commercial food waste composting study project report
TRANSCRIPT

COMMERCIAL FOOD WASTE COMPOSTING STUDY
PROJECT REPORT
FINAL October 29, 2002
Prepared for:
Oregon Department of Environmental Quality Land Quality Division, Solid Waste Program
811 SW Sixth Avenue Portland, OR 97204
Prepared by:
Tetra Tech, Inc. 1925 Post Alley
Seattle, WA 98101

TABLE OF CONTENTS
______________________________________________________________________i
EXECUTIVE SUMMARY……………………………………………………………………………… 1 SECTION 1 BACKGROUND AND OBJECTIVES……………………………………………………5 1.1 Summary of Initial Investigation……………………………………………………………….6 1.2 Suitability of Biosolids Regulations for Mixed Food Waste Composting………………….…6 1.3 Evaluation of Processes Compatible with Oregon Composting Operations…………………6 1.4 Process Comparison Testing Objectives………………………………………………………..7 SECTION 2 PROJECT INITIATION……………………………………………………………………9 2.1 Feedstock Sources……………………………………………………………………………….10 2.2 Mix Ratios………………………………………………………………………………………..12 2.3 Initial Processing………………………………………………………………………………...12 2.4 Pile Formation…………………………………………………………………………………...13 SECTION 3 MONITORING PROGRAM……………………………………………………………...15 3.1 Process Monitoring/Sampling Schedule……………………………………………………….15 3.2 Project Participant Roles……………………………………………………………………….16 3.3 Equipment and Supplies ……………………………………………………………………….17 3.4 Field Monitoring Methodology ………………………………………………………………..17 3.4.1 Pile Temperature…………………………………………………………………………………18 3.4.2 Pile Oxygen Levels……………………………………………………………………………….18 3.4.3 Bulk Density……………………………………………………………………………………...19 3.4.4 Pile Dimensions and Volume……………………………………………………………………..19 3.5 Compost Sample Collection Protocol ………………………………………………………….19 3.5.1 Sampling Procedures……………………………………………………………………………..19 3.5.2 Sanitation Procedure……………………………………………………………………………..20 3.6 Leachate Sample Collection Protocol …………………………………………………………21 3.7 Product Characterization ……………………………………………………………………..21 3.8 Data Collection and Recording………………………………………………………………...21 SECTION 4 PROJECT RESULTS……………………………………………………………………23 4.1 Weather………………………………………………………………………………………….23 4.2 Initial Materials, Mixing and Pile Formation ………………………………………………..24 4.3 Composting Process ……………………………………………………………………………27 4.3.1 Moisture Content…………………………………………………………………………………27 4.3.2 Temperature………………………………………………………………………………………29 4.3.3 Oxygen Content…………………………………………………………………………………..40 4.3.4 Stability…………………………………………………………………………………………...40 4.3.5 Indicator Organisms………………………………………………………………………………46 4.4 Leachate ………………………………………………………………………………………...49 4.5 Product Quality ………………………………………………………………………………... 49

TABLE OF CONTENTS
______________________________________________________________________ii
SECTION 5 COMPOSTING PERFORMANCE ANALYSIS………………………………………..53 5.1 Weather Conditions …………………………………………………………………………… 53 5.2 Initial Mix ………………………………………………………………………………………53 5.3 Moisture Content ………………………………………………………………………………53 5.4 Time and Temperature ………………………………………………………………………..54 5.5 Pathogen Reduction ……………………………………………………………………………60 5.6 Leachate Quality ……………………………………………………………………………….60 5.7 Stabilization ……………………………………………………………………………………..61 5.8 Product Quality ……………………………………………………………………………….. 62 SECTION 6 REGULATORY ASSESSMENT………………………………………………………...63 6.1 Alternative Approaches ……………………………………………………………………….63 6.2 Pathogen Control Strategy …………………………………………………………………… 63 6.2.1 Pathogen Kill……………………………………………………………………………………..64 6.2.2 Re-growth Prevention…………………………………………………………………………….66 6.2.3 Contamination Prevention………………………………………………………………………..67 6.2.3.1 Equipment Contamination………………………………………………………………………..67 6.2.3.2 Exterior Sources………………………………………………………………………………….67 6.2.3.3 Re-Incorporation…………………………..…………….……………………………………….67 6.2.3.4 Leachate Contamination………………………………………………………………………….67 6.2.4 Compliance Sequence…………………………………………………………………………….67 6.2.5 Composting Process Limitations…………………………………………………………………68 6.2.5.1 Feedstocks………………………………………………………………………………………..68 6.2.5.2 Pile Size………………………………………………………………………….……………….68 6.2.5.3 Minimum Detention Time………………………………………………………………………..69 6.2.5.4 Aerobic Conditions……………………………………………………………………………….69 6.2.6 Indicator Monitoring……………………………………………………………………………..69 6.2.7 Stability Monitoring………………………………………………………………………………69 6.2.8 Performance Failure Plan…………………………………………………………………………70 6.3 Impact of Test Results on Regulatory Approach ……………………………………………. 70 6.3.1 Feedstock Characteristics…………………………………………………………………………70 6.3.2 Initial Mix Characteristics………………………………………………………………………...70 6.3.3 Time and Temperature Compliance………………………………………………………………70 6.3.4 Degradation/Stability……………………………………………………………………………..70 6.3.5 Microbial Populations…………………………………………………………………………….71 6.3.6 Product Quality…………………………………………………………………………………...71 6.4 Preferred Regulatory Approaches ……………………………………………………………71 6.4.1 Recommended Mixed Food Waste Composting Protocol………………………………………..71 6.4.1.1 Pathogen Reduction Plan…………………………………………………………………………71 6.4.1.2 Pathogen Kill……………………………………………………………………………………..72 6.4.1.3 Re-growth Prevention…………………………………………………………………………….72 6.4.1.4 Contamination Prevention………………………………………………………………………..73 6.4.1.5 Compliance Sequence…………………………………………………………………………….73 6.4.1.6 Composting Process Limitations…………………………...…………………………………….73 6.4.1.7 Indicator Monitoring………………………………………………………….…………………..74 6.4.1.8 Provisional Composting Process Monitoring and Data Submittal……………………………….74 6.4.1.9 Performance Failure Plan…………………………………………………………………………74

TABLE OF CONTENTS
______________________________________________________________________iii
6.4.1.10 Runoff/Leachate Management Plan………………………………………………………………74 6.4.2 Recommended Approved Processes for Mixed Food Waste Composting……………………….74 6.4.2.1 Initial Mix and Pile Construction…………………………………………………………………75 6.4.2.2 Pile Turning………………………………………………………………………………………75 6.4.2.3 Combined PAW and LTW Process………………………………………………………………75 6.4.3 Recommended Procedure for Alternative Process Consideration………………………………..76 6.4.4 Recommended Regulatory Re-Evaluation Procedure…………………………………………….76 SECTION 7 CONCLUSIONS AND RECOMMENDATIONS……………………………………….77 GLOSSARY……………………………………………………………………………………………...78
TABLE OF CONTENTS
______________________________________________________________________iv
LIST OF TABLES Table l Period 1 Feedstock Collection and Delivery Schedule………………………………….10 Table 2 Period 2 Feedstock Collection and Delivery Schedule………………………………….10 Table 3 Total Feedstock Quantities………………………………………………………………12 Table 4 Optimum Initial Mix Characteristics for Composting…………………………………...12 Table 5 Process Monitoring/Sampling Schedule…………………………………………………14 Table 6 Test Period Weather Data………………………………………………………………..23 Table 7 Period 1 Mass Balance…………………………………………………………………...25 Table 8 Period 2 Mass Balance…………………………………………………………………...26 Table 9 Period 1 LTW Intense Temperature Monitoring Data…………………………………...36 Table 10 Period 1 PAW Intense Temperature Monitoring Data…………………………………..37 Table 11 Period 2 LTW Intense Temperature Monitoring Data…………………………………...38 Table 12 Period 2 PAW Intense Temperature Monitoring Data…………………………………..39 Table 13 TMECC 05.08-B Stability Results………………………………………………………42 Table 14 Period 1 Indicator Organism Data……………………………………………………….47 Table 15 Period 2 Indicator Organism Data……………………………………………………….48 Table 16 Period 1 Process Week 8 Product Quality Analysis…………………………………….50 Table 17 Period 1 Process Week 14 Product Quality Analysis……………………………………51 Table 18 Period 2 Process Week 14 Product Quality Analysis……………………………………52
LIST OF FIGURES Figure 1 Total Solids Change During Composting……………………………………………….28 Figure 2 Period 1 Limited Turn Windrow Daily Temperature Profile……………………………30 Figure 3 Period 1 Passive Aerated Windrow Daily Temperature Profile…………………………31 Figure 4 Period 2 Limited Turn Windrow Daily Temperature Profile……………………………33 Figure 5 Period 2 Passive Aerated Windrow Daily Temperature Profile…………………………34 Figure 6 Limited Turn Windrow Stability Data…………………………………………………..43 Figure 7 Passive Aerated Windrow Stability Data………………………………………………..44 Figure 8 Stability with Solvita Test………………………………………………………………..45 Figure 9 Average Daily Temperature Comparison………………………………………………..56 Figure 10 Maximum Daily Temperature Comparison ……………………………………………..58 Figure 11 Minimum Daily Temperature Comparison………………………………………………59 Figure 12 40 CFR 503 Class A Time and Temperature for Solids Greater Than 7%………………65
LIST OF APPENDICES Appendix A Period 1 Field Monitoring Forms Appendix B Period 2 Field Monitoring Forms Appendix C Field Monitoring Temperature Data Appendix D Field Monitoring Oxygen Data Appendix E Daily Weather Data Appendix F Stability Lab Data Appendix G Indicator Organism Lab Data Appendix H Product Quality Lab Data Appendix I Project Photo Log

TABLE OF CONTENTS
______________________________________________________________________v
Appendix J Commercial Food Waste Composting Study Operations Plan

TABLE OF CONTENTS
______________________________________________________________________vi
Acknowledgments The work reported on in this document represents the results of a team effort. The agencies and individuals to whom thanks for support are due include: Oregon Department of Environmental Quality – Lauren Ettlin, Compost Projects Coordinator, coordinated this project including participants, funding, technical support and document review. Brian Fuller and Bob Barrows, Solid Waste Technical Assistants, provided document review and monitored temperature and oxygen in the piles on a regular basis for the duration of the project. Leslie Kochan provided backup for the other staff. Rexius Forest By-Products - Jack Hoeck, Vice President of Production and the Rexius staff were easy to work with, assisted with problem solving, repaired equipment and were amenable to changes to the project whenever requested by Tetra Tech and DEQ. City of Eugene – Alex Cuyler, Recycling Analyst, and Anne Donahue, Compost Specialist, were responsible for coordination of the mixed food waste collection and delivery. Alex and Anne also monitored the piles for temperature and oxygen two days a week for the duration of the project. Oregon State University, Department of Crop and Soil Science – Dan Sullivan, Professor of Crop and Soil Science, provided expertise on methods for stability measurement, interpretation of data and document review and was mentor to graduate student Teresa Matteson. Teresa performed intensive temperature and oxygen monitoring and sample collection weekly for the duration of the project and provided document review. Tetra Tech – Larry Sasser, Senior Engineer, and Stacey Servo, Design Engineer, were project managers for Tetra Tech and authors of this report. Gerry Croteau developed the protocol for this project, provided expertise during pile formation for Period 1 and trained the other participants in equipment use and temperature and oxygen measurement. Eliot Epstein, Chief Environmental Scientist provided document review and data interpretation.

_____________________________________________________________________1
EXECUTIVE SUMMARY A field demonstration of low technology composting methods for mixed food waste has been completed. This report provides the basis for the evaluation, procedures used to conduct the demonstration, presentation and evaluation of the performance-monitoring program, an assessment of regulatory methods and a recommended regulatory approach. Initial Investigation Report The initial investigative report “Research Concerning Human Pathogens and Environmental Issues Related to Composting of Non-Green Feedstocks” provided a comprehensive review of available research information on pathogen control issues associated with composting of non-green feedstocks. A primary conclusion and basic concept used in the field demonstration was that the 40 CFR 503 regulations (federal biosolids regulations) are a sound basis for developing regulations for non-green feedstock. Field Demonstration Study Design A primary objective of the demonstration was to evaluate the ability of low technology composting methods to comply with the principals of 40 CFR 503. Based on a review of alternatives, the passively aerated windrow (PAW) and limited turned windrow (LTW) processes were selected for demonstration. These technologies were selected based on apparent compatibility with both the current practices of green feedstock composting facilities and the human pathogen control aspects of the regulation. The field demonstration evaluated these technologies on a full-scale basis. A collection program for source separated mixed food waste including both green and non-green feedstocks was coordinated by the City of Eugene. Batches of mixed food waste were collected for co-composting with yard debris, chicken offal and dairy manure solids. The mixed food waste was co-composted with yard debris because this is the primary feedstock used by the target composting community. Yard debris also provides tip fee revenue and the woody fraction and porosity that are desirable for mixed food waste composting. Full-scale piles were then composted using each of the selected methods during two operating periods, mid-winter and spring. These periods were selected because wet weather conditions would be expected to create the greatest challenge for these technologies in achieving pathogen control. The progress of composting was monitored for a range of parameters to document pathogen reducing conditions, the reduction of indicator organisms and the removal of a food source for re-growth. The indicator organism population in leachate / runoff from the piles was also monitored to determine the potential risk of leachate as a source of contamination during composting. Field Demonstration Results The composting demonstration produced the following results: 1 All four piles (two composting methods over two processing periods) satisfied the time and
temperature requirements as outlined in the 40 CFR 503 regulations (The LTW process did not turn 5 times in 15 days but did maintain temperature between turns). The PAW process met the 40 CFR 503 time and temperature requirement of 55 degrees Celsius or higher for three days. The LTW process met the time and temperature requirement of 55 degrees Celsius or higher for 15 days, but less than 5 turnings occurred during this time. Pathogen results showed that the LTW process was able to meet the reduction of pathogen 40 CFR 503 requirements with less than 5 turnings.
_____________________________________________________________________2
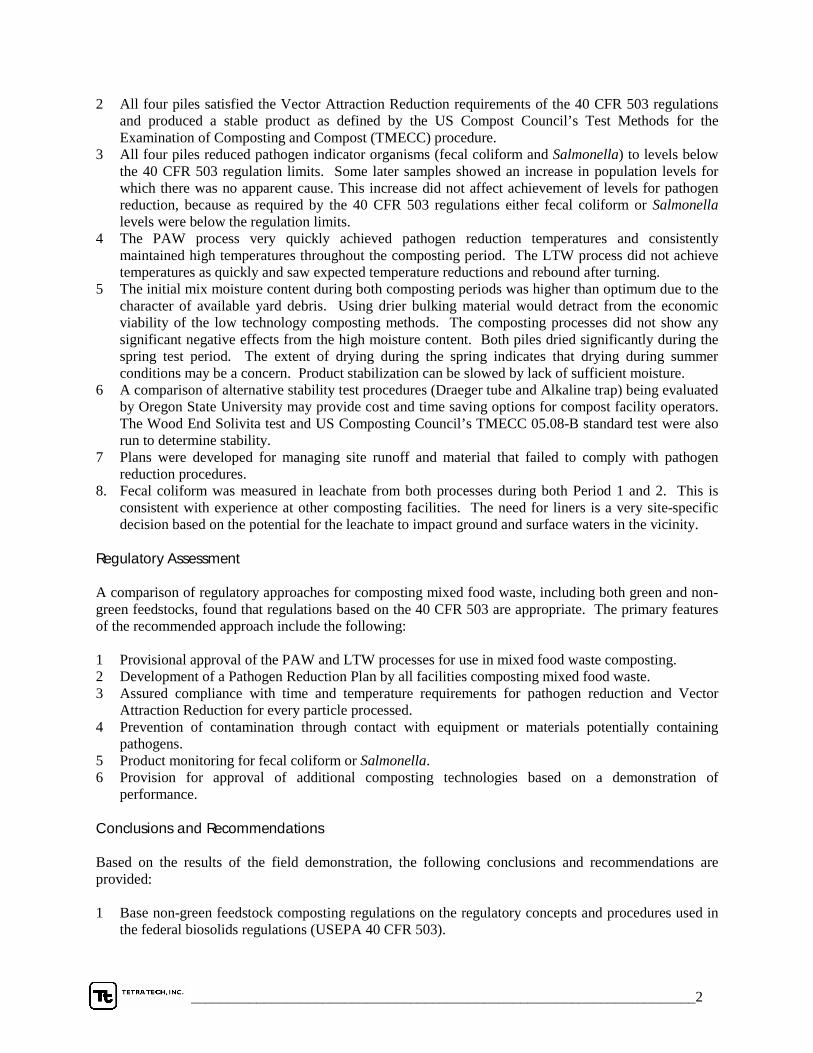
2 All four piles satisfied the Vector Attraction Reduction requirements of the 40 CFR 503 regulations and produced a stable product as defined by the US Compost Council’s Test Methods for the Examination of Composting and Compost (TMECC) procedure.
3 All four piles reduced pathogen indicator organisms (fecal coliform and Salmonella) to levels below the 40 CFR 503 regulation limits. Some later samples showed an increase in population levels for which there was no apparent cause. This increase did not affect achievement of levels for pathogen reduction, because as required by the 40 CFR 503 regulations either fecal coliform or Salmonella levels were below the regulation limits.
4 The PAW process very quickly achieved pathogen reduction temperatures and consistently maintained high temperatures throughout the composting period. The LTW process did not achieve temperatures as quickly and saw expected temperature reductions and rebound after turning.
5 The initial mix moisture content during both composting periods was higher than optimum due to the character of available yard debris. Using drier bulking material would detract from the economic viability of the low technology composting methods. The composting processes did not show any significant negative effects from the high moisture content. Both piles dried significantly during the spring test period. The extent of drying during the spring indicates that drying during summer conditions may be a concern. Product stabilization can be slowed by lack of sufficient moisture.
6 A comparison of alternative stability test procedures (Draeger tube and Alkaline trap) being evaluated by Oregon State University may provide cost and time saving options for compost facility operators. The Wood End Solivita test and US Composting Council’s TMECC 05.08-B standard test were also run to determine stability.
7 Plans were developed for managing site runoff and material that failed to comply with pathogen reduction procedures.
8. Fecal coliform was measured in leachate from both processes during both Period 1 and 2. This is consistent with experience at other composting facilities. The need for liners is a very site-specific decision based on the potential for the leachate to impact ground and surface waters in the vicinity.
Regulatory Assessment A comparison of regulatory approaches for composting mixed food waste, including both green and non-green feedstocks, found that regulations based on the 40 CFR 503 are appropriate. The primary features of the recommended approach include the following: 1 Provisional approval of the PAW and LTW processes for use in mixed food waste composting. 2 Development of a Pathogen Reduction Plan by all facilities composting mixed food waste. 3 Assured compliance with time and temperature requirements for pathogen reduction and Vector
Attraction Reduction for every particle processed. 4 Prevention of contamination through contact with equipment or materials potentially containing
pathogens. 5 Product monitoring for fecal coliform or Salmonella. 6 Provision for approval of additional composting technologies based on a demonstration of
performance. Conclusions and Recommendations Based on the results of the field demonstration, the following conclusions and recommendations are provided: 1 Base non-green feedstock composting regulations on the regulatory concepts and procedures used in
the federal biosolids regulations (USEPA 40 CFR 503).

_____________________________________________________________________3
a) Expose all material to 55oC for a minimum of 3 consecutive days to provide pathogen reduction, for a turned windrow process this requires 5 turns after each of which the 3 day criteria must be met to assure that all material is exposed to those conditions;
b) Expose all material to an average of 45oC with a minimum of 40oC for a minimum of fourteen
consecutive days to provide Vector Attraction Reduction; and c) Test the product for indicator organisms, Fecal Coliform <1000 MPN per gram total solids (dry
weight basis) OR Salmonella <3 MPN per 4 grams total solids (dry weight basis).
2 Both of the low technology composting methods field-tested demonstrated the ability to effectively reduce pathogens and related risk to acceptable levels during the wet weather conditions experienced in western Oregon. The test periods had lower than normal rainfall, so continued demonstration of the technology during wetter than normal conditions is advised. This can be done as a part of provisional longer-term demonstration of the processes at composting facilities.
3 Proceed with development of regulations that allow and encourage the composting of non-green
feedstocks using the Process to Further Reduce Pathogens (PFRP) composting processes identified in 40 CFR 503 or the two processes (LTW and PAW) that were demonstrated as part of study.
a) The PFRP processes in 40 CFR Part 503 is suitable for outright approval based on history and
experience. b) The LTW and PAW processes should be approved on a provisional basis with additional
monitoring required at each facility to provide sufficient operating experience to justify full approval.
4 Require that the product be stable to the standard set by the US Compost Council Test Methods for
the Examination of Composting and Compost (TMECC) 05.08-B Carbon Dioxide Evolution Rate (4 mg CO2-C per gram compost organic matter per day).
5 Require that each non-green feedstock composting facility develop plans for implementing the
regulation with particular focus on achieving pathogen reduction and a stable product, runoff management and management of materials that fail to comply with pathogen reduction requirements.
6 Provide a procedure for demonstrating new low technology composting options and criteria for
approving those that perform as required.

_____________________________________________________________________4
PAGE INTENTIONALLY LEFT BLANK
_____________________________________________________________________5
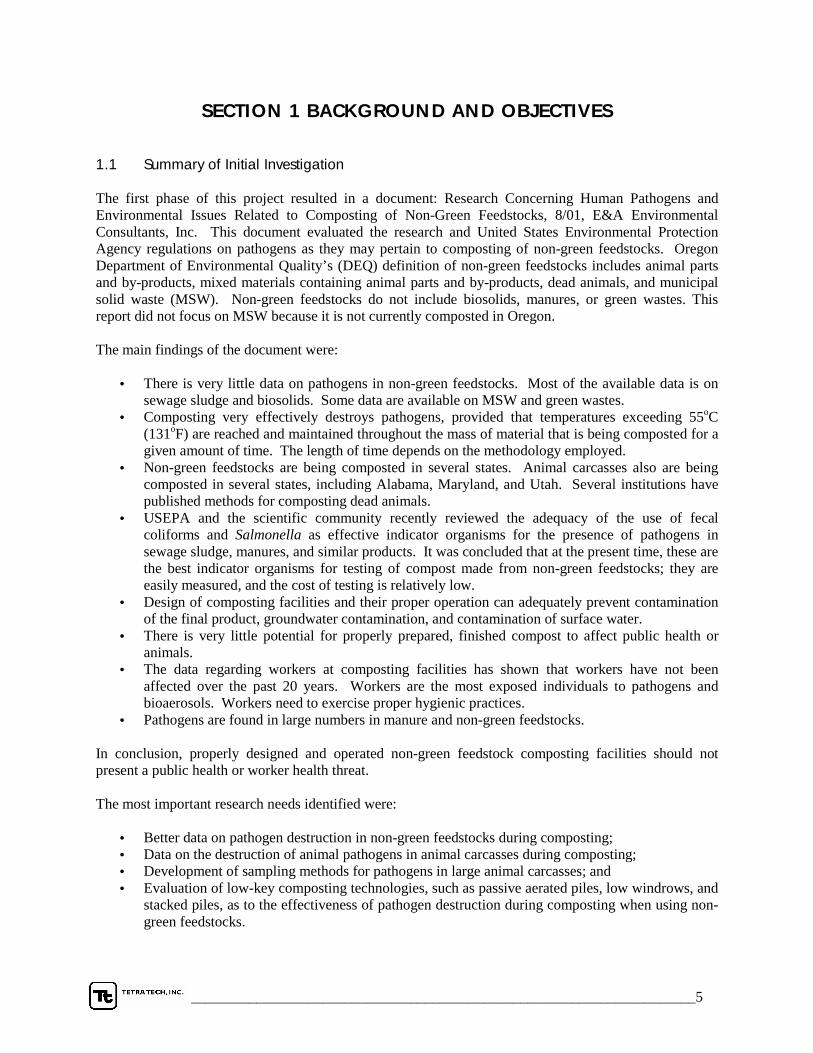
SECTION 1 BACKGROUND AND OBJECTIVES 1.1 Summary of Initial Investigation The first phase of this project resulted in a document: Research Concerning Human Pathogens and Environmental Issues Related to Composting of Non-Green Feedstocks, 8/01, E&A Environmental Consultants, Inc. This document evaluated the research and United States Environmental Protection Agency regulations on pathogens as they may pertain to composting of non-green feedstocks. Oregon Department of Environmental Quality’s (DEQ) definition of non-green feedstocks includes animal parts and by-products, mixed materials containing animal parts and by-products, dead animals, and municipal solid waste (MSW). Non-green feedstocks do not include biosolids, manures, or green wastes. This report did not focus on MSW because it is not currently composted in Oregon. The main findings of the document were:
• There is very little data on pathogens in non-green feedstocks. Most of the available data is on sewage sludge and biosolids. Some data are available on MSW and green wastes.
• Composting very effectively destroys pathogens, provided that temperatures exceeding 55oC (131oF) are reached and maintained throughout the mass of material that is being composted for a given amount of time. The length of time depends on the methodology employed.
• Non-green feedstocks are being composted in several states. Animal carcasses also are being composted in several states, including Alabama, Maryland, and Utah. Several institutions have published methods for composting dead animals.
• USEPA and the scientific community recently reviewed the adequacy of the use of fecal coliforms and Salmonella as effective indicator organisms for the presence of pathogens in sewage sludge, manures, and similar products. It was concluded that at the present time, these are the best indicator organisms for testing of compost made from non-green feedstocks; they are easily measured, and the cost of testing is relatively low.
• Design of composting facilities and their proper operation can adequately prevent contamination of the final product, groundwater contamination, and contamination of surface water.
• There is very little potential for properly prepared, finished compost to affect public health or animals.
• The data regarding workers at composting facilities has shown that workers have not been affected over the past 20 years. Workers are the most exposed individuals to pathogens and bioaerosols. Workers need to exercise proper hygienic practices.
• Pathogens are found in large numbers in manure and non-green feedstocks. In conclusion, properly designed and operated non-green feedstock composting facilities should not present a public health or worker health threat. The most important research needs identified were:
• Better data on pathogen destruction in non-green feedstocks during composting; • Data on the destruction of animal pathogens in animal carcasses during composting; • Development of sampling methods for pathogens in large animal carcasses; and • Evaluation of low-key composting technologies, such as passive aerated piles, low windrows, and
stacked piles, as to the effectiveness of pathogen destruction during composting when using non-green feedstocks.

_____________________________________________________________________6
1.2 Suitability of Biosolids Regulations for Mixed Food Waste Composting Section 8 of the first study phase document reviewed the relevance and adequacy of using the federal sewage sludge regulations (USEPA 40 CFR Part 503) as the basis for regulating pathogens in non-green feedstocks. That analysis concluded: “The USEPA 40 CFR Part 503 regulations make sense for feedstocks containing mixed food waste, in part because food wastes and accompanying pathogens are bound to be present in the existing wastewater. Class A biosolids have not resulted in any reported disease outbreaks. In addition, the time and temperature requirements for composting food waste feedstocks are more than adequate for inactivating microorganisms such as Ascaris ova, which are considered to be much hardier than most pathogens of concern. Because they appear to be ubiquitous in food waste feedstocks, Salmonella sp. should be an excellent means for verifying that adequate composting conditions have been achieved.” 1.3 Evaluation of Processes Compatible with Oregon Composting Operations A primary objective of the demonstration study was to evaluate composting processes that are compatible with current Oregon composting operations while still providing strong potential for complying with pathogen reduction requirements. Currently, most composting operations use loader or machine turned windrow and static pile methods for composting feedstock primarily composed of yard debris. A review of composting methods resulted in two processes that were believed to have the potential to provide pathogen reduction: 1 Limited Turned Windrow (LTW) – This technique is similar to common practice in the green
feedstock composting business in Oregon. Windrows are formed and turned periodically through the composting process. With the correct mix of food waste and other feedstocks it was felt that pathogen reduction temperatures could be achieved and maintained. Mixing with front-end loaders was selected because this represents the simplest form of this technology to implement, and was equipment that was available at the demonstration composting facility. In the field demonstration, the LTW was turned on a weekly basis starting during the process week 2 and ending on process week 8. The LTW was 10 feet high by 25 feet long by 20 feet wide. Composting and curing continued for a total of 14 weeks.
2 Passively Aerated Windrow (PAW) – This composting method was selected to represent the static
composting option. Unaerated static piles have been known to have difficulty achieving pathogen reduction temperatures and have limited capability to remove heat and moisture during the composting process. A passively aerated system provides greater potential for movement of air into the pile while not requiring the capital investment of a forced aeration system. In the field demonstration, the PAW was constructed with perforated 4-inch plastic drainage pipe. The pipes were located 3 feet above ground level and with a spacing of 3 feet between the pipes. Composting and curing continued for a total of 14 weeks.
A forced aeration composting method was discussed as an alternative project composting method; however, it was not selected based on limited project funding and project team consensus that this alternative method would meet the 40 CFR 503 requirements. The feedstocks to be used as bulking agent with the mixed food waste were also considered. Yard debris was the obvious primary candidate because it is most commonly available in significant quantities, normally provides a tip fee revenue stream for the processor, provides energy, and as long as grass content is limited provides good porosity needed for the composting process. Other drier feedstocks such as recycled screen overs, sawdust, wood chips, wood waste and mixed waste paper were also considered. Any of these materials could be incorporated into a non-green food waste composting process, but co-composting with yard debris was selected as the feedstock most representative of the industry in Oregon.
_____________________________________________________________________7
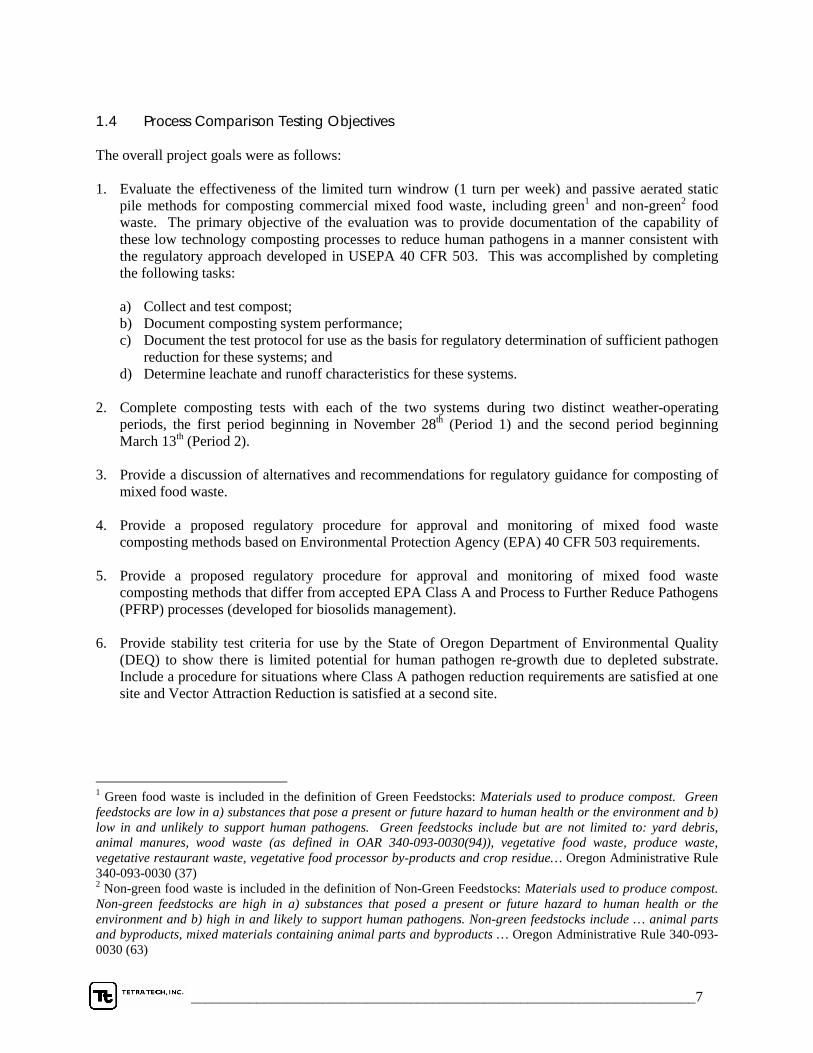
1.4 Process Comparison Testing Objectives The overall project goals were as follows: 1. Evaluate the effectiveness of the limited turn windrow (1 turn per week) and passive aerated static
pile methods for composting commercial mixed food waste, including green1 and non-green2 food waste. The primary objective of the evaluation was to provide documentation of the capability of these low technology composting processes to reduce human pathogens in a manner consistent with the regulatory approach developed in USEPA 40 CFR 503. This was accomplished by completing the following tasks:
a) Collect and test compost; b) Document composting system performance; c) Document the test protocol for use as the basis for regulatory determination of sufficient pathogen
reduction for these systems; and d) Determine leachate and runoff characteristics for these systems.
2. Complete composting tests with each of the two systems during two distinct weather-operating periods, the first period beginning in November 28th (Period 1) and the second period beginning March 13th (Period 2).
3. Provide a discussion of alternatives and recommendations for regulatory guidance for composting of
mixed food waste. 4. Provide a proposed regulatory procedure for approval and monitoring of mixed food waste
composting methods based on Environmental Protection Agency (EPA) 40 CFR 503 requirements. 5. Provide a proposed regulatory procedure for approval and monitoring of mixed food waste
composting methods that differ from accepted EPA Class A and Process to Further Reduce Pathogens (PFRP) processes (developed for biosolids management).
6. Provide stability test criteria for use by the State of Oregon Department of Environmental Quality
(DEQ) to show there is limited potential for human pathogen re-growth due to depleted substrate. Include a procedure for situations where Class A pathogen reduction requirements are satisfied at one site and Vector Attraction Reduction is satisfied at a second site.
1 Green food waste is included in the definition of Green Feedstocks: Materials used to produce compost. Green feedstocks are low in a) substances that pose a present or future hazard to human health or the environment and b) low in and unlikely to support human pathogens. Green feedstocks include but are not limited to: yard debris, animal manures, wood waste (as defined in OAR 340-093-0030(94)), vegetative food waste, produce waste, vegetative restaurant waste, vegetative food processor by-products and crop residue… Oregon Administrative Rule 340-093-0030 (37) 2 Non-green food waste is included in the definition of Non-Green Feedstocks: Materials used to produce compost. Non-green feedstocks are high in a) substances that posed a present or future hazard to human health or the environment and b) high in and likely to support human pathogens. Non-green feedstocks include … animal parts and byproducts, mixed materials containing animal parts and byproducts … Oregon Administrative Rule 340-093-0030 (63)

_____________________________________________________________________8
PAGE INTENTIONALLY LEFT BLANK
_____________________________________________________________________9
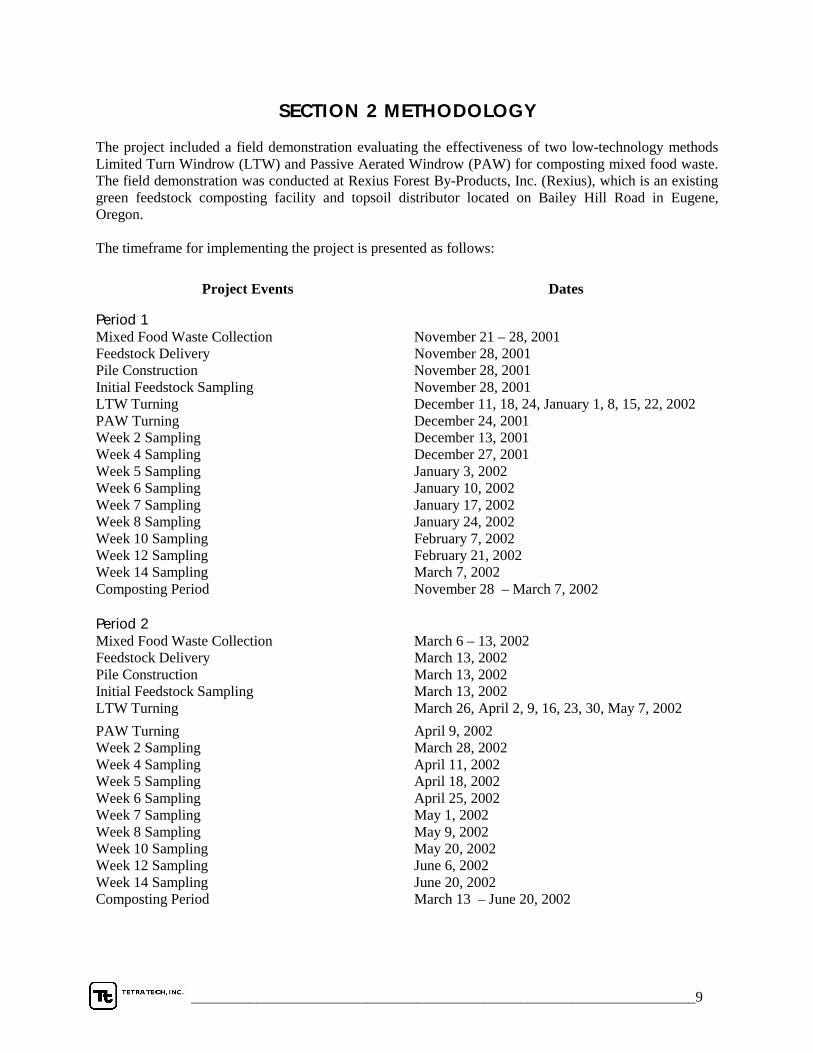
SECTION 2 METHODOLOGY The project included a field demonstration evaluating the effectiveness of two low-technology methods Limited Turn Windrow (LTW) and Passive Aerated Windrow (PAW) for composting mixed food waste. The field demonstration was conducted at Rexius Forest By-Products, Inc. (Rexius), which is an existing green feedstock composting facility and topsoil distributor located on Bailey Hill Road in Eugene, Oregon. The timeframe for implementing the project is presented as follows:
Project Events Dates
Period 1
Mixed Food Waste Collection November 21 – 28, 2001 Feedstock Delivery November 28, 2001 Pile Construction November 28, 2001 Initial Feedstock Sampling November 28, 2001 LTW Turning December 11, 18, 24, January 1, 8, 15, 22, 2002 PAW Turning December 24, 2001 Week 2 Sampling December 13, 2001 Week 4 Sampling December 27, 2001 Week 5 Sampling January 3, 2002 Week 6 Sampling January 10, 2002 Week 7 Sampling January 17, 2002 Week 8 Sampling January 24, 2002 Week 10 Sampling February 7, 2002 Week 12 Sampling February 21, 2002 Week 14 Sampling March 7, 2002 Composting Period November 28 – March 7, 2002 Period 2
Mixed Food Waste Collection March 6 – 13, 2002 Feedstock Delivery March 13, 2002 Pile Construction March 13, 2002 Initial Feedstock Sampling March 13, 2002 LTW Turning March 26, April 2, 9, 16, 23, 30, May 7, 2002 PAW Turning April 9, 2002 Week 2 Sampling March 28, 2002 Week 4 Sampling April 11, 2002 Week 5 Sampling April 18, 2002 Week 6 Sampling April 25, 2002 Week 7 Sampling May 1, 2002 Week 8 Sampling May 9, 2002 Week 10 Sampling May 20, 2002 Week 12 Sampling June 6, 2002 Week 14 Sampling June 20, 2002 Composting Period March 13 – June 20, 2002
_____________________________________________________________________10
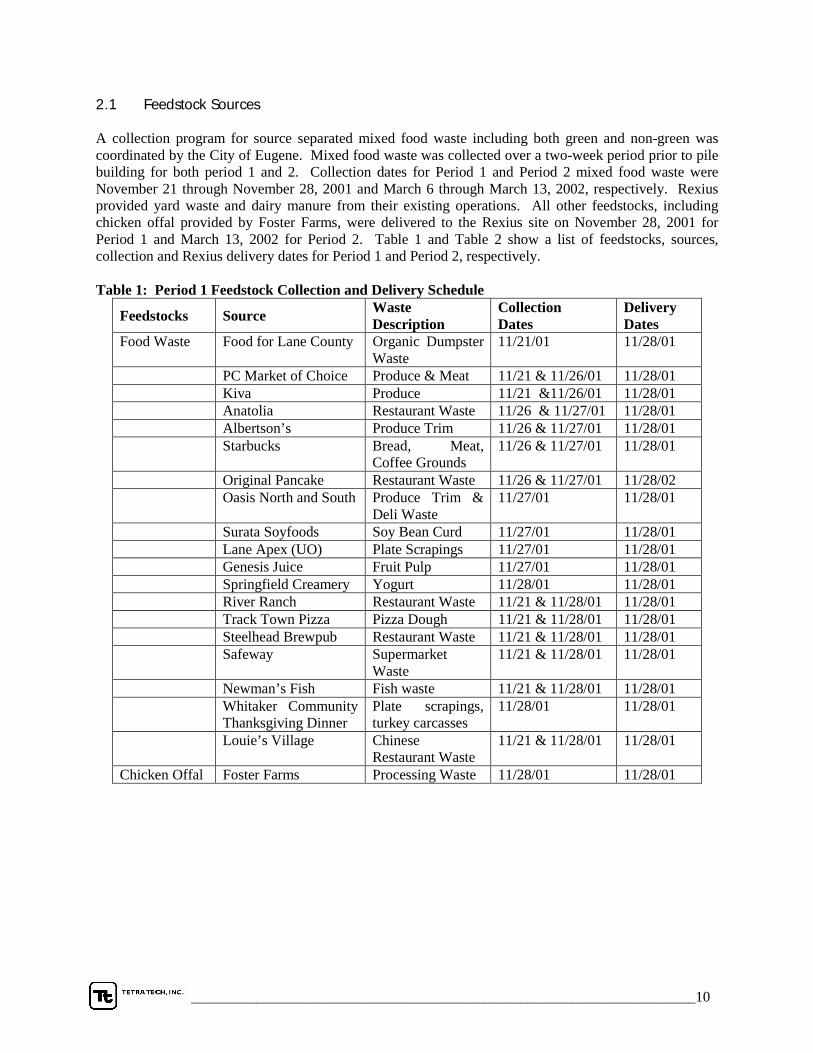
2.1 Feedstock Sources A collection program for source separated mixed food waste including both green and non-green was coordinated by the City of Eugene. Mixed food waste was collected over a two-week period prior to pile building for both period 1 and 2. Collection dates for Period 1 and Period 2 mixed food waste were November 21 through November 28, 2001 and March 6 through March 13, 2002, respectively. Rexius provided yard waste and dairy manure from their existing operations. All other feedstocks, including chicken offal provided by Foster Farms, were delivered to the Rexius site on November 28, 2001 for Period 1 and March 13, 2002 for Period 2. Table 1 and Table 2 show a list of feedstocks, sources, collection and Rexius delivery dates for Period 1 and Period 2, respectively. Table 1: Period 1 Feedstock Collection and Delivery Schedule
Feedstocks Source Waste Description
Collection Dates
Delivery Dates
Food Waste Food for Lane County Organic Dumpster Waste
11/21/01 11/28/01
PC Market of Choice Produce & Meat 11/21 & 11/26/01 11/28/01 Kiva Produce 11/21 &11/26/01 11/28/01 Anatolia Restaurant Waste 11/26 & 11/27/01 11/28/01 Albertson’s Produce Trim 11/26 & 11/27/01 11/28/01 Starbucks Bread, Meat,
Coffee Grounds 11/26 & 11/27/01 11/28/01
Original Pancake Restaurant Waste 11/26 & 11/27/01 11/28/02 Oasis North and South Produce Trim &
Deli Waste 11/27/01 11/28/01
Surata Soyfoods Soy Bean Curd 11/27/01 11/28/01 Lane Apex (UO) Plate Scrapings 11/27/01 11/28/01 Genesis Juice Fruit Pulp 11/27/01 11/28/01 Springfield Creamery Yogurt 11/28/01 11/28/01 River Ranch Restaurant Waste 11/21 & 11/28/01 11/28/01 Track Town Pizza Pizza Dough 11/21 & 11/28/01 11/28/01 Steelhead Brewpub Restaurant Waste 11/21 & 11/28/01 11/28/01 Safeway Supermarket
Waste 11/21 & 11/28/01 11/28/01
Newman’s Fish Fish waste 11/21 & 11/28/01 11/28/01 Whitaker Community
Thanksgiving Dinner Plate scrapings, turkey carcasses
11/28/01 11/28/01
Louie’s Village Chinese Restaurant Waste
11/21 & 11/28/01 11/28/01
Chicken Offal Foster Farms Processing Waste 11/28/01 11/28/01

_____________________________________________________________________11
Table 2: Period 2 Feedstock Collection and Delivery Schedule
Feedstocks Source Waste Description
Collection Dates
Delivery Dates
Food Waste River Ranch Steakhouse Waste
3/6 & 3/13/02 3/13/02
Track Town Pizza Restaurant Waste 3/6 & 3/13/02 3/13/02 Louie’s Village Chinese
Restaurant Waste 3/6 & 3/13/02 3/13/02
Steelhead Brewery Restaurant Waste 3/6 & 3/13/02 3/13/02 5th Street Market Restaurant Waste 3/6 & 3/13/02 3/13/02 Newman’s Fish Fish Waste 3/6 & 3/13/02 3/13/02 Long’s Meat Market Meat Waste 3/6 & 3/13/02 3/13/02 UO – Carson Dinning
Hall Plate Scrapings 3/6 & 3/13/02 3/13/02
Genesis Juice Fruit Pulp 3/5/02 3/13/02 Price Chopper Produce Waste 3/6 & 3/13/02 3/13/02 L & L Market Bakery/juicing
operation 3/6 &3/13/02
3/13/02
PC Market of Choice
Produce Waste/ Meat
3/6 & 3/13/02 3/13/02
Sheep Heads Mohawk Valley Meats Butchering Waste 3/13/02 3/13/02 Chicken Offal Foster Farms Processing Waste 3/13/02 3/13/02
The mixed food waste was collected from several different types of sources including markets, restaurants, dinning halls, and butcher shops. Mixed food waste collected prior to the delivery dates was stored at the Glenwood Transfer Station in drop boxes for both periods. Rexius provided and delivered 10 cubic yards of sawdust to the Glenwood Transfer Station for both Period 1 and Period 2 and placed the sawdust in the collection boxes to act as a barrier to vectors and to absorb liquids. On the Rexius delivery dates, all mixed food waste stored in the collection boxes at the Glenwood Transfer Station were transferred over to the Rexius facility. Mixed food waste collected on the Rexius delivery dates was transferred directly from the source to the Rexius facility. Chicken offal was included in the feedstocks as an inoculum for introducing Salmonella in the test piles. Chicken offal is defined as the waste parts or inedible remains of a butchered chicken. The local Foster Farms processing plant provided the chicken offal. Sheep heads and feet were additionally included as a feedstock in Period 2 only. The sheep heads and feet were collected from Mohawk Valley Meats in Marcola, OR by the City of Eugene on March 13, 2002. The sheep heads and feet were included in the feedstocks during Period 2 to evaluate the composting effectiveness for rendering wastes and to visually monitor degradation of bone mass. Following pile building, it was discovered that the brain material in sheep might harbor a prion that causes an infectious, often fatal, neurological disease known as Scrapie, similar to Mad Cow Disease. Dr. Andrew Clark, state veterinarian for Oregon Department of Agriculture reports that Scrapie is uncommon and has been documented in Oregon only 10 or 12 times3. Through further research, it was identified that Scrapie could only be analyzed from the brain material, which was not accessible after incorporating into the piles. Research also showed the transferal of the disease to humans or animals to be highly unlikely,
3 Information was collected through personal communication between Dr. Andrew Clark and Oregon Department of Environmental Quality.

_____________________________________________________________________12
but for precautionary reasons the project team decided not to distribute the resulting compost product to the public. Rexius provided dairy manure and yard debris. Both feedstocks are used in daily operations at the Rexius facility were therefore readily available for both periods of the project. Dairy manure was included as a feedstock to ensure there was an adequate nitrogen and an adequate population of fecal coliform bacteria in the test piles. Yard debris was used as a bulking agent. Sawdust was provided by Rexius and used on the piles as an insulative cover, a barrier to vectors, and to contain odors generated. Sawdust was used in Period 1 and a fine yard waste/sawdust mix was substituted during Period 2 for cost purposes. It is also important to note that Period 2 mixed food waste contained a greater percentage of meat wastes consisting of butchery wastes, plate scrapings, and fish wastes compared to Period 1. The total feedstock quantities for both Periods are listed below in Table 3. Table 3: Total Feedstock Quantities
Period 1Quantities Period 2Quantities Feedstocks (Wet Tons) (Cubic Yards) (Wet Tons) (Cubic Yards) Commercial mixed food waste 13.2 22 14.2 26 Chicken offal 7.66 10 9.34 12 Sheep heads 0 0 0.33 0.5 Dairy manure 4.0 10 7.5 10 Yard debris 46.0 110 32.2 54 Sawdust 27 95 0 0 Sawdust/Shredded Yard Waste 0 0 32 95
Total 97 240 95 193 2.2 Mix Ratios The important first step in mixed food waste composting was to development the appropriate mix ratios. Optimum initial mix characteristics for composting mixed food waste are summarized in Table 4. Table 4: Optimum Initial Mix Characteristics for Composting
Initial Mix Characteristic Optimum Level for Composting
Moisture content 55 to 60 percent Volatile solids 60 to 90 percent Bulk density 900 to 1,200 pounds/cubic yard Carbon to nitrogen ratio 25 to 40 pH 6.0 to 7.5 Porosity > 35 percent air filled pore space
Of particular significance is creating an initial mix with a moisture content between 55 and 60 percent (total solids between 40 to 45 percent). If this target is reached, the other mix characteristics are typically within an acceptable range. However, if the moisture content of the mixed food waste and bulking material are high, a high bulking ratio will be required to meet the optimum moisture content.

_____________________________________________________________________13
The initial mix characteristics and ratios for Period 1 and Period 2 are identified in the Tables 7 and 8 in section 4.2. 2.3 Initial Processing Feedstocks and bulking material were mixed with a front-end loader to generate a homogeneous porous mixture. Tetra Tech performed a visual inspection prior to pile construction to ensure that there were no signs of unmixed food waste, chicken offal, and manure. The feedstocks and bulking material were not ground prior to mixing. 2.4 Pile Formation After mixing, one Limited Turn Windrow (LTW) and one Passive Aerated Windrow (PAW) were constructed simultaneously from each individual mix batch per period. This helped to assure that the compositions of the two piles were similar. The piles were built in a windrow formation approximately 20 feet wide and 10 feet high. These pile dimensions allowed the pile to be constructed without the loader operator driving on top of the pile. See photos of the LTW and PAW in Appendix I. The piles were constructed on a 45-mil thick polyethylene pond liner with a sloped surface (1-2%) using a front-end loader. The liner for each pile was approximately 25 feet in width and about 24 feet in length. The liner accommodated approximately a 12-foot length of each pile; about half of the pile length was lined. This allowed the pile to be turned without the front-end loader driving on the liner. The 12-foot portion of liner that extended from the pile on the downgradient end allowed for the collection of leachate. The corners of this section of liner were drawn together to form a triangle. A 4-inch PVC collection pipe was affixed to the downgradient point of the triangle. The collection pipe diverted leachate collected on the liner into a 5-gallon bucket designated for leachate storage. The 5-gallon bucket was located in a hole such that the bucket lip was slightly above ground level. The bucket was additionally covered so that leachate could flow into the bucket, but rainwater couldn’t enter. Additionally for PAW construction, slotted 4-inch diameter PVC piping was placed for aeration at a height of approximately two feet above ground level every three feet along the length of the windrow. This was accomplished by laying down an eight-inch layer of cover material followed by a two-foot layer of mixture the length of the windrow, placing the piping over the mixture, then covering the piping with the remaining pile material. Following windrow formation, a one-foot insulative cover was placed over the piles. The cover was comprised of sawdust for Period 1 and a fine yard debris/sawdust mixture for Period 2 to reduce the cost for the cover. The purpose of the insulative cover was to reduce nuisance pest access and to hold in heat and odors generated. This is a typical practice for the Passive Aerated Windrow, but atypical for Limited Turn Windrow. However, in order to reduce nuisance pest access, an insulative cover was used when the Limited Turn Windrows were constructed. The insulative cover was incorporated into the Limited Turn Windrow after the second week of composting and into the Passive Aerated Windrow after the fourth week of composting, and was not replaced.

_____________________________________________________________________14
PAGE INTENTIONALLY LEFT BLANK

_____________________________________________________________________15
SECTION 3 MONITORING PROGRAM 3.1 Process Monitoring/Sampling Schedule
Process monitoring data included field temperature and oxygen measurements and sampling and lab analysis for pathogens and stability. The process monitoring data was used to: • Determine appropriate process adjustments; • Provide a quantitative means of assessing the composting conditions and how the process was
progressing; • Document the ability of each process to meet Class A pathogen reduction criteria; • Characterize the quantity and quality of leachate generated based on Salmonella and fecal coliform
results; and • Determine the value of the product as a soil amendment. The process-monitoring schedule for each pile for Periods 1 and 2 is summarized in Table 5.

_____________________________________________________________________16
Table 5: Process Monitoring/Sampling Schedule
Process Week Analytical Parameter
Inoculum
Food Waste
Bulk Material
Sawdust
Initial Mix
1 2 3 4 5 6 7 8 10
12
14
Laboratory Analyses Total Solids 1 1 1 1 1 1 4 1 4 1 4 4 4 4 CO2 Respirationa 4 4 5
(4) 4 4 5
Solvita Stability 4 4 4 4 4 4
Organic Carbonb 1 1 1 1 4 4 4 4 4 4
TKNb 1 1 1 1 4 4 4 4 4 4 Fecal Coliform 1 1 (1) (1) 1 1 1 1 1 1 1 1 Salmonella 1 1 (1) (1) 1 1 1 1 1 1 1 1 Conductivity 1
(0) 1
Sieve Analysis 1 (0) 1
pH 1 (0) 1
Ammonium 1 (0) 1
Nitrate 1 (0) 1
Plant Nutrientsc 1
(0) 1
Trace Metalsd 1
(0) 1
Leachatee 1 1 1 1
(0) 1
(0) 1
(0)

_____________________________________________________________________17
Field Monitoring
Bulk Density 1 1 1 1 1 1 Mix Volume 1 1 Temperature x x x x x x x x x x x x Oxygen x x x x x x x x x x x x
aDetermined by both Alkaline Trap, Draeger Tube and TMECC 05.08-B Tests (TMECC test only conducted during Period 1 Week 8 and 14 and Period 2 Week 14) bDetemined by LECO test cP, K, Mg, Ca, Fe dAs, Cd, Cr, Cu, Hg, Pb, Ni, Zn eLeachate analyzed for Salmonella and fecal coliform () Period 2 sampling when different from Period 1

_____________________________________________________________________18
3.2 Project Participant Roles The successful completion of the project required a clear delineation of roles and responsibilities among the different participants. The responsibilities of the participating parties are listed below. The State of Oregon Department of Environmental Quality (DEQ) Solid Waste Program provided funding, technical support, document review, and coordination of all project participants in the project during both operating periods. DEQ additionally provided funding to the City of Eugene for collection of the food waste for this project and provided staff two days per week for field monitoring pile temperature and oxygen. Tetra Tech assumed responsibility for project planning and oversight and direction for project operations including pile construction and process monitoring. Tetra Tech also assumed responsibility for analyzing results and writing the final report outlining the project results and recommended regulatory guidance for composting non-green food waste based on the USEPA 40 CFR 503 regulations. Rexius Forest By-Products (Rexius) was responsible for constructing four composting piles (2 per operating period) and associated runoff/leachate collection system to specifications provided by Tetra Tech to provide Limited Turn Windrow and Passive Aerated Window composting methods. Rexius was also responsible for providing staff and all equipment (Front-end loader, aeration pipes, and bulking materials) associated with mixing feedstocks, constructing the piles, and continued processing of each pile for approximately 14 weeks per period following instructions provided by Tetra Tech. Rexius additionally provided staff three days a week during both operating periods for field monitoring pile temperature and oxygen. The City of Eugene was responsible for coordination and some funding for mixed food waste collection and delivery by franchise garbage haulers for both operating periods. The City of Eugene additionally provided staff one day per week for field monitoring pile temperature and oxygen. Oregon State University (OSU) Crop and Soil Science Department was responsible for providing staff to do temperature and oxygen profile monitoring, sampling, and sample delivery to the designated overnight mailing service one day per week during both operating periods. An OSU graduate student utilized the OSU lab to provide stability analyses using two lab based methods (alkaline trap and Draeger tube) and a field method (Solvita test) to measure respiration rate through the determination of carbon dioxide (CO2) evolution from a sample of known mass. In addition, the OSU lab conducted tests to determine total solids, organic carbon and total Kjeldahl Nitrogen (TKN) during Period 1; however during Period 2 Soil Control Lab analyzed these parameters. Anresco, Inc. was responsible for providing pathogen analysis including fecal coliform, Salmonella and total solids during Period 1 using the MPN (Most Probable Number) method. Through process week 4, Anresco had a difficulty meeting required regulatory detection limits. It was decided by project team members to look at alternative laboratories for Period 2. On January 24, 2002 two duplicate samples were sent to two alternative laboratories, BAL Laboratory and BioVir Laboratories, Inc for results comparison. All three results were reasonably comparable. BAL Laboratory was selected for pathogen analysis during Period 2 for result validity and costing purposes. BAL Laboratory was responsible for providing pathogen analysis including fecal coliform, Salmonella and total solids during Period 2 using the MPN method.

_____________________________________________________________________19
Soil Control Lab was responsible for providing final product quality analysis including germination and growth, carbon dioxide evolution rate, biological available carbon, nutrients, salts, pH, bulk density, carbonates, metals and fecal coliform. Soil Control Lab was used during both Period 1 and 2. Soil Control Lab additionally analyzed Period 2 stability samples for total solids, organic carbon, and total Kjeldahl nitrogen (TKN), because OSU was unable to perform these analyses due to potential Scrapie sample contamination. Refer to Section 2.1 for information regarding Scrapie. The contributions from all of the participants were critical for initiating and completing the project. For a complete list of the participant addresses and contacts, please refer to the Commercial Food Waste Composting Study Operations Plan located in Appendix I. 3.3 Equipment and Supplies Equipment and supplies necessary for completing the process monitoring activities were stored in the storage shed at the Rexius site and included the following: • Temperature measurements – thermocouples, Fluke hand held digital temperature meter, Reotemp,
Demista electronic oxygen meter, clipboard with log sheets • Oxygen measurements – Demista electronic oxygen meter, clipboard with log sheets • Pathogen sampling – 5 gallon bucket, hand trowel, black 20 gallon rubber tub, latex gloves, dust
mask, ladder, shovel, one-liter glass measuring cup, one-quart resealable sample bags, sample labels, leachate mailing containers, chain of custody/lab request forms, coolers and blue ice packs for mailing, water and bleach for sanitization. Blue ice packs kept in the Rexius office freezer.
• Stability sampling – hand trowel, mixing tarp, ladder, shovel, 5 gallon bucket, one-gallon resealable sample bags
• Pile dimensions and volume measurements – front-end loader, scale, measuring tape • Bulk density – 5 gallon bucket, hand-held scale • Leachate Sampling – measuring cup, gloves, containers Equipment failures including the Demista electronic oxygen meter and fluke hand held digital temperature meter were consistently experienced throughout Period 1 and documented in the field monitoring forms found in Appendices A and B. The majority of the Demista meter failures occurred when the Demista was used to measure temperature and were likely caused by excess moisture inside the instrument. It is not known what caused the Fluke meter failures. Prior to Period 2 Tetra Tech purchased a new Fluke meter for use in Period 2. The Demista meter was continued for use during Period 2 but only to measure oxygen levels. 3.4 Field Monitoring Methodology The purpose of field monitoring was to collect data used to monitor the composting processes. The following five parameters were measured in the field: • Temperature: daily and intensive; • Oxygen: daily and intensive (intensive only collected during period 1); • Bulk Density: initial mix; • Pile Volume: initial mix and final product; and • Visual observations: decomposition of components in food waste, vector activity, steam exiting piles,
etc.

_____________________________________________________________________20
The field methodology and monitoring equipment used are described in the following sections. Refer to Appendix J for more information. 3.4.1 Pile Temperature During Periods 1 and 2, Temperature monitoring was conducted daily ("routine monitoring") for eight weeks. "Intensive monitoring" was conducted on a weekly basis for eight weeks followed by bi-weekly measurements through week 14. For Period 1, each compost pile was monitored for temperature by inserting four-foot-long temperature probes (aluminum rod with a thermocouple attached at the end) into four "routine monitoring" locations in each pile. The four “routine monitoring” locations were located five feet from the end, at the middle, five feet from the opposite end and end of each pile and labeled A, B, C and D, respectively. The probes were inserted at a pile height equal to three feet and pile depth equal to three feet. For period 2, each compost pile was monitored for temperature at six “routine monitoring” locations, including the four monitored in period 1 and two additional locations. The two additional locations were monitored by inserting five-foot-long temperature probes into each pile. The two additional “routine monitoring” locations were located at the core and outer edge of the LTW and at the core and directly over an aeration pipe in the PAW. The two additional locations were labeled E and F. It was decided by the project team prior to Period 2 to add these two additional “routine monitoring” locations to represent the maximum and minimum temperatures expected within the piles based on the Period 1 intensive monitoring temperatures. The “routine monitoring” temperatures were recorded using a Fluke hand held digital temperature meter that attached to a thermocouple to give a digital temperature readout. The temperature monitoring probes used for “routine monitoring” were kept in place for the duration of each period and only removed during pile turning. Period 1 “intensive monitoring” was located at “routine monitoring” locations A, B, C and D at pile heights one and a half foot, three feet and six feet and depths into each pile equaling one foot, two feet and four feet. “Intensive monitoring” temperatures within each pile were determined during Period 1 by using a Demista electronic oxygen meter provided by Rexius. The meter also included a temperature readout. The probe was first inserted into the compost pile to the desired depth. After insertion, the pump was used to evacuate air until a stable temperature was recorded (approximately 1 minute). The temperature in the sample was read directly from the oxygen meter. At the end of Period 1, it was decided by the project team that temperature “intensive monitoring” locations for Period 2 should include “routine monitoring” locations A, B, C, D, E and F at pile height equal to 3 feet and piles depths equaling one foot and the full length of the temperature probes (three feet and five feet)due to limited personnel during “intensive monitoring” dates. The team also decided to purchase and utilize additional temperature probes and a Fluke meter for “intensive monitoring” for more consistent/reliable data compared to inconsistent/unreliable Demista oxygen meter temperature readings collected during Period 1. The Demista oxygen meter was not used to collect temperature data during Period 2. The "routine monitoring” and “intensive monitoring” locations and procedures are explained in greater detail in the Commercial Food Waste Composting Study Operations Plan located in Appendix J. 3.4.2 Pile Oxygen Levels Oxygen monitoring was conducted daily for "routine monitoring". and weekly for "intensive monitoring" . Intensive oxygen monitoring was performed only during Period 1. Oxygen levels within each pile were

_____________________________________________________________________21
determined by using a Demista electronic oxygen meter provided by Rexius. The probe was first inserted into the compost pile to the desired depth. After insertion, the pump was used to evacuate air until a stable oxygen level was recorded (approximately 1 minute). The level of oxygen in the sample was read directly from the oxygen meter. Between oxygen monitoring points, the pump was used to evacuate air with fresh air until a stable oxygen level was recorded. “Routine monitoring” oxygen level locations were located at the temperature “routine monitoring” locations at a depth of three feet into each pile. “Intensive monitoring” oxygen level locations were the same as the “intensive monitoring” temperature locations and was only conducted during Period 1. It was decided by the project team at the end of Period 1 that oxygen “intensive monitoring” would not be required for Period 2 based on inconsistent/unreliable measurements recorded by the Demista oxygen meter during Period 1 and limited available personnel on intensive monitoring collection dates. 3.4.3 Bulk Density Bulk density is a basic measurement used for developing an input/output mass balance. The bulk density of the feedstocks, initial mixes, and final products were determined. Bulk density was determined in the field by weighing a 5-gallon bucket filled with the feedstocks or initial mixes. The bucket was filled with material then dropped three times from a height of six to eight inches onto a hard surface. The bucket was then refilled to the top and weighed using a hanging scale. Bucket volume was determined by filling the bucket with water and weighing it. Bulk densities for the feedstocks and initial mixes for Period 1 and Period 2 are located in Tables 1 and 2, respectively. Final Bulk densities were determined through lab analysis by Soil Control Lab and are located in Appendix H. 3.4.4 Pile Dimensions and Volume Pile dimensions and volume were determined at the beginning and end of the composting process. Rexius determined the weight of the initial mix pile prior to pile building using the scaled bucket loader and the final weight of the combined piles at the end of week 14 using the truck scale. Pile volumes were calculated based on the measured weights and bulk densities. The pile weights and volumes for Period 1 and Period 2 are as follows: Period 1 Period 2 Initial pile weights 97 wet tons 95 wet tons Initial pile volume 240 cubic yards 193 cubic yards Final pile weights 106 wet tons 60 wet tons Final pile volume 240 cubic yards 220 cubic yards Period 1 final wet weight was heavier than the initial wet weight. This increase weight may be due to incorporating additional material from the base under the piles into the piles prior to measuring the final pile weights. 3.5 Compost Sample Collection Protocol 3.5.1 Sampling Procedures Sampling procedures utilized both the composite sampling procedures and grab sampling procedures. Composite sampling procedures were used for pathogen samples and grab sampling was used for stability samples. Composite sampling procedures entailed mixing or compositing several subsamples taken from

_____________________________________________________________________22
different locations in the compost pile. Grab sampling procedures entailed selecting one location for sample collection. Pathogen composite sampling procedures were as follows: 1. Subsamples were taken from the following four locations in each pile: ! Pile side - 5 feet from the end of the pile, middle of the pile, 5 feet from the opposite end of the
pile, and end of the pile (“routine monitoring” locations A, B, C and D) ! Conical feedstock stockpiles were sampled at six equidistant points around the stockpile.
2. Compost subsamples were taken at a depth of one foot into the actual pile. A shovel was used to
access the area where the sample was collected. 3. A hand trowel was used to retrieve a three-liter subsample from two different holes at the sampling
point measured using a Pyrex measuring cup. The subsample was deposited into the compositing container (black 20 gallon rubber tub). This process was repeated for each of the four sampling points for the pile being sampled.
4. After all four points were sampled; the resulting composite sample was mixed well using the hand
trowel. 5. A cone and quartering procedure described in greater detail in the Commercial Food Waste
Composting Study Operations Plan in Appendix J was used to reduce the sample into smaller samples to be sent to the laboratories.
6. Samples were transferred into a one-quart Ziploc bag using the hand trowel, labeled with the project ID, pile ID, test requested and collection time and date, placed in the sample cooler with blue ice packets, and mailed to the Anresco, Inc., BAL Laboratory and BioVir Labs for Period 1 and BAL Laboratory for Period 2 for sample analysis.
Stability grab sampling procedures were as follows: Ten grab samples were collected from three different locations at the heights of 1.5 foot, 3 feet and 6 feet from the base of the pile, for a total of 30 grab samples/per routine monitoring location described below: • Five feet from end • Middle of pile • Five feet from opposite end of pile • End of pile 2. Samples were taken at a depth of one foot into the actual pile. A shovel was used to access the area
where the sample was collected. 3. The 30 grab samples from each routine monitoring location were collected in a 5 gallon bucket and
transferred to a tarp for mixing with a hand trowel. The cone and quartering procedure described in greater detail in the Commercial Food Waste Composting Study Operations Plan in Appendix J was used to reduce the grab samples into smaller proportions.
4. The remaining samples were transferred into a one-gallon Ziploc bag using the hand trowel, placed
into a plastic box and transported to the OSU laboratory for sample analysis.

_____________________________________________________________________23
Refer to Appendix J for more details. 3.5.2 Sanitation Procedures To prevent cross contamination between samples taken from each pile, sampling equipment was sanitized prior to sample collection, between test piles, and after the samples were collected from each of the two piles (three times per sampling event). The sanitation procedures entailed scrubbing the Pyrex measuring cup, sampling trowel, shovel, black 20-gallon rubber tub, and the leachate buckets with 10 percent solution of household bleach and water followed by rinsing the equipment with tap water. Refer to Appendix J for more details. 3.6 Leachate Sample Collection Protocol Leachate was collected at the downslope end of each compost pile in a five gallon plastic bucket. For two days prior to leachate sample shipment and the day of sample shipment, a 200 ml leachate subsample was collected from each pile by immersing a sanitized measuring cup into the five gallon plastic bucket and transferring it into a labeled leachate sampling container. Samples collected prior to sample shipment were kept in the storage shed. On the day of sample shipment, the collected composite samples were mixed thoroughly by gently shaking or swirling the sample container. After mixing, a 200 ml aliquot sample was transferred into 200 ml sample collection bottle for each pile. The Sample collection bottles were labeled with the project ID, pile ID, requested tests, and collection date and time. Immediately after the samples were collected, they were placed in a cooler with blue ice and prepared for shipment to the laboratories. Refer to Appendix J for more information on leachate collection and sampling. During n Period 2 process weeks 6, 7 and 8, leachate samples were not collected from either pile because there wasn’t any leachate collected in the five gallon plastic buckets. This was due to pile drying throughout the composting process. 3.7 Final Product Analysis The final product quality was analyzed for the following: • Public health parameters – Salmonella and fecal coliform • Stability parameters – CO2 respiration, Solvita stability, Organic carbon and TKN • Product Quality parameters – total solids, conductivity, sieve analysis, pH, ammonium, nitrate, plant
nutrients, and trace metals Refer to Appendices F, G and H for final product analysis results. 3.8 Data Collection and Recording Daily monitoring data included daily pile temperatures, pile oxygen levels, ambient temperatures and field observations. Monitoring and sampling personnel recorded this data on a field data form kept in the storage shed at the Rexius facility. Field data forms for Period 1 and 2 are located in Appendices A and B, respectively. A completed field data form was faxed to Tetra Tech on a weekly basis, input into electronic format and distributed to the project team members. A project photo log is located in Appendix I.

_____________________________________________________________________24
Noted comments of concern on field data forms were the following: • Increase of odor during LTW turning and after turning completed during Period 1 process week 2 • No increase odor generated from PAW turning during Period 1 • LTW and PAW leachate very odorous during Period 1process week 2 • Strong manure odors generated after turning LTW during Period 2 process week 2 • No leachate in buckets for either pile during Period 2 process weeks 6, 7 and 8

_____________________________________________________________________25
SECTION 4 PROJECT RESULTS A comprehensive monitoring program was completed to document the performance of the LTW and PAW composting processes. The results of the monitoring program are provided in the following discussion. 4.1 Weather Table 6 provides a summary of average rainfall and temperature for the months in which Periods 1 and 2 occurred. The actually rainfall during the testing period is also provided. The daily weather data for the test period is provided in Appendix E.
Average 2001/2 Tests Average 2001/2
November 8.4 6.9 45 48
Period 1Nov. 28-30 2.2December 8.3 6.7 6.7 40 42January 7.7 7.8 7.8 40 42February 6.4 2.4 2.4 43 45March 1-7 1.6
March 5.8 4.3 46 44Period 1 Average 20.6 43 44
Period 2March 13-31 1.3April 3.7 1.9 1.9 50 51May 2.7 2.1 2.1 55 53June 1-20 0.4
June 1.5 0.7 60 60Period 2 Average 5.6 53 52
Temperature average (oF)Rainfall (in.)
Table 6: Period 1 and 2 Weather Data

_____________________________________________________________________26
4.2 Initial Materials, Mixing and Pile Formation The mass balances for the materials received and composted during Period 1 and 2 are presented as Tables 7 and 8, respectively.

_____________________________________________________________________27
Table 7: Period 1 - Mass Balance
TS VS TKN Carb C:N Dry Wt. Wet Wt. Density Volume Volume Ratio(%) (%) (%) (%) (tons) (tons) (lb/cy) (cy) cybm : cyfs
FeedstocksFood Waste 25.10 90.04 1.18 50.02 42.39 3.3 13.2 1200 22
Chicken Offal 52.45 84.6 5 47 9 4.02 7.66 1600 10Yard Debris 30.2 71.82 0.81 39.90 49.26 13.9 46.0 855 110 2.6
Sawdust 46.3 90.36 0.07 50.20 717.14 12 27 559 95 2.3Manure 65 88.2 4 49 12 2.6 4.0 800 10
Input Mix 37.07 83.16 1.19 46.2 38.8 36 97 987 24028.5
Anresco lab dataOSU lab datafield data
cybm cubic yards bulking material including yard debris and sawdustcyfs cubic yards feedstocks including food waste, chicken offal and manure

_____________________________________________________________________28
Table 8: Period 2 - Mass Balance
TS VS TKN Carb C:N Dry Wt. Wet Wt. Density Volume Volume Ratio(%) (%) (%) (%) (tons) (tons) (lb/cy) (cy) cybm : cyfs
FeedstocksFood Waste 23.2 77.98 1.96 43.32 22.1 3.29 14.2 1100 26
Chicken Offal 45.7 84.6 5 47 9 4.27 9.34 1500 12Yard Debris 32.3 66.78 0.85 37.10 43.6 10.4 32.2 1200 54 1.1
Sawdust/Shredded Yard Debris 36.6 89.28 0.07 49.60 708.6 12 32 670 95 1.9Manure 48.3 88.2 4 49 12 3.6 7.5 1500 10
Sheep Heads 55 83 1.5 46 31 0.18 0.33 1300 0.5Input Mix 35.03 95.31 1.13 52.95 46.9 33 95 960 193
31.5
Anresco lab dataOSU lab dataSoil Control Lab datafield data
cybm cubic yards bulking material including yard debris and sawdust/shredded yard wastecyfs cubic yards feedstocks including food waste, chicken offal, manure and sheepheads
_____________________________________________________________________29
4.3 Composting Process The composting process was tracked by monitoring critical parameters (moisture content, temperature, oxygen content, stability and indicator organisms) on a routine basis. In addition, intensive measurements of temperature and oxygen content were completed at additional locations on the pile, refer to Section 3.4 for monitoring details. Stability data was collected during process weeks 4, 6, 8, 10, 12 and 14 for Periods 1 and 2. Stability data collection was initiated during week 4 because earlier data would not be useful. Refer to Appendices F and H for results of stability tests. 4.3.1 Moisture Content Figure 1 illustrates the changes in pile moisture content for both the LTW and PAW processes during Periods 1 and 2.

_____________________________________________________________________30
Figure 1: Moisture Content Change During Composting
0
10
20
30
40
50
60
70
80
0 2 4 6 8 10 12 14 16
Weeks
Moi
stur
e C
onte
nt (%
)
P1 LTWP1 PAWP2 LTWP2 PAW
_____________________________________________________________________31
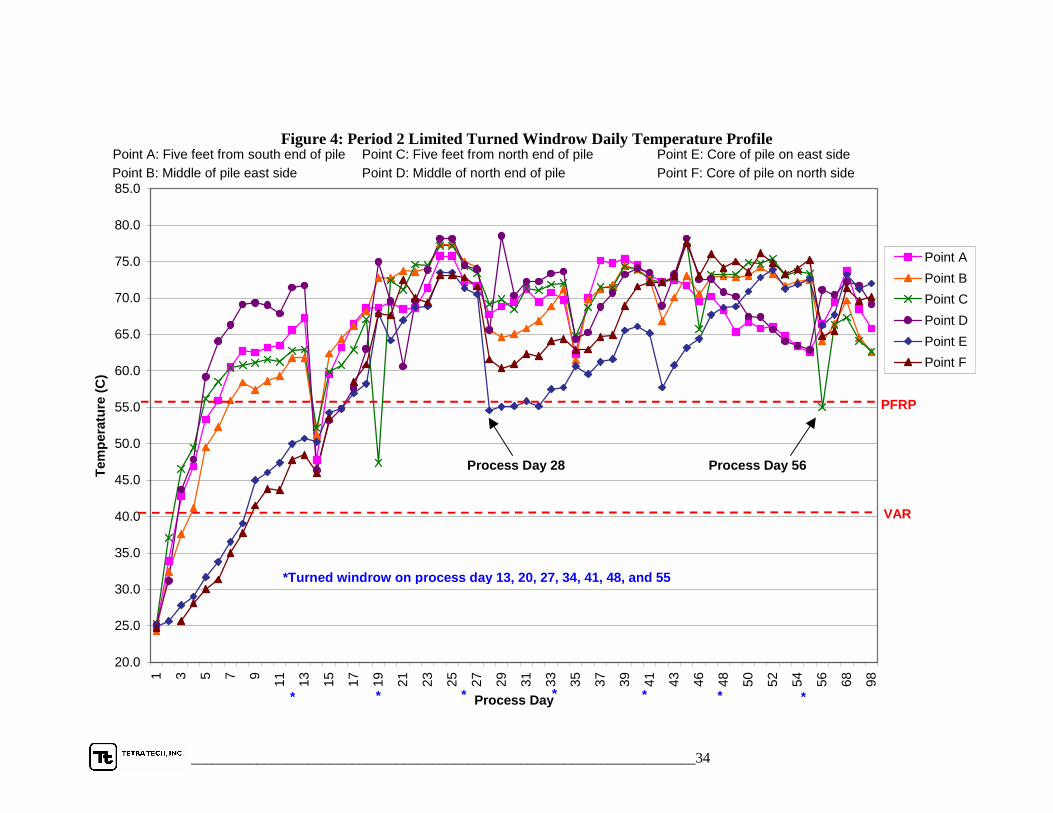
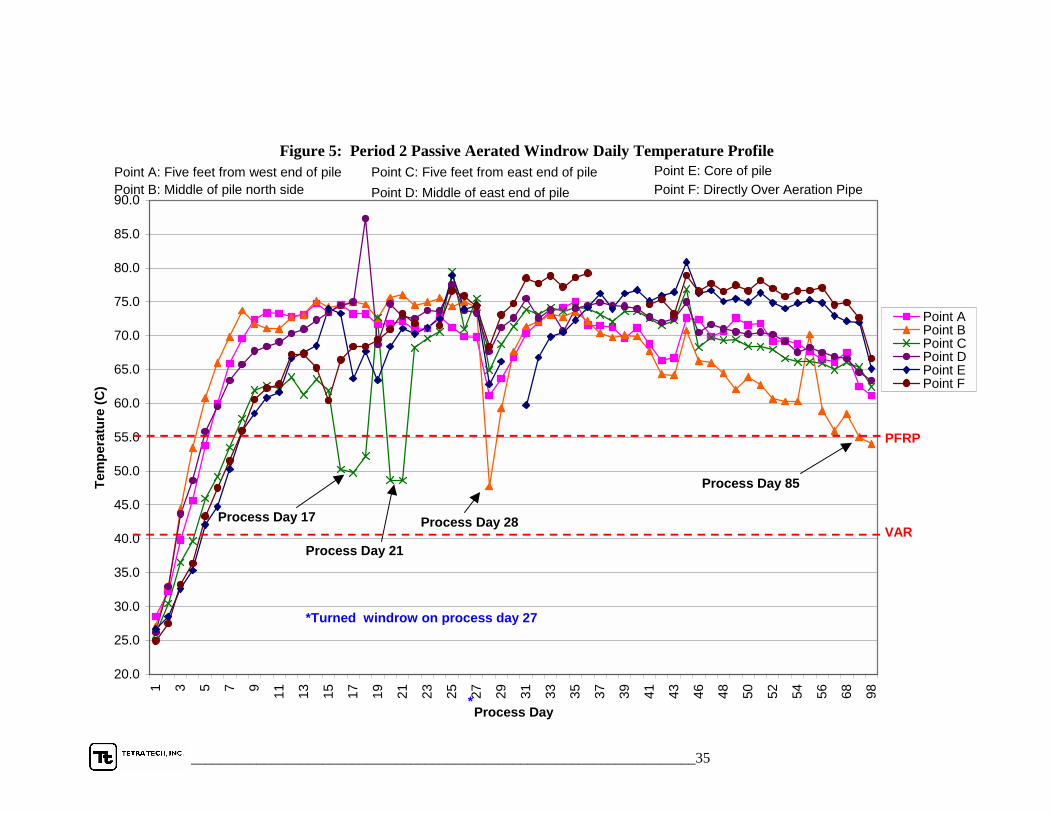
4.3.2 Temperature Figure 2 shows the temperature data for the 4 routine monitoring locations in the LTW pile during period 1. Figure 3 provides the same information for the PAW during Period 1. The four routine monitoring temperature probes were at a depth of 3 feet from the pile surface and located in the piles as follows: # Probe A: 3 feet high and 5 feet from the end of the pile # Probe B: 3 feet high and at the center of the pile # Probe C: 3 feet high and 5 feet from the opposite end of the pile # Probe D: 3 feet high and in the end of the pile. Figure 4 shows the temperature data for the 6 routine monitoring locations in the LTW pile during period 2. Figure 5 provides this information for the PAW during Period 2.

_____________________________________________________________________32
Figure 2: Period 1 Limited Turn Windrow Daily Temperature Profile
15.0
20.0
25.0
30.0
35.0
40.0
45.0
50.0
55.0
60.0
65.0
70.0
75.0
80.0
85.01 3 5 7 9 11 13 15 17 19 21 23 25 28 30 32 34 36 39 42 44 47 49 51 54 56 70 98
Process Day
Tem
pera
ture
(C)
Point APoint BPoint CPoint D
* Turned windrow on process days 13, 20, 26, 34, 41, 48, and 55
Point B: Middle of pile sidePoint A: Five feet from south end of Point C: Five feet from north end of pile
Point D: Middle of north end of pile
* * * * * * *
Process Day 11
Process Day 28
Process Day 49
Process Day 56
PFRP
VAR

_____________________________________________________________________33
Figure 3: Period 1 Passive Aerated Windrow Daily Temperature Profile
20.0
25.0
30.0
35.0
40.0
45.0
50.0
55.0
60.0
65.0
70.0
75.0
80.0
85.0
1 3 5 7 9 11 13 15 17 19 21 23 25 28 30 32 34 36 39 42 44 47 49 51 54 56 70 98
Process Day
Tem
pera
ture
(C)
Point APoint BPoint CPoint D
PFRP
Point A: Five feet from west end of pilePoint B: Middle of pile side
Point C: Five feet from east end of pilePoint D: Middle of east end of pile
*
* Turned windrow on process day 26
Process day 11
Process Day 55
VAR
_____________________________________________________________________34
Figure 4: Period 2 Limited Turned Windrow Daily Temperature Profile
20.0
25.0
30.0
35.0
40.0
45.0
50.0
55.0
60.0
65.0
70.0
75.0
80.0
85.0
1 3 5 7 9 11 13 15 17 19 21 23 25 27 29 31 33 35 37 39 41 43 46 48 50 52 54 56 68 98
Process Day
Tem
pera
ture
(C)
Point APoint BPoint CPoint DPoint EPoint F
PFRP
Point A: Five feet from south end of pilePoint B: Middle of pile east side
Point C: Five feet from north end of pilePoint D: Middle of north end of pile
Point E: Core of pile on east sidePoint F: Core of pile on north side
*Turned windrow on process day 13, 20, 27, 34, 41, 48, and 55
* * * * * * *
Process Day 28 Process Day 56
VAR
_____________________________________________________________________35
Figure 5: Period 2 Passive Aerated Windrow Daily Temperature Profile
20.0
25.0
30.0
35.0
40.0
45.0
50.0
55.0
60.0
65.0
70.0
75.0
80.0
85.0
90.0
1 3 5 7 9 11 13 15 17 19 21 23 25 27 29 31 33 35 37 39 41 43 46 48 50 52 54 56 68 98
Process Day
Tem
pera
ture
(C)
Point APoint BPoint CPoint DPoint EPoint F
PFRP
Point A: Five feet from west end of pilePoint B: Middle of pile north side
Point C: Five feet from east end of pilePoint D: Middle of east end of pile
Point E: Core of pilePoint F: Directly Over Aeration Pipe
*Turned windrow on process day 27
*
Process Day 17
Process Day 21
Process Day 28
Process Day 85
VAR

_____________________________________________________________________36
The six routine monitoring temperature probes were at a depth of 3 feet from the pile surface and located in the piles as follows: # Probe A: 3 feet high and 5 feet from the end of the pile # Probe B: 3 feet high and at the center of the pile # Probe C: 3 feet high and 5 feet from the opposite end of the pile # Probe D: 3 feet high and in the end of the pile. # Probe E: LTW – 3 feet high and at core of the pile on the east side
PAW – 3 feet high and at the core of the pile # Probe F: LTW - 3 feet high and at core of the pile on the north side
PAW - directly over an aeration pipe The intensive temperature monitoring data is provided on Tables 9, 10, 11 and 12 for Period 1 LTW and PAW and Period 2 LTW and PAW, respectively. Shaded boxes indicate temperatures greater than or equal to 55°C. More details regarding field-monitoring methods are located in Section 3.4. Field monitoring temperature data is located in Appendix C.

_____________________________________________________________________37
Table 9: Period 1 - Limited Turn Windrow Intensive Temperatures (C)
Heights Locations (ft) 1 2 4 1 2 4 1 2 4 1 2 4
A 1.5 ** 63.9 62.8 58.9 50.0 54.4 51.1 50.6 50.6 48.9 46.7 50.6 45.63 62.2 68.9 63.9 52.8 52.2 49.4 50.6 50.0 48.9 63.3 66.1 66.76 71.1 70.0 55.0 49.4 45.0 30.6 48.3 45.6 40.6 69.4 70.0 63.3
B 1.5 ** 55.0 55.0 52.2 47.2 51.7 51.7 51.1 53.9 52.2 56.7 63.3 65.03 58.9 58.9 51.1 46.7 48.9 38.9 51.7 55.6 51.7 65.6 64.4 58.96 51.7 57.2 56.1 45.0 40.6 30.6 51.7 51.7 51.1 65.6 66.7 57.8
C 1.5 ** 62.8 67.2 61.7 51.7 47.2 30.0 57.2 59.4 59.4 61.1 58.9 56.13 60.0 61.1 55.6 52.2 50.0 44.4 55.6 56.1 51.1 60.0 59.4 48.36 60.0 55.0 50.0 53.9 47.8 41.7 50.6 51.1 48.3 59.4 57.2 54.4
D 1.5 ** 54.4 53.9 52.8 46.1 45.0 40.0 54.4 52.2 45.6 60.0 60.0 59.43 55.0 51.1 51.1 49.4 52.2 47.8 47.2 50.6 45.6 60.0 60.0 53.96 55.6 51.1 47.2 46.1 48.3 41.7 47.2 49.4 47.8 53.3 51.1 47.2
Heights Locations (ft) 1 3 4 1 2 4 1.5 3 4 1 2 4
A 1.5 - - - - - - 57.8 60.0 - 45.6 47.2 45.63 - 71.1 - 71.1 72.8 66.7 51.7 56.7 - 47.8 48.9 47.26 - 64.4 - - - - 57.2 62.2 - 46.7 47.2 40.0
B 1.5 - - - - - - 58.9 60.6 - 60.6 63.9 60.63 - 61.7 - 67.2 69.4 65.6 65.6 65.0 - 59.4 63.3 63.36 - 61.1 - - - - 66.7 62.2 - 66.1 68.3 61.1
C 1.5 - 61.1 - - - - 63.3 61.1 - 61.7 62.2 58.33 - 61.1 - 69.4 74.4 66.7 60.0 65.0 - 57.2 57.8 51.76 - 59.4 - - - - 54.4 55.6 - 53.3 52.8 52.2
D 1.5 - 56.1 - - - - 61.1 59.4 - 57.8 58.9 55.03 - 60.0 - 68.9 63.3 63.9 56.7 56.7 - 52.8 56.7 56.16 - 59.4 - - - - 53.3 54.4 - 55.6 56.7 56.7
PFRP ≥ ≥ ≥ ≥ 55 C
*Temps measured using Demista oxygen probe**Pile heights for week one measured at 2 foot not 1.5 feet***Temps measured using 18" and/or 36" Reotemps
Pile Depths (ft) Pile Depths (ft) Pile Depths (ft) Pile Depths (ft)Pile Temperatures (C)*** Pile Temperatures (C)* Pile Temperatures (C)*** Pile Temperatures (C)*
Process Week 5 Process Week 6 Process Week 7 Process Week 8
Pile Depths (ft) Pile Depths (ft) Pile Depths (ft) Pile Depths (ft)Pile Temperatures (C)* Pile Temperatures (C)* Pile Temperatures (C)* Pile Temperatures (C)*
Process Week 1 Process Week 2 Process Week 3 Process Week 4

_____________________________________________________________________38
Table 10: Period 1 - Passive Aerated Windrow Intensive Temperatures (C)
Heights Locations (ft) 1 2 4 1 2 4 1 2 4 1 2 4
A 1.5** 57.2 56.1 71.7 53.9 57.2 52.8 45.6 51.7 52.2 65.6 67.2 64.43 56.7 58.3 70.0 55.0 55.0 41.1 54.4 50.0 48.9 76.7 75.6 71.16 33.9 43.3 60.6 52.8 49.4 28.9 40.6 39.4 37.2 63.9 59.4 54.4
B 1.5** 66.7 68.3 68.3 68.9 70.0 68.9 60.0 63.3 64.4 66.1 72.8 63.33 72.2 76.7 68.3 67.2 71.1 66.7 58.3 63.9 67.8 67.8 74.4 72.26 62.8 60.0 52.8 63.3 65.0 59.4 51.1 53.9 49.4 76.7 75.6 72.2
C 1.5** 70.0 75.0 66.7 57.8 61.7 57.2 50.6 57.2 62.8 62.8 64.4 62.83 73.9 77.2 68.9 53.3 57.8 66.7 53.3 58.9 62.2 70.6 77.8 79.46 69.4 61.7 52.2 61.1 63.3 58.3 54.4 61.1 61.7 72.8 76.1 70.0
D 1.5** 69.4 76.1 70.6 63.3 69.4 71.1 42.8 45.6 47.8 58.9 68.3 67.83 69.4 66.1 59.4 68.9 68.9 61.7 55.6 61.7 57.2 70.6 78.3 81.76 58.9 63.3 39.4 62.8 66.7 63.9 52.8 62.2 60.6 73.9 74.4 70.0
Heights Locations (ft) 1 2 4 1 2 4 1.5 3 4 1 2 4
A 1.5 - 61.1 - - - - 50.0 56.7 - 50.0 55.6 53.33 - 65.0 - 62.8 70.0 67.2 57.8 60.0 - 47.8 57.2 62.26 - 70.0 - - - - 60.0 68.9 - 61.7 66.7 62.8
B 1.5 - 63.3 - - - - 50.6 61.1 - 61.7 66.1 65.03 - 66.7 - 66.1 67.2 71.7 65.6 66.7 - 63.3 70.0 58.36 - 70.0 - - - - 57.2 66.1 - 66.1 66.7 61.1
C 1.5 - 56.7 - - - - 53.9 58.9 - 52.8 57.8 57.23 - 63.3 - 70.6 65.0 73.9 58.9 65.6 - 65.0 72.8 69.46 - 66.7 - - - - 58.9 65.6 - 70.6 73.9 66.7
D 1.5 - 62.8 - - - - 50.0 56.7 - 45.6 51.7 44.43 - 69.4 - 65.0 60.0 72.2 50.6 60.0 - 46.1 52.8 56.16 - 68.3 - - - - 61.7 69.4 - 67.2 73.9 71.7
PFRP ≥ ≥ ≥ ≥ 55 C
*Temps measured using Demista oxygen probe**Pile heights for week one measured at 2 foot not 1.5 feet***Temps measured using 18" and/or 36" Reotemps
Process Week 7Pile Temperatures (C)***
Pile Depths (ft)
Process Week 8Pile Temperatures (C)*
Pile Depths (ft)
Process Week 5Pile Temperatures (C)***
Pile Depths (ft)
Process Week 6Pile Temperatures (C)*
Pile Depths (ft)
Pile Depths (ft) Pile Depths (ft) Pile Depths (ft) Pile Depths (ft)Pile Temperatures (C)* Pile Temperatures (C)* Pile Temperatures (C)* Pile Temperatures (C)*
Process Week 1 Process Week 2 Process Week 3 Process Week 4

_____________________________________________________________________39
Table 11: Period 2 - Limited Turn Windrow Intensive Temperatures (C)
Temp (C)Process Day Pile Depth A B C D E F
1 1 29.9 19.8 17.5 28.0 26.2 27.13 24.9 24.3 25.3 25.14 24.9 24.7
8 1 57.7 48.8 50.8 62.1 41.6 57.33 62.7 58.4 60.8 69.14 39.1 37.7
15 1 72.2 70.6 68.5 64.9 67.1 57.33 59.5 62.4 59.9 53.24 54.2 53.5
22 1 66.1 70.3 69.8 72.3 67.9 68.93 68.7 73.6 74.6 69.64 68.7 69.9
29 1 58.5 60.8 65.9 70.4 64.3 69.13 68.8 64.6 69.8 67.44 55.1 60.4
36 1 65.2 64.2 68.0 72.2 74.1 71.63 70.1 69.8 68.7 65.34 59.6 62.9
43 1 50.6 68.8 61.8 65.7 73.5 72.43 72.5 70.1 72.7 73.34 60.8 73.0
49 1 47.2 54.2 61.4 52.1 63.9 51.83 65.3 72.8 73.2 70.24 68.8 75.0
57 1 73.4 68.7 63.2 72.9 72.1 67.23 69.5 66.4 66.3 70.44 67.7 65.5
68 1 51.6 45.6 46.5 65.6 60.9 57.23 73.8 69.7 67.3 72.24 73.2 71.3
85 1 55.0 51.3 49.4 59.7 51.4 55.43 68.5 64.6 64.1 71.74 71.3 69.6
98 1 48.1 46.7 43.1 50.2 53.3 50.43 65.8 62.6 62.7 69.24 72.0 70.2
PFRP ≥ ≥ ≥ ≥ 55 C

_____________________________________________________________________40
Table 12: Period 2 - Passive Aerated Windrow Intensive Temperatures (C)
Temp (C)Process Day Pile Depth A B C D E F
1 1 29.8 30.9 21.9 29.0 28.5 28.93 28.6 27.1 25.8 26.24 26.7 24.9
8 1 53.0 61.7 47.8 67.4 60.2 66.43 69.6 73.7 57.7 65.74 56.0 55.9
15 1 54.7 59.2 41.9 66.1 68.2 69.43 73.4 74.2 61.9 73.44 73.9 60.4
22 1 57.5 49.3 43.5 51.3 52.7 56.33 70.9 74.5 68.2 72.54 70.3 71.8
29 1 70.7 64.2 73.0 74.2 74.3 72.63 63.7 59.3 68.7 71.24 66.2 73.1
36 1 51.1 56.7 62.8 71.2 65.2 60.13 71.6 72.2 74.1 74.44 74.2 79.2
43 1 45.9 43.6 57.1 62.7 57.3 58.43 66.7 64.2 72.3 72.64 76.4 73.2
49 1 46.4 48.1 50.1 59.0 55.0 58.83 72.6 62.1 69.4 70.64 75.4 77.4
57 1 44.3 37.5 47.0 45.7 46.4 55.73 66.1 55.9 64.9 66.94 72.9 74.6
68 1 45.8 41.1 43.4 50.4 49.7 53.13 67.5 58.4 66.1 66.64 72.0 74.9
85 1 38.3 39.5 44.8 51.5 46.3 48.83 62.5 55.0 65.3 64.64 71.9 72.6
98 1 43.3 43.0 48.2 50.9 46.8 49.13 61.2 54.1 62.4 63.44 65.1 66.6
PFRP ≥≥≥≥ 55 C
_____________________________________________________________________41
4.3.3 Oxygen Content Although oxygen data was collected throughout the study, the data was not considered reliable based on unusual data variability, consistent plugging of the oxygen probe with pile material and the potential for short circuiting fresh air to the Demista sensor. The data is provided in Appendix D but will not be included in the process performance assessment. Refer to Section 3.4.2 for details on use of the Demista for collection of oxygen data. 4.3.4 Stability Stability data was collected for both the LTW and PAW processes during Periods 1 and 2. Stability parameters monitored were carbon dioxide (CO2) evolution rate, Solvita maturity index, and Vector Attraction Reduction (VAR) time and temperature requirements. A variety of stability tests were evaluated to measure the CO2 evolution rate. Stability test and comparison results are located in Appendix F. Oregon State University (OSU) compared the following stability test methods: 1. Draeger tube 4-hr test - CO2 evolution rate determined over a 4 hr period (125 g compost, 0.95 L jar,
25oC); 2. Draeger tube 4-hr test refrigerated - CO2 evolution rate determined over a 4 hr period. (Samples held
under refrigeration for approximately 48 h, then allowed to warm to room temperature prior to respiration measurement. 125 g compost, 0.95 L jar, 25oC);
3. Alkaline trap 4-hr test - CO2 evolution rate determined over a 4 hr period (125 g compost, 0.95 L jar, 25oC);
4. Alkaline trap 0 to 24-hr test - CO2 evolution rate determined for first day of incubation period – 24 hours (25 g compost, 3.8 L jar, 25oC);
5. Alkaline trap 24 to 48-hr test - CO2 evolution rate determined for second day of incubation -continuation of 0-24 hour incubation (25 g compost, 3.8 L jar, 25oC); and
6. Solvita CO2 test – CO2 evolution rate determined over a 4 hr period (Compost added to jar fill line, color read from gel paddle after 4 hours at 25oC).
The test methods were chosen to compare methods at the same incubation temperature (all tests done at 25oC), using different methods to measure CO2 evolution. Specifically, the following comparisons were made (Appendix F):
• Effect of sample refrigeration vs. no refrigeration (Method 1 vs. 2 above); • Accuracy of Draeger tube measurement of CO2 evolution (Method 2 vs. 3); • Correlation between quick alkaline trap incubation (4h) vs. longer alkaline trap incubation (48 h).
Method 2 vs. Methods 4 + 5; and • Correlation between Solvita quick test (4 h) and alkaline trap methods (Method 6 vs. Methods 3,
4 or 5). The objective was to evaluate the effectiveness of these less costly and field based alternative test procedures to provide results comparable to existing Draeger tube and Alkaline trap test procedures. Stability test and comparison results are located in Appendix F. The alternative alkaline trap test procedures used by OSU (Methods 4 and 5) are a variation of the US Composting Council (USCC) standard test method TMECC 05.08-B. The alternative OSU procedures (Methods 4 and 5) use an incubation temperature equal to 25oC and the CO2 evolution rate was
_____________________________________________________________________42
determined over a 2-day period in comparison to the TMECC 05-08-B method, where incubation temperature is equal to 37oC and CO2 evolution rate is determined over a 4-day period. Direct comparisons with TMECC 05.08-B were not performed as a part of this research project. The approximate equivalency of methods used in this study (Method 1, Method 4 + 5, and Method 6) with TMECC Method 05.08-B assumed the following:
• CO2 evolution rate for longer period (72 h) and higher temperature (37oC) used in TMECC 05.08 B would be 2X that measured in the food waste pilot study (incubation temperatures of 25oC, incubation time of 48 h) and
• Compost organic matter is approximately 50 % C. Using linear regression (Appendix F), OSU estimated that a TMECC 05.08-B value of 4 mg CO2-C per g organic matter per day is approximately equivalent to:
• Method 1 = 4 % CO2. Draeger quick test value (125 g compost in 0.9 L jar for 4 hours at 25oC) • Methods 4 + 5 = 4 mg CO2-C g C-1 d-1. Alkaline trap (48 hour incubation, 25 g compost in 3.8
L jar for 48 hours at 25oC) • Method 6: Solvita CO2 test value = 3.5
Carbon dioxide evolution rate measured using the alternative OSU alkaline trap 24-hour test and 48-hour test results (Methods 4 and 5 above) were averaged and are plotted on Figures 6 and 7 for the LTW and PAW processes, respectively. Each data point on Figures 6 and 7 is the average of four samples taken from each pile on each sampling date. Standard deviations for each data point are given in Appendix F. Standard deviation (a measure of variability associated with a data point) decreased with composting time. For example, at a mean CO2 evolution rate of approximately 5 mg CO2-C per g compost C per day, standard deviation ranged from 2.2 to 4.2 mg CO2-C per g compost C per day. At a mean CO2 evolution rate of 1 to 2 mg CO2-C per g compost C per day, standard deviation ranged from approximately 0.2 to 1.1 mg CO2-C per g compost C per day. A low CO2 evolution rate indicates low microbial activity and high stability. According to the USCC TMECC 05.08, a CO2 evolution rate ranging from 2 to 8 mg CO2-C per gram compost organic matter per day (approximately 4 to 16 mg CO2-C per gram compost organic carbon per day) indicates a stable compost and a CO2 evolution rate less than 2 mg CO2-C per gram compost organic matter per day (4 mg CO2-C per gram compost organic carbon per day) indicates a very stable compost. OSU additionally used the TMECC 05.08-E test method (Woods End Solvita test) to determine the sample maturity index, reported on a scale of 1 to 8. The Solvita test results for the LTW and PAW processes during both Period 1 and 2 for the are shown on Figure 8. According to the USCC standard test method TMECC 05.08-E, a Solvita maturity index ranging from 5 to 6 indicates a stable compost and a Solvita maturity index ranging from 7 to 8 indicates a very stable compost. Solvita test protocols and standards are located in the TMECC 05.08-E test methods in Appendix F. Soil Control Lab used the TMECC 05.08-B test method to measure the CO2 evolution rate for both the LTW and PAW processes during Period 1 weeks 8 and 14 and Period 2 week 14. The results are listed in Table 9.

_____________________________________________________________________43
Table 13: TMECC 05.08-B Stability Results Process TMECC 05.08-B CO2 Evolution Rate
(mg CO2-C per gram compost organic matter per day) Period 1 Week 8 LTW 2.1 PAW 2.4 Week 14 LTW 1.2 PAW 2.5
Period 2 Week 14 LTW 1.5 PAW 2.0 The stability lab data and protocols for the Draeger tube, Alkaline trap alternative procedures developed by OSU, TMECC 05.08-E (Solvita) and TMECC 05.08-B test methods are located in Appendix F. TMECC 05.08-E and TMECC 05.08-B test method standards are also located in Appendix F. There are currently no standards for the alternative Draeger tube and Alkaline trap test methods developed by OSU. The TMECC 05.08-B CO2 evolution rate data is located in the product quality data sheets in Appendix H. The 40 CFR 503 Vector Attraction Reduction (VAR) requirements are designed to provide sufficient degradation and stability in the composting material so that pathogen re-growth is unlikely. VAR requirements for composting are fourteen consecutive days over 40oC (104oF) with an average temperature over 45oC (113oC). Both the LTW and PAW processes met the 40 CFR 503 VAR requirements during Periods 1 and 2 within the first 17 to 25 process days. Refer to Figures 2, 3, 4 and 5 for the daily temperature profiles for the Period 1 LTW and PAW processes and Period 2 LTW and PAW processes, respectively.
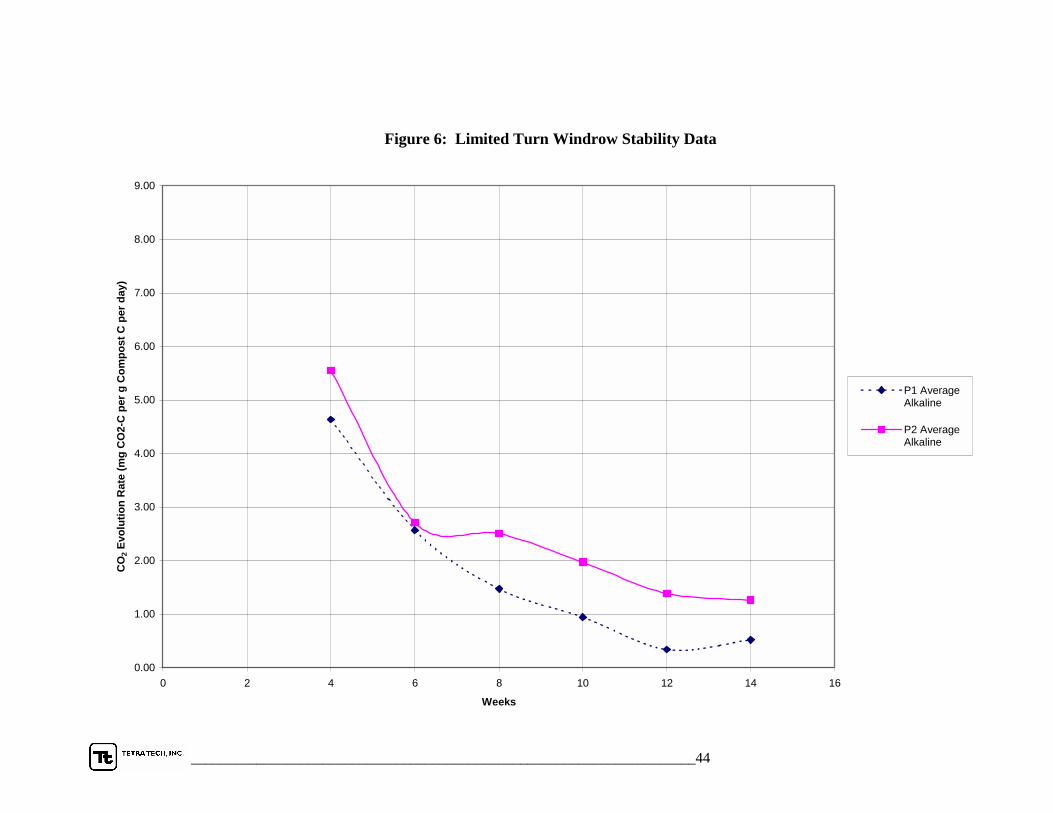
_____________________________________________________________________44
Figure 6: Limited Turn Windrow Stability Data
0.00
1.00
2.00
3.00
4.00
5.00
6.00
7.00
8.00
9.00
0 2 4 6 8 10 12 14 16
Weeks
CO
2 Evo
lutio
n R
ate
(mg
CO
2-C
per
g C
ompo
st C
per
day
)
P1 AverageAlkaline
P2 AverageAlkaline
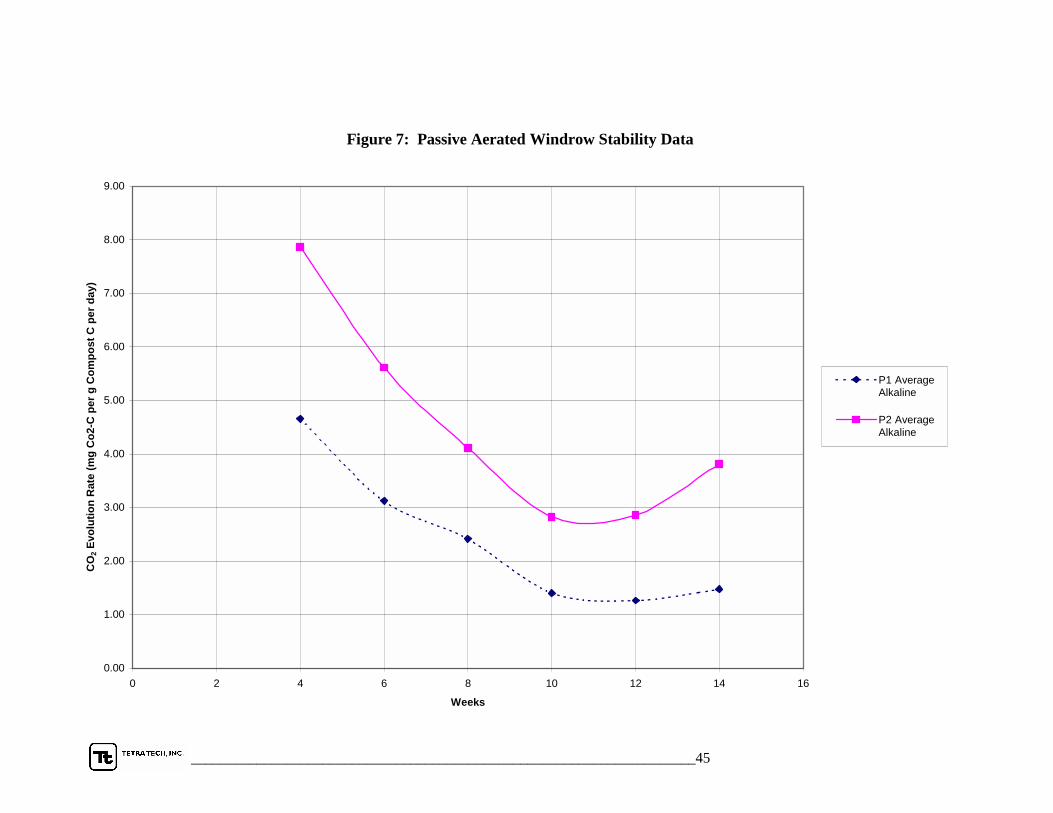
_____________________________________________________________________45
Figure 7: Passive Aerated Windrow Stability Data
0.00
1.00
2.00
3.00
4.00
5.00
6.00
7.00
8.00
9.00
0 2 4 6 8 10 12 14 16
Weeks
CO
2 Evo
lutio
n R
ate
(mg
Co2
-C p
er g
Com
post
C p
er d
ay)
P1 AverageAlkaline
P2 AverageAlkaline

_____________________________________________________________________46
Figure 8: Stability with Solvita Test
0.00
1.00
2.00
3.00
4.00
5.00
6.00
7.00
8.00
9.00
0 2 4 6 8 10 12 14 16
Weeks
1 to
8 M
atur
ity In
dex
Scal
e
P1 LTWP1 PAWP2 LTWP2 PAW
_____________________________________________________________________47
4.3.5 Indicator Organisms The indicator organism data for test Period 1 is provided on Table 14. Similar data for test period 2 is provided on Table 15. The lab data sheets are located in Appendix G.

_____________________________________________________________________48
Table 14: Period 1 - Indicator Organism Results
Process Salmonella Fecal Coliform TS Salmonella Fecal Coliform Salmonella Fecal Coliform TS Salmonella Fecal ColiformDate Week Sample ID (MPN/4 g TS) (MPN/g TS) (%) (MPN/100 ml) (MPN/100 ml) (MPN/4 g TS) (MPN/g TS) (%) (MPN/100 ml) (MPN/100 ml)
**Criteria** USEPA 40 CFR 503 Class A 3 1000 3 1000
19-Nov-01 OR DEQ FW Offal1 Positive NA NA Positive NA NA28-Nov-01 initial OR DEQ FW Offal2 274.52 >21,000 52.45 274.52 >21,000 52.45
initial OR DEQ FW Food <480 >4,400 25.10 <480 >4,400 25.10initial OR DEQ FW Mix 501.2 >38,000 28.72 501.2 >38,000 28.72
13-Dec-01 2 OR DEQ FW Comp1 37.88 49 31.58 <38.8 <9.7 31.092 OR DEQ FW Comp Dup <35.6 <8.9 33.822 OR DEQ FW Leach1 <0.3 <0.3 <0.3 <0.32 OR DEQ FW Leach Dup <0.3 <0.3
27-Dec-01 4 OR DEQ FW Comp2 <33.6 1,294 35.56 <35.2 1,365 34.214 OR DEQ FW Leach2 <0.3 4.3 <0.3 110
03-Jan-02 5 OR DEQ FW Comp3 <3.536 274 33.95 <3.6 69 33.335 OR DEQ FW Leach3 <0.3 4.3 <0.3 46
10-Jan-02 6 OR DEQ FW Comp4 <3.6 721.8 33.25 <3.96 11.8 30.426 OR DEQ FW Leach4 <0.3 2.3 <0.3 0.36
17-Jan-01 7 OR DEQ FW Comp5 <2.04 152.88 35.32 <2.12 13.49 34.117 OR DEQ FW Leach5 <0.3 0.91 <0.3 290
24-Jan-01 8 OR DEQ FW Comp6 <2.28 5,110 31.31 <2.36 261 30.658 OR DEQ FW Leach6 <0.3 24 <0.3 1,100
07-Mar-02 14 OR DEQ FW Comp7 <2.16 <0.054 33.55 <2.24 1,024 32.22
NOTES:NA not analyzed
MPN most probable numberg gram
TS total solids
Boxed greater than applicable criteriaNote: EITHER Salmonella OR fecal coliform criteria must be met to conform to US EPA 40CFR 503 Class A
Turned Windrow Passive Aerated WindrowCompost Leachate Compost Leachate
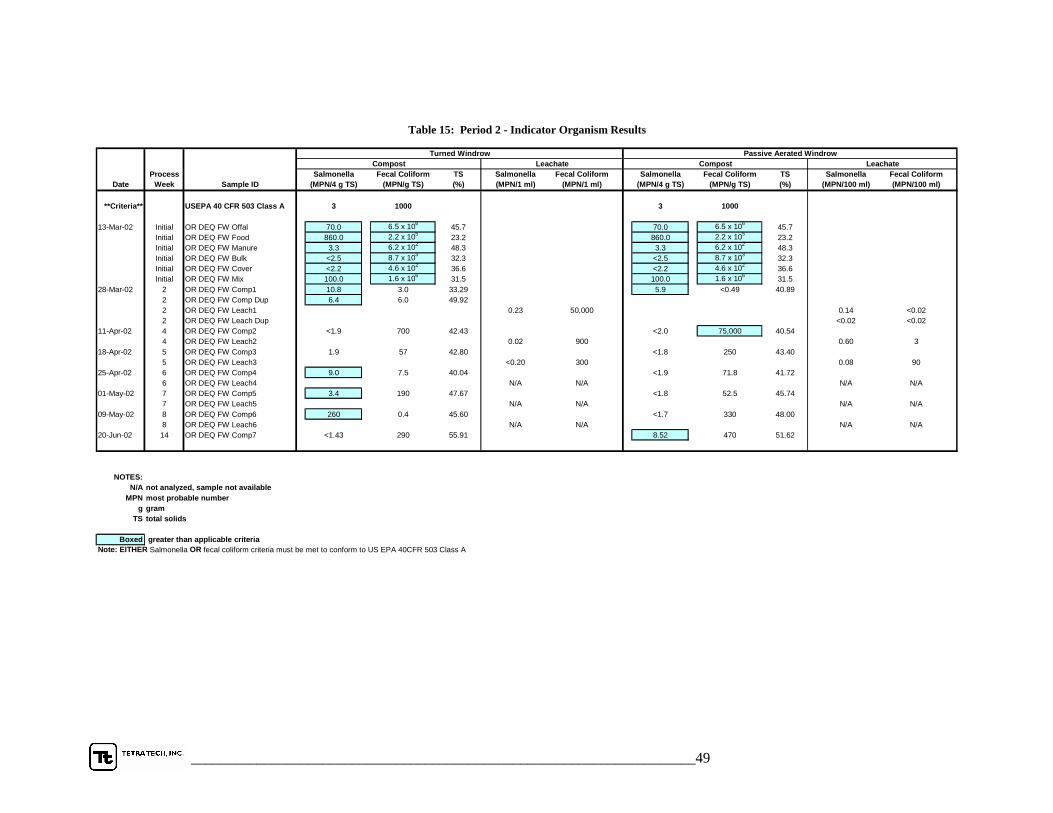
_____________________________________________________________________49
Table 15: Period 2 - Indicator Organism Results
Process Salmonella Fecal Coliform TS Salmonella Fecal Coliform Salmonella Fecal Coliform TS Salmonella Fecal ColiformDate Week Sample ID (MPN/4 g TS) (MPN/g TS) (%) (MPN/1 ml) (MPN/1 ml) (MPN/4 g TS) (MPN/g TS) (%) (MPN/100 ml) (MPN/100 ml)
**Criteria** USEPA 40 CFR 503 Class A 3 1000 3 1000
13-Mar-02 Initial OR DEQ FW Offal 70.0 6.5 x 10⁶ 45.7 70.0 6.5 x 10⁶ 45.7Initial OR DEQ FW Food 860.0 2.2 x 10⁵ 23.2 860.0 2.2 x 10⁵ 23.2Initial OR DEQ FW Manure 3.3 6.2 x 10² 48.3 3.3 6.2 x 10² 48.3Initial OR DEQ FW Bulk <2.5 8.7 x 10³ 32.3 <2.5 8.7 x 10³ 32.3Initial OR DEQ FW Cover <2.2 4.6 x 10² 36.6 <2.2 4.6 x 10² 36.6Initial OR DEQ FW Mix 100.0 1.6 x 10⁶ 31.5 100.0 1.6 x 10⁶ 31.5
28-Mar-02 2 OR DEQ FW Comp1 10.8 3.0 33.29 5.9 <0.49 40.892 OR DEQ FW Comp Dup 6.4 6.0 49.922 OR DEQ FW Leach1 0.23 50,000 0.14 <0.022 OR DEQ FW Leach Dup <0.02 <0.02
11-Apr-02 4 OR DEQ FW Comp2 <1.9 700 42.43 <2.0 75,000 40.544 OR DEQ FW Leach2 0.02 900 0.60 3
18-Apr-02 5 OR DEQ FW Comp3 1.9 57 42.80 <1.8 250 43.405 OR DEQ FW Leach3 <0.20 300 0.08 90
25-Apr-02 6 OR DEQ FW Comp4 9.0 7.5 40.04 <1.9 71.8 41.726 OR DEQ FW Leach4 N/A N/A N/A N/A
01-May-02 7 OR DEQ FW Comp5 3.4 190 47.67 <1.8 52.5 45.747 OR DEQ FW Leach5 N/A N/A N/A N/A
09-May-02 8 OR DEQ FW Comp6 260 0.4 45.60 <1.7 330 48.008 OR DEQ FW Leach6 N/A N/A N/A N/A
20-Jun-02 14 OR DEQ FW Comp7 <1.43 290 55.91 8.52 470 51.62
NOTES:N/A not analyzed, sample not available
MPN most probable numberg gram
TS total solids
Boxed greater than applicable criteriaNote: EITHER Salmonella OR fecal coliform criteria must be met to conform to US EPA 40CFR 503 Class A
Turned Windrow Passive Aerated WindrowCompost Leachate Compost Leachate
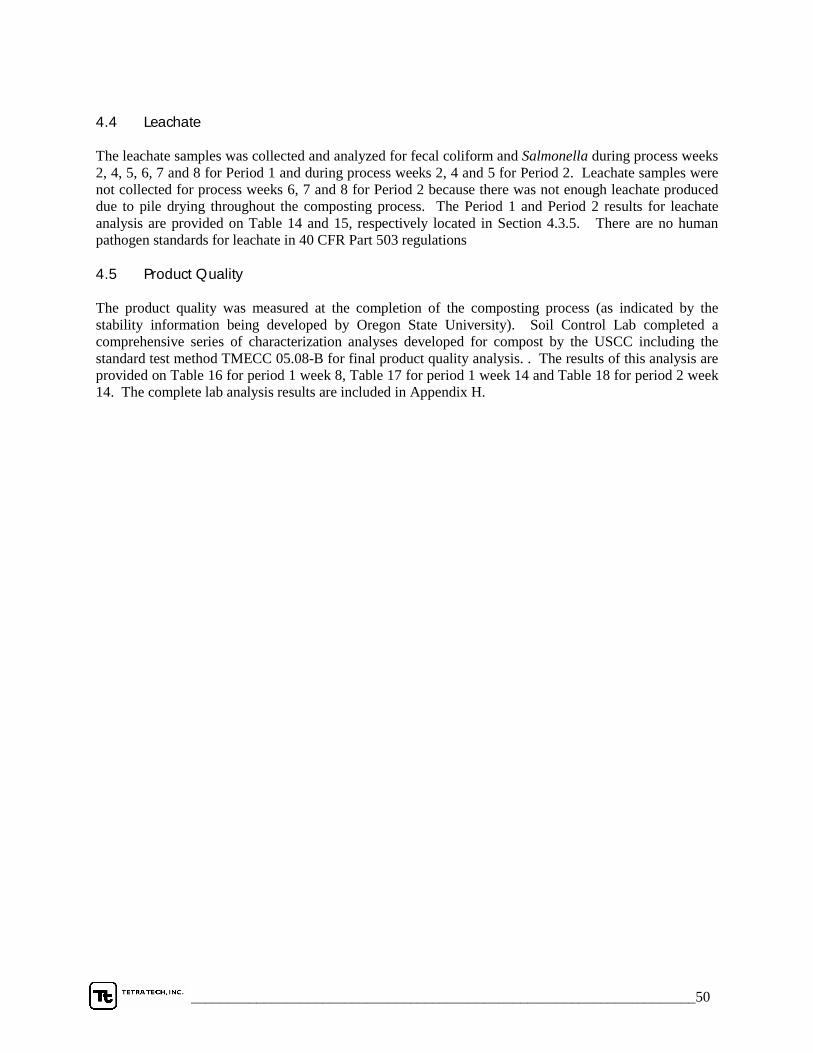
_____________________________________________________________________50
4.4 Leachate The leachate samples was collected and analyzed for fecal coliform and Salmonella during process weeks 2, 4, 5, 6, 7 and 8 for Period 1 and during process weeks 2, 4 and 5 for Period 2. Leachate samples were not collected for process weeks 6, 7 and 8 for Period 2 because there was not enough leachate produced due to pile drying throughout the composting process. The Period 1 and Period 2 results for leachate analysis are provided on Table 14 and 15, respectively located in Section 4.3.5. There are no human pathogen standards for leachate in 40 CFR Part 503 regulations 4.5 Product Quality The product quality was measured at the completion of the composting process (as indicated by the stability information being developed by Oregon State University). Soil Control Lab completed a comprehensive series of characterization analyses developed for compost by the USCC including the standard test method TMECC 05.08-B for final product quality analysis. . The results of this analysis are provided on Table 16 for period 1 week 8, Table 17 for period 1 week 14 and Table 18 for period 2 week 14. The complete lab analysis results are included in Appendix H.

_____________________________________________________________________51
Table 16: Period 1 Week 8 Product Quality Results
Analysis Units PAW TW
Germination & GrowthEmergence Cucumber %Relative Seeding Vigor Cucumber %Respiration Rate (mg CO2-C/g OM/day)BAC
Nutrients Wet Dry Wet DryTotal Nitrogen % 0.24 0.80 0.22 0.68Ammonia (NH4-N) mg/kg 71 232 49 151Nitrate (NO3-N) mg/kg 20 66 40 125Organic Nitrogen (Org.N) % 0.23 0.77 0.21 0.66Phosphorus (as P205) % 0.085 0.28 0.11 0.35Phosphorus (P) mg/kg 373 1225 493 1532Potassium (as K20) % 0.10 0.33 0.074 0.23Potassium (K) mg/kg 840 2755 615 1908Calcium (Ca) % 0.19 0.63 0.29 0.91Magnesium (Mg) % 0.038 0.13 0.028 0.088Sulfate (SO4) mg/kg 625 2050 805 2500Copper (Cu) mg/kg 6 20 5 17Zinc (Zn) mg/kg 20 66 19 60Iron (Fe) mg/kg 933 3060 869 2699Manganese (Mn) mg/kg 37 123 34 104Boron (B) mg/kg 18 57 15 46SaltsSodium (Na) % 0.026 0.085 0.017 0.053Chloride (Cl) % 0.029 0.095 0.024 0.074GeneralpH - 6.60 NA 7.32 NAElectrical Conductivity mmhos/c 0.57 1.88 0.39 1.22Bulk Density lb/cu ft 41 12 39 12Carbonates lb/ton 0 0 0 0Organic Matter % 27.1 88.9 28.6 88.9Organic Carbon % 13.1 42.9 15.5 48.1Ash % 3.4 11.1 3.6 11.1C/N Ratio - 53.8 53.8 70.4 70.4Moisture % 69.5 0.0 67.8 0.0MetalsArsenic (mg/kg)Cadmium (mg/kg)Chromium (mg/kg)Copper (mg/kg)Lead (mg/kg)Mercury (mg/kg)Molybdenum (mg/kg)Nickel (mg/kg)Selenium (mg/kg)Zinc (mg/kg)
Total Solids %Fecal Coliform MPN/g dry weight >1600
174
<113160
32.2
66
30.5500
<1141
34205
<1<1
<1<1
30 30
1002.4 2.1
100
100 100

_____________________________________________________________________52
Table 17: Period 1 Week 14 Product Quality Results
Analysis Units PAW TW
Germination & GrowthEmergence Cucumber % Pinto Bean %Relative Seeding Vigor Cucumber % Pinto Bean %Respiration Rate (mg CO2-C/g OM/day)BAC
Nutrients Wet Dry Wet DryTotal Nitrogen % 0.27 0.98 0.23 0.72Ammonia (NH4-N) mg/kg 45 165 15 48Nitrate (NO3-N) mg/kg 17 64 34 109Organic Nitrogen (Org.N) % 0.26 0.96 0.22 0.70Phosphorus (as P205) % 0.17 0.62 0.11 0.35Phosphorus (P) mg/kg 745 2730 487 1544Potassium (as K20) % 0.10 0.35 0.11 0.36Potassium (K) mg/kg 798 2925 935 2965Calcium (Ca) % 0.19 0.71 0.18 0.57Magnesium (Mg) % 0.045 0.16 0.051 0.16Sulfate (SO4) mg/kg 115 420 370 1175Copper (Cu) mg/kg 9 31 7 23Zinc (Zn) mg/kg 25 90 24 76Iron (Fe) mg/kg 1112 4078 1865 5916Manganese (Mn) mg/kg 52 192 43 138Boron (B) mg/kg 27 99 35 109SaltsSodium (Na) % 0.024 0.088 0.020 0.064Chloride (Cl) % 0.015 0.056 0.022 0.069GeneralpH - 6.43 NA 6.16 NAElectrical Conductivity mmhos/c 0.34 1.25 0.48 1.51Bulk Density lb/cu ft 45 12 36 11Carbonates lb/ton 0 0 0 0Organic Matter % 24.0 88.1 29.3 93.0Organic Carbon % 11.9 43.7 14.8 46.9Ash % 3.3 11.9 2.2 7.0C/N Ratio - 44.5 44.5 65.4 65.4Moisture % 72.7 0.0 68.5 0.0MetalsArsenic (mg/kg)Cadmium (mg/kg)Chromium (mg/kg)Copper (mg/kg)Lead (mg/kg)Mercury (mg/kg)Molybdenum (mg/kg)Nickel (mg/kg)Selenium (mg/kg)Zinc (mg/kg)
Total Solids %Fecal Coliform MPN/g dry weight
31.58
14376
27.32
4<15237
<1
5190
3112<11
3<17
1001.211
100100
1001002.514
100100
100
_____________________________________________________________________53
Table 18: Period 2 Week 14 Product Quality Results
Analysis Units PAW TW
Germination & GrowthEmergence Cucumber % Red Clover (direct planting) % Red Clover (1:4 w/ potting mix) %Relative Seeding Vigor Cucumber % Red Clover (direct planting) % Red Clover (1:4 w/ potting mix) %Respiration Rate (mg CO2-C/g OM/day)BAC
Nutrients Wet Dry Wet DryTotal Nitrogen % 0.50 0.98 0.40 0.70Ammonia (NH4-N) mg/kg 79 154 130 228Nitrate (NO3-N) mg/kg 4.6 9.0 14 24Organic Nitrogen (Org.N) % 0.49 0.96 0.38 0.67Phosphorus (as P205) % 0.15 0.29 0.20 0.35Phosphorus (P) mg/kg 649 1269 884 1552Potassium (as K20) % 0.28 0.54 0.35 0.61Potassium (K) mg/kg 2287 4474 2902 5093Calcium (Ca) % 0.34 0.67 0.43 0.76Magnesium (Mg) % 0.088 0.17 0.13 0.23Sulfate (SO4) mg/kg 93 182 139 244Copper (Cu) mg/kg 15 29 19 33Zinc (Zn) mg/kg 30 59 38 67Iron (Fe) mg/kg 2842 5559 4943 8675Manganese (Mn) mg/kg 89 174 112 197Boron (B) mg/kg 10 20 12 21SaltsSodium (Na) % 0.045 0.088 0.050 0.089Chloride (Cl) % 0.020 0.039 0.047 0.083GeneralpH - 6.07 NA 6.41 NAElectrical Conductivity mmhos/c 0.56 1.10 0.79 1.38Bulk Density lb/cu ft 23 12 22 13Carbonates lb/ton 0 0 0 0Organic Matter % 41.6 81.5 47.4 83.3Organic Carbon % 19.5 38.1 16.3 28.6Ash % 9.5 18.5 9.5 16.7C/N Ratio - 39.0 39.0 41.1 41.1Moisture % 48.88 0.0 43.02 0.0MetalsArsenic (mg/kg)Cadmium (mg/kg)Chromium (mg/kg)Copper (mg/kg)Lead (mg/kg)Mercury (mg/kg)Molybdenum (mg/kg)Nickel (mg/kg)Selenium (mg/kg)Zinc (mg/kg)
Total Solids %Fecal Coliform MPN/g dry weight
100100100
1001001002.06 2
1.5100100100
100100100
3<16296
<1<15159
51.1>1600 >1600
57
6716
<1<16338
<13

_____________________________________________________________________54
SECTION 5 COMPOSTING PERFORMANCE ANALYSIS The performance of the two composting methods being demonstrated is the basis for determining the suitability of these methods as approved processes for composting non-green feedstocks in Oregon. The intent of this analysis was to provide an initial assessment of the technologies. Although both processes produced successful results , additional demonstration of the processes’ performance is necessary over a wider range of operating conditions than could be accomplished in this limited project. The success of the processes depended upon the following factors: weather conditions, initial mix, moisture content, time and temperature. Success was measured by the following: pathogen reduction, leachate quality, stabilization and product quality. 5.1 Weather Conditions The weather during Period 1 was very wet at the time of and for two days following initial pile formation. Rainfall was less than normal through the balance of Periods 1 and 2. February (Period 2) was a particularly dry month with only 38% of normal rainfall. The rainfall over the entire test period was about 77% of normal rainfall. There was significant rainfall over the three days prior to the end of test Period 1 and the day of collection of product samples, March 7th. Ambient temperatures during Period 1 were approximately 2oF greater than average. Refer to Table 6 in Section 4.1 for Period 1 and 2 weather data. The wet period at the beginning of Period 1may have had an impact on the initial mix water content and the inability of the LTW pile to heat during the initial days of composting. The drier than normal weather would be expected to assist the composting processes during the wettest part of the year in western Oregon. This data indicates that Periods 1 and 2 did not represent a worst-case condition for rainfall. At the beginning of Period 2, significant rainfall occurred over the week prior to and on the day of feedstock mixing and pile formation. However, the entire period was drier than average with about 66% of normal rainfall. Ambient temperatures during Period 2 were within 2oF of the normal average. 5.2 Initial Mix The initial mix in both cases was wetter than optimum(55 to 60%). During full-scale operations it may be feasible to store drier screen overs for incorporation into the mix for moisture adjustment and porosity control. Both composting processes provided acceptable performance for the weather conditions experienced during testing,. While not a worst-case situation, the conditions during testing show that these processes can perform in non-optimum conditions. 5.3 Moisture Content The moisture content information presented on Figure 1 (refer to section 4.3.1) provides some additional insight into the performance of the two composting processes during the two seasonal periods. According to Figure 1, the moisture content of both the LTW and PAW processes during Periods 1 and 2 were essentially the same throughout the composting process, meaning that both processes gained or lost moisture at the same rate. Also, despite higher temperatures recorded in the PAW piles, additional moisture does not seem to have been removed. Refer to section 4.3.2 for temperature details. The similar moisture content between the two processes would seem to indicate that the feedstock and seasonal influences were significantly more important than the process differences.
_____________________________________________________________________55
The information on Figure 1 also shows that the two periods had dramatically different results. The Period 1 piles experienced an initial 5% loss of moisture content (4% increase in total solids content), then the moisture content increase by 3% (3% decrease in total solids content) from week 4 to week 14. Period 2 piles saw a relatively constant 25% decrease in moisture content (25% increase of total solids content). One possible explanation is that significantly more rain fell on the piles during Period 1 (20.6 inches) than Period 2 (5.6 inches). A calculation of the quantity of water that would need to be removed to arrive at the observed moisture contents indicates that water removal was similar for all four piles (both periods and both processes). The energy required to evaporate this amount of water would also be similar. Therefore, the Period 1 and 2 feedstocks provided about the same energy during composting. The conclusion from this information is that rainfall was likely the primary factor that caused the difference in pile moisture content between Periods 1 and 2. The ambient temperature difference between the two periods would have a very minor impact on moisture removal. The increasing moisture content during Period 1 indicates a need for caution when rainfall exceeds normal or when feedstocks do not include a significant fraction of high-energy materials. Additional rainfall could overwhelm the ability of the PAW and LTW processes to achieve and maintain temperatures. Building deeper piles would reduce the impact of rainfall but may reduce porosity and air movement. In addition, the reduction in moisture content experienced during Period 2 indicates a need for caution during summer conditions and when a lot of high-energy materials are included in the mix. It may be desirable to add water during the composting process to avoid over drying which can impede the composting process and increase the potential for dust and fire. During Period 1, both of the LTW and PAW process piles maintained a high moisture content and continued to produce leachate throughout the composting process. During Period 2, both process piles decreased consistently decreased in moisture content throughout the process resulting in no leachate produced after week 6. At optimum moisture content conditions (55 to 60%) leachate production should be very little. 5.4 Time and Temperature The temperatures experienced in a compost pile are the result of a complex of interrelated biological and physical / chemical reactions. In summary, as the microorganisms begin degrading the food source, energy is released and the pile heats. The rate of degradation and heat release depends on the type of food that is available. Fats have considerably more energy per pound than protein and carbohydrates. Sugars degrade more rapidly than more complex carbohydrates (such as cellulose) and proteins. As the pile heats, the number and variety of microorganisms will change with change in pile temperatures. Thermophilic organisms tend to release more heat and produce less biomass per unit weight of food degraded such that the rate of food consumption and the heat release increase dramatically as the pile warms. As the pile temperature becomes increasingly warmer than the outside air, heat radiates away from the pile and convective air movement at the pile exterior will remove heat. This temperature differential also causes air to be drawn into the bottom of the pile and discharged at the top due to convective air movement caused by the differential densities of the hot and cool air. As the cool air is drawn into the pile and warms it will evaporate water from the composting material. The evaporative cooling that results is the normal primary mechanism for controlling temperatures within a compost pile. If insufficient air movement is present to cool the pile, the temperatures will increase until it moves out of the optimum range for many of the microorganisms. The decomposers become overheated and less active, thereby reducing the heat released and limiting the pile temperature. A balance is generally reached between the pile cooling rate and biological activity. Obviously this condition will limit the degradation rate and increase the time required to obtain a stable product.
_____________________________________________________________________56
Pile turning, mechanical aeration and passive aeration are methods of increasing the movement of air through the material with a resulting cooling effect. Mechanical aeration and to some degree turning also provide a mechanism for maintaining desired temperatures. The passive aeration method does not control temperature but is intended to increase the air movement and pile cooling so that degradation can proceed at a rapid rate. The pile temperature data for the LTW and PAW processes during Periods 1 and 2 indicates that both experienced a heating and cooling balance that resulted in temperatures in the range of 70 to 75oC through the majority of each pile . Figure 9 shows the daily temperature (averaged from the 4 routine monitoring points) for each of the four test piles. A comparison of average temperatures for the LTW piles indicates a rise over 21 days to 65oC with a continual increase to almost 70oC through day 45. The PAW piles heated to 65oC in 10 days and 70oC in 14 days then ranged between 70 and 75oC through most of the composting process. Figures 10 and 11 provide similar plots for maximum and minimum temperatures. The maximum temperature plots indicate that the Period 2 piles generally had hotter zones than the Period 1 piles. The PAW Period 2 pile in particular consistently had zones where the temperatures ranged between 75 and 80oC. The minimum temperature plots show more rapid early heating at all points in the PAW piles and maintenance of warmer minimum pile temperatures throughout the composting period until day 42. The intensive temperature monitoring data indicates that the pile surface was generally cooler than the mass of material and was not as consistently above 55oC. Refer to the intensive temperature data located in Appendix C. This is not critical in the LTW process since regular turning mixes the outside of the pile into the interior but should be addressed through monitoring requirements for any PAW composting facility. A thicker layer of cover material or a cover consisting of finer material may provide better pile insulation.

_____________________________________________________________________57
Figure 9: Average Daily Temperature Comparison
20
25
30
35
40
45
50
55
60
65
70
75
80
85
1 3 5 7 9 11 13 15 17 19 21 23 25 27 29 31 33 35 37 39 41 43 45 47 49 51 53 55 57 85
Process Day
Tem
pera
ture
(C)
P1 LTWP1 PAWP2 LTWP2 PAW
PFRP
VAR

_____________________________________________________________________58
Figure 10: Maximum Daily Temperature Comparison
20
25
30
35
40
45
50
55
60
65
70
75
80
85
90
95
1 3 5 7 9 11 13 15 17 19 21 23 25 27 29 31 33 35 37 39 41 43 45 47 49 51 53 55 57 85
Process Day
Tem
pera
ture
(C)
P1 TWP1 PAWP2 TWP2 PAW
PFRP
VAR

_____________________________________________________________________59
Figure11: Minimum Daily Temperature Comparison
15
20
25
30
35
40
45
50
55
60
65
70
75
801 3 5 7 9 11 13 15 17 19 21 23 25 27 29 31 33 35 37 39 41 43 45 47 49 51 53 55 57 85
Process Day
Tem
pera
ture
(C)
P1 LTWP1 PAWP2 LTWP2 PAW
PFRP
VAR

_____________________________________________________________________60
5.5 Pathogen reduction The pathogen indicator data shows that all four piles had fecal coliform reductions to below the 1000MPN/gram dry solids within the first 5 weeks of composting. During Period 2 Salmonella were below the limit of 3MPN/ 4 grams dry solids within the first 4 weeks of composting; however; during Period 1, Salmonella was not below the limit until the 7th week of composting. Refer to Tables 13, 14, and Appendix G for more information. In all four test piles, either the Salmonella or fecal coliform results increased later in the composting process after dropping below the 40 CFR 503 limits. The data shows evidence of re-growth or contamination with fecal coliform in both process piles during Period 1. The data shows evidence of re-growth or contamination with Salmonella in both process piles during Period 2. The other performance data points offer no valid rationale for the increase in fecal coliform and Salmonella. The intensive temperature data for both piles during Period 1 and 2 indicates some areas were cooler than others but all met both the pathogen reduction and vector attraction reduction temperatures for much longer than required by 40 CFR 503 (refer to Appendix C). In addition, the temperature and stability data indicates that the last phase of active degradation is occurring when the Salmonella values increased to above the limit. These all indicate that there should be significant competition from other organisms during this period. Based on available research information, Salmonella should not re-grow when temperatures are high and there is active competition for the remaining food. The 40 CFR 503 regulations provides that either fecal coliform OR Salmonella standards be achieved in the finished product; therefore, pathogen reduction compliance was achieved by all 4 test piles. However, there exists a concern that these populations increased while operating temperatures remained high. There may have been undetected cooler zones in the pile. Since re-growth should not occur at the documented temperatures, contamination during material movement or during sampling could have resulted in re-growth or recontamination. A reasonable regulatory approach to this problem would be to allow re-analysis of the material after a result that exceeds the limits. This however, would require that the compost not be sold until after the microbiological results are available. 5.6 Leachate Quality The 40 CFR 503 regulations provide no standards for human pathogen reduction in leachate. leachate quality data shows the Salmonella levels throughout the composting process for both processes during Periods 1 and 2 to be less than 0.3 MPN/100 ml. Period 1 fecal coliform levels for the LTW process vary from 24 MPN/100ml to undetectable and for the PAW process vary from 1100 MPN/100ml. The Period 2 fecal coliform levels vary from 50,000 MPN/100 ml to 300 MPN/100ml for the LTW process and vary from 90 MPN/100ml to undetectable for the PAW process. Refer to Table 13 and 14 for Period 1 and 2 leachate quality data, respectively. The Willamette River Basin Water Quality Standards (ORS 340-041-0445) for bacteria state that freshwaters and estuarine waters shall not exceed: (i) A 30-day log mean of 126 E. coli organisms per 100 ml, based on a minimum of five (5) samples; (ii) No single sample shall exceed 406 E. coli organisms per 100 ml. For Period 1, six leachate samples were collected and analyzed and the means for both the LTW and PAW leachate were less than the Water Quality Standards equal to 126 MPN/100ml; however one sample did exceed the 406 MPN/100ml. For Period 2, only three leachate samples were collected and analyzed and the mean for the LTW leachate exceeded 126 MPN/100ml and two of the three samples exceeded the
_____________________________________________________________________61
406 MPN/100ml. For Period 2, the PAW leachate did not exceed 126 MPN/100ml and all three samples were less than 406 MPN/100ml. It is important to note that these standards are for E. coli and not fecal coliform and these standards apply to receiving waters not leachate. These standards would only be applicable if the leachate were to be discharged directly into freshwater/estuarine water and the freshwater/estuarine water samples resulted in E.coli levels exceeding the above criteria. 5.7 Stabilization Both the LTW and PAW processes met the 40 CFR 503 VAR requirements during Periods 1 and 2 within the first 17 to 25 process days. The 40 CFR 503 regulations do not require further stabilization after VAR requirements are met; however, material meeting VAR requirements is generally not defined as stable according to the US Compost Council TMECC 05.08-B standards. Additional composting and curing further ensures pathogen reduction and is required to produce a USCC defined stable and mature compost product. Research has shown that effective pathogen destruction occurs during curing. Stability requirements recommended in Section 6.3.4 would provide an additional level of protection from pathogen re-growth. The average stability results for the OSU alternative Alkaline trap 24 and 48-hr test procedures indicate that both processes during Periods 1 and 2 produced a very stable product according to the USCC TMECC 05.08-B standards of less than 2 mg CO2-C per gram compost organic matter per day (approximately 4 mg CO2-C per gram compost organic carbon per day) after 10 weeks of composting. The TMECC 05.08-B LTW and PAW results from weeks 14 during Periods 1 and 2 also indicate a very stable product. This level of stability means there is a low level of microbial activity and that readily degradable compounds have been decomposed; therefore, the food supply for the pathogens has been greatly reduced at this point in the process. The PAW process consistently exhibits higher CO2 evolution rates indicating less stability at all stages of the composting process during both periods.. This may be the result of continuously high temperatures that limit the active population of microbes. It could also be a result of different feedstock characteristics. Biological Available Carbon (BAC) test is a measurement of the CO2 evolution rate when the sample porosity, nutrients, pH and microbes are adjusted to optimum conditions. During Period 1, the Biological Available Carbon (carbon limiting) results are higher than the CO2 evolution rate for as received sample conditions for both processes indicating that 1) the material is not at optimum conditions and 2) the stability is limited by one or more of the conditions adjusted in the BAC test. According to TMECC 05.08-B test method standards, a Solvita maturity index ranging from 7 to 8 should compare to a CO2 evolution rate less than 2 mg CO2-C per gram compost organic matter per day (approximately 4 mg CO2-C per gram compost organic carbon per day). Solvita test results for the LTW and PAW processes during Period 1 and 2 ranged from 3.75 to 7.75 during process week 14. The TMECC 05.08-B test method CO2 respiration results for the LTW and PAW processes during Period 1 and 2 ranged from 1.2 to 2.5 mg CO2-C per gram compost organic matter per day for process week 14. The Solvita test results do not compare to the results from the TMECC 05.08-B test methods and it is therefore not recommended that the Solvita test be included in the stability compliance regulation.

_____________________________________________________________________62
5.8 Product Quality Review of the Soil Control Lab product quality reports indicates that both the LTW and PAW processes during Periods 1 and 2 produced a high quality product. The only parameters of concern are the low Period 2 moisture content and the high C:N ratio of each of the products. Refer to Tables 15, 16 and 17 in Section 4.5 and Appendix H for product quality reports. The moisture content of the material in both the LTW and PAW processes was greater in Period 1 than Period 2. Material in both processes dried significantly during Period 2. The LTW moisture content decreased from 68 percent in the initial mix to 44 percent at week 14. The PAW moisture content decreased from 68 percent in the initial mix to 48 percent at week 14. The product stability was greater during Period 1 for both processes, which indicates that moisture may have influenced the stability of the products. The addition of moisture during the composting process may be needed to assure the over drying does not prevent the achievement of a stable product.

_____________________________________________________________________63
SECTION 6 REGULATORY ASSESSMENT 6.1 Alternative Approaches All of the alternatives regulatory approaches being considered are based on provisions of the federal regulations for sewage sludge (biosolids) management (40 CFR 503). The development of these regulations included extensive involvement of the scientific community and is based on long term experience with the beneficial use of biosolids and biosolids based compost. This extensive regulatory development process together with the long successful use of biosolids indicate that this regulation provides a sound basis for pathogen control for mixed food waste composting. Four alternative regulatory approaches are considered in this analysis for mixed food waste composting: 1. Allow only composting procedures as defined in 40 CFR 503 and supporting documents. This would
be the most conservative regulatory approach since the procedures have been effectively used for biosolids, which is another pathogen containing material. The 503 pathogen regulations use an effective combination of 1) proven processes, 2) time and temperature requirements, 3) stabilization requirements (Vector Attraction Reduction requirements in 40 CFR 503 are designed to provide a level of stability needed to prevent pathogen re-growth and 4) testing of the final product indicator organisms as the regulatory structure. All of the options being considered will be based on maintaining the last three of the above listed criteria used in 40 CFR 503.
2. Provide provisional approval of the low technology methods of composting as tested in this
evaluation. Provisional approval would be granted for a three-year period during which a specified operating protocol is used and a provisional operation-monitoring program is maintained.
3. Provide provisional approval of any compost process that complies with a comprehensive set of
performance and product quality characteristics. This approach allows the use of any composting process that meets a set of performance criteria. Safeguards would be included to prevent the distribution of inadequately processed material to the public.
4. Provide full approval of low technology composting methods with comprehensive compost product
quality requirements. This approach would allow the use of the two tested composting methods without a provisional demonstration period. Use of this option would require a conclusion that the test results were sufficient without additional performance data. Performance and product quality provisions would be included as with the other options.
For alternatives 3 and 4 it may be desirable to establish a committee similar to the EPA Pathogen Equivalency Committee to review technical information and determine the appropriate status of mixed food waste composting technologies. In all cases it is assumed that the mixed food waste composting requirements will be included in fully promulgated State of Oregon regulations. 6.2 Pathogen Control Strategy A pathogen control strategy for mixed food waste composting needs to be implemented during all stages of composting, including feedstock preparation, active composting, curing and storage. Pathogen concentrations are highest during feedstock preparation and as the composting process progresses, the

_____________________________________________________________________64
level of pathogens decreases. The critical activities associated with pathogen reduction at each stage of composting are: • Incoming feedstock and feedstock preparation: Handle the feedstocks in a manner that provides
appropriate control of runoff or leachate. Mix feedstocks such that the mixture provides the desired balance of degradable material, moisture and porosity.
• Composting, curing and storage: Follow procedures to assure that pathogens are killed by time and temperature and that the curing piles are managed to prevent re-growth or contamination.
The basic requirements of a pathogen control strategy would include consideration of a mechanism for killing pathogenic organisms, procedures for preventing pathogen re-growth, procedures for preventing pathogen recontamination, a sequence of actions needed for regulatory compliance, use of appropriate composting process operating criteria, a performance monitoring program and a management plan for any mixed food waste compost that does not comply with the established regulatory requirements for mixed food waste composting. The specifics of the control strategy are provided in the following discussion. 6.2.1 Pathogen Reduction Exposing a material to a temperature above the normal microorganism growth range for a sufficient time is a proven method of sterilization, pasteurization and pathogen reduction. The USEPA 40 CFR 503 regulations clearly define the time and temperature relationship for controlling pathogens in organic waste materials. The relationship is shown on Figure 12. Based on this relationship, time and temperature requirements were developed to significantly reduce pathogen levels in biosolids. The Class A time and temperature requirement using either the within-vessel composting method or the static aerated composting method is 55oC (131oF) or higher for 3 consecutive days. Using the windrow composting method, the Class A time and temperature requirement is 55oC (131oF) or higher for 15 consecutive days or longer with a minimum five turnings. Time and temperature is not a reliable pathogen reduction method unless all portions of the composting mass are exposed to these conditions. Assured exposure is therefore another key principle for pathogen control regulation. Any regulation must include provisions to assure that all material is exposed. The windrow criterion of 5 turns in 15 days is an example of a procedure designed to provide assured exposure. By turning 5 times and maintaining temperature for 3 days after each turn provides assurance that every particle will be exposed to 55oC for 3 days even though the outer portions of the pile will not always be at these temperatures due to surface effects.

_____________________________________________________________________65
Figure 12: 40 CFR 503 Class A Time and Temperature Requirements for Solids Greater Than 7%
80.6
78.4
75.0
73.4
72.071.3
70.068.7
67.9
65.7
63.662.3
61.460.1
58.056.7
54.653.7
53.052.451.5
50.950.350.0
0.01
0.10
1.00
10.00
100.00
1,000.00
50 51 52 53 54 55 56 57 58 59 60 61 62 63 64 65 66 67 68 69 70 71 72 73 74 75 76 77 78 79 80 81
Required Temperature (oC)
Con
tact
Tim
e (h
ours
)
>7% TS

_____________________________________________________________________66
6.2.2 Re-growth Prevention Summary: Once the pathogen and vector attraction reduction requirements have been completed during the composting phase, the focus of pathogen control must change to prevention of re-growth or contamination during active composting, curing and storage. The primary mechanisms for prevention of re-growth include degradation of food on which the pathogen would grow and multiply and controlling the process to encourage the growth of non-pathogenic microorganisms that will compete with the pathogenic organisms for food and nutrients. The 40 CFR 503 Vector Attraction Reduction (VAR) requirements were developed to prevent the re-growth of pathogens following pathogen reduction requirements. VAR requirements for composting are fourteen consecutive days over 40oC (104oF) with an average temperature over 45oC (113oC). PFRP and VAR requirements can be met concurrently. Rapid Degradation: Composting with adequate moisture and nutrients and with a temperature range of 50 to 65oC provides rapid degradation of the food source available to pathogens. The food source for co-composting of mixed food waste, dairy manure solids and yard debris is from all feedstocks. The mixed food waste and fresh dairy manure solids will generally degrade rapidly in the first 2 to 3 weeks of composting. The yard debris contains materials that degrade more slowly, such that the yard debris degradation generally controls the duration of the composting process rather than the mixed food waste. Pathogen food source degradation occurs most rapidly during active composting, but continues as the composting process progresses. Mixing: With some feedstocks, occasional mixing may also be desirable to improve the physical access of the organisms to the substrate. Pathogenic organisms do not function or compete effectively with indigenous microorganisms for food at thermophilic or mesophilic temperatures with a resulting dramatic decrease in population. As the food supply diminishes the potential for pathogen re-growth is minimized. Curing: Once the highly active period of degradation is complete, the composting process will move into the curing phase in which the more difficult to degrade food sources are consumed by the microorganisms. Maintaining a gradual drop in temperature through the curing process provides for activity by a large population of organisms that will compete with pathogens for the available food source and minimize the potential for pathogen re-growth. Stability: The 40 CFR 503 VAR requirements are designed to provide sufficient degradation and stability in the composting material so that re-growth is unlikely. The 40 CFR 503 regulations do not require further stabilization after VAR requirements are met; however, material meeting VAR requirements is generally not stable according to the USCC TMECC 05.08 standards. . Additional composting and curing further ensures pathogen reduction and is required to produce a USCC defined stable and mature compost product. Research has shown that effective pathogen destruction occurs during curing. For purposes of this discussion, the following definitions apply: • Stability is the measure of microbial activity in a composting material typically as measured by
oxygen uptake or CO2 evolution rate. A stable compost has a relatively low microbial activity. • Maturity is a measure of the degradation progression and conversion process of composting to the
point that plants will germinate and grow with minimal reduction compared to a control. The process of maturing includes the conversion of ammonia to nitrate and residual organics to humic acids.
• Finished product is a commercial term that indicates that a compost processor has an established market that will purchase the product at a sufficient price.

_____________________________________________________________________67
6.2.3 Contamination Prevention The primary mechanisms for contamination of composted material after the pathogen reduction step (PFRP) are 1) the use of contaminated equipment, 2) the deposit of pathogens by birds and animals, 3) contact with contaminated leachate and 4) re-incorporation of inadequately composted material from a portion of the pile that did not reach desired temperatures. 6.2.3.1 Equipment Contamination Preventing contamination with equipment is a significant challenge at many composting facilities. It is common to use front-end loaders for moving materials at all stages of the composting process. Only at very large facilities might it be possible to dedicate specific machines to only post pathogen reduction duty. At most facilities a disinfection operation is required any time a machine moves from operations involving pre-pathogen reduction activities to post-pathogen reduction activities. This is a time consuming activity that is contrary to the normal responsibilities of a front-end loader operator. Equipment cleaning procedures must be incorporated into standard operating practice in order to assure that contamination does not occur through this route. Refer to Section IVB2 for details. 6.2.3.2 Exterior Sources Birds and animals may deposit small quantities of pathogens on the exterior of a composting pile. If these are turned into the pile and conditions are prime for pathogen growth, then significant growth can occur. The protection from this form of contamination is to use the re-growth prevention steps outlined in Section IIB. 6.2.3.3 Re-Incorporation Assuring that all portions of the pile reach pathogen reduction temperatures through mixing of the pile is the best method of preventing contamination. 6.2.3.4 Leachate Contamination Addition of or contact with leachate can lead to material contamination. Leachate should be diverted away from composting material and should only be applied to composting material prior to meeting the pathogen reduction requirements. Some facilities limit leachate contamination potential by applying lime to freestanding leachate, which raises the pH and destroys pathogens. 6.2.4 Compliance Sequence The 40 CFR 503 regulations require a specific sequence for compliance with pathogen reduction and vector attraction reduction / stabilization. Specifically, pathogen kill must take place before or at the same time as the VAR / stabilization step. This sequence assures that non-pathogenic organisms will be competing for food with a pathogen population that has been decimated by the high temperatures in the pathogen reduction step. This sequence must be maintained in any regulation for composing of mixed food waste. Compliance sequence is also important if multiple sites are to be used for complying with mixed food waste composting regulations. Movement of material from site to site should not be a problem provided that additional safeguards are used to assure that conditions that would encourage pathogen re-growth or contamination would not occur. The composting procedures to be used would be the same at multiple sites as at one.
_____________________________________________________________________68
If material that has met pathogen reduction requirements is moved to another site and introduced to material that has also met pathogen reduction requirements, then pathogen reduction requirements would not be required for the resulting mix and the composting process would continue with VAR/stabilization requirements. However, if during material movement from site to site, material that has already met pathogen reduction requirements are introduced to materials that have NOT met pathogen reduction requirements, all resulting mixed material would then be required to meet pathogen reduction requirements again at the second site before continuing with VAR/stabilization requirements. The same would apply to materials introduced to contaminated equipment during material movement. 6.2.5 Composting Process Limitations Since degradation / stabilization is an essential part of the pathogen control strategy, specifying conditions in the composting process that will encourage efficient stabilization may be of benefit from a regulatory perspective. On the other hand, this approach may be viewed as over-regulation and limiting the options available to compost facility operators. For discussion purposes, some of the composting process parameters that may be considered as part of the pathogen control strategy include feedstock characteristics, minimum pile size, minimum detention time, and maintenance of aerobic conditions. 6.2.5.1 Feedstocks The moisture content of the initial mix and the mixture throughout the composting process can impede the degradation process if excessively wet or dry. Porosity / particle size gradation are also determined primarily by the feedstock mix. Lack of porosity limits the movement of air through the pile, which can also slow the rate of degradation. The selection of feedstocks should provide an initial mix moisture content near 60 percent (solids content near 40 percent) and sufficient coarse material to provide a porous matrix. 6.2.5.2 Pile Size The size of a pile can also influence the maintenance of conditions that result in efficient degradation. Overly large piles may not allow desired penetration of air throughout the pile. Small piles may not create enough heat of degradation to compensate for surface heat losses and the piles will not be able to maintain desired pathogen reduction temperatures. Since we only have experience with one pile size for the LTW and PAW processes, this must serve as the acceptable pile size to assure that desired temperatures could be achieved during winter conditions. The pile height and width used in the demonstration must serve as the maximum dimension to assure that the piles do not get hotter and more anaerobic than the test conditions. The length of the pile in both cases is not limited by process conditions. The use of other pile sizes should be allowed based on demonstration that they provide the desired results. See Section 6.4.1.6 for recommended pile sizing. 6.2.5.3 Minimum Detention Time Degradation during composting proceeds at a rate dependant on many of the factors already discussed. For each situation there is a time period required to achieve the level of stability that will provide protection from pathogen re-growth. Selection of a minimum detention time for composting varies with the feedstocks used. For co-composting of mixed food waste and yard debris a minimum recommended composting period is 50 days provided that pathogen reduction and stability requirements have been met. Shorter composting periods should be considered if the processor could demonstrate that compost is stable in less than 50 days. This minimum composting period should be secondary to the stability requirement.
_____________________________________________________________________69
6.2.5.4 Aerobic Conditions Maintaining aerobic conditions in the composting pile speeds the degradation process and provides a higher heat release rate. Aerobic conditions in a composting pile generally means that the air in the pore spaces has an oxygen content greater than 15 percent. This will provide oxygen to the surface layer of the solid particles that make up the composting mass. Anaerobic conditions are still present within the solids, especially during the rapid degradation phase. It would be very difficult and not cost effective to maintain aerobic conditions in the interior of the solids. Maintaining aerobic conditions at this level for more than short periods of time requires forced mechanical aeration. 6.2.6 Indicator Monitoring Monitoring for indicator organisms (fecal coliform and Salmonella) in the compost product is another critical keystone of the 40 CFR 503 regulatory approach. A similar approach should be used as a part of any regulatory strategy for mixed food waste composting. Indicator levels specified in 40 CFR 503 are the following:
a) Fecal coliform – less than or equal to 1000 MPN per gram dry weight OR b) Salmonella - less than or equal to 3 MPN per 4 grams dry weight.
6.2.7 Stability Monitoring Stability data was collected for both the LTW and PAW processes during Periods 1 and 2. Stability parameters monitored were carbon dioxide (CO2) evolution rate, Solvita maturity index, and Vector Attraction Reduction (VAR) time and temperature requirements. Oregon State University (OSU) used variations of the US Composting Council (USCC) standard test method TMECC 05.08-B to measure the Carbon Dioxide (CO2) evolution rate. OSU further compared alternative test procedures of both the Draeger tube and Alkaline trap test methods. The objective was to evaluate the effectiveness of these less costly and field based alternative test procedures to provide results comparable to existing Draeger tube and Alkaline trap test procedures. OSU additionally used the USCC TMECC 05.08-E standard test method (Solvita test) for stability analysis and test comparison. Stability results and test procedures are located in section 4.3.4 and Appendix F. Refer to Section 6.3.4 for interpretation of stability results. The LTW and PAW processes during Periods 1 and 2 were monitored daily for temperature to verify that both Pathogen reduction and VAR time and temperature requirements were met. Refer to Figures 2, 3, 4 and 5 for the daily temperature profiles for the Period 1 LTW and PAW processes and Period 2 LTW and PAW processes, respectively. 6.2.8 Performance Failure Plan Since an objective of the anticipated regulation is to at least provisionally approve composting methods other than those proven processes named in 40 CFR 503, it would be prudent to plan for situations where the compost product does not comply with the indicator monitoring limits. Each facility should have a plan for managing any product that did not comply with the regulation. If material does not meet Class A 40 CFR 503 requirements, one option would be to restrict the use of material, similar to those stated in the Class B 40 CFR 503 requirements. Another option for material not complying with Class A regulations would be to re-process the material to meet pathogen reduction and vector attraction reduction/stabilization requirements a second time followed by additional sampling.

_____________________________________________________________________70
6.3 Impact of Test Results on Regulatory Approach 6.3.1 Feedstock Characteristics In both tests the feedstocks were wetter than desired. The yard debris was 70 percent moisture for the first test period and 68 percent moisture in the second test period. With bulking materials this wet it is virtually impossible to obtain an initial mix moisture content near 60 percent (40 percent total solids) as stated in Section IIE1. Drier bulking materials such as ground pallets, kiln dried wood waste and paper may be added, but might have a negative effect on the economics of composting. Feedstocks other than mixed food waste and yard debris were not included because it would not be representative of the feedstocks typically available to the target composting facilities. 6.3.2 Initial Mix Characteristics The initial mixes for the Period 1 and 2 had moisture contents equal to 71 percent (29 percent solids) and 68 percent (32 percent solids), respectively. These mixes are wetter than ideal (60 percent moisture) and may have resulted in less than optimum performance. Period 1 moisture content actually increased during the composting process, likely due to rainfall and lack of evaporative moisture loss with these low aeration rate systems. Moisture may have also been a factor in the difficulty with initially achieving desired temperatures in the Period 1 LTW pile. The regulatory implication of this situation is that the tests do represent a near worst-case situation for winter and spring operating conditions. 6.3.3 Time and Temperature Compliance All four test piles complied with the 40 CFR 503 Class A time and temperature requirements stated in Section IIA. Excess moisture may have delayed compliance in the Period 1 LTW pile. However, both processes did successfully complete this aspect of pathogen reduction. The PAW process was superior at rapidly achieving and maintaining pathogen reduction temperatures in both winter and spring conditions. 6.3.4 Degradation / Stability All stability tests (except for the Solvita test) indicate that both processes during Periods 1 and 2 produced a very stable product according to the USCC TMECC 05.08-B standards of less than 2 mg CO2-C per gram compost organic matter per day (approximately 4 mg CO2-C per gram compost organic carbon per day) after 10 weeks of composting. This level of stability indicates a low level of microbial activity and that readily degradable compounds have been decomposed. This means that the food supply for the pathogens has been greatly reduced at this point in the process. It is recommended that the USCC TMECC 05.08-B carbon dioxide evolution rate standard test method be used as the baseline test for additional stability requirements. To demonstrate compost product stability, it is recommended that the material meet a CO2 evolution rate less than 4 mg CO22-C per gram of organic matter per day (approximately 8 mg CO22-C per gram of organic carbon per day) using the TMECC 05.08-B standard test method. This standard is on the lower end of the USCC TMECC 05.08-B defined range equal to 2 to 8 mg CO2-C per gram compost organic matter per day (approximately 4 to 16 mg CO2-C per gram compost organic carbon per day) for a stable compost product. The Solvita test results do not compare to the results from the TMECC 05.08-B test methods and it is therefore not recommended that the Solvita test be included in the stability compliance regulation.

_____________________________________________________________________71
6.3.5 Microbial Populations In all four test piles, either the Salmonella or fecal coliform results increased later in the composting process after quickly dropping below the 40 CFR 503 limits. The other performance data points offer no valid rationale for this result. In all cases the either / or option provided by the 40 CFR 503 regulation indicates that compliance was achieved. However, there exists a concern that these populations increased while operating temperatures remained high. There may have been undetected cooler zones in the pile. Since re-growth should not occur at the documented temperatures, contamination during material movement or during sampling could have resulted in re-growth or recontamination. A reasonable regulatory approach to this problem would be to allow re-analysis of the material after a result that exceeds the limits. This however, would require that the compost not be sold until after the microbiological results are available. 6.3.6 Product Quality Both the Limited Turn Windrow (LTW) and Passive Aerated Windrow (PAW) processes dried significantly during Period 2. The LTW moisture content decreased from 68 percent in the initial mix to 44 percent at week 14. The PAW moisture content decreased from 68 percent in the initial mix to 48 percent at week 14. The stability data indicates that excessive dryness may have been a factor towards the end of the composting period. The addition of moisture during the composting process may be needed to assure the over drying does not prevent the achievement of a stable product. 6.4 Preferred Regulatory Approaches Using results from this pilot project and other resources, alternative methods for regulating composting of mixed food waste have been evaluated. The recommended approach for regulation to limit human pathogen transmission and pathogen re-growth during feedstock preparation, active composting, curing and compost storage is presented below. All methods considered rely on EPA’s 40 CFR 503 for the basic regulatory framework. 6.4.1 Recommended Mixed Food Waste Composting Protocol 6.4.1.1 Pathogen Reduction Plan Every facility providing mixed food waste composting will develop a Pathogen Reduction Plan that specifies the composting process to be used, how it satisfies the pathogen reduction requirements and provides a detailed monitoring protocol. 6.4.1.2 Pathogen Reduction
a) Time and Temperature – For both the PAW and LTW processes every particle of material being composted will be exposed to a temperature greater than 55oC for a minimum of 3 days (72 hours). For the LTW process, the composting pile shall be turned a minimum of 5 times with at least 3 consecutive days between each turn in which the core 80 percent of the pile volume is maintained at temperatures of 55oC or greater.
b) Assured Exposure – For the PAW process, a minimum 12-inch thick insulation layer of sawdust,
post pathogen reduction compost, finished product or other acceptable material will be used to assure that temperatures at the pile surface comply with the temperature requirement. Periodic measurement of temperature at the surface of the composting mass will be required. Once time and temperature requirements are met, the PAW process can be converted to the LTW for the

_____________________________________________________________________72
balance of the composting period. For other processes an alternate procedure that provides assured exposure may be approved by DEQ.
6.4.1.3 Re-growth Prevention In a USEPA publication called Control of Pathogens and Vector Attraction in Sewage Sludge, the USEPA states the following in regards to the pathogen re-growth. “Contamination of biosolids with a bacterial pathogen after one of the Class A pathogen reduction alternatives has been conducted may allow extensive bacterial growth unless a) an inhibitory chemical is present, b) the material is too dry to allow bacterial growth, c) little food remains for the microorganisms to consume, or d) an abundant population of non-pathogenic bacteria is present” (Control of Pathogens and Vector Attraction in Sewage Sludge, USEPA, EPA/625/R-92/013, October 1999). The 40 CFR 503 Vector Attraction Reduction (VAR) requirements are designed to provide sufficient pathogen food source degradation and stability in the composting material so that pathogen re-growth is unlikely. The 40 CFR 503 regulations do not require further stabilization after VAR requirements are met; however, material meeting VAR requirements is not normally defined as stable according to the US Compost Council TMECC 05.08 standards. Additional composting and curing further ensures pathogen reduction and is required to produce a USCC defined stable and mature compost product. Research has shown that effective pathogen destruction occurs during curing. Stability requirements suggested below would provide an additional level of protection from pathogen re-growth. It is recommended that the USCC TMECC 05.08-B carbon dioxide evolution rate standard test method be used as the baseline test for additional stability requirements. This is currently being performed by commercial labs and is in common use by many composting facilities. To demonstrate compost product stability, it is recommended that the material meet a CO2 evolution rate less than 4 mg CO22-C per gram of organic matter per day (approximately 8 mg CO22-C per gram of organic carbon per day) using the TMECC 05.08-B standard test method. If the initial test fails to meet this criteria, then the average of 3 or greater additional tests must meet the criteria with a maximum permissible value for any single sample of 8. To assure that reliable results are obtained, it is recommended that more than one sample be submitted for analysis. We further recommend that provision be allowed for alternative test procedures to be approved by DEQ based on further development of one or more of the alternative test procedures evaluated by OSU. During both Period 1 and 2, the Solvita test results were not comparable to the results from the Draeger tube, Alkaline trap and TMECC 05.08-B test methods and it is therefore not recommended that the Solvita test be included in the stability compliance regulation. This test could however be approved on a facility-by-facility basis if a correlation between the test results can be documented. 6.4.1.4 Contamination Prevention
a) Equipment contamination – During and following the pathogen reduction phase of mixed food waste composting, all equipment that comes in contact with the composting material must either be dedicated for that service or disinfected using a DEQ approved procedure following use for any pre-pathogen reduction composting activities. Refer to Section IVB2 for recommended sanitation procedures.
b) Exterior sources – No additional action is required for this source. Preventative steps may be
required if chronic failure to comply with product indicator monitoring standards indicates that this source may need to be controlled.

_____________________________________________________________________73
6.4.1.5 Compliance Sequence
a) Pathogen kill – Pathogen kill must be completed before or at the same time as the requirement for maintaining a competitive population.
b) Site transfer – Transfer of material from one site to another is acceptable provided that 1) all
other requirements are met and 2) transfer equipment is disinfected using procedures outlined in Section IVB2 or as approved by DEQ.
c) Remixing – Composting mixed food waste may be mixed with other materials for composting
provided that one of the following conditions is met.
i) Both the compost derived from mixed food waste and additional mix material have complied with the PFRP time and temperature procedures OR
ii) The new mixture of mixed food waste compost and other organic material acceptable to DEQ must comply with mixed food waste composting pathogen reduction and vector attraction reduction/stability procedures. Refer to Section 6.2.4 for more information.
6.4.1.6 Composting Process Limitations
a) Feedstocks i) Moisture content – The moisture content of the initial mix should be as close to 60% as
possible with available food waste and yard debris feedstocks. The demonstration indicates that moisture contents as high as 71% will still compost and provide pathogen reduction conditions.
ii) Porosity / particle size gradation –The yard debris should be ground to provide porosity.
b) Pile size – To assure sufficient volume for temperature compliance the piles should be a height of about 10 feet and a maximum base width of 20 feet
c) Minimum detention time – To assure adequate degradation all mixed food waste materials should
be composted and cured for a minimum of 50 days provided that pathogen reduction and stability requirements are met. This is a typical detention time for aerated static pile composting of biosolids and therefore a minimum for yard debris, the controlling feedstock. This minimum is a secondary requirement to the production of a stable product.
d) Aerobic conditions – No requirement needed.
6.4.1.7 Indicator Monitoring All mixed food waste compost must achieve the indicator levels at the time of sale as specified in 40 CFR 503:
e) Fecal coliform – less than or equal to 1000 MPN per gram dry weight OR f) Salmonella - less than or equal to 3 MPN per 4 grams dry weight.

_____________________________________________________________________74
6.4.1.8 Provisional Composting Process Monitoring and Data Submittal The mixed food waste composting facility Operations Plan will include a monitoring plan for demonstrating compliance with all criteria. Performance monitoring data will be submitted to DEQ on a quarterly basis. Any batch failure to comply will be reported immediately to DEQ together with a statement of the proposed method of managing the failed material. This provisional monitoring and reporting shall continue for at least two years. The monitoring and / or reporting effort may be reduced by DEQ at that time based on demonstrated consistent performance. Monitoring will occur at the following frequency:
a) Temperature – Daily in each pile through the pathogen reduction phase and weekly thereafter b) Initial pile moisture content – Each pile on day of pile construction c) Initial Pile dimensions and volume – Each pile. d) Product stability and fecal coliform or Salmonella – Test monthly for either fecal coliform or
Salmonella. Note that from the failure to comply standpoint, more frequent monitoring would limit the quantity of material not meeting final product requirements.
e) Moisture content adjustment – To assure that degradation continues through the curing process it may be desirable to maintain moisture contents of 45 to 55 percent.
6.4.1.9 Performance failure plan Any mixed food waste composting process other than those defined in 40 CFR 503 must provide a plan that details how any product that does not comply with performance standards will be reprocessed or used in an alternative manner. Material that requires reprocessing will need to be handled in the same manner as any other fresh feedstock. 6.4.1.10Runoff/Leachate Management Plan Any mixed food waste composting facility must provide a plan for managing runoff and leachate to assure that runoff containing pathogens is not discharged to surface waters or contaminates other materials that may be contacted by the public. Leachate and runoff may only be applied to the composting material prior to meeting the pathogen reduction requirements. 6.4.2 Recommended Approved Processes for Mixed Food Waste Composting 40 CFR 503 Processes All of the PFRP composting processes identified in USEPA 40 CFR 503 Appendix B (In vessel, Aerated Static Pile and Windrow) are recommended to be approved for mixed food waste composting. Tested Low Technology Processes Feedstock preparation should involve grinding or mechanical mixing to provide a more homogeneous mix and increase the surface area for faster decomposition. This step also involves incorporation of amendments to adjust moisture and porosity. Based on the results of the testing program, it is concluded that both the Passive Aerated Windrow and Limited Turned Windrow processes are recommended for use on a provisional basis.

_____________________________________________________________________75
6.4.2.1 Initial Mix & Pile Construction An initial mix of feedstock should be prepared to provide a moisture content near 60 percent (total solids content near 40 percent) if possible but should not be higher than 71% moisture. Following feedstock mixing, it is recommended that the piles be constructed in a windrow formation approximately 20 feet wide and 10 feet high. A one-foot insulative cover comprised of sawdust or other similar fine textured wood debris is required to reduce nuisance pest access and to hold in heat and odors generated. A synthetic cover may be acceptable provided that it can document pile temperature maintenance. It is recommended that the insulative cover be incorporated into the Limited Turn Windrow after the second week of composting and into the Passive Aeration Windrow after the fourth week of composting. 6.4.2.2 Pile Turning Pile turning entails breaking down the pile, re-mixing materials and rebuilding the pile to the same dimensions as outlined for initial pile construction. The limited turn windrow pile should be turned weekly (commencing after two weeks of composting) and the passive aerated windrow pile will be turned once (after four weeks of composting) with a front-end loader. Equipment sanitation procedures will be required prior to and following each turning event. The primary purpose of the sanitation procedures is to limit any cross contamination of fecal coliform and Salmonella bacteria between the piles. Sanitization procedures for equipment consist of the following steps: # Remove material from the equipment using cold water and a shovel, broom or other hand tool; # Make up approximately 10-gallons of a 10 percent household bleach solution; # Apply the solution to the equipment using a manual spraying device similar to that used for the
application of fertilizer and pesticides; and # Rinse the equipment with potable water. The loader sanitation process should be done in such a manner to control the resulting runoff. Alternative sanitation procedures including using a high-pressure steam unit if available, use equipment dedicated to specific activities or using quick-disconnect loader buckets so buckets can be dedicated to specific activities may be approved by DEQ. Any leachate or runoff that contacts the mixed food waste compost must be captured and managed to prevent groundwater and surface water degradation. 6.4.2.3 Combined PAW and LTW Process Performance of the PAW and LTW processes during the testing program suggests a combination of the two as a potentially more effective mixed food waste composting process. The PAW process was superior for achieving and maintaining pathogen reduction temperatures but seemed to operate at excessive temperatures that slowed the degradation process. The LTW process to the contrary had some difficulty in cool wet weather attaining pathogen reduction temperatures but was more effective at providing a stabilized product. By combining these processes, starting with PAW through the temperature maintenance phase (about 16 days) and then converting to the LTW process (at least 26 more days with weekly turning) for the balance of composting superior pathogen control may be provided.
_____________________________________________________________________76
6.4.3 Recommended Procedure for Alternative Process Consideration An Application for Approval must be submitted to DEQ for consideration of any alternative method of composting mixed food waste. The application must include a detailed description of the process and how it complies with each of the specific requirements outlined in Sections6.4.1 and 6.4.2. The Operations Plan must also include a performance failure plan and a six-month duration Initial Performance Testing Plan. The Testing Plan would provide performance data to demonstrate the suitability of the process for provisional process approval by DEQ. To accomplish this goal, the monitoring, sampling and testing should be similar in scope to the monitoring, sampling and testing included in the Commercial Food Waste Composting Study Operations Plan, except for the stability testing. The stability testing required in the Testing Plan should use the TMECC 05.08-B standard test method developed by the USCC. 6.4.4 Recommended Regulatory Re-Evaluation Procedure After three years of operation with the provisional mixed food waste composting regulations, the program should be reviewed to determine any needed changes. The review should include all monitoring results, Inspection Program results and a review of the pathogen reduction protocol. The review should also include a review of performance by provisionally approved composting processes to determine whether removal from provisional status is appropriate based on consistent compliance. Curing at controlled temperatures may provide excellent pathogen control. If demonstrated by monitoring data, this option could be offered as an option for pathogen reduction and allow reduced monitoring requirements.
_____________________________________________________________________77
SECTION 7 CONCLUSIONS AND RECOMMENDATIONS Based on the results of the field demonstration, the following conclusions and recommendations are provided: 1. Both of the low technology composting methods that were field-tested (LTW and PAW)
demonstrated the ability to effectively reduce pathogens related risk to acceptable levels during the wet weather conditions experienced in western Oregon. The test periods had lower than normal rainfall, so continued demonstration of the technology during wetter than normal conditions is advised. This can be done as a part of provisional longer-term demonstration of the processes at composting facilities.
2. Proceed with development of regulations that allow and encourage the composting of non-green
classified food waste using the PFRP composting processes identified in 40 CFR 503 or the two processes (LTW and PAW) that were demonstrated as part of study.
a) The PFRP processes are suitable for outright approval based on history and experience. b) The LTW and PAW processes should be approved on a provisional basis with additional
monitoring required at each facility to provide sufficient operating experience to justify full approval.
3. Base non-green feedstock composting regulations on the regulatory concepts and procedures used in
the federal sewage sludge regulations (USEPA 40 CFR 503).
c) Expose all material to 55oC for a minimum of 3 consecutive days to provide pathogen reduction, for a turned windrow process this requires 5 turns after each of which the 3 day criteria must be met to assure that all material is exposed to those conditions;
a) b) Expose all material to an average of 45oC with a minimum of 40oC for a minimum of fourteen
consecutive days to provide Vector Attraction Reduction; and c) Test the product for indicator organisms, fecal coliform <1000 MPN per gram of total solids (dry
weight basis) OR Salmonella <3 MPN per 4 grams of total solids (dry weight basis).
4. Require that the product be stable to the standard set by the US Compost Council Test Methods for the Examination of Composting and Compost (TMECC) 05.08-B Carbon Dioxide Evolution Rate (4 mg CO2-C per gram compost organic matter per day).
5. Require that each non-green feedstock composting facility develop plans for implementing the
regulation with particular focus on achieving pathogen reduction and a stable product, runoff management and management of materials that fail to comply with pathogen reduction requirements.
6. Provide a procedure for demonstrating new low technology composting options and criteria for
approving those that perform as required.

_____________________________________________________________________78
PAGE INTENTIONALLY LEFT BLANK
_____________________________________________________________________79
Glossary Aerobic Composting – Composting with air or oxygen. Aeration can be provided through convective aeration or with blowers and pipes. Bioaerosol – Compost bioaerosols are organisms or biological agents that can be dispersed through the air and affect human health Composting – The biological decomposition of organic matter under controlled, aerobic conditions. Enteric – pertaining to the intestinal tract. Fecal coliform – enteric organisms that serve as an indicator of possible presence of pathogens. Green Wastes – This term is used primarily for lawn clippings, garden material and tree trimmings. This term is also referred to as yard waste or yard material. The term yard material is often preferred so as to indicate that this material is not a waste but a resource. Green Feedstocks – This term is from Oregon Administrative Rules, Chapter 340, Division 93, Section 0030. Green feedstocks are materials used to produce compost. Green feedstocks are low in 1) substances that pose a present or future hazard to human health or the environment and b) low in and unlikely to support human pathogens. Green feedstocks include but are not limited to: yard debris, animal manure, wood waste (as defined in OAR 340-093-0030 (94)), vegetative food waste, produce waste, vegetative restaurant waste, vegetative food processor by-products and crop residue. Green feedstocks may also include other materials that can be shown to DEQ by the composter to be low in substances that pose a present or future hazard to human health or the environment and low in and unlikely to support human pathogens. The term is not intended to include materials fed to animals and not used for composting. Finished Compost – Compost that has undergone active composting and curing. It is a stable, hygienic product of the composting process. Leachate – Water that moves through a material or media. Leachate is produced when excessive water moves through a compost pile and resurfaces on the site. Maturity – A chemical condition of the compost. An immature compost will contain toxic chemical compounds that could affect plant growth. Mesophilic Temperatures – Temperatures from ambient to 45oC (113oF). MPN – This is an abbreviation for Most Probable Number. A method of enumerating microorganisms. Municipal Solid Waste (MSW) – This is the modern term for garbage and usually refers to residential waste containing paper, food waste, plastic, cans, and other materials discarded by residents. Non-green Feedstock – This term is from Oregon Administrative Rules, Chapter 340, Division 93, Section 0030. Non-green feedstocks are materials used to produce compost. Non-green feedstocks are high in a) substances that pose a present or future hazard to human health or the environment and b) high in and likely to support human pathogens. Non-green feedstocks include but are not limited to: animal parts and by-products, mixed materials containing animal parts and by-products, dead animals and municipal solid waste. This term is not intended to include materials fed to animals and not used for composting.

_____________________________________________________________________80
Pathogen – Human pathogen as any virus, microorganism, or substance capable of causing disease. Process to Further Reduce Pathogens (PFRP) – The United States Environmental Protection Agency issued a Rule (40CFR503) for the control of pathogens and vectors when treating sewage sludge (biosolids). The processes referred to in the Rule are designed to eliminate human pathogens in compost. pH – A measure of how acid or alkaline a material or liquid is. A pH of 7.0 is considered neutral. Below pH 7.0, the media is acid; above pH 7.0, the media is alkaline. Runoff – Water that is generated on the site and runs off the site into ponds, swales, ditches, streams, and other water bodies. Salmonella(sp) – human pathogen that causes gastro-intestinal problems. Stabilization – A stage in the composting process when the amount of available carbon that serves as a food source for microorganisms is very low. As a result, microbial activity is low and oxygen consumption by the microorganisms is low. Stable compost is a material that does not change rapidly, does not reheat, and has a very low respiration rate. Unstable compost will have great microbial activity because of carbon available as food for the microbes. Pathogenic microorganisms may regrow in unstable compost. As a result, the microbes will utilize soil nitrogen, and plants would not have enough nitrogen for their growth. TMECC – Test Methods for the Examination of Composting and Compost developed by the United States Compost Council (USCC). Thermophilic Temperatures – Temperatures from 45oC to 70oC (113oF to 158oF).Windrow Composting – This method involves placing the feedstock in long piles. Aeration is achieved by convective airflow as well as turning. The windrow piles act like a chimney; the center gets hot, and air is drawn through the sides.
APPENDIX A
Period 1 Field Monitoring Forms

PAGE INTENTIONALLY LEFT BLANK

Period 1 - Field Monitoring Form - OR DEQ Food Waste Composting Study Pile ID: LTW Point A: Five feet from south end of pile Point C: Five feet from north end of pilePhase: Composting & Curing Point B: Middle of pile side Point D: Middle of north end of pile
Date Time ID Process Ambient Pile Temperatures (F) Pile Oxygen Levels (%) Notes(initials) Day Temp A B C D A B C D (odor, weather, pests & access, visible steam/food waste)
11/29/2001 12:45 SAS 1 52.8 80.4 68.0 75 75 13 10 9 11
Cool, not raining, intermittant sun; leachate collection bucket full - emptied and unhooked *Temperatures measured using Fluke meter
11/30/2001 10:53 BF 2 49.0 98.0 71.8 82.2 76.4 2 3 2 3
D temp probe not inserted very deep into pile; no leachate bucket; steady trickel out of leachate pipe; not raining *Temperatures measured using Fluke meter
12/1/2001 8:41 RAR 3 48.9 119 82.4 92.8 82 1 1 0 0
Windy; Steady rain; no odor *Temperatures measured using Fluke meter
12/2/2001 8:40 RAR 4 41.2 128.6 104.6 92.6 102.4 0 0 - -
Sprinkles; Oxygen reader plugged up & couldn't get cleared, hung it up to dry out *Temperatures measured using Fluke meter
12/3/2001 9:00 AD & RB 5 39.8 130.6 111 107.6 97.8 - - - -
Sunny & cool; no steam; no odor unless downwind of leachate at drip; O2 monitor plugged, called Jack & Stacey; small animal tracks - no digging *Temperatures measured using Fluke meter
12/4/2001 10:04 RAR 6 41.4 133.2 113.8 111.8 99.6 0 0 0 0
Cold; no rain; leachate full - dumped half *Temperatures measured using Fluke meter
12/5/2001 10:04 BF 7 50.4 136.0 116.8 115.2 103.4 1 0 2 3
Not raining; Cover integridy good; Small animal tracks - no digging; no odor; leachate bucket full and stinky - emptied 1/4 now 3/4 full *Temperatures measured using Fluke meter
Supplies running low? - Contact Stacey Servo - Tt at 206.728.9655 ext 124
Equipment not operating correctly? - Ask Jack Hoeck for assistance, if not available contact Stacey Servo
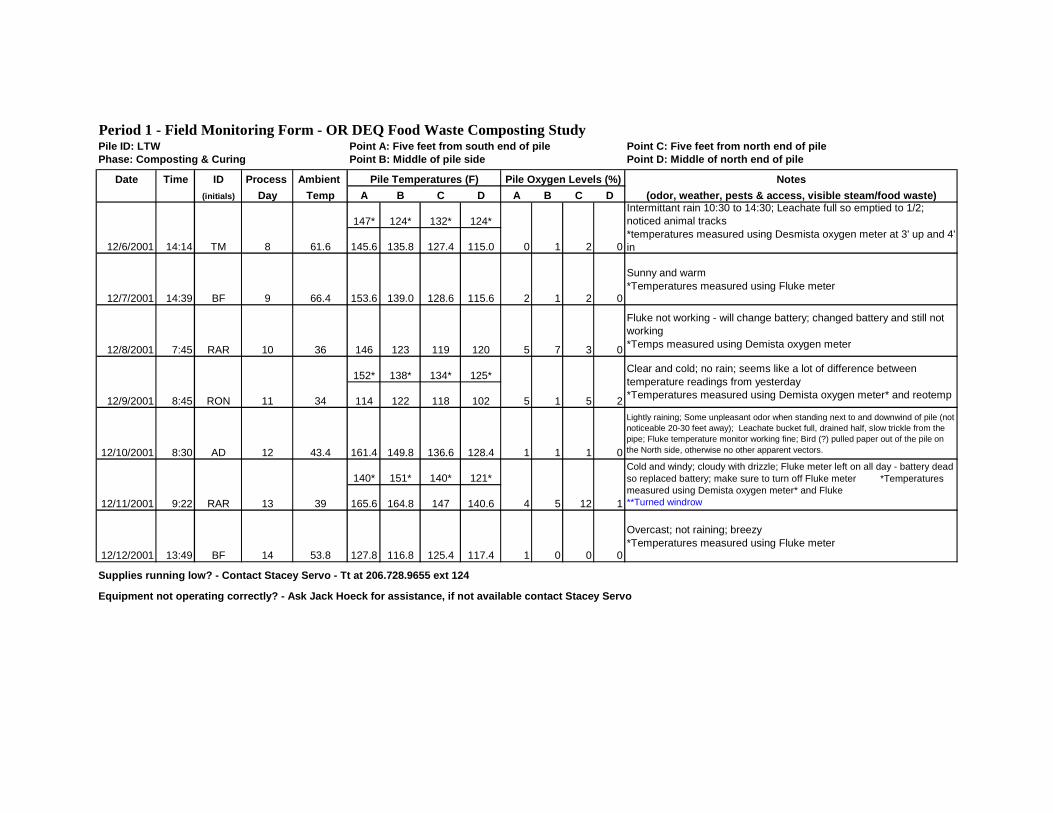
Period 1 - Field Monitoring Form - OR DEQ Food Waste Composting Study Pile ID: LTW Point A: Five feet from south end of pile Point C: Five feet from north end of pilePhase: Composting & Curing Point B: Middle of pile side Point D: Middle of north end of pile
Date Time ID Process Ambient Pile Temperatures (F) Pile Oxygen Levels (%) Notes(initials) Day Temp A B C D A B C D (odor, weather, pests & access, visible steam/food waste)
147* 124* 132* 124*
145.6 135.8 127.4 115.0 0 1 2 0
12/7/2001 14:39 BF 9 66.4 153.6 139.0 128.6 115.6 2 1 2 0
Sunny and warm *Temperatures measured using Fluke meter
12/8/2001 7:45 RAR 10 36 146 123 119 120 5 7 3 0
Fluke not working - will change battery; changed battery and still not working *Temps measured using Demista oxygen meter
152* 138* 134* 125*
114 122 118 102 5 1 5 2
12/10/2001 8:30 AD 12 43.4 161.4 149.8 136.6 128.4 1 1 1 0
Lightly raining; Some unpleasant odor when standing next to and downwind of pile (not noticeable 20-30 feet away); Leachate bucket full, drained half, slow trickle from the pipe; Fluke temperature monitor working fine; Bird (?) pulled paper out of the pile on the North side, otherwise no other apparent vectors.
140* 151* 140* 121*
165.6 164.8 147 140.6 4 5 12 1
12/12/2001 13:49 BF 14 53.8 127.8 116.8 125.4 117.4 1 0 0 0
Overcast; not raining; breezy *Temperatures measured using Fluke meter
Supplies running low? - Contact Stacey Servo - Tt at 206.728.9655 ext 124
Equipment not operating correctly? - Ask Jack Hoeck for assistance, if not available contact Stacey Servo
39
Cold and windy; cloudy with drizzle; Fluke meter left on all day - battery dead so replaced battery; make sure to turn off Fluke meter *Temperatures measured using Demista oxygen meter* and Fluke **Turned windrow12/11/2001 9:22 RAR 13
61.6
Intermittant rain 10:30 to 14:30; Leachate full so emptied to 1/2; noticed animal tracks *temperatures measured using Desmista oxygen meter at 3' up and 4' in
12/9/2001 8:45 RON 11 34
Clear and cold; no rain; seems like a lot of difference between temperature readings from yesterday *Temperatures measured using Demista oxygen meter* and reotemp
12/6/2001 14:14 TM 8

Period 1 - Field Monitoring Form - OR DEQ Food Waste Composting Study Pile ID: LTW Point A: Five feet from south end of pile Point C: Five feet from north end of pilePhase: Composting & Curing Point B: Middle of pile side Point D: Middle of north end of pile
Date Time ID Process Ambient Pile Temperatures (F) Pile Oxygen Levels (%) Notes(initials) Day Temp A B C D A B C D (odor, weather, pests & access, visible steam/food waste)
126* 120* 127* 126*
150.2 135.4 147.4 132.4 11 14 7 9
12/14/2001 16:30 AD 16 38.8 156 158.4 165 156 - - - -
Rain with hail, no other vectors, not enough daylight to take O2 measures; TW has worse odor than the PAW *Temperatures measured using Fluke meter
12/15/2001 JG 17 47.1 153 163 167 164 13 13 13 12
Cloudy, little odor on TW *Temperatures measured using Demista oxygen meter
12/16/2001 18 50 143 129 131 133 - - - -
Rain and windy; some odor; oxygen meter not working *Temperatures measured using Reo probe
153* 133* 113* 117*
144 144 154 142 9 1 1 1
110* 108* 116* 120*
146 156 141 134 4 11 5 4
136* 136* 126* 131*
123.8 138.4 141.4 136.8 1 1 1 2
Supplies running low? - Contact Stacey Servo - Tt at 206.728.9655 ext 124
Equipment not operating correctly? - Ask Jack Hoeck for assistance, if not available contact Stacey Servo
44
Raining; leachate smells really bad; fluke had ambient temp reading of 79 degrees *Temperatures measured using Reo temp* and Fluke meter12/19/2001 13:50 BF 21
44
Sunny & clear; no other vectors; no diggin, no birds; Fluke not working - took temps with O2 monitor* and Reo long probe; Ron cleared the O2 monitor that morning; O2 readings seem fine, but not sure I trust temperatures
12/18/2001 10:00 AC 20 38
Raining hard; turned pile; little odor *Temperatures measured using Oxygen meter* and Reo temp **Turned windrow
12/17/2001 15:30 AD 19
12/13/2001 14:30 TM 15 56.6
Hard rain and wind; collected pathogen compost and leachate samples *Temperatures measured using oxygen meter* and Fluke meter

Period 1 - Field Monitoring Form - OR DEQ Food Waste Composting Study Pile ID: LTW Point A: Five feet from south end of pile Point C: Five feet from north end of pilePhase: Composting & Curing Point B: Middle of pile side Point D: Middle of north end of pile
Date Time ID Process Ambient Pile Temperatures (F) Pile Oxygen Levels (%) Notes(initials) Day Temp A B C D A B C D (odor, weather, pests & access, visible steam/food waste)
122* 132* 133* 123*
128.8 138.6 139.0 130.9 1 2 4 9
12/21/2001 10:10 BF 23 46.6 139.4 149.9 148.1 147.8 13 18 19 2
Not Raining, Breezy, partly cloudy; no odor; no flies *Temperatures measured using new Fluke meter
12/22/2001 9:52 RAR 24 40 141.2 150.2 149.3 148.5 10 1 1 1
no odor *Temperatures measured using new Fluke meter
12/23/2001 8:30 RCN 25 31 150.4 159.0 160.1 159.5 9 1 1 0
Foggy and cold but no rain *Temperatures measured using new Fluke meter
12/24/2001 8:32 Ron 26 34.5 151.2 160.5 161.7 161.5 2 2 - -
Foggy, no odor; oxygen probe not working, took to office to try out *Temperatures measured using new Fluke meter **Turned windrow
12/25/2001 27 - - - - - - - -
*no temp or O2 readings taken
12/26/2001 14:15 AC 28 38 155.1 150.2 138.6 125.8 3 1 1 1
Sunny, no wind; no flies; some odor close up *Temperatures measured using new Fluke meter
Supplies running low? - Contact Stacey Servo - Tt at 206.728.9655 ext 124
Equipment not operating correctly? - Ask Jack Hoeck for assistance, if not available contact Stacey Servo
12/20/2001 13:19 TM 22 50.1
No precipitation, no wind, clouds and blue sky; Plastic and cardboard visible; few flies; pile steaming; foul smell; emptied leachate bucket, sanitized and placed in shed *Temperatures measured using Demista oxygen probe* and new Fluke meter
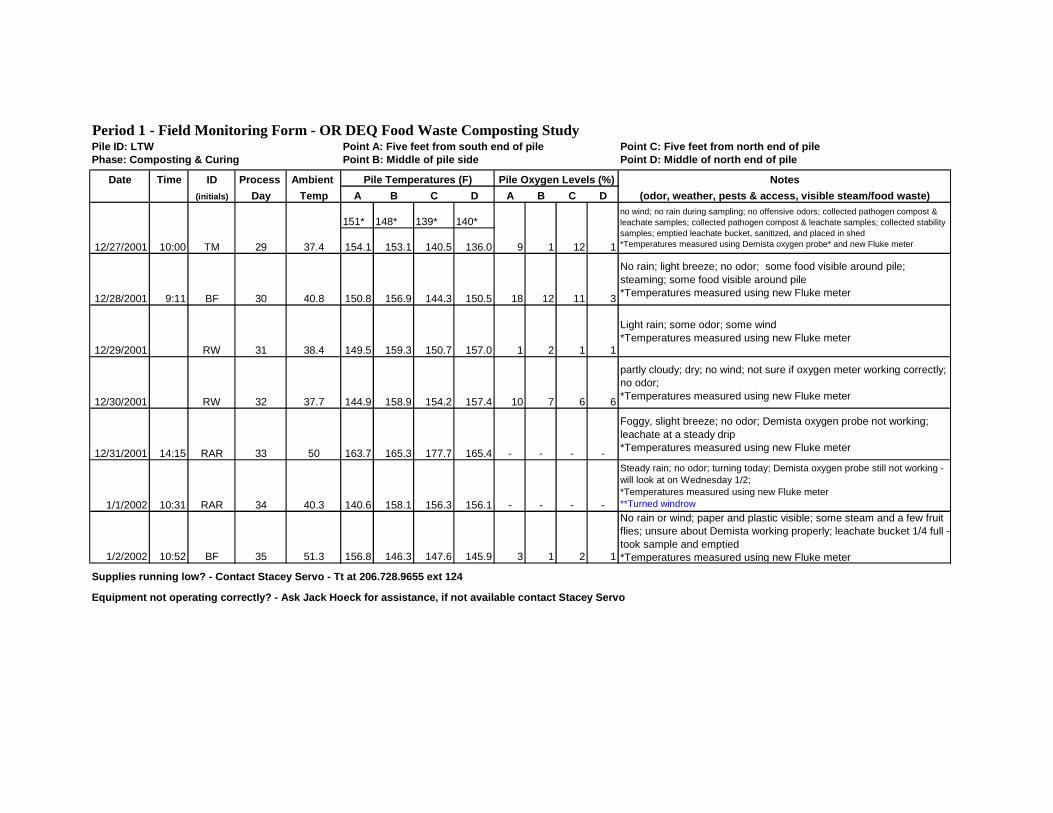
Period 1 - Field Monitoring Form - OR DEQ Food Waste Composting Study Pile ID: LTW Point A: Five feet from south end of pile Point C: Five feet from north end of pilePhase: Composting & Curing Point B: Middle of pile side Point D: Middle of north end of pile
Date Time ID Process Ambient Pile Temperatures (F) Pile Oxygen Levels (%) Notes(initials) Day Temp A B C D A B C D (odor, weather, pests & access, visible steam/food waste)
151* 148* 139* 140*
154.1 153.1 140.5 136.0 9 1 12 1
12/28/2001 9:11 BF 30 40.8 150.8 156.9 144.3 150.5 18 12 11 3
No rain; light breeze; no odor; some food visible around pile; steaming; some food visible around pile *Temperatures measured using new Fluke meter
12/29/2001 RW 31 38.4 149.5 159.3 150.7 157.0 1 2 1 1
Light rain; some odor; some wind *Temperatures measured using new Fluke meter
12/30/2001 RW 32 37.7 144.9 158.9 154.2 157.4 10 7 6 6
partly cloudy; dry; no wind; not sure if oxygen meter working correctly; no odor; *Temperatures measured using new Fluke meter
12/31/2001 14:15 RAR 33 50 163.7 165.3 177.7 165.4 - - - -
Foggy, slight breeze; no odor; Demista oxygen probe not working; leachate at a steady drip *Temperatures measured using new Fluke meter
1/1/2002 10:31 RAR 34 40.3 140.6 158.1 156.3 156.1 - - - -
Steady rain; no odor; turning today; Demista oxygen probe still not working - will look at on Wednesday 1/2; *Temperatures measured using new Fluke meter **Turned windrow
1/2/2002 10:52 BF 35 51.3 156.8 146.3 147.6 145.9 3 1 2 1
No rain or wind; paper and plastic visible; some steam and a few fruit flies; unsure about Demista working properly; leachate bucket 1/4 full -took sample and emptied *Temperatures measured using new Fluke meter
Supplies running low? - Contact Stacey Servo - Tt at 206.728.9655 ext 124
Equipment not operating correctly? - Ask Jack Hoeck for assistance, if not available contact Stacey Servo
37.4
no wind; no rain during sampling; no offensive odors; collected pathogen compost & leachate samples; collected pathogen compost & leachate samples; collected stability samples; emptied leachate bucket, sanitized, and placed in shed *Temperatures measured using Demista oxygen probe* and new Fluke meter12/27/2001 10:00 TM 29

Period 1 - Field Monitoring Form - OR DEQ Food Waste Composting Study Pile ID: LTW Point A: Five feet from south end of pile Point C: Five feet from north end of pilePhase: Composting & Curing Point B: Middle of pile side Point D: Middle of north end of pile
Date Time ID Process Ambient Pile Temperatures (F) Pile Oxygen Levels (%) Notes(initials) Day Temp A B C D A B C D (odor, weather, pests & access, visible steam/food waste)
1/3/2002 14:00 TM 3644.2
@ 9:20 161.2 152.5 149.8 143.5 8 7 3 13
Intermittent clouds/blue sky; many small flying insects at 13:00; no precipitation; sunny; Demista not working, cleaned tip & brush, changed battery; Ron Ray will work on tonight; emptied leachate bucket, sanitized and placed in shed; collected pathogen compost & leachate samples *Temps measured using new Fluke meter
1/4/2002 10:45 BF 37 45.1 157.1 160.9 150.9 147.1 - - - -
Partly cloudy; no wind or odor; Demista not here *Temps measured using new Fluke meter
1/5/2002 38 - - - - - - - -
*no temp or O2 readings taken
1/6/2002 8:15 RCN 39 approx. 50 156.3 162.8 156.5 150.1 - - - -
Rainy and warm *Temps measured using old temp gage because batteries dead on new one
1/7/2002 40 - - - - - - - -
*no temp or O2 readings taken
1/8/2002 8:35 RAR 41 52.6 146.0 163.0 155.5 151.4 9 3 2 3
Sunny; no wind; no odor; leachate at steady drip *Temps measured using new Fluke meter **Turned windrow
1/9/2002 14:00 BF &BB 42 52.3 132.4 135.5 145.3 139.5 1 1 0 0
Sunny; leachate bucket less than 1/4 full *Temps measured using new Fluke meter
Supplies running low? - Contact Stacey Servo - Tt at 206.728.9655 ext 124
Equipment not operating correctly? - Ask Jack Hoeck for assistance, if not available contact Stacey Servo

Period 1 - Field Monitoring Form - OR DEQ Food Waste Composting Study Pile ID: LTW Point A: Five feet from south end of pile Point C: Five feet from north end of pilePhase: Composting & Curing Point B: Middle of pile side Point D: Middle of north end of pile
Date Time ID Process Ambient Pile Temperatures (F) Pile Oxygen Levels (%) Notes(initials) Day Temp A B C D A B C D (odor, weather, pests & access, visible steam/food waste)
1/10/2002 12:30 TM/LJB 43 55.5 152.8 155.9 153.7 149.9 0 0 1 0
bad odor when we hit milk cartons; only 1/3 leachate bucket filled; identified what looked to be a chicken beak at point D; collected pathogen compost & leachate samples; collected stability samples *Temps measured using new Fluke meter
1/11/2002 9:15 BF 44 41.7 158.5 162.1 155.1 155.6 10 1 1 1
Foggy *Temps measured using new Fluke meter
1/12/2002 45 37.7 154.7 166.7 160.3 163.1 4 2 3 2
Foggy; slight breeze *Temps measured using new Fluke meter
1/13/2002 46 - - - - - - - -
*no temp or O2 readings taken
1/14/2002 16:00 AD 47 39.3 149.7 165.4 162 163.7 2 0 0 0
Cloudy with patches of blue sky; light wind; no odors or vectors; connected leachate bucket *Temps measured using new Fluke meter
1/15/2002 9:24 RAR 48 37.1 146.5 159.9 159.9 161.8 3 3 1 4
cold; no wind *Temps measured using new Fluke meter **Turned windrow
- - 132* 110*179** 179** 178** 161**134.2 150 143.5 126.3 1 0 0 0
Supplies running low? - Contact Stacey Servo - Tt at 206.728.9655 ext 124
Equipment not operating correctly? - Ask Jack Hoeck for assistance, if not available contact Stacey Servo
1/16/2002 16:00 AD 49 37.9
slight drizzle and cool; no odors or vectors; NO leachate in the bucket except for 1-2 ounces - took the 1-2 ounce sample and reattached bucket *Temps measured using Long Reo*, Demista** and new Fluke meter

Period 1 - Field Monitoring Form - OR DEQ Food Waste Composting Study Pile ID: LTW Point A: Five feet from south end of pile Point C: Five feet from north end of pilePhase: Composting & Curing Point B: Middle of pile side Point D: Middle of north end of pile
Date Time ID Process Ambient Pile Temperatures (F) Pile Oxygen Levels (%) Notes(initials) Day Temp A B C D A B C D (odor, weather, pests & access, visible steam/food waste)
1/17/2002 10:30 TM/LJB 50 40.0 137.0 160.3 153.1 143.0 - - - -
Weather cold and gray, no precip; no leachate in bucket; sanitized and placed bucket in shed; leachate sample was a composit from tues and Wed was sent to lab; collected pathogen compost & leachate samples; Demista oxygen probe not available *Temps measured using new Fluke meter
1/18/2002 15:02 BF 51 46.3 140.1 164.4 162.8 154.3 11 8 7 4
Demista temperature not working - pretty sure Demista oxygen working - Ron said it was fixed, appears to have worked *Temps measured using new Fluke meter
1/19/2002 52 - - - - - - - -
*no temp or O2 readings taken
1/20/2002 8:34 RAR 53 39.5 142.2 163.1 161.4 168.5 15 6 4 5
Raining hard and windy; no odor; leachate at a slight drip *Temps measured using new Fluke meter
1/21/2002 13:58 RAR 54 39.9 137.9 157.9 154.7 157.6 - - - -
Rain, snow, sunshine (you name it); didn't do O2 because of time restraints *Temps measured using new Fluke meter
1/22/2002 10:26 RAR 55 37.3 134.6 152.9 148.9 154.1 16 8 7 12
Raining *Temps measured using new Fluke meter **Turned windrow
1/23/2002 15:15 BF 56 43.2 104.1 142.7 136.9 130.1 14 2 0 1
cold; not raining; no odor *Temps measured using new Fluke meter
Supplies running low? - Contact Stacey Servo - Tt at 206.728.9655 ext 124
Equipment not operating correctly? - Ask Jack Hoeck for assistance, if not available contact Stacey Servo

Period 1 - Field Monitoring Form - OR DEQ Food Waste Composting Study Pile ID: LTW Point A: Five feet from south end of pile Point C: Five feet from north end of pilePhase: Composting & Curing Point B: Middle of pile side Point D: Middle of north end of pile
Date Time ID Process Ambient Pile Temperatures (F) Pile Oxygen Levels (%) Notes(initials) Day Temp A B C D A B C D (odor, weather, pests & access, visible steam/food waste)
1/24/2002 10:13 TM/LJB 57 46 115.3 142.4 143.8 136.2 8 5 0 3
Weather cold and gray, no precip; no leachate in bucket; no leachate sample collected for tues and wed; leachate sample was from thurs. only was sent to lab; sanitized and placed bucket in shed; collected pathogen compost & leachate samples; collected stability samples *Temps measured using new Fluke meter
2/7/2002 10:30 TM 70 45.9 124.8 126.6 138.8 143.3 18 18 16 6
Weather - rain progressively harder and wind; two worms found during sampling 3 foot height at point C; stability samples collected *Temps measured using new Fluke meter
2/21/2002 10:30 TM 84 64.7 120.9 124.7 128.7 131.7 11 14 14 13
Weather - no precipitation, warm; found liner 3 feet over and up from point B; collected stability samples *Temps measured using new Fluke meter
3/7/2002 11:00 TM 98 48.3 115.7 122.6 119.5 123.1 15 11 16 16
Weather - typical March - everything from snow, hail and sleet to warm sunshine; collected stability samples, microbial samples, and compost character samples *Temps measured using new Fluke meter
Supplies running low? - Contact Stacey Servo - Tt at 206.728.9655 ext 124
Equipment not operating correctly? - Ask Jack Hoeck for assistance, if not available contact Stacey Servo

Period 1 - Field Monitoring Form - OR DEQ Food Waste Composting Study Pile ID: PAW Point A: Five feet from west end of pile Point C: Five feet from east end of pilePhase: Composting & Curing Point B: Middle of pile side Point D: Middle of east end of pile
Date Time ID Process Ambient Pile Temperatures (F) Pile Oxygen Levels (%) Notes(initials) Day Temp A B C D A B C D (odor, weather, pests & access, visible steam/food waste)
11/29/2001 11:45 SAS 1 52.8 74.4 86.4 79.4 86.0 11 10 9 14
Cool, not raining, intermittant sun; maggots in pipes; leachate collection bucket full - emptied and unhooked *Temperatures measured using Fluke meter
11/30/2001 10:49 BRF 2 49.0 81.0 107.4 112.6 107.4 1 2 1 1
Cloudy, windy and cool; no leachate bucket; pipe dripping; not raining presently; mild odor different than biofilter odor - not bad and not sure from where *Temperatures measured using Fluke meter
12/1/2001 8:31 RAR 3 48.4 100.4 133 146 137.4 1 4 1 1
Windy and raining hard *Temperatures measured using Fluke meter
12/2/2001 8:30 RAR 4 41.2 119.6 148.8 153.4 151.4 1 3 5 0
Not raining, just sprinkles *Temperatures measured using Fluke meter
12/3/2001 9:00 AD& RB 5 39.8 128.4 151.8 156.6 158.6 - - - -
Sunny & cool; no steam; no odors; leachate at slow trickle; O2 monitor plugged - called Jack & Stacey *Temperatures measured using Fluke meter
12/4/2001 10:17 RAR 6 41.4 134.2 154.6 158.8 155 0 1 3 1
No rain, Leachate full, dumped half *Temperatures measured using Fluke meter
12/5/2001 10:08 BF 7 50.4 137.0 157.5 161.6 172.6 1 2 2 1
Cover good; Mild odor on north end - think it is from biofilter, have to get close to smell it; leachate full - dumped 1/3 of it *Temperatures measured using Fluke meter
Supplies running low? - Contact Stacey Servo - Tt at 206.728.9655 ext 124
Equipment not operating correctly? - Ask Jack Hoeck for assistance, if not available contact Stacey Servo

Period 1 - Field Monitoring Form - OR DEQ Food Waste Composting Study Pile ID: PAW Point A: Five feet from west end of pile Point C: Five feet from east end of pilePhase: Composting & Curing Point B: Middle of pile side Point D: Middle of east end of pile
Date Time ID Process Ambient Pile Temperatures (F) Pile Oxygen Levels (%) Notes(initials) Day Temp A B C D A B C D (odor, weather, pests & access, visible steam/food waste)
158* 155* 156* 139*
148.2 168.2 172.4 169.4 9 6 1 2
12/7/2001 14:34 BF 9 66.4 152.8 166.4 165.4 164.0 2 1 6 10
Sunny and warm; O2 numbers don't seem to jive with Thursday's #'s; double checked location ids and my numbers are correct *Temperatures measured using Fluke meter
12/8/2001 7:18 RAR 10 36 154 162 152 152 5 2 3 2
Fluke not working - will change battery; changed battery and still not working; temps were measured with oxygen probe
133* 138* 130* 136*
128 132 136 144 3 1 3 2
12/10/2001 8:30 AD 12 43.4 150.4 157.4 162.4 157.2 1 3 2 4
Lightly raining. Some unpleasant odor when standing next to and downwind of pile. Not noticeable 20-30 feet away. Fluke temp monitor working fine. Leachate bucket full, drained half, leachate at a slow trickle. Small sawdust deposit flowed from the pipe when I removed the bucket. Steady trickle followed. Some paper, and one chicken foot surfacing on the pile (not dug out, just finding it's way to the surface)
12/11/2001 9:35 RAR 13 39 157 167.6 169.2 163 0 7 8 10
Windy and cold; Fluke left on all day and isn't working; *temperatures measured using Fluke meter
12/12/2001 13:54 BF 14 53.8 155.8 162.6 165.6 156.2 0 2 10 4
Overcast; not raining; breezy *Temperatures measured using Fluke meter
Supplies running low? - Contact Stacey Servo - Tt at 206.728.9655 ext 124
Equipment not operating correctly? - Ask Jack Hoeck for assistance, if not available contact Stacey Servo
61.6
Leachate full - emptied to half; human tracks across NW end top; *Temperatures measured using oxygen meter* at 3' up and 4' in and Fluke meter
12/9/2001 8:15 RON 11 34
Clear and cold; no rain; seems like a lot of difference between temperature readings from yesterday *temperatures measured using oxygen meter* and reotemp
12/6/2001 14:14 TM 8
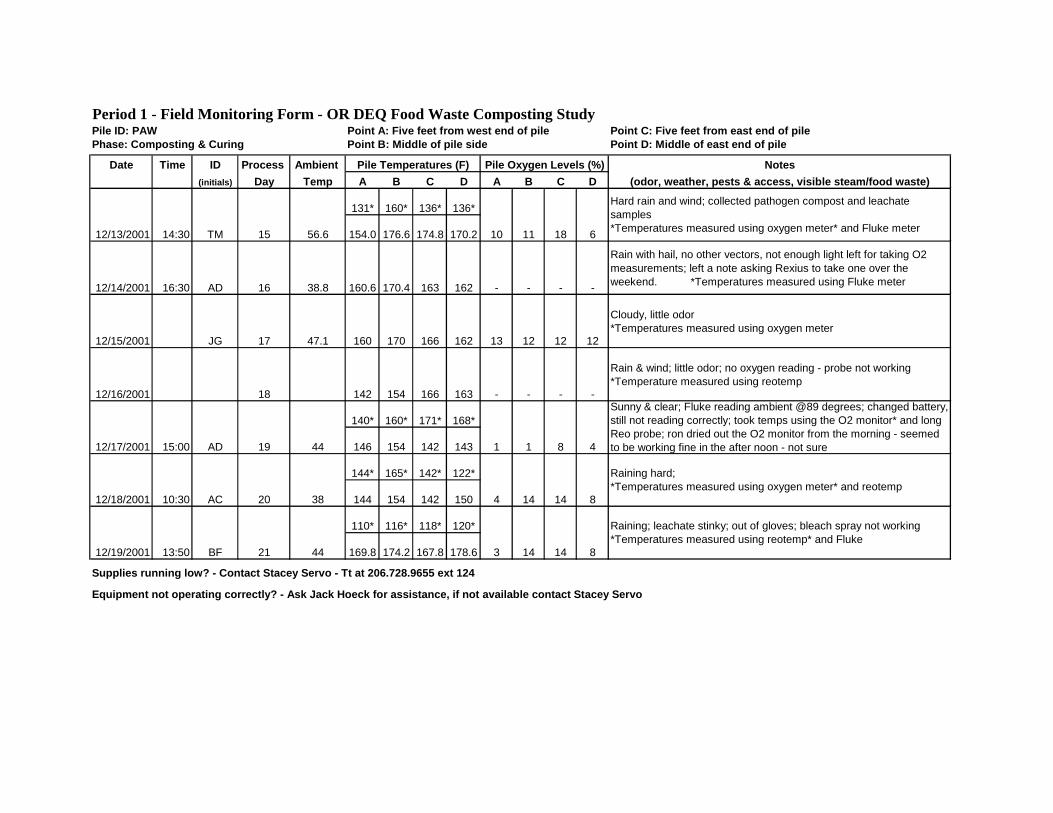
Period 1 - Field Monitoring Form - OR DEQ Food Waste Composting Study Pile ID: PAW Point A: Five feet from west end of pile Point C: Five feet from east end of pilePhase: Composting & Curing Point B: Middle of pile side Point D: Middle of east end of pile
Date Time ID Process Ambient Pile Temperatures (F) Pile Oxygen Levels (%) Notes(initials) Day Temp A B C D A B C D (odor, weather, pests & access, visible steam/food waste)
131* 160* 136* 136*
154.0 176.6 174.8 170.2 10 11 18 6
12/14/2001 16:30 AD 16 38.8 160.6 170.4 163 162 - - - -
Rain with hail, no other vectors, not enough light left for taking O2 measurements; left a note asking Rexius to take one over the weekend. *Temperatures measured using Fluke meter
12/15/2001 JG 17 47.1 160 170 166 162 13 12 12 12
Cloudy, little odor *Temperatures measured using oxygen meter
12/16/2001 18 142 154 166 163 - - - -
Rain & wind; little odor; no oxygen reading - probe not working *Temperature measured using reotemp
140* 160* 171* 168*
146 154 142 143 1 1 8 4
144* 165* 142* 122*
144 154 142 150 4 14 14 8
110* 116* 118* 120*
169.8 174.2 167.8 178.6 3 14 14 8
Supplies running low? - Contact Stacey Servo - Tt at 206.728.9655 ext 124
Equipment not operating correctly? - Ask Jack Hoeck for assistance, if not available contact Stacey Servo
44
Raining; leachate stinky; out of gloves; bleach spray not working *Temperatures measured using reotemp* and Fluke
44
Sunny & clear; Fluke reading ambient @89 degrees; changed battery, still not reading correctly; took temps using the O2 monitor* and long Reo probe; ron dried out the O2 monitor from the morning - seemed to be working fine in the after noon - not sure
12/18/2001 10:30 AC 20 38
Raining hard; *Temperatures measured using oxygen meter* and reotemp
TM 15 56.6
Hard rain and wind; collected pathogen compost and leachate samples *Temperatures measured using oxygen meter* and Fluke meter
12/19/2001 13:50 BF 21
12/17/2001 15:00 AD 19
12/13/2001 14:30

Period 1 - Field Monitoring Form - OR DEQ Food Waste Composting Study Pile ID: PAW Point A: Five feet from west end of pile Point C: Five feet from east end of pilePhase: Composting & Curing Point B: Middle of pile side Point D: Middle of east end of pile
Date Time ID Process Ambient Pile Temperatures (F) Pile Oxygen Levels (%) Notes(initials) Day Temp A B C D A B C D (odor, weather, pests & access, visible steam/food waste)
122* 147* 138* 143*
157.0 159.0 153.4 143.9 16 16 18 14
12/21/2001 10:15 BF 23 46.6 158.1 159.1 152.9 145.5 3 2 13 18
Not Raining, Breezy, partly cloudy; no odor; no flies *Temperatures taken using new Fluke meter
12/22/2001 9:42 RAR 24 40 156.9 158.2 151.8 143.9 4 11 12 8
no wind; scattered showers -not raining at the time; no odor *Temperatures taken using new Fluke meter
12/23/2001 8:15 RCH 25 31 156.7 157.9 150.9 135.7 7 6 14 9
Foggy and cold but no rain *Temperatures taken using new Fluke meter
12/24/2001 8:57 Ron 26 34.5 157.7 158.2 150.1 137.7 - - - -
Foggy, no odor; oxygen probe not working, took to office to try out *Temperatures taken using new Fluke meter *Turned windrow
12/25/2001 27
*no temperature or oxygen readings taken
12/26/2001 14:00 AC 28 38 157.9 160.9 162.2 160.1 3 2 1 5
Sunny! No wind; no odor; no flies *Temperatures taken using new Fluke meter
Supplies running low? - Contact Stacey Servo - Tt at 206.728.9655 ext 124
Equipment not operating correctly? - Ask Jack Hoeck for assistance, if not available contact Stacey Servo
12/20/2001 13:22 TM 2250.1
@ 10:30
Clouds and blue sky; no precipitation; no wind; flies resting on PAW; emptied leachate buckets, sanitized, and put in shed *Temperatures measured using Demista oxygen meter* and new Fluke meter

Period 1 - Field Monitoring Form - OR DEQ Food Waste Composting Study Pile ID: PAW Point A: Five feet from west end of pile Point C: Five feet from east end of pilePhase: Composting & Curing Point B: Middle of pile side Point D: Middle of east end of pile
Date Time ID Process Ambient Pile Temperatures (F) Pile Oxygen Levels (%) Notes(initials) Day Temp A B C D A B C D (odor, weather, pests & access, visible steam/food waste)
168* 166* 172* 173*
158.5 162.0 163.2 161.7 1 12 6 6
12/28/2001 9:11 BF 30 40.8 157.1 160.1 161.9 159.0 4 7 7 5
no rain; new Fluke meter; light breeze; steam coming out of west pipe; no odor *Temperatures measured using new Fluke meter
12/29/2001 RW 31 38.4 159.1 159.9 160.1 161.3 2 6 6 6
Sprinkling; no wind; some odor *Temperatures measured using new Fluke meter
12/30/2001 RW 32 37.7 158.3 156.9 159.2 157.9 6 8 7 8
Partly cloudy; dry; no wind; no odor; oxygen probe not working well? *Temperatures measured using new Fluke meter
12/31/2001 14:10 RAR 33 50 158.7 158.2 158.8 156.0 - - - -
Foggy; no odor; slight breeze; Demista oxygen probe not working *Temperatures measured using new Fluke meter
1/1/2002 10:36 RAR 34 40.3 157.5 157.5 158.1 155.5 - - - -
Raining; no odor; leachate at a steady drip; Demista oxygen probe still not working will take a look at on Wednesday 1/2 *Temperatures measured using new Fluke meter
1/2/2002 10:52 BF 35 51.3 155.2 157.9 157.8 153.5 7 6 8 9
Some steam; no rain/wind; leachate bucket 3/4 full - took sample and emptied; not sure if Demista working correctly *Temperatures measured using new Fluke meter
Supplies running low? - Contact Stacey Servo - Tt at 206.728.9655 ext 124
Equipment not operating correctly? - Ask Jack Hoeck for assistance, if not available contact Stacey Servo
37.4
no wind; no rain during sampling; no offensive odors; collected pathogen compost & leachate samples; collected stability samples; emptied leachate bucket, sanitized, and placed in shed *Temperatures measured using Demista oxygen probe* and new Fluke meter12/27/2001 10:00 TM 29

Period 1 - Field Monitoring Form - OR DEQ Food Waste Composting Study Pile ID: PAW Point A: Five feet from west end of pile Point C: Five feet from east end of pilePhase: Composting & Curing Point B: Middle of pile side Point D: Middle of east end of pile
Date Time ID Process Ambient Pile Temperatures (F) Pile Oxygen Levels (%) Notes(initials) Day Temp A B C D A B C D (odor, weather, pests & access, visible steam/food waste)
1/3/2002 14:05 TM 3644.2
@ 9:20 155.7 159.5 159.3 159.7 - - - -
Intermittent clouds/blue sky; Demista not working for temps or O2 - Ron Ray will work on tonight; plastic and carboard visible at surface of pile; few flies; emptied leachate buckets, sanitized and placed in shed; collected pathogen compost & leachate samples *Temps measured using new Fluke meter
1/4/2002 10:45 BF 37 45.1 155.9 160.1 158.6 152.1 - - - -
Partly cloudy; no odor or wind; Demista not working *Temps measured using Fluke meter
1/5/2002 38 - - - - - - - -
*no temperature or oxygen readings taken
1/6/2002 8:00 RCH 39 approx. 50 162.0 166.4 162.8 151.4 - - - -
Rainy and warm *Temps measured using old temp gage because batteries dead on new one
1/7/2002 40 - - - - - - - -
*no temperature or oxygen readings taken
1/8/2002 9:07 RAR 41 52.6 152.5 161.3 158.1 146.1 7 2 2 5
Sunny; slight odor @ west end of pile; leachate at steady drip *Temps measured using new Fluke meter
1/9/2002 14:00 BF & BB 42 52.3 152.1 161.3 157.5 144.7 7 11 14 9
Sunny; leachate bucket full and smelly *Temps measured using new Fluke meter
Supplies running low? - Contact Stacey Servo - Tt at 206.728.9655 ext 124
Equipment not operating correctly? - Ask Jack Hoeck for assistance, if not available contact Stacey Servo

Period 1 - Field Monitoring Form - OR DEQ Food Waste Composting Study Pile ID: PAW Point A: Five feet from west end of pile Point C: Five feet from east end of pilePhase: Composting & Curing Point B: Middle of pile side Point D: Middle of east end of pile
Date Time ID Process Ambient Pile Temperatures (F) Pile Oxygen Levels (%) Notes(initials) Day Temp A B C D A B C D (odor, weather, pests & access, visible steam/food waste)
1/10/2002 13:10 TM/LJB 43 55.5 150.7 160.9 155.9 142.7 9 11 6 0
found fish bones & undecomposed broccoli while digging; identified chicken toes at points A and B; collected pathogen compost & leachate samples; collected stability samples *Temps measured using new Fluke meter
1/11/2002 9:15 BF 44 41.7 147.3 158.7 154.1 144.6 8 11 13 5
Foggy *Temps measured using new Fluke meter
1/12/2002 RCW 45 37.7 147.9 159.9 153.6 143.3 3 6 9 7
Foggy; slight breeze *Temps measured using new Fluke meter
1/13/2002 46 - - - - - - - -
*no temperature or oxygen readings taken
1/14/2002 16:00 AD 47 39.3 145.9 157.2 153.1 145.3 1 2 8 6
Cloudy with patches of blue sky; light wind; no odors; attached leachate buckets *Temps measured using new Fluke meter
1/15/2002 9:31 RAR 48 37.1 156.6 155.9 150.8 143.1 6 7 13 10
no odor; leachate 1/2 full *Temps measured using new Fluke meter
1/16/2002 16:00 AD 49 37.9 143.3 156.1 150.0 142.9 1 0 1 5
Cool, light drizzle; no odor or vectors; empties leachate to 1/3 bucket; took 8 ounce sample *Temps measured using Fluke meter
Supplies running low? - Contact Stacey Servo - Tt at 206.728.9655 ext 124
Equipment not operating correctly? - Ask Jack Hoeck for assistance, if not available contact Stacey Servo

Period 1 - Field Monitoring Form - OR DEQ Food Waste Composting Study Pile ID: PAW Point A: Five feet from west end of pile Point C: Five feet from east end of pilePhase: Composting & Curing Point B: Middle of pile side Point D: Middle of east end of pile
Date Time ID Process Ambient Pile Temperatures (F) Pile Oxygen Levels (%) Notes(initials) Day Temp A B C D A B C D (odor, weather, pests & access, visible steam/food waste)
1/17/2002 11:30 TM/LJB 50 40.0 142.9 157.1 150.1 141.3 - - - -
Weather cold and gray, no precip; Demista oxygen probe not available; Dark reddish brown full bucket of leachate; emptied leachate buckets, sanitized, and placed in shed; leachate sample composite from tues, wed and thurs; collected pathogen compost & leachate samples *Temps measured using new Fluke meter
1/18/2002 15:02 BF 51 46.3 143.3 158.3 149.5 139.7 11 11 11 18
Demista temps not working - pretty sure Demista oxygen working - Ron said it was fixed, but the 11, 11, 11 readings made me a little suspicious - appears to have worked though *Temps measured using new Fluke meter
1/19/2002 52 - - - - - - - -
*no temp or O2 readings taken
1/20/2002 8:25 RAR 53 39.5 140.8 156.8 148.5 149.5 6 5 7 10
Raining hard and windy; no odor *Temps measured using new Fluke meter
1/21/2002 13:54 RAR 54 39.9 133.7 156.9 146.9 125.7 - - - -
Rain, snow, sleet, sunshine (you name it); didn't do O2 because of time retraints *Temps measured using new Fluke meter
1/22/2002 10:32 RAR 55 37.3 135.1 151.5 144.7 122.5 10 12 9 12
Raining *Temps measured using new Fluke meter
1/23/2002 15:15 RAR 56 43.2 135.9 151.8 143.3 123.9 13 12 10 17
Cold; not raining; no odor *Temps measured using new Fluke meter
Supplies running low? - Contact Stacey Servo - Tt at 206.728.9655 ext 124
Equipment not operating correctly? - Ask Jack Hoeck for assistance, if not available contact Stacey Servo

Period 1 - Field Monitoring Form - OR DEQ Food Waste Composting Study Pile ID: PAW Point A: Five feet from west end of pile Point C: Five feet from east end of pilePhase: Composting & Curing Point B: Middle of pile side Point D: Middle of east end of pile
Date Time ID Process Ambient Pile Temperatures (F) Pile Oxygen Levels (%) Notes(initials) Day Temp A B C D A B C D (odor, weather, pests & access, visible steam/food waste)
1/24/2002 10:13 TM/LJB 57 46 135.5 153.3 142.6 126.2 16 6 5 18
Weather cold and gray, no precip; full bucket of leachate; emptied leachate bucket, sanitized, and placed in shed; leachate sample composite from tues, wed and thurs; collected pathogen compost & leachate samples; collected stability samples *Temps measured using new Fluke meter
2/7/2002 10:30 TM 70 45.9 131.3 153.2 135.8 127.1 14 14 14 17
Weather - wind and raining progressively harder; less sawdust color on surface of pile; checked Demista readings and much lower than Fluke readings; collected stability samples *Temps measured using new Fluke meter
2/21/2002 10:30 TM 84 64.7 125.2 148.3 128.2 - 11 11 12 12
Weather - no precip, warm; greenish-white yeast-like growth (10" by 7") near ground between B & C; onions growing under ventilation pipe near A; D temp not collected; collected stability samples *Temps measured using new Fluke meter
3/7/2002 11:00 TM 98 48.3 121.5 141.3 120.9 117.7 9 4 16 15
Weather - typical March, everything from snow, hail, and sleet to warm sunshine; collected stability samples, microbial samples, and compost character samples *Temps measured using new Fluke meter
Supplies running low? - Contact Stacey Servo - Tt at 206.728.9655 ext 124
Equipment not operating correctly? - Ask Jack Hoeck for assistance, if not available contact Stacey Servo

APPENDIX B
Period 2 Field Monitoring Forms

PAGE INTENTIONALLY LEFT BLANK

Period 2 - Field Monitoring Form - OR DEQ Food Waste Composting Study Pile ID: LTW Point A: Five feet from south end of pile Point D: Middle of north end of pilePhase: Composting & Curing Point B: Middle of pile east side Point E: Core of pile on east side
Point C: Five feet from north end of pile Point F: Core of pile on north side
Date Time ID Process Ambient Pile Temperatures Pile Oxygen Levels Notes(initials) Day Temp A B C D E F A B C D E F (odor, weather, pests & access, visible steam/food waste)
3/14
/200
2
1030
TM 1
51.6
76.8
75.8
77.6
77.2
76.9
76.5 1 3 1 0 0 0
Weather - cold, some wind, occasional rain; smells like sawdust *Temps measured using new Fluke meter; oxygen levels - Demista
3/15
/200
2
1112 BF 2
46.6 93 90.3
98.8
88.1
78.2 - 2 1 1 0 1 1
Weather - overcast, not raining; Thermocouple F not working *Temps measured using new Fluke meter, oxygen levels - Demista
3/16
/200
2
1436
RAR 3
39.5
109.
1
99.7
115.
8
110.
7
82.1
78.3 - - - - - -
Weather - now sunshine; piles steaming; slight odor; repaired Thermocouple F - had open line *Temps measured using new Fluke meter; oxygen levels - not collected
3/17
/200
2
950
RAR 4
44.7
116.
3
106.
1
121.
0
118.
1
84.3
82.6 4 3 3 3 3 4
Weather - cloudy, no rain at this time *Temps measured using new Fluke meter; oxygen levels - Demista
3/18
/200
2
1400
AD 5 46 128
121.
1
133.
1
138.
5
89 86.1 6 6 4 6 3 6
cloudy sky; very little odor; no visible food *Temps measured using new Fluke meter; oxygen levels - Demista
3/19
/200
2
1004
RAR 6
51.3
132.
7
126.
1
137.
3
147.
3
92.8
88.5 - - - - - -
Weather - Overcast, not raining; no odor *Temps measured using new Fluke meter; oxygen levels - not collected
3/20
/200
2
1034 BF 7
62.3
140.
9
132.
7
140.
8
151.
3
97.8
95.1
12 7 13 7 6 9
Weather - sunny; no odor; leachate pipe has steady drip *Temps measured using new Fluke meter; oxygen levels - Demista
Supplies running low? - Contact Stacey Servo - Tt at 206.728.9655 ext 124
Equipment not operating correctly? - Ask Jack Hoeck for assistance, if not available contact Stacey Servo

Period 2 - Field Monitoring Form - OR DEQ Food Waste Composting Study Pile ID: LTW Point A: Five feet from south end of pile Point D: Middle of north end of pilePhase: Composting & Curing Point B: Middle of pile east side Point E: Core of pile on east side
Point C: Five feet from north end of pile Point F: Core of pile on north side
Date Time ID Process Ambient Pile Temperatures Pile Oxygen Levels Notes(initials) Day Temp A B C D E F A B C D E F (odor, weather, pests & access, visible steam/food waste)
3/21
/200
2
1247
TM 8
64.5
144.
9
137.
1
141.
4
156.
4
102.
3
99.9
11 11 7 9 6 13
Weather - cool, slight breeze, no precip; ambient temps behine shed 54 and in front of shed 64.5; some trouble with thermocouples, retaped with wires touching rod; no unusual odors *Temps measured using new Fluke meter; oxygen levels - Demista
3/22
/200
2
1429 BF 9
54.1
144.
5
135.
3
142.
0
156.
8
113.
0
106.
7
9 10 8 11 7 11
Weather overcast; piles look good *Temps measured using new Fluke meter; oxygen levels - Demista
3/23
/200
2
1016
RAR 10 61.1
145.
7
137.
6
142.
8
156.
2
114.
9
110.
9
- - - - - -Weather - slight overcast; no breeze; slight manure odor *Temps measured using new Fluke meter; oxygen levels - not collected
3/24
/200
2
733
RAR 11 45.5
146.
2
138.
7
142.
3
154.
1
117.
3
110.
5
4 3 3 2 3 3
Weather - cloudy, no rain, but rained entire night before; slight manure odor *Temps measured using new Fluke meter; oxygen levels - Demista
3/25
/200
2
1425
AD 12
55 s
hade
77
sun
150.
1
143.
2
145
160.
6
122
118 1 1 1 1 1 1
Weather - sunny; soft breeze; no vectors or pile tampering; bucket not in place - too much water on lid? *Temps measured using new Fluke meter; oxygen levels - Demista
3/26
/200
2
812
RAR 13 54.3
153
143.
3
145.
3
161.
1
123.
3
119.
3
4 1 1 1 5 1
Weather - sunny; no odor; at turning pile odor like sheep stew *Temps measured using new Fluke meter; oxygen levels - Demista **Turned pile**
3/27
/200
2
1117
RAR 14 63.9
117.
9
124.
1
125.
9
115.
5
122.
5
114.
8
4 3 3 4 3 4
Strong manure smell; looks like someone was messing around pile area *Temps measured using new Fluke meter; oxygen levels - Demista
Supplies running low? - Contact Stacey Servo - Tt at 206.728.9655 ext 124
Equipment not operating correctly? - Ask Jack Hoeck for assistance, if not available contact Stacey Servo
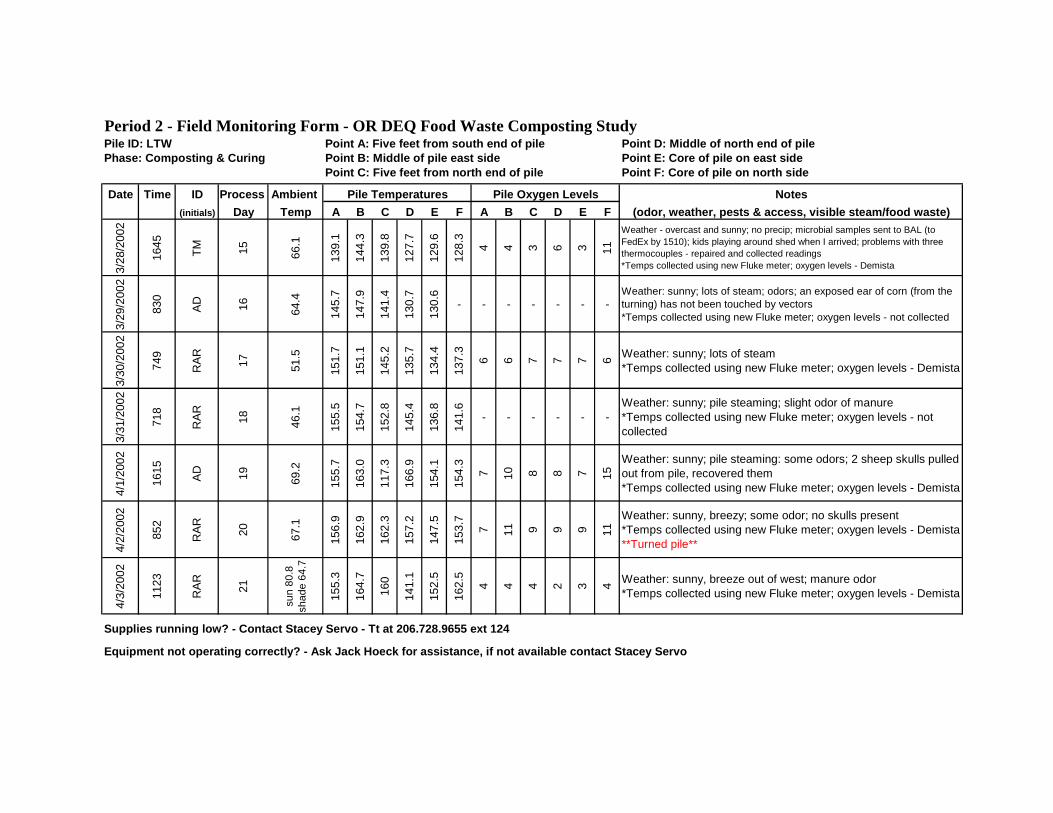
Period 2 - Field Monitoring Form - OR DEQ Food Waste Composting Study Pile ID: LTW Point A: Five feet from south end of pile Point D: Middle of north end of pilePhase: Composting & Curing Point B: Middle of pile east side Point E: Core of pile on east side
Point C: Five feet from north end of pile Point F: Core of pile on north side
Date Time ID Process Ambient Pile Temperatures Pile Oxygen Levels Notes(initials) Day Temp A B C D E F A B C D E F (odor, weather, pests & access, visible steam/food waste)
3/28
/200
2
1645
TM 15 66.1
139.
1
144.
3
139.
8
127.
7
129.
6
128.
3
4 4 3 6 3 11
Weather - overcast and sunny; no precip; microbial samples sent to BAL (to FedEx by 1510); kids playing around shed when I arrived; problems with three thermocouples - repaired and collected readings *Temps collected using new Fluke meter; oxygen levels - Demista
3/29
/200
2
830
AD 16 64.4
145.
7
147.
9
141.
4
130.
7
130.
6
- - - - - - -Weather: sunny; lots of steam; odors; an exposed ear of corn (from the turning) has not been touched by vectors *Temps collected using new Fluke meter; oxygen levels - not collected
3/30
/200
2
749
RAR 17 51.5
151.
7
151.
1
145.
2
135.
7
134.
4
137.
3
6 6 7 7 7 6 Weather: sunny; lots of steam *Temps collected using new Fluke meter; oxygen levels - Demista
3/31
/200
2
718
RAR 18 46.1
155.
5
154.
7
152.
8
145.
4
136.
8
141.
6
- - - - - -Weather: sunny; pile steaming; slight odor of manure *Temps collected using new Fluke meter; oxygen levels - not collected
4/1/
2002
1615
AD 19 69.2
155.
7
163.
0
117.
3
166.
9
154.
1
154.
3
7 10 8 8 7 15
Weather: sunny; pile steaming: some odors; 2 sheep skulls pulled out from pile, recovered them *Temps collected using new Fluke meter; oxygen levels - Demista
4/2/
2002
852
RAR 20 67.1
156.
9
162.
9
162.
3
157.
2
147.
5
153.
7
7 11 9 9 9 11
Weather: sunny, breezy; some odor; no skulls present *Temps collected using new Fluke meter; oxygen levels - Demista **Turned pile**
4/3/
2002
1123
RAR 21
sun
80.8
sh
ade
64.7
155.
3
164.
7
160
141.
1
152.
5
162.
5
4 4 4 2 3 4 Weather: sunny, breeze out of west; manure odor *Temps collected using new Fluke meter; oxygen levels - Demista
Supplies running low? - Contact Stacey Servo - Tt at 206.728.9655 ext 124
Equipment not operating correctly? - Ask Jack Hoeck for assistance, if not available contact Stacey Servo

Period 2 - Field Monitoring Form - OR DEQ Food Waste Composting Study Pile ID: LTW Point A: Five feet from south end of pile Point D: Middle of north end of pilePhase: Composting & Curing Point B: Middle of pile east side Point E: Core of pile on east side
Point C: Five feet from north end of pile Point F: Core of pile on north side
Date Time ID Process Ambient Pile Temperatures Pile Oxygen Levels Notes(initials) Day Temp A B C D E F A B C D E F (odor, weather, pests & access, visible steam/food waste)
4/4/
2002
1421
TM/E
G
22 71.2
155.
6
164.
5
166.
3
157.
3
155.
7
157.
9
1 5 0 1 2 5
Weather: sunny & warm; no samples collected; leachate buckets washed and placed in shed; assisted by Eric Fale; repaired thermocouple E - may have affected results from day before; ambient temps behind shed = 71.2, front = 85.7 *Temps collected using new Fluke meter; oxygen levels - Demista
4/5/
2002
BF 23 55.5
160.
5
165.
4
166.
1
164.
9
155.
9
156.
9
- - - - - - *Temps collected using new Fluke meter; oxygen levels - not collected
4/6/
2002
1213
RAR 24 58.5
168.
4
171.
3
170.
9
172.
6
164.
3
163.
7
- - - - - -Weather: cool cloudy day, no rain at time; some odor *Temps collected using new Fluke meter; oxygen levels - not collected
4/7/
2002
835
RAR 25 48.1
168.
4
171.
3
170.
9
172.
6
164.
3
163.
7
- - - - - -Weather: cloudy, no rain; no steam *Temps collected using new Fluke meter; oxygen levels - not collected
4/8/
2002
1430
AD 26 73.4
162
167
166
166.
1
160.
4
163.
1- - - - - -
Weather: sunny; buckets in place; no steam, Demista clogged *Temps collected using new Fluke meter; oxygen levels - not collected
4/9/
2002
1010
RAR 27 53.4
161.
1
165.
5
164.
1
165.
1
159
160.
9
7 8 7 5 9 5
Weather: drizzle, rain on and off; no odor, no steam *Temps collected using new Fluke meter; oxygen levels - Demista **Turned pile**
4/10
/200
2
1630 BF 28 64.8
153.
9
150.
2
156.
5
150.
1
130.
2
142.
8
6 8 4 4 6 7 Weather: partly cloudy; odor within 15 feet, little to no leachate *Temps collected using new Fluke meter; oxygen levels - Demista
Supplies running low? - Contact Stacey Servo - Tt at 206.728.9655 ext 124
Equipment not operating correctly? - Ask Jack Hoeck for assistance, if not available contact Stacey Servo

Period 2 - Field Monitoring Form - OR DEQ Food Waste Composting Study Pile ID: LTW Point A: Five feet from south end of pile Point D: Middle of north end of pilePhase: Composting & Curing Point B: Middle of pile east side Point E: Core of pile on east side
Point C: Five feet from north end of pile Point F: Core of pile on north side
Date Time ID Process Ambient Pile Temperatures Pile Oxygen Levels Notes(initials) Day Temp A B C D E F A B C D E F (odor, weather, pests & access, visible steam/food waste)
4/11
/200
2
1725
TM/C
S/BB
29
63.1
fron
t 64
.1 b
ack
155.
9
148.
3
157.
7
173.
3
131.
1
140.
7
7 14 5 5 8 9
Weather: cloudy w/ few sprinkles, some sun; microbial compost samples sent to BAL (FedEx by 15:00); stability samples collected;TW seems dry - very little clear leachate present; Jack and AOR tour group visited; skull w/out jaw found at B; several leg bones present in both piles *Temps collected using new Fluke meter; oxygen levels - Demista
4/12
/200
2
944
BF 30 59.5
157.
1
149.
1
155.
3
158.
6
131.
3
141.
7
4 8 5 6 6 8 no odor *Temps collected using new Fluke meter; oxygen levels - Demista
4/13
/200
2
813
RAR 31 56.1
160.
2
150.
5
160.
3
162
132.
5
144.
2
4 4 4 4 3 5 Weather: raining, no odor *Temps collected using new Fluke meter; oxygen levels - Demista
4/14
/200
2
838
RAR 32 49.5
157
152.
4
159.
9
162.
1
131.
3
143.
6
- - - - - - Weather: sunny right now; no odor; steam on east side of pile *Temps collected using new Fluke meter; oxygen levels - Demista
4/15
/200
2
1500
AD 33 50.9
159.
3
155.
9
161.
3
164.
1
135.
5
147.
3
7 8 6 5 10 5
Weather: sunny w/ showers; no steam; no vectors - few flies; no odor except slight smell of manure; small mushrooms growing on east side; no leachate drips; bucket in place *Temps collected using new Fluke meter; oxygen levels - Demista
4/16
/200
2
1015
RAR 34 45.6
157.
5
160.
2
161.
7
164.
5
135.
9
147.
9
12 8 11 8 9 11
Weather: windy, cold; no odor, no steam *Temps collected using new Fluke meter; oxygen levels - Demista **Turned pile**
4/17
/200
2
1344 BF 35 51.4
144.
2
142.
6
148.
6
147.
9
141.
2
145.
2
7 5 4 5 4 3
Weather: strong wind gusts; slight odor; no steam; less than 1 oz of leachate in bucket *Temps collected using new Fluke meter; oxygen levels - Demista
Supplies running low? - Contact Stacey Servo - Tt at 206.728.9655 ext 124
Equipment not operating correctly? - Ask Jack Hoeck for assistance, if not available contact Stacey Servo

Period 2 - Field Monitoring Form - OR DEQ Food Waste Composting Study Pile ID: LTW Point A: Five feet from south end of pile Point D: Middle of north end of pilePhase: Composting & Curing Point B: Middle of pile east side Point E: Core of pile on east side
Point C: Five feet from north end of pile Point F: Core of pile on north side
Date Time ID Process Ambient Pile Temperatures Pile Oxygen Levels Notes(initials) Day Temp A B C D E F A B C D E F (odor, weather, pests & access, visible steam/food waste)
4/18
/200
2
1522
TM 36 55.2
158.
1
157.
6
155.
7
149.
5
139.
2
145.
3
4 7 7 15 6 16
Weather: overcast & sunny, no precip, cold breeze; microbial compost samples sent to BAL (FedEx by 1511); found shed unlocked; no skull or jaw bones - found a few leg bones; less than 10 mL leachate; need face masks - will pick some up; smells like stinky compost - a bit better this week *Temps collected using new Fluke meter; oxygen levels - Demista
4/19
/200
2
1410 BF 37 54.1
167.
3
160.
3
160.
7
155.
8
142.
2
148.
4
6 2 6 7 2 1 Weather: mostly cloudy, light wind; some odor *Temps collected using new Fluke meter; oxygen levels - Demista
4/20
/200
2
730
RD
W
38 45.2
166.
6
161.
2
160.
6
159.
2
142.
9
148.
8
- - - - - -Weather: overcast, light wind; some odor *Temps collected using new Fluke meter; oxygen levels - not collected
4/21
/200
2
1415
RD
W
39 59.6
167.
7
166.
0
165.
8
163.
8
150.
0
156.
1
- - - - - -Weather: sunny & clear, some wind; no odor *Temps collected using new Fluke meter; oxygen levels - not collected
4/22
/200
2
1415
AD 40 61
166.
1
165.
1
165.
0
165.
4
151.
0
160.
9- - - - - -
Weather: sunny; no odors, Demista clogged *Temps collected using new Fluke meter; oxygen levels - not collected
4/23
/200
2
858
RAR 41 50.3
163.
5
162.
8
162.
7
164.
3
149.
3
161.
9
7 2 7 4 3 2
Weather: sunny, light breeze; no odor *Temps collected using new Fluke meter; oxygen levels - Demista **Turned pile**
4/24
/200
2
1015 BF 42 50.4
162.
1
152.
4
161.
8
156.
1
135.
9
161.
9
2 2 2 1 1 2 Weather: sunny; faint odor; no leachate in bucket *Temps collected using new Fluke meter; oxygen levels - Demista
Supplies running low? - Contact Stacey Servo - Tt at 206.728.9655 ext 124
Equipment not operating correctly? - Ask Jack Hoeck for assistance, if not available contact Stacey Servo
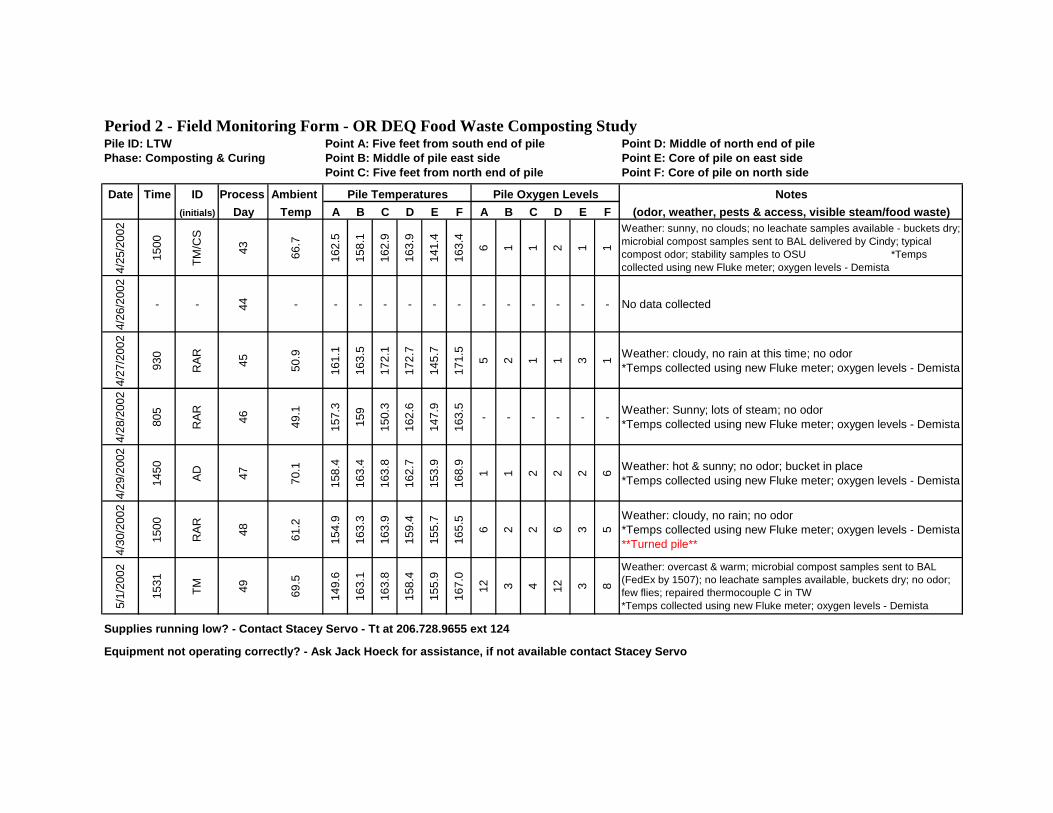
Period 2 - Field Monitoring Form - OR DEQ Food Waste Composting Study Pile ID: LTW Point A: Five feet from south end of pile Point D: Middle of north end of pilePhase: Composting & Curing Point B: Middle of pile east side Point E: Core of pile on east side
Point C: Five feet from north end of pile Point F: Core of pile on north side
Date Time ID Process Ambient Pile Temperatures Pile Oxygen Levels Notes(initials) Day Temp A B C D E F A B C D E F (odor, weather, pests & access, visible steam/food waste)
4/25
/200
2
1500
TM/C
S
43 66.7
162.
5
158.
1
162.
9
163.
9
141.
4
163.
4
6 1 1 2 1 1
Weather: sunny, no clouds; no leachate samples available - buckets dry; microbial compost samples sent to BAL delivered by Cindy; typical compost odor; stability samples to OSU *Temps collected using new Fluke meter; oxygen levels - Demista
4/26
/200
2
- - 44 - - - - - - - - - - - - - No data collected
4/27
/200
2
930
RAR 45 50.9
161.
1
163.
5
172.
1
172.
7
145.
7
171.
5
5 2 1 1 3 1 Weather: cloudy, no rain at this time; no odor *Temps collected using new Fluke meter; oxygen levels - Demista
4/28
/200
2
805
RAR 46 49.1
157.
3
159
150.
3
162.
6
147.
9
163.
5
- - - - - - Weather: Sunny; lots of steam; no odor *Temps collected using new Fluke meter; oxygen levels - Demista
4/29
/200
2
1450
AD 47 70.1
158.
4
163.
4
163.
8
162.
7
153.
9
168.
9
1 1 2 2 2 6 Weather: hot & sunny; no odor; bucket in place *Temps collected using new Fluke meter; oxygen levels - Demista
4/30
/200
2
1500
RAR 48 61.2
154.
9
163.
3
163.
9
159.
4
155.
7
165.
5
6 2 2 6 3 5
Weather: cloudy, no rain; no odor *Temps collected using new Fluke meter; oxygen levels - Demista **Turned pile**
5/1/
2002
1531
TM 49 69.5
149.
6
163.
1
163.
8
158.
4
155.
9
167.
0
12 3 4 12 3 8
Weather: overcast & warm; microbial compost samples sent to BAL (FedEx by 1507); no leachate samples available, buckets dry; no odor; few flies; repaired thermocouple C in TW *Temps collected using new Fluke meter; oxygen levels - Demista
Supplies running low? - Contact Stacey Servo - Tt at 206.728.9655 ext 124
Equipment not operating correctly? - Ask Jack Hoeck for assistance, if not available contact Stacey Servo
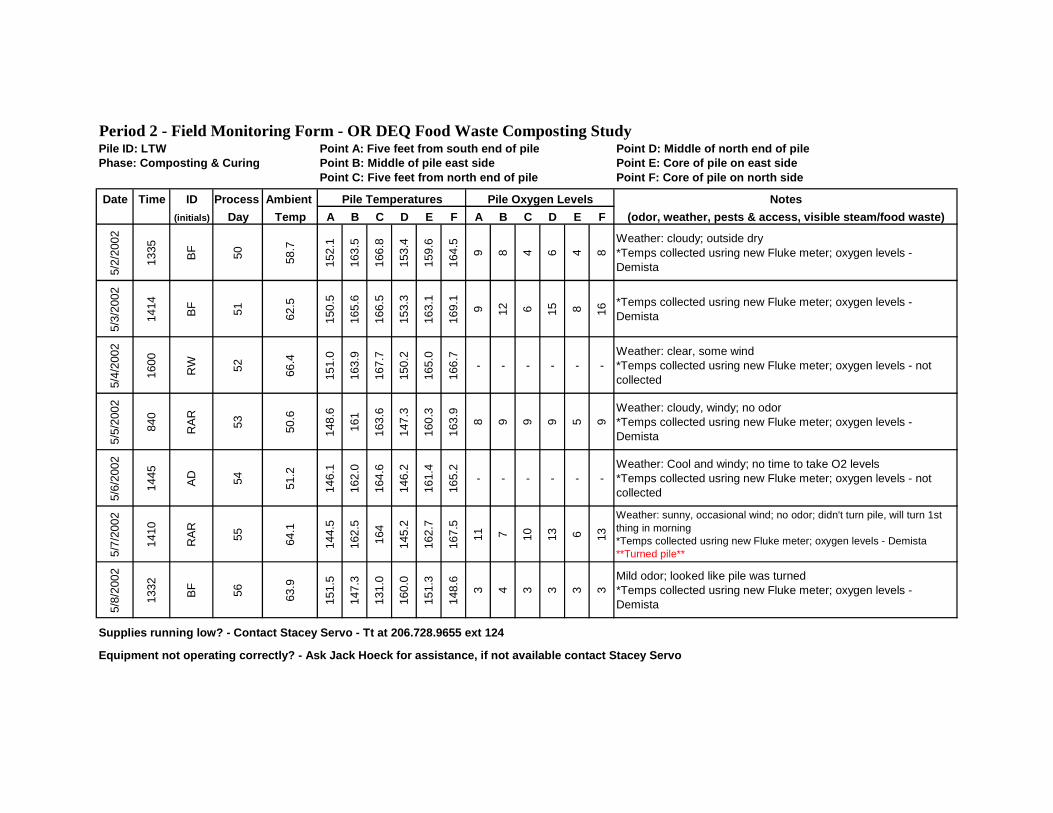
Period 2 - Field Monitoring Form - OR DEQ Food Waste Composting Study Pile ID: LTW Point A: Five feet from south end of pile Point D: Middle of north end of pilePhase: Composting & Curing Point B: Middle of pile east side Point E: Core of pile on east side
Point C: Five feet from north end of pile Point F: Core of pile on north side
Date Time ID Process Ambient Pile Temperatures Pile Oxygen Levels Notes(initials) Day Temp A B C D E F A B C D E F (odor, weather, pests & access, visible steam/food waste)
5/2/
2002
1335 BF 50 58.7
152.
1
163.
5
166.
8
153.
4
159.
6
164.
5
9 8 4 6 4 8
Weather: cloudy; outside dry *Temps collected usring new Fluke meter; oxygen levels - Demista
5/3/
2002
1414 BF 51 62.5
150.
5
165.
6
166.
5
153.
3
163.
1
169.
1
9 12 6 15 8 16
*Temps collected usring new Fluke meter; oxygen levels - Demista
5/4/
2002
1600
RW 52 66.4
151.
0
163.
9
167.
7
150.
2
165.
0
166.
7
- - - - - -Weather: clear, some wind *Temps collected usring new Fluke meter; oxygen levels - not collected
5/5/
2002
840
RAR 53 50.6
148.
6
161
163.
6
147.
3
160.
3
163.
9
8 9 9 9 5 9
Weather: cloudy, windy; no odor *Temps collected usring new Fluke meter; oxygen levels - Demista
5/6/
2002
1445
AD 54 51.2
146.
1
162.
0
164.
6
146.
2
161.
4
165.
2
- - - - - -Weather: Cool and windy; no time to take O2 levels *Temps collected usring new Fluke meter; oxygen levels - not collected
5/7/
2002
1410
RAR 55 64.1
144.
5
162.
5
164
145.
2
162.
7
167.
5
11 7 10 13 6 13
Weather: sunny, occasional wind; no odor; didn't turn pile, will turn 1st thing in morning *Temps collected usring new Fluke meter; oxygen levels - Demista **Turned pile**
5/8/
2002
1332 BF 56 63.9
151.
5
147.
3
131.
0
160.
0
151.
3
148.
6
3 4 3 3 3 3
Mild odor; looked like pile was turned *Temps collected usring new Fluke meter; oxygen levels - Demista
Supplies running low? - Contact Stacey Servo - Tt at 206.728.9655 ext 124
Equipment not operating correctly? - Ask Jack Hoeck for assistance, if not available contact Stacey Servo
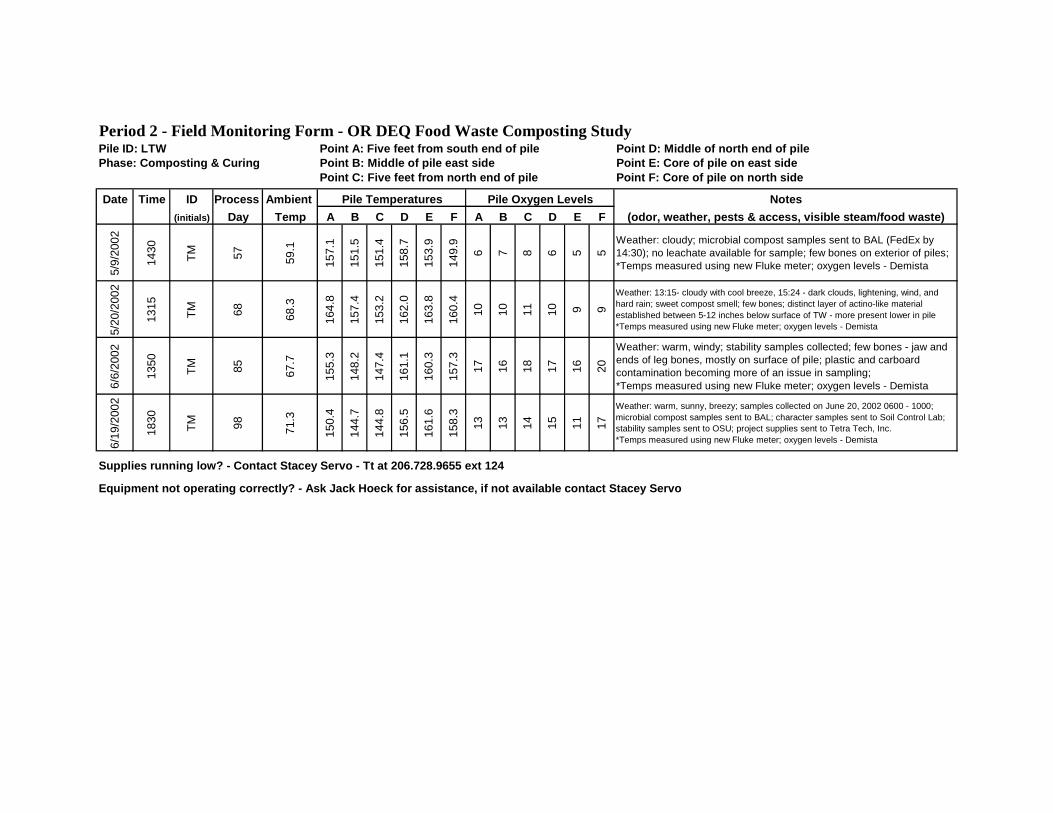
Period 2 - Field Monitoring Form - OR DEQ Food Waste Composting Study Pile ID: LTW Point A: Five feet from south end of pile Point D: Middle of north end of pilePhase: Composting & Curing Point B: Middle of pile east side Point E: Core of pile on east side
Point C: Five feet from north end of pile Point F: Core of pile on north side
Date Time ID Process Ambient Pile Temperatures Pile Oxygen Levels Notes(initials) Day Temp A B C D E F A B C D E F (odor, weather, pests & access, visible steam/food waste)
5/9/
2002
1430
TM 57 59.1
157.
1
151.
5
151.
4
158.
7
153.
9
149.
9
6 7 8 6 5 5
Weather: cloudy; microbial compost samples sent to BAL (FedEx by 14:30); no leachate available for sample; few bones on exterior of piles; *Temps measured using new Fluke meter; oxygen levels - Demista
5/20
/200
2
1315
TM 68 68.3
164.
8
157.
4
153.
2
162.
0
163.
8
160.
4
10 10 11 10 9 9
Weather: 13:15- cloudy with cool breeze, 15:24 - dark clouds, lightening, wind, and hard rain; sweet compost smell; few bones; distinct layer of actino-like material established between 5-12 inches below surface of TW - more present lower in pile *Temps measured using new Fluke meter; oxygen levels - Demista
6/6/
2002
1350
TM 85 67.7
155.
3
148.
2
147.
4
161.
1
160.
3
157.
3
17 16 18 17 16 20
Weather: warm, windy; stability samples collected; few bones - jaw and ends of leg bones, mostly on surface of pile; plastic and carboard contamination becoming more of an issue in sampling; *Temps measured using new Fluke meter; oxygen levels - Demista
6/19
/200
2
1830
TM 98 71.3
150.
4
144.
7
144.
8
156.
5
161.
6
158.
3
13 13 14 15 11 17
Weather: warm, sunny, breezy; samples collected on June 20, 2002 0600 - 1000; microbial compost samples sent to BAL; character samples sent to Soil Control Lab; stability samples sent to OSU; project supplies sent to Tetra Tech, Inc. *Temps measured using new Fluke meter; oxygen levels - Demista
Supplies running low? - Contact Stacey Servo - Tt at 206.728.9655 ext 124
Equipment not operating correctly? - Ask Jack Hoeck for assistance, if not available contact Stacey Servo

Period 2 - Field Monitoring Form - OR DEQ Food Waste Composting Study Pile ID: PAW Point A: Five feet from west end of pile Point D: Middle of east end of pilePhase: Composting & Curing Point B: Middle of pile north side Point E: Core of pile
Point C: Five feet from east end of pile Point F: Directly Over Aeration Pipe
Date Time ID Process Ambient Pile Temperatures Pile Oxygen Levels Notes(initials) Day Temp A B C D E F A B C D E F (odor, weather, pests & access, visible steam/food waste)
3/14
/200
2
1030
TM 1
51.6
83.4
80.7
78.5
79.1
80.0
76.8 0 0 1 2 1 0
Weather - cold, some wind, occasional rain; smells like sawdust *Temps measured using new Fluke meter; oxygen levels - Demista
3/15
/200
2
1115 BF 2
46.6
89.9
91.4
86.8
91.3
83.3
81.5 2 0 3 1 1 0
Weather - overcast, not raining; mild odor *Temps measured using new Fluke meter; oxygen levels - Demista
3/16
/200
2
1431
RAR 3
39.5
103.
6
111.
9
97.7
110.
6
90.7
91.8 - - - - - -
Weather - Snowing/sunshine/windy/light breeze/rain *Temps measured using new Fluke meter; oxygen levels- not collected
3/17
/200
2
931
RAR 4
44.7
114.
2
128.
1
103.
4
119.
5
95.6
97.5 2 0 0 5 1 1
Weather - cloudy, no rain at this time; slight manure odor *Temps measured using new Fluke meter; oxygen levels - Demista
3/18
/200
2
1500
AD 5 46
128.
8
141.
5
114.
7
132.
5
107.
7
110 7 5 8 11 5 3
Some odor on North Side (lamb stew?); visible chicken foot, onion, cardboard; Thermocouple F not registering - Jack and Alex re-taped the end to ensure good wire contact, worked ok after that *Temps measured using new Fluke meter; oxygen levels - Demista
3/19
/200
2
959
RAR 6
51.3
139.
9
150.
8
120.
5
139.
2
112.
5
117.
5
- - - - - -Weather - overcast, not raining *Temps measured using new Fluke meter; oxygen levels - not collected
3/20
/200
2
1029 BF 7
62.3
150.
6
157.
7
128.
3
146.
1
122.
5
124.
7
11 7 7 7 6 5Weather - sunny; no odor *Temps measured using new Fluke meter; oxygen levels - Demista
Supplies running low? - Contact Stacey Servo - Tt at 206.728.9655 ext 124
Equipment not operating correctly? - Ask Jack Hoeck for assistance, if not available contact Stacey Servo

Period 2 - Field Monitoring Form - OR DEQ Food Waste Composting Study Pile ID: PAW Point A: Five feet from west end of pile Point D: Middle of east end of pilePhase: Composting & Curing Point B: Middle of pile north side Point E: Core of pile
Point C: Five feet from east end of pile Point F: Directly Over Aeration Pipe
Date Time ID Process Ambient Pile Temperatures Pile Oxygen Levels Notes(initials) Day Temp A B C D E F A B C D E F (odor, weather, pests & access, visible steam/food waste)
3/21
/200
2
1247
TM 8
64.5
157.
3
164.
7
135.
9
150.
3
132.
8
132.
7
15 12 12 7 11 8
Weather - cool, slight breeze, no precip; ambient temps behine shed 54 and in front of shed 64.5; some trouble with thermocouples, retaped with wires touching rod; no unusual odors *Temps measured using new Fluke meter; oxygen levels - Demista
3/22
/200
2
1422 BF 9
54.1
162.
3
161.
2
143.
5
153.
9
137.
3
141.
0
4 6 8 10 2 12
Weather - overcast; very faint odor *Temps measured using new Fluke meter; oxygen levles - Demista
3/23
/200
2
1011
RAR 10 61.1
164.
1
159.
9
144.
8
155.
1
141.
5
144.
0
- - - - - -Weather - slight overcast, no breeze; no odor *Temps measured using new Fluke meter; oxygen levels - Demista
3/24
/200
2
720
RAR 11 45.5
163.
9
159.
8
143.
9
156.
3
143
145.
1
5 3 3 5 4 3
Weather - cloudy, no rain, but rained entire night before *Temps measured using new Fluke meter; oxygen levels - Demista
3/25
/200
2
1420
AD 12
55 s
hade
77
sun
163
162.
9
147
158.
6
152
153 7 7 5 5 6 5
Weather - sunny, soft breeze; no pile tampering by vectors; slight odor from tubes; bucket in place *Temps measured using new Fluke meter; oxygen levels - Demista
3/26
/200
2
859
RAR 13 54.3
163.
6
163.
5
142.
3
159.
7
153.
5
153.
1
- - - - - -Weather - Sunny; no odor *Temps measured using new Fluke meter; oxygen levels - not collected
3/27
/200
2
1155
RAR 14 63.9
166.
5
167.
3
146.
5
162.
2
155.
3
149.
4
11 14 9 8 8 5
Looks like someone tampered with pile - removed thermocouple E and maybe moved F, replaced F and couldn't find thermocouple E - so replace with ambient thermocouple, made new ambient thermocouple *Temps measured using new Fluke meter; oxygen levels - Demista
Supplies running low? - Contact Stacey Servo - Tt at 206.728.9655 ext 124
Equipment not operating correctly? - Ask Jack Hoeck for assistance, if not available contact Stacey Servo

Period 2 - Field Monitoring Form - OR DEQ Food Waste Composting Study Pile ID: PAW Point A: Five feet from west end of pile Point D: Middle of east end of pilePhase: Composting & Curing Point B: Middle of pile north side Point E: Core of pile
Point C: Five feet from east end of pile Point F: Directly Over Aeration Pipe
Date Time ID Process Ambient Pile Temperatures Pile Oxygen Levels Notes(initials) Day Temp A B C D E F A B C D E F (odor, weather, pests & access, visible steam/food waste)
3/28
/200
2
1645
TM 15 66.1
164.
2
165.
6
143.
4
164.
2
165.
1
140.
8
14 16 12 8 14 11
Weather - overcast and sunny; no precip; microbial samples sent to BAL (to FedEx by 1510); kids playing around shed when I arrived; problems with three thermocouples - repaired and collected readings *Temps collected usring new Fluke meter; oxygen levels - Demista
3/29
/200
2
800
AD 16 64.4
166.
3
166.
1
122.
4
166
163.
9
151.
5
- - - - - -Weather: sunny; little odor, less than LTW; no vectors *Temps collected usring new Fluke meter; oxygen levels - not collected
3/30
/200
2
812
RAR 17 51.5
163.
8
167
121.
5
166.
9
146.
6
155.
1
11 9 8 5 11 9
Weather: sunny; pile steaming ,but not as much as LTW *Temps collected usring new Fluke meter; oxygen levels - Demista
3/31
/200
2
715
RAR 18 46.1
163.
8
166.
3
126.
0
189.
1
153.
9
155.
1
- - - - - -Weather: sunny; steam on south side of pile; no real odor *Temps collected usring new Fluke meter; oxygen levels - not collected
4/1/
2002
1645
AD 19 69.2
161.
1
162.
6
162.
8
155.
6
146.
2
156.
8
6 8 11 9 7 8
Weather: sunny; no steam; no odors *Temps collected usring new Fluke meter; oxygen levels - Demista
4/2/
2002
903
RAR 20 67.1
161.
3
168.
2
119.
6
166.
4
155.
1
159.
7
16 15 8 10 15 17
Weather: sunny & breezy; little steam at peak of pile; breeze blowing to SW direction; no odor *Temps collected usring new Fluke meter; oxygen levels - Demista
4/3/
2002
1139
RAR 21
sun
80.8
sh
ade
64.7
161.
9
168.
8
119.
5
163.
1
159.
9
163.
9
12 7 11 11 16 18Weather: sunny, breeze out of west; no odor *Temps collected usring new Fluke meter; oxygen levels - Demista
Supplies running low? - Contact Stacey Servo - Tt at 206.728.9655 ext 124
Equipment not operating correctly? - Ask Jack Hoeck for assistance, if not available contact Stacey Servo
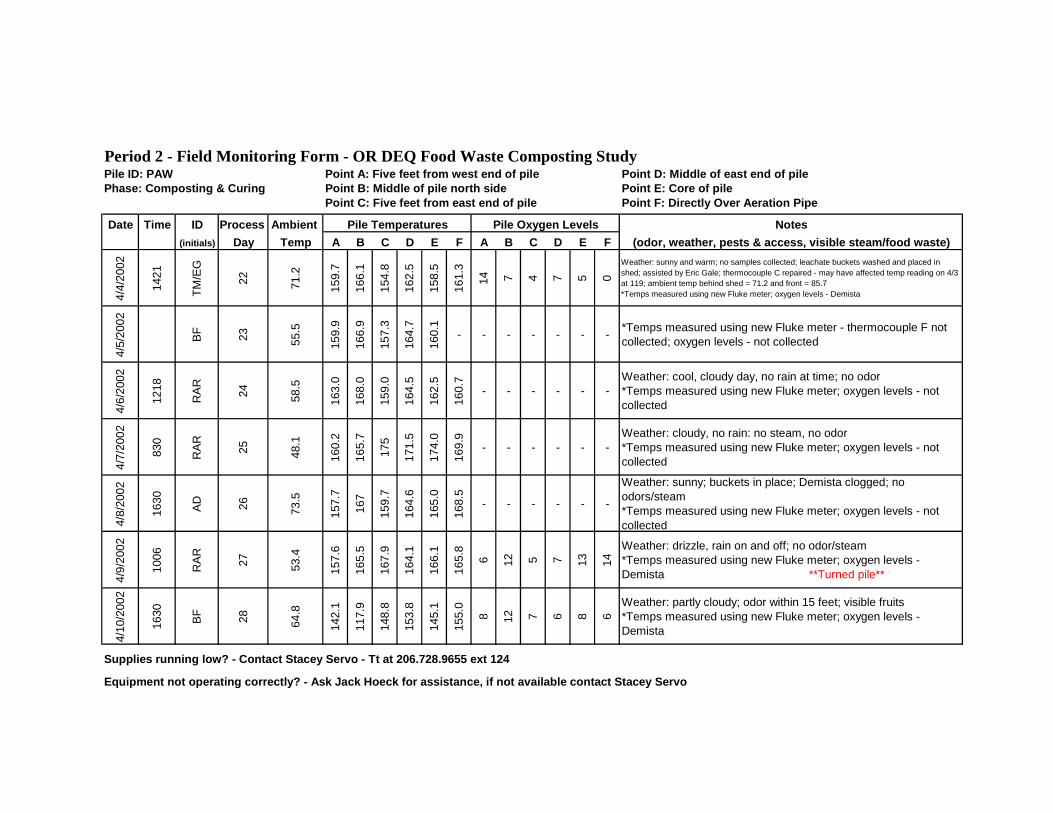
Period 2 - Field Monitoring Form - OR DEQ Food Waste Composting Study Pile ID: PAW Point A: Five feet from west end of pile Point D: Middle of east end of pilePhase: Composting & Curing Point B: Middle of pile north side Point E: Core of pile
Point C: Five feet from east end of pile Point F: Directly Over Aeration Pipe
Date Time ID Process Ambient Pile Temperatures Pile Oxygen Levels Notes(initials) Day Temp A B C D E F A B C D E F (odor, weather, pests & access, visible steam/food waste)
4/4/
2002
1421
TM/E
G
22 71.2
159.
7
166.
1
154.
8
162.
5
158.
5
161.
3
14 7 4 7 5 0
Weather: sunny and warm; no samples collected; leachate buckets washed and placed in shed; assisted by Eric Gale; thermocouple C repaired - may have affected temp reading on 4/3 at 119; ambient temp behind shed = 71.2 and front = 85.7 *Temps measured using new Fluke meter; oxygen levels - Demista
4/5/
2002
BF 23 55.5
159.
9
166.
9
157.
3
164.
7
160.
1
- - - - - - - *Temps measured using new Fluke meter - thermocouple F not collected; oxygen levels - not collected
4/6/
2002
1218
RAR 24 58.5
163.
0
168.
0
159.
0
164.
5
162.
5
160.
7
- - - - - -Weather: cool, cloudy day, no rain at time; no odor *Temps measured using new Fluke meter; oxygen levels - not collected
4/7/
2002
830
RAR 25 48.1
160.
2
165.
7
175
171.
5
174.
0
169.
9- - - - - -
Weather: cloudy, no rain: no steam, no odor *Temps measured using new Fluke meter; oxygen levels - not collected
4/8/
2002
1630
AD 26 73.5
157.
7
167
159.
7
164.
6
165.
0
168.
5
- - - - - -
Weather: sunny; buckets in place; Demista clogged; no odors/steam *Temps measured using new Fluke meter; oxygen levels - not collected
4/9/
2002
1006
RAR 27 53.4
157.
6
165.
5
167.
9
164.
1
166.
1
165.
8
6 12 5 7 13 14
Weather: drizzle, rain on and off; no odor/steam *Temps measured using new Fluke meter; oxygen levels - Demista **Turned pile**
4/10
/200
2
1630 BF 28 64.8
142.
1
117.
9
148.
8
153.
8
145.
1
155.
0
8 12 7 6 8 6Weather: partly cloudy; odor within 15 feet; visible fruits *Temps measured using new Fluke meter; oxygen levels - Demista
Supplies running low? - Contact Stacey Servo - Tt at 206.728.9655 ext 124
Equipment not operating correctly? - Ask Jack Hoeck for assistance, if not available contact Stacey Servo

Period 2 - Field Monitoring Form - OR DEQ Food Waste Composting Study Pile ID: PAW Point A: Five feet from west end of pile Point D: Middle of east end of pilePhase: Composting & Curing Point B: Middle of pile north side Point E: Core of pile
Point C: Five feet from east end of pile Point F: Directly Over Aeration Pipe
Date Time ID Process Ambient Pile Temperatures Pile Oxygen Levels Notes(initials) Day Temp A B C D E F A B C D E F (odor, weather, pests & access, visible steam/food waste)
4/11
/200
2
1725
TM/C
S/BB
29
front
63.
1
back
64.
1
146.
6
138.
7
155.
7
160.
2
151.
1
163.
5
10 6 7 16 11 9
Weather: cloudy w/ few sprinkles and some sun; microbial compost samples sent to BAL (FedEx by 1500); stability samples collected; smells sour; leachate has fatty layer;Jack and AOR tour group visited site; jaw bone @ C *Temps measured using new Fluke meter; oxygen levels - Demista
4/12
/200
2
944
BF 30 59.5
152.
3
153.
8
160.
4
162.
7
-
166.
5
4 4 6 4 2 3
Pile still smells; thermocouple E not working: *Temps measured using new Fluke meter; oxygen levels - Demista
4/13
/200
2
820
RAR 31 56.1
158.
6
160.
5
164.
9
167.
8
139.
5
173.
3
4 4 5 4 4 3
Weather: raining; some odor; repaired thermocouple E *Temps measured using new Fluke meter; oxygen levels - Demista
4/14
/200
2
844
RAR 32 49.5
161.
6
161.
9
163.
5
162.
7
152.
2
171.
9- - - - - -
Weather: sunny; no vectors; odor on East end *Temps measured using new Fluke meter; oxygen levels - not collected
4/15
/200
2
1415
AD 33 50.9
164.
3
163.
5
165.
5
164.
8
157.
7
173.
9
8 6 5 11 6 120
Weather: sunny with showers; steam at west end of pile; no vectors; some odor; smalll gnats at east end and rare beetle; no leachate *Temps measured using new Fluke meter; oxygen levels - not collected
4/16
/200
2
955
RAR 34 45.6
165.
4
163
164.
5
159.
2
158.
9
170.
9
6 6 9 8 6 12
Weather: cold wind; no steam; some odor *Temps measured using new Fluke meter; oxygen levels - Demista
4/17
/200
2
1344 BF 35 51.4
167.
1
164.
3
165.
5
165.
3
162.
1
173.
5
9 14 18 14 9 9Less than 8 oz of leachate in bucket; no odor; some steam *Temps measured using new Fluke meter; oxygen levels - Demista
Supplies running low? - Contact Stacey Servo - Tt at 206.728.9655 ext 124
Equipment not operating correctly? - Ask Jack Hoeck for assistance, if not available contact Stacey Servo

Period 2 - Field Monitoring Form - OR DEQ Food Waste Composting Study Pile ID: PAW Point A: Five feet from west end of pile Point D: Middle of east end of pilePhase: Composting & Curing Point B: Middle of pile north side Point E: Core of pile
Point C: Five feet from east end of pile Point F: Directly Over Aeration Pipe
Date Time ID Process Ambient Pile Temperatures Pile Oxygen Levels Notes(initials) Day Temp A B C D E F A B C D E F (odor, weather, pests & access, visible steam/food waste)
4/18
/200
2
1522
TM 36 55.2
160.
8
161.
9
165.
3
165.
9
165.
5
174.
6
19 18 19 17 19 19
Weather: overcast & sunny; no precip; cold breeze; microbial compost samples sent to BAL (FedEx by 1511); found shed unlocked; no skull or jaw bones found, but a few leg bones; need face masks - will pick up; smells like stinky compost - odor a bit better this week *Temps measured using new Fluke meter; oxygen levels - Demista
4/19
/200
2
1410 BF 37 54.1
160.
7
158.
7
163.
5
166.
8
169.
2
- 9 7 15 5 13 9
Weather: partly cloudy; no odors; thermocouple F not working *Temps measured using new Fluke meter; oxygen levels - Demista
4/20
/200
2
610
RD
W
38 45.2
160.
3
157.
5
161.
7
165.
9
165.
1
- - - - - - -
Weather: overcast, light wind; some odor; thermocouple F not working *Temps measured using new Fluke meter; oxygen levels - not collected
4/21
/200
2
1415
RD
W
39 45.2
157.
3
158.
1
164.
5
165.
8
169.
2- - - - - - -
Weather: clear & sunny, some wind; no odor; thermocouple F not working *Temps measured using new Fluke meter; oxygen levels - not collected
4/22
/200
2
1345
AD 40 61
160.
1
157.
8
164.
4
165.
1
170.
1
- 1 - - - - -
Weather: sunny; no odor; Thermocouple F not working; Demista clogged *Temps measured using new Fluke meter; oxygen levels - not collected
4/23
/200
2
914
RAR 41 50.3
155.
7
154
162.
7
162.
9
167.
2
166.
3
6 10 5 3 5 8
Weather: sunny, light breeze; no odor *Temps measured using new Fluke meter; oxygen levels - Demista
4/24
/200
2
1015 BF 42 50.4
151.
4
147.
7
160.
7
161.
5
168.
6
167.
6
13 13 2 1 3 12Weather: sunny; no odor; no leachate in bucket *Temps measured using new Fluke meter; oxygen levels - Demista
Supplies running low? - Contact Stacey Servo - Tt at 206.728.9655 ext 124
Equipment not operating correctly? - Ask Jack Hoeck for assistance, if not available contact Stacey Servo

Period 2 - Field Monitoring Form - OR DEQ Food Waste Composting Study Pile ID: PAW Point A: Five feet from west end of pile Point D: Middle of east end of pilePhase: Composting & Curing Point B: Middle of pile north side Point E: Core of pile
Point C: Five feet from east end of pile Point F: Directly Over Aeration Pipe
Date Time ID Process Ambient Pile Temperatures Pile Oxygen Levels Notes(initials) Day Temp A B C D E F A B C D E F (odor, weather, pests & access, visible steam/food waste)
4/25
/200
2
1500
TM 43 66.7
152.
1
147.
5
162.
1
162.
7
169.
6
163.
8
3 9 9 5 10 5
Weather: sunny, no clouds; no leachate samples available - buckets dry; microbial compost samples sent to BAL - delivered by Cindy; repaired thermocouples E & F; typical compost odor; stability samples to OSU *Temps measured using new Fluke meter; oxygen levels - Demista
4/26
/200
2
- - 44 - - - - - - - - - - - - - no data collected
4/27
/200
2
940
RAR 45 50.9
162.
6
159.
4
170.
4
166.
9
177.
5
174 2 14 4 5 3 5
Weather: cloudy, no rain at time; no odor *Temps measured using new Fluke meter; oxygen levels - Demista
4/28
/200
2
755
RAR 46 49.1
162.
3
151.
3
154.
9
158.
8
169.
3
169.
8
- - - - - -Weather: sunny; lots of steam; no odor *Temps measured using new Fluke meter; oxygen levels - Demista
4/29
/200
2
1515
AD 47 70.1
157.
7
150.
8
157.
6
161
170
171.
8
1 11 2 2 5 4
Weather: hot & sunny; no odor *Temps measured using new Fluke meter; oxygen levels - Demista
4/30
/200
2
1445
RAR 48 61.2
159.
1
148
156.
8
159.
8
167.
1
169.
7
5 8 5 5 6 9
Weather: cloudy, no rain; no odor *Temps measured using new Fluke meter; oxygen levels - Demista
5/1/
2002
1320
TM 49 69.5
162.
7
143.
7
157.
0
159.
0
167.
8
171.
4
6 11 11 7 12 9
Weather: overcast & warm; microbial samples sent to BAL (FedEx by 1507); no leachate samples available - buckets dry; no odor; few flies; found worm at C *Temps measured using new Fluke meter; oxygen levels - Demista
Supplies running low? - Contact Stacey Servo - Tt at 206.728.9655 ext 124
Equipment not operating correctly? - Ask Jack Hoeck for assistance, if not available contact Stacey Servo

Period 2 - Field Monitoring Form - OR DEQ Food Waste Composting Study Pile ID: PAW Point A: Five feet from west end of pile Point D: Middle of east end of pilePhase: Composting & Curing Point B: Middle of pile north side Point E: Core of pile
Point C: Five feet from east end of pile Point F: Directly Over Aeration Pipe
Date Time ID Process Ambient Pile Temperatures Pile Oxygen Levels Notes(initials) Day Temp A B C D E F A B C D E F (odor, weather, pests & access, visible steam/food waste)
5/2/
2002
1335 BF 50 58.7
160.
9
147.
0
155.
2
158.
4
166.
9
169.
9
9 15 14 6 15 10
Weather cloudy; outside dry *Temps measured using new Fluke meter; oxygen levels - Demista
5/3/
2002
1414 BF 51 62.5
161.
3
145.
0
155.
0
158.
9
169.
4
172.
6
17 17 16 7 18 16
*Temps measured using new Fluke meter; oxygen levels - Demista
5/4/
2002
1600
RW 52 66.4
156.
5
141.
2
154.
3
158.
3
166.
7
170.
5
- - - - - -Weather: clear, some wind; some odor *Temps measured using new Fluke meter; oxygen levels - not collected
5/5/
2002
832
RAR 53 50.6
156.
6
140.
5
151.
9
156.
4
165.
2
168.
4
6 8 6 6 7 11
Weather: cloudy and windy; no odor *Temps measured using new Fluke meter; oxygen levels - Demista
5/6/
2002
1435
AD 54 51.2
155.
8
140.
5
151.
0
153.
6
166.
6
169.
9
- - - - - -Weather: cool and windy; no time to take O2 measurements *Temps measured using new Fluke meter; oxygen levels - not collected
5/7/
2002
1400
RAR 55 64.1
153.
7
158.
3
151.
0
154.
8
167.
4
170.
0
17 15 12 4 16 16
Weather: sunny, occational breeze; no odor *Temps measured using new Fluke meter; oxygen levels - Demista
5/8/
2002
1332 BF 56 63.9
151.
7
138.
0
150.
7
153.
5
166.
7
170.
7
18 19 18 11 19 18No leachate; Biofilter sprinkler watering small portion of pile *Temps measured using new Fluke meter; oxygen levels - Demista
Supplies running low? - Contact Stacey Servo - Tt at 206.728.9655 ext 124
Equipment not operating correctly? - Ask Jack Hoeck for assistance, if not available contact Stacey Servo

Period 2 - Field Monitoring Form - OR DEQ Food Waste Composting Study Pile ID: PAW Point A: Five feet from west end of pile Point D: Middle of east end of pilePhase: Composting & Curing Point B: Middle of pile north side Point E: Core of pile
Point C: Five feet from east end of pile Point F: Directly Over Aeration Pipe
Date Time ID Process Ambient Pile Temperatures Pile Oxygen Levels Notes(initials) Day Temp A B C D E F A B C D E F (odor, weather, pests & access, visible steam/food waste)
5/9/
2002
14:3
0
TM 57 59.1
151.
0
132.
7
148.
9
152.
5
163.
3
166.
2
10 11 16 10 10 9
Weather: cloudy; microbial compost samples sent to BAL (FedEx by 14:30; no leachate available for sample; sprinkler hitting edge of PAW; few bones on exterior of piles; *Temps measured using new Fluke meter; oxygen levels - Demista
5/20
/200
2
1315
TM 68 68.3
153.
5
137.
2
150.
9
151.
9
161.
9
166.
8
14 13 15 8 13 14
Weather: 13:15- cloudy with cool breeze, 15:24 - dark clouds, lightening, wind, and hard rain; repaired thermocouple E; worms at location C; sweet compost smell; few bones; white ashy material suggestive of actinomycetes present in later weeks of Phase I and II, especially closer to bottom of pile *Temps measured using new Fluke meter; oxygen levels - Demista
6/6/
2002
13:5
0
TM 85 67.7
144.
5
131.
0
149.
6
148.
2
161.
5
162.
7
20 20 20 16 20 20
Weather: warm, windy; stability samples collected; repaired thermocouple E twice; few bones - jaw and ends of leg bones, mostly on surface of pile; plastic and carboard contamination becoming more of an issue in sampling; earthworm at location B; *Temps measured using new Fluke meter; oxygen levels - Demista
6/19
/200
2
1830
TM 98 71.3
142.
1
129.
3
144.
4
146.
1
149.
2
151.
9
19 20 18 16 17 19
Weather: warm, sunny, breezy; samples collected on June 20, 2002 0600 - 1000; microbial compost samples sent to BAL; character samples sent to Soil Control Lab; stability samples sent to OSU; project supplies sent to Tetra Tech, Inc. *Temps measured using new Fluke meter; oxygen levels - Demista
Supplies running low? - Contact Stacey Servo - Tt at 206.728.9655 ext 124
Equipment not operating correctly? - Ask Jack Hoeck for assistance, if not available contact Stacey Servo
APPENDIX C
Field Monitoring Temperature Data

PAGE INTENTIONALLY LEFT BLANK

Period 1 - Limited Turn Windrow Daily Temperatures (C)
Temp (C)Process Day A B C D Average Min Max
1 26.9 20.0 23.9 23.9 23.7 20.0 26.92 36.7 22.1 27.9 24.7 27.8 22.1 36.73 48.3 28.0 33.8 27.8 34.5 27.8 48.34 53.7 40.3 33.7 39.1 41.7 33.7 53.75 54.8 43.9 42.0 36.6 44.3 36.6 54.86 56.2 45.4 44.3 37.6 PFRP >55oC 45.9 37.6 56.27 57.8 47.1 46.2 39.7 47.7 39.7 57.88 63.1 57.7 53.0 46.1 55.0 46.1 63.19 67.6 59.4 53.7 46.4 56.8 46.4 67.6
10 63.3 50.6 48.3 48.9 52.8 48.3 63.311 45.6 50.0 47.8 38.9 45.6 38.9 50.012 71.9 65.4 58.1 53.6 62.3 53.6 71.913 74.2 73.8 63.9 60.3 Turned Windrow 68.1 60.3 74.214 53.2 47.1 51.9 47.4 49.9 47.1 53.215 65.7 57.4 64.1 55.8 60.8 55.8 65.716 68.9 70.2 73.9 68.9 70.5 68.9 73.917 67.2 72.8 75.0 73.3 72.1 67.2 75.018 61.7 53.9 55.0 56.1 56.7 53.9 61.719 62.2 62.2 67.8 61.1 63.3 61.1 67.820 63.3 68.9 60.6 56.7 Turned Windrow 62.4 56.7 68.921 51.0 59.1 60.8 58.2 57.3 51.0 60.822 53.8 59.2 59.4 54.9 56.8 53.8 59.423 59.7 65.5 64.5 64.3 63.5 59.7 65.524 60.7 65.7 65.2 64.7 64.1 60.7 65.725 65.8 70.6 71.2 70.8 69.6 65.8 71.226 66.2 71.4 72.1 71.9 Turned Windrow 70.4 66.2 72.128 68.4 65.7 59.2 52.1 61.3 52.1 68.429 67.8 67.3 60.3 57.8 63.3 57.8 67.830 66.0 69.4 62.4 65.8 65.9 62.4 69.431 65.3 70.7 65.9 69.4 67.8 65.3 70.732 62.7 70.5 67.9 69.7 67.7 62.7 70.533 73.2 74.1 80.9 74.1 Turned Windrow 75.6 73.2 80.934 60.3 70.1 69.1 68.9 67.1 60.3 70.135 69.3 63.5 64.2 63.3 65.1 63.3 69.336 71.8 66.9 65.4 61.9 66.5 61.9 71.837 69.5 71.6 66.1 63.9 67.8 63.9 71.639 69.1 72.7 69.2 65.6 69.1 65.6 72.741 63.3 72.8 68.6 66.3 Turned Windrow 67.8 63.3 72.842 55.8 57.5 62.9 59.7 59.0 55.8 62.943 67.1 68.8 67.6 65.5 67.3 65.5 68.844 70.3 72.3 68.4 68.7 69.9 68.4 72.345 68.2 74.8 71.3 72.8 71.8 68.2 74.847 65.4 74.1 72.2 73.2 71.2 65.4 74.148 63.6 71.1 71.1 72.1 Turned Windrow 69.5 63.6 72.149 56.8 65.6 61.9 52.4 59.2 52.4 65.650 58.3 71.3 67.3 61.7 64.6 58.3 71.351 60.1 73.6 72.7 67.9 68.6 60.1 73.653 61.2 72.8 71.9 75.8 70.4 61.2 75.854 58.8 69.9 68.2 69.8 66.7 58.8 69.955 57.0 67.2 64.9 67.8 Turned Windrow 64.2 57.0 67.856 40.1 61.5 58.3 54.5 53.6 40.1 61.557 46.3 61.3 62.1 57.9 56.9 46.3 62.170 51.6 52.6 59.3 61.8 56.3 51.6 61.884 49.4 51.5 53.7 55.4 52.5 49.4 55.498 46.5 50.3 48.6 50.6 49.0 46.5 50.6

Period 1 - Passive Aerated Windrow Daily Temperatures (C)
Temp (C)Process Day A B C D Average Min Max
1 23.6 30.2 26.3 30.0 27.5 23.6 30.22 27.2 41.9 44.8 41.9 38.9 27.2 44.83 38.0 56.1 63.3 58.6 PFRP >55oC 54.0 38.0 63.34 48.7 64.9 67.4 66.3 61.8 48.7 67.45 53.6 66.6 69.2 70.3 64.9 53.6 70.36 56.8 68.1 70.4 68.3 65.9 56.8 70.47 58.3 69.7 72.0 78.1 69.5 58.3 78.18 64.6 75.7 78.0 76.3 73.6 64.6 78.09 67.1 74.7 74.1 73.3 72.3 67.1 74.7
10 67.8 72.2 66.7 66.7 68.3 66.7 72.211 53.3 55.6 57.8 62.2 57.2 53.3 62.212 65.8 69.7 72.4 69.6 69.4 65.8 72.413 69.4 75.3 76.2 72.8 73.4 69.4 76.214 68.8 72.6 74.2 69.0 71.1 68.8 74.215 67.8 80.3 79.3 76.8 76.1 67.8 80.316 71.4 76.9 72.8 72.2 73.3 71.4 76.917 71.1 76.7 74.4 72.2 73.6 71.1 76.718 61.1 67.8 74.4 72.8 69.0 61.1 74.419 63.3 67.8 61.1 61.7 63.5 61.1 67.820 62.2 67.8 61.1 65.6 64.2 61.1 67.821 76.6 79.0 75.4 81.4 78.1 75.4 81.422 69.4 70.6 67.4 62.2 67.4 62.2 70.623 70.1 70.6 67.2 63.1 67.7 63.1 70.624 69.4 70.1 66.6 62.2 67.1 62.2 70.125 69.3 69.9 66.1 57.6 65.7 57.6 69.926 69.8 70.1 65.6 58.7 Turned Windrow 66.1 58.7 70.128 69.9 71.6 72.3 71.2 71.3 69.9 72.329 70.3 72.2 72.9 72.1 71.9 70.3 72.930 69.5 71.2 72.2 70.6 70.8 69.5 72.231 70.6 71.1 71.2 71.8 71.2 70.6 71.832 70.2 69.4 70.7 69.9 70.0 69.4 70.733 70.4 70.1 70.4 68.9 70.0 68.9 70.434 69.7 69.7 70.1 68.6 69.5 68.6 70.135 68.4 69.9 69.9 67.5 68.9 67.5 69.936 68.7 70.8 70.7 70.9 70.3 68.7 70.937 68.8 71.2 70.3 66.7 69.3 66.7 71.239 72.2 74.7 72.7 66.3 71.5 66.3 74.741 66.9 71.8 70.1 63.4 68.1 63.4 71.842 66.7 71.8 69.7 62.6 67.7 62.6 71.843 65.9 71.6 68.8 61.5 67.0 61.5 71.644 64.1 70.4 67.8 62.6 66.2 62.6 70.445 64.4 71.1 67.6 61.8 66.2 61.8 71.147 63.3 69.6 67.3 62.9 65.8 62.9 69.648 69.2 68.8 66.0 61.7 66.4 61.7 69.249 61.8 68.9 65.6 61.6 64.5 61.6 68.950 61.6 69.5 65.6 60.7 64.4 60.7 69.551 61.8 70.2 65.3 59.8 64.3 59.8 70.253 60.4 69.3 64.7 65.3 64.9 60.4 69.354 56.5 69.4 63.8 52.1 60.4 52.1 69.455 57.3 66.4 62.6 50.3 59.1 50.3 66.456 57.7 66.6 61.8 51.1 59.3 51.1 66.657 57.5 67.4 61.4 52.3 59.7 52.3 67.470 55.2 67.3 57.7 52.8 58.3 52.8 67.384 51.8 64.6 53.4 56.6 51.8 64.698 49.7 60.7 49.4 47.6 51.9 47.6 60.7
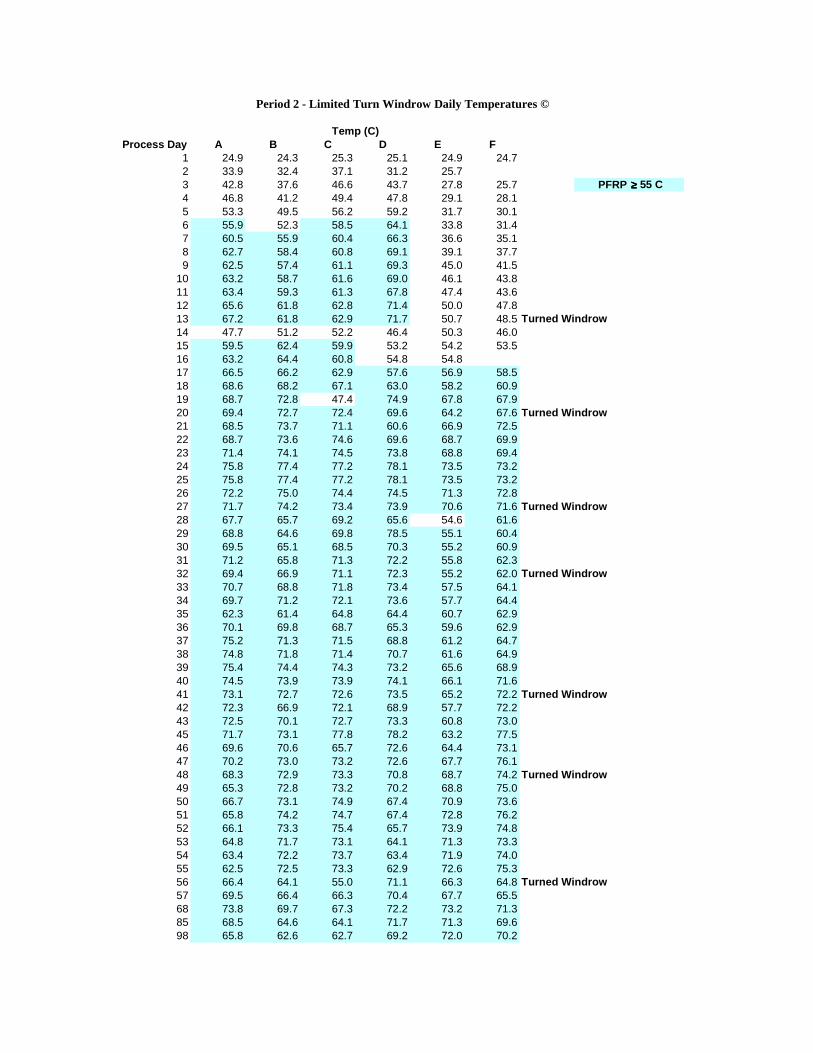
Period 2 - Limited Turn Windrow Daily Temperatures ©
Temp (C)Process Day A B C D E F
1 24.9 24.3 25.3 25.1 24.9 24.72 33.9 32.4 37.1 31.2 25.73 42.8 37.6 46.6 43.7 27.8 25.7 PFRP ≥ ≥ ≥ ≥ 55 C4 46.8 41.2 49.4 47.8 29.1 28.15 53.3 49.5 56.2 59.2 31.7 30.16 55.9 52.3 58.5 64.1 33.8 31.47 60.5 55.9 60.4 66.3 36.6 35.18 62.7 58.4 60.8 69.1 39.1 37.79 62.5 57.4 61.1 69.3 45.0 41.5
10 63.2 58.7 61.6 69.0 46.1 43.811 63.4 59.3 61.3 67.8 47.4 43.612 65.6 61.8 62.8 71.4 50.0 47.813 67.2 61.8 62.9 71.7 50.7 48.5 Turned Windrow14 47.7 51.2 52.2 46.4 50.3 46.015 59.5 62.4 59.9 53.2 54.2 53.516 63.2 64.4 60.8 54.8 54.817 66.5 66.2 62.9 57.6 56.9 58.518 68.6 68.2 67.1 63.0 58.2 60.919 68.7 72.8 47.4 74.9 67.8 67.920 69.4 72.7 72.4 69.6 64.2 67.6 Turned Windrow21 68.5 73.7 71.1 60.6 66.9 72.522 68.7 73.6 74.6 69.6 68.7 69.923 71.4 74.1 74.5 73.8 68.8 69.424 75.8 77.4 77.2 78.1 73.5 73.225 75.8 77.4 77.2 78.1 73.5 73.226 72.2 75.0 74.4 74.5 71.3 72.827 71.7 74.2 73.4 73.9 70.6 71.6 Turned Windrow28 67.7 65.7 69.2 65.6 54.6 61.629 68.8 64.6 69.8 78.5 55.1 60.430 69.5 65.1 68.5 70.3 55.2 60.931 71.2 65.8 71.3 72.2 55.8 62.332 69.4 66.9 71.1 72.3 55.2 62.0 Turned Windrow33 70.7 68.8 71.8 73.4 57.5 64.134 69.7 71.2 72.1 73.6 57.7 64.435 62.3 61.4 64.8 64.4 60.7 62.936 70.1 69.8 68.7 65.3 59.6 62.937 75.2 71.3 71.5 68.8 61.2 64.738 74.8 71.8 71.4 70.7 61.6 64.939 75.4 74.4 74.3 73.2 65.6 68.940 74.5 73.9 73.9 74.1 66.1 71.641 73.1 72.7 72.6 73.5 65.2 72.2 Turned Windrow42 72.3 66.9 72.1 68.9 57.7 72.243 72.5 70.1 72.7 73.3 60.8 73.045 71.7 73.1 77.8 78.2 63.2 77.546 69.6 70.6 65.7 72.6 64.4 73.147 70.2 73.0 73.2 72.6 67.7 76.148 68.3 72.9 73.3 70.8 68.7 74.2 Turned Windrow49 65.3 72.8 73.2 70.2 68.8 75.050 66.7 73.1 74.9 67.4 70.9 73.651 65.8 74.2 74.7 67.4 72.8 76.252 66.1 73.3 75.4 65.7 73.9 74.853 64.8 71.7 73.1 64.1 71.3 73.354 63.4 72.2 73.7 63.4 71.9 74.055 62.5 72.5 73.3 62.9 72.6 75.356 66.4 64.1 55.0 71.1 66.3 64.8 Turned Windrow57 69.5 66.4 66.3 70.4 67.7 65.568 73.8 69.7 67.3 72.2 73.2 71.385 68.5 64.6 64.1 71.7 71.3 69.698 65.8 62.6 62.7 69.2 72.0 70.2
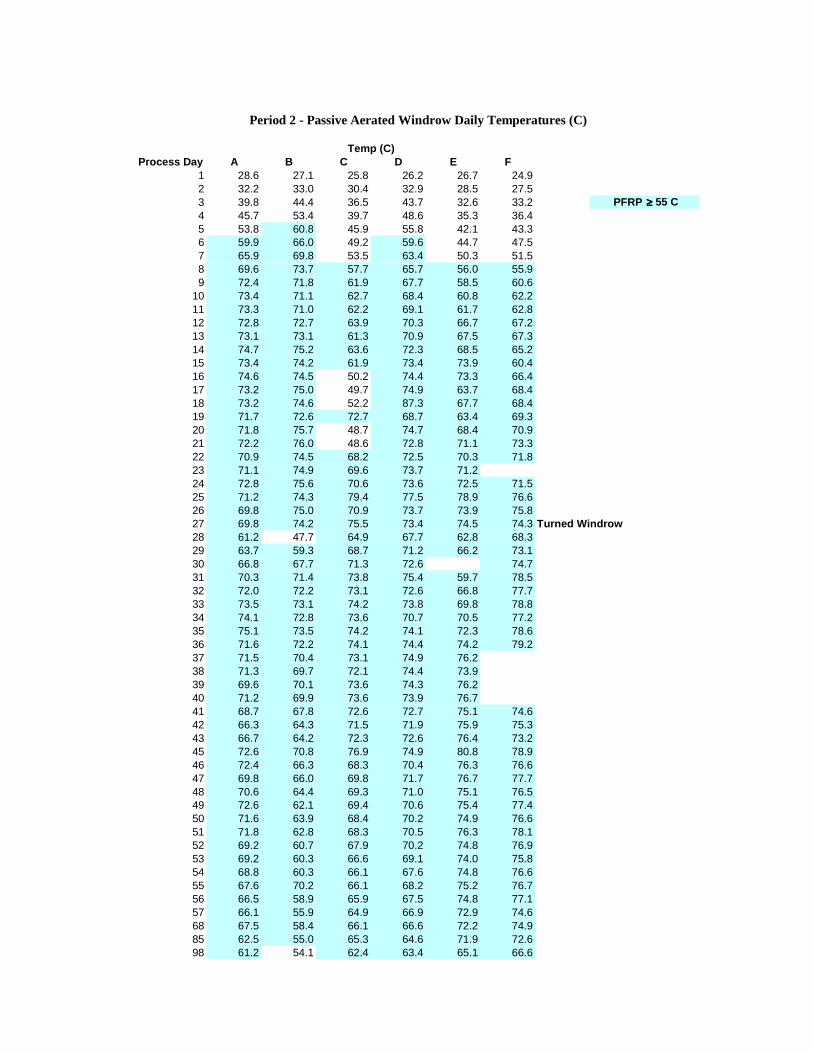
Period 2 - Passive Aerated Windrow Daily Temperatures (C)
Temp (C)Process Day A B C D E F
1 28.6 27.1 25.8 26.2 26.7 24.92 32.2 33.0 30.4 32.9 28.5 27.53 39.8 44.4 36.5 43.7 32.6 33.2 PFRP ≥≥≥≥ 55 C4 45.7 53.4 39.7 48.6 35.3 36.45 53.8 60.8 45.9 55.8 42.1 43.36 59.9 66.0 49.2 59.6 44.7 47.57 65.9 69.8 53.5 63.4 50.3 51.58 69.6 73.7 57.7 65.7 56.0 55.99 72.4 71.8 61.9 67.7 58.5 60.6
10 73.4 71.1 62.7 68.4 60.8 62.211 73.3 71.0 62.2 69.1 61.7 62.812 72.8 72.7 63.9 70.3 66.7 67.213 73.1 73.1 61.3 70.9 67.5 67.314 74.7 75.2 63.6 72.3 68.5 65.215 73.4 74.2 61.9 73.4 73.9 60.416 74.6 74.5 50.2 74.4 73.3 66.417 73.2 75.0 49.7 74.9 63.7 68.418 73.2 74.6 52.2 87.3 67.7 68.419 71.7 72.6 72.7 68.7 63.4 69.320 71.8 75.7 48.7 74.7 68.4 70.921 72.2 76.0 48.6 72.8 71.1 73.322 70.9 74.5 68.2 72.5 70.3 71.823 71.1 74.9 69.6 73.7 71.224 72.8 75.6 70.6 73.6 72.5 71.525 71.2 74.3 79.4 77.5 78.9 76.626 69.8 75.0 70.9 73.7 73.9 75.827 69.8 74.2 75.5 73.4 74.5 74.3 Turned Windrow28 61.2 47.7 64.9 67.7 62.8 68.329 63.7 59.3 68.7 71.2 66.2 73.130 66.8 67.7 71.3 72.6 74.731 70.3 71.4 73.8 75.4 59.7 78.532 72.0 72.2 73.1 72.6 66.8 77.733 73.5 73.1 74.2 73.8 69.8 78.834 74.1 72.8 73.6 70.7 70.5 77.235 75.1 73.5 74.2 74.1 72.3 78.636 71.6 72.2 74.1 74.4 74.2 79.237 71.5 70.4 73.1 74.9 76.238 71.3 69.7 72.1 74.4 73.939 69.6 70.1 73.6 74.3 76.240 71.2 69.9 73.6 73.9 76.741 68.7 67.8 72.6 72.7 75.1 74.642 66.3 64.3 71.5 71.9 75.9 75.343 66.7 64.2 72.3 72.6 76.4 73.245 72.6 70.8 76.9 74.9 80.8 78.946 72.4 66.3 68.3 70.4 76.3 76.647 69.8 66.0 69.8 71.7 76.7 77.748 70.6 64.4 69.3 71.0 75.1 76.549 72.6 62.1 69.4 70.6 75.4 77.450 71.6 63.9 68.4 70.2 74.9 76.651 71.8 62.8 68.3 70.5 76.3 78.152 69.2 60.7 67.9 70.2 74.8 76.953 69.2 60.3 66.6 69.1 74.0 75.854 68.8 60.3 66.1 67.6 74.8 76.655 67.6 70.2 66.1 68.2 75.2 76.756 66.5 58.9 65.9 67.5 74.8 77.157 66.1 55.9 64.9 66.9 72.9 74.668 67.5 58.4 66.1 66.6 72.2 74.985 62.5 55.0 65.3 64.6 71.9 72.698 61.2 54.1 62.4 63.4 65.1 66.6
APPENDIX D
Field Monitoring Oxygen Data

PAGE INTENTIONALLY LEFT BLANK
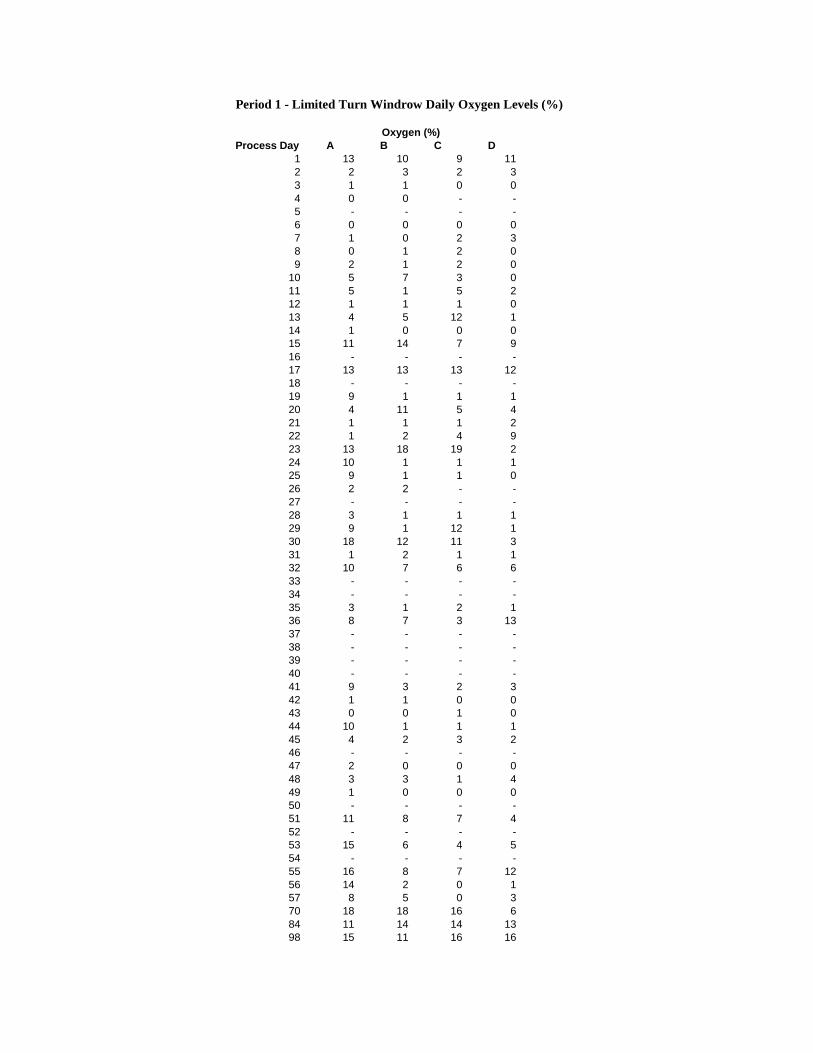
Period 1 - Limited Turn Windrow Daily Oxygen Levels (%)
Oxygen (%)Process Day A B C D
1 13 10 9 112 2 3 2 33 1 1 0 04 0 0 - -5 - - - -6 0 0 0 07 1 0 2 38 0 1 2 09 2 1 2 0
10 5 7 3 011 5 1 5 212 1 1 1 013 4 5 12 114 1 0 0 015 11 14 7 916 - - - -17 13 13 13 1218 - - - -19 9 1 1 120 4 11 5 421 1 1 1 222 1 2 4 923 13 18 19 224 10 1 1 125 9 1 1 026 2 2 - -27 - - - -28 3 1 1 129 9 1 12 130 18 12 11 331 1 2 1 132 10 7 6 633 - - - -34 - - - -35 3 1 2 136 8 7 3 1337 - - - -38 - - - -39 - - - -40 - - - -41 9 3 2 342 1 1 0 043 0 0 1 044 10 1 1 145 4 2 3 246 - - - -47 2 0 0 048 3 3 1 449 1 0 0 050 - - - -51 11 8 7 452 - - - -53 15 6 4 554 - - - -55 16 8 7 1256 14 2 0 157 8 5 0 370 18 18 16 684 11 14 14 1398 15 11 16 16
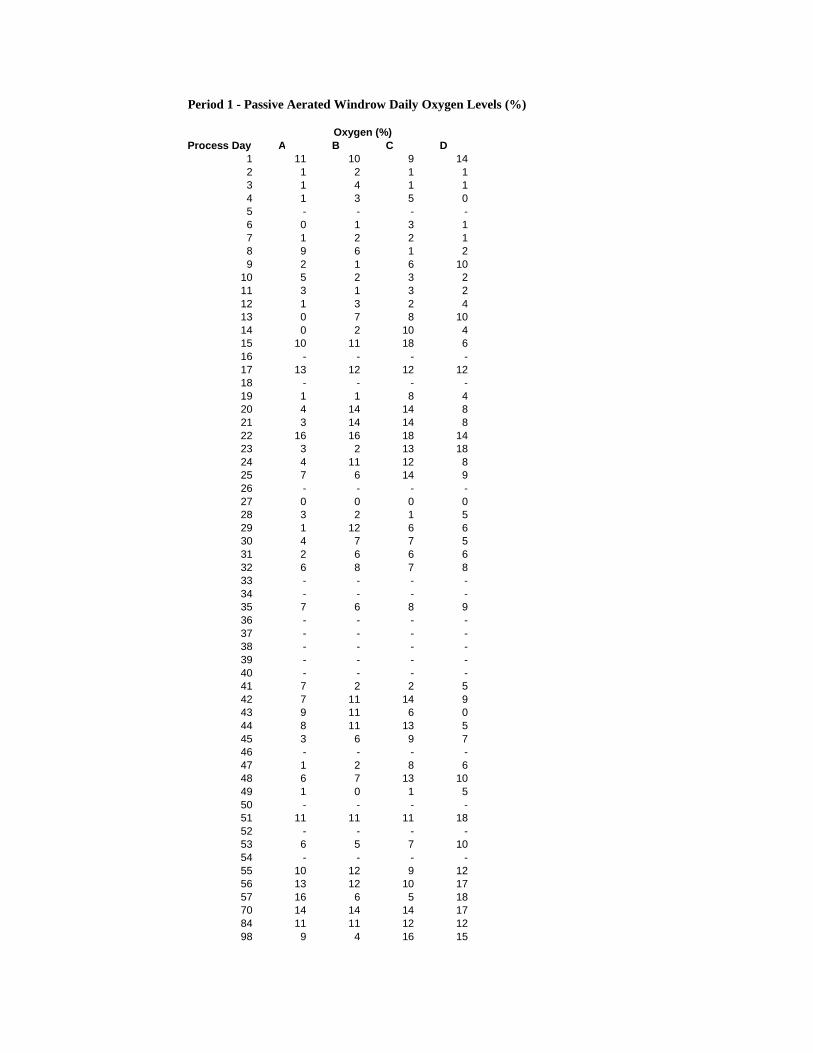
Period 1 - Passive Aerated Windrow Daily Oxygen Levels (%)
Oxygen (%)Process Day A B C D
1 11 10 9 142 1 2 1 13 1 4 1 14 1 3 5 05 - - - -6 0 1 3 17 1 2 2 18 9 6 1 29 2 1 6 10
10 5 2 3 211 3 1 3 212 1 3 2 413 0 7 8 1014 0 2 10 415 10 11 18 616 - - - -17 13 12 12 1218 - - - -19 1 1 8 420 4 14 14 821 3 14 14 822 16 16 18 1423 3 2 13 1824 4 11 12 825 7 6 14 926 - - - -27 0 0 0 028 3 2 1 529 1 12 6 630 4 7 7 531 2 6 6 632 6 8 7 833 - - - -34 - - - -35 7 6 8 936 - - - -37 - - - -38 - - - -39 - - - -40 - - - -41 7 2 2 542 7 11 14 943 9 11 6 044 8 11 13 545 3 6 9 746 - - - -47 1 2 8 648 6 7 13 1049 1 0 1 550 - - - -51 11 11 11 1852 - - - -53 6 5 7 1054 - - - -55 10 12 9 1256 13 12 10 1757 16 6 5 1870 14 14 14 1784 11 11 12 1298 9 4 16 15

Period 1 - Limited Turn Windrow Intensive Oxygen Levels (%)
Heights Locations (ft) 1 2 4 1 2 4 1 2 4 1 2 4
A 1.5** 17 1 1 18 18 17 18 1 1 14 5 33 18 6 0 13 11 7 15 1 1 12 9 106 13 0 1 15 11 10 7 0 1 9 4 3
B 1.5** 19 2 1 18 17 18 17 0 1 14 10 103 19 2 1 20 14 4 15 2 1 7 1 46 19 2 1 16 2 2 4 1 1 14 3 1
C 1.5** 18 1 4 16 8 10 16 4 4 12 0 13 18 1 2 16 7 5 15 4 1 4 12 96 17 0 1 1 1 1 15 3 1 7 0 2
D 1.5** 17 9 2 16 7 5 17 1 1 18 1 33 15 0 0 17 9 4 18 9 1 14 1 26 13 4 0 17 8 5 16 4 3 1 1 3
Heights Locations (ft) 1 2 4 1 2 4 1 2 4 1 2 4
A 1.5 18 14 13 - - - - - - 15 10 93 18 8 6 8 10 2 - - - 12 8 56 19 6 1 - - - - - - 17 7 3
B 1.5 9 3 19 - - - - - - 17 8 23 16 7 2 0 1 0 - - - 17 5 36 14 1 3 - - - - - - 15 6 1
C 1.5 4 10 9 - - - - - - 14 0 23 9 3 17 1 1 0 - - - 17 0 16 1 2 12 - - - - - - 9 0 1
D 1.5 15 15 16 - - - - - - 13 8 63 13 13 14 4 1 1 - - - 17 3 16 13 13 12 - - - - - - 5 0 2
*Oxygen levels measured using Demista oxygen probe**Pile heights for week one measured at 2 foot not 1.5 feet
Process Week 1 Process Week 2 Process Week 3 Process Week 4Pile Oxygen Levels (%)* Pile Oxygen Levels (%)* Pile Oxygen Levels (%)* Pile Oxygen Levels (%)*
Pile Depths (ft) Pile Depths (ft) Pile Depths (ft) Pile Depths (ft)
Process Week 5 Process Week 6 Process Week 7 Process Week 8Pile Oxygen Levels (%)* Pile Oxygen Levels (%)* Pile Oxygen Levels (%)* Pile Oxygen Levels (%)*
Pile Depths (ft) Pile Depths (ft) Pile Depths (ft) Pile Depths (ft)
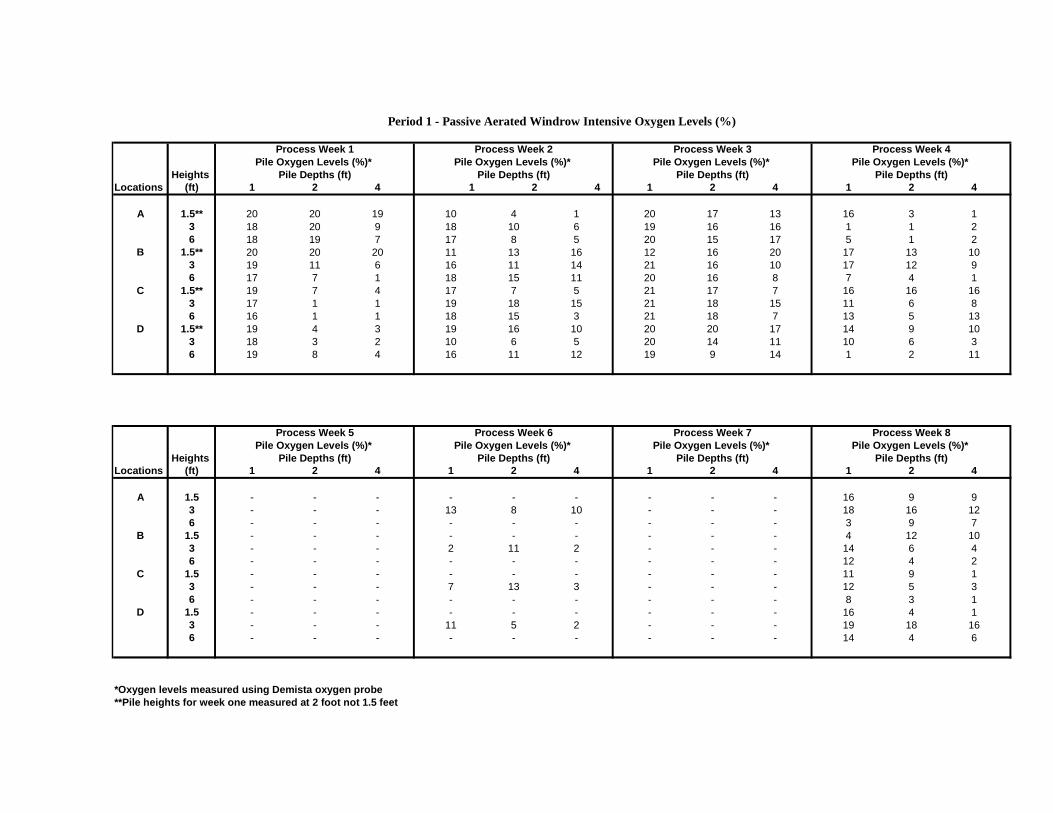
Period 1 - Passive Aerated Windrow Intensive Oxygen Levels (%)
Heights Locations (ft) 1 2 4 1 2 4 1 2 4 1 2 4
A 1.5** 20 20 19 10 4 1 20 17 13 16 3 13 18 20 9 18 10 6 19 16 16 1 1 26 18 19 7 17 8 5 20 15 17 5 1 2
B 1.5** 20 20 20 11 13 16 12 16 20 17 13 103 19 11 6 16 11 14 21 16 10 17 12 96 17 7 1 18 15 11 20 16 8 7 4 1
C 1.5** 19 7 4 17 7 5 21 17 7 16 16 163 17 1 1 19 18 15 21 18 15 11 6 86 16 1 1 18 15 3 21 18 7 13 5 13
D 1.5** 19 4 3 19 16 10 20 20 17 14 9 103 18 3 2 10 6 5 20 14 11 10 6 36 19 8 4 16 11 12 19 9 14 1 2 11
Heights Locations (ft) 1 2 4 1 2 4 1 2 4 1 2 4
A 1.5 - - - - - - - - - 16 9 93 - - - 13 8 10 - - - 18 16 126 - - - - - - - - - 3 9 7
B 1.5 - - - - - - - - - 4 12 103 - - - 2 11 2 - - - 14 6 46 - - - - - - - - - 12 4 2
C 1.5 - - - - - - - - - 11 9 13 - - - 7 13 3 - - - 12 5 36 - - - - - - - - - 8 3 1
D 1.5 - - - - - - - - - 16 4 13 - - - 11 5 2 - - - 19 18 166 - - - - - - - - - 14 4 6
*Oxygen levels measured using Demista oxygen probe**Pile heights for week one measured at 2 foot not 1.5 feet
Process Week 7Pile Oxygen Levels (%)*
Process Week 1 Process Week 2 Process Week 3
Pile Depths (ft) Pile Depths (ft) Pile Depths (ft)
Pile Oxygen Levels (%)*
Process Week 4Pile Oxygen Levels (%)* Pile Oxygen Levels (%)* Pile Oxygen Levels (%)* Pile Oxygen Levels (%)*
Pile Depths (ft)
Pile Depths (ft) Pile Depths (ft)
Process Week 5Pile Oxygen Levels (%)*
Pile Depths (ft) Pile Depths (ft)
Process Week 8Pile Oxygen Levels (%)*
Process Week 6
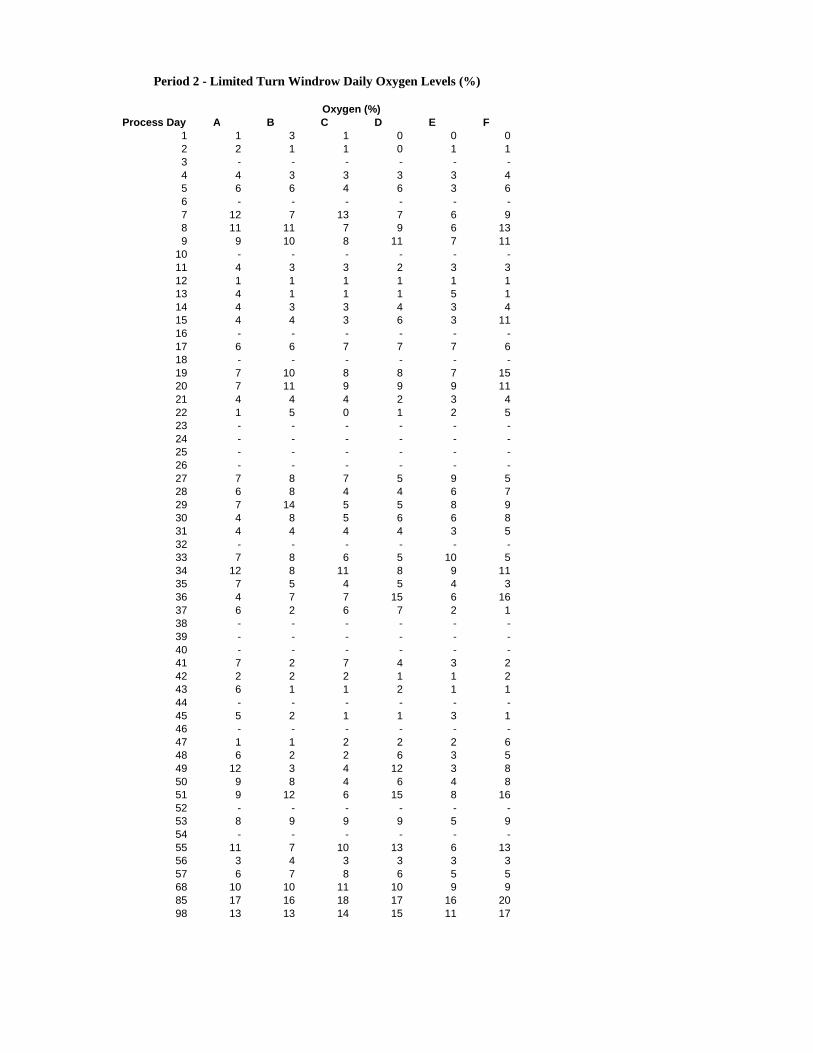
Oxygen (%)Process Day A B C D E F
1 1 3 1 0 0 02 2 1 1 0 1 13 - - - - - -4 4 3 3 3 3 45 6 6 4 6 3 66 - - - - - -7 12 7 13 7 6 98 11 11 7 9 6 139 9 10 8 11 7 11
10 - - - - - -11 4 3 3 2 3 312 1 1 1 1 1 113 4 1 1 1 5 114 4 3 3 4 3 415 4 4 3 6 3 1116 - - - - - -17 6 6 7 7 7 618 - - - - - -19 7 10 8 8 7 1520 7 11 9 9 9 1121 4 4 4 2 3 422 1 5 0 1 2 523 - - - - - -24 - - - - - -25 - - - - - -26 - - - - - -27 7 8 7 5 9 528 6 8 4 4 6 729 7 14 5 5 8 930 4 8 5 6 6 831 4 4 4 4 3 532 - - - - - -33 7 8 6 5 10 534 12 8 11 8 9 1135 7 5 4 5 4 336 4 7 7 15 6 1637 6 2 6 7 2 138 - - - - - -39 - - - - - -40 - - - - - -41 7 2 7 4 3 242 2 2 2 1 1 243 6 1 1 2 1 144 - - - - - -45 5 2 1 1 3 146 - - - - - -47 1 1 2 2 2 648 6 2 2 6 3 549 12 3 4 12 3 850 9 8 4 6 4 851 9 12 6 15 8 1652 - - - - - -53 8 9 9 9 5 954 - - - - - -55 11 7 10 13 6 1356 3 4 3 3 3 357 6 7 8 6 5 568 10 10 11 10 9 985 17 16 18 17 16 2098 13 13 14 15 11 17
Period 2 - Limited Turn Windrow Daily Oxygen Levels (%)

Oxygen (%)Process Day A B C D E F
1 0 0 1 2 1 02 2 0 3 1 1 03 - - - - - -4 2 0 0 5 1 15 7 5 8 11 5 36 - - - - - -7 11 7 7 7 6 58 15 12 12 7 11 89 4 6 8 10 2 12
10 - - - - - -11 5 3 3 5 4 312 7 7 5 5 6 513 - - - - - -14 11 14 9 8 8 515 14 16 12 8 14 1116 - - - - - -17 11 9 8 5 11 918 - - - - - -19 6 8 11 9 7 820 16 15 8 10 15 1721 12 7 11 11 16 1822 14 7 4 7 5 023 - - - - - -24 - - - - - -25 - - - - - -26 - - - - - -27 6 12 5 7 13 1428 8 12 7 6 8 629 10 6 7 16 11 930 4 4 6 4 2 331 4 4 5 4 4 332 - - - - - -33 8 6 5 11 6 12034 6 6 9 8 6 1235 9 14 18 14 9 936 19 18 19 17 19 1937 9 7 15 5 13 938 - - - - - -39 - - - - - -40 1 - - - - -41 6 10 5 3 5 842 13 13 2 1 3 1243 3 9 9 5 10 544 - - - - - -45 2 14 4 5 3 546 - - - - - -47 1 11 2 2 5 448 5 8 5 5 6 949 6 11 11 7 12 950 9 15 14 6 15 1051 17 17 16 7 18 1652 - - - - - -53 6 8 6 6 7 1154 - - - - - -55 17 15 12 4 16 1656 18 19 18 11 19 1857 10 11 16 10 10 968 14 13 15 8 13 1485 20 20 20 16 20 2098 19 20 18 16 17 19
Period 2 - Passive Aerated Windrow Daily Oxygen Levels (%)

APPENDIX E
Daily Weather Data

PAGE INTENTIONALLY LEFT BLANK

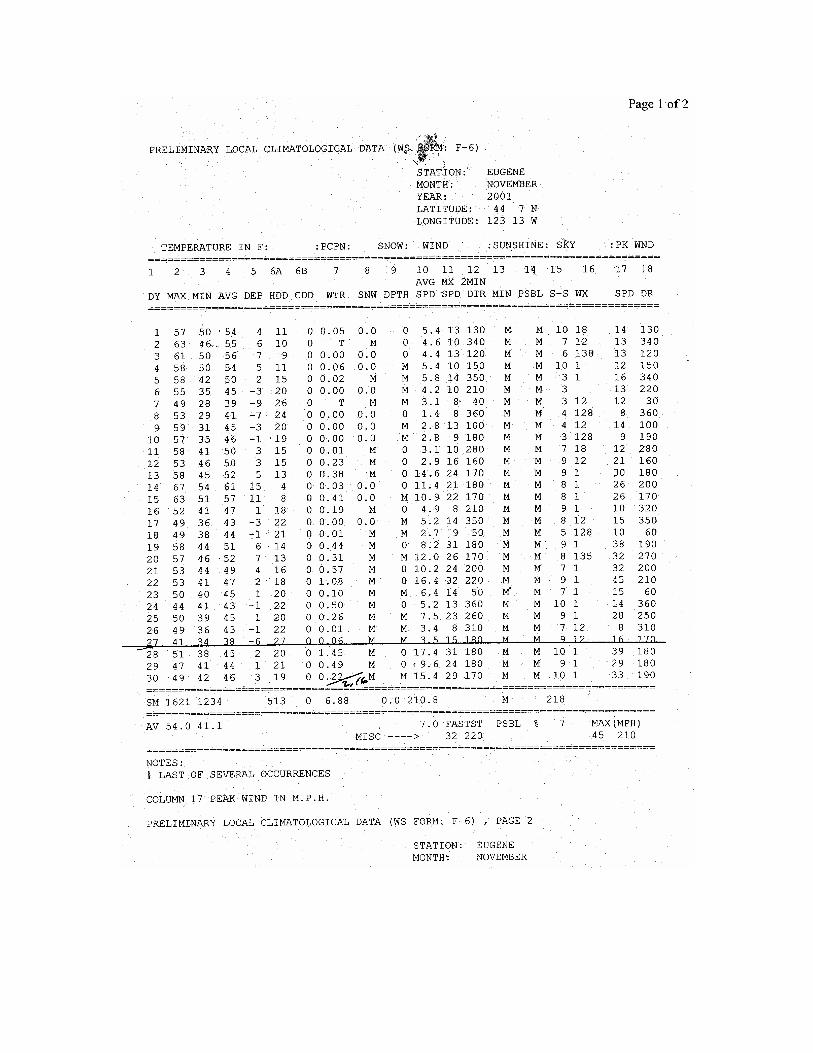


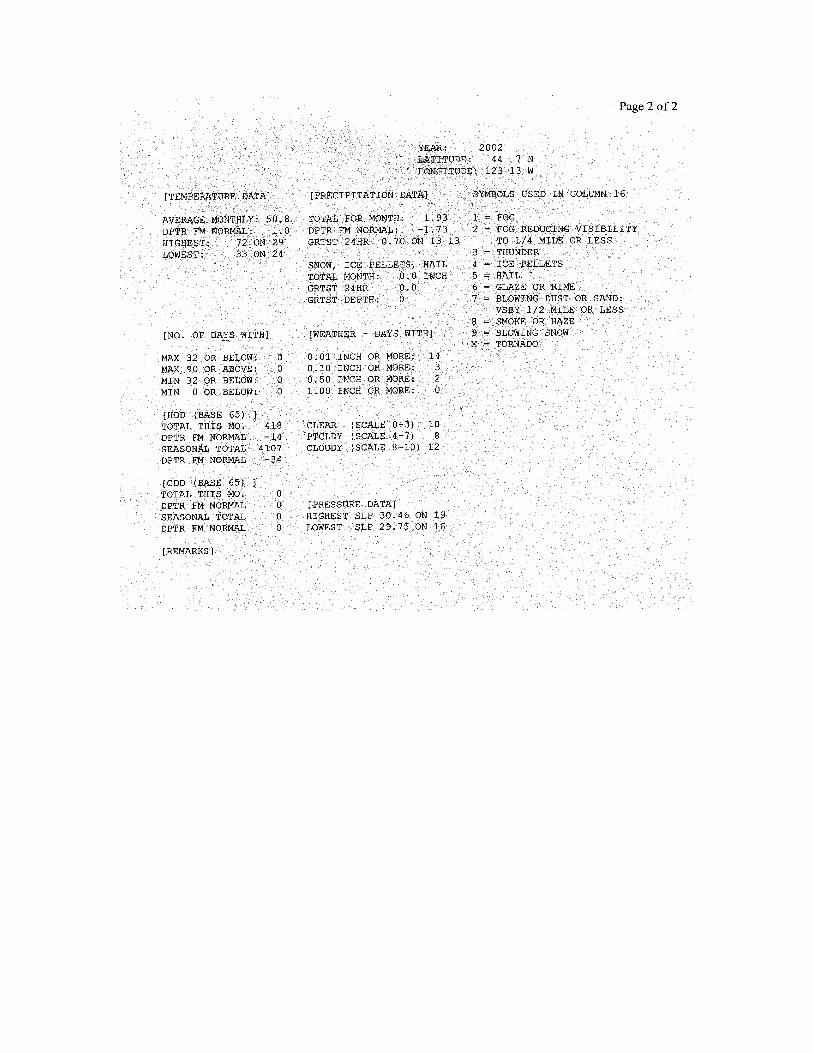

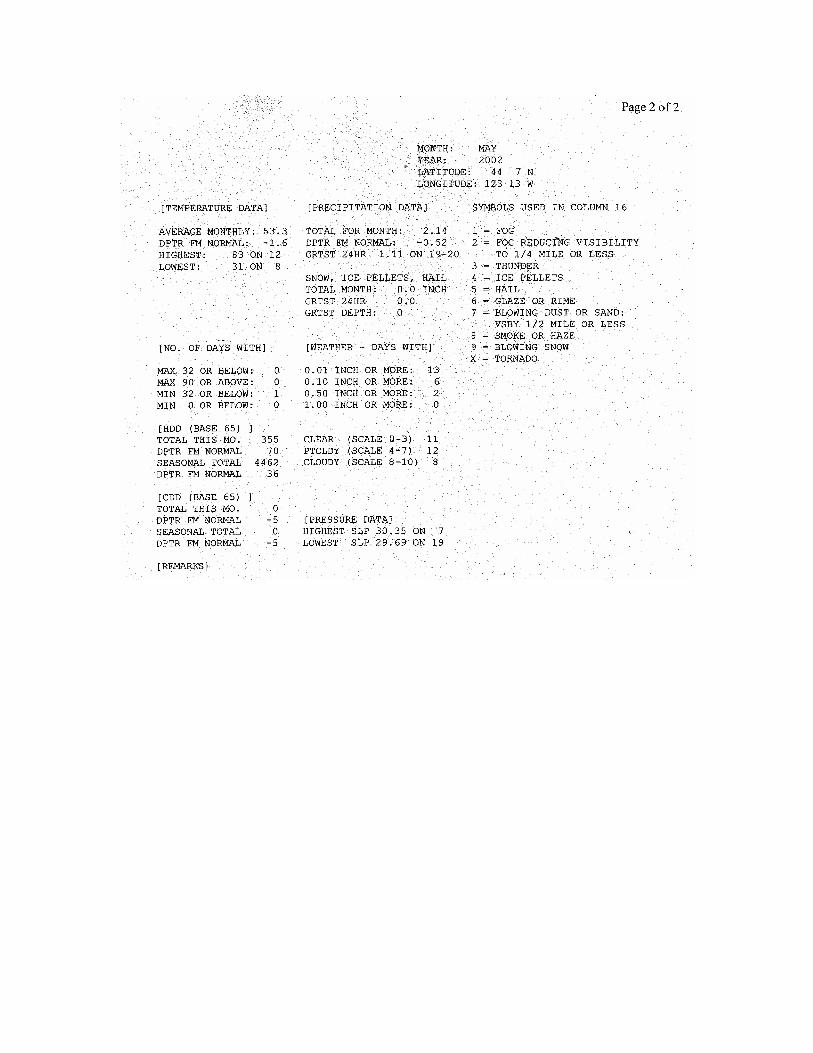


PAGE INTENTIONALLY LEFT BLANK
APPENDIX F
Stability Lab Data

PAGE INTENTIONALLY LEFT BLANK

Period 1 - Stability ResultsOregon State University Dept of Crop and Soil Science
4/1/2002
OSU Pile Total LECO LECO C:N Solvita Solvita Draeger Draeger Alkaline Alkaline Alkaline Draeger DraegerSample ID Date Process week ID Solids C N Ratio CO2 test NH3 test CO2 test CO2 test trap CO2 test trap CO2 test trap CO2 test CO2 test CO2 testNumber 0 to 4 h 0 to 24 h 24 to 48 h 0 to 4 h 0 to 4 h
% % % 1 to 8 scale 1 to 5 scale % CO2 in 4 h % CO2 in 4h mg CO2-C mg CO2-C mg CO2-C mg CO2-C mg CO2-C
not refrigerated refrigerated per g compost C per d per g compost C per d per g compost C per d per g compost C per d per g compost C per d
before analysis not refrigerated not refrigerated not refrigerated not refrigerated refrigerated
before analysis
TM1 28-Nov-01 initial foodwaste 24.5 49.90 1.08 46TM2 28-Nov-01 initial foodwaste 25.3 50.20 1.18 43TM3 28-Nov-01 initial bulking material 28.3 41.60 1.02 41TM4 28-Nov-01 initial bulking material 30.2 39.90 0.81 49TM5 28-Nov-01 initial sawdust 51.6 48.20 0.08 618TM6 28-Nov-01 initial sawdust 46.3 50.20 0.07 745TM7 28-Nov-01 initial food/yard compost mix 28.0 46.80 1.11 42TM8 28-Nov-01 initial food/yard compost mix 28.5 46.20 1.19 39TM9 27-Dec-01 4 TW 36.9 46.82 0.56 84 2.5 5.0 2.5 2.2 2.8 2.3 1.4 3.3 2.9TM10 27-Dec-01 4 TW 36.2 48.17 0.75 64 2.0 5.0 5.6 4.0 7.3 6.2 4.5 7.4 5.3TM11 27-Dec-01 4 TW 35.8 47.14 0.82 57 2.0 5.0 4.3 11.0 5.8 7.7 6.9 5.9 15.1TM12 27-Dec-01 4 TW 36.0 44.08 0.66 67 2.0 5.0 3.6 3.0 5.2 4.3 3.9 5.2 4.3TM13 27-Dec-01 4 PAW 34.1 46.20 0.84 55 2.0 5.0 3.8 4.0 4.5 2.6 2.8 5.5 5.8TM14 27-Dec-01 4 PAW 33.7 44.99 1.37 33 2.0 5.0 5.9 5.3 7.7 5.2 5.1 9.0 8.0TM15 27-Dec-01 4 PAW 34.5 46.06 0.98 47 2.0 5.0 4.6 4.7 5.1 3.0 3.2 6.6 6.8TM16 27-Dec-01 4 PAW 33.0 43.64 1.53 29 1.5 5.0 7.5 6.5 14.7 8.6 6.7 12.0 10.4TM17 10-Jan-02 6 TW 34.5 48.51 0.64 76 3.5 5.0 2.4 2.0 2.0 3.1 2.1 3.3 2.7TM18 10-Jan-02 6 TW 35.0 48.52 0.99 49 3.0 5.0 4.0 5.4 5.6 3.3 3.1 5.4 7.3TM19 10-Jan-02 6 TW 33.9 47.78 0.69 69 3.0 5.0 3.4 3.5 4.5 2.5 2.2 4.8 5.0TM20 10-Jan-02 6 TW 34.3 47.18 0.62 77 3.0 5.0 3.7 4.6 4.8 2.2 2.0 5.3 6.5TM21 10-Jan-02 6 PAW 32.6 46.60 0.86 54 3.0 5.0 4.0 3.9 7.2 3.0 2.4 6.0 5.9TM22 10-Jan-02 6 PAW 33.9 45.48 1.30 35 3.0 5.0 4.4 4.3 5.3 5.4 3.3 6.6 6.4TM23 10-Jan-02 6 PAW 31.8 47.16 1.00 47 3.0 5.0 5.6 3.3 7.2 3.0 2.4 8.6 5.0TM24 10-Jan-02 6 PAW 30.7 47.39 1.01 47 3.0 5.0 5.5 2.5 7.6 2.6 2.7 8.7 3.9TM25 24-Jan-01 8 TW 31.9 47.28 0.73 65 6.5 5.0 1.2 1.3 1.3 1.1 1.7 1.8 1.9TM26 24-Jan-01 8 TW 32.8 47.92 0.62 77 5.5 5.0 1.5 1.8 1.7 1.6 1.7 2.2 2.5TM27 24-Jan-01 8 TW 33.7 47.02 0.73 64 5.5 5.0 1.8 1.4 1.6 1.5 1.4 2.5 2.0TM28 24-Jan-01 8 TW 31.4 48.15 0.77 62 6.0 5.0 1.2 1.2 1.1 1.3 1.4 1.8 1.8TM29 24-Jan-01 8 PAW 30.7 46.74 1.02 46 5.5 5.0 1.7 1.7 1.7 1.8 1.2 2.7 2.7TM30 24-Jan-01 8 PAW 33.5 45.83 1.46 31 3.5 5.0 4.7 3.1 6.5 3.3 2.6 7.0 4.6TM31 24-Jan-01 8 PAW 29.5 46.34 1.13 41 3.0 5.0 3.0 1.8 4.0 1.9 2.8 5.0 3.0TM32 24-Jan-01 8 PAW 30.4 46.49 1.26 37 3.5 5.0 3.2 2.8 3.9 2.6 3.0 5.2 4.5TM45 07-Feb-02 10 TW 29.6 45.6 0.53 86 7.5 5.0 0.5 0.6 0.3 0.4 0.7 0.8 1.0TM46 07-Feb-02 10 TW 29.1 46.4 0.64 73 7.0 5.0 0.5 0.8 0.3 0.9 1.4 0.8 1.3TM47 07-Feb-02 10 TW 28.9 46.4 0.77 60 6.5 5.0 0.7 1.0 0.7 0.8 1.4 1.2 1.7TM48 07-Feb-02 10 TW 28.0 45.5 0.95 48 6.0 5.0 1.0 1.2 0.9 0.9 1.2 1.8 2.1TM49 07-Feb-02 10 PAW 31.6 45.2 1.19 38 5.0 5.0 2.0 1.7 2.5 1.8 2.0 3.2 2.7TM50 07-Feb-02 10 PAW 29.5 46.0 0.73 63 8.0 5.0 0.4 0.5 0.0 0.5 1.0 0.7 0.8TM51 07-Feb-02 10 PAW 25.7 45.0 1.11 41 5.0 5.0 1.8 1.6 2.2 1.6 1.7 3.5 3.1TM52 07-Feb-02 10 PAW 24.5 44.7 1.26 36 6.5 5.0 0.8 1.1 0.8 1.1 1.5 1.6 2.3TM53 21-Feb-02 12 TW 30.8 46.0 0.61 75 8.0 5.0 0.1 0.2 0.1 0.3 0.5 0.2 0.3TM54 21-Feb-02 12 TW 32.4 46.5 0.71 65 8.0 5.0 0.1 0.1 0.1 0.3 0.4 0.2 0.2TM55 21-Feb-02 12 TW 31.5 47.5 0.78 61 8.0 5.0 0.1 0.2 0.1 0.2 0.4 0.2 0.3TM56 21-Feb-02 12 TW 31.6 46.3 0.60 77 8.0 5.0 0.1 0.2 0.1 0.1 0.4 0.2 0.2TM57 21-Feb-02 12 PAW 29.0 45.0 1.26 36 6.5 5.0 0.4 0.3 0.3 0.6 1.1 0.6 0.5TM58 21-Feb-02 12 PAW 33.2 47.8 0.74 65 6.0 5.0 1.3 1.3 0.8 0.9 0.8 1.8 1.8TM59 21-Feb-02 12 PAW 31.4 47.2 0.83 57 5.5 5.0 2.1 1.7 2.0 1.5 1.6 3.2 2.6TM60 21-Feb-02 12 PAW 31.6 46.6 1.01 46 5.5 5.0 1.8 1.8 1.6 1.4 2.1 2.8 2.8TM61 07-Mar-02 14 TW 31.9 47.1 0.74 64 8.0 5.0 0.2 0.1 0.2 0.5 0.4 0.3 0.2TM62 07-Mar-02 14 TW 31.4 45.3 0.73 62 8.0 5.0 0.2 0.2 0.2 0.5 0.6 0.3 0.3TM63 07-Mar-02 14 TW 31.3 45.9 0.80 57 8.0 5.0 0.2 0.2 0.1 0.4 0.6 0.3 0.3TM64 07-Mar-02 14 TW 32.0 46.0 0.79 58 7.0 5.0 1.5 0.3 0.2 0.6 0.6 2.3 0.4TM65 07-Mar-02 14 PAW 31.5 45.7 0.68 67 6.0 5.0 0.4 0.4 0.7 0.8 0.8 0.6 0.6TM66 07-Mar-02 14 PAW 31.0 45.7 1.02 45 6.0 5.0 0.6 1.1 0.7 0.8 1.1 0.9 1.7TM67 07-Mar-02 14 PAW 27.0 42.49 1.37 31 6.0 5.0 1.2 1.7 1.4 1.7 2.2 2.4 3.4TM68 07-Mar-02 14 PAW 29.4 46.41 1.47 32 5.0 5.0 3.3 2.9 5.1 2.2 2.0 5.5 4.9

Period 2 - Stability ResultsOregon State University Dept. of Crop and Soil Science
7/1/2002
OSU Pile Total Total LECO LECO C:N Solvita Solvita Draeger Draeger Alkaline Alkaline Alkaline DraegerSample ID Date Process week ID Solids Solids C N Ratio CO2 test NH3 test CO2 test CO2 test trap CO2 test trap CO2 test trap CO2 test CO2 testNumber 0 to 4 h 0 to 24 h 24 to 48 h 0 to 4 h
% % % % 1 to 8 scale 1 to 5 scale % CO2 in 4 h % CO2 in 4h mg CO2-C mg CO2-C mg CO2-C mg CO2-C
adjusted as not refrigerated refrigerated per g compost C per d per g compost C per d per g compost C per d per g compost C per d
moisture received before analysis not refrigerated not refrigerated not refrigerated not refrigerated
PHASE II
TM69 37328 initial cover 49.7 0.08 621.25TM70 37328 initial cover 49.6 0.07 708.5714286TM71 37328 initial bulk 40.1 0.71 56.47887324TM72 37328 initial bulk 37.1 0.85 43.64705882TM73 37328 initial food 43.32 1.96 22.10204082TM74 37328 initial foodTM75 37328 initial mix 52.95 1.13 46.85840708TM76 37328 initial mixTM77 37357 4 TW 28.73000326 41.09424484 42.26 0.81 22.07 4 5 2.2 3.517998539 2.507717899 3.148704088 2.3TM78 37357 4 TW 31.16831231 38.58393437 46 3 5 7 17.59314024 7.722403285 7.753500211 2.3TM79 37357 4 TW 35.65180286 42.87671233 46 4 5 4.6 7.214696384 5.154214879 2.607735202 2.3TM80 37357 4 TW 32.74051491 39.9505589 46 4 5 5.2 15.10592554 8.669744596 6.855827279 7.943887177TM81 37357 4 PAW 33.11522679 40.47109208 40.8 0.98 47.01 4 5 2.5 13.34954547 6.715705922 11.63372635 3.748964996TM82 37357 4 PAW 32.74313792 40.55205132 46 4 5 4.8 14.34884818 5.649165915 6.275745937 7.328186647TM83 37357 4 PAW 37.08714431 38.95169031 46 4 5 6 13.00082633 5.657447053 5.475228667 8.098903892TM84 37357 4 PAW 33.37951615 39.20341087 46 3 5 9.8 14.56718867 10.37410005 11.17137764 14.73020023TM85 37371 6 TW 36.07761456 44.68395462 43.97 0.91 48.48 7 5 0.6 1.4 0.988843429 1.083493589 0.960169116 0.808691277TM86 37371 6 TW 34.08720235 42.38581408 46 8 5 0.2 0.08 0.594767366 1.281626572 8.952811705 0.285304065TM87 37371 6 TW 35.19264872 43.32969432 46 4 5 6 4.5 8.303694269 2.67994552 3.257442198 8.53488522TM88 37371 6 TW 37.49316417 45.93680074 46 5 5 2.5 2 2.724917767 1.978800963 1.499091638 3.311212293TM89 37371 6 PAW 37.84788671 43.91641205 41.36 0.94 43.82 6 5 1.4 2 1.465469101 3.759688396 12.57521347 1.816883937TM90 37371 6 PAW 40.24556617 43.00986842 46 4 5 4.6 5.2 5.500617142 4.627319436 4.4237487 5.711890346TM91 37371 6 PAW 31.5928328 41.24207304 46 4 5 6 5 9.074731138 5.21983668 3.407822369 9.507384769TM92 37371 6 PAW 36.51663834 44.81042782 46 3 5 8.5 4.2 11.8110976 6.01787345 4.864232474 11.6723445TM93 37385 8 TW 33.38379197 46.57195135 39.09 0.85 45.95 4 5 1.8 2 5.104144586 3.005691499 3.005691499 2.663099145TM94 37385 8 TW 37.00588268 47.7403407 46 4 5 3.8 2.5 4.840995423 2.309813976 1.782860217 5.123509731TM95 37385 8 TW 36.17124394 44.97139496 46 4 5 3.4 2 4.512726782 3.792519109 2.507956185 4.684961066TM96 37385 8 TW 39.05758595 46.82687056 46 4 5 4 2 5.384163558 2.23756888 1.423159618 5.112183981TM97 37385 8 PAW 34.9713792 48.4856768 44.41 0.98 45.48 3 5 5.8 4.1 8.541905142 4.151322987 3.041838002 8.300949486TM98 37385 8 PAW 34.87132053 47.72454436 46 4 5 4 4.2 6.541975025 3.918825962 2.745905895 5.725896301TM99 37385 8 PAW 38.08315335 47.77414075 46 4 5 6 5.5 7.575898586 4.287611928 3.655841997 7.887088935TM100 37385 8 PAW 32.23144982 45.89078276 46 3 5 7 6.2 11.28915734 6.066062273 5.038745275 10.88108185TM101 37396 10 TW 35.45554336 48.65543972 42.73 0.85 50.08 4 5 3.5 3 3.946126704 1.998192639 2.08881362 4.921533719TM102 37396 10 TW 38.31860776 51.18686321 46 4 5 2.8 2.6 3.718294303 2.110397777 2.321016317 3.634061414TM103 37396 10 TW 33.64999176 48.45484222 46 5 5 3.2 2.4 4.410899175 2.335487538 2.316383346 4.736741259TM104 37396 10 TW 38.8473738 51.49579648 46 6 5 1.8 2 1.735902999 1.490514443 1.151008376 2.288554904TM105 37396 10 PAW 32.88671682 49.11062907 43.8 1.11 39.54 4 5 3.5 3.7 4.834901511 2.928995067 2.379501855 5.305961466TM106 37396 10 PAW 34.46102462 46.18173827 46 3 5 3.8 4.8 5.465380707 2.765203108 2.306699345 5.501867751TM107 37396 10 PAW 31.81120491 48.05173894 46 4 5 2.8 3 3.852117821 2.929357538 2.032210813 4.377456758TM108 37396 10 PAW 32.93097772 50.58171441 46 3 5 4 5 6.715574833 3.05108036 4.210589161 6.063274735TM109 37413 12 TW 36.18766404 53.20717351 43.9 0.85 51.89 6 5 1.5 1.6 1.170190577 1.425471732 1.082302611 2.039368994TM110 37413 12 TW 36.05122031 54.11021752 46 5 5 1.8 2.2 1.66391115 1.677841587 1.398201322 2.466056545TM111 37413 12 TW 34.66342255 52.30557088 46 6 5 1.3 1.8 1.252577297 1.281465478 1.116115094 1.838549979TM112 37413 12 TW 39.0291899 53.92371767 46 5 5 2.6 3 2.331093236 1.59818039 1.561580839 3.30989726TM113 37413 12 PAW 35.65773777 52.36261621 44.06 1.09 40.46 5 5 3 3.8 3.301868194 2.16482622 1.965609083 4.187639162TM114 37413 12 PAW 35.82311204 53.32901345 46 5 5 3 3.5 2.83262131 2.360423657 2.265464085 4.168307292TM115 37413 12 PAW 35.42411082 52.75858287 46 4 5 3 6.3 3.346842258 3.363514662 2.793887179 4.215257226TM116 37413 12 PAW 36.53339192 51.50852645 46 4 5 3.5 4.8 4.108820879 3.640709329 4.329134366 4.776333185TM117 37427 14 TW 35.10964912 54.7826087 42.57 1.22 35.01 4 5 2.2 2 2.738953116 1.627953922 1.550864182 3.105798007TM118 37427 14 TW 40.10104893 57.00821253 46 6 5 1.2 1.8 0.979606582 1.08033025 1.072386645 1.463693687TM119 37427 14 TW 36.71025162 56.20570298 46 6 5 1.4 2.2 0.992526026 1.050688678 1.016380477 1.873188397TM120 37427 14 TW 36.88903567 58.3447595 46 5 5 1.8 2.6 1.734943392 1.438559457 1.275379578 2.410048032TM121 37427 14 PAW 38.70508326 54.86091986 41.49 1.17 35.43 3 5 3.8 4.2 4.035565574 2.763275914 1.983681084 4.898581376TM122 37427 14 PAW 32.49698034 52.50867434 46 4 5 4 4.9 6.020530112 4.77503093 4.22387311 6.144249807TM123 37427 14 PAW 36.36663914 55.67844173 46 3 5 7 7 9.682779171 5.707660727 4.131301364 9.643812345TM124 37427 14 PAW 38.64832274 54.9291894 46 5 5 1.8 8 1.715915814 2.984433605 3.976466005 2.300341684
For Period 2 samples, moisture added prior to stability analysis; total solids as received are greater than total solids moisture adjusted
Period 2 has LECO C and N data only for feedstocks (Week 0) ; calculations of respiration rate based on estimated sample C concentration of 46%
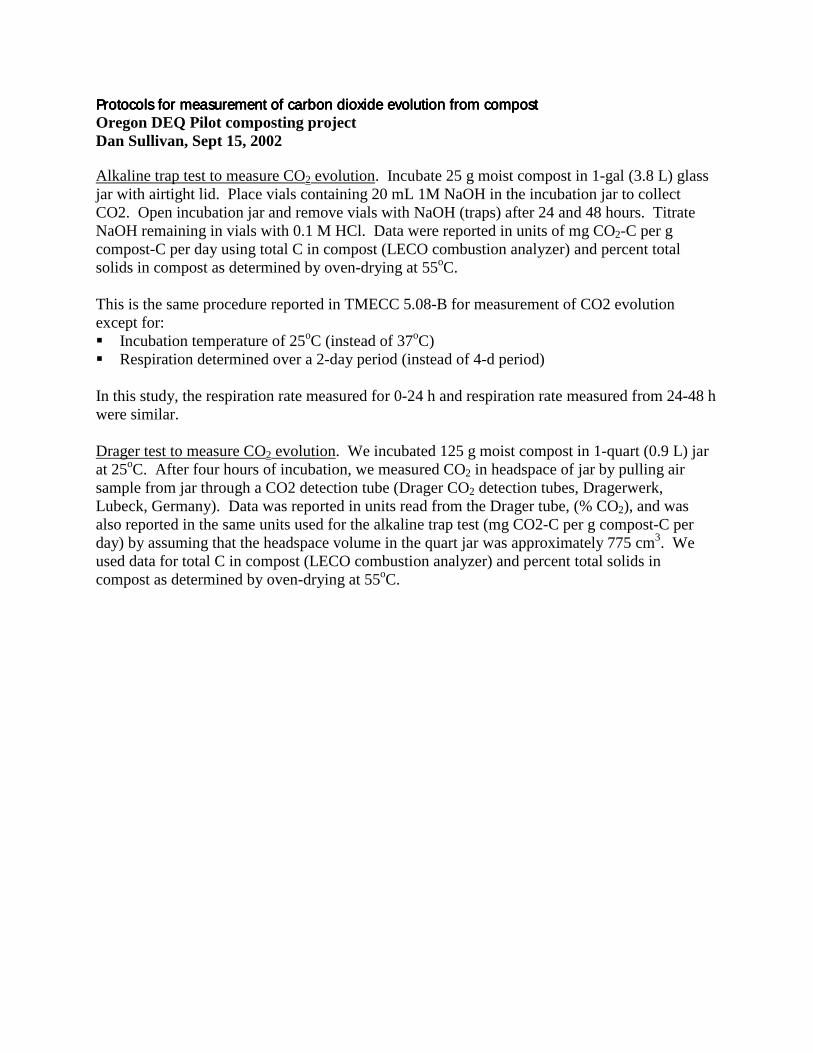
Protocols for measurement of carbon dioxide evolution from compost Protocols for measurement of carbon dioxide evolution from compost Protocols for measurement of carbon dioxide evolution from compost Protocols for measurement of carbon dioxide evolution from compost Oregon DEQ Pilot composting project Dan Sullivan, Sept 15, 2002 Alkaline trap test to measure CO2 evolution. Incubate 25 g moist compost in 1-gal (3.8 L) glass jar with airtight lid. Place vials containing 20 mL 1M NaOH in the incubation jar to collect CO2. Open incubation jar and remove vials with NaOH (traps) after 24 and 48 hours. Titrate NaOH remaining in vials with 0.1 M HCl. Data were reported in units of mg CO2-C per g compost-C per day using total C in compost (LECO combustion analyzer) and percent total solids in compost as determined by oven-drying at 55oC. This is the same procedure reported in TMECC 5.08-B for measurement of CO2 evolution except for: ! Incubation temperature of 25oC (instead of 37oC) ! Respiration determined over a 2-day period (instead of 4-d period) In this study, the respiration rate measured for 0-24 h and respiration rate measured from 24-48 h were similar.
Drager test to measure CO2 evolution. We incubated 125 g moist compost in 1-quart (0.9 L) jar at 25oC. After four hours of incubation, we measured CO2 in headspace of jar by pulling air sample from jar through a CO2 detection tube (Drager CO2 detection tubes, Dragerwerk, Lubeck, Germany). Data was reported in units read from the Drager tube, (% CO2), and was also reported in the same units used for the alkaline trap test (mg CO2-C per g compost-C per day) by assuming that the headspace volume in the quart jar was approximately 775 cm3. We used data for total C in compost (LECO combustion analyzer) and percent total solids in compost as determined by oven-drying at 55oC.

Comparison of methods At each sampling date, four samples were collected from each compost pile (TW and FA). We averaged data for the subsamples from each pile within sampling dates. Each data point in Figures 1 to 4 represents the average of four subsamples. We checked the accuracy of the Drager tube method ( 4 hour incubation) using the alkaline trap test with the same amount of compost, jar volume, and incubation time (4 h) and temperature (25oC).. We found that Drager values were generally + 10 % of the alkaline trap value (Figure 1). This indicates that the CO2 detection tubes are an accurate way to rapidly measure CO2.
Drager method(mg CO2-C per g compost C per day)
0 2 4 6 8 10 12
Alka
line
trap
met
hod
(mg
CO
2-C
per
g c
ompo
st C
per
day
)
0
2
4
6
8
10
12
Figure 1. Comparison of measurement method for CO2 evolved from compost. Four-hour incubation of 125 g compost samples in 1-quart jar for both Drager and alkaline trap methods.

Drager test values (4 hours) were strongly correlated with values determined via the alkaline trap procedure (48 hours), suggesting that the Drager quick test was a reliable substitute for the standard alkaline trap method (Figure 2).
Drager method(mg CO2-C per g compost C per day)
0 2 4 6 8 10 12
Alka
line
trap
met
hod
(mg
CO
2-C
per
g c
ompo
st C
per
day
)
0
2
4
6
8
10
12
Y = -0.12 + 0.67 X; R2 = 0.80
Figure 2. Comparison of values for Drager quick test (125 g compost; 4 h incubation; 0.9 L jar) with alkaline trap method (25 g compost; 48 hours incubation; 3.8 L jar). Linear regression indicates that 80 % of the variation in respiration measured by alkaline trap method was accounted for by the Drager method. Linear regression indicates that 4h Drager values multiplied by 0.67 were approximately equivalent to 48 h alkaline trap values.
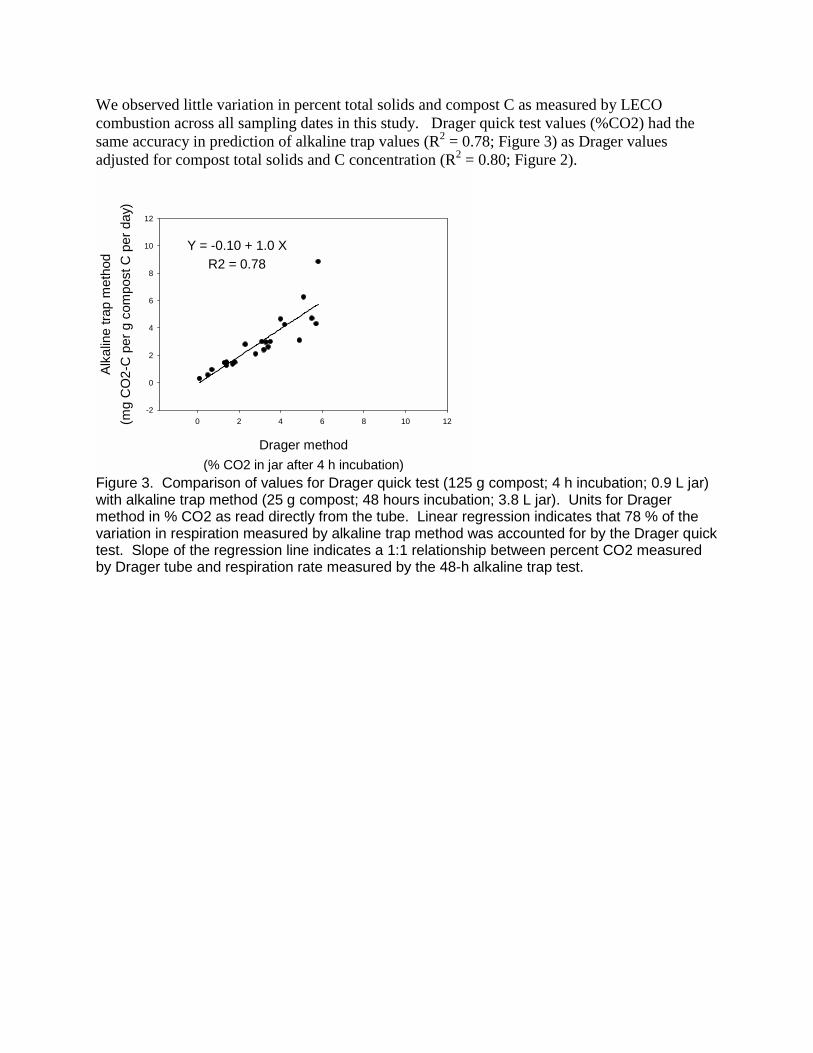
We observed little variation in percent total solids and compost C as measured by LECO combustion across all sampling dates in this study. Drager quick test values (%CO2) had the same accuracy in prediction of alkaline trap values (R2 = 0.78; Figure 3) as Drager values adjusted for compost total solids and C concentration (R2 = 0.80; Figure 2).
Drager method(% CO2 in jar after 4 h incubation)
0 2 4 6 8 10 12
Alka
line
trap
met
hod
(mg
CO
2-C
per
g c
ompo
st C
per
day
)
-2
0
2
4
6
8
10
12
Y = -0.10 + 1.0 XR2 = 0.78
Figure 3. Comparison of values for Drager quick test (125 g compost; 4 h incubation; 0.9 L jar) with alkaline trap method (25 g compost; 48 hours incubation; 3.8 L jar). Units for Drager method in % CO2 as read directly from the tube. Linear regression indicates that 78 % of the variation in respiration measured by alkaline trap method was accounted for by the Drager quick test. Slope of the regression line indicates a 1:1 relationship between percent CO2 measured by Drager tube and respiration rate measured by the 48-h alkaline trap test.
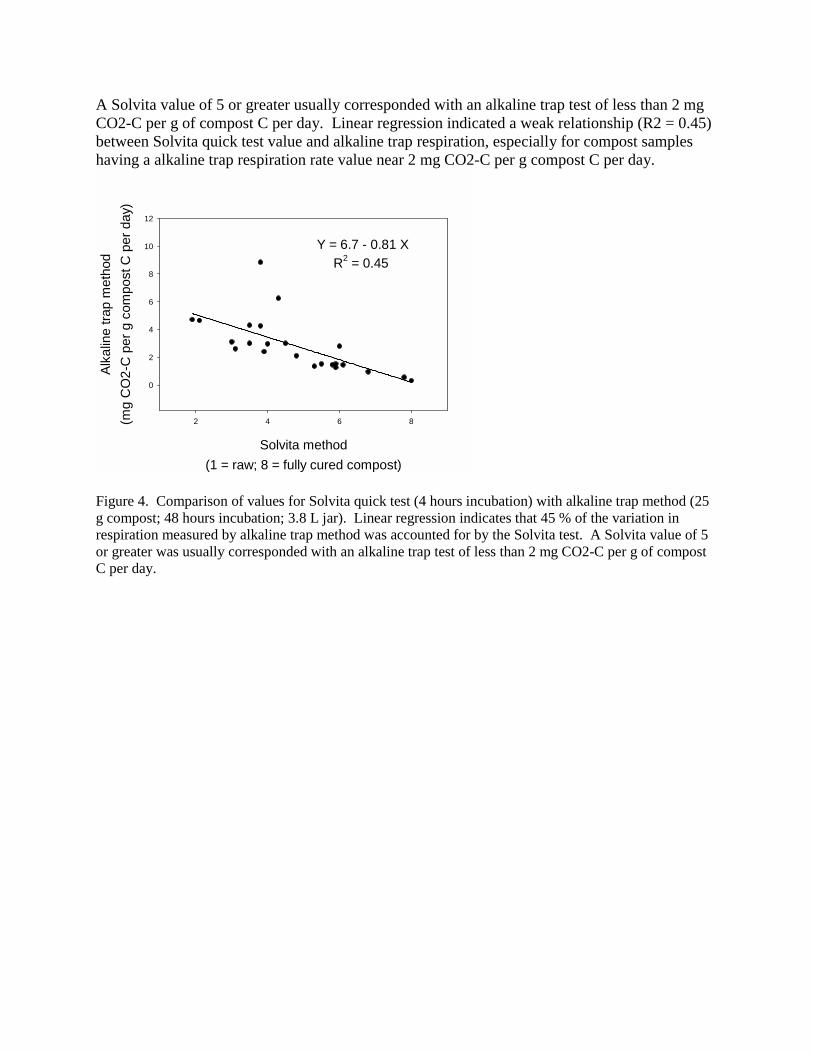
A Solvita value of 5 or greater usually corresponded with an alkaline trap test of less than 2 mg CO2-C per g of compost C per day. Linear regression indicated a weak relationship (R2 = 0.45) between Solvita quick test value and alkaline trap respiration, especially for compost samples having a alkaline trap respiration rate value near 2 mg CO2-C per g compost C per day.
Solvita method(1 = raw; 8 = fully cured compost)
2 4 6 8
Alka
line
trap
met
hod
(mg
CO
2-C
per
g c
ompo
st C
per
day
)
0
2
4
6
8
10
12
Y = 6.7 - 0.81 XR2 = 0.45
Figure 4. Comparison of values for Solvita quick test (4 hours incubation) with alkaline trap method (25 g compost; 48 hours incubation; 3.8 L jar). Linear regression indicates that 45 % of the variation in respiration measured by alkaline trap method was accounted for by the Solvita test. A Solvita value of 5 or greater was usually corresponded with an alkaline trap test of less than 2 mg CO2-C per g of compost C per day.


APPENDIX G
Indicator Organism Lab Data

PAGE INTENTIONALLY LEFT BLANK
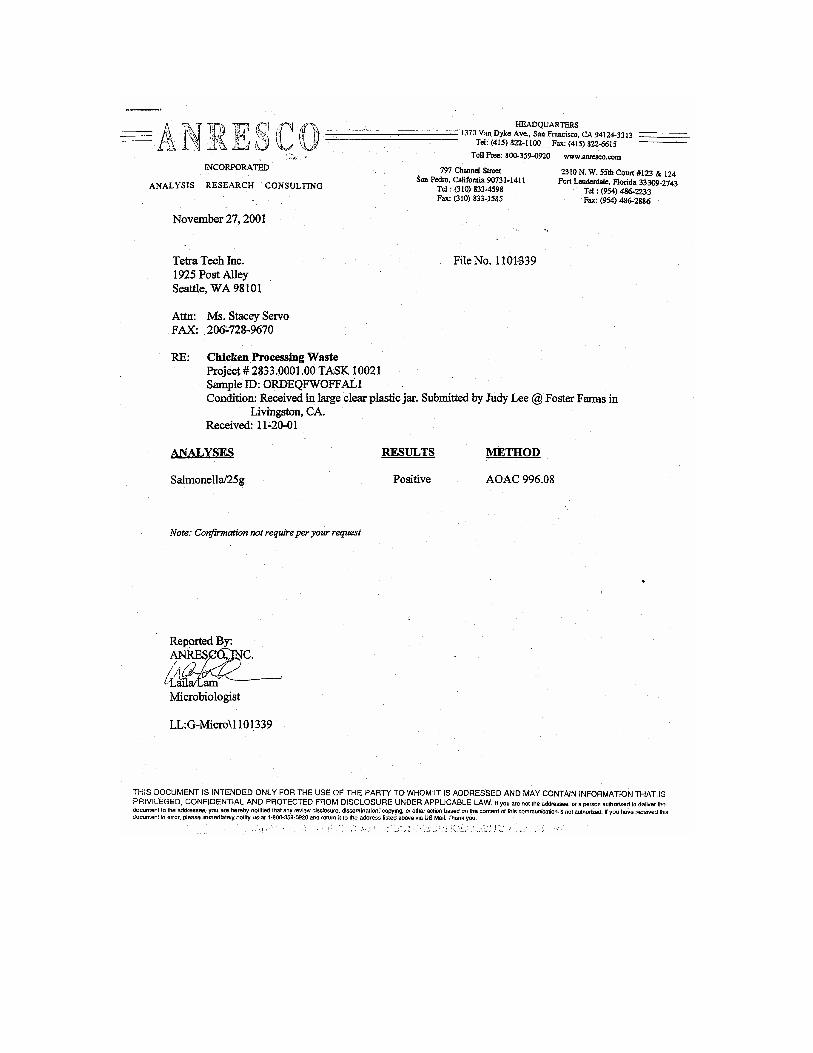
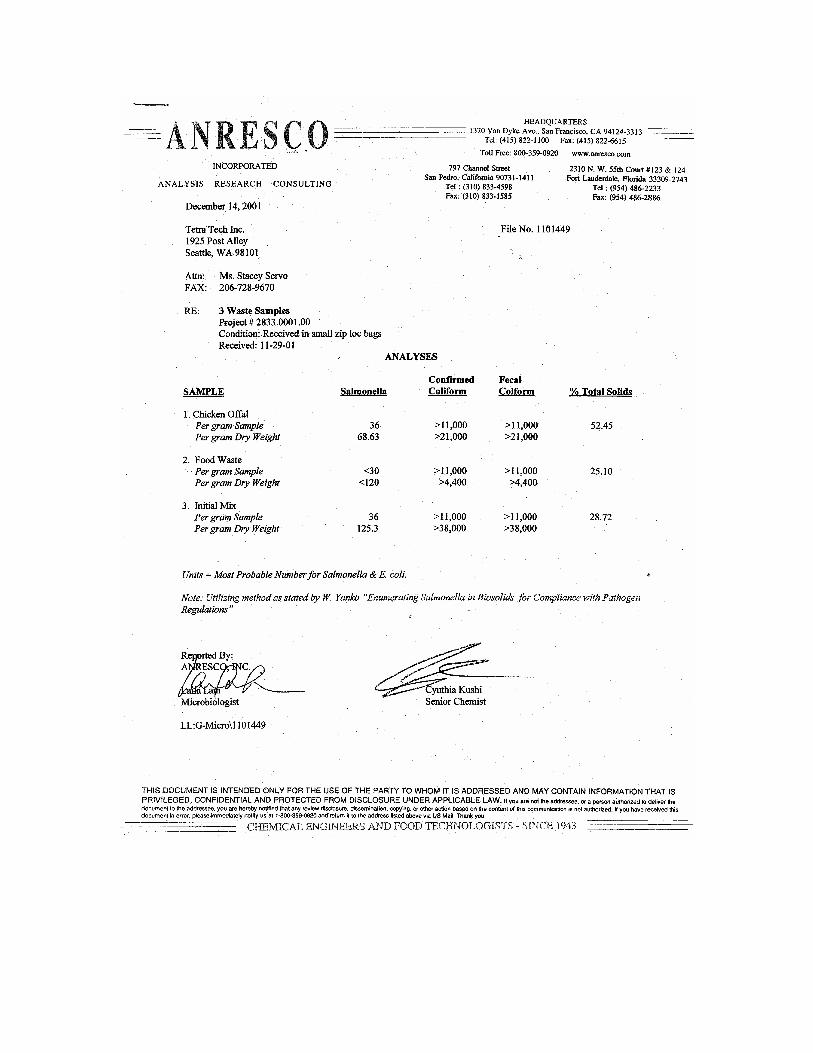
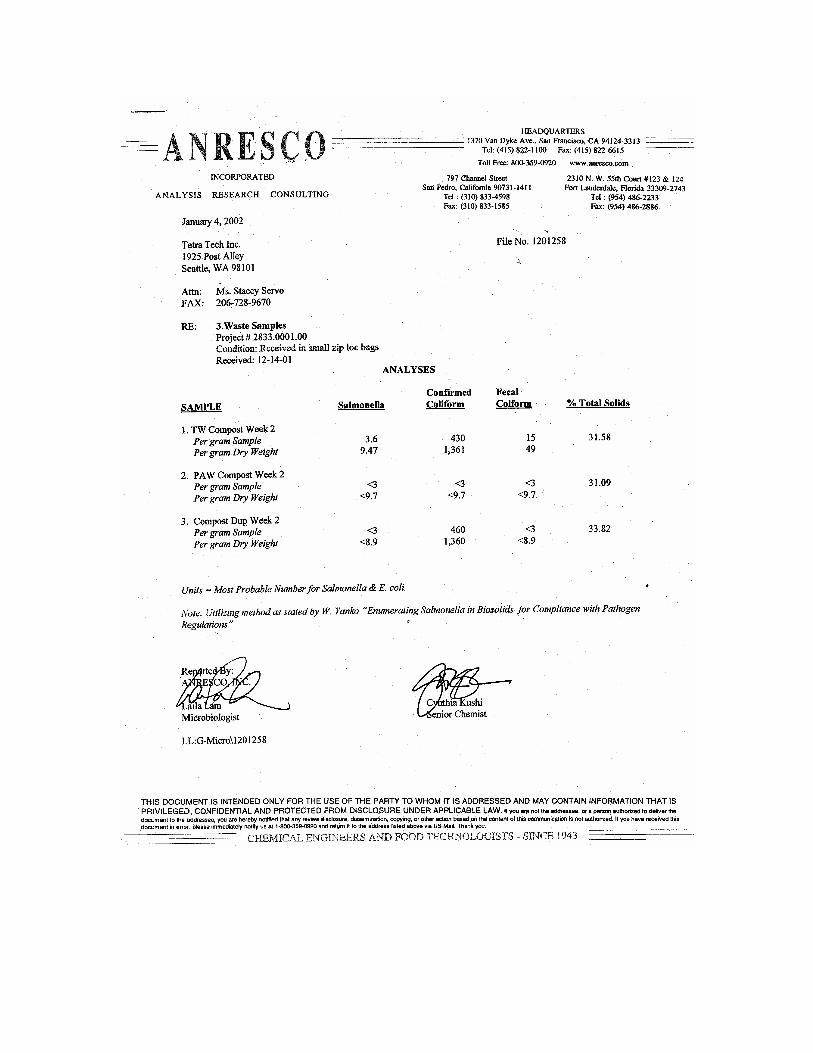


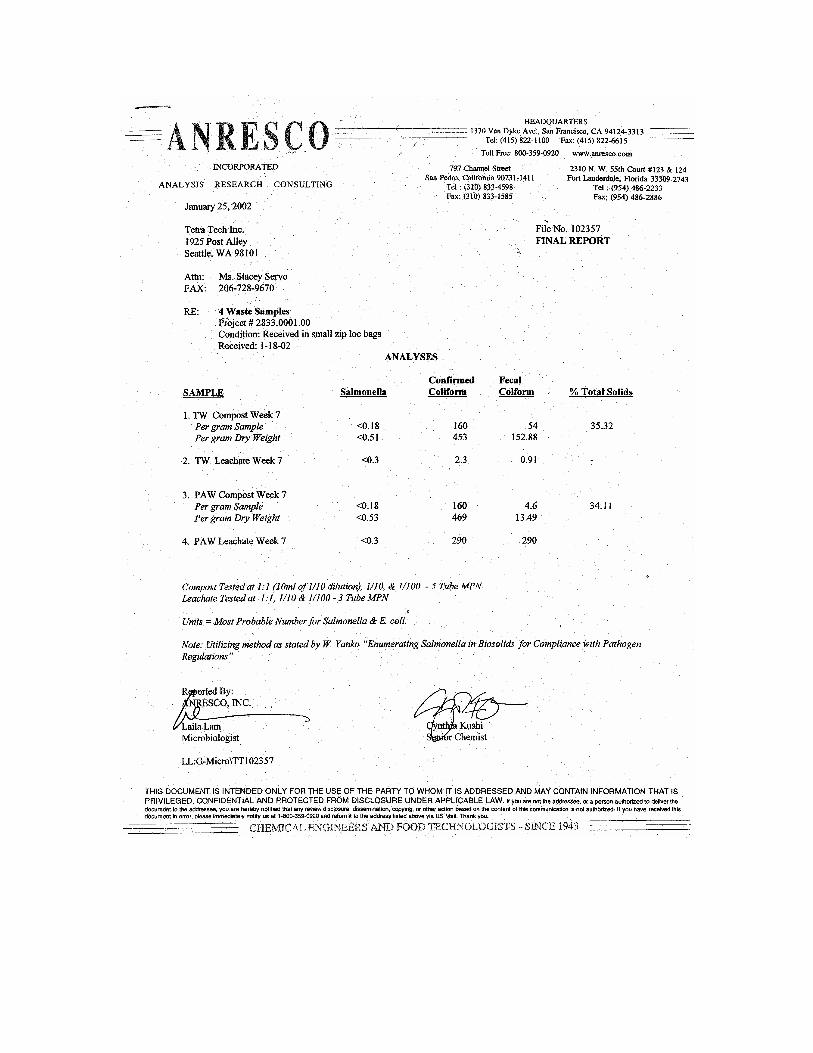

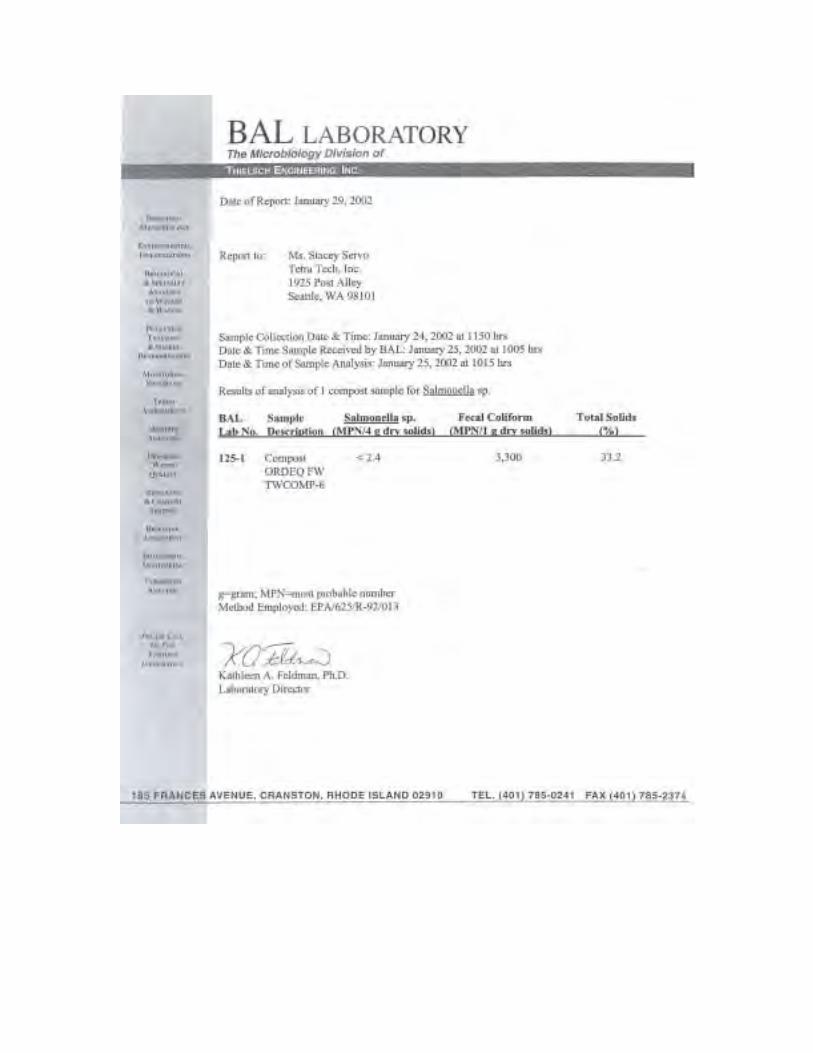


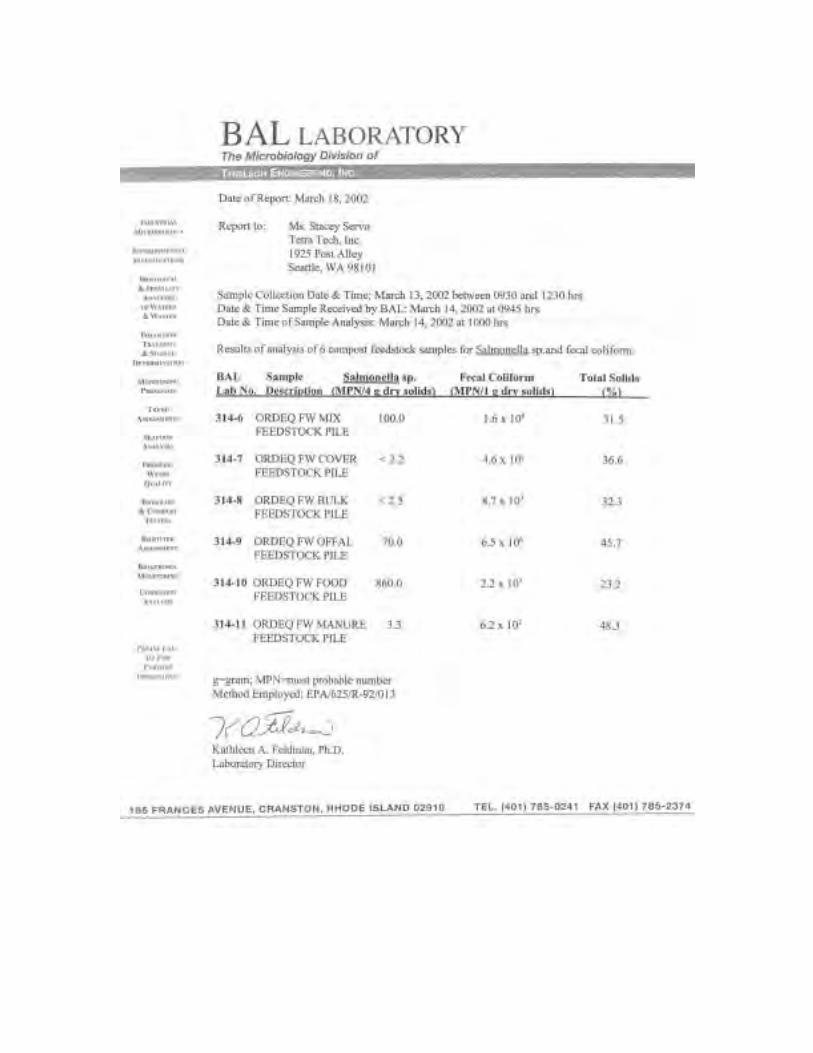


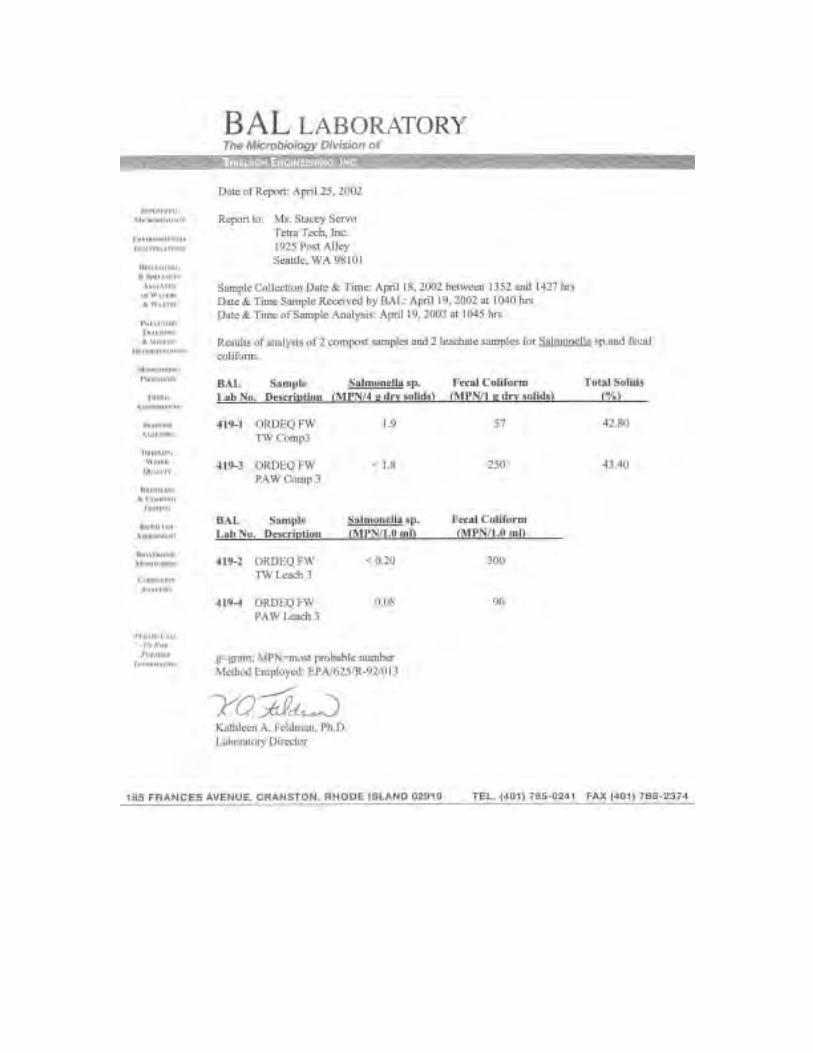


APPENDIX H
Product Quality Lab Data

PAGE INTENTIONALLY LEFT BLANK


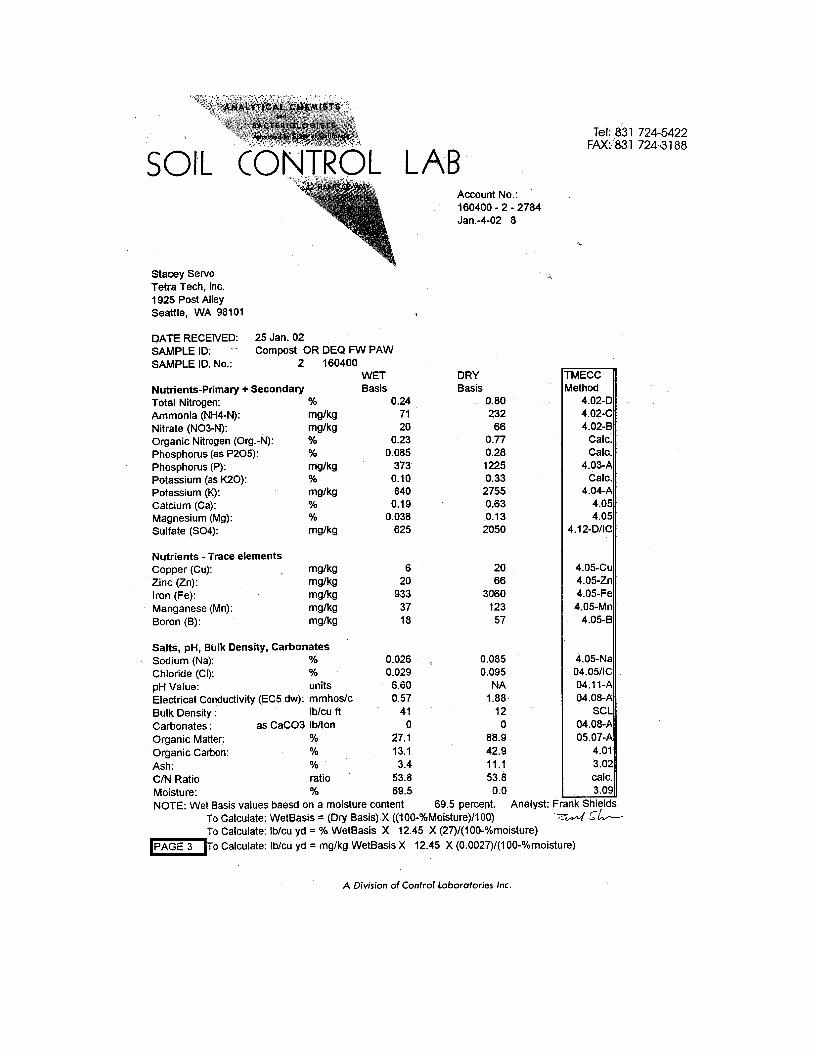

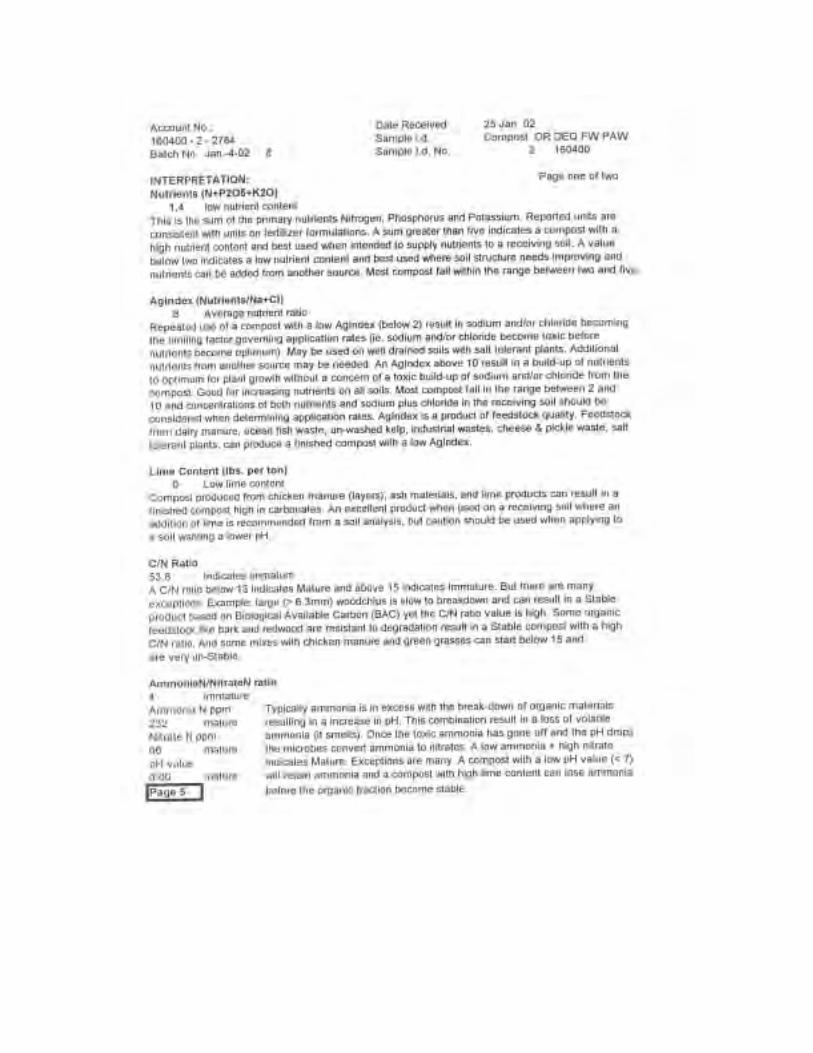


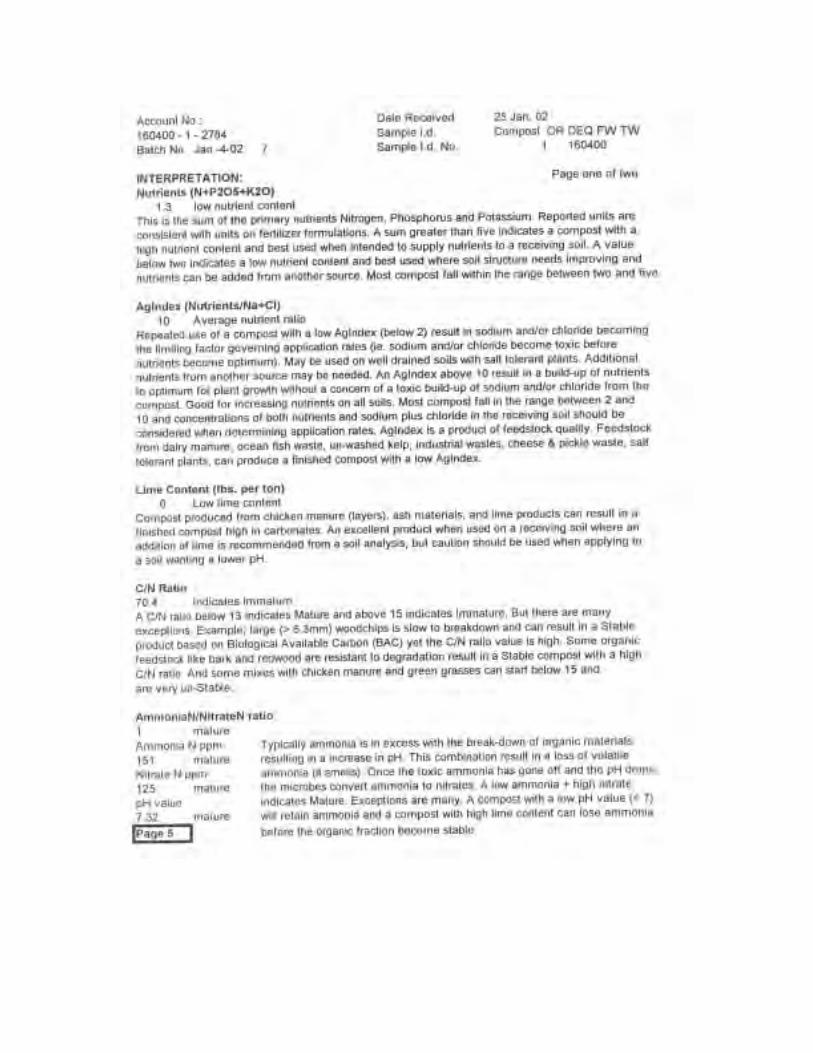


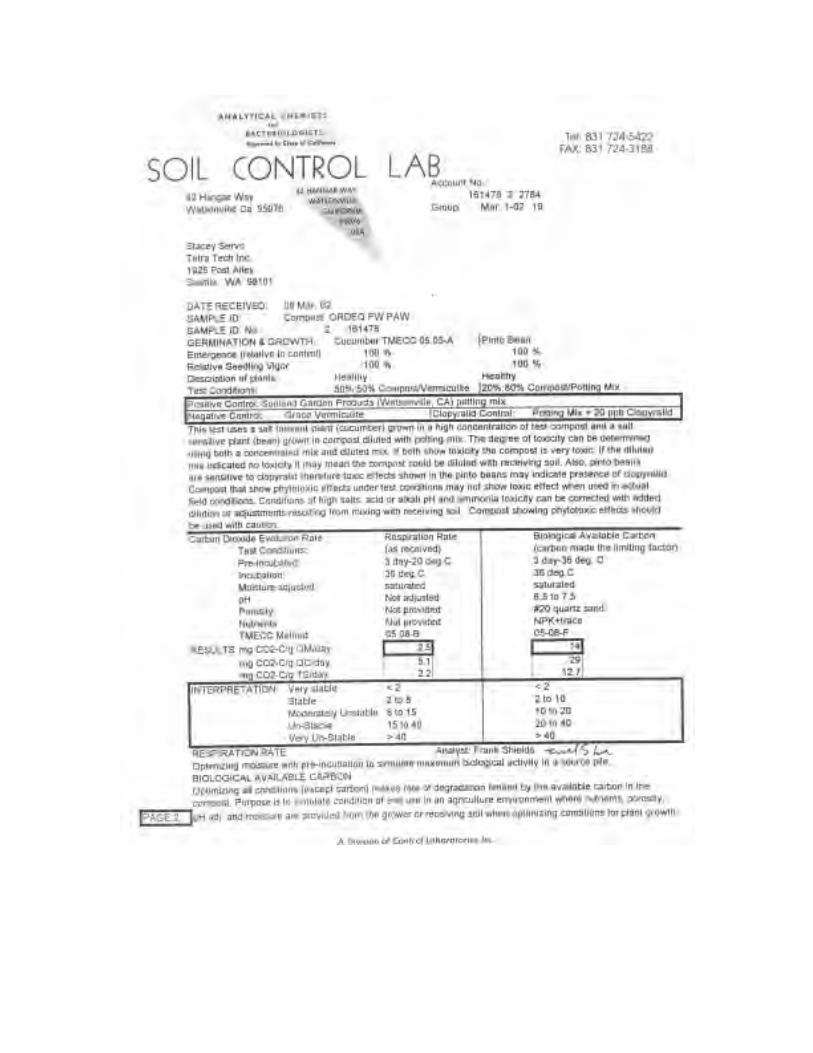
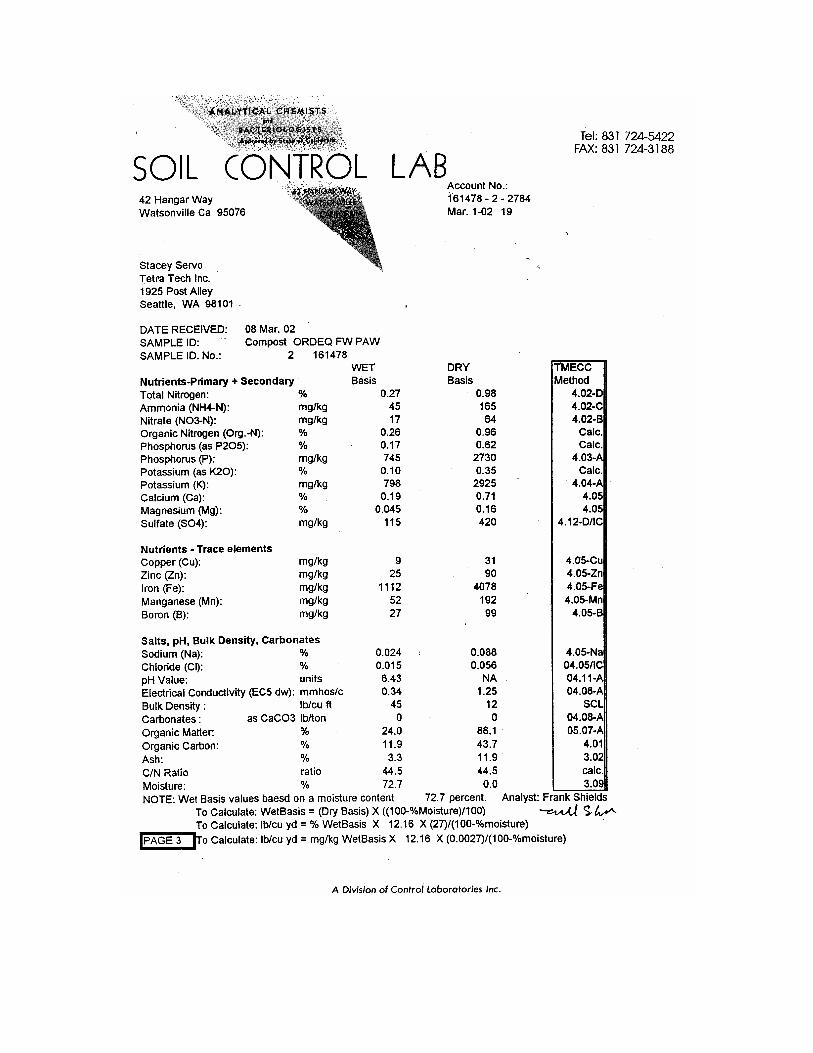


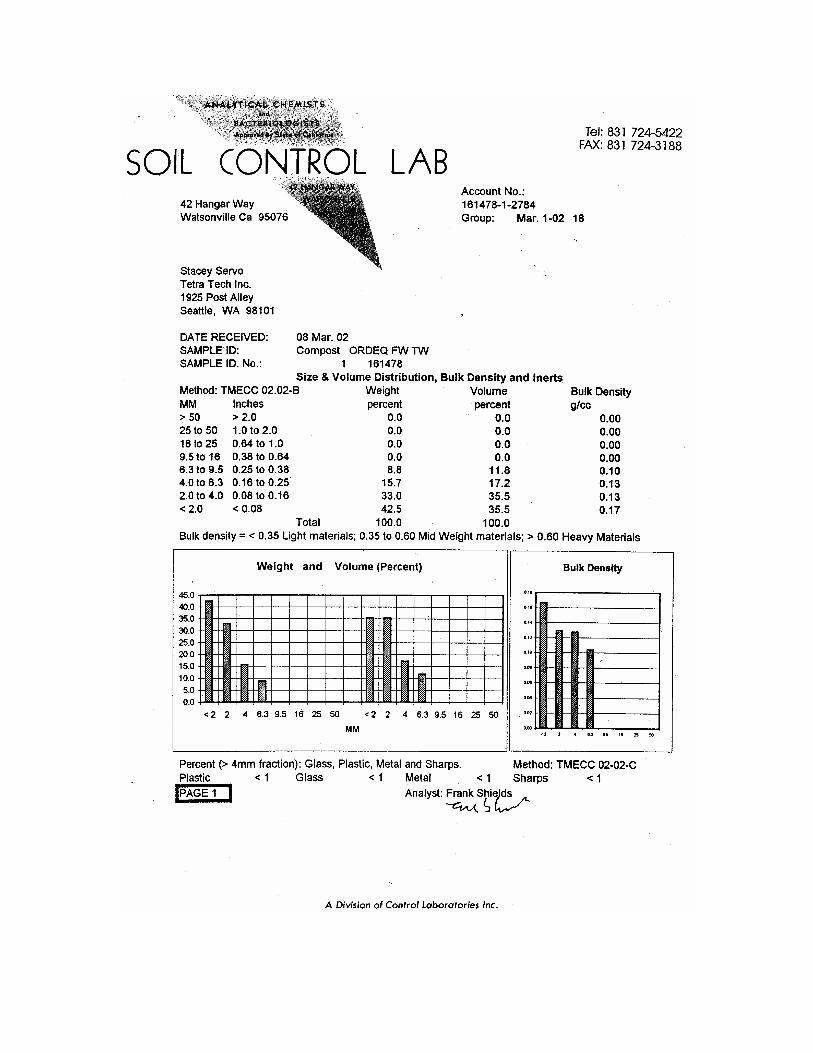
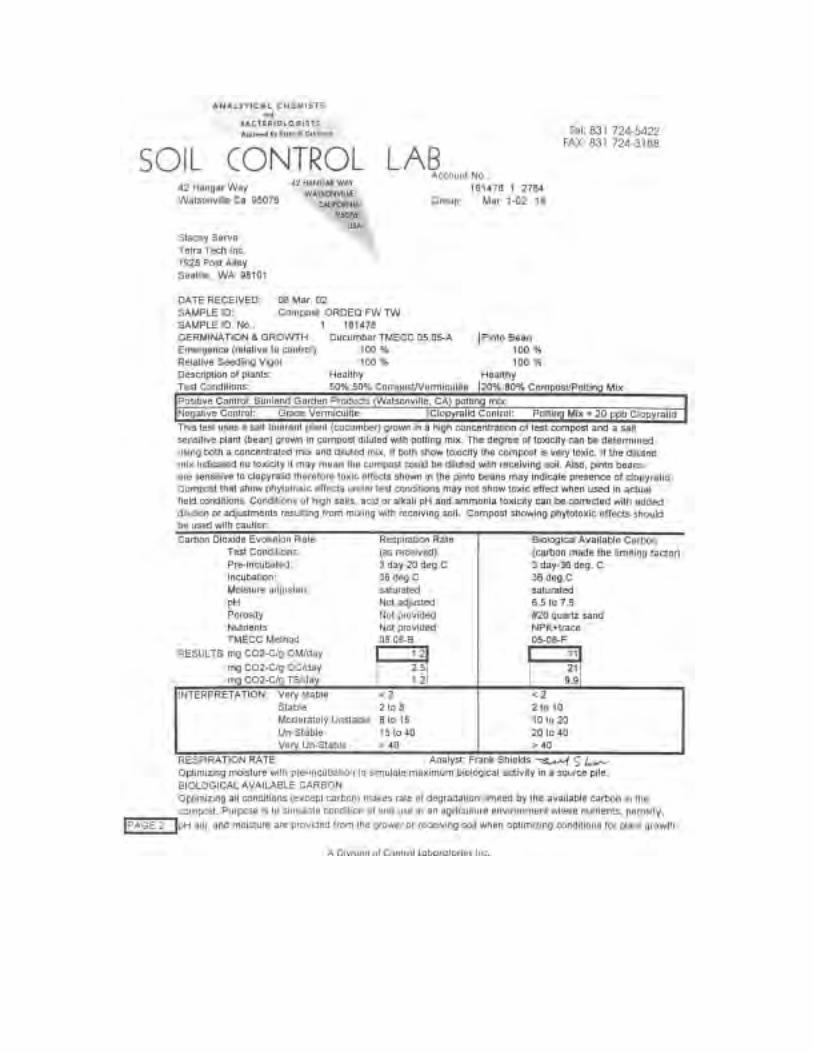


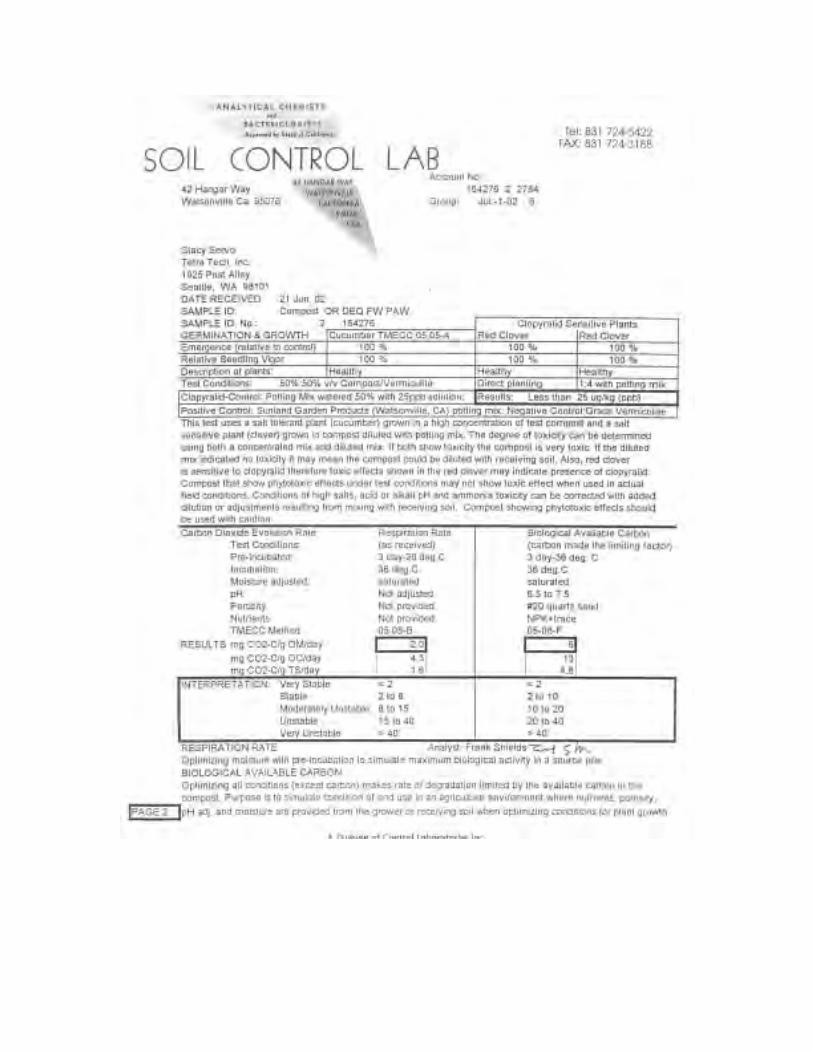


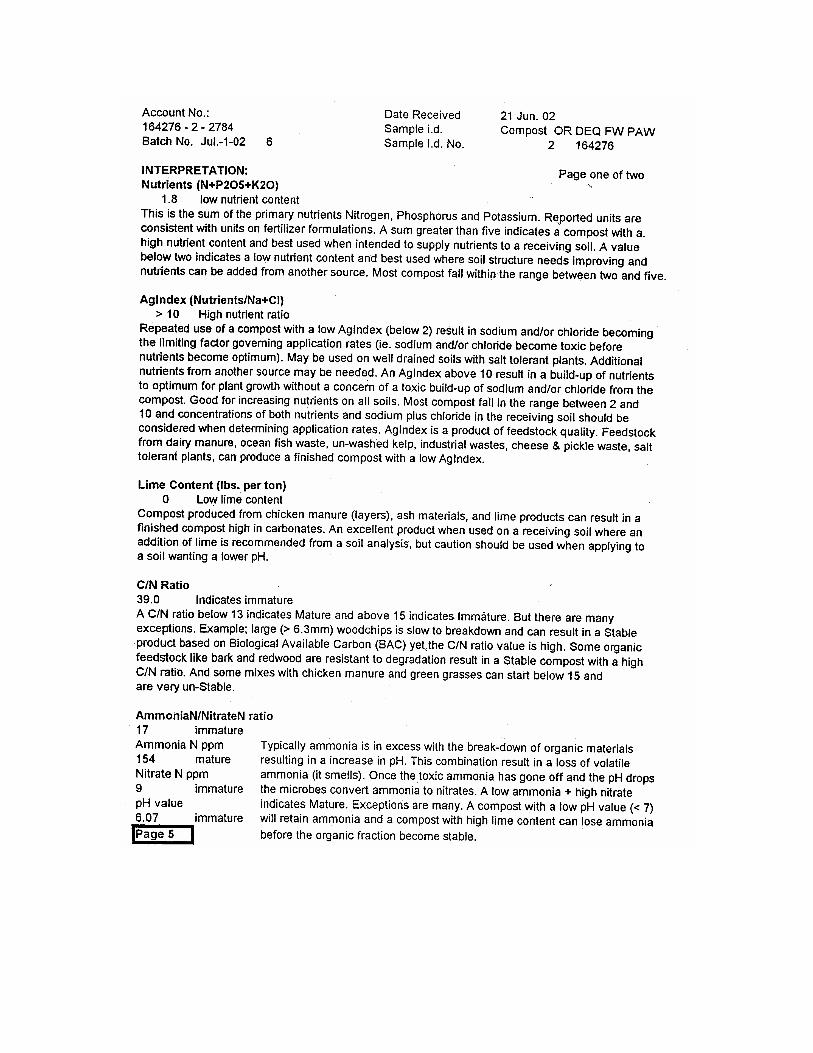


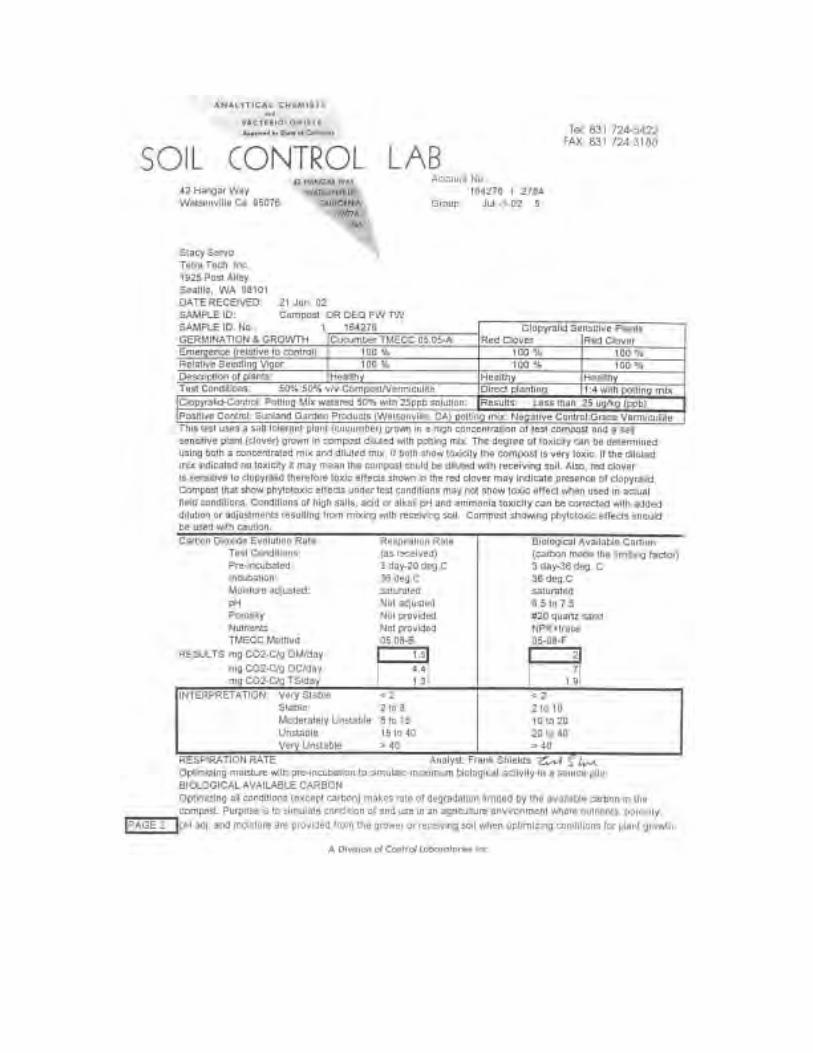
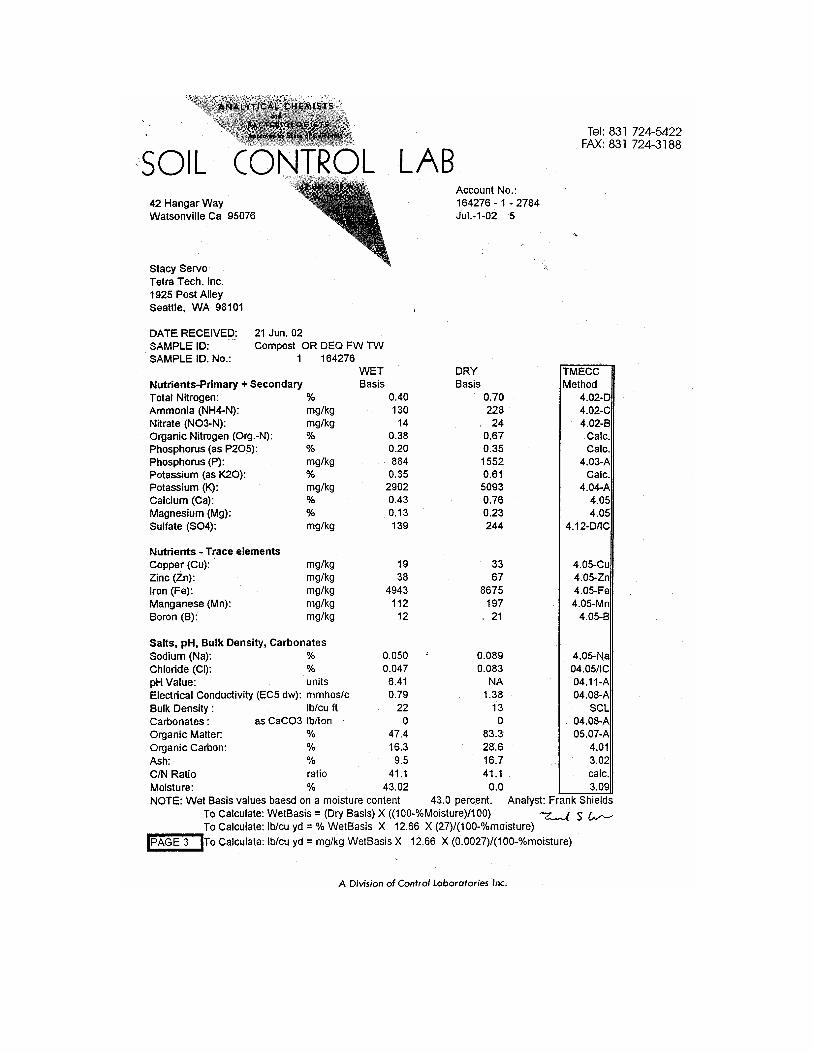
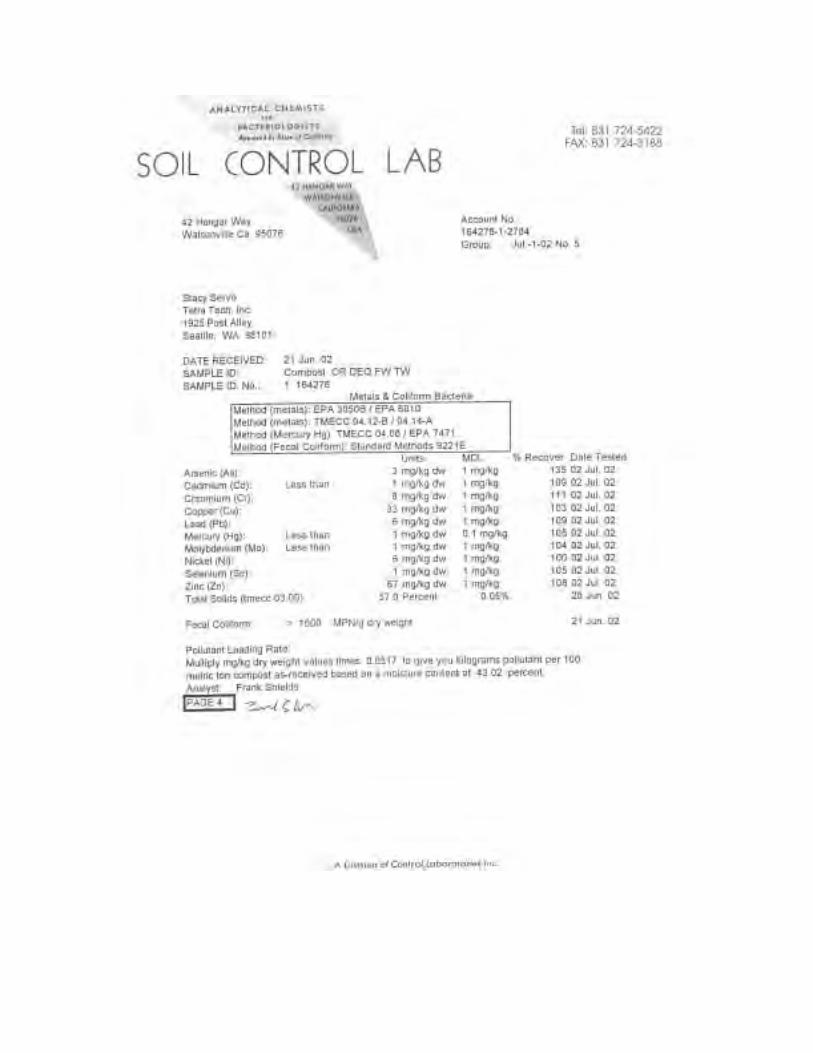


PAGE INTENTIONALLY LEFT BLANK
APPENDIX I
Project Photo Log

PAGE INTENTIONALLY LEFT BLANK
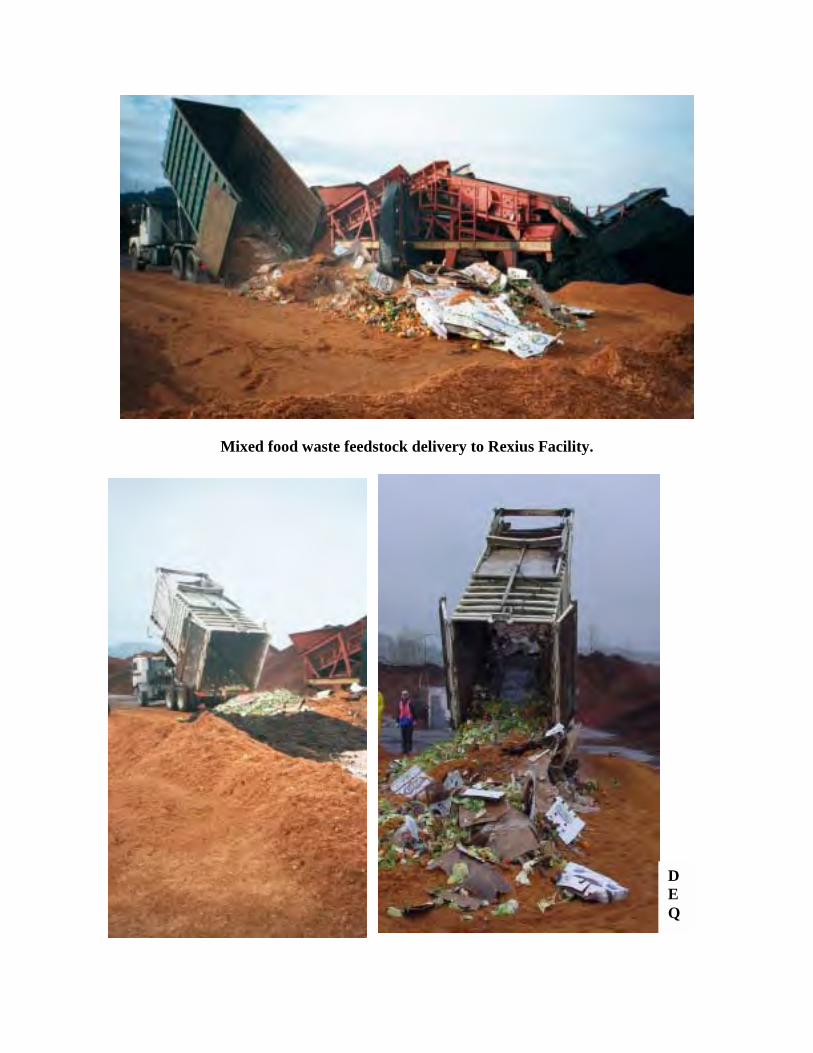
Mixed food waste feedstock delivery to Rexius Facility.
DEQ

Mixed food waste feedstock pile.
Observed meat content in Period 2 mixed food waste feedstock pile.
DEQ
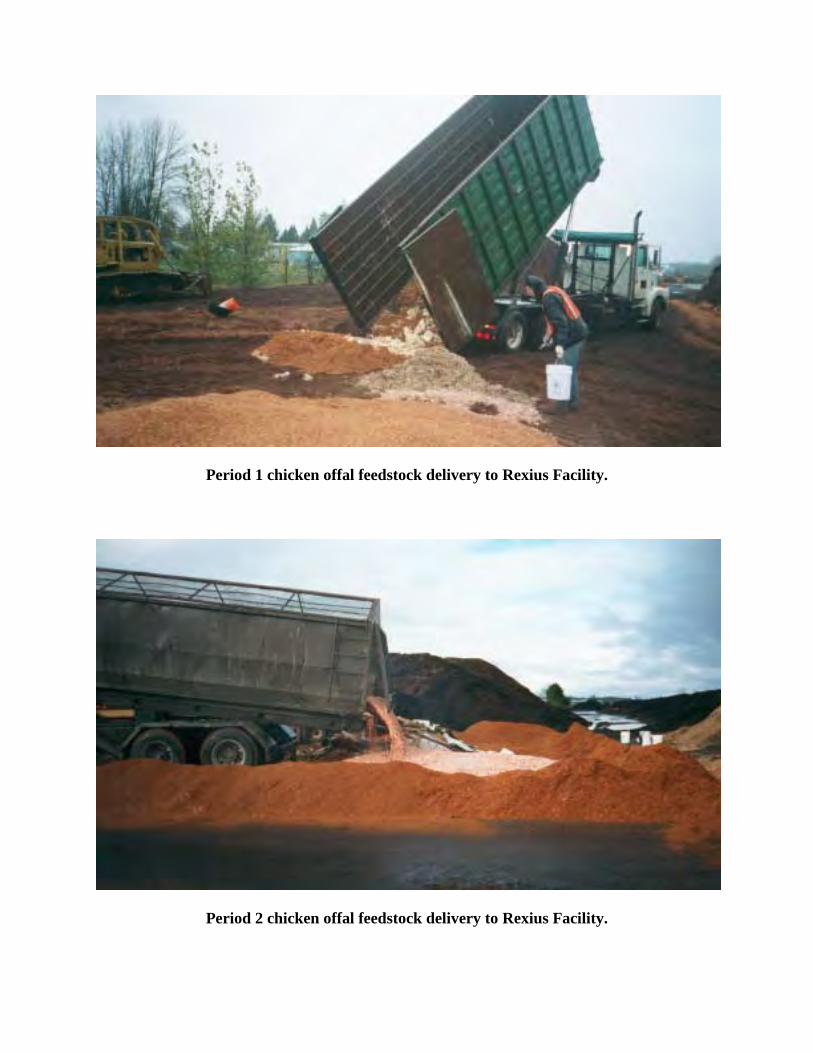
Period 1 chicken offal feedstock delivery to Rexius Facility.
Period 2 chicken offal feedstock delivery to Rexius Facility.

Chicken offal feedstock pile.
Detailed view of chicken offal feedstock pile.
DEQ
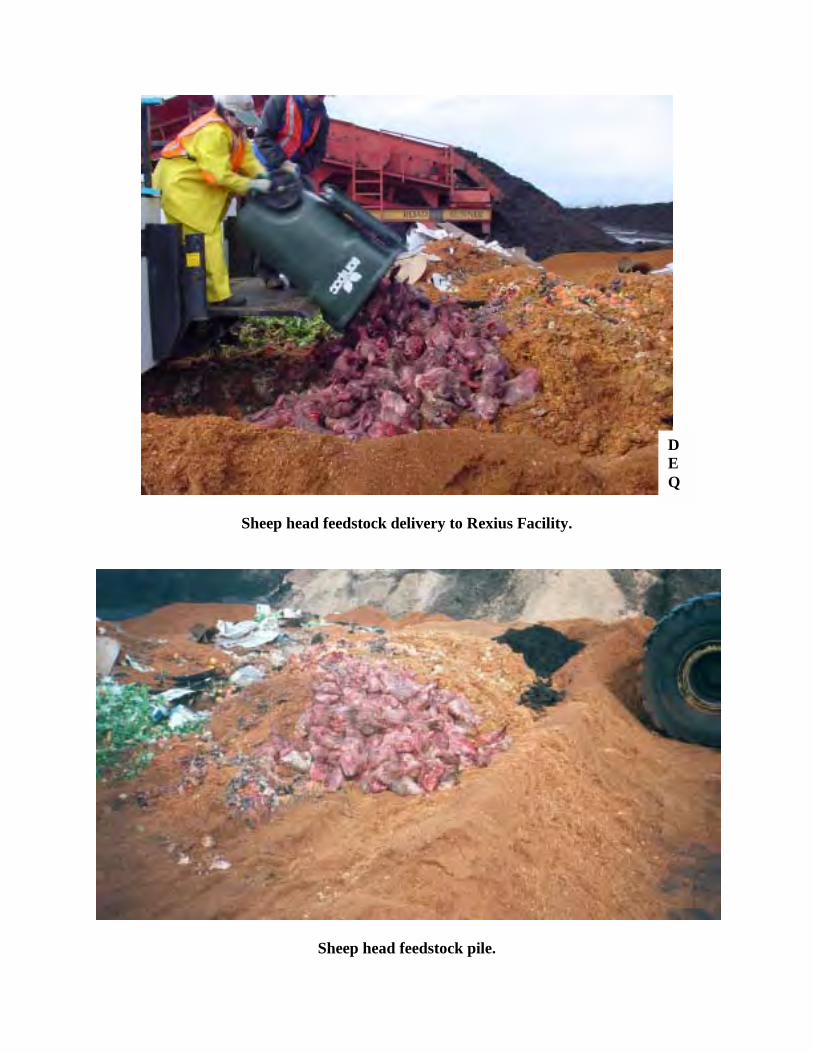
Sheep head feedstock delivery to Rexius Facility.
Sheep head feedstock pile.
DEQ

Mixed food waste feedstock sampling.

Chicken offal feedstock sampling.
Chicken offal bulk density field measurement.
DEQ
DEQ
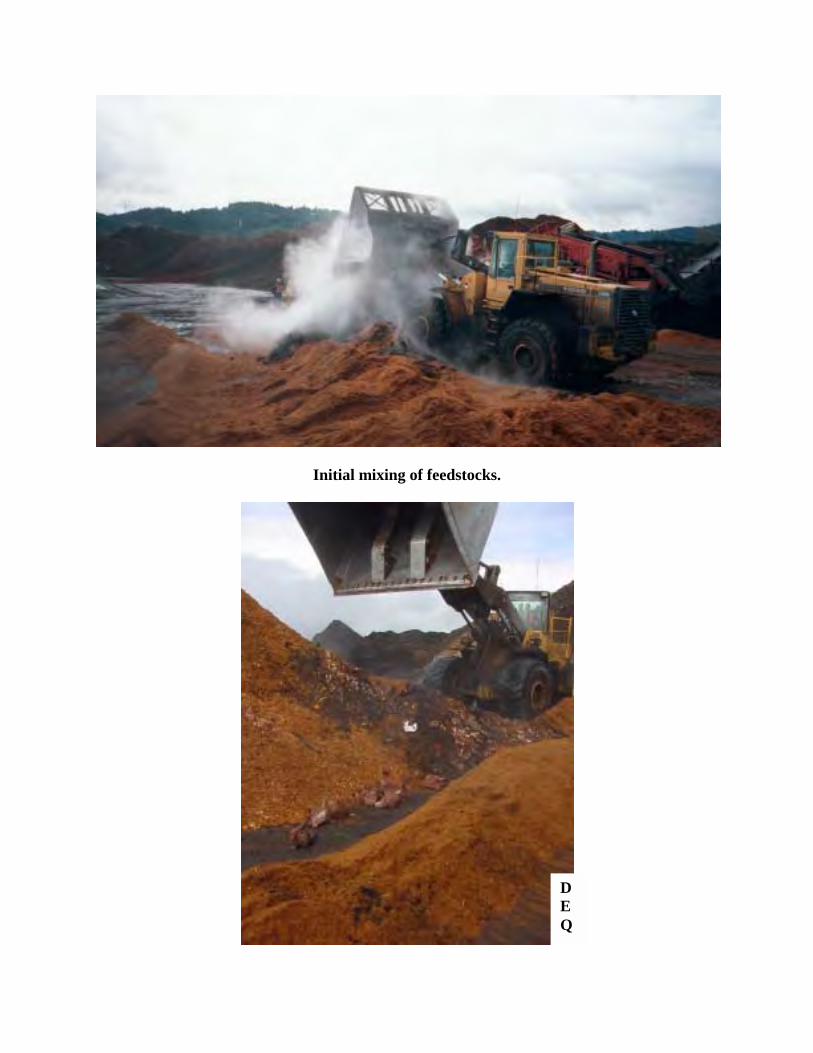
Initial mixing of feedstocks.
DEQ

Passive Aerated Windrow (PAW) initial pile building.
DEQ

Cover placement on Passive Aerated Pile (PAW).
Initial Passive Aerated Windrow (PAW) building completed.
DEQ
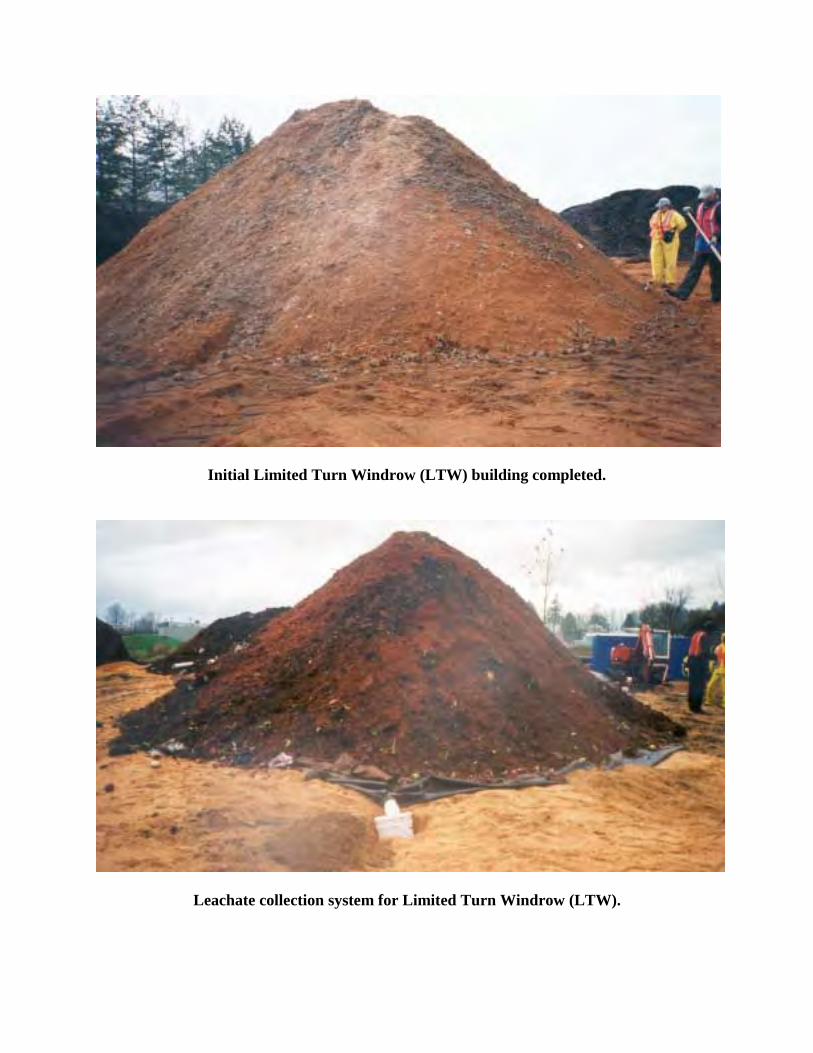
Initial Limited Turn Windrow (LTW) building completed.
Leachate collection system for Limited Turn Windrow (LTW).

Detailed view of leachate collection system.
Phase 2 Passive Aerated Windrow (PAW) and Limited Turn Windrow (LTW).
DEQ

Pile temperature monitoring using thermocouple probe and Fluke meter.
Pile oxygen level monitoring using the Demista electronic oxygen meter.

Teresa Matteson (OSU graduate) collecting pile pathogen samples.

Turning Limited Turn Windrow (LTW) during Period 1 process week 2.

Turning Passive Aerated Windrow (PAW) during Period 2 process week 4.
Removing PAW aeration piping during Period 2 turning activities.
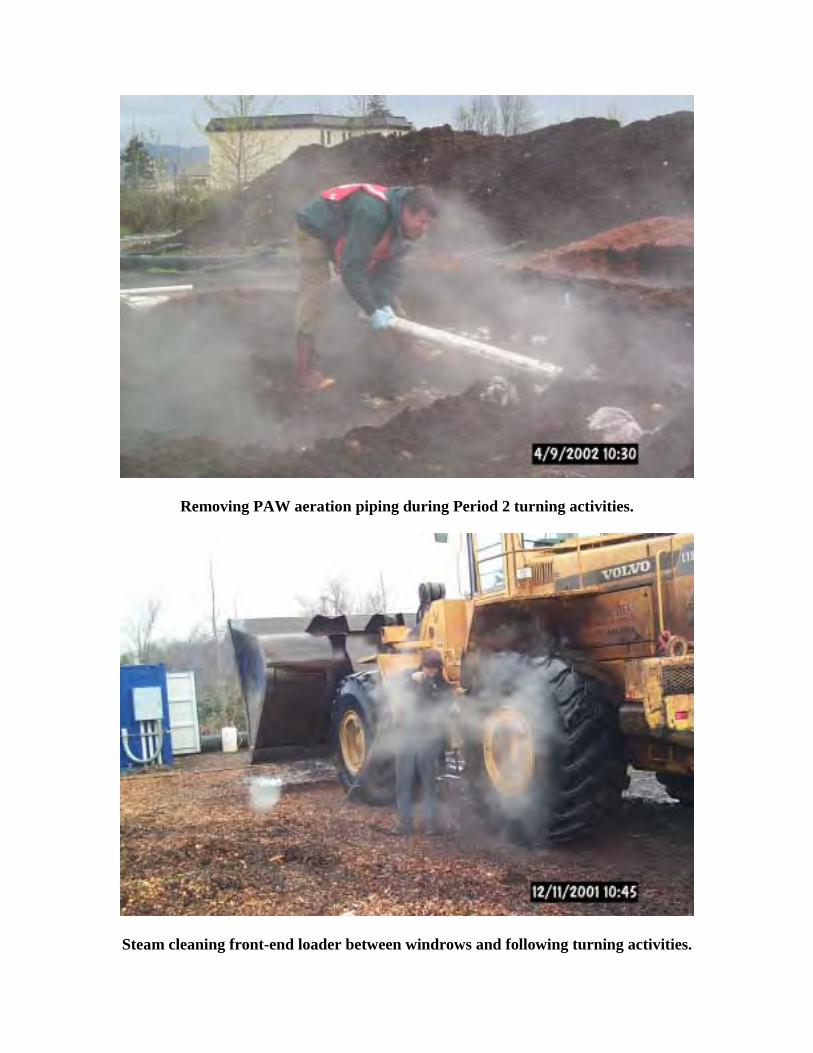
Removing PAW aeration piping during Period 2 turning activities.
Steam cleaning front-end loader between windrows and following turning activities.

Pineapple remains during Period 2 process week 4.
Corncob and various mixed food waste remains during Period 2 process week 4.
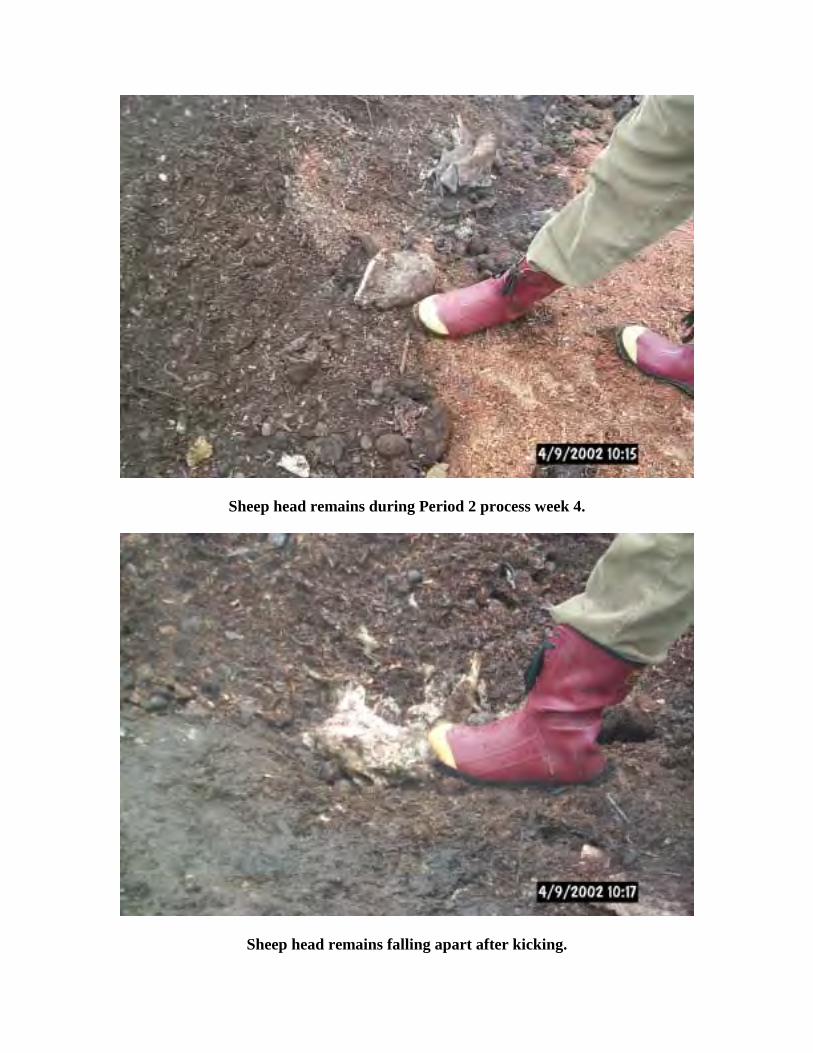
Sheep head remains during Period 2 process week 4.
Sheep head remains falling apart after kicking.
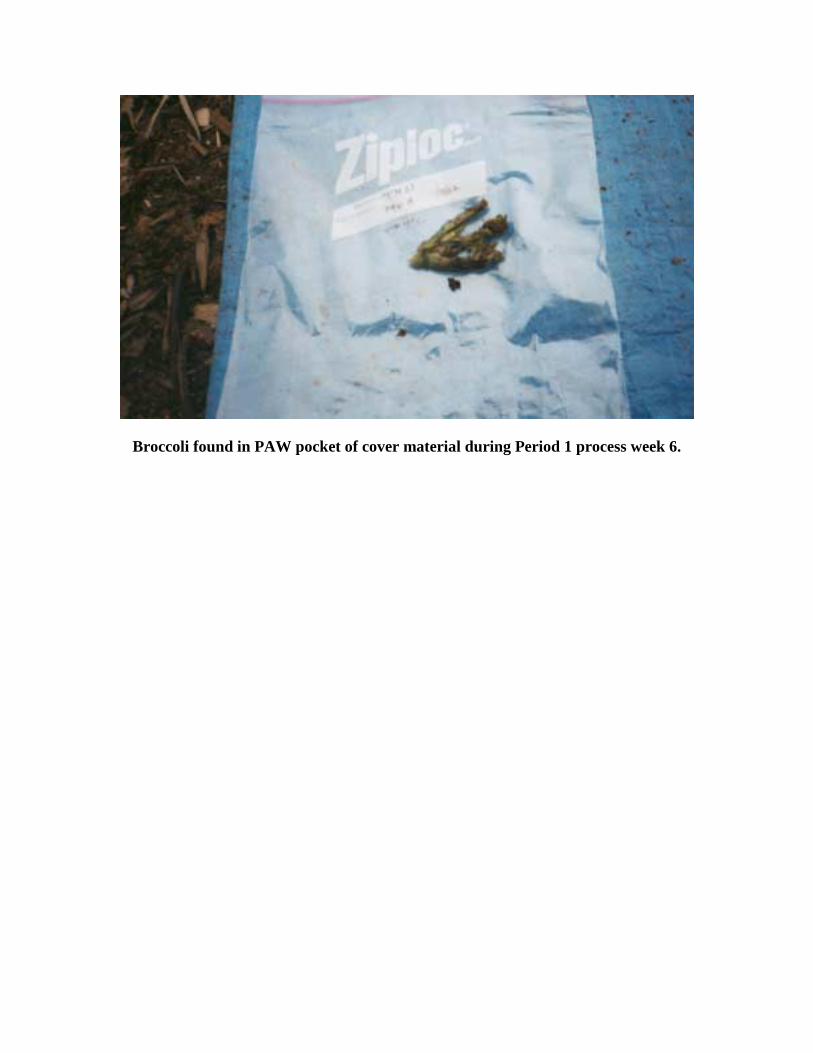
Broccoli found in PAW pocket of cover material during Period 1 process week 6.

APPENDIX J
Commercial Food Waste Composting Study Operations Plan

PAGE INTENTIONALLY LEFT BLANK

COMMERCIAL FOOD WASTE COMPOSTING STUDY
OPERATIONS PLAN
November 21, 2001 Revised March 7, 2002
Prepared for:
Oregon Department of Environmental Quality Land Quality Division, Solid Waste Program
811 SW Sixth Avenue Portland, OR 97204
Prepared by:
Tetra Tech, Inc. 1925 Post Alley
Seattle, WA 98101

PAGE INTENTIONALLY LEFT BLANK
\\Isgseaww01d\StaceyFile\Final Report 10-29-02 Appendices.doc November 21, 2001
TABLE OF CONTENTS
1. INTRODUCTION................................................................................................................ 1
1.1 Operations Plan Scope and Purpose ........................................................................................................... 1
1.2 Project Objectives......................................................................................................................................... 1
1.3 Project Responsibilities ................................................................................................................................ 2 1.3.1 State of Oregon Department of Environmental Quality (DEQ) ............................................................ 2 1.3.2 Tetra Tech, Inc. (Tetra Tech) ................................................................................................................ 2 1.3.3 Rexius Forest ByProducts (Rexius) ...................................................................................................... 2 1.3.4 City of Eugene (Eugene) ....................................................................................................................... 3 1.3.5 Oregon State University (OSU) ............................................................................................................ 4
1.4 Pilot Study Overview.................................................................................................................................... 5 1.4.1 Pilot Study Design................................................................................................................................. 5 1.4.2 Monitoring and Analysis Program ........................................................................................................ 5 1.4.3 Monitoring and Operations Review ...................................................................................................... 5
2. COMPOSTING STUDY EVALUATION CRITERIA............................................................. 6
2.1 Achievement of Class A Criteria ................................................................................................................. 7
2.2 Substrate Decomposition and Compost Stability....................................................................................... 7
2.3 Leachate Generation and Characteristics .................................................................................................. 7
2.4 Processing Period (Secondary Objective) ................................................................................................... 7
2.5 Final Product Quality (Secondary Objective) ............................................................................................ 8
2.6 Odor Generation (Secondary Objective) .................................................................................................... 8
3. COMPOSTING SITE DESCRIPTION ................................................................................ 9
3.1 Composting Area .......................................................................................................................................... 9
3.2 Leachate Collection ...................................................................................................................................... 9
3.3 Equipment ..................................................................................................................................................... 9
4. COMPOSTING STUDY OPERATIONS............................................................................ 10
4.1 Food Waste Collection & Storage ............................................................................................................. 11
4.2 Initial Mix.................................................................................................................................................... 11 4.2.1 Target Mix........................................................................................................................................... 11 4.2.2 Salmonella Innoculum Addition ......................................................................................................... 12 4.2.3 Fecal coliform Innoculum Addition .................................................................................................... 13
\\Isgseaww01d\StaceyFile\Final Report 10-29-02 Appendices.doc November 21, 2001
4.3 Pile Construction ........................................................................................................................................ 13
4.4 Process Control ........................................................................................................................................... 14
4.5 Pile Turning................................................................................................................................................. 14
4.6 Screening ..................................................................................................................................................... 15
4.7 Site Health and Safety ................................................................................................................................ 15
5. PROCESS MONITORING AND DATA RECORDING...................................................... 17
5.1 Process Monitoring/Sampling Schedule and Responsibilities................................................................. 17
5.2 Equipment and Supplies ............................................................................................................................ 19
5.3 Field Monitoring Methodology.................................................................................................................. 19 5.3.1 Pile Temperature ................................................................................................................................. 19 5.3.2 Pile Oxygen Levels ............................................................................................................................. 20 5.3.3 Bulk Density ....................................................................................................................................... 21 5.3.4 Pile Dimensions and Volume.............................................................................................................. 21
5.4 Qualitative Observations............................................................................................................................ 21
5.5 Compost Sample Collection Protocol........................................................................................................ 22 5.5.1 Sampling Procedures........................................................................................................................... 22 5.5.2 Sanitation Procedure ........................................................................................................................... 24 5.5.3 Sampling Equipment and Supplies...................................................................................................... 24
5.6 Product Characterization........................................................................................................................... 25
5.7 Leachate Sample Collection Protocol........................................................................................................ 25
5.8 Data Collection and Recording.................................................................................................................. 27
5.9 Contingencies .............................................................................................................................................. 27

\\Isgseaww01d\StaceyFile\Final Report 10-29-02 Appendices.doc November 21, 2001
LIST OF TABLES Table l Optimum Initial Mix Characteristics for Composting Table 2 Compost Pile Dimensions Table 3 Pile Turning Schedule Table 4 Process Monitoring/Sampling Schedule Table 5 Sample Shipping Information
LIST OF FIGURES Figure 1 Effect of Bulking Material Solids Content on Bulking Ratio Figure 2 Compost Pile Process Monitoring and Sample Collection Locations
LIST OF APPENDICES Appendix A Project Contact List Appendix B Process Monitoring Form Appendix C Laboratory Contact List Appendix D Example Labels/Forms Appendix E Sampling Schedule

\\Isgseaww01d\StaceyFile\Final Report 10-29-02 Appendices.doc November 21, 2001
PAGE INTENTIONALLY LEFT BLANK
\\Isgseaww01d\StaceyFile\Final Report 10-29-02 Appendices.doc 1 November 21, 2001
1. Introduction 1.1 Operations Plan Scope and Purpose The purpose of this document is to provide a comprehensive operating plan for this composting pilot study. During the course of the pilot study this document will provide guidance in specific operating procedures. In general this document will explain when and why a particular task is to be performed. 1.2 Project Objectives The overall goals of the project are as follows: 1. Evaluate the effectiveness of the limited turn windrow (1 turn per week) and passive aerated static
pile methods for composting commercial non-green1 food waste. The primary objective of the evaluation is to provide documentation of the capability of these low technology composting processes to reduce human pathogens in a manner consistent with the regulatory approach developed in USEPA 40 CFR 503. This will be accomplished by completing the following tasks:
a) Complete collection and compost testing. b) Document composting system performance. c) Document the test protocol for use as the basis for regulatory determination of sufficient pathogen
reduction for these systems. d) Determine leachate and runoff characteristics for these systems.
2. Complete composting tests with each of the two systems during two distinct weather operating periods, preferably the first period beginning in November (Period 1) and the second period beginning in March (Period 2).
3. Provide a discussion of alternatives and recommendations for regulatory guidance for composting of food waste. 4. Provide a proposed regulatory procedure for approval and monitoring of food waste composting methods based on Environmental Protection Agency (EPA) 40 CFR 503 requirements. 5. Provide a proposed regulatory procedure for approval and monitoring of food waste composting methods that differ from accepted EPA Class A and Process to Further Reduce Pathogens (PFRP) processes (developed for biosolids management). 6. Provide stability test criteria for use by the State of Oregon Department of Environmental Quality
(DEQ) to show there is limited potential for human pathogen re-growth due to depleted substrate.
1 Non-green food waste is included in the definition of Non-Green Feedstocks: Materials used to produce compost. Non-green feedstocks are high in a) substances that posed a present or future hazard to human health or the environment and b) high in and likely to support human pathogens. Non-green feedstocks include … animal parts and byproducts, mixed materials containing animal parts and byproducts … Oregon Administrative Rule 340-093-0030 (63)

\\Isgseaww01d\StaceyFile\Final Report 10-29-02 Appendices.doc 2 November 21, 2001
Include a procedure for situations where Class A pathogen reduction requirements are satisfied at one site and Vector Attraction Reduction is satisfied at a second site.
1.3 Project Responsibilities The successful completion of the project requires clear delineation of roles and responsibilities among the different participants. Contact information regarding the project participants is provided in Appendix A. The responsibilities of the participating parties are as follows: 1.3.1 State of Oregon Department of Environmental Quality (DEQ) 1. Provide staff for two days per week for monitoring for temperature and oxygen (periodic). 2. Provide backup for the OSU graduate student for temperature profile monitoring and
collection of samples. 3. Provide timely review and comment. 4. Coordination of partners in the project, as necessary. 1.3.2 Tetra Tech, Inc. (Tetra Tech) The consultant will be responsible for all planning and reporting necessary to complete the composting pilot project as defined in the task descriptions identified in the Scope of Services. Tetra Tech will oversee and direct the operations and monitoring during the study. 1.3.3 Rexius Forest ByProducts (Rexius) 1. Construct four composting piles to specifications provided by Tetra Tech to provide limited
turn windrow and passive aerated static pile composting methods. All piles will be constructed at a permitted composting facility in Eugene, Oregon by the composter’s staff and with equipment, aeration pipes, and bulking agent provided by the composter. The first 2 piles will be constructed in approximately mid-November and the second two piles in approximately early March.
2. Develop initial mix for the piles using front loaders to mix food waste, chicken offal and bulking material in 40 to 60 cubic yard batches.
3. Continue processing each pile for approximately 14 weeks for Period 1 and approximately 14 weeks for Period 2 following instructions provided by Tetra Tech.
4. Provide a sawdust or other fine textured wood chip insulation layer over the exposed exterior of the passive aerated static piles and limited turned piles. Mix the cover into the limited turn windrow at the end of week 2. Mix the cover into the passive aerated static pile at the end of week 4.
5. Provide the aeration piping for the passive aerated static piles. Provide a permeable cover for these piles, if required by Tetra Tech.
6. Provide bulking material at approximately 3 parts by volume to each part of food waste and dairy or steer manure as directed by Tetra Tech for Periods 1 and 2.
7. Provide all equipment for turning piles and measuring temperature and oxygen.

\\Isgseaww01d\StaceyFile\Final Report 10-29-02 Appendices.doc 3 November 21, 2001
8. Store sampling collection containers and sampling equipment and make them available to sampling personnel. (Containers and equipment will be provided by Tetra Tech.)
9. Construct a runoff/leachate sample collection system following instructions provided by Tetra Tech.
10. Read and record pile temperatures on forms provided by Tetra Tech on all Tuesdays, Saturdays, and Sundays for weeks 1 and 2 ( Sundays during period 2 designated by Tetra Tech) at four locations in each pile for the duration of Periods 1 and 2. Record pile temperatures before turning.
11. Turn the limited turned windrow piles once per week and passive aerated pile once per period per turning schedule in Table 3 and as instructed by Tetra Tech. Sterilize the bucket and wheels of the loader used for turning before and after each turning event. See section 4.5 for sterilization procedures.
12. Protect the piles from contamination from any other activities at the site and limit public access.
13. Provide access to the piles for sampling and monitoring by personnel Monday through Friday during regular business hours for the duration of Periods 1 and 2.
14. Respond to and act on requests from Tetra Tech and DEQ for modifications to the 2 systems for the duration of Periods 1 and 2.
15. If required by DEQ, complete steps to be issued a solid waste letter authorization permit for this pilot project and pay the permit fee.
16. When the leachate collection bucket is full, Rexius operations staff will either use a manual sump pump or manually tip the bucket over to empty half of the leachate from the collection bucket. The bucket should be emptied to no more than one quarter to one half level. Leachate shall not be placed back on the pile. Leachate shall be dumped on the ground downslope of the pile or put into the stormwater collection pond. As the sampling day (Thursday during Period 1 and 2) approaches, care must be taken as to not completely empty the leachate collection bucket. See section 3.2 for details.
17. Provide and deliver sawdust to be used for the bottom of drop boxes for collection of food waste and chicken offal. Record the total volume of sawdust added to the commercial food waste and chicken offal.
18. After piles are constructed, insert flags in the four “routine monitoring” locations for both piles.
19. Maintain records in the field notebook located in the blower shed concerning all operational activities for each pile for both Periods 1 and 2 including turning, addition of water, covering with tarps, changes from the established protocol, etc.
1.3.4 City of Eugene (Eugene) 1. Arrange and pay for food waste collection and for all costs for composter’s contract with
Tetra Tech (see section 1.3.3). 2. Educate food waste generators and coordinate collection. 3. Arrange for delivery of food waste to the composting facility. 4. Provide staff for two days per week for monitoring temperature and oxygen (periodic).

\\Isgseaww01d\StaceyFile\Final Report 10-29-02 Appendices.doc 4 November 21, 2001
1.3.5 Oregon State University (OSU) 1. Provide temperature profile monitoring and sampling one day per week during both
operating Periods (must be Thursdays during Period 1). 2. Attend training provided by Tetra Tech in November concerning techniques for monitoring
and sampling. 3. Deliver samples to designated overnight mailing service. 4. Do research on stability for her master’s thesis. 5. Provide stability analyses as identified in the sampling and analysis plan.

\\Isgseaww01d\StaceyFile\Final Report 10-29-02 Appendices.doc 5 November 21, 2001
1.4 Pilot Study Overview 1.4.1 Pilot Study Design The composting study will seek to establish the ability of both the limited turned windrow and passive aerated windrow composting methods to destroy pathogens that might be present in commercial food waste. A set of two piles will be constructed and monitored over a fourteen-week period in November, which will be followed by a duplication of the study protocol in March. These two periods were selected to represent cool and wet periods when it would be most difficult to achieve desired temperature for a duration sufficient to reduce pathogens. 1.4.2 Monitoring and Analysis Program The composting pilot project incorporates a comprehensive monitoring and analysis program. The purpose of this program is to perform an accurate evaluation of the various processes and technologies to be used in the study. The monitoring and analysis program is divided into the following categories: ! Initial mix characterization ! Process monitoring ! Temperature profiles ! Oxygen levels ! Compost stability ! Pathogen and indicator organism testing ! Leachate quality testing ! Product characterization ! Public health parameters ! Soil physical and chemical characterization 1.4.3 Monitoring and Operations Review On the first day of the composting study, the monitoring and operations plans will be reviewed with the project staff involved with these project components. This meeting will focus on reviewing how monitoring and composting operations are to be conducted.

\\Isgseaww01d\StaceyFile\Final Report 10-29-02 Appendices.doc 6 November 21, 2001
PAGE INTENTIONALLY LEFT BLANK

\\Isgseaww01d\StaceyFile\Final Report 10-29-02 Appendices.doc 7 November 21, 2001
2. Composting Study Evaluation Criteria The following criteria will be used to assess the two composting technologies being evaluated. 2.1 Achievement of Class A Criteria A primary objective of the composting process is the achievement of high thermophilic (> 55°C) temperatures for the destruction of disease-causing microorganisms that could potentially be present in the commercial food waste. Temperature profiles will be developed for each compost pile to evaluate the impact of the various process parameters on achieving PFRP. In addition, samples will be collected and analyzed for fecal coliform and Salmonella throughout the process. 2.2 Substrate Decomposition and Compost Stability Compost stability will be determined at weeks 4, 6, 8, 10, 12, and 14 for the primary purpose of assessing the effect of compost stability on the potential re-growth of Salmonella. Stability testing data to be collected includes: ! Carbon dioxide respiration rate (determined using alkaline trap and Draeger methods) ! Solvita test (standard industry field test) ! Reduction in organic carbon content ! Reduction in carbon to nitrogen ratio ! Pathogen test results ! Microbiological testing to determine types and densities of microbes Compost stability is a measure of how well decomposed the organic compost substrate is. Research has shown that a measure of microbial respiration rate is the most sensitive and accurate measure of compost stability. As the organic substrate decomposes there is less available food for microbial growth and a concomitant reduction in microbial activity. In this project, two lab based methods and a field method will be used to measure respiration rate through the determination of carbon dioxide evolution from a sample of known mass. The alkaline trap method is a standard lab test for measuring compost stability. The Draeger method is similar to that of the alkaline trap, but will use a Draeger tube to determine the concentration of carbon dioxide in the incubation vessel. This method is being included for research purposes. The Solvita test is a proprietary field test that is being used on a wide scale and is considered an industry standard field test. This test procedure also measures the carbon dioxide evolution rate, but in a qualitative manner. 2.3 Leachate Generation and Characteristics Leachate quality will be assessed through the collection of samples and subsequent determination of Salmonella and fecal coliform. 2.4 Processing Period (Secondary Objective) The achievement of optimum degradation rates is significant as it reduces the amount of space required for composting. The following parameters will be used to compare the processing efficiency of the various process parameters:

\\Isgseaww01d\StaceyFile\Final Report 10-29-02 Appendices.doc 8 November 21, 2001
! Heat generation ! Organic carbon reduction ! Oxygen levels ! Stability testing results 2.5 Final Product Quality (Secondary Objective) The quality of the compost product will be important for end-use applications and marketing. In general, a higher quality product will have a wide range of end uses, be readily marketed, and will generate more revenue on a volume basis than lower grades. The following parameters will be used to evaluate the quality of each compost product and determine the relative impact of the two compost processes, if any, on compost quality: ! Maturity ! Salinity ! C:N ratio ! Achievement of U.S. EPA Class A and Exceptional Quality status ! Foreign matter/inert contaminant content ! Nutrient content ! Texture, color, and visual appearance ! Stability ! Salmonella and fecal coliform test results 2.6 Odor Generation (Secondary Objective) The following parameters will be evaluated to establish which of the low technology processes being assessed have the lowest potential for producing nuisance odor conditions: ! Qualitative observations ! Oxygen levels

\\Isgseaww01d\StaceyFile\Final Report 10-29-02 Appendices.doc 9 November 21, 2001
3. Composting Site Description This section of the Operations Plan provides a description of the pilot scale composting facility. More specifically, the site layout, infrastructure requirements, and equipment and supply needs are described. 3.1 Composting Area The composting area will be located at the west end of the Rexius facility, between the biofilter and aerated static pile composting area. This end of the facility is readily accessed from Dani Street. The composting area is clay lined with all runoff diverted to an onsite storage pond. When the pond is full it drains to sanitary sewer. 3.2 Leachate Collection Leachate collection will be accomplished utilizing a 45-mil thick polyethylene liner on a sloped surface (1-2%), collection pipe, and collection bucket. The liner for each pile will be approximately 25 feet in width and about 24 feet in length. The liner will accommodate approximately a 12-foot length of each pile; about half of the pile length will be lined. This will allow the pile to be turned without the front-end loader driving on the liner, which would likely damage it. The 12-foot portion of liner that extends from the pile on the downgradient end will allow for the collection of leachate. The corners of this section of liner will be drawn together to form a triangle. A 4-inch PVC collection pipe will be affixed to the downgradient point of the triangle. The collection pipe will divert leachate collected on the liner into a 5-gallon bucket designated for leachate storage. The 5-gallon bucket will be located in a hole such that the bucket lip will be slightly above ground level. The bucket will also be covered so that leachate can flow into the bucket, but rainwater doesn't enter it. On a daily basis, Rexius operations staff will check the level of leachate in the bucket. If the bucket is noted to more than 75 percent full, Rexius operations staff will either use a manual sump pump or manually tip the bucket over to reduce the volume to 50 percent full. This will ensure that leachate doesn't run over the top of the bucket and that the sample represents leachate collected over the previous week. Leachate shall not be placed back onto the pile and will be dumped on the ground downslope of the pile or put into the stormwater collection pond. As the sampling day (Thursday during Period 1 & 2) approaches, care must be taken as to not completely empty the leachate collection bucket. After the weekly leachate sample is collected on Thursday, the leachate collection bucket is to be emptied either using the manual sump pump or by manually tipping the bucket over. The bucket then needs to be sanitized by rinsing with a 10 percent bleach solution followed by rinsing with tap water until the bucket no longer has a bleach odor. 3.3 Equipment Rexius has a full complement of compost processing equipment available for use, including front-end loaders, screening equipment, and size reduction equipment.

\\Isgseaww01d\StaceyFile\Final Report 10-29-02 Appendices.doc10 November 21, 2001
PAGE INTENTIONALLY LEFT BLANK
\\Isgseaww01d\StaceyFile\Final Report 10-29-02 Appendices.doc11 November 21, 2001
4. Composting Study Operations 4.1 Food Waste Collection & Storage Food waste will be collected by three licensed haulers located in the Eugene, OR area under contract to the City of Eugene. Two haulers will collect food waste on a regular schedule from local restaurants. The food waste will be sorted by the generators into organic and non-organic fractions. The organic fraction will be collected by the haulers for this project. Food waste will be delivered and stored at a place designated by DEQ and the City of Eugene in dumpsters or drop boxes until a total of approximately 20 tons of food waste is collected. The dumpsters/drop boxes will be lined with a sawdust bed to adsorb excess moisture and additional sawdust will be used to cover the material. Rexius will provide sawdust. The dumpsters/drop boxes and cover material will provide a sufficient barrier to vectors. On the day of pile construction, the stored 20 tons of food waste will be delivered to Rexius. Five tons of offal from Foster Farms’ chicken processing plant in Creswell, Oregon will also be delivered to Rexius by a licensed hauler on the day of pile construction. The drop box used for collecting the offal will be lined with about a foot of sawdust, provided by Rexius, to absorb excess moisture. The total volume of sawdust added to the commercial food waste and chicken offal will be recorded. All food waste loads will be weighed at the transfer station prior to delivery to Rexius. After the 25 tons of food waste are delivered to Rexius, compost pile construction will commence. 4.2 Initial Mix 4.2.1 Target Mix A bulking ratio of three parts yard debris to one part food waste is proposed. However, as the following discussion indicates, a higher bulking ratio may be required to produce a suitable initial mix. The physical and chemical characteristics of the initial mix are crucial to the achievement of optimum process conditions. In particular, readily degradable carbon substrates (energy), moisture, porosity, nutrients, and pH need to be at appropriate levels. Optimum initial mix characteristics for composting food waste are summarized in Table 1. Tetra Tech staff will determine optimal mix characteristics for both piles for Periods 1 and 2. Table 1: Optimum Initial Mix Characteristics for Composting Initial Mix Characteristic Optimum Level for Composting Moisture content 55 to 60 percent Volatile solids 60 to 90 percent Bulk density 900 to 1,200 pounds/cubic yard Carbon to nitrogen ratio 25 to 40 pH 6.0 to 7.5 Porosity > 35 percent air filled pore space

\\Isgseaww01d\StaceyFile\Final Report 10-29-02 Appendices.doc12 November 21, 2001
Of particular significance is creating an initial mix with a moisture content between 55 and 60 percent. If this target is reached, the other mix characteristics are typically within an acceptable range. However, if the total solids content of the food waste and bulking material are low (high moisture content), a high bulking ratio will be required to meet the target solids content. Assuming the food waste has a 20 percent solids content and the bulking material has a 50 percent solids content, a bulking ratio of approximately three parts bulking material to one part food waste is needed. Figure 1 shows the effect of bulking material solids content on the bulking ratio, assuming the food waste has a solids content of 15 and 20 percent. If the bulking material has a solids content of 50 percent, a bulking ratio of approximately 4:1 will be required. Depending on the bulking rate used, a pile volume of 75 to 100 cubic yards per pile is anticipated.
4.2.2 Salmonella Innoculum Addition The use of chicken processing waste, referred to as offal, will be used as an innoculum for introducing Salmonella in the test piles. This material will be added at the beginning of the study during the initial mixing of the feedstocks. Approximately eight tons of chicken offal will be collected and used. The Salmonella concentration of the chicken offal to be used will not be known prior to pile mixing. It is anticipated that the addition of the chicken offal will result in the initial mix having a target Salmonella concentration of approximately 10 Salmonella spp. per dry gram of initial mix. Equation 1 can be used to estimate the mass of chicken manure offal to achieve the target Salmonella concentration.
Figure 2 - Effect of Bulking Material Solids Content on Bulking Ratio
0
2
4
6
8
10
12
14
16
18
20
44% 45% 46% 47% 48% 49% 50% 51% 52% 53% 54% 55% 56% 57% 58% 59% 60% 61% 62% 63% 64% 65% 66% 67% 68% 69% 70%
Bulking Material Total Solids Content
Bul
king
Mat
eria
l to
Food
Was
te R
esid
uals
Rat
io
15 % Total Solids 20 % Total Solids

\\Isgseaww01d\StaceyFile\Final Report 10-29-02 Appendices.doc13 November 21, 2001
Mmass = Mixc * Mixdry mass (Equation 1) Mc * Mts Where, Mmass = Mass of chicken offal to be used (wet kg) Mixc = Initial mix target Salmonella concentration (MPN/wet kg) Mixdry mass = Initial mix mass (dry kg) Mc = Chicken offal Salmonella concentration (MPN/wet kg) Mts = Chicken offal total solids content (fraction) An equivalent fraction of chicken offal will be incorporated into each compost pile by thoroughly mixing the chicken offal with the collected commercial food waste using front-end loaders. The resulting food waste mixture will then be thoroughly mixed with bulking material in 40 to 60 cubic yard batches. The mix will be visually inspected to ensure that there are no signs of unmixed chicken offal or food waste. 4.2.3 Fecal coliform Innoculum Addition To ensure there is an adequate population of fecal coliform bacteria, dairy or steer manure will be added to the food waste/chicken offal mixture at a volumetric rate of approximately 10 percent. With an estimated total volume of food waste and chicken offal of approximately 20 cubic yards, about two cubic yards of steer manure will be incorporated. The bulk density of the steer manure will be determined allowing for the tonnage of manure to be estimated. Rexius will provide Dairy/steer manure. 4.3 Pile Construction Two individual 75 to 100 cubic yard piles will be constructed for each of the two operating periods. The two piles will be constructed simultaneously from each individual mix batch. This will help to assure that compositions of the two piles are similar. Each pile will have a one-foot insulative cover that will be comprised of sawdust or other similar fine textured wood debris. Care will be taken to assure the same amount of sawdust or other similar fine textured wood debris is used as cover on both piles. The purpose of the insulative cover is to reduce nuisance pest access, and to hold in heat and odors generated. This is a typical practice for the passive aerated windrow, but atypical for turned windrow. However, in order to reduce nuisance pest access, an insulative cover will be used when the turned windrow piles are constructed. The insulative cover will be incorporated into the turned windrow pile after the first week of composting and into the passive aerated pile after the fourth week of composting, and will not be replaced. Observations regarding nuisance pest access potential will be made at this point and recommendations regarding the use of an insulative cover for the turned windrow method will be developed. The insulative cover will increase the pile volume approximately 35 percent, resulting in a total volume of approximately 100 to 130 cubic yards. After a suitable initial mix has been prepared, the piles will be constructed on the temporary compost pad liners using a front-end loader. The piles will be built in a windrow formation approximately 20 feet wide and 10 feet high. These pile dimensions will allow the pile to be constructed without the loader operator driving on top of the pile. A conscious effort will be made to make the piles as high as possible and the sides as steep as possible to reduce the amount of water absorbed when it is raining. Approximate pile dimensions and volumes are summarized in Table 2.

\\Isgseaww01d\StaceyFile\Final Report 10-29-02 Appendices.doc14 November 21, 2001
Table 2: Compost Pile Dimensions Mix Height (ft) 10 Cover depth 1 Total Height (ft) 11 Base Length (ft) 27 Base Width (ft) 20 Pile Mix Volume (cy) 74 Pile Cover Volume (cy) 32 Total Pile Volume (cy) 106
Aeration pipe will be placed in the passive aerated windrow every three feet at a height of about two feet from ground level. Corrugated 4-inch diameter drainfield pipe that has holes around the pipe periphery will be used. The pipe will need to be about 24 feet in length and with about 6 lengths of pipe needed, a total of approximately 150 feet of drainfield pipe is needed. An alternate design can be found in the On-Farm Composting Handbook pg. 29, which shows pipe spacing at 12-18 inches and 4-inch perforated pipe with 12-inch spacing between holes. The closer spacing of pipe used in this design would require two to three times as much pipe per pile and is not considered practical on a commercial scale. 4.4 Process Control The primary objective of process control is to maintain optimum composting conditions. In a high technology process, process control could include aeration, water, and nutrient adjustments. However, in this project using the low technology limited turn (once per week) and passive aerated windrow processes, the operator has a limited ability to control the process. Process control will rely on: The development of an initial mix as defined in Section 4.2; and Limited moisture control. Given the climate during the composting trials, the need for water addition is not a likely possibility and an excessively high moisture content is a more likely issue. To reduce the effect of rainfall in making the piles excessively wet, the operator will seek to reduce the opportunity for water absorption by building high steep sided piles. In the event high rainfall is predicted during the project, the use of tarps to protect the piles may be considered. 4.5 Pile Turning The limited turn windrow pile will be turned weekly and the passive aerated windrow pile will be turned once (after four weeks of composting) with a front-end loader.

\\Isgseaww01d\StaceyFile\Final Report 10-29-02 Appendices.doc15 November 21, 2001
Table 3: Pile Turning Schedule Pile Turning Day
Process Week Limited Turn Windrow Passive Aerated Windrow 1 none None 2 Tuesday None 3 Tuesday None 4 Monday during Period 1,
Tuesday during Period 2 Tuesday
5 Monday during Period 1, Tuesday during Period 2
None
6 Tuesday None 7 Tuesday None 8 Tuesday None
Pile turning will entail breaking down the pile and rebuilding it on a second, adjacent compost/leachate collection pad. The unused leachate collection pad will be protected from contamination when not in use by restricting traffic in the area. The front-end loader bucket and front wheels will be sanitized using the following procedure prior to turning each pile: Remove material from the loader bucket and wheels using cold water and a shovel, broom or other hand tool. Make up approximately 10-gallons of a 10 percent household bleach solution. Apply the solution to the loader bucket and wheels using a manual-spraying device similar to that used for the application of fertilizer and pesticides. Rinse the bucket and wheels with potable water. The loader sanitation process will be conducted directly on the clay lined compost pad in order to control the resulting runoff. The primary purpose of the sanitation procedure is to limit any cross contamination of fecal coliform and Salmonella bacteria between the two test piles. 4.6 Screening The purpose of screening is to produce a product desired by the potential users. Generally, screening removes the large, oversized (>1/2”) woody fraction of the product. Final product samples will be collected for analysis prior to screening the material. The product could then be screened by Rexius to achieve the desired characteristics for marketing. 4.7 Site Health and Safety There are some health and safety risks associated with the composting study. Adherence to the following guidelines is recommended. People entering the site from the main entrance need to check in with the person attending the tipping booth. People entering the site from Dani Street do not need to check in, but need to be sure that their cars are parked appropriately and the gate is closed after entering or leaving the site. Reflective Vests. Anybody entering the site, regardless of their task or intended purpose is required to wear an orange reflective safety vest. The vest improves visibility allowing equipment operators to more readily see people working on the ground. Vest will be available in the blower shed.

\\Isgseaww01d\StaceyFile\Final Report 10-29-02 Appendices.doc16 November 21, 2001
Heavy Equipment – Stand clear of front-end loaders and other heavy equipment while they are operating. Avoid being behind such equipment and be sure you are visible to the operator. Pathogenic Microorganisms – The compost piles will contain some human pathogens and to minimize exposure, project staff should wash hands thoroughly and change clothing after operations. This is especially important before eating or smoking. Staff that is coming in close contact with the compost, especially during sample collection, should wear protective gloves. The use of heavy boots and work clothes is also recommended. Other Hazards – Depending on site activities being performed, especially at other areas of the facility (i.e. grinding), the use of safety glasses and earplugs should be considered.

\\Isgseaww01d\StaceyFile\Final Report 10-29-02 Appendices.doc17 November 21, 2001
5. Process Monitoring and Data Recording Process monitoring is a crucial component of the commercial food waste composting pilot project. Tetra Tech will review the process monitoring data weekly. Process monitoring data, which includes field measurements, sampling and lab analysis, will be used to: Determine appropriate process adjustments and convey information to DEQ for approval, then to appropriate participants for implementation Provide the operators with a quantitative means of assessing the composting conditions and how the process is progressing by contacting on a weekly basis either by phone or via email Document the ability of each process to meet Class A pathogen reduction criteria Characterize the quantity and quality of leachate generated based on Salmonella and Fecal coliform results Determine the value of the product as a soil amendment using parameters in Section 2.5 5.1 Process Monitoring/Sampling Schedule and Responsibilities The process-monitoring schedule is summarized in Table 4.

\\Isgseaww01d\StaceyFile\Final Report 10-29-02 Appendices.doc18 November 21, 2001
Table 4: Process Monitoring/Sampling Schedule (for each compost pile) Process Week Analytical
Parameter Innoculum
Food Waste
Bulk Material
Sawdust
Initial Mix
1 2 3 4 5 6 7 8 10 12 14
Laboratory Analyses Total Solids 1 1 1 1 1 1 1 1 1 1 1 1 1 1 CO2 Respirationa
4 4 4 4 4 4
Solvitaa Stability
4 4 4 4 4 4
Organic Carbon
1 1 1 1 4 4 4 4 4 4
TKN 1 1 1 1 4 4 4 4 4 4 Fecal Coliform
1 1 1 1 1 1 1 1 1 1
Salmonella 1 1 1 1 1 1 1 1 1 1 Conductivity
1
Sieve Analysis
1
pH 1 Ammonium 1 Nitrate 1 Plant Nutrientsb
1
Trace Metalsc
1
Leachated 1 1 1 1 1 Field Monitoring Bulk Density
3 3 3 3 3 3
Mix Volume 1 1 Temperature x x x x x x x x x x x x Oxygen x x x x x x x x x x x x
aDetermined by both Alkaline Trap and Draeger Tests bP, K, Mg, Ca, Fe cAs, Cd, Cr, Cu, Hg, Pb, Ni, Zn dLeachate is analyzed for Salmonella and fecal coliform Several parties (DEQ, Eugene, OSU, and Rexius) will maintain responsibility for carrying out the monitoring program. Consequently, coordination among the parties will be very important. A schedule of which party will conduct monitoring on which days is provided as follows:
\\Isgseaww01d\StaceyFile\Final Report 10-29-02 Appendices.doc19 November 21, 2001
Monday: Tuesday Wednesday: Thursday: Friday: Saturday: Sunday:
City of Eugene: Alex Cuyler or Anne Donahue Rexius: Jack Hoeck coordinates DEQ: Brian Fuller Teresa Matteson, OSU DEQ: Brian Fuller Rexius: Jack Hoeck coordinates Rexius: Jack Hoeck coordinates
If a party is unable to make a scheduled monitoring site visit, it is imperative that they find a backup prior to the scheduled monitoring event. With the exception of OSU, all parties will engage in the "routine monitoring" activities described in the following sections. Oregon State University staff will implement the "intensive monitoring" and sampling activities. DEQ will provide backup for OSU. On a weekly basis, DEQ staff (Brian Fuller) will fax or email the previous weeks monitoring results to Stacey Servo at Tetra Tech. 5.2 Equipment and Supplies All equipment and supplies needed for the project will be stored in the blower shed at the Rexius site. Tetra Tech will provide boxes for storing supplies and will initially seek to stock the shed with all of the supplies needed for the entire project. Tetra Tech staff will check that all supplies are restocked during the mid-project visit for Period 1 and again for Period 2. If equipment is damaged or inoperable or additional supplies are needed, please contact Stacey Servo at Tetra Tech so arrangements can be made for replacing the equipment or restocking supplies. Please keep the shed neat and remove any trash on a daily basis. 5.3 Field Monitoring Methodology The purpose of field monitoring is to collect data used to monitor the composting process. This information will primarily be used to document the temperature and substrate availability conditions (stability tests) relative to the survival of Salmonella and fecal coliform bacteria. This information will also be used to manage day-to-day composting activities. Four parameters will be measured in the field according to the schedule defined in the Operations Plan. The parameters include: Temperature: daily Oxygen: periodic Bulk Density: initial mix and final product Pile Volume: initial mix and final product Field methodology and monitoring equipment required are described in the following sections. 5.3.1 Pile Temperature Temperature monitoring will be conducted daily ("routine monitoring"), with more "intensive monitoring" conducted on a weekly basis (Thursday during Period 1) by OSU staff. Each compost pile will be monitored for temperature by inserting four-foot-long temperature probes into four "routine monitoring" locations in each pile. The temperature monitoring probes used for measuring temperature at
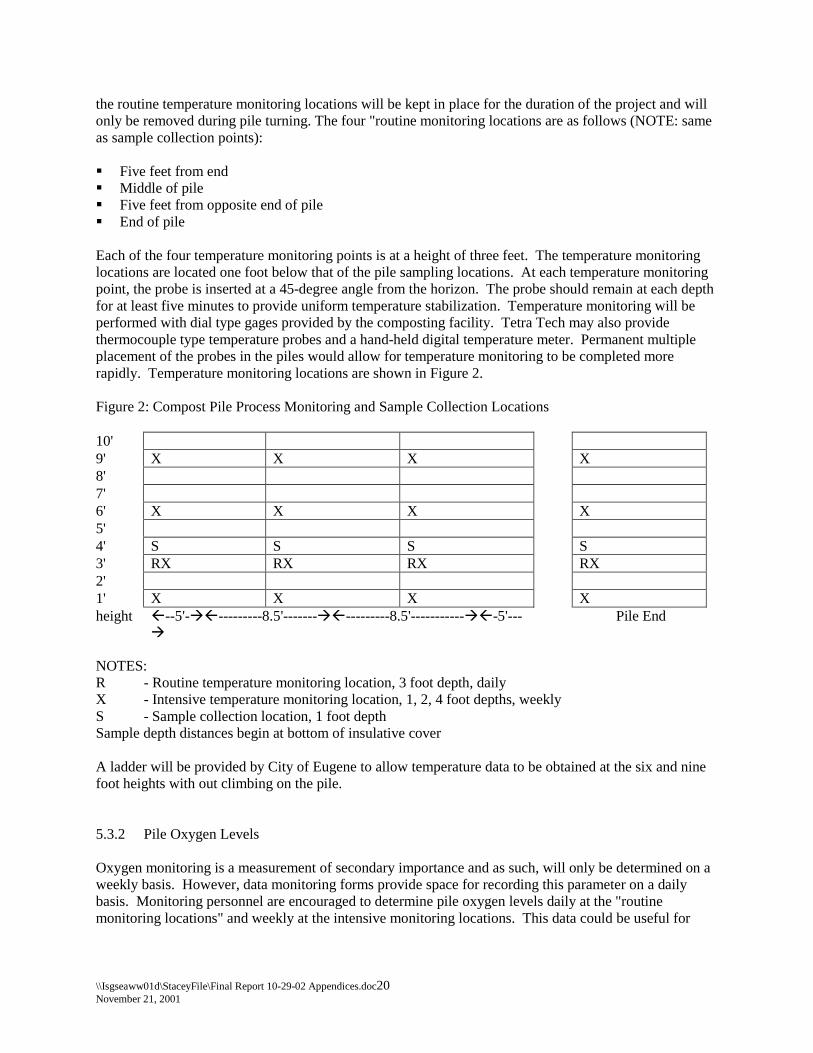
\\Isgseaww01d\StaceyFile\Final Report 10-29-02 Appendices.doc20 November 21, 2001
the routine temperature monitoring locations will be kept in place for the duration of the project and will only be removed during pile turning. The four "routine monitoring locations are as follows (NOTE: same as sample collection points): ! Five feet from end ! Middle of pile ! Five feet from opposite end of pile ! End of pile Each of the four temperature monitoring points is at a height of three feet. The temperature monitoring locations are located one foot below that of the pile sampling locations. At each temperature monitoring point, the probe is inserted at a 45-degree angle from the horizon. The probe should remain at each depth for at least five minutes to provide uniform temperature stabilization. Temperature monitoring will be performed with dial type gages provided by the composting facility. Tetra Tech may also provide thermocouple type temperature probes and a hand-held digital temperature meter. Permanent multiple placement of the probes in the piles would allow for temperature monitoring to be completed more rapidly. Temperature monitoring locations are shown in Figure 2. Figure 2: Compost Pile Process Monitoring and Sample Collection Locations 10' 9' X X X X 8' 7' 6' X X X X 5' 4' S S S S 3' RX RX RX RX 2' 1' X X X X height #--5'-$#---------8.5'-------$#---------8.5'-----------$#-5'---
$ Pile End
NOTES: R - Routine temperature monitoring location, 3 foot depth, daily X - Intensive temperature monitoring location, 1, 2, 4 foot depths, weekly S - Sample collection location, 1 foot depth Sample depth distances begin at bottom of insulative cover A ladder will be provided by City of Eugene to allow temperature data to be obtained at the six and nine foot heights with out climbing on the pile. 5.3.2 Pile Oxygen Levels Oxygen monitoring is a measurement of secondary importance and as such, will only be determined on a weekly basis. However, data monitoring forms provide space for recording this parameter on a daily basis. Monitoring personnel are encouraged to determine pile oxygen levels daily at the "routine monitoring locations" and weekly at the intensive monitoring locations. This data could be useful for

\\Isgseaww01d\StaceyFile\Final Report 10-29-02 Appendices.doc21 November 21, 2001
assessing the ability of both low technology composting methods for introducing oxygen into the compost matrix. Oxygen levels within each pile are determined by using an air sampling probe, air pump, and electronic oxygen meter provided by Rexius. All components are attached together and function as a single instrument. Pile oxygen content readings are determined according to the following procedure. The probe is first inserted into the compost pile to the desired depth. After insertion, the pump is used to evacuate air until a stable oxygen level is recorded. After a stable reading has been achieved (approximately one minute) and recorded, the probe is inserted to depths of three- and four-feet. The level of oxygen in the sample is read directly from the oxygen meter. Care should be taken to avoid placing the probe in the cavity created by the previous probe insertion point. Prior to determining the oxygen content in a pile, the probe needs to be sanitized with the spray disinfectant and paper towels provide in the blower shed. 5.3.3 Bulk Density Bulk density is a basic measurement used for developing an input/output mass balance. The bulk density of the feedstocks, initial mixes, and final products will be determined. Bulk density is determined by field weighing a container of a known volume that has been filled with compost. Bulk density measurements will be taken from several points in the feedstock, initial mix, and final product piles. The bucket is filled with material taken from beneath the insulative cover. Next, the bucket is dropped three times from a height of six to eight inches onto a hard surface. The bucket is then refilled to the top and weighed using a hanging scale. Bucket volume can be determined by weighing full of water. 5.3.4 Pile Dimensions and Volume Pile dimensions and volume will be determined at the beginning and end of the composting process by Tetra Tech staff to obtain data for an input/output mass balance. Pile volume is determined by recording the total length of the pile, and the width, side angle distance (crown to base), and total pile base to crown distance in at least three pile locations or by determining the weight of each pile after pile is built and at the end of week 14. Rexius will determine the weight of each pile as it is built and the weight of each pile at the end of week 14 with the bucket loader or scale and report that information to Tetra Tech. This determination is made immediately after the piles are constructed. A spreadsheet formula is constructed to determine the pile volume. 5.4 Qualitative Observations Project participants involved with daily monitoring are encouraged to record any observations made on the monitoring form (see Appendix B) during their visit that they deem to be noteworthy. These observations might include: ! Relative odor of both piles, especially during turning and sampling ! Presence or evidence of insects or nuisance pests ! Relative amount of un-decomposed food waste on pile exterior ! Evidence of heat or visible steam

\\Isgseaww01d\StaceyFile\Final Report 10-29-02 Appendices.doc22 November 21, 2001
5.5 Compost Sample Collection Protocol The objectives of a sampling protocol are to: Gather a representative sample of the matrix to be analyzed using appropriate sampling apparati. Package and deliver the sample to the analytical laboratories using appropriate sample handling procedures. 5.5.1 Sampling Procedures During the pilot study all scheduled sampling will be conducted using composite sampling procedures, except for those samples collected for stability analysis, which will be collected using grab sampling procedures. A composite sample entails the mixing or compositing of several subsamples taken from different locations in the compost pile. A grab sample entails selecting one location for sample collection. Sanitation of sampling equipment is necessary; see Section 5.5.2 for details. In the pilot study, composite sampling will entail the following procedure: 1. Subsamples will be taken from the following four locations in each pile: % Pile side - 5 feet from the end of the pile, middle of the pile, 5 feet from the opposite end
of the pile, and end of the pile % Conical feedstock stockpiles will be sampled at six equidistant points around the
stockpile. 3. Subsamples will be taken at a depth of one foot into the actual pile. If the pile has a foot
deep insulative cover, the subsample would be collected at a depth of two feet. A shovel will be used to access the area where the sample is to be collected. Care must be taken as to not include any of the insulation cover layer material in the subsample. The shovel needs to be sanitized prior to collecting the subsamples from a given test pile (but not sanitized between subsamples). Sterilization procedures are specified in Section 5.5.2 .
4. A hand trowel will be used to retrieve a two-liter subsample. A glass measuring cup or pre-
sanitized plastic scoops will be used to meter out a consistent volume of sample. The subsample is to be deposited into the compositing container (black 20 gallon rubber tub). This process is repeated for each of the four sampling points for the pile being sampled.
5. After all four points have been sampled; the resulting composite sample is mixed well using
the hand trowel. Mixing needs to be conducted on a very clean surface and plastic gloves should be used during mixing and sample collection and discarded between each sampling to avoid sample contamination. The goal of mixing is to create as homogenous sample as possible. This will entail manually breaking up both clumps and food waste pieces into smaller sized pieces using the hand trowel. In the early part of the composting process, and for the food waste feedstock in particular, it may be necessary to place the sample in a five-gallon bucket and to then "chop" the food waste using the shovel.
6. A cone and quartering procedure, described as follows is used to reduce the sample into
smaller samples that will be sent to the respective laboratories. The sample is formed into a
\\Isgseaww01d\StaceyFile\Final Report 10-29-02 Appendices.doc23 November 21, 2001
conical pile that is then physically divided into four equal subsamples. Depending on the amount of sample needed, either one-quarter is retained and the process is repeated if necessary, or two or more quarters of the subsample are discarded with the intent of leaving the desired amount of sample needed. The resulting sample is then mixed well prior to sample transfer. The potential for contaminating the sample is greatest during this procedure.
7. Samples are transferred into their respective containers used for each lab (Table 5) using the
hand trowel. Sample should be removed from different points of the subsample and all containers should be filled simultaneously.
In the pilot study, grab sampling will entail the following procedure: 1. One grab sample per location will be taken from the following 4 locations:
• Five feet from end • Middle of pile • Five feet from opposite end of pile • End of pile
2. Samples will be taken at a depth of one foot into the actual pile. If the pile has a foot deep
insulative cover, the sample would be collected at a depth of two feet. A shovel will be used to access the area where the sample is to be collected. Care must be taken as to not include any of the insulation cover layer material in the sample. The shovel needs to be sanitized prior to collecting the samples from a given test pile. Sterilization procedures are specified in Section 5.5.2.
3. Samples are transferred into their respective containers used for each lab (Table 5) using the
hand trowel. In the pilot study, sample labeling and shipping will entail the following procedure: 1. Sample containers are labeled with the project name (OR DEQ FW), pile identification number
(TW/PAW), and date using a stick on label and an indelible ink pen. An “example” label for each type of sample is located in Appendix D.
2. A chain of custody will be filled out completely for each sampling container shipped and will
contain the following information Tetra Tech’s address, contact person’s phone and fax number, sample description, sample ID, analysis requested, and a relinquished signature. An “example” chain of custody is located in Appendix D.
3. Microbiological samples will be placed in a cooler with three “blue ice” containers immediately after
collection. Teresa Matteson of OSU will bring the frozen “blue ice" containers on the sampling day. Care should be taken to avoid sample exposure to direct sunlight or heat. Samples will be shipped via Fed Ex priority overnight, since there is a 24-hour holding period on the water samples. Fed Ex labels containing the following information Tetra Tech’s address, billing reference number, Fed Ex account number, and laboratory address will be attached to every cooler. An “example” Fed Ex label is located in Appendix D. Tetra Tech will be responsible for sample shipping and handling costs.

\\Isgseaww01d\StaceyFile\Final Report 10-29-02 Appendices.doc24 November 21, 2001
5. The samples are shipped to the respective laboratory using the method indicated in Table 5. With the
exception of the samples being analyzed for microbiological parameters, all the samples will be shipped or transferred in cardboard boxes. Contact information and shipping addresses for each lab are presented in Appendix C.
Table 5: Sample Shipping Information (addresses are located in Appendix C) Analytical Laboratory
Analysis Frequency
Analyses
Sample Volume Sample Containers
Shipping Method
Oregon State University
Initial, bi-weekly
TS, TKN, C, stability
1 gallon 1 gallon ziplock
Hand delivery, cardboard box
Anresco for Period 1 BAL for Period 2
weekly FC, Salmonella TSS
1 liter compost 500 ml leachate
1 quart ziplock 500 ml PE
Overnight, FedExa cooler w/ ice
Soil Control Lab
Final product product quality parameters
1 gallon 1 gallon ziplock
FedExa
cardboard box aThe nearest FedEx location is 3003 W 11th Avenue, Eugene, Oregon 97401. Express drop-off hours are Monday through Friday, 9:00 AM to 4:00 PM. A sampling schedule for Period 1, including sampling dates, process week, sampling ID, sample description, quantity, sample size, laboratory, and analyses, is located in Appendix E. 5.5.2 Sanitation Procedure To prevent cross contamination between samples taken from each pile, sampling equipment will be sanitized prior to sample collection, between test piles, and after samples are collected from each of the two piles (three times per sampling event). The procedure entails the following steps: Partially fill a five-gallon bucket with a 10 percent solution of household bleach and water. Partially fill another bucket with tap water. After sampling each pile, lightly scrub the Pyrex measuring cup, sampling trowel and the compositing pail with the bleach water and rinse with the tap water. Commence sampling the next pile and repeat the decontamination procedure after sampling has been conducted. An alternative sterilization procedure for the sampling trowel involves poring alcohol over the metal portion and then igniting it. 5.5.3 Sampling Equipment and Supplies The following equipment, supplied by Tetra Tech, will be used for sample collection: ! Shovel, long handle ! Hand trowel ! Measuring cup, Pyrex ! Compositing pail, 20-gallon rubber ! Decontamination pails (2), plastic, five gallon

\\Isgseaww01d\StaceyFile\Final Report 10-29-02 Appendices.doc25 November 21, 2001
! Plastic brush, long handle ! Household bleach ! 1-gallon ziplock bags (50) ! 1-quart ziplock bags (50) ! Cardboard boxes for delivering samples to OSU and shipping samples to Soil Control Lab (8) ! 200 mil polyethylene bottles (20) ! Styrofoam coolers, 8-quart volume (10) ! Blue ice packets (20) ! Paper towels ! Disposable latex gloves ! Spray disinfectant (this is identified in section 5.5.2) ! Blank adhesive labels for each type of sample ! Pre-printed adhesive shipping labels for 2 labs (1 per lab) ! Field monitoring forms (20) two plastic sheets to cover from while recording in the rain. ! Pens that write in the rain (6) ! Clipboards (3) ! Ladder This and all sampling and analysis equipment will be stored in the blower shed. Please keep this area neat and remove any trash on a daily basis. 5.6 Product Characterization The final product will be characterized for the following: Public health parameters – Salmonella and fecal coliform Soil physical and chemical characteristics – total solids, CO2 respiration, Solvita stability, Organic carbon, TKN, conductivity, sieve analysis, pH, ammonium, nitrate, plant nutrients, and trace metals 5.7 Leachate Sample Collection Protocol Leachate will be collected at the downslope end of each compost pile in a five gallon plastic bucket. For the day prior to sample shipment and the day of sample shipment, a 200 ml leachate subsample will be collected from each pile by immersing a sanitized measuring cup into the five gallon plastic bucket and transferring it into the labeled leachate sampling container.. Samples should be collected such that material floating on the surface is excluded. Only pre-sanitized containers and collection equipment should be allowed to contact the liquid being sampled. Samples collected on the day prior to sample shipment should be kept in the storage shed in a cooler with a blue ice packet. On the day of sample shipment, the collected composite samples will be mixed thoroughly by gently shaking or swirling the sample container. After mixing, a 200 ml aliquot sample will be transferred into 200 ml liter sample collection bottle for each pile. The Sample collection bottles need to be labeled with the project ID (OR DEQ FW), pile ID (TW/PAW), and date. Immediately after the samples are collected, they need to be placed in a cooler with blue ice.

\\Isgseaww01d\StaceyFile\Final Report 10-29-02 Appendices.doc26 November 21, 2001
During the project time frame, the early and late winter months there is typically adequate rainfall to generate enough leachate to collect a 200 ml sample on a weekly basis. Of utmost importance is to never completely empty the leachate collection bucket (either by using the manual sump pump or by tipping the bucket over) when it is full, except for Thursdays (during Period 1) when the bucket is completely emptied after the weekly sample is collected. If full, the bucket should only be emptied to the 50 percent level. This is especially important on Tuesdays and Wednesdays, which proceed the Thursday sample collection day.
\\Isgseaww01d\StaceyFile\Final Report 10-29-02 Appendices.doc27 November 21, 2001
5.8 Data Collection and Recording Data will be managed during the project according to the following steps: Monitoring and sampling personnel and Rexius operations staff will: Record field data directly onto data sheets. Brian Fuller of DEQ will fax the data on the previous week’s monitoring form to Stacey Servo at Tetra Tech on a weekly basis. Maintain a field notebook at the site to record sampling performed, turning of piles, and daily activities, observations and general comments. Tetra Tech staff will: Enter field and lab data into a computer-generated spreadsheet according to parameter, pile ID and date collected. Old field data sheets will be stored in chronological order by category in a three ring binder. Data entered into the spreadsheets will be printed and distributed on a weekly basis to Lauren Ettlin at DEQ. Laboratory and field monitoring data sheets to be used during the project are presented in Appendix B. 5.9 Contingencies There will be an opportunity to revise the protocol after Period 1 is over and before Period 2 commences. However, if problems or any questions arise during Period 1, contact Stacey Servo or Larry Sasser at Tetra Tech. Tetra Tech will inform DEQ and Rexius of problems and together Tetra Tech, DEQ and Rexius will decide how best to address specific problems as they occur.

\\Isgseaww01d\StaceyFile\Final Report 10-29-02 Appendices.doc28 November 21, 2001
PAGE INTENTIONALLY LEFT BLANK

\\Isgseaww01d\StaceyFile\Final Report 10-29-02 Appendices.doc November 21, 2001
Appendix A
Project Contact List OR DEQ Lauren Ettlin Phone: (503) 229-5934 Fax: (503) 229-6977 email: [email protected] 811 SW 6th Ave. Portland, OR 97204 Brian Fuller Phone: (541) 686-7838 Fax: (541) 686-7551 email: [email protected] 1102 Lincoln St., #210 Eugene, OR 97401 William Bree Phone (503)229-6046 Fax: (503)229-6977 Email: [email protected] 811 SW 6th Ave. Portland, OR 97204
Tetra Tech, Inc. Phone: (206) 728-9655 Fax: (206) 728-9670 1925 Post Alley Seattle, WA 98101 Larry Sasser ext 123 Email: [email protected] Stacey Servo ext 124 Email: [email protected] Gerry Croteau Email: [email protected] Rexius Jack Hoeck Phone: (541) 342-1835 Fax: (541) 343-4802 email:[email protected] Ron Raugh Cell phone: (541) 912-7457
City of Eugene Alex Cuyler Phone: (541) 682-6830 Email: [email protected] Anne Donahue Phone: (541)682-5542 Email: [email protected] Fax: (541)682-6806 99 West 10th Ave., Suite 240 Eugene, OR 97401
Oregon State University Dan Sullivan Phone: (541) 737-5715 Fax: (541) 737-5725 email: [email protected] Teresa Matteson email: [email protected] or (home) [email protected] Phone: home (541)738-0879 ALS 3017 Oregon State University Corvallis, OR 97331-3002

\\Isgseaww01d\StaceyFile\Final Report 10-29-02 Appendices.doc November 21, 2001
PAGE INTENTIONALLY LEFT BLANK

\\Isgseaww01d\StaceyFile\Final Report 10-29-02 Appendices.doc November 21, 2001
Appendix B
Field Monitoring Data Sheets

\\Isgseaww01d\StaceyFile\Final Report 10-29-02 Appendices.doc November 21, 2001
PAGE INTENTIONALLY LEFT BLANK

\\Isgseaww01d\StaceyFile\Final Report 10-29-02 Appendices.doc November 21, 2001
Field Monitoring Form - OR DEQ Food Waste Composting Study
Pile ID:____________ Point A: Five feet from north end of pile
Point C: Five feet from south end of pile
Phase: Composting Point B: Middle of pile side Point D: Middle of south end of pile
Date Time ID Process
Ambient Pile Temperatures Pile Oxygen Levels Notes
(initials) Day Temp A B C D A B C D (odor, weather, pests & access, visible steam/food waste) 1
2
3
4
5
6
7
Supplies running low? - Contact Stacey Servo - Tt at 206.728.9655 ext 124 Equipment not operating correctly? - Ask Jack Hoeck for assistance, if not available contact Stacey Servo Field Monitoring Form - OR DEQ Food Waste Composting St d

\\Isgseaww01d\StaceyFile\Final Report 10-29-02 Appendices.doc November 21, 2001
Study Pile ID:____________ Point A: Five feet from north end of
pile Point C: Five feet from south end of pile
Phase: Composting Point B: Middle of pile side Point D: Middle of south end of pile
Date Time ID Process
Ambient Pile Temperatures Pile Oxygen Levels Notes
(initials) Day Temp A B C D A B C D (odor, weather, pests & access, visible steam/food waste) 8
9
10
11
12
13
14
Supplies running low? - Contact Stacey Servo - Tt at 206.728.9655 ext 124 Equipment not operating correctly? - Ask Jack Hoeck for assistance, if not available contact Stacey Servo Field Monitoring Form - OR DEQ Food Waste Composting Study
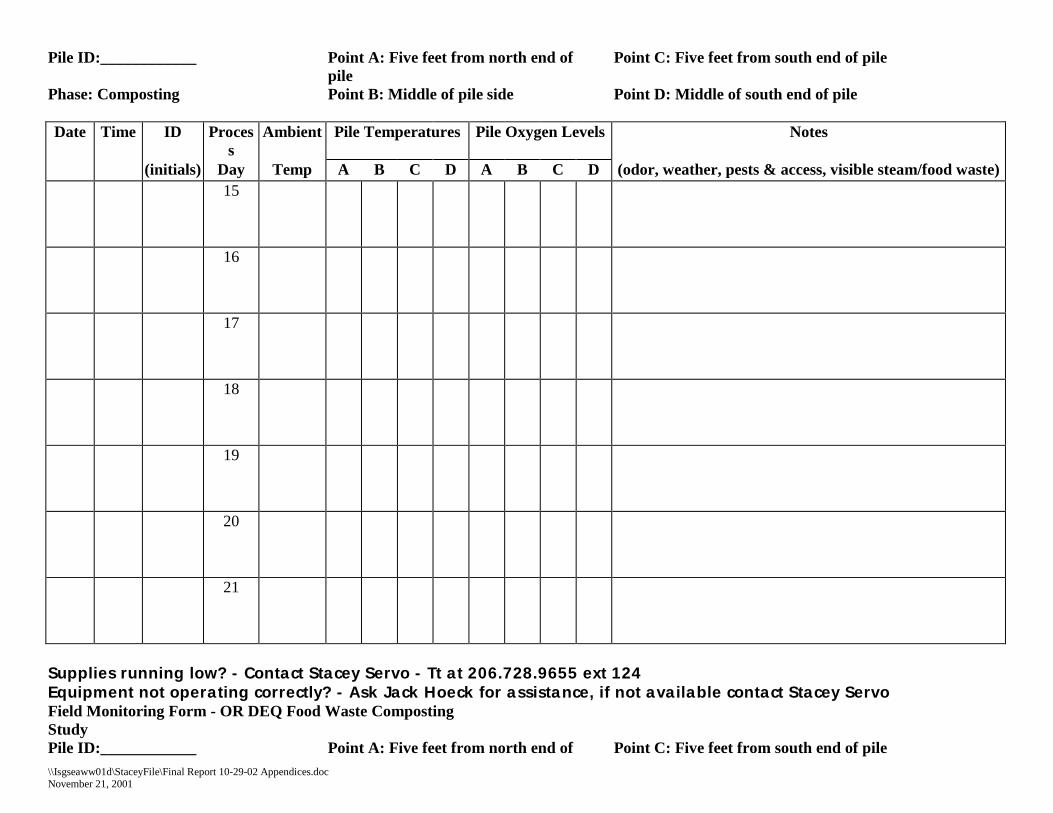
\\Isgseaww01d\StaceyFile\Final Report 10-29-02 Appendices.doc November 21, 2001
Pile ID:____________ Point A: Five feet from north end of pile
Point C: Five feet from south end of pile
Phase: Composting Point B: Middle of pile side Point D: Middle of south end of pile
Date Time ID Process
Ambient Pile Temperatures Pile Oxygen Levels Notes
(initials) Day Temp A B C D A B C D (odor, weather, pests & access, visible steam/food waste) 15
16
17
18
19
20
21
Supplies running low? - Contact Stacey Servo - Tt at 206.728.9655 ext 124 Equipment not operating correctly? - Ask Jack Hoeck for assistance, if not available contact Stacey Servo Field Monitoring Form - OR DEQ Food Waste Composting Study
Pile ID:____________ Point A: Five feet from north end of Point C: Five feet from south end of pile

\\Isgseaww01d\StaceyFile\Final Report 10-29-02 Appendices.doc November 21, 2001
pile Phase: Composting Point B: Middle of pile side Point D: Middle of south end of pile
Date Time ID Proces
s Ambient Pile Temperatures Pile Oxygen Levels Notes
(initials) Day Temp A B C D A B C D (odor, weather, pests & access, visible steam/food waste) 22
23
24
25
26
27
28
Supplies running low? - Contact Stacey Servo - Tt at 206.728.9655 ext 124 Equipment not operating correctly? - Ask Jack Hoeck for assistance, if not available contact Stacey Servo

\\Isgseaww01d\StaceyFile\Final Report 10-29-02 Appendices.doc November 21, 2001
Field Monitoring Form - OR DEQ Food Waste Composting Study
Pile ID:____________ Point A: Five feet from north end of pile
Point C: Five feet from south end of pile
Phase: Curing Point B: Middle of pile side Point D: Middle of south end of pile
Date Time ID Process
Ambient Pile Temperatures Pile Oxygen Levels Notes
(initials) Day Temp A B C D A B C D (odor, weather, pests & access, visible steam/food waste) 29
30
31
32
33
34
35
Supplies running low? - Contact Stacey Servo - Tt at 206.728.9655 ext 124 Equipment not operating correctly? - Ask Jack Hoeck for assistance, if not available contact Stacey Servo Field Monitoring Form - OR DEQ Food Waste Composting St d

\\Isgseaww01d\StaceyFile\Final Report 10-29-02 Appendices.doc November 21, 2001
Study Pile ID:____________ Point A: Five feet from north end of
pile Point C: Five feet from south end of pile
Phase: Curing Point B: Middle of pile side Point D: Middle of south end of pile
Date Time ID Process
Ambient Pile Temperatures Pile Oxygen Levels Notes
(initials) Day Temp A B C D A B C D (odor, weather, pests & access, visible steam/food waste) 36
37
38
39
40
41
42
Supplies running low? - Contact Stacey Servo - Tt at 206.728.9655 ext 124 Equipment not operating correctly? - Ask Jack Hoeck for assistance, if not available contact Stacey Servo Field Monitoring Form - OR DEQ Food Waste Composting Study

\\Isgseaww01d\StaceyFile\Final Report 10-29-02 Appendices.doc November 21, 2001
Pile ID:____________ Point A: Five feet from north end of pile
Point C: Five feet from south end of pile
Phase: Curing Point B: Middle of pile side Point D: Middle of south end of pile
Date Time ID Process
Ambient Pile Temperatures Pile Oxygen Levels Notes
(initials) Day Temp A B C D A B C D (odor, weather, pests & access, visible steam/food waste) 43
44
45
46
47
48
49
Supplies running low? - Contact Stacey Servo - Tt at 206.728.9655 ext 124 Equipment not operating correctly? - Ask Jack Hoeck for assistance, if not available contact Stacey Servo Field Monitoring Form - OR DEQ Food Waste Composting Study
Pile ID:____________ Point A: Five feet from north end of Point C: Five feet from south end of pile
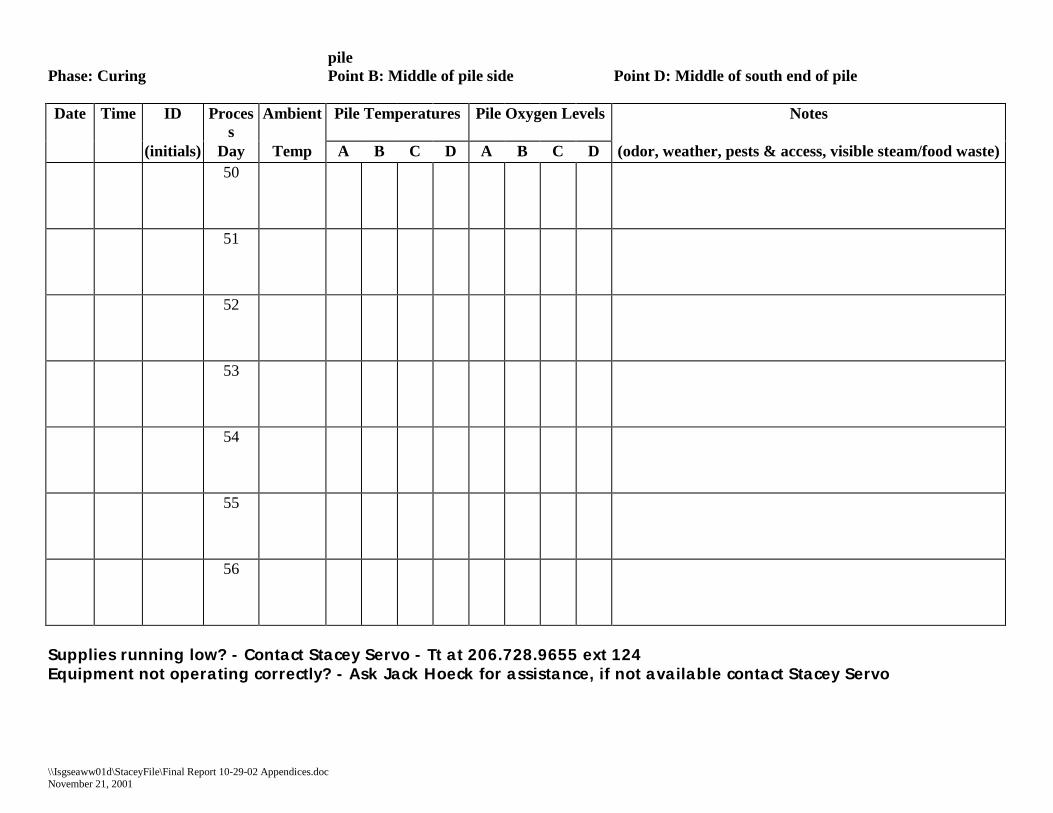
\\Isgseaww01d\StaceyFile\Final Report 10-29-02 Appendices.doc November 21, 2001
pile Phase: Curing Point B: Middle of pile side Point D: Middle of south end of pile
Date Time ID Proces
s Ambient Pile Temperatures Pile Oxygen Levels Notes
(initials) Day Temp A B C D A B C D (odor, weather, pests & access, visible steam/food waste) 50
51
52
53
54
55
56
Supplies running low? - Contact Stacey Servo - Tt at 206.728.9655 ext 124 Equipment not operating correctly? - Ask Jack Hoeck for assistance, if not available contact Stacey Servo

\\Isgseaww01d\StaceyFile\Final Report 10-29-02 Appendices.doc November 21, 2001
Appendix C
Laboratory Contact List Stability Testing Oregon State University (CO2 respiration, Solvita stability, Organic C, TKN, Total solids) Contact: Dan Sullivan Phone: (541) 737-5715 Fax: (541) 737-5725 email: [email protected] Shipping Address: ALS 3017 Oregon State University Corvallis, OR 97331-3002 Final Product Quality Testing Soil Control Lab (Conductivity, Sieve analysis, pH, Ammonia, Nitrate, Plant nutrients, Trace metals) Contact: Frank Shields Phone: (831) 724-5422 Fax: (831) 724-3188 Shipping Address: 42 Hangar Way Watsonville, CA 95076
Microbiological Testing Anresco, Inc. (Salmonella, Fecal coliform, Total solids) Contact: Laila Lam Phone: (415)822-1100 Fax: (415)822-6615 Shipping Address: 1370 Van Dyke Avenue San Francisco, CA 94124 BAL Laboratory (Salmonella, Fecal coliform, Total solids) Contact: Kathy Feldman Phone: (401) 785-0241 Fax: (401) 785-2374 Shipping Address: 185 Frances Avenue Cranston, Rhode Island 02910

\\Isgseaww01d\StaceyFile\Final Report 10-29-02 Appendices.doc November 21, 2001
PAGE INTENTIONALLY LEFT BLANK

\\Isgseaww01d\StaceyFile\Final Report 10-29-02 Appendices.doc November 21, 2001
Appendix D
Example Labels/Forms

\\Isgseaww01d\StaceyFile\Final Report 10-29-02 Appendices.doc November 21, 2001
PAGE INTENTIONALLY LEFT BLANK

\\Isgseaww01d\StaceyFile\Final Report 10-29-02 Appendices.doc November 21, 2001
Appendix E
Sampling Schedule

\\Isgseaww01d\StaceyFile\Final Report 10-29-02 Appendices.doc November 21, 2001
PAGE INTENTIONALLY LEFT BLANK
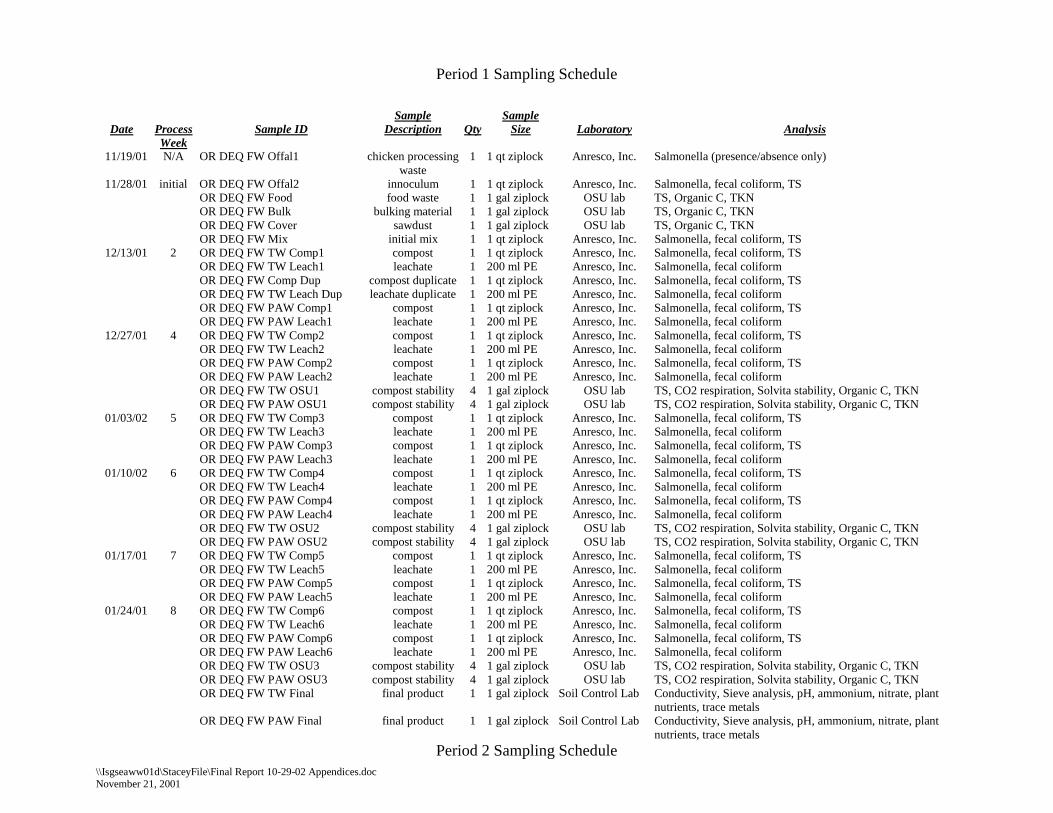
\\Isgseaww01d\StaceyFile\Final Report 10-29-02 Appendices.doc November 21, 2001
Period 1 Sampling Schedule
Period 2 Sampling Schedule
Date
Process Week
Sample ID
Sample Description
Qty
Sample Size
Laboratory
Analysis
11/19/01 N/A OR DEQ FW Offal1 chicken processing waste
1 1 qt ziplock Anresco, Inc. Salmonella (presence/absence only)
11/28/01 initial OR DEQ FW Offal2 innoculum 1 1 qt ziplock Anresco, Inc. Salmonella, fecal coliform, TS OR DEQ FW Food food waste 1 1 gal ziplock OSU lab TS, Organic C, TKN OR DEQ FW Bulk bulking material 1 1 gal ziplock OSU lab TS, Organic C, TKN OR DEQ FW Cover sawdust 1 1 gal ziplock OSU lab TS, Organic C, TKN OR DEQ FW Mix initial mix 1 1 qt ziplock Anresco, Inc. Salmonella, fecal coliform, TS
12/13/01 2 OR DEQ FW TW Comp1 compost 1 1 qt ziplock Anresco, Inc. Salmonella, fecal coliform, TS OR DEQ FW TW Leach1 leachate 1 200 ml PE Anresco, Inc. Salmonella, fecal coliform OR DEQ FW Comp Dup compost duplicate 1 1 qt ziplock Anresco, Inc. Salmonella, fecal coliform, TS OR DEQ FW TW Leach Dup leachate duplicate 1 200 ml PE Anresco, Inc. Salmonella, fecal coliform OR DEQ FW PAW Comp1 compost 1 1 qt ziplock Anresco, Inc. Salmonella, fecal coliform, TS OR DEQ FW PAW Leach1 leachate 1 200 ml PE Anresco, Inc. Salmonella, fecal coliform
12/27/01 4 OR DEQ FW TW Comp2 compost 1 1 qt ziplock Anresco, Inc. Salmonella, fecal coliform, TS OR DEQ FW TW Leach2 leachate 1 200 ml PE Anresco, Inc. Salmonella, fecal coliform OR DEQ FW PAW Comp2 compost 1 1 qt ziplock Anresco, Inc. Salmonella, fecal coliform, TS OR DEQ FW PAW Leach2 leachate 1 200 ml PE Anresco, Inc. Salmonella, fecal coliform OR DEQ FW TW OSU1 compost stability 4 1 gal ziplock OSU lab TS, CO2 respiration, Solvita stability, Organic C, TKN OR DEQ FW PAW OSU1 compost stability 4 1 gal ziplock OSU lab TS, CO2 respiration, Solvita stability, Organic C, TKN
01/03/02 5 OR DEQ FW TW Comp3 compost 1 1 qt ziplock Anresco, Inc. Salmonella, fecal coliform, TS OR DEQ FW TW Leach3 leachate 1 200 ml PE Anresco, Inc. Salmonella, fecal coliform OR DEQ FW PAW Comp3 compost 1 1 qt ziplock Anresco, Inc. Salmonella, fecal coliform, TS OR DEQ FW PAW Leach3 leachate 1 200 ml PE Anresco, Inc. Salmonella, fecal coliform
01/10/02 6 OR DEQ FW TW Comp4 compost 1 1 qt ziplock Anresco, Inc. Salmonella, fecal coliform, TS OR DEQ FW TW Leach4 leachate 1 200 ml PE Anresco, Inc. Salmonella, fecal coliform OR DEQ FW PAW Comp4 compost 1 1 qt ziplock Anresco, Inc. Salmonella, fecal coliform, TS OR DEQ FW PAW Leach4 leachate 1 200 ml PE Anresco, Inc. Salmonella, fecal coliform OR DEQ FW TW OSU2 compost stability 4 1 gal ziplock OSU lab TS, CO2 respiration, Solvita stability, Organic C, TKN OR DEQ FW PAW OSU2 compost stability 4 1 gal ziplock OSU lab TS, CO2 respiration, Solvita stability, Organic C, TKN
01/17/01 7 OR DEQ FW TW Comp5 compost 1 1 qt ziplock Anresco, Inc. Salmonella, fecal coliform, TS OR DEQ FW TW Leach5 leachate 1 200 ml PE Anresco, Inc. Salmonella, fecal coliform OR DEQ FW PAW Comp5 compost 1 1 qt ziplock Anresco, Inc. Salmonella, fecal coliform, TS OR DEQ FW PAW Leach5 leachate 1 200 ml PE Anresco, Inc. Salmonella, fecal coliform
01/24/01 8 OR DEQ FW TW Comp6 compost 1 1 qt ziplock Anresco, Inc. Salmonella, fecal coliform, TS OR DEQ FW TW Leach6 leachate 1 200 ml PE Anresco, Inc. Salmonella, fecal coliform OR DEQ FW PAW Comp6 compost 1 1 qt ziplock Anresco, Inc. Salmonella, fecal coliform, TS OR DEQ FW PAW Leach6 leachate 1 200 ml PE Anresco, Inc. Salmonella, fecal coliform OR DEQ FW TW OSU3 compost stability 4 1 gal ziplock OSU lab TS, CO2 respiration, Solvita stability, Organic C, TKN OR DEQ FW PAW OSU3 compost stability 4 1 gal ziplock OSU lab TS, CO2 respiration, Solvita stability, Organic C, TKN OR DEQ FW TW Final final product 1 1 gal ziplock Soil Control Lab Conductivity, Sieve analysis, pH, ammonium, nitrate, plant
nutrients, trace metals OR DEQ FW PAW Final final product 1 1 gal ziplock Soil Control Lab Conductivity, Sieve analysis, pH, ammonium, nitrate, plant
nutrients, trace metals

\\Isgseaww01d\StaceyFile\Final Report 10-29-02 Appendices.doc November 21, 2001
Date Process
Week Sample ID Sample
Description Qty Sample
Size Lab Analysis
13-Mar-02 initial OR DEQ FW Offal innoculum 1 1quart ziploc BAL lab Salmonella, fecal coliform, TS OR DEQ FW Food foodwaste 1 1quart ziploc BAL lab Salmonella, fecal coliform, TS OR DEQ FW Mix initial mix 1 1quart ziploc BAL lab Salmonella, fecal coliform, TS OR DEQ FW Bulk bulking material 1 1 quart ziploc BAL lab Salmonella, fecal coliform, TS OR DEQ FW Food foodwaste 1 1 gallon
ziploc OSU lab TS, Organic C, TKN
OR DEQ FW Bulk bulking material 1 1 gallon ziploc
OSU lab TS, Organic C, TKN
OR DEQ FW Cover sawdust 1 1 gallon ziploc
OSU lab TS, Organic C, TKN
OR DEQ FW Mix initial mix 1 1 gallon ziploc
OSU lab TS, Organic C, TKN
28-Mar-02 2 OR DEQ FW TW Comp1 compost 1 1quart ziploc BAL lab Salmonella, fecal coliform, TS OR DEQ FW TW Leach1 leachate 1 200 ml PE BAL lab Salmonella, fecal coliform OR DEQ FW Comp Dup compost duplicate 1 1quart ziploc BAL lab Salmonella, fecal coliform, TS OR DEQ FW Leach Dup leachate duplicate 1 200 ml PE BAL lab Salmonella, fecal coliform OR DEQ FW PAW Comp1 compost 1 1quart ziploc BAL lab Salmonella, fecal coliform, TS OR DEQ FW PAW Leach1 leachate 1 200 ml PE BAL lab Salmonella, fecal coliform
11-Apr-02 4 OR DEQ FW TW Comp2 compost 1 1quart ziploc BAL lab Salmonella, fecal coliform, TS OR DEQ FW TW Leach2 leachate 1 200 ml PE BAL lab Salmonella, fecal coliform OR DEQ FW PAW Comp2 compost 1 1quart ziploc BAL lab Salmonella, fecal coliform, TS OR DEQ FW PAW Leach2 leachate 1 200 ml PE BAL lab Salmonella, fecal coliform OR DEQ FW TW OSU1 compost stability 4 1 gallon
ziploc OSU lab TS, CO2 respiration, Solvita stability, Organic C, TKN
OR DEQ FW PAW OSU1 compost stability 4 1 gallon ziploc
OSU lab TS, CO2 respiration, Solvita stability, Organic C, TKN
18-Apr-02 5 OR DEQ FW TW Comp3 compost 1 1quart ziploc BAL lab Salmonella, fecal coliform, TS OR DEQ FW TW Leach3 leachate 1 200 ml PE BAL lab Salmonella, fecal coliform OR DEQ FW PAW Comp3 compost 1 1quart ziploc BAL lab Salmonella, fecal coliform, TS OR DEQ FW PAW Leach3 leachate 1 200 ml PE BAL lab Salmonella, fecal coliform
25-Apr-02 6 OR DEQ FW TW Comp4 compost 1 1quart ziploc BAL lab Salmonella, fecal coliform, TS OR DEQ FW TW Leach4 leachate 1 200 ml PE BAL lab Salmonella, fecal coliform OR DEQ FW PAW Comp4 compost 1 1quart ziploc BAL lab Salmonella, fecal coliform, TS OR DEQ FW PAW Leach4 leachate 1 200 ml PE BAL lab Salmonella, fecal coliform OR DEQ FW TW OSU2 compost stability 4 1 gallon
ziploc OSU lab TS, CO2 respiration, Solvita stability, Organic C, TKN
OR DEQ FW PAW OSU2 compost stability 4 1 gallon ziploc
OSU lab TS, CO2 respiration, Solvita stability, Organic C, TKN
02-May-02
7 OR DEQ FW TW Comp5 compost 1 1quart ziploc BAL lab Salmonella, fecal coliform, TS
OR DEQ FW TW Leach5 leachate 1 200 ml PE BAL lab Salmonella, fecal coliform OR DEQ FW PAW Comp5 compost 1 1quart ziploc BAL lab Salmonella, fecal coliform, TS OR DEQ FW PAW Leach5 leachate 1 200 ml PE BAL lab Salmonella, fecal coliform
09-May-02
8 OR DEQ FW TW Comp6 compost 1 1quart ziploc BAL lab Salmonella, fecal coliform, TS
OR DEQ FW TW Leach6 leachate 1 200 ml PE BAL lab Salmonella, fecal coliform OR DEQ FW PAW Comp6 compost 1 1quart ziploc BAL lab Salmonella, fecal coliform, TS

\\Isgseaww01d\StaceyFile\Final Report 10-29-02 Appendices.doc November 21, 2001
OR DEQ FW PAW Leach6 leachate 1 200 ml PE BAL lab Salmonella, fecal coliform OR DEQ FW TW OSU3 compost stability 4 1 gallon
ziploc OSU lab TS, CO2 respiration, Solvita stability, Organic C, TKN
OR DEQ FW PAW OSU3 compost stability 4 1 gallon ziploc
OSU lab TS, CO2 respiration, Solvita stability, Organic C, TKN
23-May-02
10 OR DEQ FW TW OSU4 compost stability 4 1 gallon ziploc
OSU lab TS, Draeger and alkaline trap CO2 respiration, Solvita stability, LECO C and N
OR DEQ FW PAW OSU4 compost stability 4 1 gallon ziploc
OSU lab TS, Draeger and alkaline trap CO2 respiration, Solvita stability, LECO C and N
06-Jun-02 12 OR DEQ FW TW OSU5 compost stability 4 1 gallon ziploc
OSU lab TS, Draeger and alkaline trap CO2 respiration, Solvita stability, LECO C and N
OR DEQ FW PAW OSU5 compost stability 4 1 gallon ziploc
OSU lab TS, Draeger and alkaline trap CO2 respiration, Solvita stability, LECO C and N
20-Jun-02 14 OR DEQ FW PAW Comp7 compost 1 1quart ziploc BAL lab Salmonella, fecal coliform, TS OR DEQ FW TW Comp7 compost 1 1quart ziploc BAL lab Salmonella, fecal coliform, TS OR DEQ FW TW OSU6 compost stability 4 1 gallon
ziploc OSU lab TS, Draeger and alkaline trap CO2 respiration, Solvita
stability, LECO C and N OR DEQ FW PAW OSU6 compost stability 4 1 gallon
ziploc OSU lab TS, Draeger and alkaline trap CO2 respiration, Solvita
stability, LECO C and N OR DEQ FW TW Final final product 1 1 gallon
ziploc Soil Control Lab Conductivity, Sieve analysis, pH, ammonium, nitrate, plant
nutrients, trace metals OR DEQ FW PAW Final final product 1 1 gallon
ziploc Soil Control Lab Conductivity, Sieve analysis, pH, ammonium, nitrate, plant
nutrients, trace metals

\\Isgseaww01d\StaceyFile\Final Report 10-29-02 Appendices.doc November 21, 2001
PAGE INTENTIONALLY LEFT BLANK