updated regional regression equations for estimating peak ...2 outline of the presentation •the...
TRANSCRIPT

1
MICHAEL BAKER CORPORATION
Updated Regional Regression Equations for
Estimating Peak Discharges for Maryland Streams
Wilbert O. Thomas, Jr.
Maryland Association of Floodplain and Stormwater
Managers
October 21, 2010
Linthicum, Maryland

2
Outline of the Presentation
• The objectives of the presentation are to
describe:
– The purpose of the Maryland Hydrology Panel
– Previous accomplishments and reports of the Panel
– Recommended hydrologic procedures for Maryland
– Introduce the Third Edition of the Panel report
– New regional regression equations for Maryland
– Summary comments
3
Maryland Hydrology Panel
• Hydrology Panel convened in June 1996 by
Maryland State Highway Administration
(SHA) and Maryland Department of
Environment (MDE)
• Mission of the Panel was
– Review Maryland hydrologic practices and make
recommendations concerning peak flood
estimating procedures that will best serve to
satisfy agency needs, Maryland laws and
regulations.
4
Maryland Hydrology Panel
• The Hydrology Panel was to
– explore the development of improved
procedures that would ensure an optimal
balance between preserving the environmental
quality of Maryland streams and the hydraulic
performance of highway drainage structures.
• MDE had selected the NRCS TR-20 model
for computing flood flows in Maryland;
SHA wanted to make greater use of
regional regression equations based on
USGS streamgaging records

5
The Maryland Hydrology Panel
• The current Hydrology Panel consists of:
– Richard Berich, Private Consultant
– Donald Woodward, retired Natural Resources
Conservation Service
– Glenn Moglen, Virginia Tech
– William Merkel, Natural Resources
Conservation Service
– Michael Casey, George Mason University
– Wilbert Thomas, Michael Baker, Jr.
SHA represented by Andy Kosicki and Len
Podell
MDE represented by Dave Guignet and others
6
Hydrology Panel Reports
• The Hydrology Panel previously published
the following versions of the report:
Application of Hydrologic Methods in
Maryland
– February 2001
– August 2006
• The Third Edition will be completed by the
end of October 2010 and posted at:
– http://www.gishydro.umd.edu/panel.htm
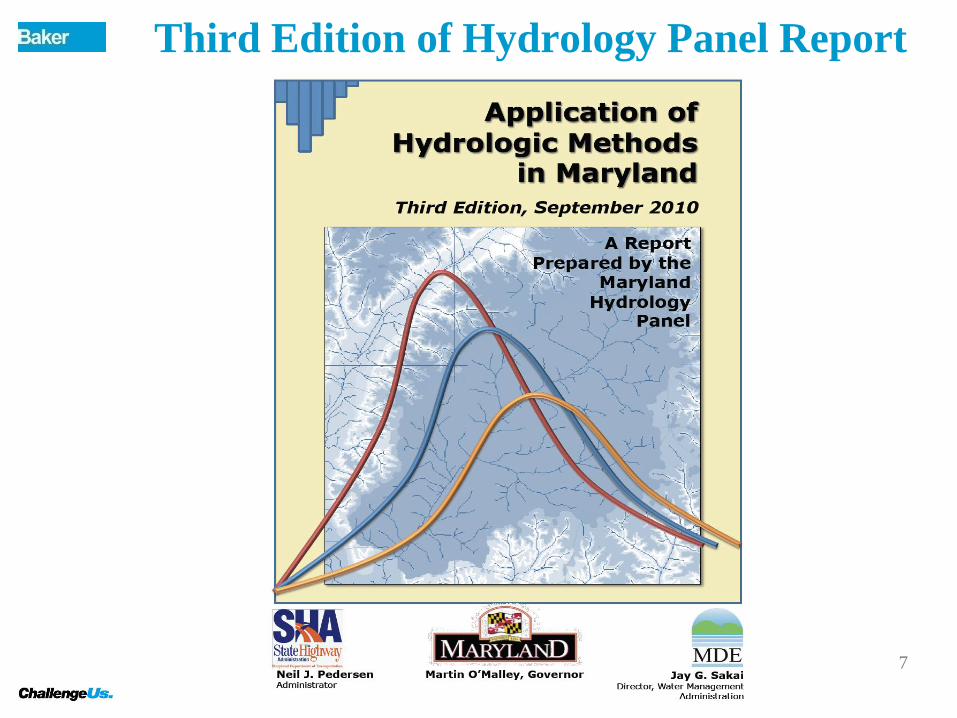
7
Third Edition of Hydrology Panel Report

Hydrologic Procedures
• In all versions of the Panel report, the
recommended hydrologic procedures
included:
– TR-20 model developed by NRCS to serve as
the base method
– Design discharges based on ultimate
development
– TR-20 “calibrated” to flood discharges
estimated at USGS gaging stations or from
regional regression equations
8

9
Calibration of TR-20 Model

Regional Regression Equations
• The regional regression equations used to
“calibrate” TR-20 have changed over time:
– February 2001 report: USGS regression equations
described by Dillow (1996) http://md.water.usgs.gov/publications/wrir-95-4154/
– August 2006 report: Fixed Region regression
equations described by Moglen and others (2006) – a
UMD Research Report http://www.gishydro.umd.edu/documents/mdsha_reports/peakflowsfinalreport.pdf
– September 2010 report: Fixed Region regression
equations to be described in this presentation
10

11
Implementation of Hydrologic Procedures
• TR-20 and regional regression procedures
implemented within GISHydro2000 – software
package developed by the University of
Maryland with funding from SHA
– GIS software based on ArcView Version 3 that
includes statewide land use, soils and
topographic data
– New version GISHydroNXT being developed
based on ArcGIS 9.3.1 as ArcView version will be
phased out in the future http://www.gishydro.umd.edu/news/news.htm

12
GISHydro2000

13
GISHydro2000
• GISHydro2000 is available at no cost at
– http://www.gishydro.umd.edu
• A web-based version of the software is
available at
– http://www.gishydro.umd.edu/web.htm
• Software is also available at SHA
headquarters for firms performing work on
state or county-funded projects by
contacting Andy Kosicki at SHA

14
Regional Regression Equations
• Dillow (1996) defined five hydrologic regions
(USGS WRIR 95-4154)
• Moglen and others (2006) evaluated the five
regions and decided to use the same regions
– Evaluated Region of Influence, L-Moment
procedures and Fixed Regions equations
– Determined the Fixed Regions approach to be most
accurate
• Recently developed (2010) Fixed Region
regression equations have combined the
Piedmont and Blue Ridge Regions for rural
watersheds

15
A = Appalachian Plateaus and Allegheny Ridges
B = Blue Ridge and Great Valley
P = Piedmont
W = Western Coastal Plain
E = Eastern Coastal Plain
Maryland’s Physiographic Provinces

Regional Regression Equations (2010)
• Motivation for updating the Moglen and
others (2006) equations for the Coastal
Plain Regions was the release of SSURGO
soils data by NRCS
• Motivation for updating the Moglen and
others (2006) equations for rural
watersheds in the Piedmont and Blue
Ridge Regions was the development of a
new limestone/carbonate rock map
16

Eastern Coastal Plain Analysis
• Regression equations updated in September
2007 after release of SSURGO soils data
(2006 equations based on STATSGO soils
data)
• Equations based on 28 stations in MD and DE
with annual peak data through 2006
• Revised SSURGO data became available in
early 2010 and used in final equations – peak
flow data were not updated
17

Eastern Coastal Plain (ECP) Analysis
• The 2010 equations for ECP based on
– Drainage area (DA) in square miles
– A soils (SA) in percent of drainage area –
SSURGO data
– Land slope (LSLOPE) in ft/ft (perpendicular to
channel)
• An example of the revised equations
– Q100 = 4433 DA0.812 (SA+1)-0.230 LSLOPE0.557
18

Western Coastal Plain Analysis
• Regression equations updated in June 2009
after release of SSURGO soils data (2006
equations based on STATSGO soils data)
• Equations based on 24 stations in MD with
annual peak data through 2008
• Revised SSURGO data became available in
early 2010 and used in final equations – peak
flow data were not updated
19

Western Coastal Plain (WCP) Analysis
• The 2010 equations for WCP based on
– Drainage area (DA) in square miles
– Sum of C and D soils (SCD) in percent of drainage
area – SSURGO data
– Impervious area (IA) in percent of drainage area
• An example of the revised equations
– Q100 = 25.6 DA0.608 (IA+1)0.262 (SCD+1)0.781
20

Piedmont and Blue Ridge Analysis
• In an effort to improve the estimation of flood
discharges in karst areas, the Hydrology Panel
determined the number of sinkholes per
square kilometer
• Data were compiled from
– PA Dept of Conservation and Natural Resources
– Tom DeVillbis with Carroll County Planning Dept
– Dave Brezinski with MD Geological Survey
provided data for Frederick and Hagerstown Valley
– Maryland Geological Survey RI 73
21

Sinkholes and Limestone Map from Dillow (1996)
22

Sinkholes and Limestone/Carbonate Rock
• Regression analyses were performed
using the density of sinkholes and the
percent carbonate rock
• The percent carbonate rock was shown to
provide slightly better results
• The percent carbonate rock was developed
from the following map developed by the
Hydrology Panel
23

Revised Limestone/Carbonate Map (2010)
24

Piedmont and Blue Ridge Analysis
• Rural stations in the Piedmont and Blue
Ridge Regions were combined into a single
analysis since limestone/carbonate rock is
prevalent in both regions
• Previous analyses, Dillow (1996) and
Moglen and others (2006), only used
limestone data in the Blue Ridge Region
• 53 rural stations with peak flow data
through 1999 were used in 2010 analysis
25

26
A = Appalachian Plateaus and Allegheny Ridges
B = Blue Ridge and Great Valley
P = Piedmont
W = Western Coastal Plain
E = Eastern Coastal Plain
Maryland’s Physiographic Provinces

Piedmont and Blue Ridge (P&BR) Analysis
• The 2010 rural equations for P&BR based on
– Drainage area (DA) in square miles
– Limestone/carbonate rock (LIME) in percent of
drainage area
– Forest cover (FOR) in percent of drainage area
• An example of the revised equations
– Q100 = 1471 DA0.617 (LIME+1)-0.154 (FOR+1)-0.045
27

28
Regression Equations Not Revised
• The urban equations for the Piedmont
Region were not updated (DA and IA)
• The equations for the Appalachian Plateau
Region were not updated (DA and LSLOPE)
• These equations are the same as developed
by Moglen and others (2006) and given in
Appendix 3 of the August 2006 Panel report

USGS StreamStats Program
• USGS is developing the StreamStats
Program for Maryland for MDE
• USGS will use the regression equations
developed by the Hydrology Panel in
StreamStats - cite the Third Edition of the
Panel report for documentation
• StreamStats, like GISHydro2000, is a GIS
web-based application for applying
regression equations
29

USGS StreamStats Program
30
New (2010) Regression Equations
• New regression equations provide
following improvements:
– Based on SSURGO soils data in the Eastern
and Western Coastal Plain Regions
– Updated flood data for the Eastern and
Western Coastal Plain Regions
– Combined regression equations for rural
watersheds in Piedmont and Blue Ridge
Regions provides estimates for karst
watersheds in the Piedmont Region
31
Final Comments
• Third edition of Panel report will be posted at
http://www.gishydro.umd.edu/panel.htm by end of
October 2010
• USGS will include new regression equations
in their StreamStats Program
• New regression equations will be available in
GISHydro2000 and in a standalone program (http://www.gishydro.umd.edu/document.htm)
32