updated draft march 2017 - kwo.uat.ks.gov
TRANSCRIPT
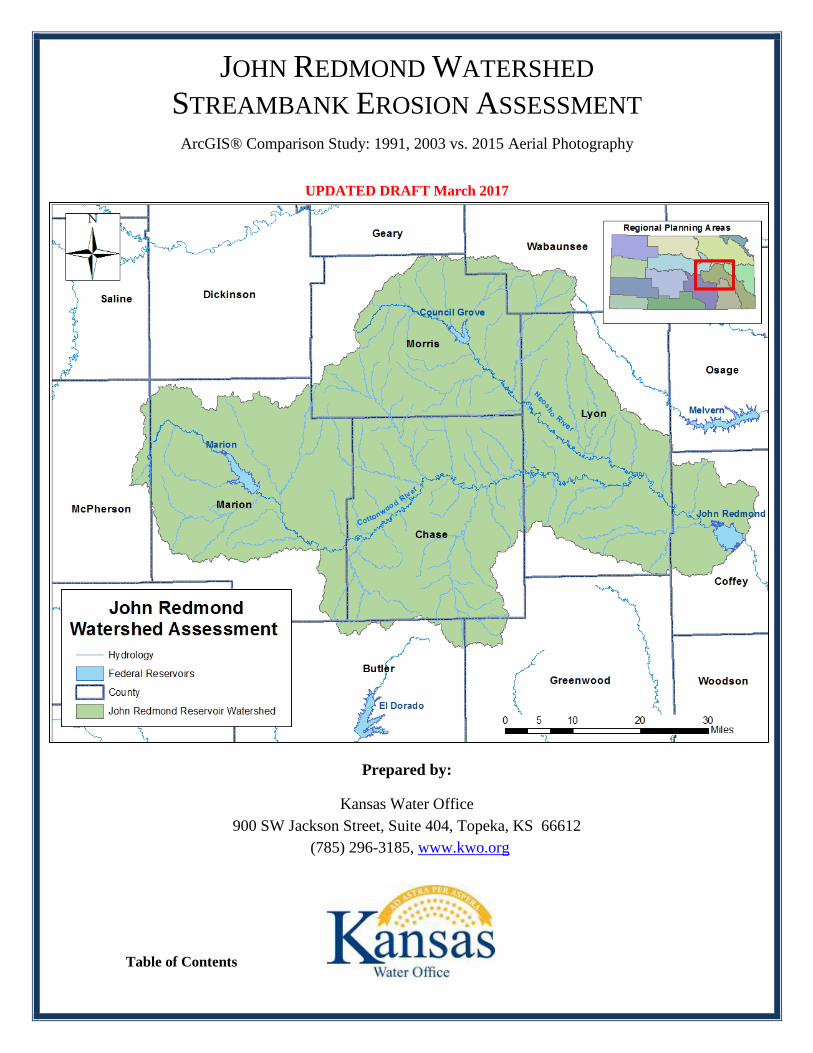
JOHN REDMOND WATERSHED STREAMBANK EROSION ASSESSMENT
ArcGIS® Comparison Study: 1991, 2003 vs. 2015 Aerial Photography
UPDATED DRAFT March 2017
Prepared by:
Kansas Water Office 900 SW Jackson Street, Suite 404, Topeka, KS 66612
(785) 296-3185, www.kwo.org
Table of Contents
2 | P a g e
Executive Summary ................................................................................................................................................................ 2
Introduction ............................................................................................................................................................................. 2
Study Area .............................................................................................................................................................................. 3
Figure 1:John Redmond Watershed Assessment Area ............................................................................................. 4
Data Collection & Methodology ............................................................................................................................................. 4
Figure 2: 1991 FSA & 2008 NAIP of a Streambank Erosion Site on the Cottonwood River ................................... 5
Analysis................................................................................................................................................................................... 6
Figure 3: John Redmond Watershed Streambank Assessment by HUC10 ............................................................... 6
Figure 4: John Redmond Watershed Streambank Assessment by HUC12 ............................................................... 7
Figure 5: TWI Estimated Costs to Implement Streambank Stabilization BMPs ...................................................... 7
Results ..................................................................................................................................................................................... 8
Table 1: John Redmond Watershed Streambank Erosion Assessment Table by HUC10 ........................................ 8
Figure 6: John Redmond Watershed Streambank Erosion Assessment Graph by HUC10 ...................................... 9
Figure 7: John Redmond Watershed Streambank Erosion Assessment Graph by HUC10 ...................................... 9
Figure 8: John Redmond Watershed Streambank Erosion Assessment Map by HUC10 ....................................... 10
Table 2: John Redmond Watershed Streambank Erosion Assessment Table by HUC12 ...................................... 11
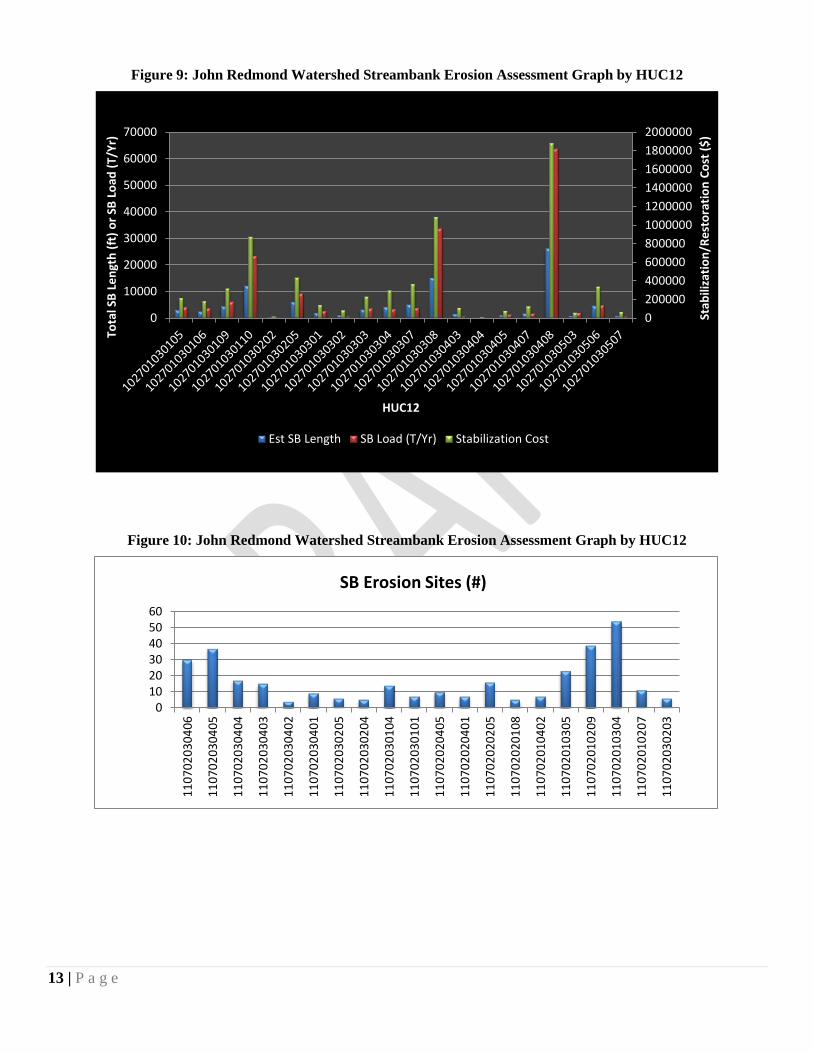
Figure 9: John Redmond Watershed Streambank Erosion Assessment Graph by HUC12 .................................... 12
Figure 10: John Redmond Watershed Streambank Erosion Assessment Graph by HUC12 .................................. 12
Figure 11: John Redmond Watershed Streambank Erosion Assessment Map by HUC12 ..................................... 13
Conclusion ............................................................................................................................................................................ 13
References ............................................................................................................................................................................. 13
3 | P a g e
Executive Summary
Federal reservoirs are an important source of water supply in Kansas for roughly two-thirds of Kansas’ citizens. The ability of a reservoir to store water over time is diminished as the capacity is reduced through sedimentation. In some cases reservoirs are filling with sediment faster than anticipated. Whether sediment is filling the reservoir on or ahead of schedule, it is beneficial to take efforts to reduce sedimentation to extend the life of the reservoir. The Kansas Water Authority has established a Reservoir Sustainability Initiative that seeks to integrate all aspects of reservoir input, operations and outputs into an operational plan for each reservoir to ensure water supply storage availability long into the future. Reduction of sediment input is part of this initiative. The John Redmond Watershed Streambank Erosion Assessment, an ArcGIS® Comparison Study, was initiated to partially implement the Reservoir Sustainability Initiative. This assessment identifies areas of streambank erosion to provide a better understanding of the John Redmond Watershed for streambank restoration purposes and to increase understanding of streambank erosion to reduce excessive sedimentation in reservoirs across Kansas. The comparison study was designed to guide prioritization of streambank restoration by identifying reaches of streams where erosion is most severe in the watershed above John Redmond Reservoir. The Kansas Water Office (KWO) 2017 assessment quantifies annual tons of sediment eroded from the John Redmond Watershed. A total of 366 streambank erosion sites were identified, covering 197,470 feet of unstable streambank and transporting 525,447 tons (426 acre-feet) of sediment downstream per year, accounting for roughly fifty-five percent of the total sediment load estimated from the most recent bathymetric survey in 2014. It should be noted that the identified streambank erosion locations are only a portion of all streambank erosion occurrences in the watershed. Only those streambank erosion sites covering an area 2,000 sq. feet, or more, were identified. Streambank erosion sites were analyzed by 10-digit Hydrologic Unit Codes (HUC10), 12-digit Hydrologic Unit Codes (HUC12). Results by HUC10 identified 1107020304 as the most active HUC10 for streambank degradation, accounting for 72,947 feet of unstable streambank, 260,507 tons of sediment per year, and 37 percent of total stabilization costs (Table 1 and Figure 6). Results by HUC12 identified 110702010305 as the most active HUC12 for streambank degradation, accounting for 29,720 feet of unstable streambank, 113,802 of sediment per year, and 15 percent of total stabilization costs (Table 2 and Figure 9). Based on the average stabilization costs of $71.50 per linear foot, conducting streambank stabilization practices for the entire watershed would cost approximately $14.1 million. The KWO completed this assessment for the Neosho Regional Planning Area (Neosho RPA) and the Cottonwood Watershed Restoration and Protection Strategy (WRAPS) Stakeholder Leadership Team (SLT). Information contained in this assessment feeds into a number of sections and other assessments and can be used by the Cottonwood WRAPS SLT to target streambank stabilization and riparian restoration efforts toward high priority stream reaches in John Redmond watershed. Similar assessments are ongoing in selected watersheds above reservoirs throughout Kansas and are available on the KWO website at www.kwo.org under KWO Programs & Projects: Watershed Unit Projects, or may be made available upon request to agencies and interested parties for the benefit of streambank and riparian restoration projects. Introduction
Riparian areas are vital components of proper watershed function that, when wisely managed in context of a watershed system, can moderate and reduce sediment input. There is growing evidence that a substantial source of sediment in streams in many areas of the country is generated from stream channels and edge of field gullies (Balch, 2007). Streambank erosion is a natural process that contributes a large portion of annual sediment yield, but acceleration of this natural process leads to a disproportionate sediment supply, stream channel instability, land loss, habitat loss and other adverse effects. Many land use activities can affect and lead to accelerated bank erosion (EPA, 2008). In most Kansas watersheds, this natural process has been accelerated due to changes in land cover and the modification of stream channels to accommodate agricultural, urban and other land uses.
4 | P a g e
A naturally stable stream has the ability, over time, to transport the water and sediment of its watershed in such a manner that the stream maintains its dimension, pattern and profile without significant aggregation or degradation (Rosgen, 1997). Streams significantly impacted by land use changes in their watersheds or by modifications to streambeds and banks go through an evolutionary process to regain a more stable condition. This process generally involves a sequence of incision (downcutting), widening and re-stabilizing of the stream. Many streams in Kansas are incised (SCC, 1999). Streambank erosion is often a symptom of a larger, more complex problem requiring solutions that may involve more than just streambank stabilization (EPA, 2008). It is important to analyze watershed conditions and understand the evolutionary tendencies of a stream when considering stream stabilization measures. Efforts to restore and re-stabilize streams should allow the stream to speed up the process of regaining natural stability along the evolutionary sequence (Rosgen, 1997). A watershed-based approach to developing stream stabilization plans can accommodate the comprehensive review and implementation. Additional research in Kansas documents the effectiveness of forested riparian areas on bank stabilization and sediment trapping (Geyer, 2003; Brinson, 1981; Freeman, 1996; Huggins, 1994). Riparian vegetative type is an important tool that provides indicators of erosion occurrence from land use practices. Vegetative cover based on rooting characteristics can mitigate erosion by protecting banks from fluvial entrainment and collapse by providing internal bank strength. Forested riparian areas are superior to grassland in holding banks during high flows, when most sediment is transported. When riparian vegetation is changed from woody species to annual grasses and/or forbs, sub-surface internal strength is weakened, causing acceleration of mass wasting processes (extensive sedimentation due to sub-surface instability) (EPA, 2008). The primary threats to forested riparian areas are agricultural production and suburban/urban development. Study Area
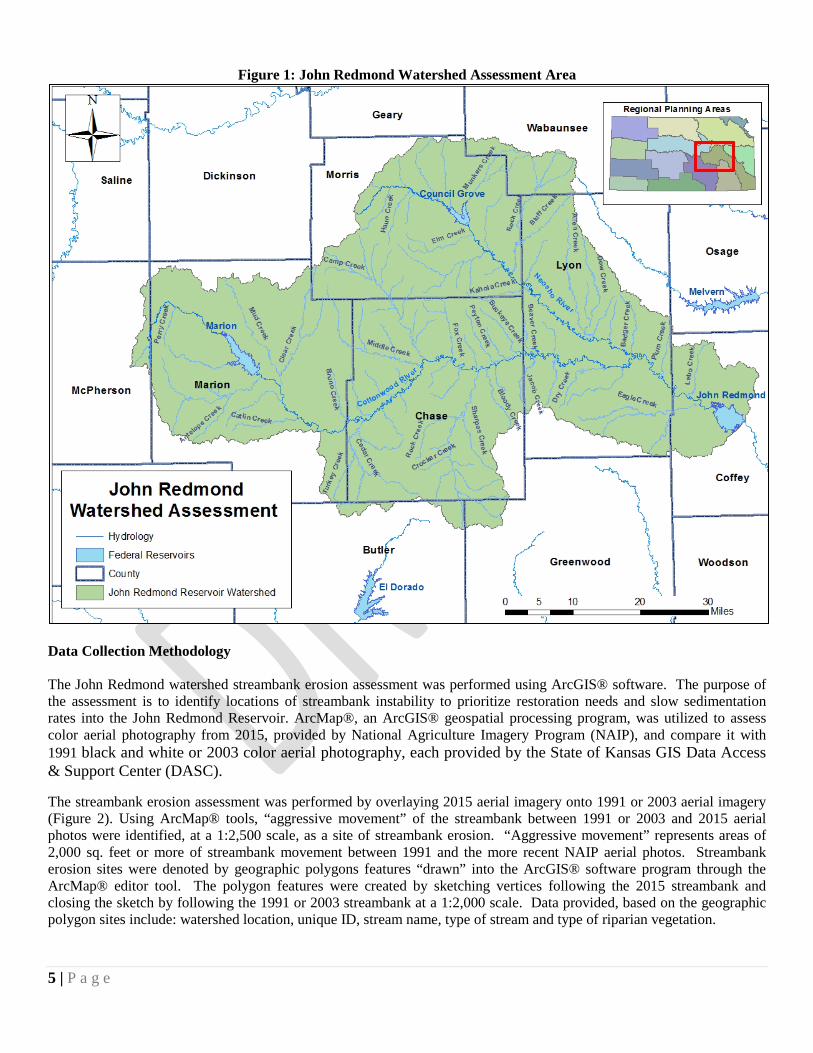
John Redmond Reservoir is located on the Neosho River, river mile 343.7 in Coffey County. The John Redmond watershed in the Neosho Regional Planning Area (Neosho RPA) was assessed for streambank erosion with a primary focus on the Neosho River mainstem and Cottonwood river tributary from roughly John Redmond Reservoir to Council Grove, Kansas and John Redmond Reservoir to Marion, Kansas (Figure 1). The Neosho River watershed above John Redmond Reservoir drains approximately 3,015 square miles through portions of Butler, Chase, Coffey, Greenwood, Harvey, Lyon, McPherson, Marion, Morris, Osage and Wabaunsee counties. John Redmond Reservoir is a 9,400 acre impoundment located in eastern Kansas on the Neosho River. Construction began on the reservoir in 1959; the federally authorized purposes are flood control, water supply, navigation, recreation and fish and wildlife management. The original storage capacity of the reservoir was estimated to be 102,254 acre-ft. The most current bathymetric survey in 2014 concluded that 38.91 percent of the 50 year design life for sediment storage at John Redmond Reservoir has been lost to date, calculating the current sedimentation rate at 765 acre-feet per year (969,135 tons/yr). The bathymetric survey also concluded that the current storage capacity at the reservoir is estimated at 62,470 acre-feet to date.
5 | P a g e
Figure 1: John Redmond Watershed Assessment Area
Data Collection Methodology The John Redmond watershed streambank erosion assessment was performed using ArcGIS® software. The purpose of the assessment is to identify locations of streambank instability to prioritize restoration needs and slow sedimentation rates into the John Redmond Reservoir. ArcMap®, an ArcGIS® geospatial processing program, was utilized to assess color aerial photography from 2015, provided by National Agriculture Imagery Program (NAIP), and compare it with 1991 black and white or 2003 color aerial photography, each provided by the State of Kansas GIS Data Access & Support Center (DASC).
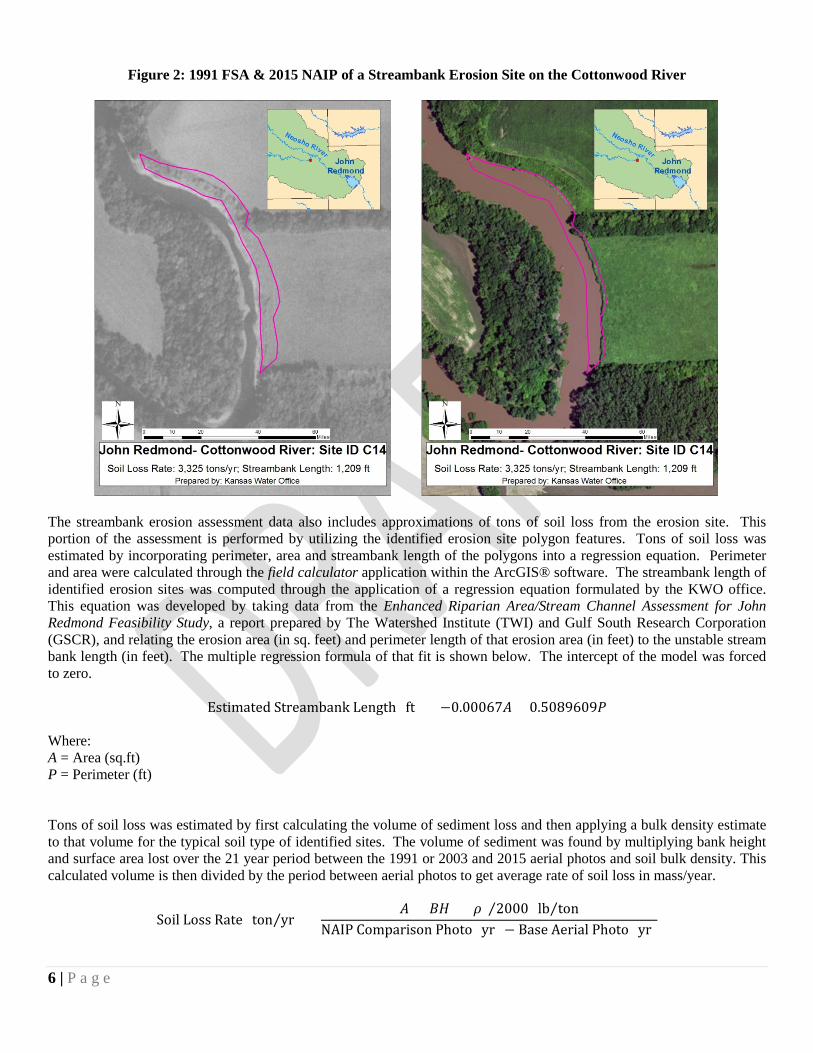
The streambank erosion assessment was performed by overlaying 2015 aerial imagery onto 1991 or 2003 aerial imagery (Figure 2). Using ArcMap® tools, “aggressive movement” of the streambank between 1991 or 2003 and 2015 aerial photos were identified, at a 1:2,500 scale, as a site of streambank erosion. “Aggressive movement” represents areas of 2,000 sq. feet or more of streambank movement between 1991 and the more recent NAIP aerial photos. Streambank erosion sites were denoted by geographic polygons features “drawn” into the ArcGIS® software program through the ArcMap® editor tool. The polygon features were created by sketching vertices following the 2015 streambank and closing the sketch by following the 1991 or 2003 streambank at a 1:2,000 scale. Data provided, based on the geographic polygon sites include: watershed location, unique ID, stream name, type of stream and type of riparian vegetation.
6 | P a g e
Figure 2: 1991 FSA & 2015 NAIP of a Streambank Erosion Site on the Cottonwood River
The streambank erosion assessment data also includes approximations of tons of soil loss from the erosion site. This portion of the assessment is performed by utilizing the identified erosion site polygon features. Tons of soil loss was estimated by incorporating perimeter, area and streambank length of the polygons into a regression equation. Perimeter and area were calculated through the field calculator application within the ArcGIS® software. The streambank length of identified erosion sites was computed through the application of a regression equation formulated by the KWO office. This equation was developed by taking data from the Enhanced Riparian Area/Stream Channel Assessment for John Redmond Feasibility Study, a report prepared by The Watershed Institute (TWI) and Gulf South Research Corporation (GSCR), and relating the erosion area (in sq. feet) and perimeter length of that erosion area (in feet) to the unstable stream bank length (in feet). The multiple regression formula of that fit is shown below. The intercept of the model was forced to zero.
Estimated Streambank Length (ft) = −0.00067𝐴𝐴 + 0.5089609𝑃𝑃 Where: A = Area (sq.ft) P = Perimeter (ft) Tons of soil loss was estimated by first calculating the volume of sediment loss and then applying a bulk density estimate to that volume for the typical soil type of identified sites. The volume of sediment was found by multiplying bank height and surface area lost over the 21 year period between the 1991 or 2003 and 2015 aerial photos and soil bulk density. This calculated volume is then divided by the period between aerial photos to get average rate of soil loss in mass/year.
Soil Loss Rate (ton yr) = ⁄(𝐴𝐴 × 𝐵𝐵𝐵𝐵 × 𝜌𝜌) 2000 (lb ton)⁄⁄
NAIP Comparison Photo (yr) − Base Aerial Photo (yr)
7 | P a g e
Where: A = Area (sq.ft) BH = Bank Height (ft) Ρ = Soil Density (lb/ft3) To complete the analysis for the equation above for tons of soil lost, streambank height measurements of select identified erosion sites were needed. The Kansas River Basin Regional Sediment Management Section, 204 Stream and River Channel Assessment, performed by the Gulf South Research Corporation (GRSC) and The Watershed Institute, Inc. (TWI), through contracts with the U.S. Army Corps of Engineers (Corps), was incorporated into this assessment. The project assembled a number of previously installed streambank stabilization/riparian restoration projects in the state. Included with many of those projects is streambank height including many surveyed bank heights on the projects in the Neosho River basin. Where no streambank elevations were available, Light Detection and Ranging (LiDAR) raster tiles available for the John Redmond Reservoir watershed were used to calculate stream bank heights at actively eroding sites. Analysis
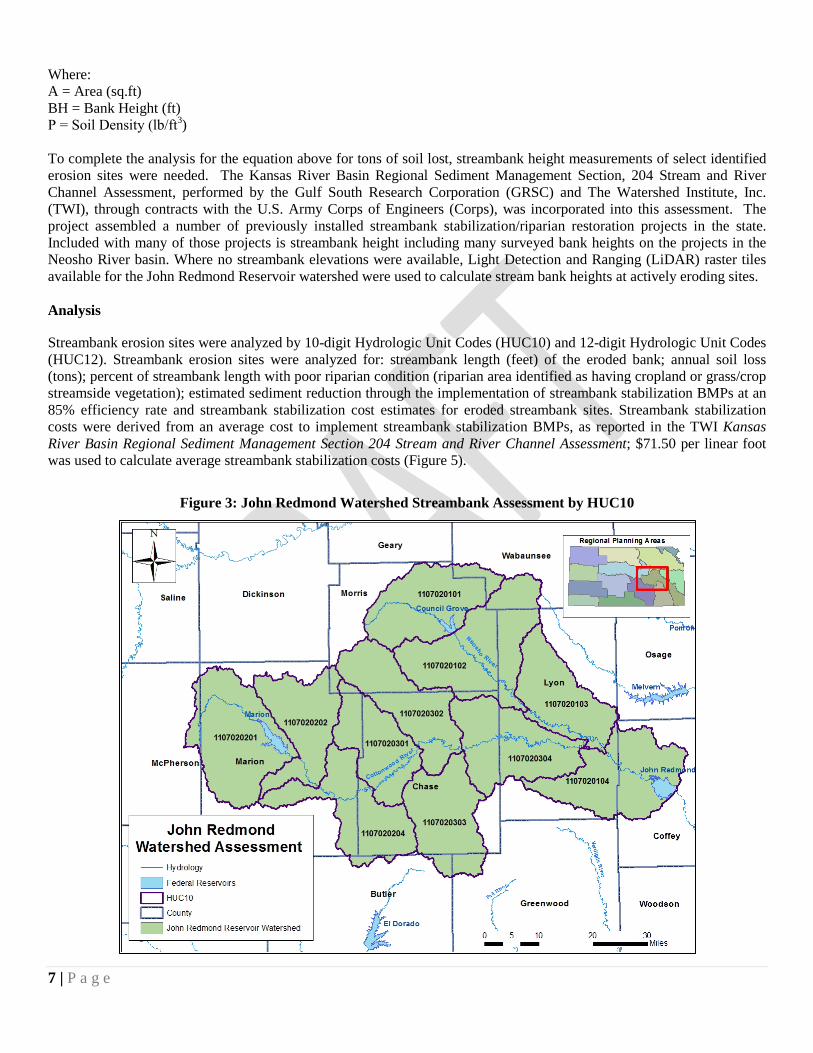
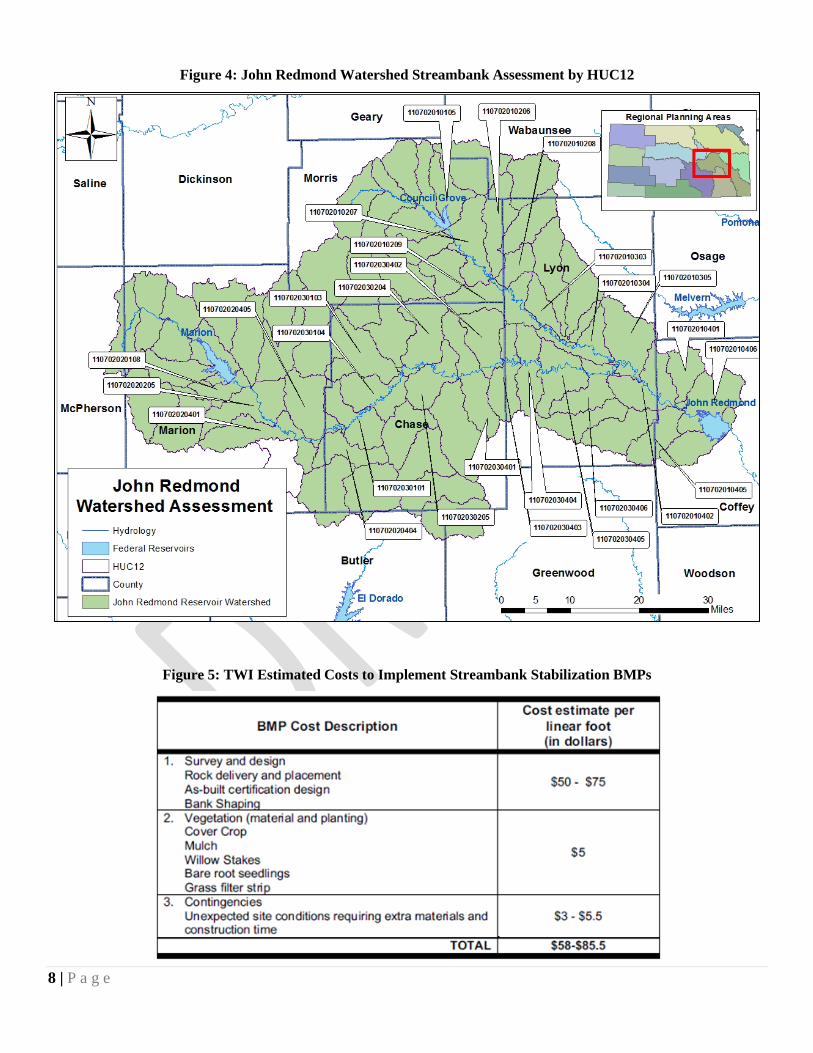
Streambank erosion sites were analyzed by 10-digit Hydrologic Unit Codes (HUC10) and 12-digit Hydrologic Unit Codes (HUC12). Streambank erosion sites were analyzed for: streambank length (feet) of the eroded bank; annual soil loss (tons); percent of streambank length with poor riparian condition (riparian area identified as having cropland or grass/crop streamside vegetation); estimated sediment reduction through the implementation of streambank stabilization BMPs at an 85% efficiency rate and streambank stabilization cost estimates for eroded streambank sites. Streambank stabilization costs were derived from an average cost to implement streambank stabilization BMPs, as reported in the TWI Kansas River Basin Regional Sediment Management Section 204 Stream and River Channel Assessment; $71.50 per linear foot was used to calculate average streambank stabilization costs (Figure 5).
Figure 3: John Redmond Watershed Streambank Assessment by HUC10
8 | P a g e
Figure 4: John Redmond Watershed Streambank Assessment by HUC12
Figure 5: TWI Estimated Costs to Implement Streambank Stabilization BMPs
9 | P a g e
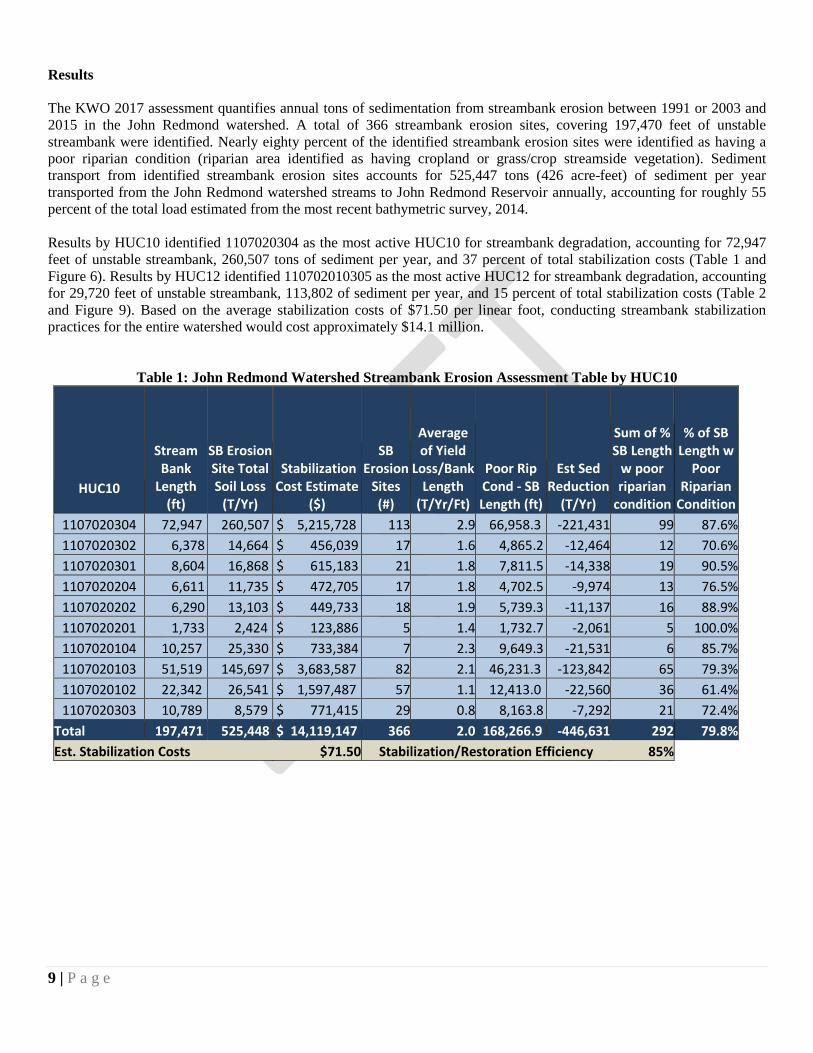
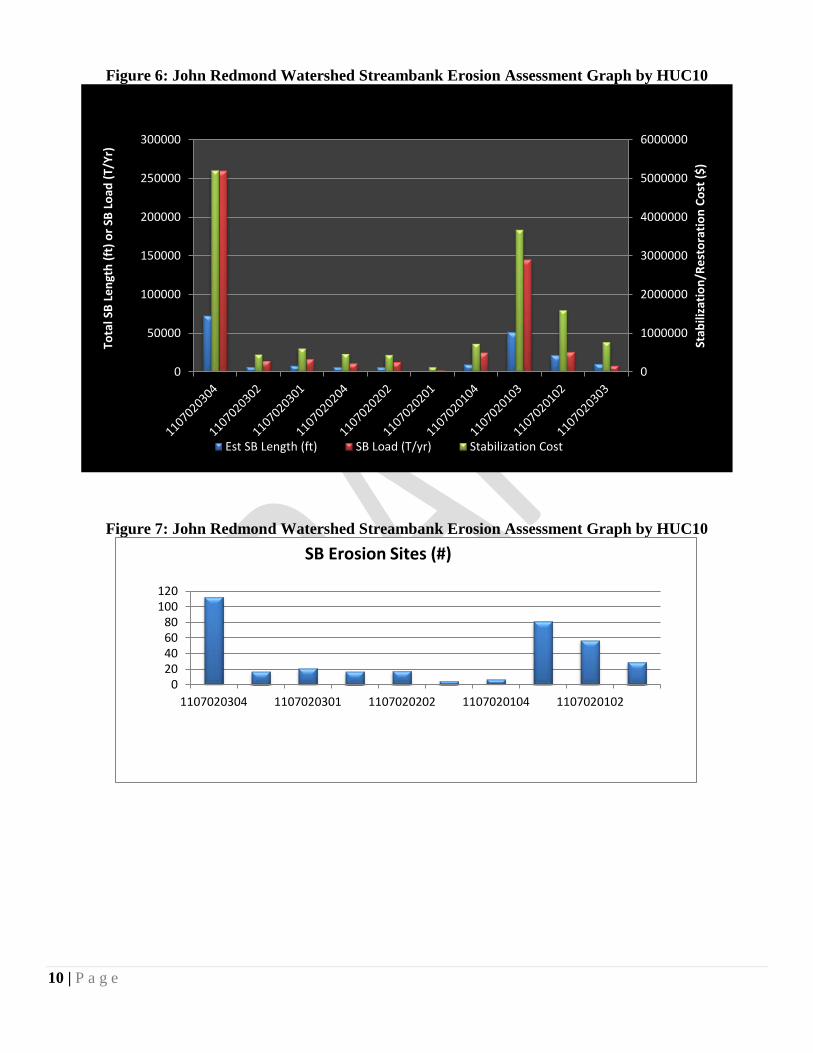
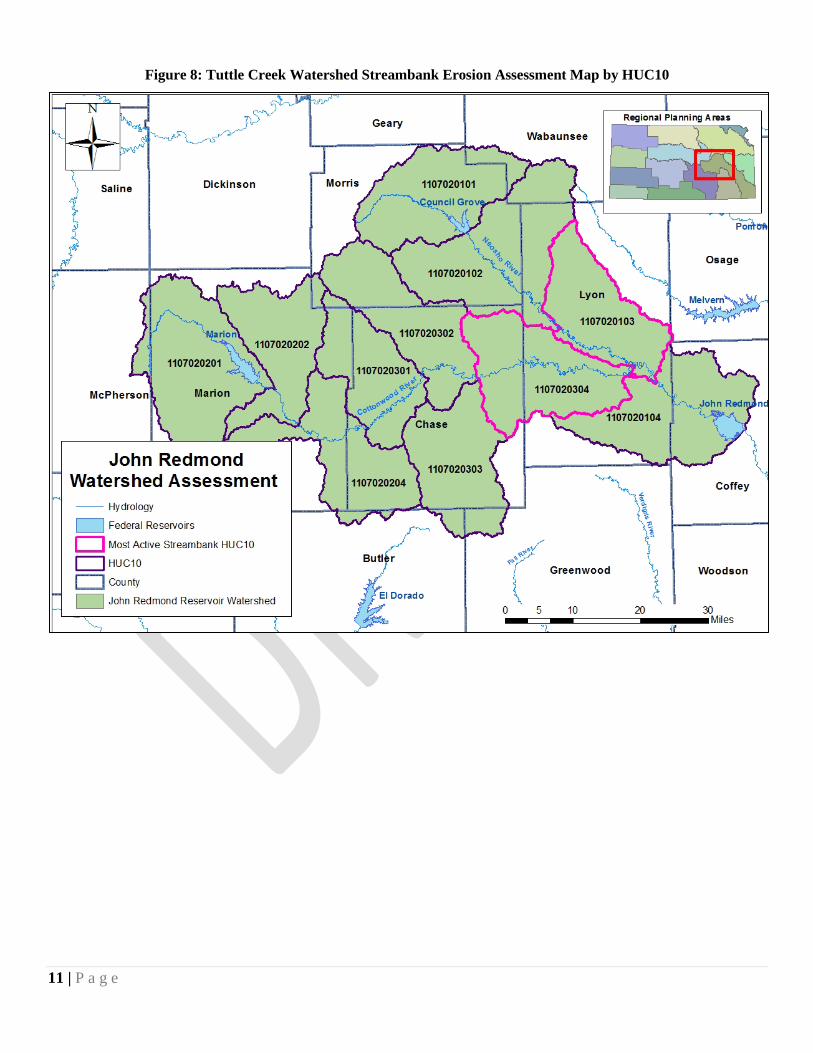
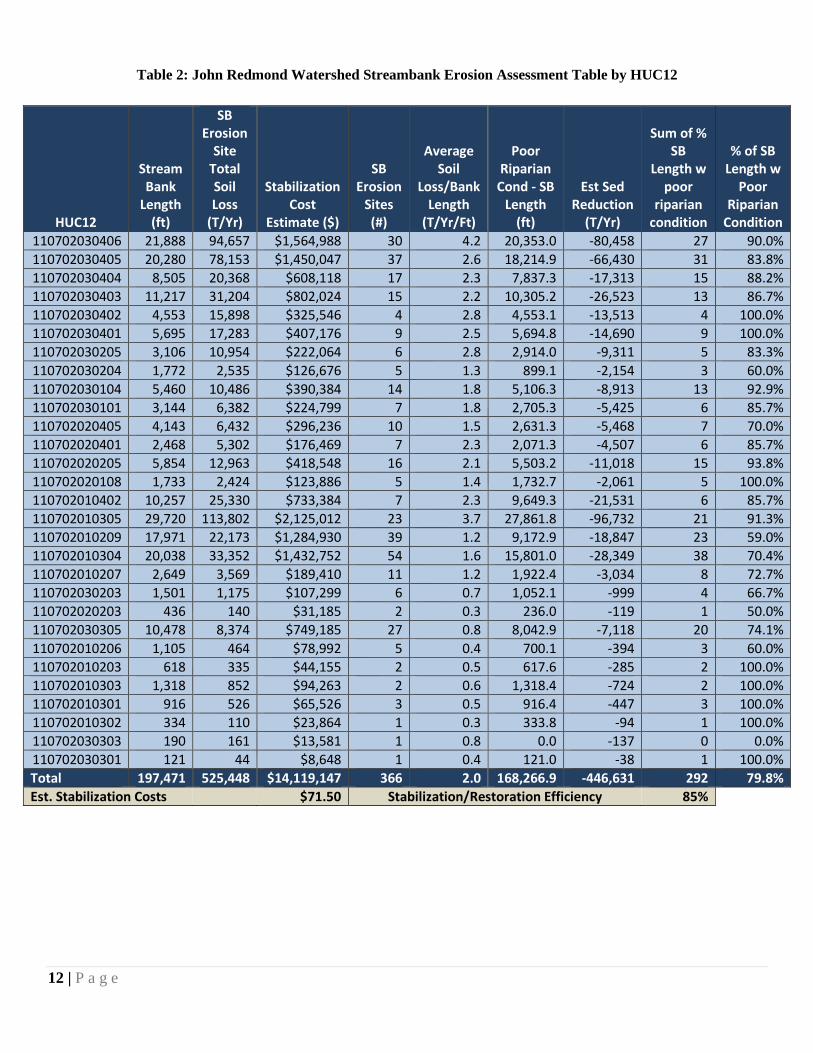
Results The KWO 2017 assessment quantifies annual tons of sedimentation from streambank erosion between 1991 or 2003 and 2015 in the John Redmond watershed. A total of 366 streambank erosion sites, covering 197,470 feet of unstable streambank were identified. Nearly eighty percent of the identified streambank erosion sites were identified as having a poor riparian condition (riparian area identified as having cropland or grass/crop streamside vegetation). Sediment transport from identified streambank erosion sites accounts for 525,447 tons (426 acre-feet) of sediment per year transported from the John Redmond watershed streams to John Redmond Reservoir annually, accounting for roughly 55 percent of the total load estimated from the most recent bathymetric survey, 2014. Results by HUC10 identified 1107020304 as the most active HUC10 for streambank degradation, accounting for 72,947 feet of unstable streambank, 260,507 tons of sediment per year, and 37 percent of total stabilization costs (Table 1 and Figure 6). Results by HUC12 identified 110702010305 as the most active HUC12 for streambank degradation, accounting for 29,720 feet of unstable streambank, 113,802 of sediment per year, and 15 percent of total stabilization costs (Table 2 and Figure 9). Based on the average stabilization costs of $71.50 per linear foot, conducting streambank stabilization practices for the entire watershed would cost approximately $14.1 million.
Table 1: John Redmond Watershed Streambank Erosion Assessment Table by HUC10
HUC10
Stream Bank
Length (ft)
SB Erosion Site Total Soil Loss
(T/Yr)
Stabilization Cost Estimate
($)
SB Erosion
Sites (#)
Average of Yield
Loss/Bank Length
(T/Yr/Ft)
Poor Rip Cond - SB Length (ft)
Est Sed Reduction
(T/Yr)
Sum of % SB Length
w poor riparian
condition
% of SB Length w
Poor Riparian
Condition 1107020304 72,947 260,507 $ 5,215,728 113 2.9 66,958.3 -221,431 99 87.6% 1107020302 6,378 14,664 $ 456,039 17 1.6 4,865.2 -12,464 12 70.6% 1107020301 8,604 16,868 $ 615,183 21 1.8 7,811.5 -14,338 19 90.5% 1107020204 6,611 11,735 $ 472,705 17 1.8 4,702.5 -9,974 13 76.5% 1107020202 6,290 13,103 $ 449,733 18 1.9 5,739.3 -11,137 16 88.9% 1107020201 1,733 2,424 $ 123,886 5 1.4 1,732.7 -2,061 5 100.0% 1107020104 10,257 25,330 $ 733,384 7 2.3 9,649.3 -21,531 6 85.7% 1107020103 51,519 145,697 $ 3,683,587 82 2.1 46,231.3 -123,842 65 79.3% 1107020102 22,342 26,541 $ 1,597,487 57 1.1 12,413.0 -22,560 36 61.4% 1107020303 10,789 8,579 $ 771,415 29 0.8 8,163.8 -7,292 21 72.4%
Total 197,471 525,448 $ 14,119,147 366 2.0 168,266.9 -446,631 292 79.8% Est. Stabilization Costs $71.50 Stabilization/Restoration Efficiency 85%
10 | P a g e
Figure 6: John Redmond Watershed Streambank Erosion Assessment Graph by HUC10
Figure 7: John Redmond Watershed Streambank Erosion Assessment Graph by HUC10
0
1000000
2000000
3000000
4000000
5000000
6000000
0
50000
100000
150000
200000
250000
300000
Stab
iliza
tion/
Rest
orat
ion
Cost
($)
Tota
l SB
Leng
th (f
t) o
r SB
Load
(T/Y
r)
Est SB Length (ft) SB Load (T/yr) Stabilization Cost
020406080
100120
1107020304 1107020301 1107020202 1107020104 1107020102
SB Erosion Sites (#)
11 | P a g e
Figure 8: Tuttle Creek Watershed Streambank Erosion Assessment Map by HUC10
12 | P a g e
Table 2: John Redmond Watershed Streambank Erosion Assessment Table by HUC12
HUC12
Stream Bank
Length (ft)
SB Erosion
Site Total Soil Loss
(T/Yr)
Stabilization Cost
Estimate ($)
SB Erosion
Sites (#)
Average Soil
Loss/Bank Length
(T/Yr/Ft)
Poor Riparian
Cond - SB Length
(ft)
Est Sed Reduction
(T/Yr)
Sum of % SB
Length w poor
riparian condition
% of SB Length w
Poor Riparian
Condition 110702030406 21,888 94,657 $1,564,988 30 4.2 20,353.0 -80,458 27 90.0% 110702030405 20,280 78,153 $1,450,047 37 2.6 18,214.9 -66,430 31 83.8% 110702030404 8,505 20,368 $608,118 17 2.3 7,837.3 -17,313 15 88.2% 110702030403 11,217 31,204 $802,024 15 2.2 10,305.2 -26,523 13 86.7% 110702030402 4,553 15,898 $325,546 4 2.8 4,553.1 -13,513 4 100.0% 110702030401 5,695 17,283 $407,176 9 2.5 5,694.8 -14,690 9 100.0% 110702030205 3,106 10,954 $222,064 6 2.8 2,914.0 -9,311 5 83.3% 110702030204 1,772 2,535 $126,676 5 1.3 899.1 -2,154 3 60.0% 110702030104 5,460 10,486 $390,384 14 1.8 5,106.3 -8,913 13 92.9% 110702030101 3,144 6,382 $224,799 7 1.8 2,705.3 -5,425 6 85.7% 110702020405 4,143 6,432 $296,236 10 1.5 2,631.3 -5,468 7 70.0% 110702020401 2,468 5,302 $176,469 7 2.3 2,071.3 -4,507 6 85.7% 110702020205 5,854 12,963 $418,548 16 2.1 5,503.2 -11,018 15 93.8% 110702020108 1,733 2,424 $123,886 5 1.4 1,732.7 -2,061 5 100.0% 110702010402 10,257 25,330 $733,384 7 2.3 9,649.3 -21,531 6 85.7% 110702010305 29,720 113,802 $2,125,012 23 3.7 27,861.8 -96,732 21 91.3% 110702010209 17,971 22,173 $1,284,930 39 1.2 9,172.9 -18,847 23 59.0% 110702010304 20,038 33,352 $1,432,752 54 1.6 15,801.0 -28,349 38 70.4% 110702010207 2,649 3,569 $189,410 11 1.2 1,922.4 -3,034 8 72.7% 110702030203 1,501 1,175 $107,299 6 0.7 1,052.1 -999 4 66.7% 110702020203 436 140 $31,185 2 0.3 236.0 -119 1 50.0% 110702030305 10,478 8,374 $749,185 27 0.8 8,042.9 -7,118 20 74.1% 110702010206 1,105 464 $78,992 5 0.4 700.1 -394 3 60.0% 110702010203 618 335 $44,155 2 0.5 617.6 -285 2 100.0% 110702010303 1,318 852 $94,263 2 0.6 1,318.4 -724 2 100.0% 110702010301 916 526 $65,526 3 0.5 916.4 -447 3 100.0% 110702010302 334 110 $23,864 1 0.3 333.8 -94 1 100.0% 110702030303 190 161 $13,581 1 0.8 0.0 -137 0 0.0% 110702030301 121 44 $8,648 1 0.4 121.0 -38 1 100.0% Total 197,471 525,448 $14,119,147 366 2.0 168,266.9 -446,631 292 79.8% Est. Stabilization Costs $71.50 Stabilization/Restoration Efficiency 85%
13 | P a g e
Figure 9: John Redmond Watershed Streambank Erosion Assessment Graph by HUC12
Figure 10: John Redmond Watershed Streambank Erosion Assessment Graph by HUC12
0200000400000600000800000100000012000001400000160000018000002000000
0
10000
20000
30000
40000
50000
60000
70000
Stab
iliza
tion/
Rest
orat
ion
Cost
($)
Tota
l SB
Leng
th (f
t) o
r SB
Load
(T/Y
r)
HUC12
Est SB Length SB Load (T/Yr) Stabilization Cost
0102030405060
1107
0203
0406
1107
0203
0405
1107
0203
0404
1107
0203
0403
1107
0203
0402
1107
0203
0401
1107
0203
0205
1107
0203
0204
1107
0203
0104
1107
0203
0101
1107
0202
0405
1107
0202
0401
1107
0202
0205
1107
0202
0108
1107
0201
0402
1107
0201
0305
1107
0201
0209
1107
0201
0304
1107
0201
0207
1107
0203
0203
SB Erosion Sites (#)
14 | P a g e
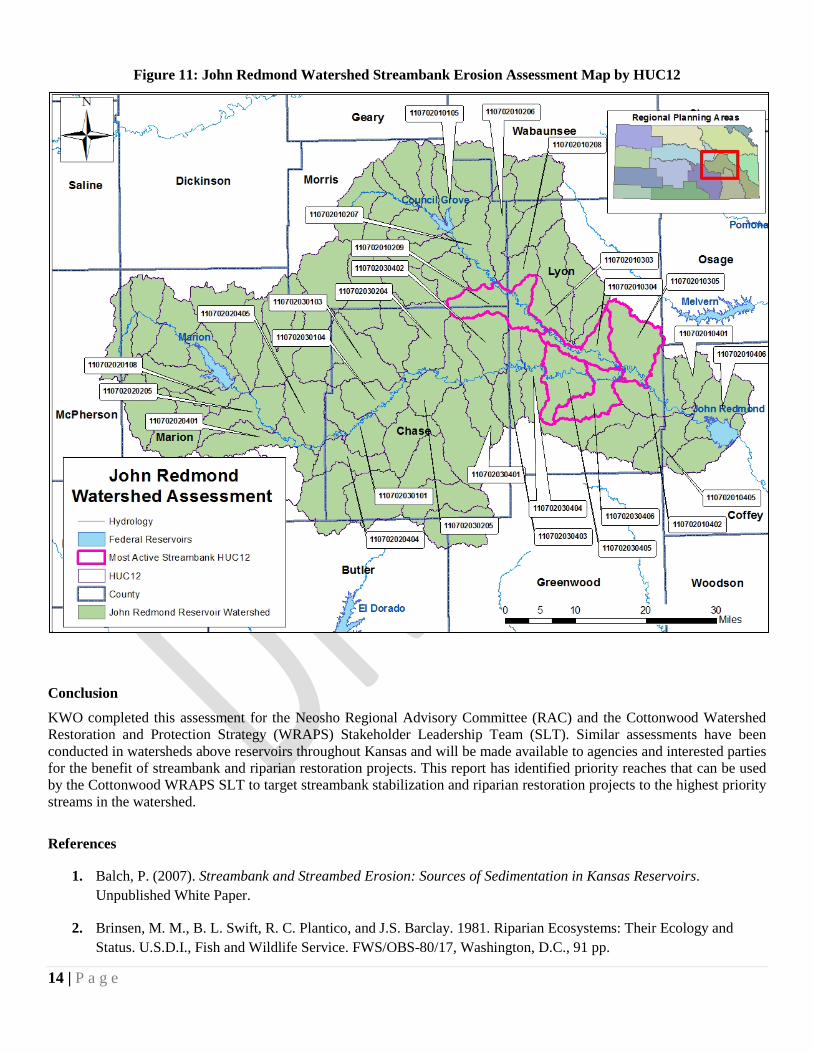
Figure 11: John Redmond Watershed Streambank Erosion Assessment Map by HUC12
Conclusion
KWO completed this assessment for the Neosho Regional Advisory Committee (RAC) and the Cottonwood Watershed Restoration and Protection Strategy (WRAPS) Stakeholder Leadership Team (SLT). Similar assessments have been conducted in watersheds above reservoirs throughout Kansas and will be made available to agencies and interested parties for the benefit of streambank and riparian restoration projects. This report has identified priority reaches that can be used by the Cottonwood WRAPS SLT to target streambank stabilization and riparian restoration projects to the highest priority streams in the watershed.
References
1. Balch, P. (2007). Streambank and Streambed Erosion: Sources of Sedimentation in Kansas Reservoirs. Unpublished White Paper.
2. Brinsen, M. M., B. L. Swift, R. C. Plantico, and J.S. Barclay. 1981. Riparian Ecosystems: Their Ecology and Status. U.S.D.I., Fish and Wildlife Service. FWS/OBS-80/17, Washington, D.C., 91 pp.

15 | P a g e
3. Freeman, Craig, Kansas Biological Survey. 1996. Importance of Kansas Forests and Woodlands, KS Walnut Council Annual Meeting, Topeka.
4. Geyer, W., Brooks, K., Neppl, T. 2003. Streambank Stability of Two Kansas River Systems During the 1993 Flood in Kansas, Transactions of the Kansas Academy of Science, Volume 106, no.1/2, p.48-53. (http://www.oznet.ksu.edu/library/forst2/srl122.pdf)
5. Huggins, D. G., Bandi, D. and Higgins, K. 1994. KBS Report # 60, Identifying riparian buffers that function to control nonpoint source pollution impacts to instream communities: feasibility study in the Delaware River Basin, Kansas.
6. Juracek, K.E. and Ziegler, A. (2007). Estimation of Sediment Sources Using Selected Chemical Tracers in the Perry Lake and Lake Wabaunsee Basins, Northeast Kansas.
7. Kansas State Conservation Commission. (1999). Kansas River and Stream Corridor Management Guide.
8. Kansas Water Plan. (2009). Reservoir Sustainability Initiative.
9. Mau, D.P., 2001, Sediment depositional trends and transport of phosphorus and other chemical constituents, Cheney Reservoir watershed, south-central Kansas: U.S. Geological Survey Water-Resources Investigations Report 01–4085, 40 p.
10. US Environmental Protection Agency. (2008). Watershed Assessment of River Stability & Sediment Supply (WARSSS) website: www.epa.gov/warsss/sedsource/streamero.htm
11. Rosgen, D. L. (1997). A Geomorphological Approach to Restoration of Incised Rivers. Proceedings of the Conference on Management of Landscapes Disturbed by Channel Incision, 1997.
12. TWI. (2010). Kansas River Basin Regional Sediment management Section 204 Stream and River Assessment.