updated data on blood cancers · 2019-05-31 · blood cancer that can affect the bone marrow, the...
TRANSCRIPT

UPDATED DATA ON BLOOD CANCERS
FACTS
2018-
2019
Table of Contents
Executive Summary . . . . . . . . . . . . . . . . . . . . . . . . . . . . . . . . . . . . . . . . . . . . . . . . . . . . . . . . . . . . . 2
About Blood Cancers . . . . . . . . . . . . . . . . . . . . . . . . . . . . . . . . . . . . . . . . . . . . . . . . . . . . . . . . . . . 2
Leukemia . . . . . . . . . . . . . . . . . . . . . . . . . . . . . . . . . . . . . . . . . . . . . . . . . . . . . . . . . . . . . . . . . . . . . . . . 4
Hodgkin and Non-Hodgkin Lymphoma . . . . . . . . . . . . . . . . . . . . . . . . . . . . . . . . . . . . . . . 10
Myeloma . . . . . . . . . . . . . . . . . . . . . . . . . . . . . . . . . . . . . . . . . . . . . . . . . . . . . . . . . . . . . . . . . . . . . . . . 14
Myelodysplastic Syndromes . . . . . . . . . . . . . . . . . . . . . . . . . . . . . . . . . . . . . . . . . . . . . . . . . . . 16
Myeloproliferative Neoplasms . . . . . . . . . . . . . . . . . . . . . . . . . . . . . . . . . . . . . . . . . . . . . . . . . 17
Incidence Rates: Leukemia, Lymphoma, Myeloma, Myelodysplastic Syndromes and Myeloproliferative Neoplasms . . . . . . . . . . . . . 19
Estimated New Cases and Estimated Deaths, by State . . . . . . . . . . . . . . . . . . . . . . 20
Five-Year Incidence and Mortality Cases, by State . . . . . . . . . . . . . . . . . . . . . . . . . . . . 21
Five-Year Leukemia Incidence and Mortality Cases, by State . . . . . . . . . . . . . . . 22
Notes and Definitions . . . . . . . . . . . . . . . . . . . . . . . . . . . . . . . . . . . . . . . . . . . . . . . . . . . . . . . . . 23
About The Leukemia & Lymphoma Society . . . . . . . . . . . . . . . . . . . . . . . . . . . . . . . . . . . . 24
Citations and Acknowledgements . . . . . . . . . . . . . . . . . . . . . . . . . . . . . . . . . . . . . . . . . . . . . 27

Table of Contents
2 Table 1. Approximate US Prevalence of the Four Major Types of Blood Cancers as of January 1, 2015
4 Table 2. The Four Major Types of Leukemia
4 Table 3. Approximate US Prevalence of the Four Major Types of Leukemia as of January 1, 2015
5 Table 4. Estimated New Cases of Leukemia, by Gender, 2019
8 Table 5. Trends in Five-Year Relative Survival Rates for Leukemia, By Subtype, Race and Year of Diagnosis
9 Table 6. Estimated Deaths from Leukemia, by Gender, 2019
10 Table 7. Estimated New Cases of Lymphoma, by Gender, 2019
13 Table 8. Trends in Five-Year Relative Survival Rates for Lymphoma, By Subtype, Race and Year of Diagnosis
13 Table 9. Estimated Deaths from Lymphoma, by Gender, 2019
14 Table 10. Estimated New Cases of Myeloma, by Gender, 2019
15 Table 11. Trends in Five-Year Relative Survival Rates for Myeloma, By Race and Year of Diagnosis
15 Table 12. Estimated Deaths from Myeloma, by Gender, 2019
16 Table 13. Myelodysplastic Syndromes Age-Adjusted Incidence Rates, per 100,000 Population, 2011-2015
17 Table 14. Myeloproliferative Neoplasms Age-Adjusted Incidence Rates, per 100,000 Population, 2011-2015
19 Table 15. Age-Adjusted Incidence Rates, by Gender, All Races, per 100,000 Population, 2011-2015
19 Table 16. Age-Adjusted Incidence Rates, by Gender, for Blacks, per 100,000 Population, 2011-2015
19 Table 17. Age-Adjusted Incidence Rates, by Gender, for Whites, per 100,000 Population, 2011-2015
20 Table 18. Estimated New Cases of Blood Cancers, by State, 2019
20 Table 19. Estimated Deaths from Blood Cancers, by State, 2019
21 Table 20. Five-Year Blood Cancer Incidence Cases, by State, 2011-2015
21 Table 21. Five-Year Blood Cancer Mortality Cases, by State, 2011-2015
22 Table 22. Five-Year Leukemia Incidence Cases, by State, 2011-2015
22 Table 23. Five-Year Leukemia Mortality Cases, by State, 2011-2015
PAGE FIGURES
PAGE TABLES
2 Figure 1. Estimated New Cases (%) of Leukemia, Lymphoma and Myeloma, 2019
3 Figure 2. Five-Year Relative Survival Rates by Year of Diagnosis
5 Figure 3. Estimated Proportion of New Cases (%) in 2019 for Types of Leukemia, Adults and Children
6 Figure 4. Age-Specific Incidence Rates for Leukemia, 2011-2015
6 Figure 5. Age-Specific Incidence Rates for Acute Lymphoblastic Leukemia, 2011-2015
7 Figure 6. Age-Specific Incidence Rates for Acute Myeloid Leukemia, 2011-2015
7 Figure 7. Age-Specific Incidence Rates for Chronic Lymphocytic Leukemia, 2011-2015
7 Figure 8. Age-Specific Incidence Rates for Chronic Myeloid Leukemia, 2011-2015
9 Figure 9. Five-Year Relative Survival Rates for Acute Lymphoblastic Leukemia in Children Under 15, Diagnosed 1964-2014
11 Figure 10. Age-Specific Incidence Rates for Lymphoma, 2011-2015
11 Figure 11. Age-Specific Incidence Rates for Hodgkin Lymphoma, 2011-2015
12 Figure 12. Age-Specific Incidence Rates for Non-Hodgkin Lymphoma, 2011-2015
14 Figure 13. Age-Specific Incidence Rates for Myeloma, 2011-2015

2 I 800.955.4572 • www.LLS.org
Leukemia, lymphoma, myeloma, myelodysplastic syndromes
(MDS) and myeloproliferative neoplasms (MPNs) are types of
blood cancer that can affect the bone marrow, the blood cells,
the lymph nodes and other parts of the lymphatic system.
These diseases may result from acquired mutations to the
DNA of a single lymph- or blood-forming stem cell. With blood
cancers, abnormal cells multiply and survive without the usual
controls that are in place for healthy cells. The accumulation
of these cells in the marrow, blood and/or lymphatic tissue
interferes with production and functioning of red blood cells,
white blood cells and platelets. The disease process can lead
to severe anemia, bleeding, an impaired ability to fight infection
and/or death. Figure 1 shows the percentage of estimated new
cases for leukemia, lymphoma and myeloma in 2019.
Facts 2018-2019 is an update of data available for leukemia,
lymphoma, myeloma, myelodysplastic syndromes and
myeloproliferative neoplasms (blood cancers). Blood cancers
are diseases that can affect the bone marrow, the blood cells,
the lymph nodes and other parts of the lymphatic system.
Facts 2018-2019 provides updates from the American Cancer
Society’s Cancer Facts & Figures 2019 (published online in
2019, https://www.cancer.org/research/cancer-facts-statistics.
html) for estimated numbers of new blood cancer cases and
estimated numbers of deaths due to blood cancers. The
incidence rates, prevalence and mortality data in
Estimated New Cases (%) of Leukemia, Lymphoma and Myeloma, 2019
Figure 1. Source: Cancer Facts & Figures, 2019. American Cancer Society; 2019.
Lymphoma 47%82,310 cases
Leukemia 35%61,780 cases
Myeloma 18%32,110 cases
Total cases: 176,200
*Data specified for “blood cancer” include leukemia, lymphoma and myeloma, and do not include data for myelodysplastic syndromes (MDS) or myeloproliferative neoplasms (MPNs).
Facts 2018-2019 reflect the statistics from the National Cancer
Institute’s Surveillance, Epidemiology and End Results (SEER)
Program, Cancer Statistics Review (CSR) 1975-2015 (published
online in April 2018, www.seer.cancer.gov). National incidence
counts are generated from the United States Cancer Statistics
(USCS) Public Use Database for 2001-2015 (www.cdc.
gov/cancer/uscs/public-use/). Incidence rates by state are
provided by the North American Association of Central Cancer
Registries, Cancer in North America: 2011-2015 (published
online in June 2018, www.naaccr.org).
Throughout this publication, “cases” and “counts” are used interchangeably.
Highlights from Facts 2018-2019 Prevalence
Prevalence is the estimated number of people alive on a
certain date in a population who previously had a diagnosis of
the disease.
An estimated 1,399,180 people in the United States (US)
are living with or in remission from leukemia, lymphoma or
myeloma (see Table 1).
New Cases
Approximately every 3 minutes, one person in the US is
diagnosed with a blood cancer*.
• An estimated combined total of 176,200 people in the US
are expected to be diagnosed with leukemia, lymphoma or
myeloma in 2019.
• New cases of leukemia, lymphoma and myeloma are
expected to account for 10.0 percent of the estimated
1,762,450 new cancer cases that will be diagnosed in
the US in 2019.
Approximate US Prevalence of the Four Major Types of Blood Cancers as of January 1, 2015
Myeloma
Hodgkin Lymphoma
124,483
196,508
Table 1. Source: SEER (Surveillance, Epidemiology, and End Results) Cancer Statistics Review, 1975-2015, National Cancer Institute; 2018.
Type Prevalence
Non-Hodgkin Lymphoma 678,222
Leukemia 399,967
Executive Summary
About Blood Cancers

Facts 2018-2019 I 3
Five-Year Relative Survival Rates by Year of Diagnosis
Figure 2. Source: SEER (Surveillance, Epidemiology, and End Results) Cancer Statistics Review, 1975-2015. National Cancer Institute; 2018.
* The difference in rates between 1975-1977 and 2008-2014 is statistically significant (p<.05).
**Survival rate among whites.
09
182736455463728190
1225 29
52*
1960-1963**
40
7282 88*
31
47 51
74*
14
3445
65*
Myeloma HodgkinLymphoma
Non-HodgkinLymphoma
Leukemia
1975-1977 2008-20141990-1992
Sur
viva
l Rat
es,
%
Incidence
Incidence rates are the number of new cases in a given year,
not counting the preexisting cases. Incidence rates are usually
presented as a specific number per 100,000 population.
Age-adjusted rates provide more reliable rates for comparison
because they reduce the bias of age in the makeup of the
populations that are being compared.
Overall age-adjusted incidence rates per 100,000 population
reported in 2018 for leukemia, lymphoma and myeloma are
close to data reported in 2017: leukemia 13.8 in 2018 vs 13.7
in 2017; non-Hodgkin lymphoma (NHL) 19.4 in 2018 vs 19.5
in 2017; Hodgkin lymphoma (HL) 2.5 in 2018 vs 2.6 in 2017;
myeloma 6.7 in 2018 vs 6.6 in 2017.
Survival
Relative survival compares the survival rate of a person
diagnosed with a disease to that of a person without the
disease. The most recent survival data available may not fully
represent the impact of all current therapies and, as a result,
may underestimate current survival. Figure 2 shows 5-year
relative survival rates.
Deaths
Approximately every 9 minutes, someone in the US dies from
a blood cancer*. This statistic represents approximately 156
people each day or more than 6 people every hour.
• Leukemia, lymphoma and myeloma are expected to cause
the deaths of an estimated 56,770 people in the US in 2019.
• These diseases are expected to account for 9.4 percent
of the deaths from cancer in 2019, based on the estimated
total of 606,880 cancer deaths.
*Data specified for “blood cancer” include leukemia, lymphoma and myeloma, and do not include data for myelodysplastic syndromes (MDS) or myeloproliferative neoplasms (MPNs).
• Overall, the likelihood of dying from blood cancer*
decreased from 2000 to 2015 (the most recent
data available). During this time, the mortality rate of
leukemia decreased by 18.3 percent, lymphoma by
33.0 percent and myeloma by 13.8 percent.
Leukemia• An estimated 399,967 people are living with or in
remission from leukemia in the US.
• In 2019, 61,780 people are expected to be diagnosed
with leukemia.
• In 2019, 22,840 people are expected to die from
leukemia.
• Approximately 32.8 percent more males than females
are living with leukemia. More males than females are
diagnosed with leukemia and die of leukemia.
Hodgkin and Non-Hodgkin Lymphoma• An estimated 874,730 people are living with or in
remission from lymphoma in the US.
• An estimated 196,508 people are living with or in
remission from HL.
• An estimated 678,222 people are living with or in
remission from NHL.
• In 2019, 82,310 new cases of lymphoma are expected
to be diagnosed in the US (8,110 cases of HL, 74,200
cases of NHL).
• In 2019, 20,970 people are expected to die from
lymphoma (1,000 from HL, 19,970 from NHL).
• NHL is the seventh most common cancer in the US,
and the age-adjusted incidence rate rose by 80.0
percent from 1975 (11.06 per 100,000 population) to
2015 (19.91 per 100,000 population).
Myeloma• An estimated 124,483 people are living with or in
remission from myeloma in the US.
• In 2019, 32,110 people are expected to be diagnosed
with myeloma.
• In 2019, approximately 12,960 people are expected to
die from myeloma.
• The age-adjusted incidence rate of myeloma
increased by 43.4 percent from 1975 (4.91 per 100,000)
to 2015 (7.04 per 100,000).
• The age-adjusted incidence rate of myeloma in black
males and females (13.4 per 100,000) was 120 percent
greater than that of white males and females (6.1 per
100,000) from 2011 to 2015.

4 I 800.955.4572 • www.LLS.org
Myelodysplastic Syndromes• An average of 14,011 new cases of myelodysplastic syndromes
(MDS) were diagnosed in the US each year from 2011 to 2015.
• The estimated overall age-adjusted incidence rate of MDS
is 4.6 cases per 100,000 population. White males have the
highest rate (6.6 per 100,000 population).
Myeloproliferative Neoplasms • An average of 9,659 new cases of myeloproliferative
neoplasms (MPNs) were diagnosed in the US each year
from 2011 to 2015.
• The estimated overall age-adjusted incidence rate of MPNs
is 2.7 cases per 100,000 population. White males have the
highest rate (3.0 per 100,000 population).
Childhood Blood Cancers • Leukemia is the most common cancer diagnosed in children,
adolescents and young adults younger than 20 years and
accounts for 25.8 percent of all cancer cases in this age group.
• From 2011 to 2015, the most recent 5 years for which data
are available, leukemia and lymphoma accounted for 39.6
percent of all cancer types in children, adolescents and
young adults younger than 20 years.
• The most common types of cancer in children, adolescents
and young adults younger than 20 years are leukemia (25.8
percent), cancers of the brain and other nervous tissue (17.0
percent), NHL (7.1 percent), HL (6.6 percent), and soft tissue
(6.0 percent).
• The age-adjusted incidence rate of leukemia and lymphoma
in children, adolescents and young adults younger than 20
years was 7.2 per 100,000 (leukemia, 4.7 and lymphoma, 2.5).
• Leukemia is the second leading cause of cancer deaths
(after cancers of the brain and other nervous tissue) among
children, adolescents and young adults younger than 20
years. This accounts for 26.1 percent of all cancer-related
deaths among this age group.
• From 2011-2015, 3.8 percent of all blood cancers (leukemia,
lymphoma, myeloma, MDS and MPNs*) were diagnosed in
children, adolescents and young adults younger than 20 years.
• From 2011-2015, 5.1 percent of all leukemia and lymphoma
cases were diagnosed in children, adolescents and young
adults younger than 20 years.
*Myeloma, MDS and MPNs are not commonly diagnosed in children, adolescents and young adults younger than age 20.
“Leukemia” is the term used to describe the four major types
of leukemia (see Table 2).
The terms “myeloid” or “myelogenous” and “lymphoid,”
“lymphocytic” or “lymphoblastic” denote the cell types
involved. In general, leukemia is characterized by the
uncontrolled accumulation of blood cells. However, the natural
history of each type, and the therapies used to treat people
with each type, are different.
Prevalence An estimated 399,967 people in the United States (US) are
living with or in remission from leukemia (see Table 3).
Thirty-three percent more males than females are living
with leukemia.
Acute lymphoblastic leukemia (ALL) and acute myeloid
leukemia (AML) are diseases that progress rapidly without
treatment. They result in the accumulation of immature,
The Four Major Types of Leukemia
Acute Lymphoblastic Leukemia (ALL)
Acute Myeloid Leukemia (AML)
Chronic Lymphocytic Leukemia (CLL)
Chronic Myeloid Leukemia (CML)
Table 2. Source: The Leukemia & Lymphoma Society.
Approximate US Prevalence of the Four Major Types of Leukemia as of January 1, 2015
Acute Lymphoblastic Leukemia
Acute Myeloid Leukemia
Type Prevalence
Chronic Lymphocytic Leukemia
Chronic Myeloid Leukemia
81,139
179,683
53,491
50,948
Table 3. Source: Surveillance, Epidemiology, and End Results (SEER) Program (www.seer.cancer.gov). Prevalence database: “US Estimated 40-Year L-D Prevalence Counts on 1/1/2015.” National Cancer Institute, DCCPS, Surveillance Research Program, Data Modeling Branch, released April 2018, based on the November 2017 SEER data submission.
nonfunctional cells in the marrow and blood. The marrow often
stops producing enough normal platelets, red blood cells and
white blood cells. Anemia, a deficiency of red blood cells,
develops in virtually everybody who has acute leukemia. The
lack of normal white blood cells impairs the body’s ability to
fight infections. A shortage of platelets results in bruising and
easy bleeding.
The progression of chronic lymphocytic leukemia (CLL) and
chronic myeloid leukemia (CML) is usually slower than that
of acute types of leukemia. The slower disease progression
of chronic leukemia allows greater numbers of more mature,
functional cells to be made.
Leukemia

Facts 2018-2019 I 5
Estimated New Cases of Leukemia, by Gender, 2019
Acute Lymphoblastic Leukemia
Acute Myeloid Leukemia
Type Female
Chronic Lymphocytic Leukemia
Chronic Myeloid Leukemia
2,650
7,840
9,800
3,740
Table 4. Source: Cancer Facts & Figures 2019. American Cancer Society; 2019.
Total Male
Other Leukemia* 1,830
3,280
12,880
11,650
5,250
2,860
5,930
20,720
21,450
8,990
4,690
Total Estimated New Cases 25,86035,92061,780
New Cases
An estimated 61,780 new cases of leukemia are expected to
be diagnosed in the US in 2019 (see Figure 3 and Table 4).
Chronic leukemia is expected to account for 8.5 percent more
cases than those of acute leukemia.
• Most cases of leukemia occur in older adults; the median
age at diagnosis is 66 years.
• From 2011 to 2015, approximately 11 times as many adults
over age 19 years (42,216) were diagnosed with leukemia
as children, adolescents and young adults younger than
20 years (3,715).
• The most common types of leukemia in adults older than
19 years are CLL (38.5% of all new leukemia cases from 2011
to 2015) and AML (32.1% of all new leukemia cases from
2011 to 2015). CML accounted for 14.1 percent of new
leukemia cases and ALL accounted for 5.8 percent of new
leukemia cases in this age group from 2011 to 2015.
• Most cases of CML occur in adults. From 2011 to 2015,
approximately 97.9 percent of all cases of CML occurred in
adults age 20 years and older.
Incidence
Since 1975, the incidence of leukemia has increased
slightly. In 1975 the incidence rate was 12.8 per 100,000
population and in 2015, it was 13.6 per 100,000 population.
See Figure 4 (on page 6) for age-specific rates.
Gender. In 2019, approximately 58 percent of the new
cases of leukemia are expected to occur in males.
Incidence rates for all types of leukemia are higher
among males than among females:
• ALL – 1.9 per 100,000 for males, 1.6 per 100,000 for
females
• AML – 5.2 per 100,000 for males, 3.6 per 100,000 for
females
• CLL – 6.4 per 100,000 for males, 3.3 per 100,000 for
females
• CML – 2.4 per 100,000 for males, 1.4 per 100,000 for
females.
Race and Ethnicity. Leukemia is the tenth most
frequently occurring type of cancer in all races and
ethnicities.
• Age-adjusted incidence of leukemia is highest among
non-Hispanic whites (15.0 per 100,000 population); it is
lowest among Asian and Pacific Islander populations
(7.8 per 100,000 population) and American Indian and
Alaska Native populations (8.3 per 100,000 population).
• Leukemia is the tenth most common cancer in whites,
eleventh most common cancer in blacks, and twelfth
most common cancer in Hispanics.
• In children, adolescents and young adults younger
than 20 years, leukemia incidence rates are highest
among Hispanics (5.8 per 100,000 population) and
lowest among blacks (3.0 per 100,000 population). The
incidence rate in whites is 5.4 per 100,000 population.
Children, Adolescents and Young Adults. From 2011 to
2015, leukemia represented 25.8 percent of all types of
cancer occurring among children, adolescents and young
adults younger than 20 years.
• In 2019, about 3,097 children and adolescents younger
than 15 years are expected to be diagnosed with
leukemia throughout the US.
• About 32.3 percent of cancer cases in children and
adolescents younger than 15 years are leukemia.
• An average of 3,715 children and adolescents younger
than 20 years were diagnosed with leukemia each
year (including 2,769 diagnosed with ALL) in the US
from 2011 to 2015.
• ALL is the most common cancer in children, adolescents
and young adults younger than 20 years, accounting for
19.8 percent of all cancer cases in this age group.
Estimated Proportion of New Cases (%) in 2019 for Types of Leukemia, Adults and Children
AML 35%21,450 cases
CLL 34%20,720 cases
ALL 10%5,930 cases
Other Leukemia* 8%4,690 cases
CML 15%8,990 cases
Figure 3. Source: Cancer Facts & Figures, 2019. American Cancer Society; 2019.
Note: Total percentage does not add up to 100% due to rounding in the calculation of individual percentages.
Total cases: 61,780
*There are other rare subtypes of leukemia, beyond the four main subtypes, which comprise “Other Leukemia.”
6 I 800.955.4572 • www.LLS.org
• In children, adolescents and young adults younger than
20 years, AML incidence is highest in children under 1 year
(1.6 per 100,000) and lowest in children ages 5 to 9 years
(0.5 per 100,000).
• From 2011 to 2015, among children ages 5 to 9 years, ALL
incidence was seven times greater than that of AML (3.7 per
100,000 for ALL and 0.5 per 100,000 for AML).
• In young adults ages 25 to 29 years, AML incidence was 50
percent greater than that of ALL (1.2 per 100,000 for AML
and 0.8 per 100,000 for ALL).
Adults. AML, CLL and CML are most prevalent in the sixth
through ninth decades of life. Incidence rates begin to
increase notably among people with
• AML – at age 60 years and older (see Figure 6 on page 7)
• CLL – at age 50 years and older (see Figure 7 on page 7)
• CML – at age 60 years and older. (see Figure 8 on page 7).
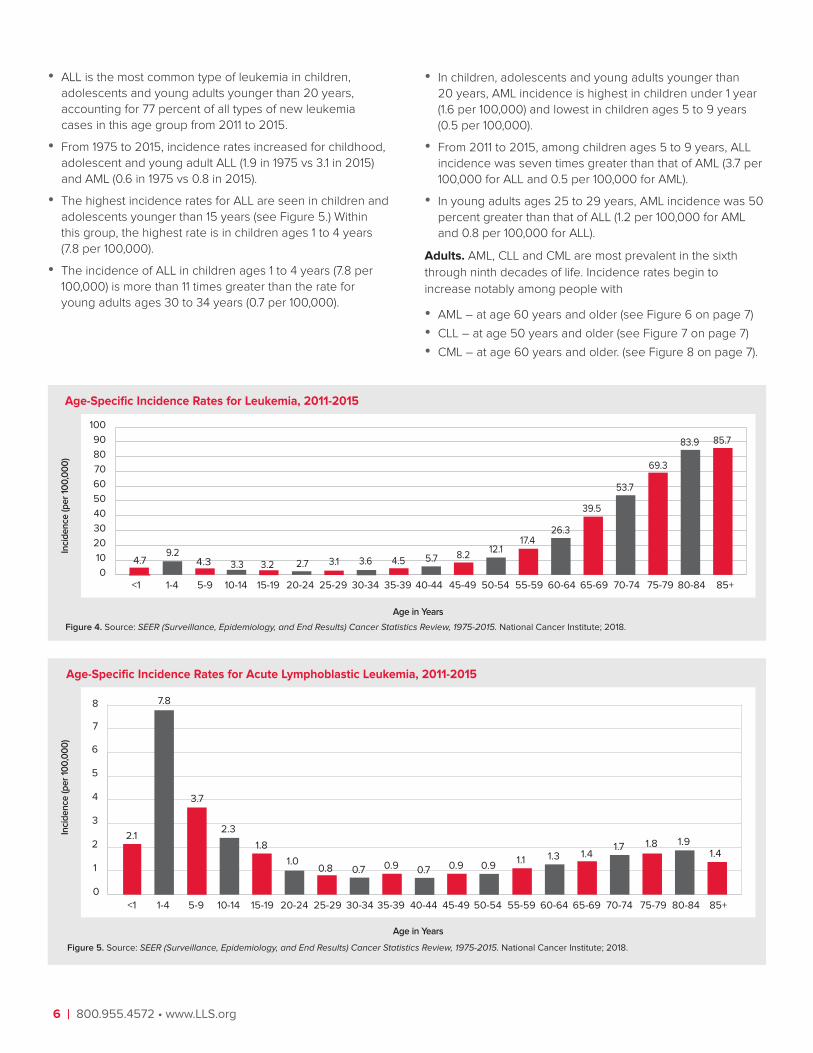
• ALL is the most common type of leukemia in children,
adolescents and young adults younger than 20 years,
accounting for 77 percent of all types of new leukemia
cases in this age group from 2011 to 2015.
• From 1975 to 2015, incidence rates increased for childhood,
adolescent and young adult ALL (1.9 in 1975 vs 3.1 in 2015)
and AML (0.6 in 1975 vs 0.8 in 2015).
• The highest incidence rates for ALL are seen in children and
adolescents younger than 15 years (see Figure 5.) Within
this group, the highest rate is in children ages 1 to 4 years
(7.8 per 100,000).
• The incidence of ALL in children ages 1 to 4 years (7.8 per
100,000) is more than 11 times greater than the rate for
young adults ages 30 to 34 years (0.7 per 100,000).
Age-Specific Incidence Rates for Leukemia, 2011-2015
Figure 4. Source: SEER (Surveillance, Epidemiology, and End Results) Cancer Statistics Review, 1975-2015. National Cancer Institute; 2018.
0
10
20
30
40
50
60
70
80
90
100
4.79.2
4.3 3.3 3.2 2.7 3.1 3.6 4.5 5.7 8.212.1
17.426.3
39.5
53.7
69.3
83.9 85.7
85+80-8475-7970-7465-6960-6455-5950-5445-4940-4435-3930-3425-2920-2415-1910-145-91-4<1
Inci
de
nce
(pe
r 10
0,0
00
)
Age in Years
Age-Specific Incidence Rates for Acute Lymphoblastic Leukemia, 2011-2015
0
1
2
3
4
5
6
1.91.4
1.81.71.41.31.1
0.90.71.0
0.8
1.8
2.3
3.7
7.8
2.1
85+80-8475-7970-7465-6960-6455-5950-5445-4940-4435-3930-3425-2920-2415-1910-145-91-4<1
7
8
0.7 0.9 0.9
Inci
de
nce
(pe
r 10
0,0
00
)
Figure 5. Source: SEER (Surveillance, Epidemiology, and End Results) Cancer Statistics Review, 1975-2015. National Cancer Institute; 2018.
Age in Years

Facts 2018-2019 I 7
Age-Specific Incidence Rates for Acute Myeloid Leukemia, 2011-2015
0
5
10
15
20
25
30 28.6
26.2
23.4
18.2
12.1
7.9
4.8
1.61.51.1 1.21.00.70.51.01.6
85+80-8475-7970-7465-6960-6455-5950-5445-4940-4435-3930-3425-2920-2415-1910-145-91-4<1
2.0 2.5 3.5Inci
de
nce
(pe
r 10
0,0
00
)
Figure 6. Source: SEER (Surveillance, Epidemiology, and End Results) Cancer Statistics Review, 1975-2015. National Cancer Institute; 2018.
Age in Years
Age-Specific Incidence Rates for Chronic Lymphocytic Leukemia, 2011-2015
0
5
10
15
20
25
30
34.9 35.8
29.3
23.7
18.0
11.9
7.4
0.40.10.0* 0.0*0.0*0.0*0.0*0.0*0.0*
85+80-8475-7970-7465-6960-6455-5950-5445-4940-4435-3930-3425-2920-2415-1910-145-91-4<1
0.92.1
4.5
35
40
Inci
de
nce
(pe
r 10
0,0
00
)
Figure 7. Source: SEER (Surveillance, Epidemiology, and End Results) Cancer Statistics Review, 1975-2015. National Cancer Institute; 2018.
*<16 cases for each age and time interval, SEER 18 areas
Age in Years
Age-Specific Incidence Rates for Chronic Myeloid Leukemia, 2011-2015
0
5
10
15
10.3 10.18.76.3
4.93.3
2.41.10.90.4 0.70.20.10.10.10.4
85+80-8475-7970-7465-6960-6455-5950-5445-4940-4435-3930-3425-2920-2415-1910-145-91-4<1
1.4 1.7 2.0
Inci
de
nce
(pe
r 10
0,0
00
)
Figure 8. Source: SEER (Surveillance, Epidemiology, and End Results) Cancer Statistics Review, 1975-2015. National Cancer Institute; 2018.
Age in Years
8 I 800.955.4572 • www.LLS.org
Signs and Symptoms
Signs and symptoms of acute leukemia may include easy
bruising or bleeding (because of platelet deficiency), paleness
or easy fatigue (because of anemia), and/or recurrent minor
infections or poor healing of minor cuts (because of a low
white blood cell count). These signs and symptoms are
not unique to leukemia and may be caused by other, more
common conditions. Nonetheless, they do warrant medical
evaluation. The diagnosis of leukemia requires specific blood
tests, including an examination of cells in the blood and bone
marrow. People who have chronic leukemia may not have
major symptoms; they may be diagnosed as a result of a
periodic physical examination and testing.
Possible Causes
The cause of most cases of leukemia is not known.
Extraordinary doses of radiation and certain cancer therapies
are possible causes. Repeated exposure to the chemical
benzene may cause acute myeloid leukemia (AML).
Automobile exhaust and industrial emissions account for about
20 percent of the total national benzene exposure. About half
of the benzene exposure in the US population results from
tobacco smoking or from exposure to tobacco smoke. The
average smoker is exposed to about 10 times the daily intake
of benzene compared to nonsmokers.
Treatment The goal of leukemia treatment is to bring about a complete
remission. Patients with acute myeloid leukemia (AML) and
acute lymphoblastic leukemia (ALL) need to start treatment soon
after diagnosis. Treatment may include chemotherapy, targeted
therapies, monoclonal antibody therapy, immunotherapy and
stem cell transplantation. Patients diagnosed with chronic
myeloid leukemia (CML) are usually treated with tyrosine kinase
inhibitors, oral dugs that may need to be taken indefinitely to
keep CML under control. Some patients diagnosed with chronic
lymphocytic leukemia (CLL) do not need treatment for a long
period of time after diagnosis; this period is sometimes called
“watch-and-wait.” Patients who need treatment may receive
chemotherapy, targeted therapy, monoclonal antibody therapy
or treatments in combination. All patients should consider new
approaches under study (clinical trials).
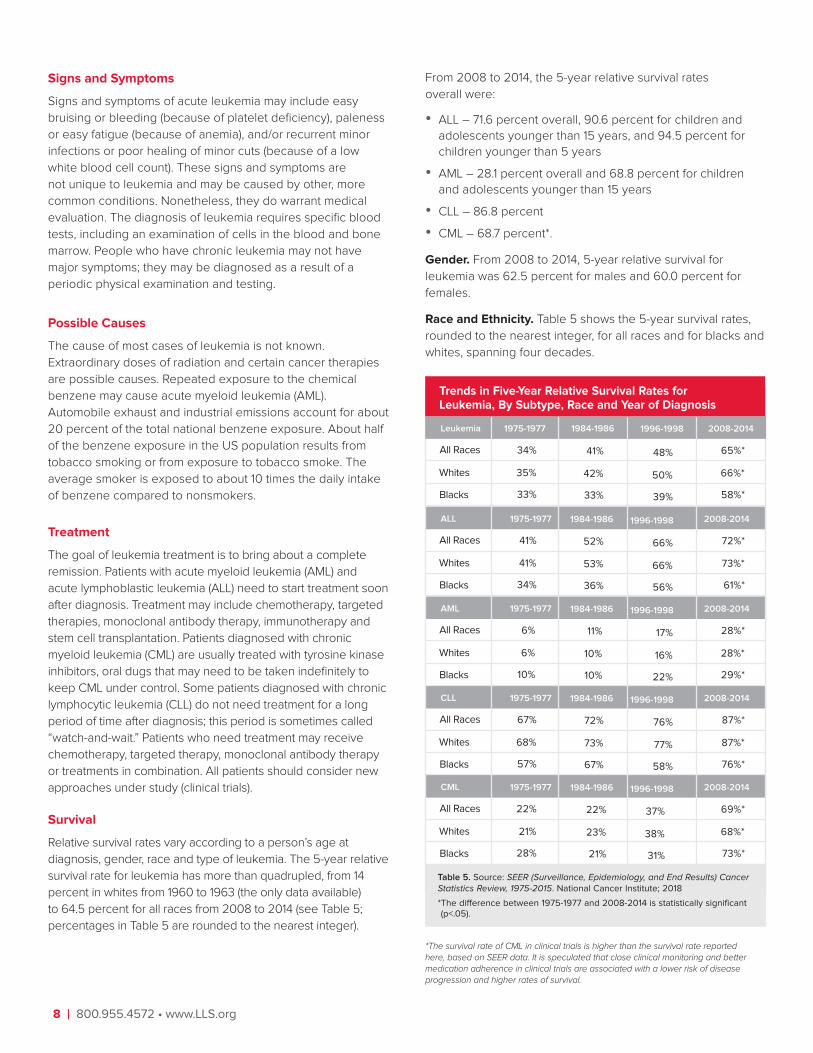
Survival
Relative survival rates vary according to a person’s age at
diagnosis, gender, race and type of leukemia. The 5-year relative
survival rate for leukemia has more than quadrupled, from 14
percent in whites from 1960 to 1963 (the only data available)
to 64.5 percent for all races from 2008 to 2014 (see Table 5;
percentages in Table 5 are rounded to the nearest integer).
From 2008 to 2014, the 5-year relative survival rates
overall were:
• ALL – 71.6 percent overall, 90.6 percent for children and
adolescents younger than 15 years, and 94.5 percent for
children younger than 5 years
• AML – 28.1 percent overall and 68.8 percent for children
and adolescents younger than 15 years
• CLL – 86.8 percent
• CML – 68.7 percent*.
Gender. From 2008 to 2014, 5-year relative survival for
leukemia was 62.5 percent for males and 60.0 percent for
females.
Race and Ethnicity. Table 5 shows the 5-year survival rates,
rounded to the nearest integer, for all races and for blacks and
whites, spanning four decades.
All Races
Blacks
Leukemia
Whites
Table 5. Source: SEER (Surveillance, Epidemiology, and End Results) Cancer Statistics Review, 1975-2015. National Cancer Institute; 2018
* The difference between 1975-1977 and 2008-2014 is statistically significant (p<.05).
Trends in Five-Year Relative Survival Rates for Leukemia, By Subtype, Race and Year of Diagnosis
All Races
Blacks
ALL
Whites
All Races
Blacks
AML
Whites
All Races
Blacks
CLL
Whites
All Races
Blacks
CML
Whites
65%*
66%*
58%*
2008-2014
72%*
73%*
61%*
2008-2014
28%*
28%*
29%*
2008-2014
87%*
87%*
76%*
2008-2014
69%*
68%*
73%*
2008-2014
1996-1998
48%
50%
39%
1996-1998
66%
66%
56%
1996-1998
17%
16%
22%
1996-1998
76%
77%
58%
1996-1998
37%
38%
31%
1984-1986
41%
42%
33%
1984-1986
52%
53%
36%
1984-1986
11%
10%
10%
1984-1986
72%
73%
67%
1984-1986
22%
23%
21%
1975-1977
34%
35%
33%
1975-1977
41%
41%
34%
1975-1977
6%
6%
10%
1975-1977
67%
68%
57%
1975-1977
22%
21%
28%
*The survival rate of CML in clinical trials is higher than the survival rate reported here, based on SEER data. It is speculated that close clinical monitoring and better medication adherence in clinical trials are associated with a lower risk of disease progression and higher rates of survival.

Facts 2018-2019 I 9
Five-Year Relative Survival Rates for Acute Lymphoblastic Leukemia in Children Under 15, Diagnosed 1964-2014
Figure 9. Sources: 1. Zuelzer WW. Implications of long-term survivals in acute stem cell leukemia of childhood treated with composite cyclic therapy. Blood. 1964:24:477-494. 2. SEER (Surveillance, Epidemiology, and End Results) Cancer Statistics Review, 1975-2015, National Cancer Institute; 2018.
* The difference in rates between 1975-1977 and 2008-2014 is statistically significant (p<.05).
1964
1
1975
-772
1978
-802
1981
-832
1984
-862
1987
-892
1990
-922
1993
-952
1996
-982
1999
-0120
102030405060708090
3
5766
71 7278 83 84 8987 91*
2008
-142
2003
-072
92
Year of Diagnosis
Sur
viva
l Rat
es,
%
Children, Adolescents and Young Adults. Figure 9 shows
that childhood ALL 5-year survival rates have improved
significantly over the past 5 decades. Most children,
adolescents and young adults younger than 20 years who
have ALL are expected to become 5-year survivors of the
disease. However, significant treatment-related long-term
morbidity and mortality for childhood cancer have been well
established by several studies. Long-term treatment-related
effects among ALL and other childhood cancer survivors may
include cognitive impairment, subsequent cancer, cardiac
disease, pulmonary disease or other diseases.
Deaths
Approximately 22,840 deaths (13,150 males and 9,690
females) in the US are expected to be attributed to leukemia
in 2019. Estimated deaths for the four major types of leukemia
in 2019 are
• ALL – 1,500 deaths
• AML – 10,920 deaths
• CLL – 3,930 deaths
• CML – 1,140 deaths
• Other leukemia* – 5,350 deaths.
In general, mortality rates for leukemia decreased from 1975
(8.1 per 100,000) to 2015 (6.3 per 100,000).
*There are other rare subtypes of leukemia, beyond the four main subtypes, which comprise “Other Leukemia.”
Gender. From 2011 to 2015, leukemia was the sixth most
common cause of cancer deaths in both men and women in
the US. In 2019, the estimated number of deaths expected
to be attributed to leukemia in the US is 35.7 percent higher
for males than for females. Expected deaths from leukemia in
2019, according to gender, are shown in Table 6.
Race and Ethnicity. For leukemia, the highest age-adjusted
rates of death from 2011 to 2015 were in non- Hispanic whites
at 7.0 per 100,000 population, followed by blacks at 5.6 per
100,000 population and Hispanic whites at 5.1 per 100,000
population.
• Leukemia is the fifth most common cause of cancer deaths
in white males and the sixth most common in white females.
• Leukemia is the eighth most common cause of cancer
deaths in black males and the ninth most common in
black females.
• From 2011 to 2015, blacks between the ages of 30 and 64
years had a higher death rate from leukemia than whites.
Children, Adolescents and Young Adults. The leukemia
age-adjusted death rate for children, adolescents and young
adults younger than 20 years in the US has declined by
78.6 percent from 2.8 per 100,000 population in 1969 to 0.6
per 100,000 population in 2015. Despite this decline, leukemia
is the second leading cause of cancer death among children,
adolescents and young adults younger than 20 years,
accounting for 26.1 percent of all cancer deaths in this
age group.
Estimated Deaths from Leukemia, by Gender, 2019
Acute Lymphoblastic Leukemia
Acute Myeloid Leukemia
Type Female
Chronic Lymphocytic Leukemia
Chronic Myeloid Leukemia
650
1,710
4,630
480
Table 6. Source: Cancer Facts & Figures 2019. American Cancer Society; 2019.
Total Male
Other Leukemia* 2,220
850
2,220
6,290
660
3,130
1,500
3,930
10,920
1,140
5,350
Total 9,69013,15022,840

10 I 800.955.4572 • www.LLS.org
“Lymphoma” is a general term for many blood cancers that
originate in the lymphatic system. Lymphoma results when a
lymphocyte (a type of white blood cell) undergoes a malignant
change and multiplies out of control. Eventually, healthy cells
are crowded out and malignant lymphocytes amass in the
lymph nodes, liver, spleen and/or other sites in the body.
Hodgkin Lymphoma. Hodgkin lymphoma (HL) represents 9.9
percent of all types of lymphoma expected to be diagnosed in
2019. This disease has characteristics that distinguish it from
other diseases classified as lymphoma, including the presence
of the Reed-Sternberg cell, a large, malignant cell found in
HL tissues.
Non-Hodgkin Lymphoma. Non-Hodgkin lymphoma (NHL)
represents 90.1 percent of all types of lymphoma expected
to be diagnosed in 2019. This disease comprises a diverse
group of diseases (subtypes) that are distinguished by the
characteristics of the cancer cells associated with each
disease type. The designations “indolent” and “aggressive”
are often applied to types of NHL. Each type is associated
with factors that categorize the prognosis as either more or
less favorable.
Prevalence
An estimated total of 874,730 people in the United States (US)
population are living with or in remission from lymphoma.
• There are 196,508 people living with or in remission from
Hodgkin lymphoma.
• There are 678,222 people living with or in remission from
non-Hodgkin lymphoma.
New Cases
About 82,310 people in the US are expected to be diagnosed
with lymphoma in 2019 (8,110 cases of HL and 74,200 cases
of NHL). The incidence of HL is consistently and considerably
lower than that of NHL. Table 7 shows estimated new cases of
lymphoma in 2019, by gender.
Incidence
From 2011 to 2015, the age-adjusted incidence rate for
lymphoma was 21.9 per 100,000. See Figure 10 (on page 11) for
age-specific rates.
• The age-adjusted incidence rate for HL was 2.5 per
100,000.
• The age-adjusted incidence rate for NHL was 19.4 per
100,000.
The age-adjusted incidence rate of HL declined by 14.9
percent from 1975 (3.09 per 100,000) to 2015 (2.63 per
100,000), an annual percentage decrease of 0.4 percent. The
age-adjusted incidence rate of NHL rose by 80.0 percent
from 1975 (11.06 per 100,000) to 2015 (19.91 per 100,000), an
average annual percentage increase of 2.0 percent.
Gender. Age-adjusted incidence rates for HL and NHL are
higher among males than among females.
• HL – 2.9 per 100,000 for males; 2.2 per 100,000 for
females
• NHL – 23.6 per 100,000 for males; 15.9 per 100,000 for
females
In 2019, it is expected that 29.1 percent more males than
females will be diagnosed with HL and about 24.1 percent
more males than females will be diagnosed with NHL.
NHL is the sixth most common cancer in males and the
seventh most common cancer in females in the US.
Race and Ethnicity. The highest age-adjusted incidence rate
of lymphoma is in non-Hispanic whites (23.7 per 100,000),
followed by Hispanic whites (20.3 per 100,000) and blacks
(17.0 per 100,000).
• The highest age-adjusted incidence rate of HL is in
non-Hispanic whites (2.9 per 100,000), followed by blacks
(2.6 per 100,000) and Hispanic whites (2.3 per 100,000).
• The highest age-adjusted incidence rate of NHL is in
non-Hispanic whites (20.8 per 100,000), followed by
Hispanic whites (18.0 per 100,000) and blacks (14.4 per
100,000).
Blacks, from their early-20s to their early-40s, have higher
incidence rates of NHL than whites. However, beginning at
age 50 years, whites generally have considerably higher
incidence rates of NHL than blacks.
NHL is the fifth most common cancer in Hispanics.
Children, Adolescents and Young Adults. Lymphoma (HL, 6.6
percent; NHL, 7.1 percent) is the third most common cancer in
children, adolescents and young adults younger than 20 years.
Hodgkin and Non-Hodgkin Lymphoma
Estimated New Cases of Lymphoma by Gender, 2019
Hodgkin Lymphoma
Total
Type Female
Non-Hodgkin Lymphoma
3,540
33,110
36,650
Total Male
4,570
41,090
45,660
8,110
74,200
82,310
Table 7. Source: Cancer Facts & Figures 2019. American Cancer Society; 2019.

Facts 2018-2019 I 11
• In 2019, lymphoma will account for 8 percent (HL, 3 percent;
NHL, 5 percent) of all cancers expected to be diagnosed in
children and adolescents younger than 15 years. The number
of cases expected to be diagnosed in children and adolescents
younger than 15 years is 332 for HL and 553 for NHL.
• In children ages 1 to 14, the age-adjusted incidence rate for
NHL (1.1 per 100,000) is higher than for HL (0.6 per 100,000).
• In adolescents and young adults between the ages of 15
and 29, the age-adjusted incidence rate for HL (3.6 per
100,000) is higher than for NHL (2.6 per 100,000).
• In young adults ages 30 to 34, NHL incidence (4.6 per
100,000) is higher than HL incidence (3.4 per 100,000).
The following data are based on age-adjusted incidence rates for
children, adolescents and young adults younger than 20 years:
• Lymphoma is most commonly diagnosed in non-Hispanic
whites (2.8 per 100,000 population), followed by blacks
(2.3 per 100,000 population).
Age-Specific Incidence Rates for Lymphoma, 2011-2015
Figure 10. Source: SEER (Surveillance, Epidemiology, and End Results) 18 Registries, 2011-2015. National Cancer Institute; 2018.
*<16 cases for each age and time interval, SEER 18 areas
0
10
20
30
40
50
60
70
80
90
100
0.0* 0.8 1.6 2.6 5.0 6.5 7.2 8.0 9.712.2
16.623.9
32.8
46.2
66.0
86.4
108.6
85+80-8475-7970-7465-6960-6455-5950-5445-4940-4435-3930-3425-2920-2415-1910-145-91-4<1
110
120
130123.0
112.7
Inci
de
nce
(pe
r 10
0,0
00
)
Age in Years
• Lymphoma is least commonly diagnosed among American
Indians and Alaska Natives (1.4 per 100,000 population).
Adults. HL incidence rates are higher in adolescents and
young adults ages 15 to 34 years than in adults ages 35 to 64
years. Incidence peaks at ages 75 to 79 years (see Figure 11).
In contrast, the incidence rates of NHL increase with age (see
Figure 12 on page 12).
• From ages 20 to 24 years, the incidence rate of NHL is
2.5 cases per 100,000 population.
• From ages 60 to 64 years, the incidence rate increases
17 times to 43.6 cases per 100,000 population.
• From ages 80 to 84 years, the incidence rate increases
almost 48 times to 119.0 cases per 100,000 population.
Age-Specific Incidence Rates for Hodgkin Lymphoma, 2011-2015
0
1
2
3
4
5
4.0
3.3
4.3
3.63.0
2.62.8
3.4
4.03.8
3.0
1.2
0.40.10.0*
85+80-8475-7970-7465-6960-6455-5950-5445-4940-4435-3930-3425-2920-2415-1910-145-91-4<1
2.72.4 2.4 2.4
Inci
de
nce
(pe
r 10
0,0
00
)
Figure 11. Source: SEER (Surveillance, Epidemiology, and End Results) Cancer Statistics Review, 1975-2015. National Cancer Institute; 2018.
*<16 cases for each age and time interval, SEER 18 areas
Age in Years

12 I 800.955.4572 • www.LLS.org
Age-Specific Incidence Rates for Non-Hodgkin Lymphoma, 2011-2015
0
10
20
30
40
50
60
70
80
90
100
0.0* 0.7 1.2 1.4 2.0 2.5 3.4 4.6 6.9 9.514.2
21.5
30.4
43.6
63.1
82.7
104.4
119.0
109.4
85+80-8475-7970-7465-6960-6455-5950-5445-4940-4435-3930-3425-2920-2415-1910-145-91-4<1
110
120
Inci
de
nce
(pe
r 10
0,0
00
)
Figure 12. Source: SEER (Surveillance, Epidemiology, and End Results) Cancer Statistics Review, 1975-2015. National Cancer Institute; 2018.
*<16 cases for each age and time interval, SEER 18 areas
Age in Years
Signs and Symptoms
A common early sign of HL or NHL is a painless enlargement
of one or more lymph nodes. Enlarged lymph nodes may
also be the result of inflammation in the body and are not
necessarily a sign of cancer.
Other HL signs and symptoms may include recurrent high
fever, persistent cough and shortness of breath, drenching
night sweats of the whole body, itching and weight loss.
Other signs and symptoms of NHL may include bone pain,
cough, chest pain, abdominal pain, rash, fever, night sweats,
enlarged spleen, unexplained fatigue or weight loss. Some
individuals may have no symptoms, and a diagnosis of NHL is
made as a result of a periodic physical examination and testing.
Possible Causes
The results of certain studies about causes of HL have not
been definitive—many studies of links between HL and
environmental exposures have been conducted, with unclear
results. Although Epstein-Barr virus (EBV) has been associated
with nearly half of HL cases, EBV has not been conclusively
established as a cause. People infected with human
immunodeficiency virus (HIV) have increased probability
of developing HL.
The reasons for the development of NHL are not known.
Immune suppression plays a role in some cases. People
infected with the human immunodeficiency virus (HIV) have
a higher risk of developing lymphoma. Studies suggest that
specific ingredients in herbicides and pesticides may be linked
to NHL. Exposure to certain viruses, such as EBV and human
T-lymphotropic virus (HTLV), are also associated with NHL.
The bacterium Helicobacter pylori causes ulcers in the
stomach, and it is associated with the development of
mucosa-associated lymphoid tissue (MALT) lymphoma in the
stomach wall. About a dozen uncommon, inherited syndromes
can predispose individuals to develop NHL. These risk factors
explain only a small proportion of cases.
Treatment
The goal of treatment for HL is to cure the disease.
Chemotherapy, either alone or combined with an
antibody-drug conjugate or modality therapy (chemotherapy
and radiation), are commonly administered treatment
approaches for HL. Involved field radiation therapy (IFRT) and
involved site radiation therapy (ISRT) are the most common
types of radiotherapy used to treat HL. The radiation targets
primarily the lymph node regions involved by disease.
Chemotherapy is used to kill neighboring lymphoma cells.
In general, the goal of treatment for NHL is to destroy as
many lymphoma cells as possible and to induce a complete
remission. Treatment protocols vary according to the type of
disease. Chemotherapy and radiation therapy are the two
principal forms of treatment. Although radiation therapy is
often neither the sole nor the principal curative therapy, it is
an important additional treatment in some cases. Stem cell
transplantation and a watch-and-wait strategy are also used to
treat some NHL subtypes. Immunotherapy is indicated to treat
individuals with specific types of NHL.

Facts 2018-2019 I 13
Survival
HL is now considered to be one of the most curable forms
of cancer.
• The 5-year relative survival rate for people with HL has
more than doubled, from 40 percent in whites from 1960 to
1963 (the only data available) to 88.4 percent for all races
from 2008 to 2014.
• The 5-year relative survival rate is 93.9 percent for all
people with HL who were younger than 45 years at
diagnosis.
The 5-year relative survival rate for people with NHL has risen
from 31 percent in whites from 1960 to 1963 (the only data
available) to 74.1 percent for all races from 2008 to 2014.
• The 5-year relative survival rate is 83.3 percent for all
people with NHL who were younger than 45 years at
diagnosis.
Gender. From 2008 to 2014, 5-year relative survival rates
were
• HL – 87.4 per 100,000 for males and 89.7 per 100,000 for
females
• NHL – 73.3 per 100,000 for males and 75.0 per 100,000 for
females.
Race and Ethnicity. Table 8 shows the 5-year relative survival
rates, rounded to the nearest integer, for all races and for
blacks and whites, spanning four decades.
All Races
Blacks
Lymphoma
Whites
Trends in Five-Year Relative Survival Rates for Lymphoma, by Subtype, Race and Year of Diagnosis
All Races
Blacks
HodgkinLymphoma
Whites
All Races
Blacks
Whites
76%*
77%*
72%*
2008-2014
88%*
89%*
86%*
2008-2014
74%*
75%*
69%*
2008-2014
1996-1998
63%
63%
60%
1996-1998
85%
86%
81%
1996-1998
59%
60%
55%
1984-1986
57%
57%
53%
1984-1986
78%
79%
75%
1984-1986
52%
52%
47%
1975-1977
53%
53%
56%
1975-1977
72%
72%
70%
1975-1977
47%
47%
49%
Non-HodgkinLymphoma
Table 8. Source: SEER (Surveillance, Epidemiology, and End Results) 9 Registries, 1973-2015. National Cancer Institute; 2018
* The difference between 1975-1977 and 2008-2014 is statistically significant (p<.05).
Children, Adolescents and Young Adults. Five-year relative
survival is 98.3 percent for HL in children, adolescents and
young adults younger than 20 years.
In children, adolescents and young adults younger than 20
years, 5-year relative survival for NHL is 84.3 percent. This
represents a significant improvement in the rate of survival. As
recently as the mid-1970s, most children and adolescents with
NHL did not survive 5 years after they were diagnosed (44.6
percent in 1975 to 1977).
Deaths
In 2019, an estimated 20,970 members of the US population
are expected to die from lymphoma (1,000 HL and 19,970
NHL), as shown in Table 9.
Gender. NHL is the eighth most common cause of cancer
death in males and females in the US. Death rates for HL are
much lower than those for NHL for both males and females.
• Males – 0.4 per 100,000 for HL; 7.4 per 100,000 for NHL
• Females – 0.3 per 100,000 for HL; 4.5 per 100,000 for NHL
Race and Ethnicity. For NHL, the highest age-adjusted rates
of death from 2011 to 2015 were in non-Hispanic whites at 6.0
per 100,000 population, followed by Hispanic whites at 5.2 per
100,000 population and blacks at 4.2 per 100,000 population.
Children, Adolescents and Young Adults. For children,
adolescents and young adults under 20 years, age-adjusted
death rates for HL and NHL per 100,000 population declined
from 1975 to 2015.
• For HL, the rate was 0.1 in 1975 vs 0.0* in 2015.
• For NHL, the rate was 0.4 in 1975 vs 0.1 in 2015.
*Statistic not reported due to fewer than 16 deaths.
Estimated Deaths from Lymphoma, by Gender, 2019
Hodgkin Lymphoma
Total
Type Female
Non-Hodgkin Lymphoma
410
8,460
8,870
Table 9. Source: Cancer Facts & Figures 2019. American Cancer Society; 2019.
Total Male
590
11,510
12,100
1,000
19,970
20,970

14 I 800.955.4572 • www.LLS.org
Myeloma is a cancer of the plasma cells (a type of white blood
cell). Plasma cells are found primarily in the bone marrow.
About 90 percent of people with myeloma have disease
involving multiple sites at the time of diagnosis (multiple
myeloma). Some individuals have myeloma that progresses
very slowly (sometimes referred to as “smoldering” or
“indolent” myeloma).
In myeloma, a B lymphocyte (the cell type that forms plasma
cells) becomes malignant. Eventually, malignant plasma cells
(myeloma cells) amass in the marrow and sometimes in other
sites in the body. The myeloma cells disrupt normal blood
production, destroy normal bone tissue and cause pain.
Healthy plasma cells produce immunoglobulins (antibodies)
that protect the body against certain types of infection. The
onset of myeloma interferes with antibody production, making
people with myeloma susceptible to infection and other
serious complications.
Prevalence
An estimated 124,483 people in the US are living with or in
remission from myeloma.
New Cases
An estimated 32,110 new cases of myeloma (18,130 males and
13,980 females) are expected to be diagnosed in the US in
2019 (see Table 10).
The median age at diagnosis is 69 years; myeloma is seldom
diagnosed in people younger than 40 years.
Incidence
For the years 2011 to 2015, the age-adjusted incidence rate for
myeloma was 6.7 per 100,000.
Gender. The age-adjusted incidence rate for the years 2011
to 2015 was 58.5 percent higher in males (8.4 per 100,000
population) than it was in females (5.3 per 100,000 population).
Myeloma
Estimated New Cases of Myeloma, by Gender, 2019
Myeloma
Cancer Type Female
13,980
Table 10. Source: Cancer Facts & Figures 2019. American Cancer Society; 2019.
Total Male
18,13032,110
Race and Ethnicity. From 2011 to 2015, myeloma was the
ninth most commonly diagnosed cancer among black males
and females.
• The median age at diagnosis is 66 years for blacks and 70
years for whites.
• Blacks have more than twice the age-adjusted incidence
rate (13.4 per 100,000 population) of myeloma than whites
(6.1 per 100,000 population).
• Black males have a higher age-adjusted myeloma incidence
rate (15.9 per 100,000) than males or females of any other
race or ethnicity.
• The highest incidence rate is found in black males who are
ages 80 to 84 (113.9 per 100,000 population).
Age. Figure 13 shows the age-specific incidence rates for
myeloma for the years 2011 to 2015.
Signs and Symptoms
The first symptom of myeloma is often bone pain from the
effects that myeloma cells are having on the marrow. Fractures
may occur as a result of the weakened bones. Anemia, recurrent
infections, or numbness or pain in the hands and/or feet (caused
by a condition called “peripheral neuropathy”) can also be early
signs of the disease. People with myeloma may also tire more
easily and feel weak, or they may have no symptoms.
Possible Causes
The cause of myeloma is unknown in most cases. Long-term
exposure to certain chemicals seems to increase the risk of
developing myeloma, but most people who have myeloma do
not have any history of such exposure, indicating that other
Age-Specific Incidence Rates for Myeloma, 2011-2015
Figure 13. Source: SEER (Surveillance, Epidemiology, and End Results) Cancer Statistics Review, 1975-2015, National Cancer Institute; 2018.
0-1
9
20
-24
25
-29
30
-34
35
-39
40
-44
45
-49
50
-54
55
-59
60
-64
65
-69
70
-74
75
-79
80
-84
0
5
10
15
20
25
30
35
40
0.0 0.0 0.1 0.4 0.9 2.14.1
7.0
11.2
16.8
25.4
33.8
41.645.7
36.2
85
+
45
50
Inci
de
nce
(pe
r 10
0,0
00
)
Age in Years

Facts 2018-2019 I 15
factors must play a major role. There are presently clinical
trials going on to look at possible causes and precursors of
myeloma. Contact an LLS Information Specialist at
(800) 955.4572 for more information.
Treatment
The goals of treatment for people with myeloma are to reduce
symptoms, to slow disease progression and to provide
prolonged remission. There have been significant treatment
advances in recent years. The approach for treating each
person is customized, based on the extent of disease and
the rate of disease progression. People who have a slow-
growing myeloma and no symptoms may not need treatment
immediately. Some people need only supportive care to
reduce symptoms of anemia, high blood calcium levels,
infections and/or bone damage or osteoporosis. Patients who
require myeloma-specific therapies may receive combination
drug therapy, high-dose chemotherapy with stem cell
transplantation (autologous, allogeneic or reduced-intensity
allogeneic), radiation therapy for local disease and/or new and
emerging drug therapies as part of clinical trials.
Survival
Current statistical databases show that overall 5-year relative
survival in people with myeloma has improved significantly
since the 1960s. Table 11 shows the 5-year relative survival
rates, rounded to the nearest integer, for all races and for
blacks and whites, spanning four decades.
• Five-year relative survival has increased from 12 percent
from 1960 to 1963 (for whites, the only data available) to
52.4 percent from 2008 to 2014 (for all races and ethnicities).
• The 3-year survival rate as of January 1, 2015, was
66.2 percent (for all races and ethnicities).
• The 5-year survival rate is 75.7 percent for people with
myeloma who were younger than 45 years at diagnosis.
Gender. From 2008 to 2014, 5-year relative survival was
50.6 percent for males and 50.9 percent for females.
Race and Ethnicity. Five-year survival from 2008 to 2014
is highest for black females (55.2 percent) compared to
51.8 percent for black males, 52.0 percent for white males
and 51.8 percent for white females.
Trends in Five-Year Relative Survival Rates for Myeloma, by Race and Year of Diagnosis
Table 11. Source: SEER (Surveillance, Epidemiology, and End Results) Cancer Statistics Review, 1975-2015, National Cancer Institute; 2018.
*The difference between 1975-1977 and 2008-2014 is statistically significant (p<.05).
All Races
Blacks
Whites
52%*
52%*
54%*
2008-20141996-1998
33%
32%
32%
1984-1986
27%
26%
32%
1975-1977
25%
24%
29%
Deaths
Approximately 12,960 deaths from myeloma are expected in
2019 (see Table 12).
Estimated Deaths from Myeloma, by Gender, 2019
Myeloma
Cancer Type Female
5,970
Table 12. Source: Cancer Facts & Figures 2019. American Cancer Society; 2019.
Total Male
6,99012,960
Gender. Myeloma was the seventh most common cause of
cancer death for black females and the twelfth most common
cause of cancer death for white females from 2011 to 2015.
Myeloma was the seventh leading cause of cancer death for
black males and the thirteenth most common cause of cancer
death for white males from 2011 to 2015.
Race and Ethnicity. As reported in Cancer Facts & Figures for
African Americans 2019-2021, the American Cancer Society
estimated that approximately 3 percent of all cancer-related
deaths among blacks are expected to be caused by myeloma.
• The age-adjusted mortality rate for myeloma from 2011 to
2015 for black males was nearly double the rate for white
males (7.5 per 100,000 population vs 4.0 per 100,000
population).
• For black females, the age-adjusted mortality rate from
myeloma was more than twice the rate for white females
(5.5 per 100,000 population vs 2.4 per 100,000 population).
• The US median age at death from myeloma is 75 years.
It is 76 years for whites, 71 years for blacks and 72 years
for Hispanics.

16 I 800.955.4572 • www.LLS.org
Myelodysplastic Syndromes Age-Adjusted Incidence Rates, per 100,000 Population, 2011-2015
All Races
Black
By Race Rate
White
Asian/Pacific Islander
4.6
4.8
3.9
3.2
Table 13. Source: SEER (Surveillance, Epidemiology, and End Results) Cancer Statistics Review, 1975-2015. National Cancer Institute; 2018.
* Incidence data for American Indians/Alaska Natives are based on the CHSDA (Contract Health Service Delivery Area) counties.
* *Hispanics are not mutually exclusive from whites, blacks, Asian/Pacific Islanders, and American Indians/Alaska Natives. Incidence data for Hispanics are based on NAACCR Hispanic Identification Algorithm (NHIA), and exclude cases from the Alaska Native Registry.
American Indian/Alaska Native* 3.4
Hispanic** 3.2
Ages <40
Ages 50-59
By Age Rate
Ages 40-49
Ages 60-69
0.4
0.7
2.2
8.6
Ages 70-79 28.3
Ages 80+ 56.8
Myelodysplastic syndromes (MDS) comprise a group of
diseases of the blood and marrow, with varying degrees of
severity and life expectancy. A myelodysplastic syndrome
begins with a change to a normal stem cell in the marrow.
The marrow becomes filled with an increased number of
developing blood cells. However, the blood is usually deficient
in cell numbers because the cells in the marrow die before
they can be released into the blood. Normally, immature cells
known as “blasts” make up less than 5 percent of all cells in
the marrow. In a person with MDS, blasts often constitute more
than 5 percent of the cells, and in a person with acute myeloid
leukemia (AML), blasts constitute more than 20 percent of
the cells in the marrow. MDS has been known as “smoldering
leukemia” or “preleukemia.” These terms may be misleading
because they imply that MDS is only serious and problematic if
it evolves into AML; this is not the case.
The most common MDS subtypes are
• Refractory anemia with excess blasts, 16.1 percent
• Refractory cytopenia with multilineage dysplasia, 7.8 percent.
People diagnosed with MDS, not otherwise specified (MDS
NOS), constitute 59.9 percent of all MDS cases.
Prevalence
The SEER program only recently began maintaining statistics
for MDS. Prevalence statistics were not reported by SEER for
MDS in 2019 at the time of this publication.
New Cases
For the 5-year period from 2011 to 2015, there were 70,056
new cases of MDS throughout the US, averaging 14,011 cases
per year.
Incidence
The overall age-adjusted incidence rate of MDS is 4.6 cases
per 100,000 population (see Table 13).
Gender. In the United States (US), for the 5-year period from
2011 to 2015, 40,730 MDS cases were diagnosed in males
(averaging 8,146 per year) and 29,326 MDS cases were
diagnosed in females (averaging 5,865 per year). The overall
age-adjusted incidence rates of MDS by gender are 6.3 per
100,000 in males and 3.4 per 100,000 in females.
Race and Ethnicity. White males have the highest age-
adjusted incidence rates (6.6 per 100,000 population), while
the lowest occur among Asian and Pacific Islander females
(2.5 per 100,000 population).
Myelodysplastic Syndromes
Age. The age-adjusted incidence rate for MDS is highest for
males ages 80 years and older (85.1 per 100,000) and lowest
for both males and females younger than 40 years (0.1 per
100,000).
Signs and Symptoms
Most often, people diagnosed with MDS first seek medical
attention because they are experiencing fatigue and shortness
of breath (from anemia). Some individuals have no symptoms,
and a diagnosis of MDS is made as a result of a periodic
physical examination and testing.
Possible Causes
Most people with MDS have “primary MDS,” for which there is
usually no clear-cut triggering event. A possible cause of MDS
is repeated exposure to the chemical benzene. Automobile
exhaust and industrial emissions account for about 20 percent
of the total national exposure to benzene. About half of the
benzene exposure in the US population results from smoking
tobacco or from exposure to tobacco smoke. The average
smoker is exposed to about 10 times the daily intake of
benzene compared to nonsmokers. Secondary MDS is
caused by previous cancer treatments, such as chemotherapy
or radiation.

Facts 2018-2019 I 17
Treatment
The goal of therapy for a person with lower-risk MDS is to
manage the disease by reducing transfusion needs and infection
risk. Currently, the only potentially curative therapy is high-dose
chemotherapy with allogeneic stem cell transplantation. This may
be a practical option for certain younger people with higher-
risk MDS (individuals whose life expectancy without successful
treatment warrants the risk associated with transplantation).
Other general approaches to treatment (either used alone or
in combination) include a watch-and-wait strategy; transfusion;
administration of blood cell growth factors; drug therapy with
newer agents; or chemotherapy used to treat AML.
Survival
Because the SEER program only recently began maintaining
statistics for MDS, survival statistics were not reported in 2019
at the time of this publication.
Deaths
Because the SEER program only recently began maintaining
statistics for MDS, mortality statistics were not reported in 2019
at the time of this publication.
Myeloproliferative Neoplasms
Myeloproliferative neoplasms (MPNs) make up a group of
blood cancers characterized by the overproduction of one or
more types of blood cells—red blood cells, white blood cells
and/or platelets. MPNs usually develop slowly over time, and
different MPNs affect different blood cells.
There are several types of MPNs. The following three classic
types are traditionally grouped together because of their
overlapping features:
• Essential thrombocythemia (ET), which accounted for 43.7
percent of MPNs from 2011 to 2015
• Polycythemia vera (PV), which accounted for 42.0 percent of
MPNs from 2011 to 2015
• Myelofibrosis (MF), which accounted for 12.9 percent of
MPNs from 2011 to 2015.
Prevalence
The SEER program only recently began maintaining statistics
for MPNs. Prevalence statistics were not reported by SEER for
MPNs in 2019 at the time of this publication.
New Cases
For the 5-year period from 2011 to 2015, there were 48,296
new cases of MPNs throughout the US, averaging 9,659 cases
per year.
Incidence
The overall age-adjusted incidence rate of MPNs is 2.7 cases
per 100,000 population (see Table 14).
Gender. In the United States (US), for the 5-year period from
2011 to 2015, 23,839 MPN cases were diagnosed in males
(averaging 4,768 per year) and 24,457 MPN cases were
diagnosed in females (averaging 4,891 per year). The overall
age-adjusted incidence rates of MPNs by gender are 2.9 per
100,000 in males and 2.6 per 100,000 in females.
Race and Ethnicity. White males have the highest age-
adjusted incidence rates of MPNs (3.0 per 100,000 population),
while the lowest occur among American Indian and Alaska
Native females (1.4 per 100,000 population) and Hispanic
females (1.5 per 100,000 population).
Age. The age-adjusted incidence rate for MPNs is highest for
males ages 80 years and older (17.5 per 100,000) and lowest for
both males and females younger than 40 years (0.4 per 100,000).
Myeloproliferative Neoplasms Age-Adjusted Incidence Rates, per 100,000 Population, 2011-2015
All Races
Black
By Race Rate
White
Asian/Pacific Islander
2.7
2.8
2.5
1.8
Table 14. Source: SEER (Surveillance, Epidemiology, and End Results) Cancer Statistics Review, 1975-2015. National Cancer Institute; 2018.
* Incidence data for American Indians/Alaska Natives are based on the CHSDA (Contract Health Service Delivery Area) counties.
* *Hispanics are not mutually exclusive from whites, blacks, Asian/Pacific Islanders, and American Indians/Alaska Natives. Incidence data for Hispanics are based on NAACCR Hispanic Identification Algorithm (NHIA), and exclude cases from the Alaska Native Registry.
American Indian/Alaska Native* 1.6
Hispanic** 1.6
Ages <40
Ages 50-59
By Age Rate
Ages 40-49
Ages 60-69
0.4
1.9
3.5
7.4
Ages 70-79 12.6
Ages 80+ 16.2

18 I 800.955.4572 • www.LLS.org
Signs and Symptoms
Many people with MPNs experience few or no signs or
symptoms for extended periods of time with proper monitoring
and treatment. Each type of MPN may show different signs
and symptoms.
ET is often detected during a routine blood test before
an individual has any signs or symptoms. One of the first
indications of ET may be the development of a blood clot
(thrombus). In a small subset of patients, ET may cause
bleeding in individuals with an extremely high platelet count.
PV develops slowly, and it may not cause signs or symptoms
for many years. The condition is often diagnosed during a
routine blood test, before severe symptoms occur.
MF usually develops slowly. Often, MF does not cause early
signs or symptoms and it may be found during a routine blood
test. However, as disruption of normal blood cell production
increases, people may experience symptoms such as fatigue,
weakness, shortness of breath or pale skin.
Possible Causes
MPNs are considered “clonal disorders.” Clonal disorders
begin with one or more changes to the DNA of a single stem
cell in the bone marrow.
In most cases, the cause of the change to the stem cell is
unknown. Mutations may be caused by environmental factors
or by an error during cell division. While family clusters of
ET, PV and MF have been reported, these are generally not
inherited diseases. They arise from gene mutations that occur
during a person’s lifetime.
Researchers believe that proteins known as “Janus kinases”
(JAKs) are involved. JAKs send signals that affect the
production of blood cells in the bone marrow. These proteins
help control the numbers of red blood cells, white blood cells
and platelets. When JAKs send too many signals, they cause
the bone marrow to make too many blood cells. This chain
of events is referred to as “overactive JAK signaling.” JAK
signaling may become overactive in many ways. One way is
a mutation of the JAK2 gene.
Approximately 95 percent of PV patients have a mutation of
the JAK2 gene. Mutations in genes of hematopoietic stem
cells are thought to be responsible for the overactive JAK
signaling that causes MF. The mutations may be in the genes
that make JAKs, or the mutations may be in genes that affect
how JAKs work. Most patients with MF have either a mutation
of the JAK2, MPL or CALR gene.
Most cases of ET are associated with one or more acquired
genetic mutations to a hematopoietic stem cell that results in
the overproduction of megakaryocytes, the precursor cells
of platelets in the bone marrow. Most patients with ET have a
mutation of the JAK2, MPL or CALR gene.
Treatment
Treatment for MPNs can vary based on specific diagnosis.
Patients have symptoms and circumstances that require
different treatments. There is no single treatment that is
effective for all patients. Treatment for patients may include
low-dose aspirin, therapeutic phlebotomy, drug therapy or
allogeneic stem cell transplantation. The doctor will monitor
the patient closely through regular examinations, watching for
any signs of disease progression. All patients, however, need
to be closely monitored.
Survival
Because the SEER program only recently began maintaining
statistics for MPNs, survival statistics were not reported in
2019 at the time of this publication.
Deaths
Because the SEER program only recently began maintaining
statistics for MPNs, mortality statistics were not reported in
2019 at the time of this publication.

Facts 2018-2019 I 19
Leukemia, Lymphoma, Myeloma, Myelodysplastic Syndromes and Myeloproliferative Neoplasms
Tables 15, 16 and 17 show incidence rates for leukemia, non-Hodgkin lymphoma, Hodgkin lymphoma, myeloma, myelodysplastic
syndromes and myeloproliferative neoplasms using data figures from 2011 to 2015 (the most recent data available). Rates are per
100,000 population and are age-adjusted to the 2000 US standard population.
Incidence Rates
Age-Adjusted Incidence Rates, by Gender, All Races, per 100,000 Population, 2011-2015
Leukemia
Hodgkin Lymphoma
Type Female
Non-Hodgkin Lymphoma
Myeloma
10.8
Table 15. Source: SEER (Surveillance, Epidemiology, and End Results) Cancer Statistics Review, 1975-2015, National Cancer Institute; 2018.
Total Male
Myelodysplastic Syndromes
Myeloproliferative Neoplasms
15.9
2.2
5.3
3.4
2.6
17.6
23.6
2.9
8.4
6.3
2.9
13.8
19.4
2.5
6.7
4.6
2.7
Age-Adjusted Incidence Rates, by Gender, for Blacks, per 100,000 Population, 2011-2015
Leukemia
Hodgkin Lymphoma
Type Female
Non-Hodgkin Lymphoma
Myeloma
9.0
Table 16. Source: SEER (Surveillance, Epidemiology, and End Results) Cancer Statistics Review, 1975-2015, National Cancer Institute; 2018.
Total Male
Myelodysplastic Syndromes
Myeloproliferative Neoplasms
12.1
2.2
11.6
3.2
2.4
14.0
17.5
3.1
15.9
5.0
2.7
11.0
14.4
2.6
13.4
3.9
2.5
Age-Adjusted Incidence Rates, by Gender, for Whites, per 100,000 Population, 2011-2015
Leukemia
Hodgkin Lymphoma
Type Female
Non-Hodgkin Lymphoma
Myeloma
11.4
Table 17. Source: SEER (Surveillance, Epidemiology, and End Results) Cancer Statistics Review, 1975-2015, National Cancer Institute; 2018.
Total Male
Myelodysplastic Syndromes
Myeloproliferative Neoplasms
16.8
2.4
4.7
3.5
2.6
18.6
24.7
3.0
7.9
6.6
3.0
14.6
20.3
2.7
6.1
4.8
2.8

20 I 800.955.4572 • www.LLS.org
Estimated New Cases of Blood Cancers, by State, 2019
State LeukemiaNon-Hodgkin Lymphoma
Myeloma Hodgkin Lymphoma
Alabama 840 990 480 110Alaska 90 130 * *Arizona 1,110 1,420 570 140Arkansas 560 640 290 70California 6,030 8,230 3,060 850Colorado 810 1,130 470 140Connecticut 670 950 380 110Delaware 210 240 120 *Dist. of Columbia 80 120 80 *Florida 4,980 5,420 2,510 510Georgia 1,800 2,030 1,180 240Hawaii 200 280 110 *Idaho 340 380 150 *Illinois 2,380 2,890 1,240 330Indiana 1,230 1,550 620 170Iowa 730 830 330 80Kansas 590 650 300 70Kentucky 940 1,050 420 110Louisiana 830 1,060 510 120Maine 310 400 150 *Maryland 960 1,280 640 160Massachusetts 1,140 1,720 700 210Michigan 1,930 2,530 1,040 260Minnesota 1,360 1,360 630 150Mississippi 520 570 340 70Missouri 1,240 1,430 640 150Montana 240 260 110 *Nebraska 420 460 190 50Nevada 530 600 240 60New Hampshire 260 370 130 *New Jersey 2,070 2,330 990 260New Mexico 360 400 170 *New York 4,540 5,030 2,250 580North Carolina 1,960 2,220 1,200 240North Dakota 170 180 70 *Ohio 2,100 2,850 1,160 310Oklahoma 780 850 360 90Oregon 670 1,010 350 100
Pennsylvania 3,040 3,430 1,370 390
Rhode Island 190 270 100 *South Carolina 1,040 1,100 680 120South Dakota 200 210 90 *Tennessee 1,280 1,550 670 160Texas 4,820 5,430 2,420 660Utah 480 550 210 70Vermont 130 170 60 *Virginia 1,400 1,760 810 210Washington 1,370 1,800 620 190West Virginia 410 470 200 50Wisconsin 1,320 1,480 580 160Wyoming 110 130 50 *
United States 61,780 74,200 32,110 8,110
Table 18. *Estimate is fewer than 50 cases Estimates are rounded to the nearest 10. State estimates may not sum to US total due to rounding and exclusion of state. Source: American Cancer Society. (Note: The projected numbers of new cancer cases and deaths in 2019 should not be compared with previous years to track cancer trends because they are model-based and vary from year to year for reasons other than changes in cancer occurrence. Age-standardized incidence and death rates should be used to measure cancer trends.)
Estimated New Cases and Estimated Deaths, by State
Estimated Deaths from Blood Cancers, by State, 2019
State LeukemiaNon-Hodgkin Lymphoma
Myeloma Hodgkin Lymphoma
Alabama 380 290 210 *Alaska * * * *Arizona 510 410 260 *Arkansas 240 200 130 *California 2,400 2,110 1,320 130Colorado 330 250 190 *Connecticut 270 230 140 *Delaware 80 80 60 *Dist. of Columbia * * * *Florida 1,740 1,500 970 70Georgia 590 530 420 *Hawaii 80 90 60 *Idaho 110 120 70 *Illinois 900 770 480 *Indiana 510 460 280 *Iowa 240 240 140 *Kansas 240 190 130 *Kentucky 370 320 180 *Louisiana 320 290 190 *Maine 110 110 60 *Maryland 390 340 300 *Massachusetts 480 380 270 *Michigan 770 740 460 *Minnesota 420 380 230 *Mississippi 210 170 140 *Missouri 480 370 260 *Montana 80 70 * *Nebraska 150 120 80 *Nevada 200 160 100 *New Hampshire 100 110 50 *New Jersey 590 570 350 *New Mexico 130 120 70 *New York 1,370 1,210 770 60North Carolina 720 610 480 *North Dakota 50 50 * *Ohio 920 860 530 *Oklahoma 340 270 160 *Oregon 300 280 170 *
Pennsylvania 1,080 960 590 *
Rhode Island 80 70 * *South Carolina 380 320 270 *South Dakota 70 60 * *Tennessee 520 470 310 *Texas 1,580 1,350 850 80Utah 160 130 90 *Vermont 50 50 * *Virginia 520 490 340 *Washington 480 450 260 *West Virginia 190 150 90 *Wisconsin 490 400 200 *Wyoming 50 * * *
United States 22,840 19,970 12,960 1,000
Table 19. *Estimate is fewer than 50 deaths Estimates are rounded to the nearest 10. State estimates may not sum to US total due to rounding and exclusion of state. Source: American Cancer Society. (Note: The projected numbers of new cancer cases and deaths in 2019 should not be compared with previous years to track cancer trends because they are model-based and vary from year to year for reasons other than changes in cancer occurrence. Age-standardized incidence and death rates should be used to measure cancer trends.)
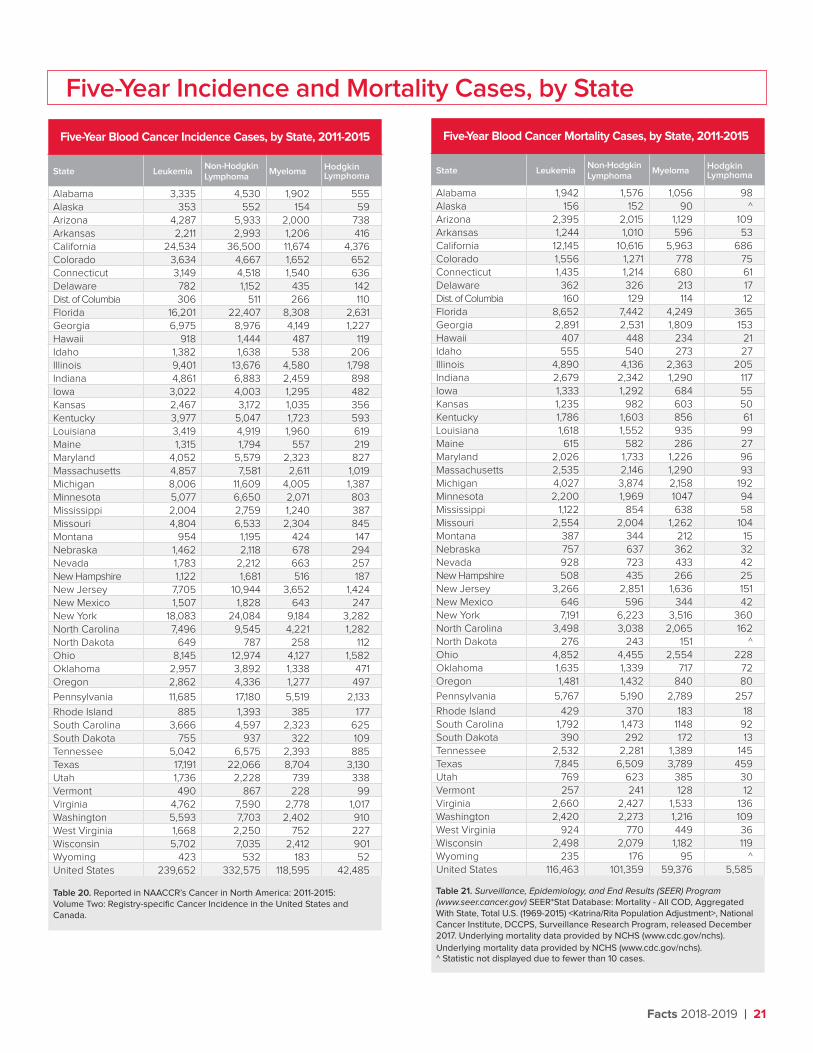
Facts 2018-2019 I 21
Five-Year Blood Cancer Incidence Cases, by State, 2011-2015
State LeukemiaNon-Hodgkin Lymphoma
Myeloma Hodgkin Lymphoma
Alabama 3,335 4,530 1,902 555Alaska 353 552 154 59Arizona 4,287 5,933 2,000 738Arkansas 2,211 2,993 1,206 416California 24,534 36,500 11,674 4,376Colorado 3,634 4,667 1,652 652Connecticut 3,149 4,518 1,540 636Delaware 782 1,152 435 142Dist. of Columbia 306 511 266 110Florida 16,201 22,407 8,308 2,631Georgia 6,975 8,976 4,149 1,227Hawaii 918 1,444 487 119Idaho 1,382 1,638 538 206Illinois 9,401 13,676 4,580 1,798Indiana 4,861 6,883 2,459 898Iowa 3,022 4,003 1,295 482Kansas 2,467 3,172 1,035 356Kentucky 3,977 5,047 1,723 593Louisiana 3,419 4,919 1,960 619Maine 1,315 1,794 557 219Maryland 4,052 5,579 2,323 827Massachusetts 4,857 7,581 2,611 1,019Michigan 8,006 11,609 4,005 1,387Minnesota 5,077 6,650 2,071 803Mississippi 2,004 2,759 1,240 387Missouri 4,804 6,533 2,304 845Montana 954 1,195 424 147Nebraska 1,462 2,118 678 294Nevada 1,783 2,212 663 257New Hampshire 1,122 1,681 516 187New Jersey 7,705 10,944 3,652 1,424New Mexico 1,507 1,828 643 247New York 18,083 24,084 9,184 3,282North Carolina 7,496 9,545 4,221 1,282North Dakota 649 787 258 112Ohio 8,145 12,974 4,127 1,582Oklahoma 2,957 3,892 1,338 471Oregon 2,862 4,336 1,277 497
Pennsylvania 11,685 17,180 5,519 2,133
Rhode Island 885 1,393 385 177South Carolina 3,666 4,597 2,323 625South Dakota 755 937 322 109Tennessee 5,042 6,575 2,393 885Texas 17,191 22,066 8,704 3,130Utah 1,736 2,228 739 338Vermont 490 867 228 99Virginia 4,762 7,590 2,778 1,017Washington 5,593 7,703 2,402 910West Virginia 1,668 2,250 752 227Wisconsin 5,702 7,035 2,412 901Wyoming 423 532 183 52United States 239,652 332,575 118,595 42,485
Table 20. Reported in NAACCR’s Cancer in North America: 2011-2015: Volume Two: Registry-specific Cancer Incidence in the United States and Canada.
Five-Year Incidence and Mortality Cases, by State
Five-Year Blood Cancer Mortality Cases, by State, 2011-2015
State LeukemiaNon-Hodgkin Lymphoma
Myeloma Hodgkin Lymphoma
Alabama 1,942 1,576 1,056 98Alaska 156 152 90 ^Arizona 2,395 2,015 1,129 109Arkansas 1,244 1,010 596 53California 12,145 10,616 5,963 686Colorado 1,556 1,271 778 75Connecticut 1,435 1,214 680 61Delaware 362 326 213 17Dist. of Columbia 160 129 114 12Florida 8,652 7,442 4,249 365Georgia 2,891 2,531 1,809 153Hawaii 407 448 234 21Idaho 555 540 273 27Illinois 4,890 4,136 2,363 205Indiana 2,679 2,342 1,290 117Iowa 1,333 1,292 684 55Kansas 1,235 982 603 50Kentucky 1,786 1,603 856 61Louisiana 1,618 1,552 935 99Maine 615 582 286 27Maryland 2,026 1,733 1,226 96Massachusetts 2,535 2,146 1,290 93Michigan 4,027 3,874 2,158 192Minnesota 2,200 1,969 1047 94Mississippi 1,122 854 638 58Missouri 2,554 2,004 1,262 104Montana 387 344 212 15Nebraska 757 637 362 32Nevada 928 723 433 42New Hampshire 508 435 266 25New Jersey 3,266 2,851 1,636 151New Mexico 646 596 344 42New York 7,191 6,223 3,516 360North Carolina 3,498 3,038 2,065 162North Dakota 276 243 151 ^Ohio 4,852 4,455 2,554 228Oklahoma 1,635 1,339 717 72Oregon 1,481 1,432 840 80
Pennsylvania 5,767 5,190 2,789 257
Rhode Island 429 370 183 18South Carolina 1,792 1,473 1148 92South Dakota 390 292 172 13Tennessee 2,532 2,281 1,389 145Texas 7,845 6,509 3,789 459Utah 769 623 385 30Vermont 257 241 128 12Virginia 2,660 2,427 1,533 136Washington 2,420 2,273 1,216 109West Virginia 924 770 449 36Wisconsin 2,498 2,079 1,182 119Wyoming 235 176 95 ^United States 116,463 101,359 59,376 5,585
Table 21. Surveillance, Epidemiology, and End Results (SEER) Program (www.seer.cancer.gov) SEER*Stat Database: Mortality - All COD, Aggregated With State, Total U.S. (1969-2015) <Katrina/Rita Population Adjustment>, National Cancer Institute, DCCPS, Surveillance Research Program, released December 2017. Underlying mortality data provided by NCHS (www.cdc.gov/nchs).
Underlying mortality data provided by NCHS (www.cdc.gov/nchs). ^ Statistic not displayed due to fewer than 10 cases.

22 I 800.955.4572 • www.LLS.org
Five-Year Leukemia Incidence Cases, by State, 2011-2015
State LeukemiaAcute Lymphoblastic Leukemia
Chronic Lymphocytic Leukemia
Acute Myeloid Leukemia
Chronic Myeloid Leukemia
Alabama 3,335 302 1,096 1,061 404Alaska 353 44 94 113 47Arizona 4,287 569 1,114 1,468 523Arkansas 2,211 198 795 688 276California 24,534 3,796 7,414 7,791 2,984Colorado 3,634 375 1,238 1,049 450Connecticut 3,149 256 1,220 926 410Delaware 782 81 267 234 99Dist. of Columbia 306 38 84 91 38Florida 16,201 1,587 5,078 5,425 2,204Georgia 6,975 657 2,483 2,087 969Hawaii 918 114 216 352 132Idaho 1,382 143 560 337 195Illinois 9,401 1,038 2,853 3,215 1,204Indiana 4,861 491 1,519 1,692 675Iowa 3,022 241 1,206 893 382Kansas 2,467 225 953 700 337Kentucky 3,977 311 1,495 1,202 584Louisiana 3,419 321 1,207 1,023 516Maine 1,315 107 548 374 162Maryland 4,052 405 1,332 1,328 489Massachusetts 4,857 495 1,613 1,551 604Michigan 8,006 758 2,824 2,542 1,091Minnesota 5,077 427 2,051 1,367 663Mississippi 2,004 211 666 631 287Missouri 4,804 407 1,584 1,519 613Montana 954 63 438 241 122Nebraska 1,462 149 501 468 192Nevada 1,783 203 601 533 191New Hampshire 1,122 86 437 313 137New Jersey 7,705 714 2,971 2,182 925New Mexico 1,507 176 565 409 198New York 18,083 1,556 7,338 4,993 2,314North Carolina 7,496 739 2,715 2,177 1,066North Dakota 649 50 285 176 83Ohio 8,145 849 2,442 2,689 1,017Oklahoma 2,957 297 1,017 896 371Oregon 2,862 307 1,025 939 293
Pennsylvania 11,685 1,019 4,235 3,696 1,496
Rhode Island 885 56 341 249 112South Carolina 3,666 350 1,272 1,136 500South Dakota 755 62 281 225 111Tennessee 5,042 494 1,861 1,516 625Texas 17,191 2,403 5,525 4,454 2,397Utah 1,736 241 609 484 214Vermont 490 49 178 163 60Virginia 4,762 516 1,407 1,609 604Washington 5,593 578 2,191 1,616 692West Virginia 1,668 120 609 515 233Wisconsin 5,702 428 2,278 1,551 863Wyoming 423 45 151 124 55United States 239,652 25,147 82,783 73,013 31,209
Table 22. Reported in NAACCR’s Cancer in North America: 2011-2015, Volume Two: Registry-specific Cancer Incidence in the United States and Canada.
Five-Year Leukemia Incidence and Mortality Cases, by State
Five-Year Leukemia Mortality Cases, by State, 2011-2015
State LeukemiaAcute Lymphoblastic Leukemia
Chronic Lymphocytic Leukemia
Acute Myeloid Leukemia
Chronic Myeloid Leukemia
Alabama 1,942 96 313 713 78Alaska 156 ^ 24 76 ^Arizona 2,395 203 452 976 116Arkansas 1,244 50 208 457 56California 12,145 1,193 2,163 5,283 583Colorado 1,556 113 319 666 74Connecticut 1,435 73 295 613 76Delaware 362 16 75 161 17Dist. of Columbia 160 15 31 63 10Florida 8,652 535 1,573 3,507 437Georgia 2,891 182 469 1064 133Hawaii 407 18 41 199 20Idaho 555 37 120 234 27Illinois 4,890 255 939 1,953 190Indiana 2,679 131 531 1,206 122Iowa 1,333 80 317 591 64Kansas 1,235 57 280 492 63Kentucky 1,786 104 374 739 74Louisiana 1,618 81 251 558 87Maine 615 20 136 273 28Maryland 2,026 86 373 794 101Massachusetts 2,535 144 540 1,074 91Michigan 4,027 220 840 1,662 178Minnesota 2,200 116 519 1015 89Mississippi 1,122 61 180 351 42Missouri 2,554 138 536 1,099 107Montana 387 22 85 152 21Nebraska 757 39 183 334 30Nevada 928 80 129 393 33New Hampshire 508 22 123 206 23New Jersey 3,266 162 609 1,310 112New Mexico 646 49 124 279 22New York 7,191 441 1,380 3,272 285North Carolina 3,498 183 738 1,520 181North Dakota 276 17 58 133 ^Ohio 4,852 250 950 2,119 232Oklahoma 1,635 101 301 617 78Oregon 1,481 85 318 670 68
Pennsylvania 5,767 293 1,191 2,310 224
Rhode Island 429 19 90 186 17South Carolina 1,792 102 310 779 94South Dakota 390 21 96 156 14Tennessee 2,532 129 525 1,059 140Texas 7,845 667 1,315 3,050 414Utah 769 56 157 291 40Vermont 257 11 60 130 10Virginia 2,660 138 535 1,073 119Washington 2,420 181 522 1,230 94West Virginia 924 33 216 350 48Wisconsin 2,498 129 517 1,098 110Wyoming 235 14 47 96 10United States 116,463 7,276 22,478 48,632 5,300
Table 23. Surveillance, Epidemiology, and End Results (SEER) Program (www.seer.cancer.gov) SEER*Stat Database: Mortality - All COD, Aggregated With State, Total U.S. (1969-2015) <Katrina/Rita Population Adjustment>, National Cancer Institute, DCCPS, Surveillance Research Program, released December 2017. Underlying mortality data provided by NCHS (www.cdc.gov/nchs).
Underlying mortality data provided by NCHS (www.cdc.gov/nchs).
^ Statistic not displayed due to fewer than 10 cases.

Facts 2018-2019 I 23
The data within Facts 2018-2019 reflect the most recent
statistics from The National Cancer Institute’s Surveillance,
Epidemiology, and End Results (SEER) Program, Cancer
Statistics Review (CSR) 1975-2014. The CSR reports cancer
incidence, mortality, survival, prevalence and lifetime risk
statistics. Incidence, prevalence and survival data were
released online by SEER, www.seer.cancer.gov, on April 15,
2018. The next SEER Cancer Statistics Review is expected to
be published online in the spring of 2019.
Incidence and mortality rates measure exactly what occurred,
and cover the entire period through the most recent year
reported, 2015. However, in order to calculate survival rates,
the most current year of data is not considered, because not
enough time has passed for it to be included.
The SEER Program’s CSR presents statistics by age, sex, race
and ethnicity. Statistics for these categories reflect a blend of
biological and cultural factors. Additionally, data reported by
race and ethnicity represent both the diversity and the mixed
heritage of the US population.
Data on Hispanic ethnicity are not shown for statistics/years
for which they are not available. The Hispanic ethnicity
categorization is not mutually exclusive with race, so in
instances where comparisons are made using ethnicity, the
groupings Hispanic whites and non-Hispanic whites are used
to enable meaningful comparisons.
Mortality data reflected in the 2018 referenced SEER report
reflect data from the National Cancer for Health Statistics
(NCHS) from 1969 to 2015, and were made available in 2018.
The SEER (18 region) data cover only about 27.8 percent of the
US population. The data can be extrapolated for the entire US
by multiplying by the population ratio, but these figures do not
take into account differences in geography, race and ethnicity
in various regions, or region-specific health risks.
Data on American Indians and Alaska Natives (AIs/ANs) should
be interpreted with care because the data reflect statistics
from Indian Health Service (IHS) Contract Health Service
Delivery Area (CHSDA) counties only. Many AIs/ANs do not
reside in such counties, and other AI/AN individuals are not
members of federally recognized tribes and cannot avail
themselves of IHS services.
Limited data on myelodysplastic syndromes (MDS) and
myeloproliferative neoplasms (MPNs) were included in the
SEER statistics as separate entities beginning in 2007.
State level incidence rates presented in Facts 2018-2019 are
provided by the North American Association of Central Cancer
Registries (NAACCR). NAACCR presents the most current
Notes and Definitions
5-year incidence rate for the US and Canada in the annual
publication, Cancer in North America.
The American Cancer Society (ACS) projected the number
of estimated cancer cases for 2019 using a model based on
incidence data from 49 states and the District of Columbia
for the years from 1995 to 2015. That incidence data met
the NAACCR’s high-quality data standard for incidence. This
method considers geographic variations in sociodemographic
and lifestyle factors, medical settings and cancer screening
behaviors as predictors of incidence, and also accounts for
expected delays in case reporting. The ACS projected the
estimated number of US cancer deaths by fitting the number
of cancer deaths from 1995 to 2016 to a statistical model that
forecasts the number of deaths expected to occur in 2019.
The estimated number of cancer deaths for each state is
calculated similarly, using state-level data. For both US and
state estimates, data on the number of deaths are obtained
from the National Center for Health Statistics (NCHS) at the
Centers for Disease Control and Prevention (CDC).
In instances where 2019 incidence count estimates are not
available from the ACS, actual national incidence counts were
obtained using the United States Cancer Statistics (USCS)
public use database, which contains cancer incidence for the
entire US for 2001 to 2015, sourced from the CDC’s National
Program for Cancer Registries (NPCR) and SEER. National
incidence counts are presented as a yearly average of the
5 most recent years of US incidence available.
Definitions
Age-adjusted rate is an incidence or death rate that has
been adjusted to reduce the bias of age in the makeup of
the populations that are being compared, thereby providing
a more reliable rate for comparison. Incidence or death
rates can be adjusted for any demographic factor or any
combination of factors, such as age (the most common),
sex and race.
Incidence is the number of newly diagnosed cases either for
a specific cancer, or for all cancers combined, during a specific
time period. When expressed as a rate, it is the number of new
cases per standard unit of population during the time period.
Incidence rates can be calculated based on a number of
factors, such as age, race or sex.
Prevalence is the estimated number of people alive on a
certain date in a population who previously had a diagnosis of
the disease. It includes new cases (incidence) and preexisting
cases, and is a function of both past incidence and survival.
Prevalence may be calculated in a number of different ways,
especially in looking at populations in which individuals
have had more than one type of cancer. In some prevalence

24 I 800.955.4572 • www.LLS.org
Executive Summarystatistics, only the first diagnosed cancer counts. Thus, if a
person is initially diagnosed with melanoma and later develops
leukemia, his or her survival with leukemia may not be counted
in leukemia prevalence statistics. Therefore, prevalence
numbers reported may vary depending upon the method
used to determine them. In this report, complete prevalence is
reported as defined by SEER as “an estimate of the number of
persons (or the proportion of population) alive on a specified
date who had been diagnosed with the given cancer, no
matter how long ago that diagnosis was.” This publication is
using the “40-year limited duration” prevalence figures, based
on the “first invasive tumor for each cancer site diagnosed
during the previous 40 years (1975-2014),” as per SEER Table
1.22. The specified date is January 1, 2015, for the prevalence
estimates. The prevalence counts in Facts 2018-2019 are
adjusted for race, sex and age.
Relative survival rate is an estimate of the percentage of
patients who would be expected to survive the effects of
the cancer. This rate is calculated by adjusting the observed
survival rate so that the effects of causes of death other than
those related to the cancer in question are removed. The
relative survival rate is a comparison of survival to that of a
person who is free of the disease. (“Observed survival” is the
actual percentage of patients still alive at some specified time
after diagnosis of cancer. It considers deaths from all causes,
cancer or otherwise.)
Remission is when signs of a disease disappear. This usually
follows treatment. The words “complete” and “partial” are
sometimes used to further define the term “remission.” Complete
remission means that all evidence of the disease is gone. Partial
remission means that the disease is markedly improved by
treatment, but residual evidence of the disease is present.
About The Leukemia & Lymphoma Society
The Leukemia & Lymphoma Society has helped millions impacted by cancer throughout our 70-year history, funding
research to advance breakthroughs and providing lifesaving support and advocacy for patients.
• LLS has invested nearly $1.3 billion in research over our 70-year history, leading to breakthroughs in cancer treatment.
• LLS is the leading source of free blood cancer information, education and support, and helps patients navigate their
cancer treatment, access quality care and find clinical trials.
• LLS advocates for policy changes to break down the barriers that stand between patients and the care they need.
Research
Over the past 70 years, LLS has invested more than
$1.3 billion in research to advance therapies and save lives.
We provide funding across the continuum, from basic research
through clinical trials—from bench to bedside. LLS research
grants have funded many of today’s most promising advances,
including targeted therapies and immunotherapies. Our
funding supports the training of the next generation of
first-rate cancer researchers.
Our Research Grant programs support scientific studies at
academic centers throughout the world.
• The Career Development Program (CDP) provides stipends
to investigators of exceptional promise in the early stages of
their careers. CDP is stratified into two separately reviewed
programs: basic or clinical research.
• The Translational Research Program (TRP) supports
outstanding investigations likely to translate basic
biomedical discoveries into safe and effective treatments.
Awards are for an initial 3-year period. Renewals to support
clinical trials are possible for an additional 2 years.
• The Specialized Center of Research Program (SCOR)
encourages multidisciplinary academic investigations by
teams of at least three research groups, regardless of
their location.
• The New Idea Award seeks innovative approaches that can
lead to significant improvements in clinical outcomes and
changes to standards of care for blood cancer patients.
• The Screen to Lead Program (SLP) provides support for
medicinal chemistry and/or drug target screening in
blood cancers.
LLS creates partnerships with universities and biotechnology
and pharmaceutical companies to get treatments to
patients faster than ever—especially to patients with unmet
medical needs.
Our Therapy Acceleration Program® (TAP) speeds the path
of potentially better therapies into preclinical development and
clinical trials. Working with academic investigators, medical
centers, and biotechnology and pharmaceutical companies,
TAP is increasing the likelihood that breakthrough treatments
will be available to patients sooner. Three TAP programs have
led to FDA-approved therapies in 2017-2018.

Facts 2018-2019 I 25
LLS has foundation partnerships with
• The MPN Research Foundation, to fund innovative grants to
better understand and treat the range of myeloproliferative
neoplasms (MPN)
• The International Waldenström’s Macroglobulinemia (WM)
Foundation, to fund research to improve quality of life
and to better understand and treat WM and other B-cell
malignancies
• The Rising Tide Foundation for Clinical Cancer Research, to
fund novel immunotherapy and prevention research linked
to clinical trials for all blood cancers
• The Babich Family Foundation/RUNX1 Research Program, to
fund translational research seeking to control familial platelet
disorder (FPD) leading to acute myeloid leukemia (AML)
• Dana-Farber Cancer Institute (DFCI). The Blood Cancer
Research Partnership funds innovative clinical trials at DFCI
coordinated with multiple community medicine treatment
centers across the US
• Global T-Cell Lymphoma (TCL) Clinical Trials Network, an
international network of community and university centers
dedicated to accelerating scientific breakthroughs into
effective care for patients with TCL
• The Sarah Cannon Research Institute, to fund an intensive
research program in mantle cell lymphoma
• The Snowdome Foundation, to fund translational research
on blood cancer in Australia.
Visit www.LLS.org or email [email protected] for
information about LLS research grant programs.
Public Policy
LLS recognizes that finding cures is not enough; we must
make sure that patients have access to the treatments they
need to live longer, better, healthier lives. The LLS Office
of Public Policy (OPP) is dedicated to removing barriers to
care. The Office of Public Policy works directly with federal
and state legislators and regulators in Washington, DC, and
across the US, to advance public policies that ensure blood
cancer patients have access to the care that they need. OPP
works directly with the Administration, the US Congress, the
Food and Drug Administration (FDA), the National Institutes
of Health (NIH), the Centers for Medicare and Medicaid
Services, and Health and Human Services (HHS) to accelerate
approval of innovative treatments for blood cancer patients.
The work of OPP is supported through a nationwide team
of policy advocates who help drive public policies to ensure
that patients have sustainable access to quality, affordable
coordinated care.
The work of OPP helps to provide access to better
therapies, faster. LLS is a strong voice in Washington, DC, and
throughout the US, representing the healthcare and medical
research interests of patients and families to policy makers
at all levels of government. Our staff includes Federal and
State Government, Regulatory Affairs and Policy Advocate
professionals. We collaborate with our passionate and
extensive Policy Advocate Network of volunteers—many
individuals whose lives have been touched by a blood cancer.
Currently, we are working at the federal, state and community
levels to ensure that patients have affordable health insurance
coverage and to remove barriers to access.
To learn more about OPP’s work and how to get involved, visit
www.LLS.org/policy-advocacy or text SPEAK to 698-66 to join
the LLS Mobile Action Network.
Education and Support Services
LLS is the leading source of free blood cancer information,
education and support. To help ensure access to the latest
treatments and survivorship care, and improve quality of life,
staff and volunteers provide assistance and resources to
patients, caregivers and healthcare professionals nationally
and in communities through our chapters across the US
and Canada.
• Personalized disease and treatment information and
support. Our Information Specialists are master’s level
oncology professionals who provide free one-on-one
assistance to patients, families and healthcare providers.
These Specialists offer personalized guidance for coping
with a blood cancer diagnosis, current disease and
treatment information, and referral to financial and support
resources within LLS and beyond.
Information Specialists can be contacted at (800) 955-4572,
Monday through Friday, from 9 am to 9 pm Eastern Time, or
by visiting www.LLS.org/InformationSpecialists.
• Clinical Trial Support Center (CTSC). When appropriate,
patients and caregivers can work one-on-one with an
LLS Clinical Trial Nurse Navigator who will conduct a
comprehensive clinical trial search and personally assist
them throughout the entire clinical trial process. Clinical Trial
Nurse Navigators are registered nurses with expertise in
blood cancers. To speak with a CTSC nurse navigator at no
cost, call the Information Specialists or visit
www.LLS.org/CTSC.
• Assistance with financial burdens. The Leukemia &
Lymphoma Society (LLS) offers financial assistance to help
individuals with blood cancer.
Our Co-Pay Assistance Program has provided over
$500 million to date to help patients pay for co-payments
and health insurance premiums. Eligibility for this program
is based on fund availability for specific blood cancer
diagnoses and financial need criteria. A current list of funds
by blood cancer diagnosis is available at www.LLS.org/copay
or at (877) 557-2672.

26 I 800.955.4572 • www.LLS.org
The LLS Patient Aid Program provides financial assistance
to blood cancer patients in active treatment. Eligible
patients will receive a one-time $100 stipend to help offset
expenses. Visit www.LLS.org/PatientAid or call
(866) 446-7377.
Our Susan Lang Pay-it-Forward Patient Travel Assistance
Program provides financial assistance to patients diagnosed
with a blood cancer who struggle to pay for treatment-
related transportation and/or lodging costs. Qualified
patients, who meet program eligibility criteria, receive
an annual stipend to help cover these expenses. Patient
assistance is based upon available funding. Visit
www.LLS.org/travel or call (844) 565-2269.
The Urgent Need Program, established in partnership
with Moppie’s Love, helps pediatric and young adult blood
cancer patients, or adult blood cancer patients who are
enrolled in clinical trials, with acute financial need. The
program provides a $500 grant to assist with non-medical
expenses, including utilities, rent, mortgage, food, lodging,
dental care, child care, elder care and other essential
needs. Visit www.LLS.org/UrgentNeed or call
(866) 446-7377.
• Information booklets. Free disease, treatment and support
booklets in English, Spanish and several other languages
are available through our Information Specialists and LLS
chapters, and can be downloaded and ordered at
www.LLS.org/booklets.
• Education programs. LLS provides free education
programs online and in local communities for patients,
caregivers and healthcare professionals.
Programs and videos for patients and caregivers feature
experts who share the latest disease, treatment and
research updates, including information about survivorship.
These programs are available via telephone, Web and in
person. Visit www.LLS.org/programs and
www.LLS.org/EducationVideos.
LLS also offers free continuing education programs online
and in person for nurses, social workers and physicians.
Visit www.LLS.org/ProfessionalEd.
• Nutrition consultations. LLS offers free one-on-one
nutrition consultations to patients and caregivers by phone
or email with a registered dietitian who has expertise in
oncology nutrition. Visit www.LLS.org/nutrition.
• Podcasts. Our podcast series for patients and caregivers,
The Bloodline with LLS, features patients, caregivers,
advocates, doctors and other healthcare professionals
who discuss diagnosis, treatment options, quality-of-
life concerns, treatment side effects, doctor-patient
communication and other important survivorship topics.
For more information and to subscribe, visit
www.LLS.org/TheBloodline.
Our podcast series for healthcare professionals (HCPs),
Treating Blood Cancers, provides up-to-date and accurate
information on diagnosis, treatment and survivorship to
educate HCPs.
• Connection with other blood cancer survivors. LLS has
created many opportunities for peer-to-peer support.
Weekly online chats are moderated by a licensed social
worker; the chats give cancer patients and caregivers the
opportunity to reach out, share information, and provide
support to one another in a structured, online setting. For
more information, visit www.LLS.org/chat.
The Patti Robinson Kaufmann First Connection Program
gives patients and caregivers the opportunity to talk about
their experiences one-on-one with someone who has
“been through it,” and obtain valuable information about the
community resources available to support them. Visit
www.LLS.org/FirstConnection.
LLS Community is a one-stop virtual meeting place for
talking with other patients and caregivers, receiving the
latest blood cancer resources and information, and getting
personalized support from trained LLS staff. To join, visit
www.LLS.org/community.
Support groups in local communities throughout LLS
chapters provide mutual support and offer the opportunity
to discuss anxieties and concerns with others who share
the same experiences. To find out if there is a support
group near you, visit www.LLS.org/ChapterFind to contact
your chapter.
• Blood Cancer Conferences. LLS Blood Cancer
Conferences are free, in-person, educational events where
blood cancer patients, caregivers and their families can
learn more about the latest disease-specific breakthroughs,
current treatments and survivorship information from local
and national experts. Visit www.LLS.org/bcc for a list of
these upcoming regional events.
• Myeloma Link. Myeloma Link is a special program
designed to connect African American communities to
information, expert myeloma care, treatment and support,
as African Americans are at twice the risk for myeloma as
whites. This unique community-based program is currently
being implemented in select cities around the US. Visit
www.LLS.org/MyelomaLink to learn more.
Visit www.LLS.org/PatientSupport for access to up-to-date
disease, treatment and support information.
Facts 2018-2019 I 27
Citations and Acknowledgements
Citations
Cancer Facts & Figures 2019. Atlanta, GA: American Cancer
Society; 2019.
Cancer Facts & Figures for African Americans 2019-2021.
Atlanta, GA: American Cancer Society; 2019.
Copeland G, Green D, Firth R, et al, eds. Cancer in North
America: 2011-2015. Volume Two: Registry-Specific Cancer
Incidence in the United States and Canada. Springfield, IL:
North American Association of Central Cancer Registries,
Inc; June 2018. https://www.naaccr.org/wp-content/
uploads/2018/06/CINA2017.v2.incidence.pdf.
Haque R, Shi J, Chung J, et al, eds. Medication adherence,
molecular monitoring, and clinical outcomes in patients with
chronic myelogenous leukemia in a large HMO. Journal of the
American Pharmacists Association. 2017;57;303-310.
Noone, AM, Howlader N, Krapcho M, et al (eds). SEER Cancer
Statistics Review, 1975-2015, National Cancer Institute.
Bethesda, MD, https://seer.cancer.gov/csr/1975_2015/, based
on November 2017 SEER data submission, posted to the SEER
web site, April 2018.
National Program of Cancer Registries and Surveillance,
Epidemiology, and End Results SEER*Stat Database: NPCR
and SEER Incidence – U.S. Cancer Statistics 2001-2015
Public Use Research Database, United States Department
of Health and Human Services, Centers for Disease Control
and Prevention and National Cancer Institute. Released June
2018, based on the November 2017 submission. www.cdc.gov/
cancer/uscs/public-use.
Surveillance, Epidemiology, and End Results (SEER) Program
(www.seer.cancer.gov) SEER*Stat Database: Incidence - SEER
18 Regs Research Data + Hurricane Katrina Impacted Louisiana
Cases, Nov 2017 Sub (1973-2015 varying) - Linked To County
Attributes - Total U.S., 1969-2016 Counties, National Cancer
Institute, DCCPS, Surveillance Research Program, released
April 2018, based on the November 2017 submission.
Surveillance, Epidemiology, and End Results (SEER) Program
(www.seer.cancer.gov) SEER*Stat Database: Mortality- All COD,
Aggregated With State, Total U.S. (1969-2015) <Katrina/Rita
Population Adjustment>, National Cancer Institute, DCCPS,
Surveillance Research Program, released December 2017.
Underlying mortality data provided by NCHS (www.cdc.gov/nchs).
Benzene. Toxic Substances Portal. Agency for Toxic
Substances & Disease Registry. https://www.atsdr.cdc.gov/
PHS/PHS.asp?id=37&tid=14. Accessed March 24, 2019.
Zuelzer WW. Implications of long-term survival in acute stem
cell leukemia of childhood treated with composite cyclic
therapy. Blood. 1964;24:477-494.
Acknowledgements
Control and Population Sciences, National Cancer Institute,
the North American Association of Central Cancer Registries
and Rebecca Siegel, MPH, Director, Surveillance Information,
American Cancer Society, for providing statistical assistance.
Data compilation services were provided by Information
Management Services, Inc.
This publication is designed to provide information in regard to the subject matter covered. It is distributed as a public service by The Leukemia & Lymphoma Society (LLS) with the understanding that LLS is not engaged in rendering medical or other professional services.

Notes


The Leukemia & Lymphoma Society 3 International Drive, Suite 200, Rye Brook, NY 10573 914-949-5213
The mission of The Leukemia & Lymphoma Society (LLS) is to cure leukemia, lymphoma, Hodgkin’s disease and myeloma, and improve the quality of life of patients and their families. Find out more at www.LLS.org.
PS80 5M 3/19