university s florida - university of south florida
TRANSCRIPT

2011-12 Annual Accountability Report
STATE UNIVERSITY SYSTEM of FLORIDA Board of Governors
UNIVERSITY OF SOUTH FLORIDA -
TAMPA
APPROVED BY THE USF BOT, 12/13/2012
1 APPROVED BY THE USF BOT, 12/13/2012
Annual Accountability Report
2011-2012
UNIVERSITY OF SOUTH FLORIDA - TAMPA
TABLE OF CONTENTS EXECUTIVE SUMMARY DASHBOARD p. 2 KEY ACHIEVEMENTS p. 7 NARRATIVE p. 8
DATA TABLES SECTION 1. FINANCIAL RESOURCES p. 17 SECTION 2. PERSONNEL p. 21 SECTION 3. ENROLLMENT p. 22 SECTION 4. UNDERGRADUATE EDUCATION p. 25 SECTION 5. GRADUATE EDUCATION p. 35 SECTION 6. RESEARCH & ECONOMIC DEVELOPMENT p. 38
2 APPROVED BY THE USF BOT, 12/13/2012
Annual Accountability Report
2011-2012
UNIVERSITY OF SOUTH FLORIDA - TAMPA
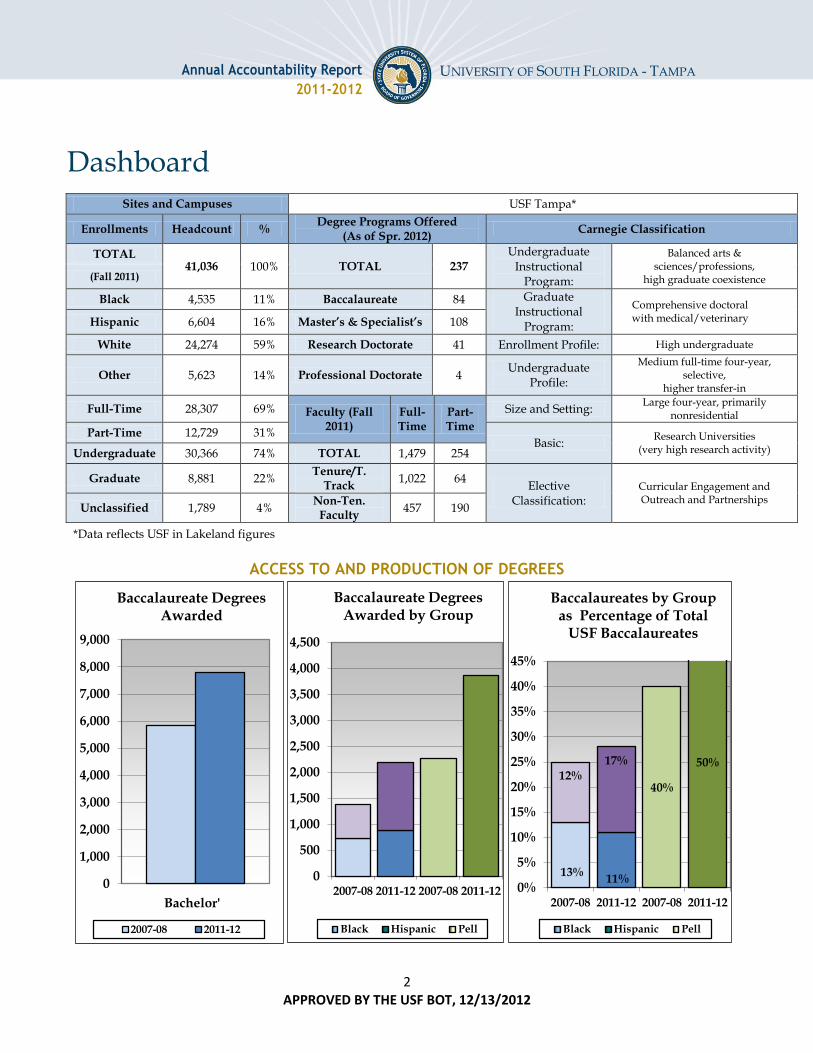
Dashboard Sites and Campuses USF Tampa*
Enrollments Headcount % Degree Programs Offered
(As of Spr. 2012) Carnegie Classification
TOTAL 41,036 100% TOTAL 237
Undergraduate Instructional
Program:
Balanced arts & sciences/professions,
high graduate coexistence (Fall 2011)
Black 4,535 11% Baccalaureate 84 Graduate Instructional
Program:
Comprehensive doctoral with medical/veterinary Hispanic 6,604 16% Master’s & Specialist’s 108
White 24,274 59% Research Doctorate 41 Enrollment Profile: High undergraduate
Other 5,623 14% Professional Doctorate 4 Undergraduate
Profile:
Medium full-time four-year, selective,
higher transfer-in
Full-Time 28,307 69% Faculty (Fall 2011)
Full-Time
Part-Time
Size and Setting: Large four-year, primarily
nonresidential
Part-Time 12,729 31% Basic:
Research Universities (very high research activity) Undergraduate 30,366 74% TOTAL 1,479 254
Graduate 8,881 22% Tenure/T.
Track 1,022 64
Elective Classification:
Curricular Engagement and Outreach and Partnerships
Unclassified 1,789 4% Non-Ten.
Faculty 457 190
*Data reflects USF in Lakeland figures
ACCESS TO AND PRODUCTION OF DEGREES
0
1,000
2,000
3,000
4,000
5,000
6,000
7,000
8,000
9,000
Baccalaureate Degrees Awarded
2007-08 2011-12
Bachelor'
0
500
1,000
1,500
2,000
2,500
3,000
3,500
4,000
4,500
2007-08 2011-12 2007-08 2011-12
Baccalaureate Degrees Awarded by Group
Black Hispanic Pell
13% 11%
40%
50% 12%
17%
0%
5%
10%
15%
20%
25%
30%
35%
40%
45%
2007-08 2011-12 2007-08 2011-12
Baccalaureates by Group as Percentage of Total
USF Baccalaureates
Black Hispanic Pell
3 APPROVED BY THE USF BOT, 12/13/2012
Annual Accountability Report
2011-2012
UNIVERSITY OF SOUTH FLORIDA - TAMPA
Dashboard
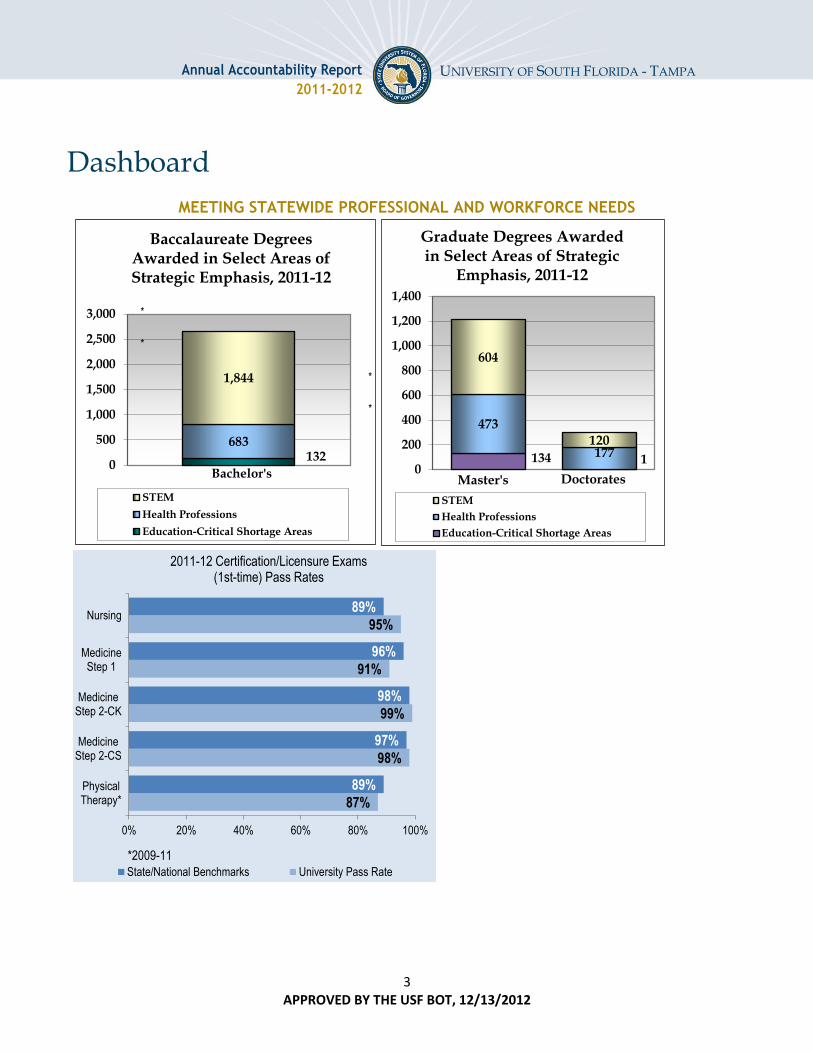
MEETING STATEWIDE PROFESSIONAL AND WORKFORCE NEEDS
132 683
1,844
0
500
1,000
1,500
2,000
2,500
3,000
Bachelor's
Baccalaureate Degrees Awarded in Select Areas of Strategic Emphasis, 2011-12
STEM
Health Professions
Education-Critical Shortage Areas
134 1
473
177
604
120
0
200
400
600
800
1,000
1,200
1,400
Graduate Degrees Awarded in Select Areas of Strategic
Emphasis, 2011-12
STEM
Health Professions
Education-Critical Shortage Areas
Master's Doctorates
87%
98%
99%
91%
95%
89%
97%
98%
96%
89%
0% 20% 40% 60% 80% 100%
PhysicalTherapy*
MedicineStep 2-CS
MedicineStep 2-CK
MedicineStep 1
Nursing
2011-12 Certification/Licensure Exams (1st-time) Pass Rates
State/National Benchmarks University Pass Rate
*2009-11
*
*
*
*
4 APPROVED BY THE USF BOT, 12/13/2012
Annual Accountability Report
2011-2012
UNIVERSITY OF SOUTH FLORIDA - TAMPA
Dashboard
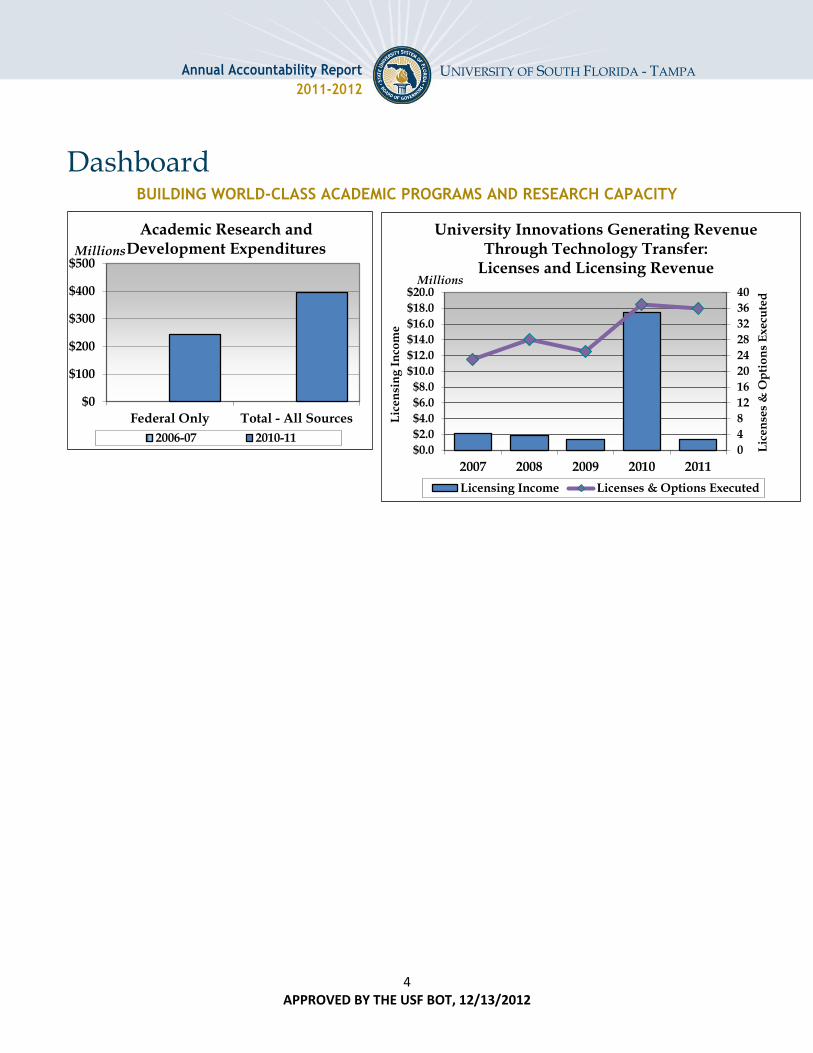
BUILDING WORLD-CLASS ACADEMIC PROGRAMS AND RESEARCH CAPACITY
$0
$100
$200
$300
$400
$500
Federal Only Total - All Sources
Millions
Academic Research and Development Expenditures
2006-07 2010-110
4
8
12
16
20
24
28
32
36
40
$0.0
$2.0
$4.0
$6.0
$8.0
$10.0
$12.0
$14.0
$16.0
$18.0
$20.0
2007 2008 2009 2010 2011
Lic
en
ses
& O
pti
on
s E
xe
cute
d
Millions
Lic
en
sin
g I
nco
me
University Innovations Generating Revenue Through Technology Transfer:
Licenses and Licensing Revenue
Licensing Income Licenses & Options Executed
5 APPROVED BY THE USF BOT, 12/13/2012
Annual Accountability Report
2011-2012
UNIVERSITY OF SOUTH FLORIDA - TAMPA
0
5
10
15
20
25
30
35
40
20007-08 2008-09 2009-10 2010-11 2011-12
Student-to-Faculty Ratio
Dashboard
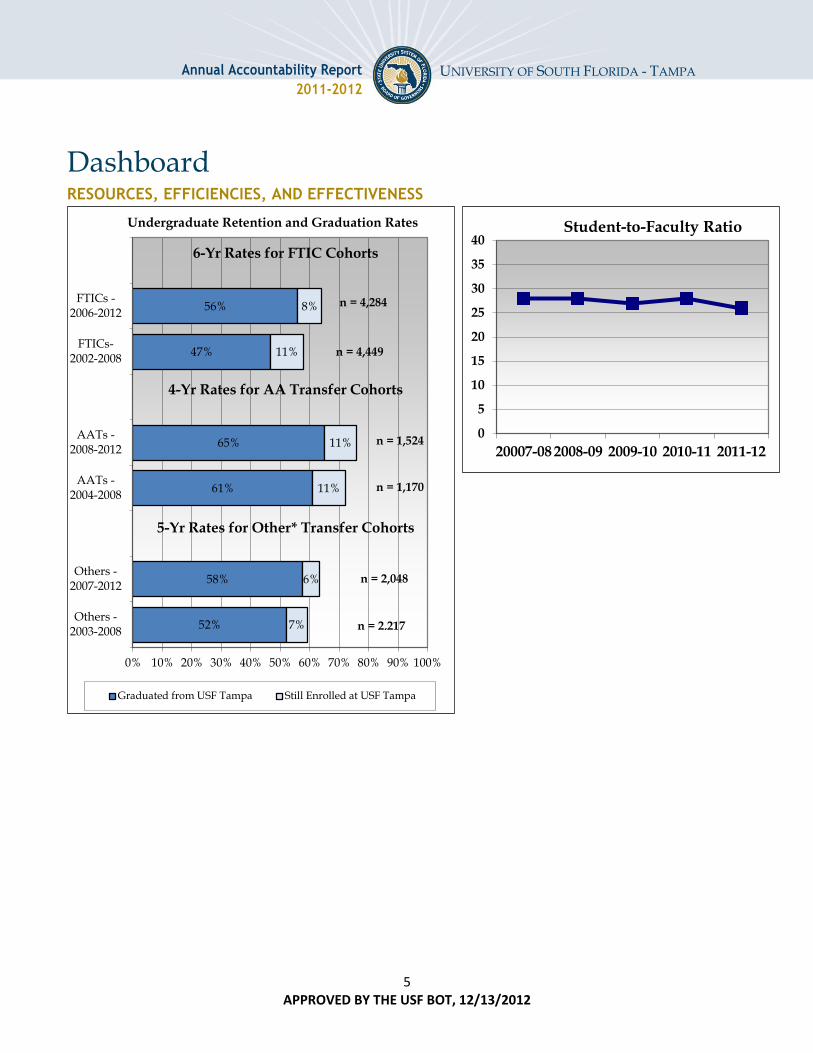
RESOURCES, EFFICIENCIES, AND EFFECTIVENESS
52%
58%
61%
65%
47%
56%
7%
6%
11%
11%
11%
8%
0% 10% 20% 30% 40% 50% 60% 70% 80% 90% 100%
Others -2003-2008
Others -2007-2012
AATs -2004-2008
AATs -2008-2012
FTICs-2002-2008
FTICs -2006-2012
Undergraduate Retention and Graduation Rates
Graduated from USF Tampa Still Enrolled at USF Tampa
6-Yr Rates for FTIC Cohorts
n = 4,284
n = 4,449
n = 1,524
n = 1,170
n = 2,048
n = 2,217
4-Yr Rates for AA Transfer Cohorts
5-Yr Rates for Other* Transfer Cohorts
6 APPROVED BY THE USF BOT, 12/13/2012
Annual Accountability Report
2011-2012
UNIVERSITY OF SOUTH FLORIDA - TAMPA
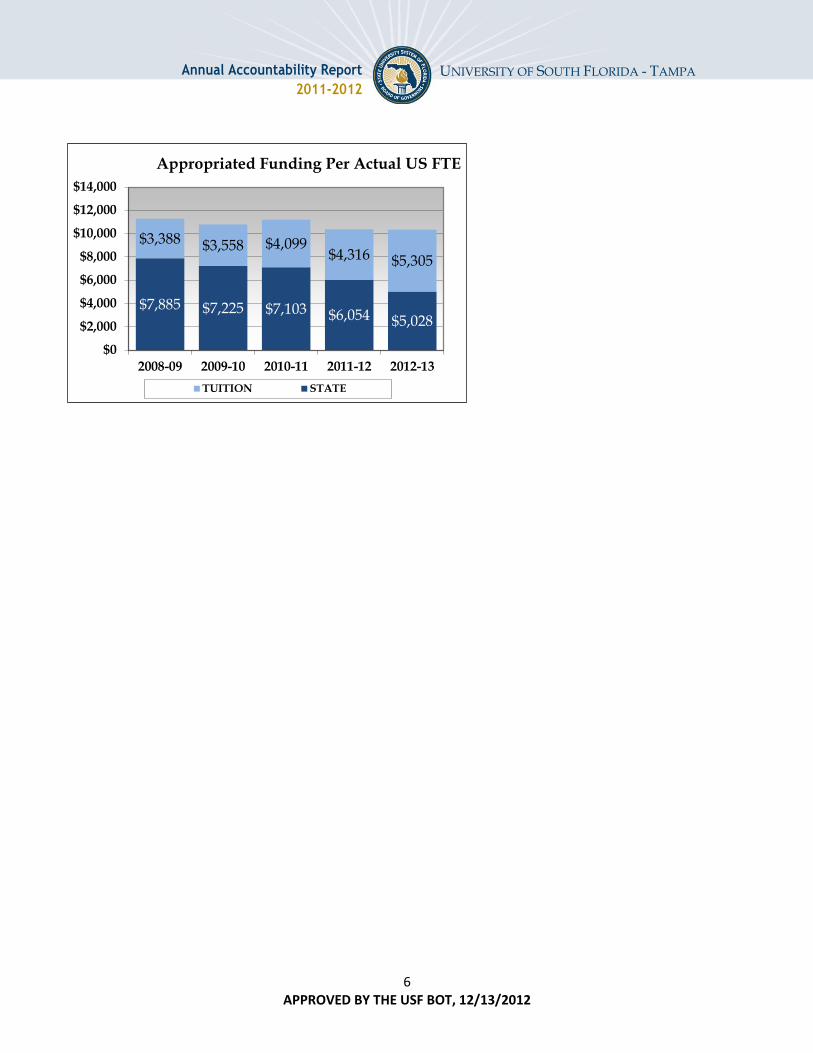
$7,885 $7,225 $7,103 $6,054 $5,028
$3,388 $3,558 $4,099 $4,316 $5,305
$0
$2,000
$4,000
$6,000
$8,000
$10,000
$12,000
$14,000
2008-09 2009-10 2010-11 2011-12 2012-13
Appropriated Funding Per Actual US FTE
TUITION STATE

7 APPROVED BY THE USF BOT, 12/13/2012
Annual Accountability Report
2011-2012
UNIVERSITY OF SOUTH FLORIDA - TAMPA
Key Achievements Selected Accomplishments for ABC University (July 2011 – June 2012) Limit to one page.
STUDENT AWARDS/ACHIEVEMENTS 1. Forty-eight students earned nationally prestigious awards, including one Udall Scholarship, the
only one in Florida, nine Fulbright scholarships, one Goldwater, and 17 Gilman scholarships 2. The graduation rate (six year) improved by four percentage points (from 52% to 56%) and for the
Honor’s Program the graduation rate stands at 73% 3. USF ranks 4th in the BIG East for student athletes with 163 students earning the all-academic
teams honor for sports in which USF participates, an increase of nearly 9%
FACULTY AWARDS/ACHIEVEMENTS
1. Seven USF faculty received prestigious Fulbright residencies during 2011 and 2012 2. Four USF faculty newly elected as Fellows of the American Association for the Advancement of
Science bringing USF’s total to nineteen 3. Six USF faculty received prestigious faculty awards during this period, and another ranked as a
top “global water hero” by Impeller magazine
PROGRAM AWARDS/ACHIEVEMENTS 1. Nine USF graduate programs ranked in the top 50 by the U.S. News & World Report 2. USF Graduate Entrepreneurship Program ranked 9th in the nation for 2012 by The Princeton
Review and Entrepreneur magazine 3. Three USF Doctoral Programs (Criminology, Communication Sciences, and Aging Studies)
ranked in the top 10 nationally by The Chronicle of Higher Education
RESEARCH AWARDS/ACHIEVEMENTS 1. USF ranked 27th in federal research expenditures for public universities and 31st in total research
expenditures according to the National Science Foundation (USF is 50th nation-wide when including public and private institutions)
2. USF ranked 10th among all universities worldwide and among the top 300 organizations worldwide of those receiving US patents in 2011, according to the Intellectual Property Owners Association
3. USF was recognized as the nation’s fastest growing research university in federal funding in 2011 by The Chronicle of Higher Education.
INSTITUTIONAL AWARDS/ACHIEVEMENTS 1. USF is a top producer of Fulbright Scholarship recipients (faculty and students) in the US 2. USF ranked in the top 15% of all colleges, universities, and trade schools nation-wide as a
military friendly school as named by G.I. Jobs magazine 3. USF ranked 8th in the nation for “Up-and-Coming” universities in U.S. News & World Report’s
Best Colleges for 2011 and one of the Top 100 public universities by U.S. News & World Report in 2012.
8 APPROVED BY THE USF BOT, 12/13/2012
Annual Accountability Report
2011-2012
UNIVERSITY OF SOUTH FLORIDA - TAMPA
Narrative
ACCESS TO AND PRODUCTION OF DEGREES
USF is committed to both the access and success of its students. One way to measure success is to examine the production of degrees as a culmination of student experiences, achievements, and accomplishments at the institution. In 2011-12, USF awarded 10,351 degrees (7,467 bachelors, 2,455 master’s, 12 specialist, 271 research doctoral, and 146 professional doctoral degrees), an overall increase of more than eight percent from the previous academic year.
In 2010-11 (latest available data), USF awarded more baccalaureate, master’s, and specialist degrees than all eight of its national peers. In research doctoral degrees USF compared favorably with two peers, exceeded two others, but trailed the other four. By percentage, USF’s numbers are similar to N.C. State and Rutgers. For research doctoral degrees, USF is in the middle of the group.
USF values cultural and ethnic diversity and inclusion and strives to make its educational experiences accessible to students from the broadest spectrum of socio-economic backgrounds. As an example, 42 percent of USF’s undergraduate students during the 2010-11 school year were Pell Grant recipients. That’s an increase of seven percentage points from the 2009-10 academic year.
During the 2011-12 academic year, USF’s undergraduate population was 56 percent female, 18 percent Hispanic, 12 percent Black or African American, and six percent Asian American. Diverse: Issues in Higher Education — the nation’s leading source for news, information, analysis, and commentary on issues concerning diversity in American higher education — ranks USF 28th among all U.S. colleges and universities, public or private, in granting undergraduate diplomas to minority students in all disciplines. According to the Diverse study, of all USF bachelor’s degrees awarded in 2010-11, more than 2,300 or 34 percent were earned by students identified as African American, Asian American, Hispanic or Native American, an increase of 11 percent from the previous year.
To help ensure that students continue to have the access they deserve, the university has multiple initiatives to assist them with financial challenges. As part of this commitment, USF has broadened its on-campus student employment opportunities. In late fall of 2011, 2,245 students were employed on USF’s campus, an increase of more than 18 percent from the previous year.
In June, 2012, the USF Board of Trustees approved an increase of about nine percent in the differential tuition fee used to enhance undergraduate education during the 2012-13 academic year. State law requires that the university invest at least 30 percent of this differential amount in financial aid. Understanding the financial challenges of students, and staying true to its commitment to providing access to a higher education to the broadest cross-section of students possible, USF committed 40 percent of the differential to need-based financial aid for USF students, or 10 percent more than Florida law requires. MEETING STATEWIDE PROFESSIONAL AND WORKFORCE NEEDS
USF participates in a wide range of efforts designed to ensure that its graduates are meeting the needs of Florida employers. USF programs are required to report on job placement of their graduates and efforts to communicate about the program with employers and alumni. These initiatives are completed in each individual academic program. Examples include the following:
9 APPROVED BY THE USF BOT, 12/13/2012
Annual Accountability Report
2011-2012
UNIVERSITY OF SOUTH FLORIDA - TAMPA
College of Engineering: Academic programs have advisory boards comprised largely of industry representatives. To assess the meeting of workforce needs, the program tracks the companies that hire its graduates, and surveys both employers and alumni.
College of Public Health: The College of Public Health has an external advisory board and an advisory board for the Master of Health Administration program. In addition, the dean is a regular participant in bi-monthly meetings of the West Central Florida County Health Directors.
College of Nursing: The College of Nursing participates extensively in activities that strengthen connections with employers and provide important information used to shape curriculum offerings, including:
Bimonthly Clinical Collaborative Board meetings with Chief Nursing Officers and/or Directors of Nursing Education at nine hospitals in the Tampa Bay region. This forum provides continuous dialog, evaluation, and planning.
Annual program reviews for BS, MS, DNP, and PhD programs that survey student enrollment, graduation, and employment data as well as student outcomes.
Comprehensive self-study of the CRNA and PhD programs, each conducted with two separate on-site evaluations by an external reviewer. This includes students, faculty, employers, and the employment market.
Participation in biennial Florida Colleges of Nursing deans meetings to evaluate needs, resources, and planning.
Several key partnerships to build sustainable education and practice improvements: o USF Sarasota-Manatee Health Professions Blue Print o USF-Bay Care Health partnership to improve patient outcomes by transforming research
utilization and patient outcome accountability o USF-James A. Haley Veterans Hospital (JAHVAH) VANA Partnership to educate
baccalaureate-prepared nurses, evaluate workforce needs, and VA faculty development. Measure the number of retirement eligible nurses at JAHVAH
o Lehigh Valley Health Network Partnership o Tampa General Hospital
College of Education: The College of Education partners with local school districts to conduct studies of the effectiveness of different methods of instruction and correlates of teacher effectiveness. The College’s Florida Center for Instructional Technology receives external funding to provide training and assistance to teachers in the use of innovative strategies and provides free educational online resources that garner more than two million hits per school day.
College of The Arts: Evidence suggests that graduates of the PhD in Music Education program are meeting the needs of employers. Since 2005, 100 percent of graduates were employed in the field and are able to maintain their positions (21% part-time, 79% full-time).
In addition, USF also studies trends in the state’s workforce needs. As part of this effort, USF continues to make rapid progress in the STEM field, increasing the number of baccalaureate degrees by more than 80 percent since 2004-05. In 2011-12, USF awarded more STEM baccalaureate (1,825) and health baccalaureate (683) degrees than all but one of its SUS peer institutions. In health graduate degrees awarded (650), the USF System exceeded all but one of its SUS peers.
USF’s commitment to the STEM fields can also be seen in the new Science, Math, and Research Technology (SMART) Lab in the Library. Equipped with more than 300 computer workstations, the lab is a hands-on learning space geared toward improving student performance in STEM related coursework.
10 APPROVED BY THE USF BOT, 12/13/2012
Annual Accountability Report
2011-2012
UNIVERSITY OF SOUTH FLORIDA - TAMPA
Redesigned courses taught in the SMART Lab are based on best practices promoted by the National Center for Academic Transformation and allow instructors to utilize advanced teaching technologies, peer tutors, and active learning strategies to promote student success and provide practical and applied lessons.
Also housed in the Library is the USF Career Center. The Center’s primary mission is to assist students in making the transition from academic life to professional employment. BUILDING WORLD-CLASS ACADEMIC PROGRAMS AND RESEARCH CAPACITY
USF has many top-flight academic programs. According to U.S. News & World Report’s annual compendium of America’s Best Graduate Schools, nine programs ranked nationally in the top 50 released in the 2013 rankings publication, including: Industrial and Organizational Psychology (8th); Public Health (21st); Criminology (22nd); Audiology (12th); Library & Information Sciences (29th); Rehabilitation Counseling (30th); Speech-Language Pathology (45th); Industrial/Manufacturing Engineering (42nd). The Princeton Review and Entrepreneur magazine ranked the USF Graduate Entrepreneurship Program No. 11 in the nation for 2012.
A driving factor that makes these programs world-class is the quality of the faculty. One significant measure of academic quality is the number of times faculty research publications are cited in the academic literature. Thompson’s ISI metric shows that the five-year citation impact (2003-2007) of USF is 6.14; this figure lags behind only the University of Miami in the state and exceeds that of many AAU institutions and USF peers. Additional world-class achievements of the university include its advancements in research and innovation. USF is classified by the Carnegie Foundation for the Advancement of Teaching as a Research University with Very High Research Activity, a distinction earned by only 2.3 percent of American universities. It also is ranked 110th globally on the Research Performance Index calculated by the High Impact Universities (2010) in affiliation with the University of Western Australia.
USF now ranks 50th in the nation for research expenditures among all U.S. universities, public or private, according to the National Science Foundation (NSF). Total research contracts and grants in 2011-12 exceed $411 million (this number refers to the entire USF System; however, more than 98 percent of the funding is generated by USF). USF has consistently increased its external research funding over the last
six years and now ranks 27th in federal research expenditures, and31st in total research expenditures
for public universities, according to NSF.
Federal research expenditures awarded to USF increased 252 percent between 1999 and 2010, which places USF as the nation’s 5th-fastest growing research university, as reported in The Chronicle of Higher Education’s Almanac of Higher Education (2011).
Furthermore, the efficiencies and effectiveness of USF can be measured by assessing total research expenditures per faculty member. The mean funding per faculty member at USF is $337,000 (FY 2010), the highest for all Florida research institutions, public or private.
11 APPROVED BY THE USF BOT, 12/13/2012
Annual Accountability Report
2011-2012
UNIVERSITY OF SOUTH FLORIDA - TAMPA
MEETING COMMUNITY NEEDS AND FULFILLING UNIQUE INSTITUTIONAL RESPONSIBILITIES
USF is classified by the Carnegie Foundation as an “Engaged University,” and has an $11.5 billion annual impact on the Tampa Bay region and overall Florida economy, according to a study completed by economists at the University of Florida and Florida State University on behalf of the Florida Board of Governors.
For instance, during 2011-12, USF was responsible for 77 invention disclosures received, 98 U.S. patents issued, 52 licenses/options executed, and 10 start-up companies formed. USF ranked 10th among all universities (and in the top 300 organizations) worldwide receiving US patents in 2011, according to the Intellectual Property Owners Association. USF has been engaged in the community in many ways, such as: Office of Community Engagement & Partnerships: Recognizing the incomparable strength of asset represented by its community, the university established the Office of Community Engagement & Partnerships. Seeking to expand local and global initiatives that strengthen and sustain healthy communities and improve the quality of life for all, the office carries out its mission by building mutually beneficial and reciprocal university-community partnerships founded on engaged scholarship and service-learning models. For a list and descriptions of more than 45 community partners, visit http://engagement.rc.usf.edu/?page_id=3002/. Supporting America’s Veterans: USF was selected by G.I. Jobs magazine as a “Military Friendly School” for 2011. This is the second consecutive year that USF has earned the designation placing the university in the top 15 percent of all higher education institutions nationwide.
USF currently is the only public university in the state of Florida participating in a Department of Veterans Affairs program that reduces tuition for student veterans. Called the “Yellow Ribbon” program, it is part of the Post-9/11 Veterans Education Bill that took effect in 2008.
Also of note, USF’s planned Center for Veterans Reintegration was highlighted by First Lady Michelle Obama in January 2012 as she unveiled a new initiative to meet the health care needs of veterans and those in the military.
VA Hospital Affiliation: USF is affiliated with many hospitals in the Tampa Bay area, including the Tampa VA hospital. The VA hospital develops unique and close professional relationships. It is connected both physically and functionally to the university, providing training to 196.5 USF residents and fellows for academic year 2010-11, and offering residency training in all major medical and surgical specialties and subspecialties.
Capital Construction: Despite the broader financial slowdown, capital construction continues at USF, providing a significant economic boost and jobs for the community. In the past year, the University has opened:
The Center for Advanced Medical Learning and Simulation (CAMLS) in the heart of downtown Tampa. CAMLS is expected to play a central role in assuring the long-term economic viability of the city by having an estimated $6 million annual impact. The structure, which takes up a full city block in downtown Tampa, is packed with learning tools that are not found anywhere else in the world. CAMLS is expected to draw 30,000 health professionals from around the globe each year to train in advanced surgical skills, in interdisciplinary teams, and to have their skills evaluated by the best in the field.
12 APPROVED BY THE USF BOT, 12/13/2012
Annual Accountability Report
2011-2012
UNIVERSITY OF SOUTH FLORIDA - TAMPA
The Advanced Visualization Center which functions as a resource for student research and faculty instruction. The center supports the USF community by supplying a state of the art high resolution tiled LCD video wall, with 3D capability that can display multiple images, video and web content simultaneously. The large video wall can be used for lectures, presentations and research projects that have a need to showcase advanced visual content. The center functions as a resource for student research and faculty instruction and provides valuable technical skills.
The Science, Math, and Research Technology (SMART) Lab that is equipped with more than 300 computer workstations. The hands-on learning space is geared toward improving student performance in STEM related coursework. Redesigned courses taught in the SMART Lab are based on best practices promoted by the National Center for Academic Transformation and allow instructors to utilize advanced teaching technologies, peer tutors, and active learning strategies to promote student success and provide practical and applied lessons.
A new School of Music building makes USF one of only 120 universities and conservatories world-wide to be designated as an all Steinway school.
USF’s new seven story, state-of-the-art Interdisciplinary Sciences Building houses classrooms and research labs for the physics, biology and chemistry departments.
The Office for Undergraduate Research (OUR) which serves as the university-wide office for promoting undergraduate research and is centrally located in a newly renovated office suite in the main USF Library.
USF’s Career Center’s Job Shop, located on the first floor of the Library, which provides computer workstations offering easy online access to explore, research and apply for current part-time jobs (on and off-campus), internships, Cooperative Education and full-time professional employment opportunities.
A refurbished Sun Dome that now has 30 more years of use as an academic, ceremonial, rental and athletic facility. The construction was completed with no educational money and the financing of a construction loan will be repaid through rental fees for the renovated center.
Additional expansion at the university was made possible by a $20 million private gift to USF’s newly named Morsani College of Medicine.
USF Research Park: USF’s research park is a unique hub for the growth of science and technology in the state, helping to bring innovations from the lab to market. It provides a means by which discoveries, inventions, processes, and work products of USF faculty, staff, and students can be transferred from the university laboratory to the public, boosting the economy and creating high-paying jobs in the Tampa Bay area. The Research Foundation is acting on this charge by continuing to develop its USF Research Park of Tampa Bay into a core area for biotechnology and life sciences research and entrepreneurship, including interdisciplinary laboratories, offices for corporate partners, and an expanded business incubator. PROGRESS ON PRIMARY INSTITUTIONAL GOALS AND METRICS (as outlined in University Work Plan)
USF has made great strides toward its five institutional goals listed in the 2011 Work Plan.
I. Improve Baccalaureate Retention and Graduation:
The 2006 cohort graduation rate at USF is 56 percent. This number is four percentage points higher than the previous year’s 52 percent, evidence of continued focused efforts and implementation of a wide range of strategies to improve student success.
13 APPROVED BY THE USF BOT, 12/13/2012
Annual Accountability Report
2011-2012
UNIVERSITY OF SOUTH FLORIDA - TAMPA
In addition, USF’s freshman to sophomore retention rate has remained in the high eighty percent range for the past five years. The current 87 percent retention rate is substantially higher than the 73 percent IPEDS national average for all 4-year public, degree-seeking institutions.
These achievements can be attributed to USF’s comprehensive approach to promoting student success, which focuses on preparedness, affordability, and student support services, including:
Raising academic standards for admission to improve readiness.
Improving student orientation.
Developing new programs to increase access and student choice.
Developing a financial aid leveraging model to support enrollment objectives and maintain access and affordability.
Improving teaching and learning outcomes through course redesign in high enrollment classes with low passing rates.
Expanding tutoring services.
Increasing the number of faculty and academic advisors.
Developing new student evaluation of teaching.
Promoting undergraduate research.
Implementing a state-of-the-art degree audit system to promote timely progression.
Expanding Career Center services.
II. Revenue Enhancement – Public-Private Partnerships:
USF continues to expand and diversify its resource base to maintain financial sustainability while meeting its distinctive mission. Existing partnerships include close ties with Draper Laboratory, SRI International, and the Mote Marine Research Institute. USF also is host to the Florida Institute of Oceanography (FIO), houses the Florida Center of Excellence for Biomolecular Identification and Targeted Therapeutics (FCoEBITT/ CDDI), and is an active partner in the Florida Energy Systems Consortium (FESC). USF ranks highly in invention disclosures with 91 patents for the 2011 fiscal year, an increase from 67 in the 2010 fiscal year which exceeded the 75th percentile of AAU institutions and all but one Florida research institution. This has been achieved by developing external funding, private giving, technology transfer and public-private partnerships, patents and licenses. USF champions endowment support and fosters partnerships with research and industry by sponsoring research to support external funding, patents, technology transfer, licensing revenues, and start-ups. This work helps cultivate research and development that strengthen Florida’s economy and contribute to global solutions. III. Global Initiatives:
As an engaged, global research university dedicated to excellence in education, research, service, and outreach in Florida and around the world, USF is dedicated to promoting a global culture at the university and deepening global engagement. USF World leads these efforts by providing resources that empower the university community to function as a global leader and promote global stewardship. USF World offers education abroad/exchanges, global research, international partnerships, a Confucius Institute, an Africa Initiatives Group, an Institute for the Study of Latin America & the Caribbean, a Center for India Studies, a Center for Strategic and Diplomatic Studies, and multiple global academic partners including; the University of Exeter (United Kingdom), the University of Cape Coast (Ghana) the University of Ghana, Nankai University (China), and Ocean University (China). In addition, USF is
14 APPROVED BY THE USF BOT, 12/13/2012
Annual Accountability Report
2011-2012
UNIVERSITY OF SOUTH FLORIDA - TAMPA
recognized as a top producer of U.S. Fulbright Scholars.
Led by the Patel School for Global Sustainability, and supported by the Office of Sustainability, USF has established itself as a leader in interdisciplinary educational and research collaboration. The university’s national sustainability rankings have risen this year. USF was named the nation’s 12th ranked (up from 47th in 2011) “Cool School” by Sierra magazine and awarded the 2012 Second Nature Climate Leadership Award. Given to select schools for “unparalleled campus innovation and climate leadership,” the climate leadership award is regarded as the highest accolade for sustainability efforts in higher education.
IV. Technological and Innovative Advances – Marine and Coastal Environments – Health: USF Health and the USF College of Marine Science are responsible for a large portion of the university’s overall tally of inventions and patents. Of the 91 U.S. patents issued to USF in 2011-12, 48, or 53 percent, were generated by the two colleges (31 from USF Health and 17 from the College of Marine Science). Similarly, of the 172 invention disclosures for USF during 2011-12, 80, or 47 percent, were from the two colleges (73 from USF Health and seven from the College of Marine Science).
There are many specific innovative advances in these areas. As one example, in 2012 the College of Marine Science made a high-tech breakthrough by turning a new generation of autonomous underwater vehicles into a unique marine observing and reporting system. USF launched a solar-powered, underwater robot able to analyze ocean conditions and report back via Twitter what it learns about the water’s depths to humans on land. Unlike previous generations of underwater vehicles, it is powered by solar cells instead of batteries and can be programmed to follow a specific route and dive thousands of feet below the surface to test conditions at various depths in order to monitor the ongoing effects of the 2010 Deepwater Horizon oil spill.
An additional example of innovation can be found at USF Health, where professor and diabetes researcher Dr. Jeffrey Krischer and his team have attracted more than $400 million in National Institutes of Health (NIH) research funding to the university (no other institution has received as much NIH funding for diabetes research as USF). Successes of the past year include:
An expansion of clinical services to approximately 1,500 patients – primarily children and adults with Type 1 diabetes, but also adults with Type 2 diabetes requiring intensive therapy, and pregnant women with diabetes.
The launch of the patient-based diabetes management system MyCareTeam, which allows patients or their family members to track blood sugar readings, communicate electronically with members of the diabetes care team, and receive online coaching.
The start of four clinical trials investigating therapies for children with Type 2 diabetes.
Strengthened partnerships, including work with the American Diabetes Association and the Juvenile Diabetes Research Foundation at the national and local levels, and work that builds education and research collaborations with diabetes care providers across the Tampa Bay region.
V. Community Engagement:
USF has established a unified institutional structure to facilitate and promote community engagement, social enterprise, and global collaborations in education, research, and service learning, including mechanisms for managing fiscal and human resources for student exchange, education abroad, and
15 APPROVED BY THE USF BOT, 12/13/2012
Annual Accountability Report
2011-2012
UNIVERSITY OF SOUTH FLORIDA - TAMPA
international field placement programs, as well as faculty research, teaching, outreach, and professional development opportunities. A recognition of USF’s success is its classification by the Carnegie Foundation as a Community Engaged university with “Curricular Engagement and Outreach and Partnerships.” USF also earned a place on the U.S. President’s 2012 Higher Education Community Service Honor Roll. Currently, the university is working on:
Developing an up-to-date clearinghouse of information about all engagement activities
Developing a system to measure community engagement
Encouraging faculty participation in community engagement –and including community engagement in promotion and tenure guidelines
Encouraging and rewarding student community engagement and exploring the feasibility of acknowledging community engagement in official transcripts
USF students are also doing their part to be engaged members of the community. Last year 18,230 USF students engaged in volunteer service in the community, contributing 153,169 hours to organizations, causes, and individuals in need.
ADDITIONAL INFORMATION ON QUALITY, RESOURCES, EFFICIENCIES AND EFFECTIVENESS
The University of South Florida System (based on the efficiencies report submitted to the BOG) continues to focus on initiatives that result in improvements and/or cost savings for re-investment. Some of these cost savings coincide with the university’s sustainability efforts. Ongoing and new initiatives include:
Continuation of the USF Sales Tax Savings Program and issuance of Direct Owner Purchase Orders for construction materials and equipment which generated approximately $990,000 of construction cost savings for the 2010/2011 Fiscal Year.
Continuation of resource conservation in design of major projects to reduce costs for operations and continuation of environmental conservation efforts including “gray water” usage in the Dr. Kiran C. Patel Center for Global Solutions building and condensate water recovery for a portion of the USF campus’ irrigation.
Continuation of in-house training and cross training for professional staff to enhance collective application of emerging technologies and applications in design and construction of facilities; and to provide for continuity of services and succession plan for operations.
Continuation of “in-house” services by professional staff for projects including roof inspections (estimated $100,000 savings), LEED certification, commissioning (estimated $400,000 savings), latent defect/warranty enforcement (estimated $200,000 savings), construction defects investigation, and design services; and by student interns for services including record document scanning for USF archives and graphic presentations.
Continuation of campus planning objectives for landscape and environmental enhancement through use of donated trees for a construction cost savings of $195,000.
Continuation of the negotiation of costs for design and construction services below the initial proposed amounts for services to obtain the best fair, reasonable, and competitive price for services.
Continuation of organizational structures that maximize productivity and service by consolidation of responsibilities where possible and reduce overall staff resource requirements.
Utilizing the full functionality of the enterprise business systems to improve efficiencies.
16 APPROVED BY THE USF BOT, 12/13/2012
Annual Accountability Report
2011-2012
UNIVERSITY OF SOUTH FLORIDA - TAMPA
Data Tables
FINANCIAL RESOURCES
Table 1A. Education and General Revenues
Table 1B. Education and General Expenditures
Table 1C. Funding per Student FTE
Table 1D. Other Budget Entities
Table 1E. Voluntary Support of Higher Education
PERSONNEL
Table 2A. Personnel Headcount
ENROLLMENT AND SPACE
Table 3A. Full-time Equivalent (FTE) Enrollment
Table 3B. Enrollment by Location
Table 3C. Enrollment by Method of Instruction
UNDERGRADUATE EDUCATION
Table 4A. Baccalaureate Degree Program Changes in AY 2011-2012
Table 4B. Retention Rates
Table 4C. FTIC Graduation Rates (Full-time)
Table 4D. FTIC Graduation Rates (Full- and Part-time)
Table 4E. AA Transfers Graduation Rates
Table 4F. Other Transfers Graduation Rates
Table 4G. Baccalaureate Degrees Awarded
Table 4H. Baccalaureate Degrees Awarded in Areas of Strategic Emphasis
Table 4I. Baccalaureate Degrees Awarded to Underrepresented Groups
Table 4J. Baccalaureate Degrees Without Excess Credit Hours
Table 4K. Undergraduate Course Offerings
Table 4L. Faculty Teaching Undergraduates
Table 4M. Undergraduate Instructional Faculty Compensation
Table 4N. Student/Faculty Ratio
Table 4O. Licensure/Certification Exam: Nursing (NCLEX)
Table 4P. Tuition Differential Fee
GRADUATE EDUCATION
Table 5A. Graduate Degree Program Changes in AY 2011-2012
Table 5B. Graduate Degrees Awarded
Table 5C. Graduate Degrees Awarded in Areas of Strategic Emphasis
Table 5D. Licensure/Certification Exams for Graduate Programs
RESEARCH & ECONOMIC DEVELOPMENT
Table 6A. Research and Development Expenditures
Table 6B. Centers of Excellence
Table 6C. State University Research Commercialization Assistance Grants
Table 6D. 21st Century World Class Scholars Program
17 APPROVED BY THE USF BOT, 12/13/2012
Annual Accountability Report
2011-2012
UNIVERSITY OF SOUTH FLORIDA - TAMPA
Section 1 – Financial Resources
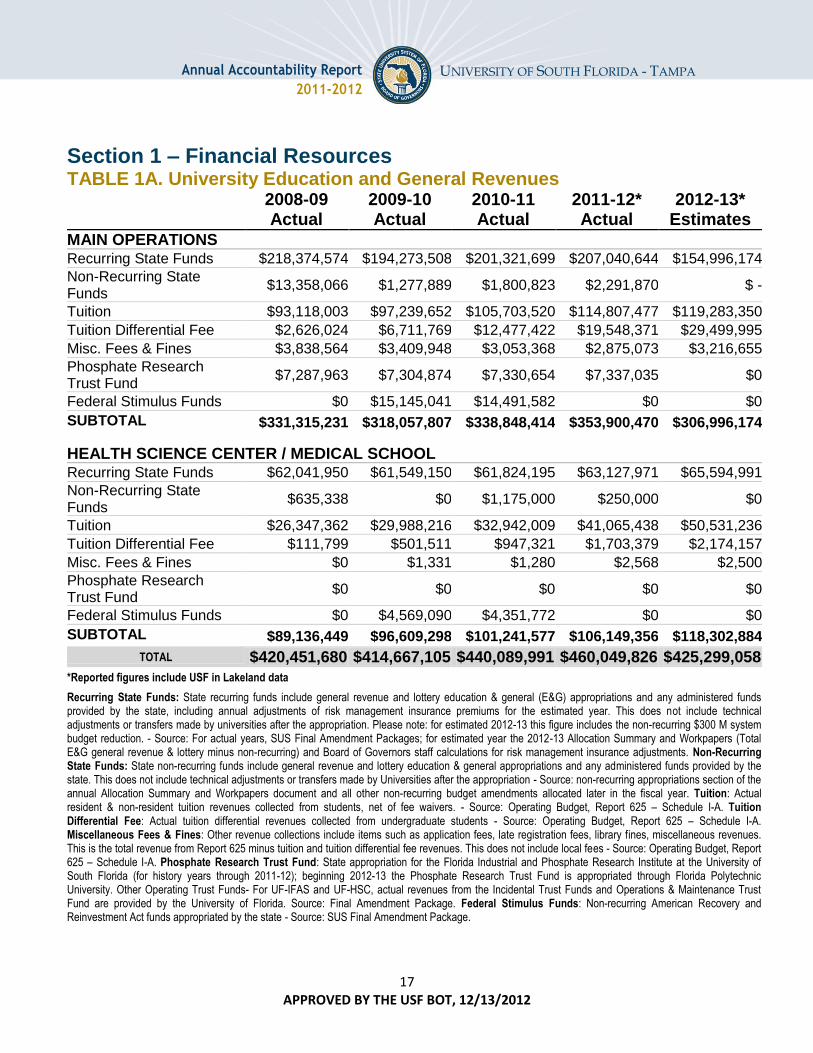
TABLE 1A. University Education and General Revenues
2008-09 Actual
2009-10 Actual
2010-11 Actual
2011-12* Actual
2012-13* Estimates
MAIN OPERATIONS Recurring State Funds $218,374,574 $194,273,508 $201,321,699 $207,040,644 $154,996,174
Non-Recurring State Funds
$13,358,066 $1,277,889 $1,800,823 $2,291,870 $ -
Tuition $93,118,003 $97,239,652 $105,703,520 $114,807,477 $119,283,350
Tuition Differential Fee $2,626,024 $6,711,769 $12,477,422 $19,548,371 $29,499,995
Misc. Fees & Fines $3,838,564 $3,409,948 $3,053,368 $2,875,073 $3,216,655
Phosphate Research Trust Fund
$7,287,963 $7,304,874 $7,330,654 $7,337,035 $0
Federal Stimulus Funds $0 $15,145,041 $14,491,582 $0 $0
SUBTOTAL $331,315,231 $318,057,807 $338,848,414 $353,900,470 $306,996,174
HEALTH SCIENCE CENTER / MEDICAL SCHOOL Recurring State Funds $62,041,950 $61,549,150 $61,824,195 $63,127,971 $65,594,991
Non-Recurring State Funds
$635,338 $0 $1,175,000 $250,000 $0
Tuition $26,347,362 $29,988,216 $32,942,009 $41,065,438 $50,531,236
Tuition Differential Fee $111,799 $501,511 $947,321 $1,703,379 $2,174,157
Misc. Fees & Fines $0 $1,331 $1,280 $2,568 $2,500
Phosphate Research Trust Fund
$0 $0 $0 $0 $0
Federal Stimulus Funds $0 $4,569,090 $4,351,772 $0 $0
SUBTOTAL $89,136,449 $96,609,298 $101,241,577 $106,149,356 $118,302,884
TOTAL $420,451,680 $414,667,105 $440,089,991 $460,049,826 $425,299,058
*Reported figures include USF in Lakeland data
Recurring State Funds: State recurring funds include general revenue and lottery education & general (E&G) appropriations and any administered funds provided by the state, including annual adjustments of risk management insurance premiums for the estimated year. This does not include technical adjustments or transfers made by universities after the appropriation. Please note: for estimated 2012-13 this figure includes the non-recurring $300 M system budget reduction. - Source: For actual years, SUS Final Amendment Packages; for estimated year the 2012-13 Allocation Summary and Workpapers (Total E&G general revenue & lottery minus non-recurring) and Board of Governors staff calculations for risk management insurance adjustments. Non-Recurring State Funds: State non-recurring funds include general revenue and lottery education & general appropriations and any administered funds provided by the state. This does not include technical adjustments or transfers made by Universities after the appropriation - Source: non-recurring appropriations section of the annual Allocation Summary and Workpapers document and all other non-recurring budget amendments allocated later in the fiscal year. Tuition: Actual resident & non-resident tuition revenues collected from students, net of fee waivers. - Source: Operating Budget, Report 625 – Schedule I-A. Tuition Differential Fee: Actual tuition differential revenues collected from undergraduate students - Source: Operating Budget, Report 625 – Schedule I-A. Miscellaneous Fees & Fines: Other revenue collections include items such as application fees, late registration fees, library fines, miscellaneous revenues. This is the total revenue from Report 625 minus tuition and tuition differential fee revenues. This does not include local fees - Source: Operating Budget, Report 625 – Schedule I-A. Phosphate Research Trust Fund: State appropriation for the Florida Industrial and Phosphate Research Institute at the University of South Florida (for history years through 2011-12); beginning 2012-13 the Phosphate Research Trust Fund is appropriated through Florida Polytechnic University. Other Operating Trust Funds- For UF-IFAS and UF-HSC, actual revenues from the Incidental Trust Funds and Operations & Maintenance Trust Fund are provided by the University of Florida. Source: Final Amendment Package. Federal Stimulus Funds: Non-recurring American Recovery and Reinvestment Act funds appropriated by the state - Source: SUS Final Amendment Package.
18 APPROVED BY THE USF BOT, 12/13/2012
Annual Accountability Report
2011-2012
UNIVERSITY OF SOUTH FLORIDA - TAMPA
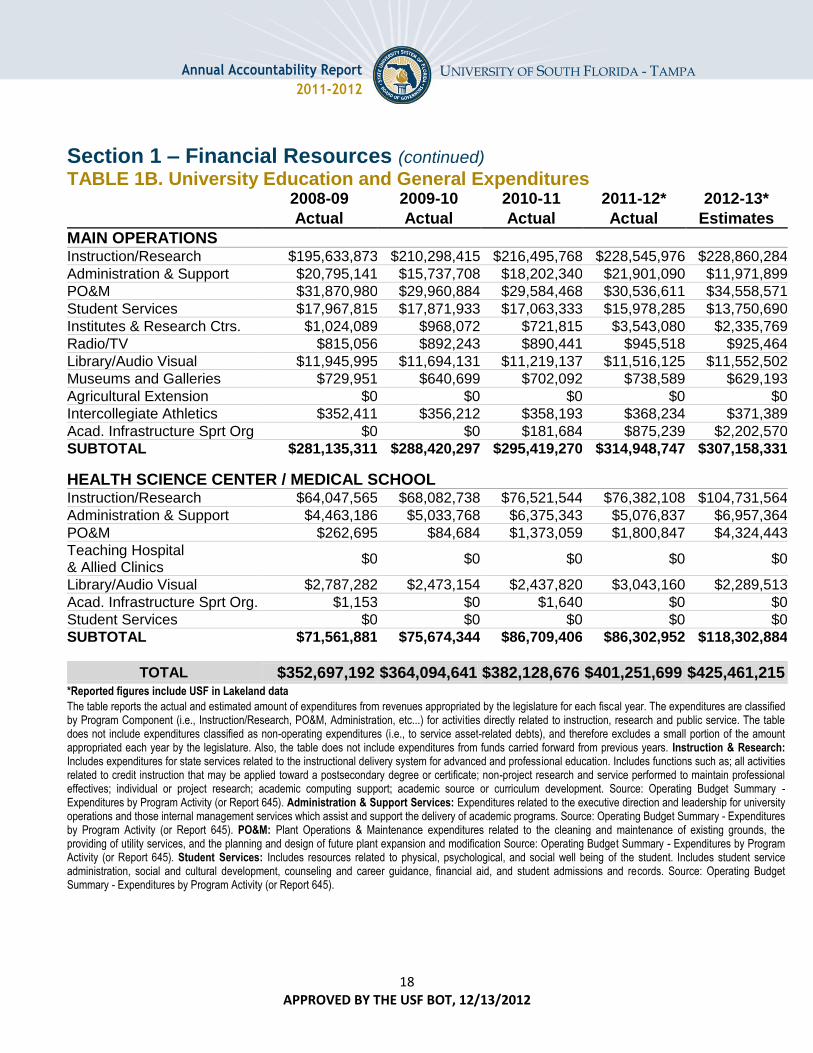
Section 1 – Financial Resources (continued)
TABLE 1B. University Education and General Expenditures 2008-09 2009-10 2010-11 2011-12* 2012-13*
Actual Actual Actual Actual Estimates
MAIN OPERATIONS Instruction/Research $195,633,873 $210,298,415 $216,495,768 $228,545,976 $228,860,284
Administration & Support $20,795,141 $15,737,708 $18,202,340 $21,901,090 $11,971,899
PO&M $31,870,980 $29,960,884 $29,584,468 $30,536,611 $34,558,571
Student Services $17,967,815 $17,871,933 $17,063,333 $15,978,285 $13,750,690
Institutes & Research Ctrs. $1,024,089 $968,072 $721,815 $3,543,080 $2,335,769
Radio/TV $815,056 $892,243 $890,441 $945,518 $925,464
Library/Audio Visual $11,945,995 $11,694,131 $11,219,137 $11,516,125 $11,552,502
Museums and Galleries $729,951 $640,699 $702,092 $738,589 $629,193
Agricultural Extension $0 $0 $0 $0 $0
Intercollegiate Athletics $352,411 $356,212 $358,193 $368,234 $371,389
Acad. Infrastructure Sprt Org $0 $0 $181,684 $875,239 $2,202,570
SUBTOTAL $281,135,311 $288,420,297 $295,419,270 $314,948,747 $307,158,331
HEALTH SCIENCE CENTER / MEDICAL SCHOOL Instruction/Research $64,047,565 $68,082,738 $76,521,544 $76,382,108 $104,731,564
Administration & Support $4,463,186 $5,033,768 $6,375,343 $5,076,837 $6,957,364
PO&M $262,695 $84,684 $1,373,059 $1,800,847 $4,324,443
Teaching Hospital & Allied Clinics
$0 $0 $0 $0 $0
Library/Audio Visual $2,787,282 $2,473,154 $2,437,820 $3,043,160 $2,289,513
Acad. Infrastructure Sprt Org. $1,153 $0 $1,640 $0 $0
Student Services $0 $0 $0 $0 $0
SUBTOTAL $71,561,881 $75,674,344 $86,709,406 $86,302,952 $118,302,884
TOTAL $352,697,192 $364,094,641 $382,128,676 $401,251,699 $425,461,215 *Reported figures include USF in Lakeland data
The table reports the actual and estimated amount of expenditures from revenues appropriated by the legislature for each fiscal year. The expenditures are classified by Program Component (i.e., Instruction/Research, PO&M, Administration, etc...) for activities directly related to instruction, research and public service. The table does not include expenditures classified as non-operating expenditures (i.e., to service asset-related debts), and therefore excludes a small portion of the amount appropriated each year by the legislature. Also, the table does not include expenditures from funds carried forward from previous years. Instruction & Research: Includes expenditures for state services related to the instructional delivery system for advanced and professional education. Includes functions such as; all activities related to credit instruction that may be applied toward a postsecondary degree or certificate; non-project research and service performed to maintain professional effectives; individual or project research; academic computing support; academic source or curriculum development. Source: Operating Budget Summary - Expenditures by Program Activity (or Report 645). Administration & Support Services: Expenditures related to the executive direction and leadership for university operations and those internal management services which assist and support the delivery of academic programs. Source: Operating Budget Summary - Expenditures by Program Activity (or Report 645). PO&M: Plant Operations & Maintenance expenditures related to the cleaning and maintenance of existing grounds, the providing of utility services, and the planning and design of future plant expansion and modification Source: Operating Budget Summary - Expenditures by Program Activity (or Report 645). Student Services: Includes resources related to physical, psychological, and social well being of the student. Includes student service administration, social and cultural development, counseling and career guidance, financial aid, and student admissions and records. Source: Operating Budget Summary - Expenditures by Program Activity (or Report 645).
19 APPROVED BY THE USF BOT, 12/13/2012
Annual Accountability Report
2011-2012
UNIVERSITY OF SOUTH FLORIDA - TAMPA
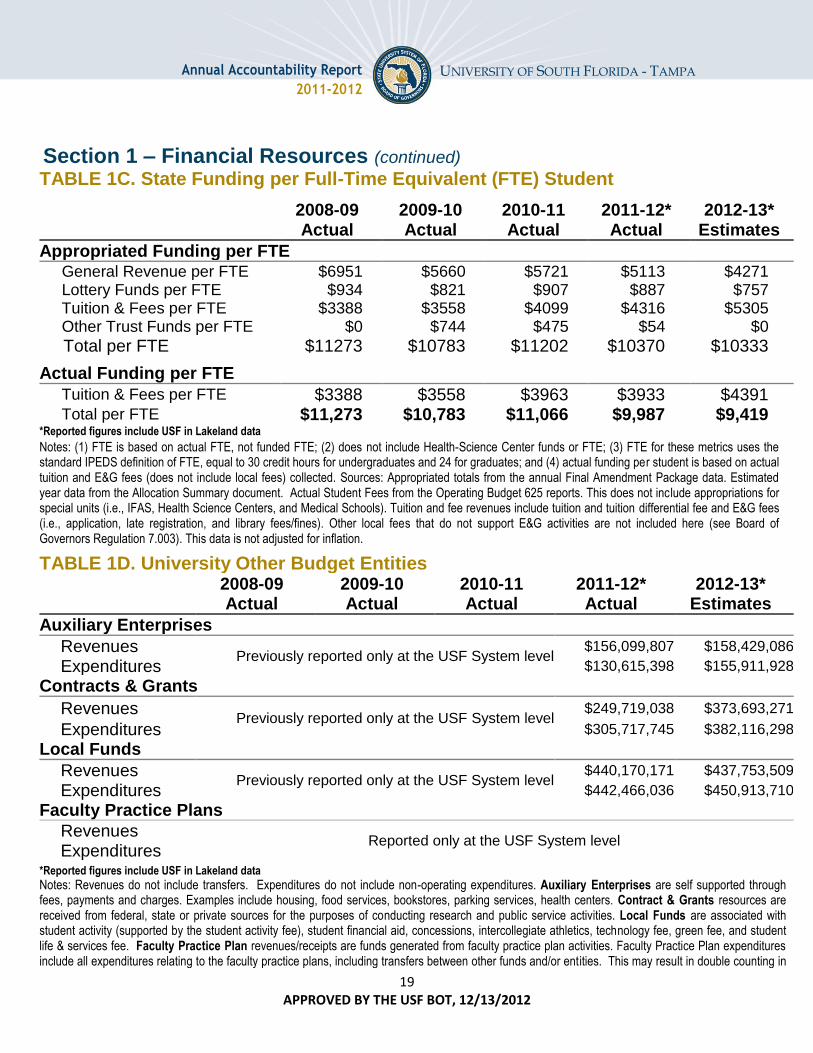
Section 1 – Financial Resources (continued)
TABLE 1C. State Funding per Full-Time Equivalent (FTE) Student
2008-09
Actual
2009-10 Actual
2010-11 Actual
2011-12* Actual
2012-13*
Estimates
Appropriated Funding per FTE
General Revenue per FTE $6951 $5660 $5721 $5113 $4271 Lottery Funds per FTE $934 $821 $907 $887 $757 Tuition & Fees per FTE $3388 $3558 $4099 $4316 $5305 Other Trust Funds per FTE $0 $744 $475 $54 $0
Total per FTE $11273 $10783 $11202 $10370 $10333
Actual Funding per FTE
Tuition & Fees per FTE $3388 $3558 $3963 $3933 $4391 Total per FTE $11,273 $10,783 $11,066 $9,987 $9,419 *Reported figures include USF in Lakeland data
Notes: (1) FTE is based on actual FTE, not funded FTE; (2) does not include Health-Science Center funds or FTE; (3) FTE for these metrics uses the standard IPEDS definition of FTE, equal to 30 credit hours for undergraduates and 24 for graduates; and (4) actual funding per student is based on actual tuition and E&G fees (does not include local fees) collected. Sources: Appropriated totals from the annual Final Amendment Package data. Estimated year data from the Allocation Summary document. Actual Student Fees from the Operating Budget 625 reports. This does not include appropriations for special units (i.e., IFAS, Health Science Centers, and Medical Schools). Tuition and fee revenues include tuition and tuition differential fee and E&G fees (i.e., application, late registration, and library fees/fines). Other local fees that do not support E&G activities are not included here (see Board of Governors Regulation 7.003). This data is not adjusted for inflation.
TABLE 1D. University Other Budget Entities
2008-09
Actual
2009-10 Actual
2010-11 Actual
2011-12* Actual
2012-13*
Estimates
Auxiliary Enterprises
Revenues Previously reported only at the USF System level
$156,099,807 $158,429,086
Expenditures $130,615,398 $155,911,928
Contracts & Grants
Revenues Previously reported only at the USF System level
$249,719,038 $373,693,271
Expenditures $305,717,745 $382,116,298
Local Funds
Revenues Previously reported only at the USF System level
$440,170,171 $437,753,509
Expenditures $442,466,036 $450,913,710
Faculty Practice Plans
Revenues Reported only at the USF System level
Expenditures
*Reported figures include USF in Lakeland data
Notes: Revenues do not include transfers. Expenditures do not include non-operating expenditures. Auxiliary Enterprises are self supported through fees, payments and charges. Examples include housing, food services, bookstores, parking services, health centers. Contract & Grants resources are received from federal, state or private sources for the purposes of conducting research and public service activities. Local Funds are associated with student activity (supported by the student activity fee), student financial aid, concessions, intercollegiate athletics, technology fee, green fee, and student life & services fee. Faculty Practice Plan revenues/receipts are funds generated from faculty practice plan activities. Faculty Practice Plan expenditures include all expenditures relating to the faculty practice plans, including transfers between other funds and/or entities. This may result in double counting in
20 APPROVED BY THE USF BOT, 12/13/2012
Annual Accountability Report
2011-2012
UNIVERSITY OF SOUTH FLORIDA - TAMPA
TABLE 1D. University Other Budget Entities
information presented within the annual report. Source: Operating Budget, Report 615.
Section 1 – Financial Resources (continued)
TABLE 1E. Voluntary Support of Higher Education
2006-07 2007-08 2008-09 2009-10 2010-11
Endowment Value
($1000s)
This is a USF System function. Gifts Received ($s)
Percentage of Alumni Donors
Notes: Endowment value at the end of the fiscal year, as reported in the annual NACUBO Endowment Study. Gifts Received as reported in the Council for Aid to Education’s Voluntary Support of Education (VSE) survey in the section entitled “Gift Income Summary,” this is the sum of the present value of all gifts (including outright and deferred gifts) received for any purpose and from all sources during the fiscal year, excluding pledges and bequests. (There’s a deferred gift calculator at www.cae.org/vse.) The present value of non-cash gifts is defined as the tax deduction to the donor as allowed by the IRS. Percentage of Alumni Donors as reported in the Council for Aid to Education’s Voluntary Support of Education (VSE) survey in the section entitled “Additional Details,” this is the number of alumni donors divided by the total number of alumni, as of the end of the fiscal year. “Alumni,” as defined in this survey, include those holding a degree from the institution as well as those who attended the institution but did not earn a degree.
21 APPROVED BY THE USF BOT, 12/13/2012
Annual Accountability Report
2011-2012
UNIVERSITY OF SOUTH FLORIDA - TAMPA
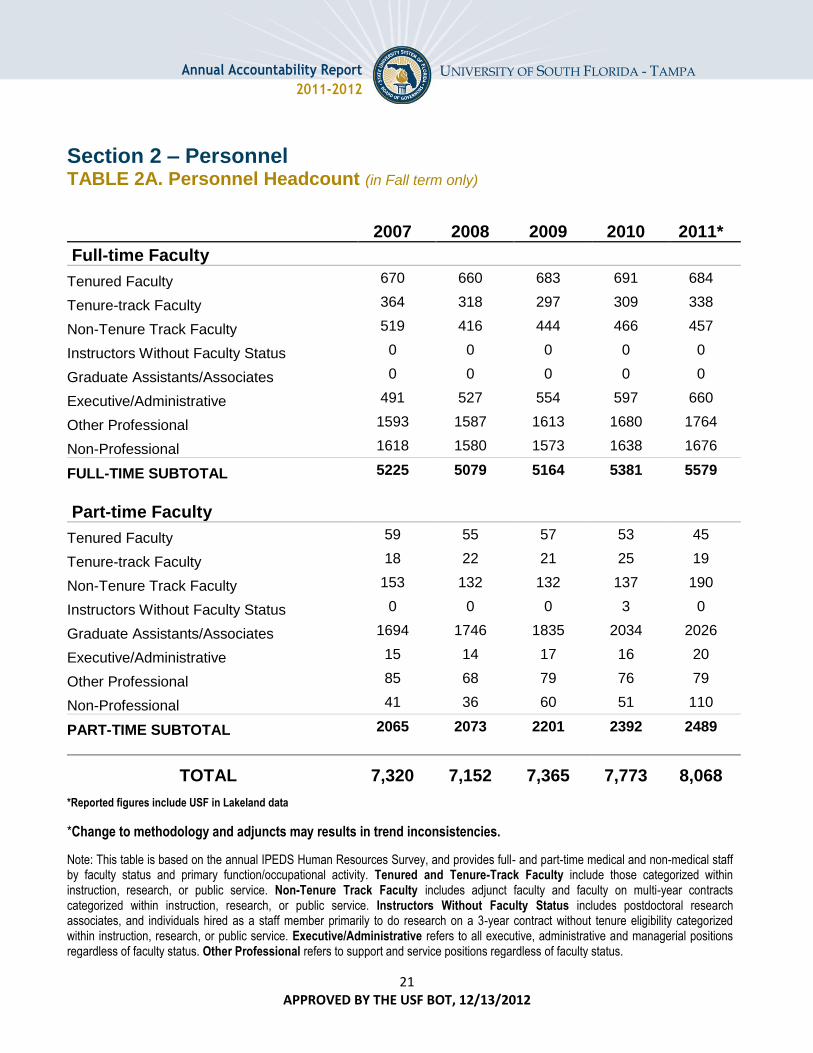
Section 2 – Personnel
TABLE 2A. Personnel Headcount (in Fall term only)
2007 2008 2009 2010 2011*
Full-time Faculty
Tenured Faculty 670 660 683 691 684
Tenure-track Faculty 364 318 297 309 338
Non-Tenure Track Faculty 519 416 444 466 457
Instructors Without Faculty Status 0 0 0 0 0
Graduate Assistants/Associates 0 0 0 0 0
Executive/Administrative 491 527 554 597 660
Other Professional 1593 1587 1613 1680 1764
Non-Professional 1618 1580 1573 1638 1676
FULL-TIME SUBTOTAL 5225 5079 5164 5381 5579
Part-time Faculty
Tenured Faculty 59 55 57 53 45
Tenure-track Faculty 18 22 21 25 19
Non-Tenure Track Faculty 153 132 132 137 190
Instructors Without Faculty Status 0 0 0 3 0
Graduate Assistants/Associates 1694 1746 1835 2034 2026
Executive/Administrative 15 14 17 16 20
Other Professional 85 68 79 76 79
Non-Professional 41 36 60 51 110
PART-TIME SUBTOTAL 2065 2073 2201 2392 2489
TOTAL 7,320 7,152 7,365 7,773 8,068
*Reported figures include USF in Lakeland data
*Change to methodology and adjuncts may results in trend inconsistencies.
Note: This table is based on the annual IPEDS Human Resources Survey, and provides full- and part-time medical and non-medical staff by faculty status and primary function/occupational activity. Tenured and Tenure-Track Faculty include those categorized within instruction, research, or public service. Non-Tenure Track Faculty includes adjunct faculty and faculty on multi-year contracts categorized within instruction, research, or public service. Instructors Without Faculty Status includes postdoctoral research associates, and individuals hired as a staff member primarily to do research on a 3-year contract without tenure eligibility categorized within instruction, research, or public service. Executive/Administrative refers to all executive, administrative and managerial positions regardless of faculty status. Other Professional refers to support and service positions regardless of faculty status.
22 APPROVED BY THE USF BOT, 12/13/2012
Annual Accountability Report
2011-2012
UNIVERSITY OF SOUTH FLORIDA - TAMPA
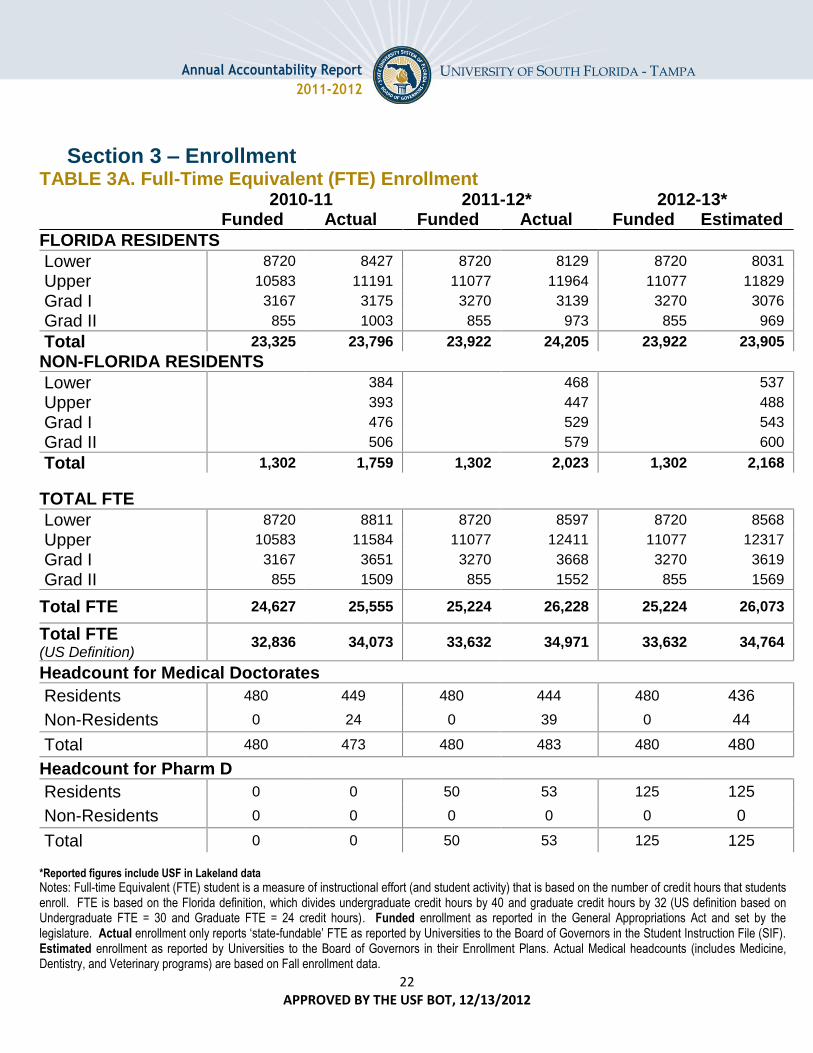
Section 3 – Enrollment
TABLE 3A. Full-Time Equivalent (FTE) Enrollment
2010-11 2011-12* 2012-13*
Funded Actual Funded Actual Funded Estimated
FLORIDA RESIDENTS
Lower 8720 8427 8720 8129 8720 8031
Upper 10583 11191 11077 11964 11077 11829
Grad I 3167 3175 3270 3139 3270 3076
Grad II 855 1003 855 973 855 969
Total 23,325 23,796 23,922 24,205 23,922 23,905
NON-FLORIDA RESIDENTS
Lower 384 468 537
Upper 393 447 488
Grad I 476 529 543
Grad II 506 579 600
Total 1,302 1,759 1,302 2,023 1,302 2,168
TOTAL FTE
Lower 8720 8811 8720 8597 8720 8568
Upper 10583 11584 11077 12411 11077 12317
Grad I 3167 3651 3270 3668 3270 3619
Grad II 855 1509 855 1552 855 1569
Total FTE 24,627 25,555 25,224 26,228 25,224 26,073
Total FTE
(US Definition) 32,836 34,073 33,632 34,971 33,632 34,764
Headcount for Medical Doctorates
Residents 480 449 480 444 480 436
Non-Residents 0 24 0 39 0 44
Total 480 473 480 483 480 480
Headcount for Pharm D
Residents 0 0 50 53 125 125
Non-Residents 0 0 0 0 0 0
Total 0 0 50 53 125 125 *Reported figures include USF in Lakeland data
Notes: Full-time Equivalent (FTE) student is a measure of instructional effort (and student activity) that is based on the number of credit hours that students enroll. FTE is based on the Florida definition, which divides undergraduate credit hours by 40 and graduate credit hours by 32 (US definition based on Undergraduate FTE = 30 and Graduate FTE = 24 credit hours). Funded enrollment as reported in the General Appropriations Act and set by the legislature. Actual enrollment only reports ‘state-fundable’ FTE as reported by Universities to the Board of Governors in the Student Instruction File (SIF). Estimated enrollment as reported by Universities to the Board of Governors in their Enrollment Plans. Actual Medical headcounts (includes Medicine, Dentistry, and Veterinary programs) are based on Fall enrollment data.

23 APPROVED BY THE USF BOT, 12/13/2012
Annual Accountability Report
2011-2012
UNIVERSITY OF SOUTH FLORIDA - TAMPA
Section 3 – Enrollment (continued)
TABLE 3B. Full-Time Equivalent (FTE) Enrollment by Location
2010-11
Actual
2011-12*
Actual
2012-13*
Estimated
MAIN CAMPUS (*includes USF in Lakeland)
Lower 8425 8203 8173 Upper 10631 11292 11114 Master’s (Grad I) 2675 2622 2622 Doctoral ( Grad II) 1214 1237 1270
TOTAL 22,945 23,354 23,179
SITE: Health Science Center Lower 386 394 395 Upper 953 1119 1203 Master’s (Grad I) 976 1046 997 Doctoral (Grad II) 295 315 299
TOTAL 2,610 2,874 2,894
Notes: “Site” refers to each distinct physical location that has or is planned to have more than 150 State-fundable FTE enrollments. See table 3C for more details on Distance Learning. Total equals totals in table 3A.
24 APPROVED BY THE USF BOT, 12/13/2012
Annual Accountability Report
2011-2012
UNIVERSITY OF SOUTH FLORIDA - TAMPA
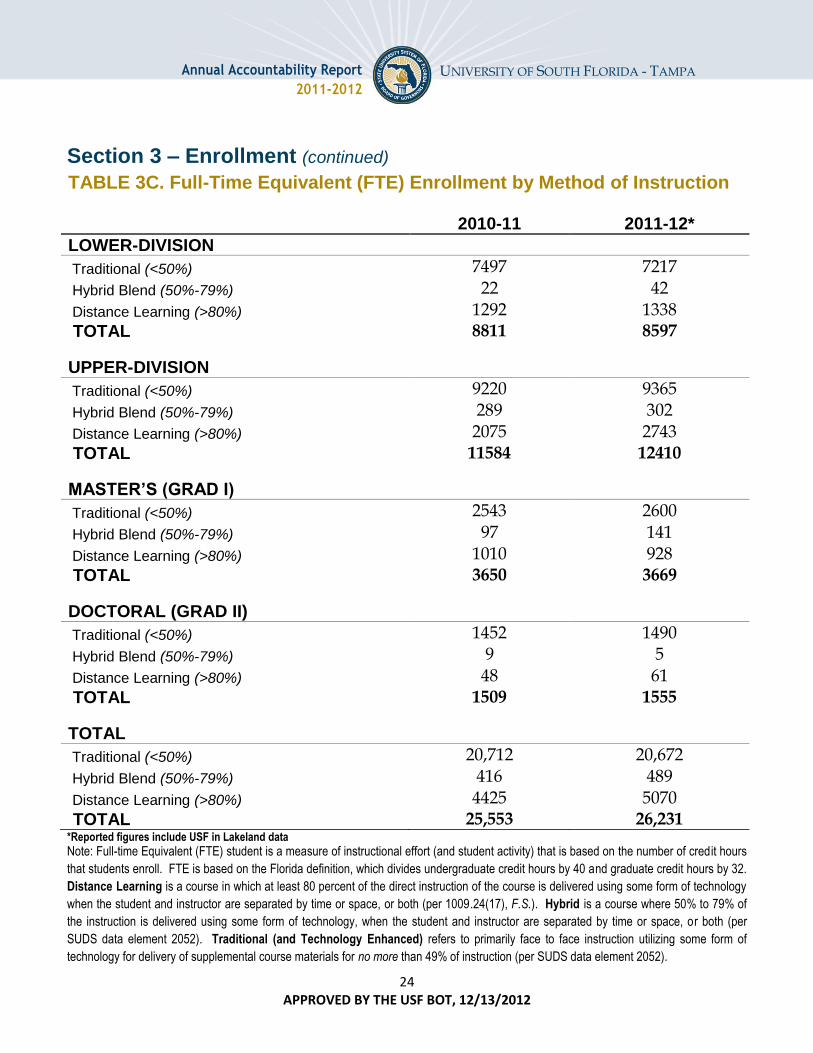
Section 3 – Enrollment (continued)
TABLE 3C. Full-Time Equivalent (FTE) Enrollment by Method of Instruction
2010-11 2011-12*
LOWER-DIVISION
Traditional (<50%) 7497 7217
Hybrid Blend (50%-79%) 22 42
Distance Learning (>80%) 1292 1338 TOTAL 8811 8597
UPPER-DIVISION
Traditional (<50%) 9220 9365
Hybrid Blend (50%-79%) 289 302
Distance Learning (>80%) 2075 2743
TOTAL 11584 12410
MASTER’S (GRAD I)
Traditional (<50%) 2543 2600
Hybrid Blend (50%-79%) 97 141
Distance Learning (>80%) 1010 928 TOTAL 3650 3669
DOCTORAL (GRAD II)
Traditional (<50%) 1452 1490
Hybrid Blend (50%-79%) 9 5
Distance Learning (>80%) 48 61
TOTAL 1509 1555
TOTAL
Traditional (<50%) 20,712 20,672
Hybrid Blend (50%-79%) 416 489
Distance Learning (>80%) 4425 5070 TOTAL 25,553 26,231 *Reported figures include USF in Lakeland data
Note: Full-time Equivalent (FTE) student is a measure of instructional effort (and student activity) that is based on the number of credit hours
that students enroll. FTE is based on the Florida definition, which divides undergraduate credit hours by 40 and graduate credit hours by 32.
Distance Learning is a course in which at least 80 percent of the direct instruction of the course is delivered using some form of technology
when the student and instructor are separated by time or space, or both (per 1009.24(17), F.S.). Hybrid is a course where 50% to 79% of
the instruction is delivered using some form of technology, when the student and instructor are separated by time or space, or both (per
SUDS data element 2052). Traditional (and Technology Enhanced) refers to primarily face to face instruction utilizing some form of
technology for delivery of supplemental course materials for no more than 49% of instruction (per SUDS data element 2052).
25 APPROVED BY THE USF BOT, 12/13/2012
Annual Accountability Report
2011-2012
UNIVERSITY OF SOUTH FLORIDA - TAMPA
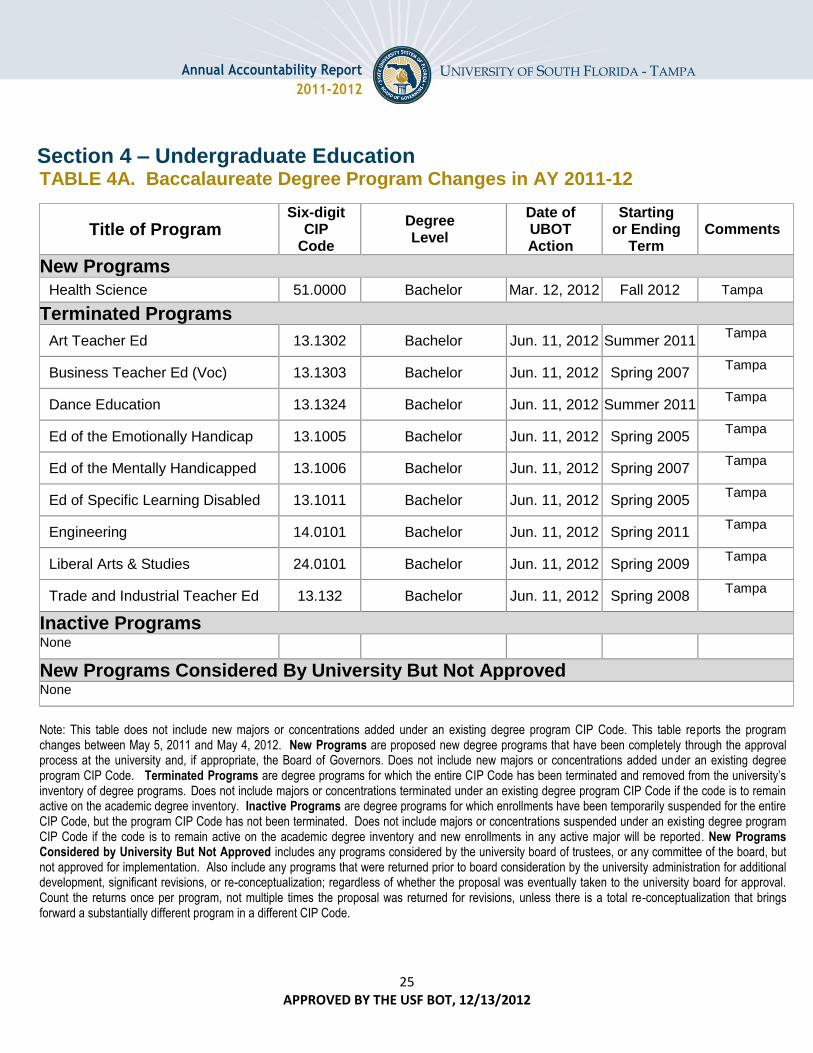
Section 4 – Undergraduate Education
TABLE 4A. Baccalaureate Degree Program Changes in AY 2011-12
Title of Program
Six-digit
CIP
Code
Degree
Level
Date of
UBOT
Action
Starting
or Ending
Term
Comments
New Programs
Health Science 51.0000 Bachelor Mar. 12, 2012 Fall 2012 Tampa
Terminated Programs
Art Teacher Ed 13.1302 Bachelor Jun. 11, 2012 Summer 2011 Tampa
Business Teacher Ed (Voc) 13.1303 Bachelor Jun. 11, 2012 Spring 2007 Tampa
Dance Education 13.1324 Bachelor Jun. 11, 2012 Summer 2011 Tampa
Ed of the Emotionally Handicap 13.1005 Bachelor Jun. 11, 2012 Spring 2005 Tampa
Ed of the Mentally Handicapped 13.1006 Bachelor Jun. 11, 2012 Spring 2007 Tampa
Ed of Specific Learning Disabled 13.1011 Bachelor Jun. 11, 2012 Spring 2005 Tampa
Engineering 14.0101 Bachelor Jun. 11, 2012 Spring 2011 Tampa
Liberal Arts & Studies 24.0101 Bachelor Jun. 11, 2012 Spring 2009 Tampa
Trade and Industrial Teacher Ed 13.132 Bachelor Jun. 11, 2012 Spring 2008 Tampa
Inactive Programs
None
New Programs Considered By University But Not Approved
None
Note: This table does not include new majors or concentrations added under an existing degree program CIP Code. This table reports the program changes between May 5, 2011 and May 4, 2012. New Programs are proposed new degree programs that have been completely through the approval process at the university and, if appropriate, the Board of Governors. Does not include new majors or concentrations added under an existing degree program CIP Code. Terminated Programs are degree programs for which the entire CIP Code has been terminated and removed from the university’s inventory of degree programs. Does not include majors or concentrations terminated under an existing degree program CIP Code if the code is to remain active on the academic degree inventory. Inactive Programs are degree programs for which enrollments have been temporarily suspended for the entire CIP Code, but the program CIP Code has not been terminated. Does not include majors or concentrations suspended under an existing degree program CIP Code if the code is to remain active on the academic degree inventory and new enrollments in any active major will be reported. New Programs Considered by University But Not Approved includes any programs considered by the university board of trustees, or any committee of the board, but not approved for implementation. Also include any programs that were returned prior to board consideration by the university administration for additional development, significant revisions, or re-conceptualization; regardless of whether the proposal was eventually taken to the university board for approval. Count the returns once per program, not multiple times the proposal was returned for revisions, unless there is a total re-conceptualization that brings forward a substantially different program in a different CIP Code.

26 APPROVED BY THE USF BOT, 12/13/2012
Annual Accountability Report
2011-2012
UNIVERSITY OF SOUTH FLORIDA - TAMPA
Section 4 – Undergraduate Education (continued)
TABLE 4B. Retention Rates Full-time FTIC Retained in the Second Fall Term at Same University
2007-08 2008-09 2009-10 20010-11
2011-12 Preliminary
Cohort Size 3905 4015 3814 4477 3451
% Retained 87% 87% 88% 86% 87%
% Retained with GPA of 2.0 or higher
82% 84% 85% 84% 86%
Notes: Cohorts are based on undergraduate students who enter the institution in the Fall term (or Summer term and continue into the Fall term). Percent Retained is based on student enrollment in the Fall term following their first year. Percent Retained with GPA Above 2.0 is based on student enrollment in the Fall term following their first years for those students with a GPA of 2.0 or higher at the end of their first year (Fall, Spring, Summer). The most recent year of Retention data is based on preliminary data (SIFP file) that is comparable to the final data (SIF file) but may be revised in the following years based on changes in student cohorts.
TABLE 4C. FTIC Graduation Rates for Full-Time, First-Time-in-College (FTIC) Undergraduate Students at Same University
Term of Entry 2002-08 2003-09 2004-10 2005-11 2006-12 Preliminary
Cohort Size 4205 4703 3979 3926 4122
% Graduated 48% 47% 52% 52% 56%
% Still Enrolled 11% 10% 9% 9% 8%
% Success Rate 59% 57% 61% 60% 64%
Notes: Cohorts are based on undergraduate students who enter the institution in the Fall term (or Summer term and continue into the Fall term). Percent Graduated is based on federal rate and does not include students who originally enroll as part-time students, or who transfer into the institution. This metric complies with the requirements of the federal Student Right to Know Act that requires institutions to report the completion status at 150% of normal time (or six years). Success Rate measures the percentage of an initial cohort of students who have either graduated or are still enrolled at the same university. Since degrees can be awarded after the last semester of coursework, the most recent year of data in this table provides preliminary data that may change with the addition of “late degrees”. Late degrees reported in conjunction with the IPEDS Graduation Rate Survey due in mid-April will be reflected in the following year.

27 APPROVED BY THE USF BOT, 12/13/2012
Annual Accountability Report
2011-2012
UNIVERSITY OF SOUTH FLORIDA - TAMPA
Section 4 – Undergraduate Education (continued)
TABLE 4D. FTIC Progression and Graduation Rates
4 – Year Rates 2004-08 2005-09 2006-10 2007-11
2008-12 Preliminary
Full- & Part-time Cohort 4492 4231 4212 3963 4086
From Same University
% Graduated 23% 24% 28% 35% 38% % Still Enrolled 42% 41% 40% 39% 37%
From Other SUS University
% Graduated 2% 2% 2% 2% 2% % Still Enrolled 65 4% 4% 4% 4%
From State University System
% Graduated 25% 26% 30% 36% 39% % Still Enrolled 48% 45% 44% 43% 41%
% Success Rate 72% 71% 74% 79% 80%
6 – Year Rates 2002-08 2003-09 2004-10 2005-11
2006-12 Preliminary
Full- & Part-time Cohort 4434 4914 4492 4231 4212
From Same University
% Graduated 47% 46% 51% 51% 56%
% Still Enrolled 11% 10% 9% 9% 8%
From Other SUS University
% Graduated 4% 6% 6% 5% 5%
% Still Enrolled 1% 2% 3% 2% 2%
From State University System
% Graduated 51% 52% 57% 56% 60%
% Still Enrolled 12% 13% 12% 11% 10%
% Success Rate 63% 64% 69% 67% 70% Notes: First-time-in-college (FTIC) cohort is defined as undergraduates entering in fall term (or summer continuing to fall) with fewer than 12 hours earned since high school graduation. (1) Cohorts are based on undergraduate students who enter the institution in the Fall term (or Summer term and continue into the Fall term). Students of degree programs longer than four years (eg, PharmD) are included in the cohorts. The initial cohorts are revised to remove students, who have allowable exclusions as defined by IPEDS, from the cohort. (2) Success Rate measures the percentage of an initial cohort of students who have either graduated or are still enrolled. (3) Since degrees can be awarded after the last semester of coursework, the most recent year of data in this table provides preliminary graduation rate data that may change with the addition of “late degrees”. Late degrees reported in conjunction with the IPEDS Graduation Rate Survey due in mid-April will be reflected in the following year.
28 APPROVED BY THE USF BOT, 12/13/2012
Annual Accountability Report
2011-2012
UNIVERSITY OF SOUTH FLORIDA - TAMPA
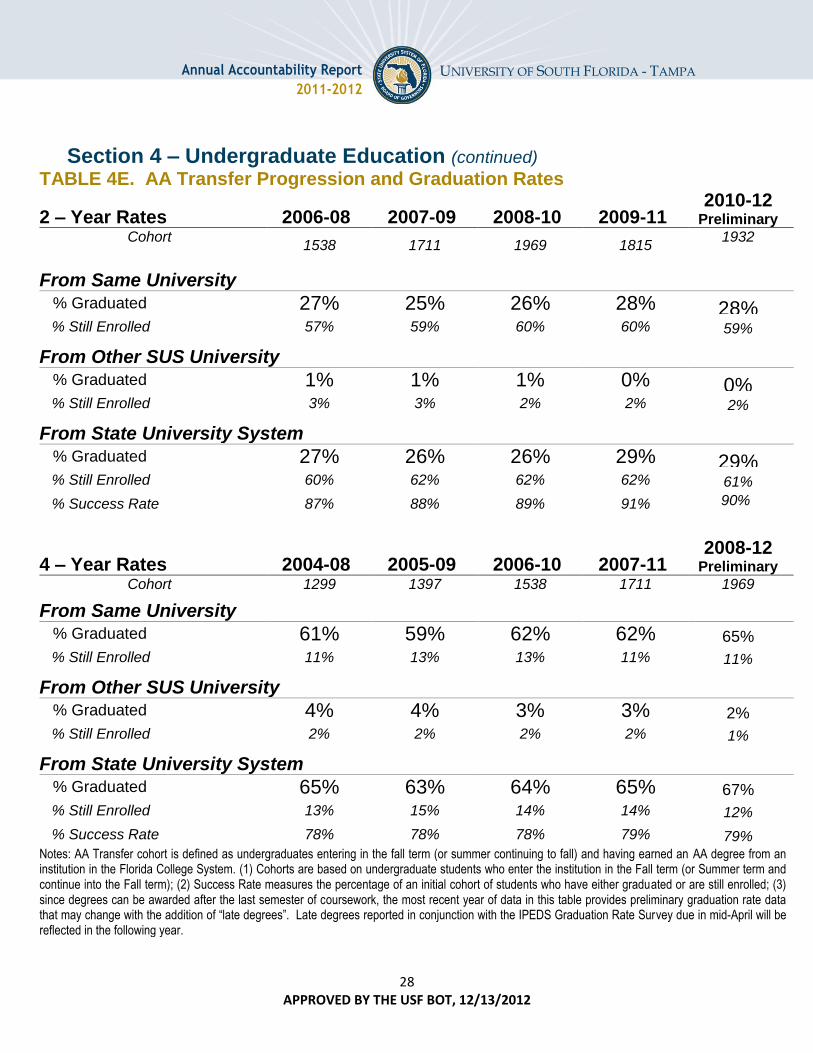
Section 4 – Undergraduate Education (continued)
TABLE 4E. AA Transfer Progression and Graduation Rates
2 – Year Rates 2006-08 2007-09 2008-10 2009-11
2010-12 Preliminary
Cohort
1538 1711 1969 1815 1932
From Same University
% Graduated 27% 25% 26% 28% 28% % Still Enrolled 57% 59% 60% 60% 59%
From Other SUS University
% Graduated 1% 1% 1% 0% 0% % Still Enrolled 3% 3% 2% 2% 2%
From State University System
% Graduated 27% 26% 26% 29% 29% % Still Enrolled 60% 62% 62% 62% 61%
% Success Rate 87% 88% 89% 91% 90%
4 – Year Rates 2004-08 2005-09 2006-10 2007-11
2008-12 Preliminary
Cohort 1299 1397 1538 1711 1969
From Same University
% Graduated 61% 59% 62% 62% 65%
% Still Enrolled 11% 13% 13% 11% 11%
From Other SUS University
% Graduated 4% 4% 3% 3% 2%
% Still Enrolled 2% 2% 2% 2% 1%
From State University System
% Graduated 65% 63% 64% 65% 67%
% Still Enrolled 13% 15% 14% 14% 12%
% Success Rate 78% 78% 78% 79% 79% Notes: AA Transfer cohort is defined as undergraduates entering in the fall term (or summer continuing to fall) and having earned an AA degree from an institution in the Florida College System. (1) Cohorts are based on undergraduate students who enter the institution in the Fall term (or Summer term and continue into the Fall term); (2) Success Rate measures the percentage of an initial cohort of students who have either graduated or are still enrolled; (3) since degrees can be awarded after the last semester of coursework, the most recent year of data in this table provides preliminary graduation rate data that may change with the addition of “late degrees”. Late degrees reported in conjunction with the IPEDS Graduation Rate Survey due in mid-April will be reflected in the following year.
29 APPROVED BY THE USF BOT, 12/13/2012
Annual Accountability Report
2011-2012
UNIVERSITY OF SOUTH FLORIDA - TAMPA
Section 4 – Undergraduate Education (continued)
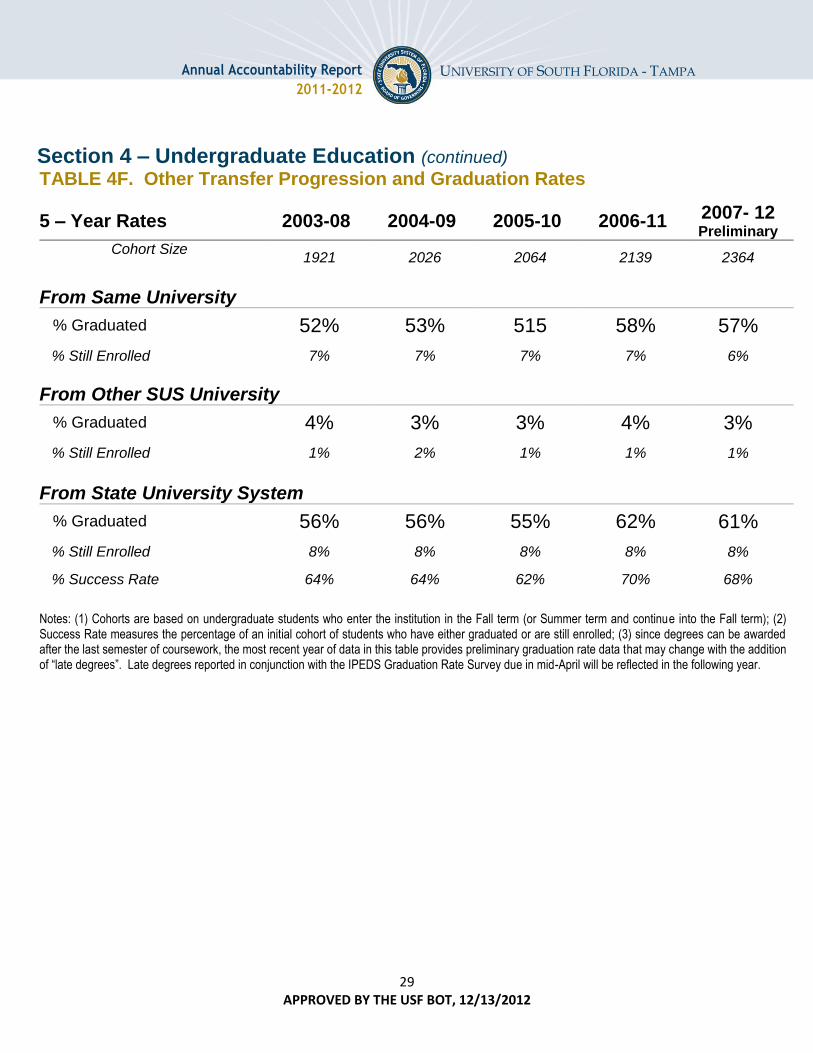
TABLE 4F. Other Transfer Progression and Graduation Rates
5 – Year Rates 2003-08 2004-09 2005-10 2006-11 2007- 12 Preliminary
Cohort Size
1921 2026 2064 2139 2364
From Same University
% Graduated 52% 53% 515 58% 57%
% Still Enrolled 7% 7% 7% 7% 6%
From Other SUS University
% Graduated 4% 3% 3% 4% 3%
% Still Enrolled 1% 2% 1% 1% 1%
From State University System
% Graduated 56% 56% 55% 62% 61%
% Still Enrolled 8% 8% 8% 8% 8%
% Success Rate 64% 64% 62% 70% 68%
Notes: (1) Cohorts are based on undergraduate students who enter the institution in the Fall term (or Summer term and continue into the Fall term); (2) Success Rate measures the percentage of an initial cohort of students who have either graduated or are still enrolled; (3) since degrees can be awarded after the last semester of coursework, the most recent year of data in this table provides preliminary graduation rate data that may change with the addition of “late degrees”. Late degrees reported in conjunction with the IPEDS Graduation Rate Survey due in mid-April will be reflected in the following year.
30 APPROVED BY THE USF BOT, 12/13/2012
Annual Accountability Report
2011-2012
UNIVERSITY OF SOUTH FLORIDA - TAMPA
Section 4 – Undergraduate Education (continued)
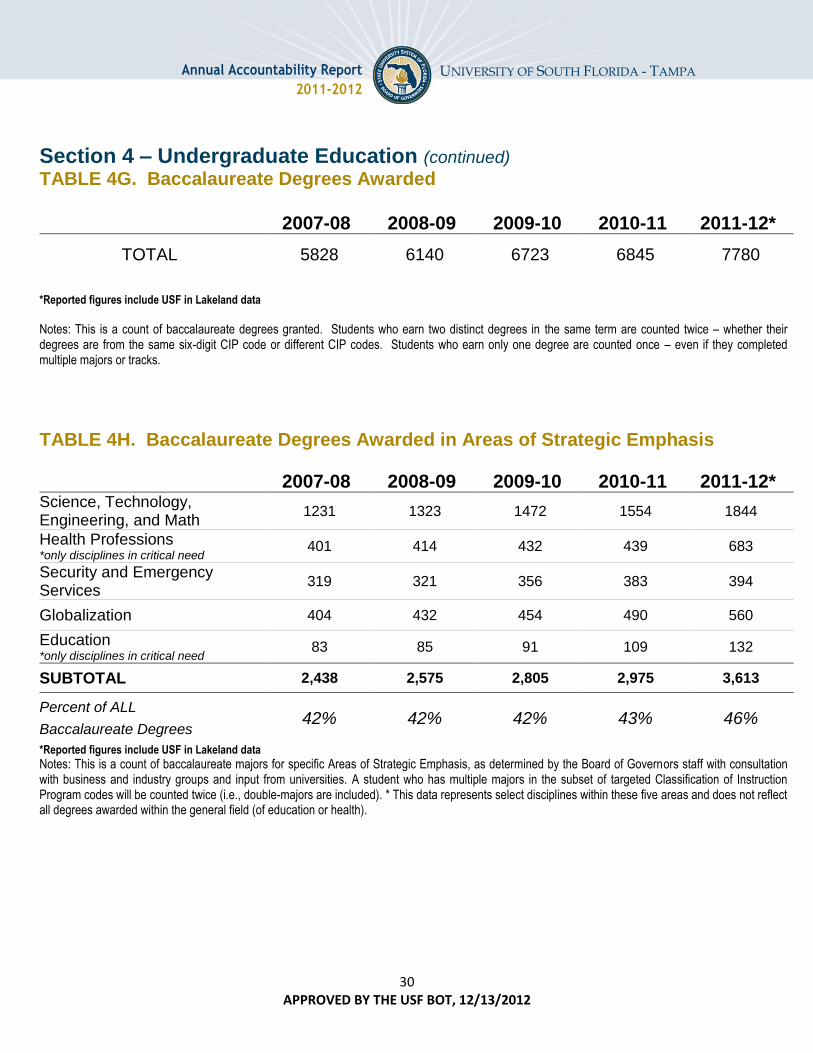
TABLE 4G. Baccalaureate Degrees Awarded
2007-08 2008-09 2009-10 2010-11 2011-12*
TOTAL 5828 6140 6723 6845 7780
*Reported figures include USF in Lakeland data
Notes: This is a count of baccalaureate degrees granted. Students who earn two distinct degrees in the same term are counted twice – whether their degrees are from the same six-digit CIP code or different CIP codes. Students who earn only one degree are counted once – even if they completed multiple majors or tracks.
TABLE 4H. Baccalaureate Degrees Awarded in Areas of Strategic Emphasis
2007-08 2008-09 2009-10 2010-11 2011-12*
Science, Technology, Engineering, and Math
1231 1323 1472 1554 1844
Health Professions *only disciplines in critical need
401 414 432 439 683
Security and Emergency Services
319 321 356 383 394
Globalization 404 432 454 490 560
Education *only disciplines in critical need
83 85 91 109 132
SUBTOTAL 2,438 2,575 2,805 2,975 3,613
Percent of ALL
Baccalaureate Degrees 42% 42% 42% 43% 46%
*Reported figures include USF in Lakeland data
Notes: This is a count of baccalaureate majors for specific Areas of Strategic Emphasis, as determined by the Board of Governors staff with consultation with business and industry groups and input from universities. A student who has multiple majors in the subset of targeted Classification of Instruction Program codes will be counted twice (i.e., double-majors are included). * This data represents select disciplines within these five areas and does not reflect all degrees awarded within the general field (of education or health).

31 APPROVED BY THE USF BOT, 12/13/2012
Annual Accountability Report
2011-2012
UNIVERSITY OF SOUTH FLORIDA - TAMPA
Section 4 – Undergraduate Education (continued)
TABLE 4I. Baccalaureate Degrees Awarded to Underrepresented Groups
2007-08 2008-09 2009-10 2010-11 2011-12*
Non-Hispanic Black
Number of Degrees 723 786 795 845 881
Percentage of Degrees 13% 14% 13% 13% 11%
Hispanic
Number of Degrees 657 759 830 1013 1312
Percentage of Degrees 12% 13% 13% 16% 17%
Pell-Grant Recipients
Number of Degrees 2273 2578 2806 3130 3859
Percentage of Degrees 40% 43% 42% 46% 50% *Reported figures include USF in Lakeland data
Note: Non-Hispanic Black and Hispanic do not include students classified as Non-Resident Alien or students with a missing race code. Students who earn two distinct degrees in the same term are counted twice – whether their degrees are from the same six-digit CIP code or different CIP codes. Students who earn only one degree are counted once – even if they completed multiple majors or tracks. Percentage of Degrees is based on the number of baccalaureate degrees awarded to non-Hispanic Black and Hispanic students divided by the total degrees awarded - excluding those awarded to non-resident aliens and unreported. Pell-Grant recipients are defined as those students who have received a Pell grant from any SUS Institution within six years of graduation - excluding those awarded to non-resident aliens, who are only eligible for Pell grants in special circumstances. Percentage of Degrees is based on the number of baccalaureate degrees awarded to Pell recipients, as shown above, divided by the total degrees awarded - excluding those awarded to non-resident aliens. The number of degrees awarded to Pell recipients in 2010-11 is significantly higher in this year’s report than last year’s report due to a timing issue of when financial aid data is updated.
32 APPROVED BY THE USF BOT, 12/13/2012
Annual Accountability Report
2011-2012
UNIVERSITY OF SOUTH FLORIDA - TAMPA
Section 4 – Undergraduate Education (continued)
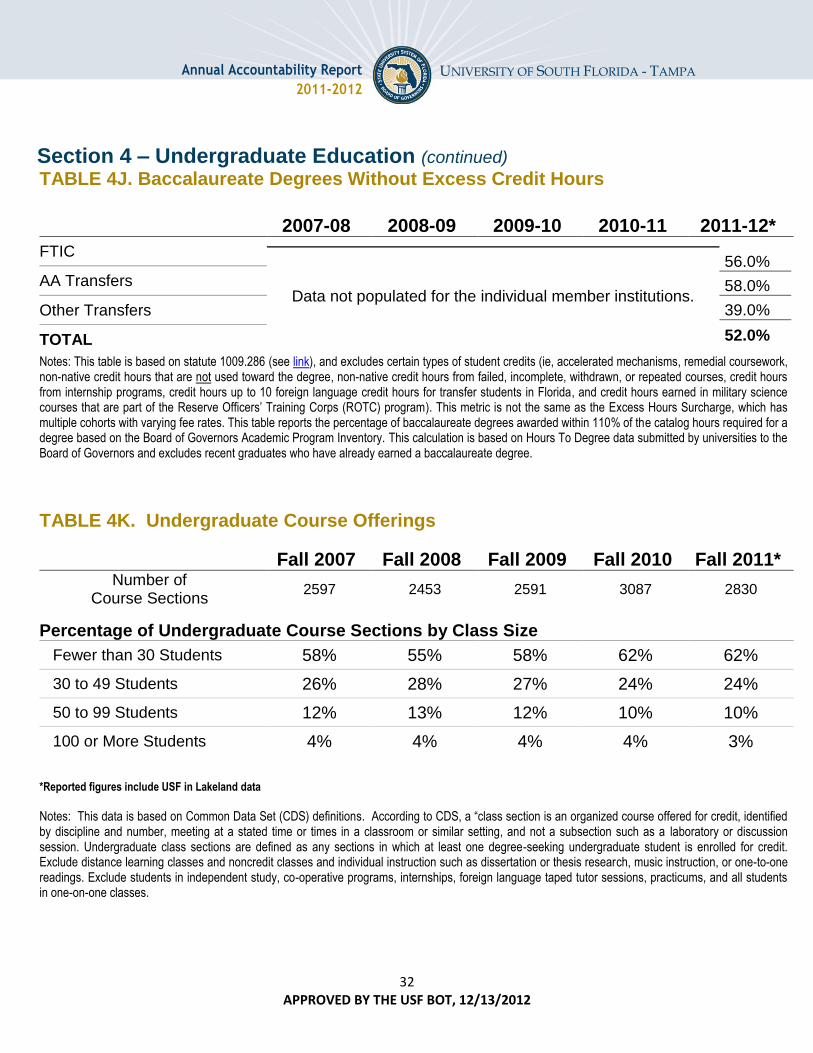
TABLE 4J. Baccalaureate Degrees Without Excess Credit Hours
2007-08 2008-09 2009-10 2010-11 2011-12*
FTIC
Data not populated for the individual member institutions.
56.0%
58.0%
39.0%
52.0%
AA Transfers
Other Transfers
TOTAL
Notes: This table is based on statute 1009.286 (see link), and excludes certain types of student credits (ie, accelerated mechanisms, remedial coursework, non-native credit hours that are not used toward the degree, non-native credit hours from failed, incomplete, withdrawn, or repeated courses, credit hours from internship programs, credit hours up to 10 foreign language credit hours for transfer students in Florida, and credit hours earned in military science courses that are part of the Reserve Officers’ Training Corps (ROTC) program). This metric is not the same as the Excess Hours Surcharge, which has multiple cohorts with varying fee rates. This table reports the percentage of baccalaureate degrees awarded within 110% of the catalog hours required for a degree based on the Board of Governors Academic Program Inventory. This calculation is based on Hours To Degree data submitted by universities to the Board of Governors and excludes recent graduates who have already earned a baccalaureate degree.
TABLE 4K. Undergraduate Course Offerings
Fall 2007 Fall 2008 Fall 2009 Fall 2010 Fall 2011*
Number of Course Sections
2597 2453 2591 3087 2830
Percentage of Undergraduate Course Sections by Class Size
Fewer than 30 Students 58% 55% 58% 62% 62%
30 to 49 Students 26% 28% 27% 24% 24%
50 to 99 Students 12% 13% 12% 10% 10%
100 or More Students 4% 4% 4% 4% 3%
*Reported figures include USF in Lakeland data
Notes: This data is based on Common Data Set (CDS) definitions. According to CDS, a “class section is an organized course offered for credit, identified by discipline and number, meeting at a stated time or times in a classroom or similar setting, and not a subsection such as a laboratory or discussion session. Undergraduate class sections are defined as any sections in which at least one degree-seeking undergraduate student is enrolled for credit. Exclude distance learning classes and noncredit classes and individual instruction such as dissertation or thesis research, music instruction, or one-to-one readings. Exclude students in independent study, co-operative programs, internships, foreign language taped tutor sessions, practicums, and all students in one-on-one classes.
33 APPROVED BY THE USF BOT, 12/13/2012
Annual Accountability Report
2011-2012
UNIVERSITY OF SOUTH FLORIDA - TAMPA
Section 4 – Undergraduate Education (continued)
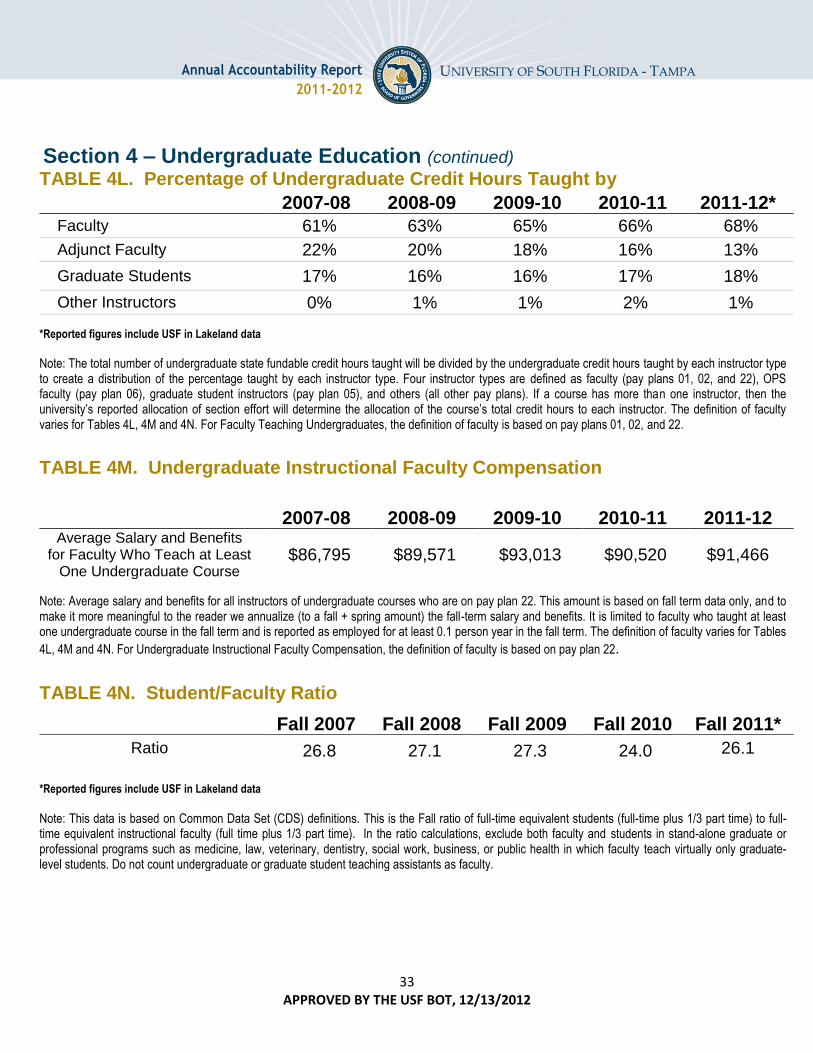
TABLE 4L. Percentage of Undergraduate Credit Hours Taught by
2007-08 2008-09 2009-10 2010-11 2011-12*
Faculty 61% 63% 65% 66% 68%
Adjunct Faculty 22% 20% 18% 16% 13%
Graduate Students 17% 16% 16% 17% 18%
Other Instructors 0% 1% 1% 2% 1%
*Reported figures include USF in Lakeland data
Note: The total number of undergraduate state fundable credit hours taught will be divided by the undergraduate credit hours taught by each instructor type to create a distribution of the percentage taught by each instructor type. Four instructor types are defined as faculty (pay plans 01, 02, and 22), OPS faculty (pay plan 06), graduate student instructors (pay plan 05), and others (all other pay plans). If a course has more than one instructor, then the university’s reported allocation of section effort will determine the allocation of the course’s total credit hours to each instructor. The definition of faculty varies for Tables 4L, 4M and 4N. For Faculty Teaching Undergraduates, the definition of faculty is based on pay plans 01, 02, and 22.
TABLE 4M. Undergraduate Instructional Faculty Compensation
2007-08 2008-09 2009-10 2010-11 2011-12
Average Salary and Benefits for Faculty Who Teach at Least
One Undergraduate Course
$86,795 $89,571 $93,013 $90,520 $91,466
Note: Average salary and benefits for all instructors of undergraduate courses who are on pay plan 22. This amount is based on fall term data only, and to make it more meaningful to the reader we annualize (to a fall + spring amount) the fall-term salary and benefits. It is limited to faculty who taught at least one undergraduate course in the fall term and is reported as employed for at least 0.1 person year in the fall term. The definition of faculty varies for Tables
4L, 4M and 4N. For Undergraduate Instructional Faculty Compensation, the definition of faculty is based on pay plan 22.
TABLE 4N. Student/Faculty Ratio
Fall 2007 Fall 2008 Fall 2009 Fall 2010 Fall 2011*
Ratio 26.8 27.1 27.3 24.0 26.1
*Reported figures include USF in Lakeland data
Note: This data is based on Common Data Set (CDS) definitions. This is the Fall ratio of full-time equivalent students (full-time plus 1/3 part time) to full-time equivalent instructional faculty (full time plus 1/3 part time). In the ratio calculations, exclude both faculty and students in stand-alone graduate or professional programs such as medicine, law, veterinary, dentistry, social work, business, or public health in which faculty teach virtually only graduate-level students. Do not count undergraduate or graduate student teaching assistants as faculty.
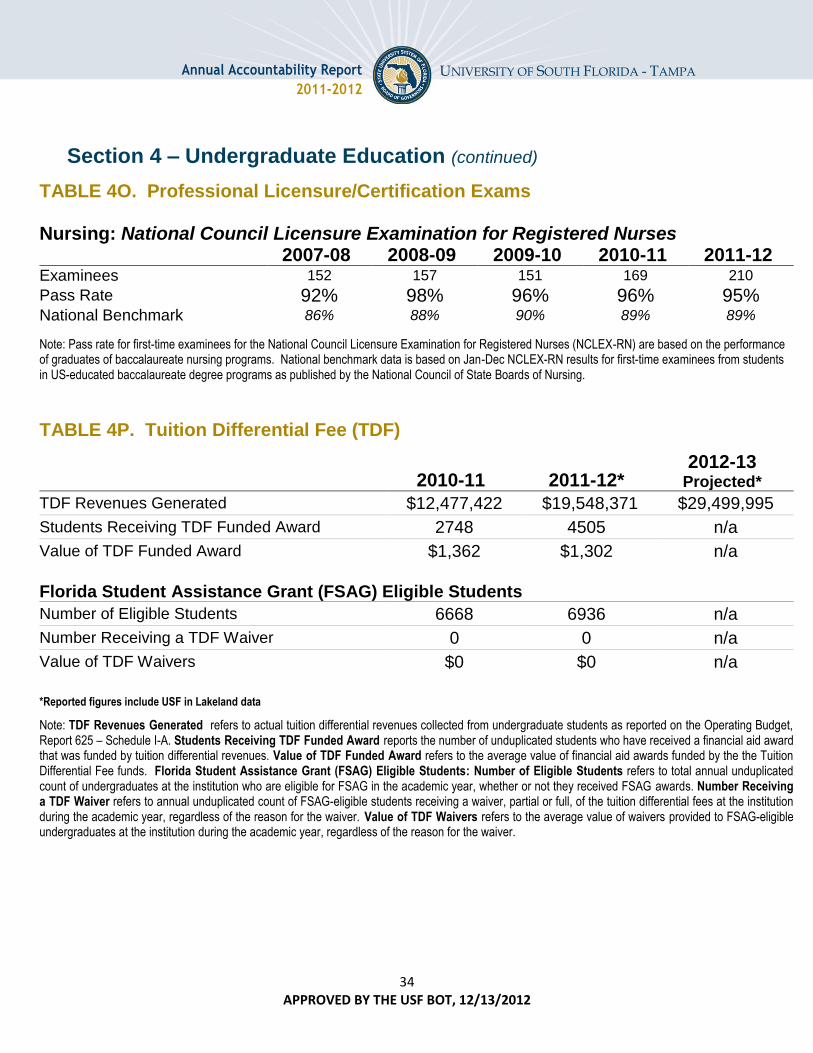
34 APPROVED BY THE USF BOT, 12/13/2012
Annual Accountability Report
2011-2012
UNIVERSITY OF SOUTH FLORIDA - TAMPA
Section 4 – Undergraduate Education (continued)
TABLE 4O. Professional Licensure/Certification Exams
Nursing: National Council Licensure Examination for Registered Nurses
2007-08 2008-09 2009-10 2010-11 2011-12
Examinees 152 157 151 169 210
Pass Rate 92% 98% 96% 96% 95% National Benchmark 86% 88% 90% 89% 89%
Note: Pass rate for first-time examinees for the National Council Licensure Examination for Registered Nurses (NCLEX-RN) are based on the performance of graduates of baccalaureate nursing programs. National benchmark data is based on Jan-Dec NCLEX-RN results for first-time examinees from students in US-educated baccalaureate degree programs as published by the National Council of State Boards of Nursing.
TABLE 4P. Tuition Differential Fee (TDF)
2010-11 2011-12* 2012-13
Projected*
TDF Revenues Generated $12,477,422 $19,548,371 $29,499,995
Students Receiving TDF Funded Award 2748 4505 n/a
Value of TDF Funded Award $1,362 $1,302 n/a
Florida Student Assistance Grant (FSAG) Eligible Students
Number of Eligible Students 6668 6936 n/a
Number Receiving a TDF Waiver 0 0 n/a
Value of TDF Waivers $0 $0 n/a
*Reported figures include USF in Lakeland data
Note: TDF Revenues Generated refers to actual tuition differential revenues collected from undergraduate students as reported on the Operating Budget, Report 625 – Schedule I-A. Students Receiving TDF Funded Award reports the number of unduplicated students who have received a financial aid award that was funded by tuition differential revenues. Value of TDF Funded Award refers to the average value of financial aid awards funded by the the Tuition Differential Fee funds. Florida Student Assistance Grant (FSAG) Eligible Students: Number of Eligible Students refers to total annual unduplicated count of undergraduates at the institution who are eligible for FSAG in the academic year, whether or not they received FSAG awards. Number Receiving a TDF Waiver refers to annual unduplicated count of FSAG-eligible students receiving a waiver, partial or full, of the tuition differential fees at the institution during the academic year, regardless of the reason for the waiver. Value of TDF Waivers refers to the average value of waivers provided to FSAG-eligible undergraduates at the institution during the academic year, regardless of the reason for the waiver.
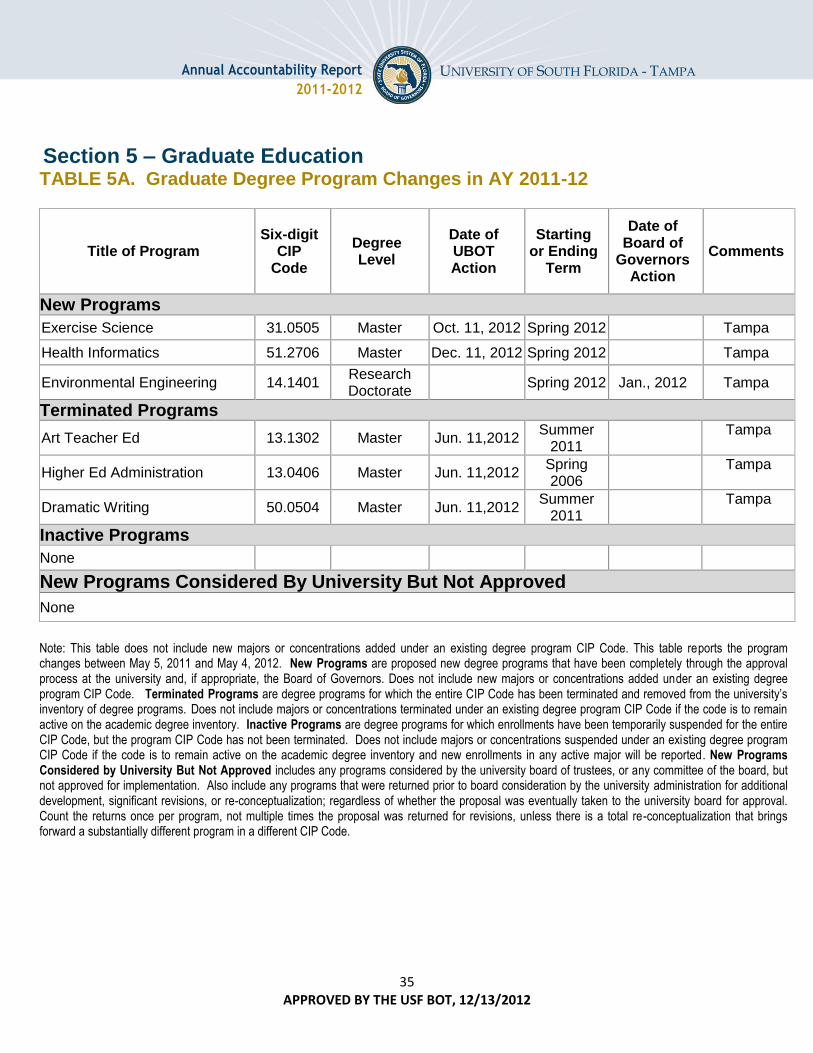
35 APPROVED BY THE USF BOT, 12/13/2012
Annual Accountability Report
2011-2012
UNIVERSITY OF SOUTH FLORIDA - TAMPA
Section 5 – Graduate Education
TABLE 5A. Graduate Degree Program Changes in AY 2011-12
Title of Program
Six-digit
CIP
Code
Degree
Level
Date of
UBOT
Action
Starting
or Ending
Term
Date of
Board of
Governors Action
Comments
New Programs
Exercise Science 31.0505 Master Oct. 11, 2012 Spring 2012 Tampa
Health Informatics 51.2706 Master Dec. 11, 2012 Spring 2012 Tampa
Environmental Engineering 14.1401 Research Doctorate
Spring 2012 Jan., 2012 Tampa
Terminated Programs
Art Teacher Ed 13.1302 Master Jun. 11,2012 Summer
2011
Tampa
Higher Ed Administration 13.0406 Master Jun. 11,2012 Spring 2006
Tampa
Dramatic Writing 50.0504 Master Jun. 11,2012 Summer
2011
Tampa
Inactive Programs
None
New Programs Considered By University But Not Approved
None
Note: This table does not include new majors or concentrations added under an existing degree program CIP Code. This table reports the program changes between May 5, 2011 and May 4, 2012. New Programs are proposed new degree programs that have been completely through the approval process at the university and, if appropriate, the Board of Governors. Does not include new majors or concentrations added under an existing degree program CIP Code. Terminated Programs are degree programs for which the entire CIP Code has been terminated and removed from the university’s inventory of degree programs. Does not include majors or concentrations terminated under an existing degree program CIP Code if the code is to remain active on the academic degree inventory. Inactive Programs are degree programs for which enrollments have been temporarily suspended for the entire CIP Code, but the program CIP Code has not been terminated. Does not include majors or concentrations suspended under an existing degree program CIP Code if the code is to remain active on the academic degree inventory and new enrollments in any active major will be reported. New Programs Considered by University But Not Approved includes any programs considered by the university board of trustees, or any committee of the board, but not approved for implementation. Also include any programs that were returned prior to board consideration by the university administration for additional development, significant revisions, or re-conceptualization; regardless of whether the proposal was eventually taken to the university board for approval. Count the returns once per program, not multiple times the proposal was returned for revisions, unless there is a total re-conceptualization that brings forward a substantially different program in a different CIP Code.
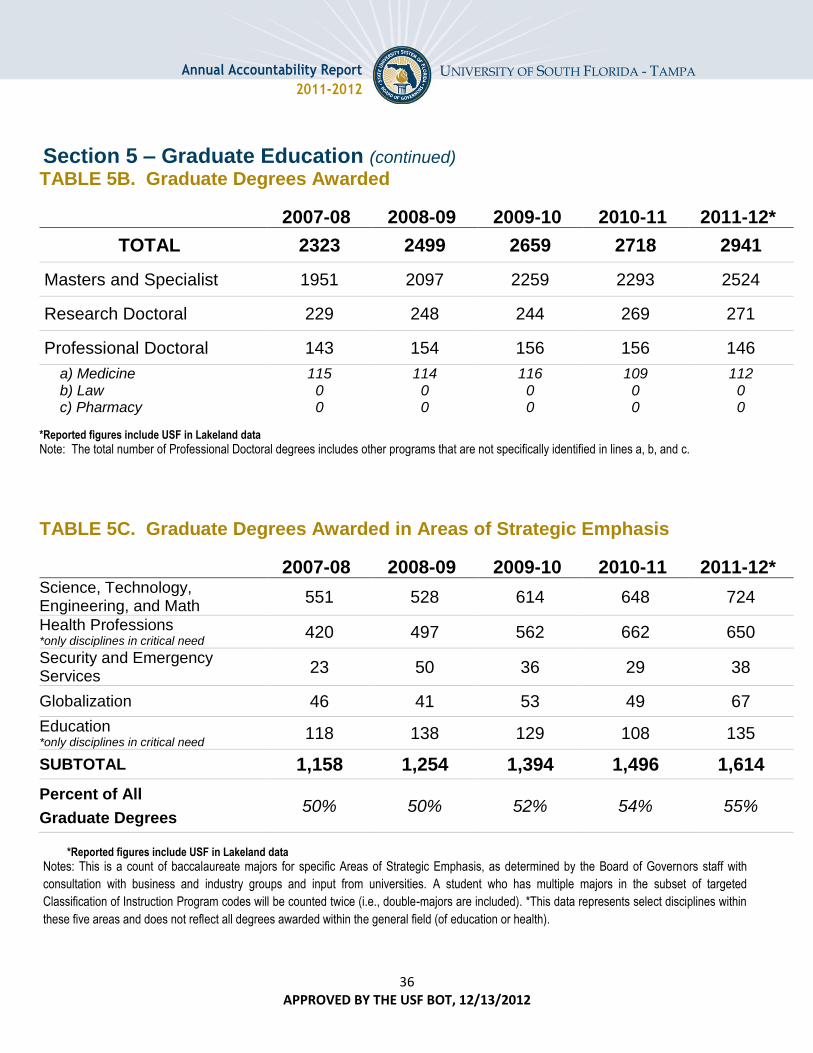
36 APPROVED BY THE USF BOT, 12/13/2012
Annual Accountability Report
2011-2012
UNIVERSITY OF SOUTH FLORIDA - TAMPA
Section 5 – Graduate Education (continued)
TABLE 5B. Graduate Degrees Awarded
2007-08 2008-09 2009-10 2010-11 2011-12*
TOTAL 2323 2499 2659 2718 2941
Masters and Specialist 1951 2097 2259 2293 2524
Research Doctoral 229 248 244 269 271
Professional Doctoral 143 154 156 156 146
a) Medicine 115 114 116 109 112 b) Law 0 0 0 0 0 c) Pharmacy 0 0 0 0 0
*Reported figures include USF in Lakeland data
Note: The total number of Professional Doctoral degrees includes other programs that are not specifically identified in lines a, b, and c.
TABLE 5C. Graduate Degrees Awarded in Areas of Strategic Emphasis
2007-08 2008-09 2009-10 2010-11 2011-12*
Science, Technology, Engineering, and Math
551 528 614 648 724
Health Professions *only disciplines in critical need 420 497 562 662 650
Security and Emergency Services
23 50 36 29 38
Globalization 46 41 53 49 67
Education *only disciplines in critical need 118 138 129 108 135
SUBTOTAL 1,158 1,254 1,394 1,496 1,614
Percent of All
Graduate Degrees 50% 50% 52% 54% 55%
*Reported figures include USF in Lakeland data
Notes: This is a count of baccalaureate majors for specific Areas of Strategic Emphasis, as determined by the Board of Governors staff with
consultation with business and industry groups and input from universities. A student who has multiple majors in the subset of targeted
Classification of Instruction Program codes will be counted twice (i.e., double-majors are included). *This data represents select disciplines within
these five areas and does not reflect all degrees awarded within the general field (of education or health).
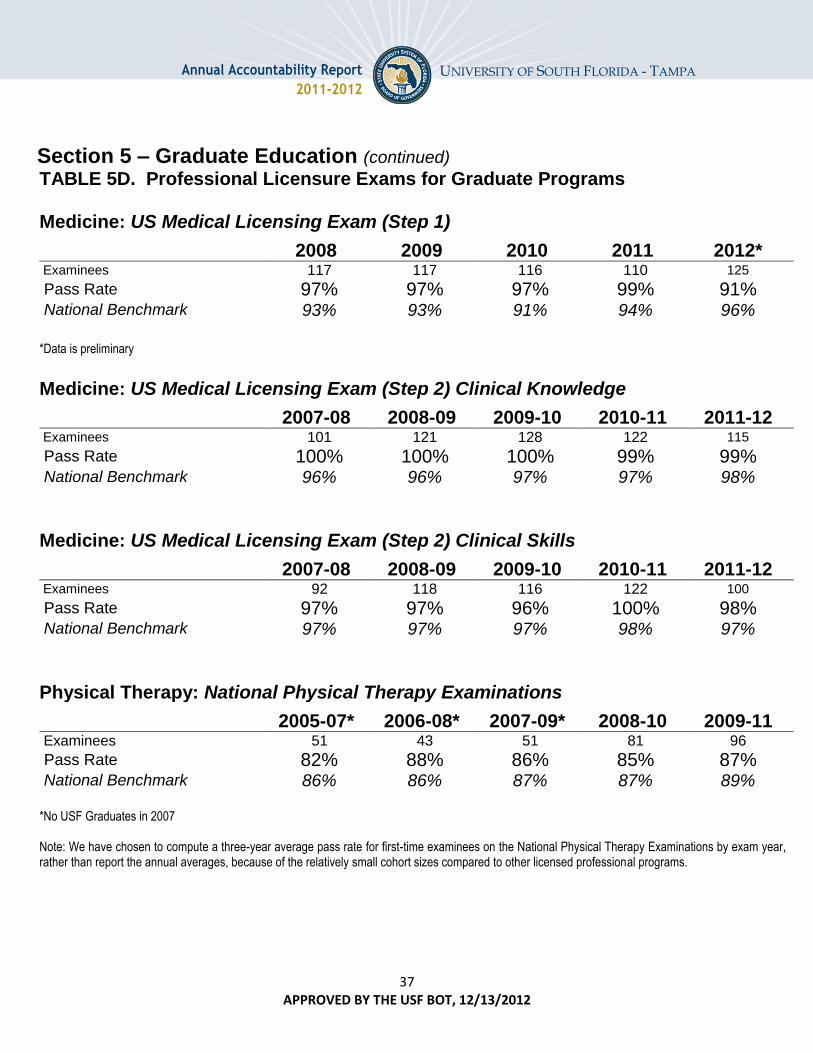
37 APPROVED BY THE USF BOT, 12/13/2012
Annual Accountability Report
2011-2012
UNIVERSITY OF SOUTH FLORIDA - TAMPA
Section 5 – Graduate Education (continued)
TABLE 5D. Professional Licensure Exams for Graduate Programs
Medicine: US Medical Licensing Exam (Step 1)
2008 2009 2010 2011 2012*
Examinees 117 117 116 110 125
Pass Rate 97% 97% 97% 99% 91% National Benchmark 93% 93% 91% 94% 96%
*Data is preliminary
Medicine: US Medical Licensing Exam (Step 2) Clinical Knowledge
2007-08 2008-09 2009-10 2010-11 2011-12
Examinees 101 121 128 122 115
Pass Rate 100% 100% 100% 99% 99% National Benchmark 96% 96% 97% 97% 98%
Medicine: US Medical Licensing Exam (Step 2) Clinical Skills
2007-08 2008-09 2009-10 2010-11 2011-12
Examinees 92 118 116 122 100
Pass Rate 97% 97% 96% 100% 98% National Benchmark 97% 97% 97% 98% 97%
Physical Therapy: National Physical Therapy Examinations
2005-07* 2006-08* 2007-09* 2008-10 2009-11
Examinees 51 43 51 81 96
Pass Rate 82% 88% 86% 85% 87% National Benchmark 86% 86% 87% 87% 89% *No USF Graduates in 2007 Note: We have chosen to compute a three-year average pass rate for first-time examinees on the National Physical Therapy Examinations by exam year, rather than report the annual averages, because of the relatively small cohort sizes compared to other licensed professional programs.

38 APPROVED BY THE USF BOT, 12/13/2012
Annual Accountability Report
2011-2012
UNIVERSITY OF SOUTH FLORIDA - TAMPA
Section 6 – Research and Economic Development
TABLE 6A. Research and Development
2006-07 2007-08 2008-09 2009-10 2010-11
R&D Expenditures
Total ($ 1,000s)
Data reported at the USF System level.
$385,029 $394,963
Federally Funded ($ 1,000s)
$243,017 $243,030
Percent Funded From External Sources
79% 78%
Total R&D Expenditures Per Full-Time, Tenured, Tenure-Earning Faculty Member ($)
$363,921 $394,963
Technology Transfer
Invention Disclosures 110 139 141 161 172
U.S. Patents Issued 31 31 36 66 91
Patents Issued Per 1,000 Full-Time, Tenured and Tenure-Earning Faculty
26 26 28 52 80
Licenses/ Options Executed 23 28 25 37 36
Licensing Income Received ($)
$2,099,712 $1,831,000 $1,300,000 $17,411,625 $1,390,871
Number of Start-Up Companies
4 5 3 5 8
Note: R&D Expenditures are based on the National Science Foundation’s annual Survey of R&D Expenditures at Universities and Colleges (data include Science & Engineering and non-Science & Engineering awards). Percent Funded from External Sources is defined as funds from federal, private industry and other sources (non-state and non-institutional funds). Total R&D expenditures are divided by fall, full-time tenured/tenure-track faculty as reported to IPEDS (FGCU includes both tenured/tenure-track and non-tenure/track faculty). The fall faculty year used will align with the beginning of the fiscal year, so that (e.g.) 2007 FY R&D expenditures are divided by fall 2006 faculty. Technology Transfer data are based on the Association of University Technology Managers Annual Licensing Survey. Licensing Income Received refers to license issue fees, payments under options, annual minimums, running royalties, termination payments, amount of equity received when cashed-in, and software and biological material end-user license fees of $1,000 or more, but not research funding, patent expense reimbursement, valuation of equity not cashed-in, software and biological material end-user license fees of less than $1,000, or trademark licensing royalties from university insignia. Number of Start-up Companies that were dependent upon the licensing of University technology for initiation.
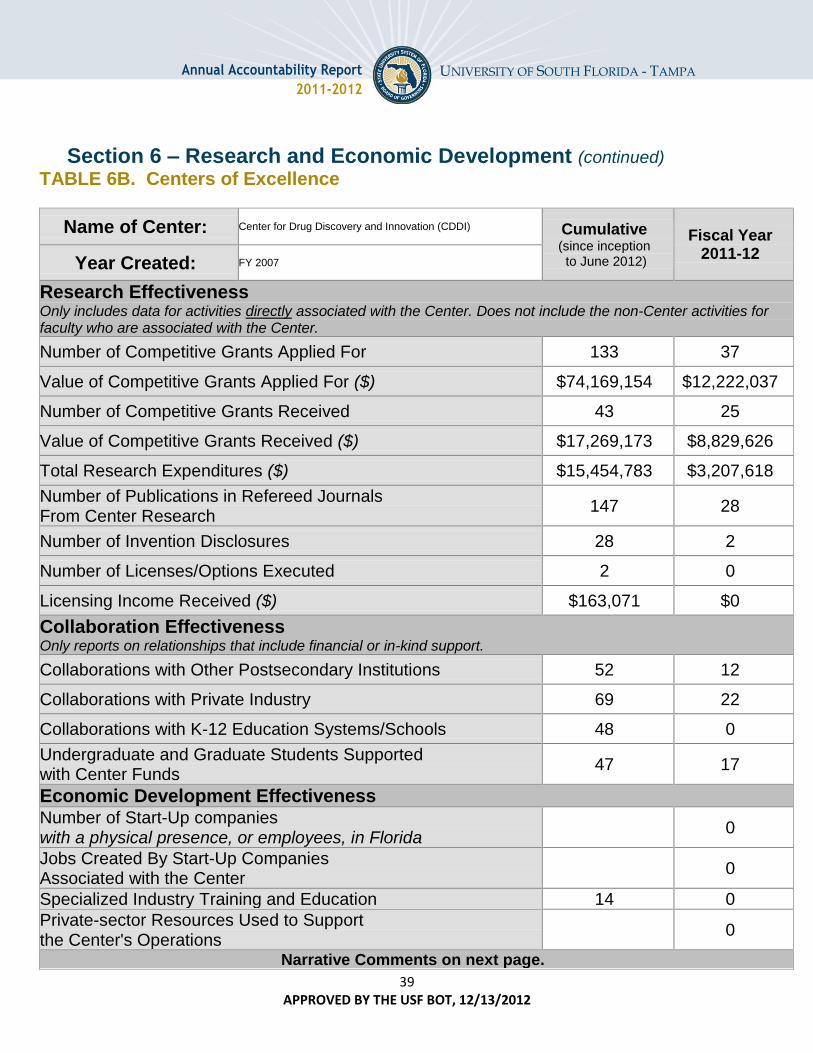
39 APPROVED BY THE USF BOT, 12/13/2012
Annual Accountability Report
2011-2012
UNIVERSITY OF SOUTH FLORIDA - TAMPA
Section 6 – Research and Economic Development (continued)
TABLE 6B. Centers of Excellence
Name of Center: Center for Drug Discovery and Innovation (CDDI) Cumulative
(since inception
to June 2012)
Fiscal Year
2011-12 Year Created: FY 2007
Research Effectiveness
Only includes data for activities directly associated with the Center. Does not include the non-Center activities for faculty who are associated with the Center.
Number of Competitive Grants Applied For 133 37
Value of Competitive Grants Applied For ($) $74,169,154 $12,222,037
Number of Competitive Grants Received 43 25
Value of Competitive Grants Received ($) $17,269,173 $8,829,626
Total Research Expenditures ($) $15,454,783 $3,207,618
Number of Publications in Refereed Journals
From Center Research 147 28
Number of Invention Disclosures 28 2
Number of Licenses/Options Executed 2 0
Licensing Income Received ($) $163,071 $0
Collaboration Effectiveness
Only reports on relationships that include financial or in-kind support.
Collaborations with Other Postsecondary Institutions 52 12
Collaborations with Private Industry 69 22
Collaborations with K-12 Education Systems/Schools 48 0
Undergraduate and Graduate Students Supported
with Center Funds 47 17
Economic Development Effectiveness
Number of Start-Up companies
with a physical presence, or employees, in Florida 0
Jobs Created By Start-Up Companies
Associated with the Center 0
Specialized Industry Training and Education 14 0
Private-sector Resources Used to Support
the Center's Operations 0
Narrative Comments on next page.
40 APPROVED BY THE USF BOT, 12/13/2012
Annual Accountability Report
2011-2012
UNIVERSITY OF SOUTH FLORIDA - TAMPA
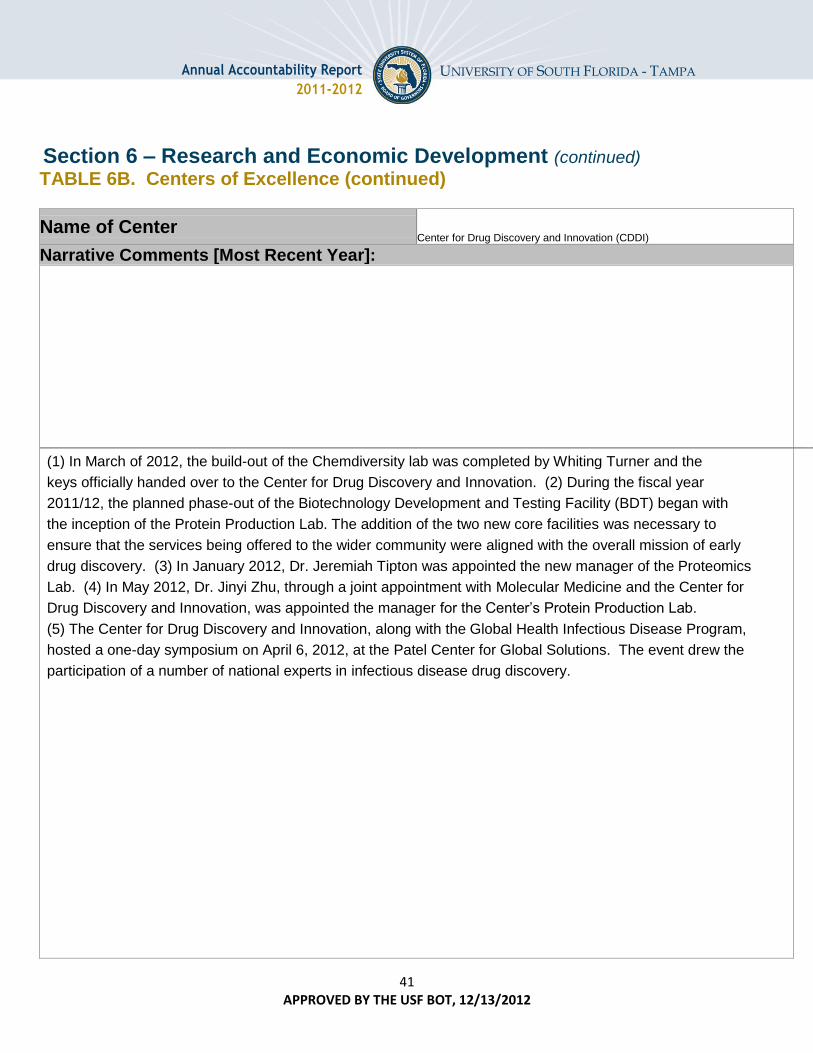
41 APPROVED BY THE USF BOT, 12/13/2012
Annual Accountability Report
2011-2012
UNIVERSITY OF SOUTH FLORIDA - TAMPA
Section 6 – Research and Economic Development (continued)
TABLE 6B. Centers of Excellence (continued)
Name of Center Center for Drug Discovery and Innovation (CDDI)
Narrative Comments [Most Recent Year]:
(1) In March of 2012, the build-out of the Chemdiversity lab was completed by Whiting Turner and the (1) In March of 2012, the build out of the Chemdiversity lab was completed by Whiting Turner and the
keys officially handed over to the Center for Drug Discovery and Innovation. (2) During the fiscal year keys officially handed over to the Center for Drug Discovery and Innovation. (2) During the fiscal year
2011/12, the planned phase-out of the Biotechnology Development and Testing Facility (BDT) began with 2011/12, the planned phase-out of the Biotechnology Development and Testing Facility (BDT) began with
the inception of the Protein Production Lab. The addition of the two new core facilities was necessary to the inception of the Protein Production Lab. The addition of the two new core facilities
ensure that the services being offered to the wider community were aligned with the overall mission of early was necessary to ensure that the services being offered to the wider community was aligned with the
drug discovery. (3) In January 2012, Dr. Jeremiah Tipton was appointed the new manager of the Proteomics overall mission of early drug discovery. (3) In January 2012, Dr. Jeremiah Tipton was appointed the new
Lab. (4) In May 2012, Dr. Jinyi Zhu, through a joint appointment with Molecular Medicine and the Center for manager of the Proteomics Lab. (4) In May 2012, Dr. Jinyi Zhu, through a joint appointment with
Drug Discovery and Innovation, was appointed the manager for the Center’s Protein Production Lab. Molecular Medicine and the Center for Drug Discovery and Innovation, was appointed the manager
(5) The Center for Drug Discovery and Innovation, along with the Global Health Infectious Disease Program, for the center's Protein Production Lab. (5) The Center for Drug Discovery and Innovation, along
hosted a one-day symposium on April 6, 2012, at the Patel Center for Global Solutions. The event drew the with the Global Health Infectious Disease Program, hosted a one-day symposium on April 6, 2012, at the
participation of a number of national experts in infectious disease drug discovery. Patel Center for Global Solutions. The event drew the participation of a number of national experts in infectious disease drug discovery.

42 APPROVED BY THE USF BOT, 12/13/2012
Annual Accountability Report
2011-2012
UNIVERSITY OF SOUTH FLORIDA - TAMPA

43 APPROVED BY THE USF BOT, 12/13/2012
Annual Accountability Report
2011-2012
UNIVERSITY OF SOUTH FLORIDA - TAMPA
Section 6 – Research and Economic Development (continued)
TABLE 6C. State University Research Commercialization Assistance Grants
Project Name by Type of Grant
Year Grant
Awarded
Cumulative
Awards Expenditures
Phase I Grants
Phase II Grants
Phase III Grants
MDI Partners, LLC FY 2011 $185,000 $124,727
Rehab Ideas, Inc. FY 2011 $150,000 $149,994
Natura Therapeutics, Inc. FY 2011 $65,000 $58,500
Total for all SURCAG Grants $400,000 $333,221
Narrative Comments: For each project, provide a brief update on (1) the project’s progress towards completing its key milestones/deliverables; and (2) the project’s return on investment for the university and state.
Phase III Grants MDI Partners: The overall goal for this grant was to finalize the design of the speculum sheath, gear up for manufacturing, submit an application for FDA approval, and ultimately get commercial product on the market. In support of this goal and milestones proposed in the grant, MDI designed and built the beta prototypes. The initial user preference clinical study was completed, and a follow-on effectiveness study was initiated in 136 patients. The 510k submission is planned for December 2012, with market launch anticipated by December 2013. Rehab Ideas: The overall goal for this grant was to commercialize five innovative products designed specifically for individuals with disabilities including the Mobili-T Rover, Backpack Retriever, TrayAway, Folding Crutch and Sideways Wheelchair Kit. In further support of this goal and milestones proposed in the grant, Rehab Ideas improved the Mobili-T Rover design, produced several units, and showcased the Rover at an international conference. Marketing efforts continue to grow sales in Backpack Retriever, and TrayAway. A prototype Folding Crutch was made, and tooling for manufacturing is pending. The Sideways Wheelchair Kit project was discontinued due to potential stability issues. Natura Therapeutics: Natura’s overall goal for this grant was to develop and commercialize a combination product for supporting cellular health and weight loss, NutraStem®Slim. In support of this goal and the milestones proposed in the grant, Natura established a single dosage that was beneficial for stem cell health and for promoting weight loss. A peer reviewed scientific manuscript is in progress. Finished product manufacturing is projected to begin June
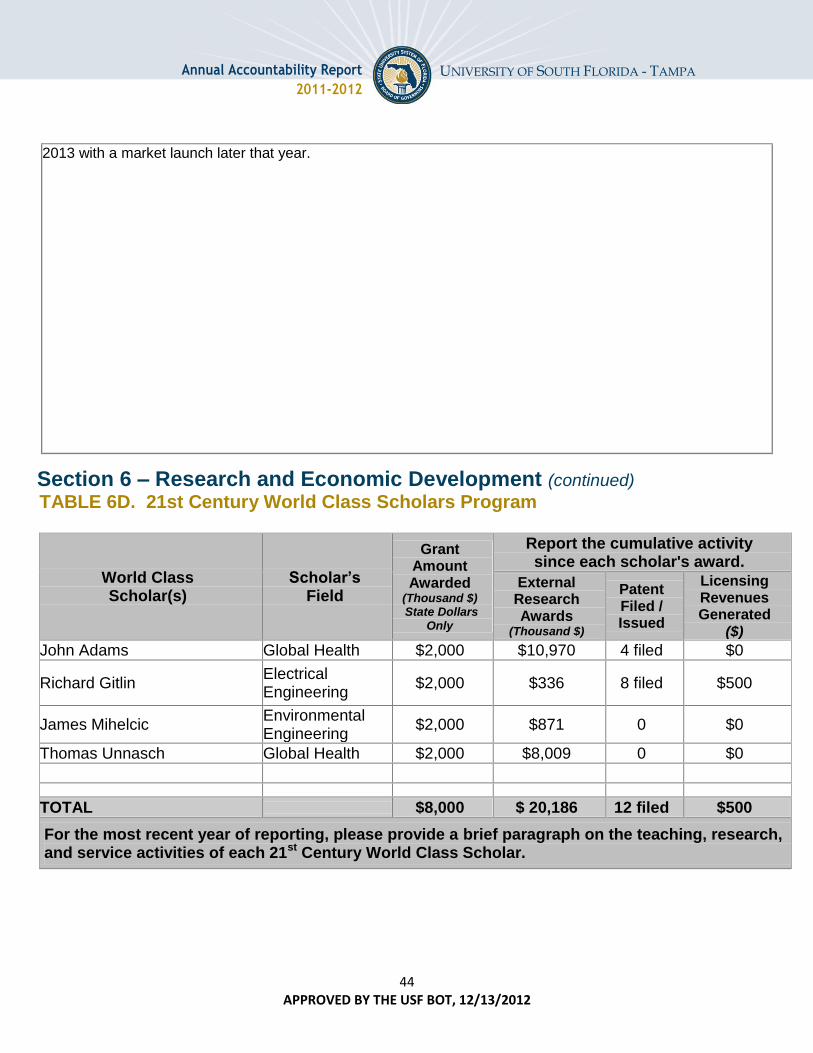
44 APPROVED BY THE USF BOT, 12/13/2012
Annual Accountability Report
2011-2012
UNIVERSITY OF SOUTH FLORIDA - TAMPA
2013 with a market launch later that year.
Section 6 – Research and Economic Development (continued)
TABLE 6D. 21st Century World Class Scholars Program
World Class Scholar(s)
Scholar’s Field
Grant Amount
Awarded
(Thousand $) State Dollars
Only
Report the cumulative activity
since each scholar's award.
External Research Awards
(Thousand $)
Patent Filed / Issued
Licensing Revenues Generated
($)
John Adams Global Health $2,000 $10,970 4 filed $0
Richard Gitlin Electrical Engineering
$2,000 $336 8 filed $500
James Mihelcic Environmental Engineering
$2,000 $871 0 $0
Thomas Unnasch Global Health $2,000 $8,009 0 $0
TOTAL $8,000 $ 20,186 12 filed $500
For the most recent year of reporting, please provide a brief paragraph on the teaching, research, and service activities of each 21st Century World Class Scholar.
45 APPROVED BY THE USF BOT, 12/13/2012
Annual Accountability Report
2011-2012
UNIVERSITY OF SOUTH FLORIDA - TAMPA
Dr. John Adams, Professor of Global Health, came to USF in May 2007 from the University of Notre Dame’s Center for Tropical Disease Research and Training, where he made important advances in malaria genetics and vaccine development. A devastating disease, malaria is a major economic drain in affected countries and leads to severe anemia and death in young children and pregnant women. Dr. Adams’ laboratory studies protein ligands that help malaria parasites bind to a person’s red blood cell wall, beginning a cascade of replication that leads to the massive destruction of oxygen-carrying red blood cells. He was issued U.S. patents for two of these proteins because of their potential use in a malaria vaccine. With the support of grants from the National Institutes of Health (NIH), Dr. Adams is using advanced analytic technologies to pursue effective vaccine and mosquito-based therapies to prevent malaria caused by Plasmodium vivax and P. falciparum, the most common types of malaria. Dr. Adams oversees the Vector-Borne Pathogen Laboratory, or insectary, where researchers will study the complex life cycle of the malaria parasite transmitted by mosquitoes. Dr. Adams currently serves as Editor of Infection & Immunity, and is active on the USF Graduate Council, as well as the Tenure & Promotion Committees in his department and college. He currently sponsors 4 postdoctoral and 4 predoctoral scholars and has provided undergraduate research experiences for more than 50 students, including honors students. Dr. Adams has published more than 90 referred publications and actively collaborates with USF-affiliate Draper Laboratory.
Dr. Richard D. Gitlin, Agere Systems Chair Distinguished Professor of Electrical Engineering, has more than 40 years of leadership in the communications and networking industry, directing pioneering research and development in digital communications, broadband networking, and wireless systems. Since joining USF in 2008, he has focused on the synergies between advanced communications technologies and bio-medical systems by investigating the potential for wireless networking of in vivo miniature wirelessly controlled devices to enable a paradigm shift in Minimally Invasive Surgery (MIS). This research has produced nine papers, four patent filings, and two NSF grants. The system patent for advancing MIS surgery has just been allowed and should become a dominant patent in this domain. Dr. Gitlin is involved with a USF start-up company, Innovatia Medical Systems, which was formed to support and commercialize the work of Dr. Gitlin’s Miniature Anchored Remote Videoscope for Expedited Laparoscopy (MARVEL) research team comprised of engineering students. Dr. Gitlin has updated and taught the following graduate level courses at USF: EEL6534 Digital Communications, EEL6545 Random Processes, and EEL6597 Wireless Networking. Dr. Gitlin’s USF service activities include: Member, USF Board of Trustees working group on Audit and Finance (2008-2011); Member, USF System Strategic Planning Committee (2010-2011); Chair, EE Department Personnel Committee (2009-2011); Chair, EE Department Academic Affairs Committee (2012-); and Executive Committee, USF Chapter of the National Academy of Inventors (2012-).
James R. Mihelcic is Professor of Civil and Environmental Engineering, where he directs the Peace Corps Master’s International Program in Civil & Environmental Engineering. Dr. Mihelcic is a member of the EPA Chartered Science Advisory Board and a Board Certified Environmental Engineering Member and Board Trustee of the American Academy of Environmental Engineers (AAEE). He is lead author for three textbooks: Fundamentals of Environmental Engineering (John Wiley & Sons, 1999); Field Guide in Environmental Engineering for Development Workers: Water, Sanitation, Indoor Air (ASCE Press, 2009); and Environmental Engineering: Fundamentals, Sustainability, Design (John Wiley & Sons, 2010). His areas of interest are sustainability, impact of anthropogenic stressors on water resources, water supply, and wastewater treatment, water, and sanitation in the developing world, engineering education. His research is currently supported by externally funded research from the National Science Foundation, U.S. Agency for International Development, WateReuse Foundation, and CARE Madagascar. Dr. Mihelcic teaches courses at USF in environmental engineering, sustainable development engineering, aquatic chemistry, and professionalism and ethics. He has conducted university service related to development of the master’s degree in Global Sustainability and led efforts that created the Ph.D. Environmental Engineering degree. At the department level, he has led or served on committees for new faculty searches, engineering ABET accreditation, and faculty promotion and tenure.
46 APPROVED BY THE USF BOT, 12/13/2012
Annual Accountability Report
2011-2012
UNIVERSITY OF SOUTH FLORIDA - TAMPA
Dr. Thomas Unnasch is the Department Chair and Professor in the Department of Global Health. Dr. Unnasch directs the Global Health Infectious Diseases Research (GHIDR) program’s Biosafety Level 3 (BSL-3) Laboratory, which primarily houses his team’s work with Eastern equine encephalitis virus (EEEV). He is a leading authority on the ecology of EEEV and other encephalitis viruses such as the West Nile virus. His research has focused upon vector-borne diseases and the human filarial infections. The laboratory concentrates upon research areas that have a direct impact upon disease control and elimination programs targeting vector-borne pathogens worldwide. The laboratory has been instrumental in the development of molecular-based methods for the detection of the river blindness parasite Onchocerca volvulus both in humans and in its black-fly vector. He and his team are also working closely with collaborators in Africa and Latin America to develop spatial models to predict zones that are at risk for onchocerciasis using remote sensing data, and to develop more efficient methods for the collection of vector blackflies to monitor transmission of onchocerciasis. In the field of arboviral infections, the laboratory is studying the ecology of Eastern Equine Encephalitis virus (EEEV) in the Southeastern USA, concentrating on elucidating the dynamic processes in the host-vector relationship that are drivers in the development of EEEV enzootics and epidemics. This work has recently been featured in stories in the New York Times, Science Direct, and MSNBC. The ultimate goal of these studies is to develop a predictive model for habitats that are most likely to represent EEEV enzootic foci. Such a model could be used to target most efficiently the surveillance and vector control efforts of the mosquito control programs throughout Florida and the Southeastern USA. Dr. Unnasch has served as the co-Director for the Center of Biological Defense at USF and on numerous College-wide leadership committees, including the Dean’s Research Advisory committee, the College Appointment, Promotion and Awards Committee, and various admission committees. Dr. Unnasch serves a leadership role in numerous national and international organizations, including the Board of Directors of the Florida Mosquito Control Association, the Mectizan Donation Committee and the Chair of Uganda’s Expert Advisory Committee for Onchocerciasis Elimination. He serves on the editorial boards of several peer-reviewed journals and is the editor in chief of Research Reports in Tropical Medicine. Dr. Unnasch has supervised many MSPH and PhD students; is course director for PHC 6561 Laboratory Techniques in Public Health, PHC 6934 Tools of Research: Laboratory Rotations, PHC 7931 Advanced Interdisciplinary Seminar: Current Topics in Global Health Infectious Disease Research; and serves as a guest lecturer in numerous classes in the College of Public Health and School of Medicine.