dedication - university of south florida
TRANSCRIPT

Assessing Paleo-Coastal Caves Evolution and Sea Level Changes in Mallorca:
Results from Radiometric Dating of Speleothems
by
Giuseppe Lucia
A thesis submitted in partial fulfillment
of the requirements for the degree of
Master of Science in Geology
School of Geosciences
College of Arts and Sciences
University of South Florida
Major Professor: Bogdan P. Onac, Ph.D.
Joan J. Fornós, Ph.D.
Victor J. Polyak, Ph.D.
Ping Wang, Ph.D.
Date of Approval:
March 19, 2019
Keywords: Karst Geomorphology, Paleokarst, Flowstones, Stalagmites, U-series
Copyright © 2019, Giuseppe Lucia

DEDICATION
To my family, for the love and support essential in my life. To the ‘Free World Riders’,
because without them I could not be the person I am. Love you all.

ACKNOWLEDGEMENTS
The research was funded by a collaborative National Science Foundation grant AGS
1602670 to Bogdan P. Onac and Victor J. Polyak.
I am deeply grateful to Bogdan for his guidance and support over these two years. Special
thanks to Victor for his patience and crucial help during the U-series analyses and to the
improvements of the manuscript. Joan J. Fornós and Joaquín Ginés are acknowledged for their
logistic and assistance during sampling campaigns and the suggestions to enhance the thesis. I
would also like to thank my colleague Oana Dumitru for her help with the lab work and
encouragement over the last period of writing. I am also thankful to Viorel Atudorei for his support
during my stay in Albuquerque, NM. Thanks to my colleagues Oana, Robert, Abby, Daniel,
Dylan, Isidoros, and my roommates Renato and Hari for their moral support and the great time
spent together over these two years.
I would like to thank my family and friends in Italy and my American relatives for their
love and help that is extremely important to me. Finally, I am grateful to Jo De Waele who
introduced me to the fascinating underground realm.

i
TABLE OF CONTENTS
List of Tables ................................................................................................................................. iii
List of Figures ................................................................................................................................ iv
Abstract ............................................................................................................................................x
Chapter One: Introduction ...............................................................................................................1
1.1 Aim of the Research.......................................................................................................3
1.2 Thesis Structure .............................................................................................................3
Chapter Two: Background ...............................................................................................................4
2.1 Study Area Description ..................................................................................................4
2.1.1 Geographic and Geomorphologic Settings .....................................................4
2.1.2 Climate ............................................................................................................6
2.1.3 Geologic Settings ...........................................................................................6
2.1.4 Mallorcan Karst: Speleogenetic Processes and Cave Types...........................8
2.1.5 Paleokarst Features: Structural and Morphogenetic Aspects .............................. 11
2.2 U-Th-Pb Geochronology of Speleothems ....................................................................15
2.2.1 U, Th, and Pb in Natural Environments ........................................................15
2.2.2 Overview of Radioactive Decay Mechanisms and Laws .............................16
2.2.3 U-Th-Pb Decay Systems and Dating Methods .............................................18
2.2.4 U-Pb Age Determination Methods ........................................................... 20
2.2.5 Previous U-Pb Dating Studies of Speleothems ......................................... 21
2.2.6 U-series Age Determination ..................................................................... 24
2.2.7 Previous U-series Investigations of Secondary Cave Deposits ....................25
2.3 Oxygen and Carbon Isotope Geochemistry of Speleothems .......................................25
Chapter Three: Materials and Methods ..........................................................................................27
3.1 Investigation Sites and Samples Description ...............................................................27
3.2 U-series and U-Pb Dating Analyses ..................................................................................... 35
3.2.1 Samples Preparation............................................................................................... 35
3.2.2 Chemical Procedures ............................................................................................. 35
3.2.3 Analytical Methods .............................................................................. 37
3.2.4 Data Processing, Age Models and Calculations ........................................ 38
3.3 Oxygen and Carbon Isotopic Analysis ........................................................................39

ii
Chapter Four: Results ....................................................................................................................41
4.1 Cala Falcó ............................................................................................................................... 41
4.1.1 Stalagmite CF-11 ...................................................................................... 43 4.2 Dimoni .................................................................................................................................... 46 4.3 Sa Ferradura ............................................................................................................................ 47
4.4 Na Mitjana ........................................................................................................................ 48 4.4.1 Sample MIP-5 ........................................................................................... 50
4.5 Coves del Drac ........................................................................................................ 51 4.5.1 Speleothem DR-D20 ................................................................................. 51
4.6 U-series Systematics and Ages of Investigated Speleothems ......................................52
Chapter Five: Discussion ...............................................................................................................55
5.1 Mallorcan Coastal Karst and Relative Sea Level Changes over the Past
750 kyr .........................................................................................................................55
5.1.1 Cala Falcó Paleo-cave ...................................................................................62
5.1.2 Sa Ferradura and Dimoni Paleokarst ............................................................64
5.1.3 Na Mitjana Paleokarst ...................................................................................67
5.2 Constraining Relative Sea Level Maximum in Mallorca during the MIS 7 ................69
5.3 MIS 5b/5a Transition and MIS 5a Sea Level Highstand in Mallorca..........................73
Chapter Six: Conclusions ...............................................................................................................79
References ......................................................................................................................................82
Appendix A: Data ..........................................................................................................................96
Appendix B: Copyright Permissions ...........................................................................................103

iii
LIST OF TABLES
Table A1. U-series dataset and ages of the samples in this study.................................................97
Table A2. U-Pb data for the flowstone FE-1-A ............................................................................98
Table A3. Carbon and Oxygen isotopic data for CF-11 stalagmite ..............................................99
Table A4. Age-depth model dataset for CF-11 stalagmite generated from StalAge
Algorithm (Scholz & Hoffmann, 2011) .......................................................................101

iv
LIST OF FIGURES
Figure 1. Localization of Mallorca Island in the western Mediterranean. It is visible the
structural alignment NE-SW of the Balearic Promontory and the surrounding
basins. Image modified from Google Earth ....................................................................5
Figure 2. Simplified geological map of Mallorca showing the principal morphostructural
and stratigraphic units (modified from Fornós et al., 2019) ...........................................7
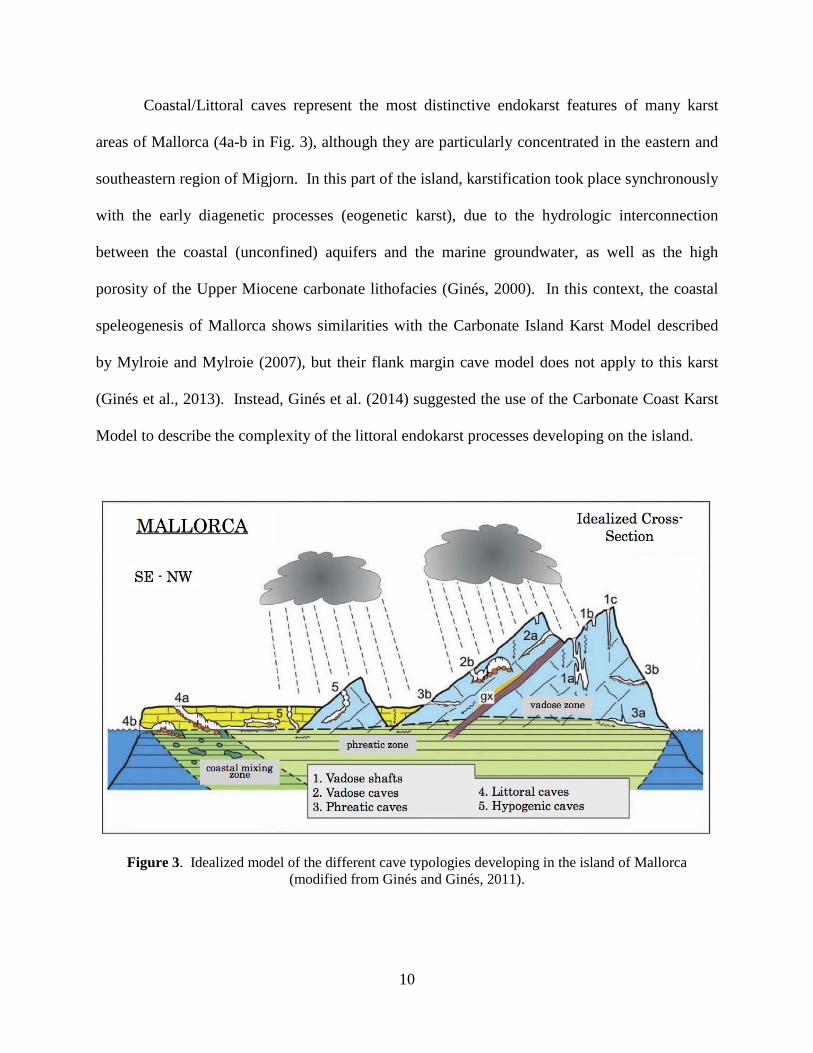
Figure 3. Idealized model of the different cave typologies developing in the island of
Mallorca (modified from Ginés and Ginés, 2011) ........................................................10
Figure 4. A) Schematic summary of the paleokarst development in the Upper Miocene
limestones (modified from Fornós, 1999). Syn-sedimentary paleokarst
structures: B) The eastern coastal zone of Portocolom village, and C) Punta
des Savinar (Mondragó). Post-sedimentary paleokarst features: D) Littoral
area near the entrance of Cova del Dimoni (Porto Cristo), and E) Cova des
Pont (Manacor) (photo credit: B.P. Onac) ............................................................ 13
Figure 5. Morphological evolution of paleokarst structures in the eastern coastal region
of Mallorca (Solimina, Mondragó Natural Park) (photo credit: J.G. Ginés)
(see text for explanations) .............................................................................................14
Figure 6. Uranium (green), Actinium (yellow), and Thorium (orange) decay series.
Intermediate radioactive daughter and half-lives (>10 years) are shown.
Decay constants of 238U, 235U, and 232Th are dispayed (from Schoene, 2014)..............18
Figure 7. Map of Mallorca showing the location of the sampling sites: Cala Falcó (CF),
Coves del Drac (DR), Dimoni (DIP), sa Ferradura (FE), and na Mitjana (MIP).
All locations are color coded.........................................................................................27
Figure 8. Cala Falcó site: A) Overview of the cala and the cave entrance; B) Panorama of
the paleokarst structure outcropping on the cliff; C-E) Close up of the sampling
points (photo credits: B.P. Onac & J. McIlrath) ...........................................................28
v
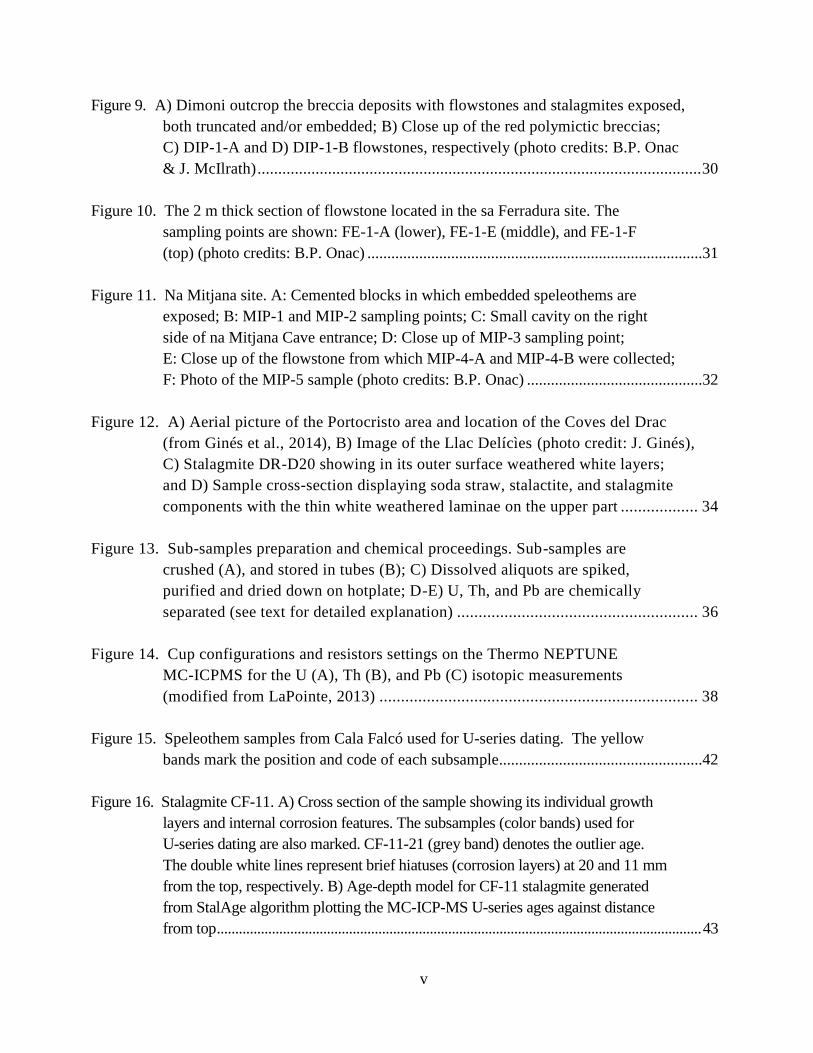
Figure 9. A) Dimoni outcrop the breccia deposits with flowstones and stalagmites exposed,
both truncated and/or embedded; B) Close up of the red polymictic breccias;
C) DIP-1-A and D) DIP-1-B flowstones, respectively (photo credits: B.P. Onac
& J. McIlrath) ........................................................................................................... 30
Figure 10. The 2 m thick section of flowstone located in the sa Ferradura site. The
sampling points are shown: FE-1-A (lower), FE-1-E (middle), and FE-1-F
(top) (photo credits: B.P. Onac) ....................................................................................31
Figure 11. Na Mitjana site. A: Cemented blocks in which embedded speleothems are
exposed; B: MIP-1 and MIP-2 sampling points; C: Small cavity on the right
side of na Mitjana Cave entrance; D: Close up of MIP-3 sampling point;
E: Close up of the flowstone from which MIP-4-A and MIP-4-B were collected;
F: Photo of the MIP-5 sample (photo credits: B.P. Onac) ............................................32
Figure 12. A) Aerial picture of the Portocristo area and location of the Coves del Drac
(from Ginés et al., 2014), B) Image of the Llac Delícìes (photo credit: J. Ginés),
C) Stalagmite DR-D20 showing in its outer surface weathered white layers;
and D) Sample cross-section displaying soda straw, stalactite, and stalagmite
components with the thin white weathered laminae on the upper part .................. 34
Figure 13. Sub-samples preparation and chemical proceedings. Sub-samples are
crushed (A), and stored in tubes (B); C) Dissolved aliquots are spiked,
purified and dried down on hotplate; D-E) U, Th, and Pb are chemically
separated (see text for detailed explanation) ........................................................ 36
Figure 14. Cup configurations and resistors settings on the Thermo NEPTUNE
MC-ICPMS for the U (A), Th (B), and Pb (C) isotopic measurements
(modified from LaPointe, 2013) .......................................................................... 38
Figure 15. Speleothem samples from Cala Falcó used for U-series dating. The yellow
bands mark the position and code of each subsample...................................................42
Figure 16. Stalagmite CF-11. A) Cross section of the sample showing its individual growth
layers and internal corrosion features. The subsamples (color bands) used for
U-series dating are also marked. CF-11-21 (grey band) denotes the outlier age.
The double white lines represent brief hiatuses (corrosion layers) at 20 and 11 mm
from the top, respectively. B) Age-depth model for CF-11 stalagmite generated
from StalAge algorithm plotting the MC-ICP-MS U-series ages against distance
from top .................................................................................................................................... 43

vi
Figure 17. Curve plots 232Th vs. Initial 230Th/232Th correction for all the subsamples
(color-coded) and their corresponding absolute 2σ errors. The equation
used to calculate the initial 230Th/232Th correction is also shown. The
equation used to calculate the initial 230Th/232Th correction is also displayed.
The x values were assumed for each subsample from different 230Th
concentrations in accordance with the stratigraphic order ........................................44
Figure.18. Records of δ18O and δ13C values for the stalagmite CF-11 ..........................................45
Figure 19. Dimoni flowstones: A) DIP-1A-1 and B) DIP-1B. Subsamples’ code and
position are also displayed (yellow marks) ...................................................................47
Figure 20. Flowstone samples from sa Ferradura site: A) FE-1-A; B) FE-1-E; and
C) FE-1-F. Subsamples location (in yellow) and related codes are also shown ...........48
Figure 21. Na Mitjana samples: A) MIP-1; B) MIP-2; C) MIP-3; D) MIP-4A; and E) MIP-4B.
Subsamples position (in yellow) and code are indicated for each speleothem ................... 49
Figure 22. MIP-5 sample cross section. Powder subsamples and codes are displayed
in yellow. Hiatuses at 20 and 23 mm (from the outer surface) are shown
in white .........................................................................................................................50
Figure 23. Cross section of sample DR-D20. Morphological components of the speleothem
are indicated and labeled. The original soda straw is shown in orange (dashed)
and the stalactite-stalagmite contact in black (line). Yellow: subsamples for
U-series ages used in this study; Grey: subsamples that provided unreliable
U-series ages; Red: subsamples of whose ages were discarded and not included
in the study ....................................................................................................................52
Figure 24. Uranium-evolution curve for the speleothems in this study. All samples are
color-coded and described in the legend. In close-up, the samples clustering near
the secular equilibrium line. Ellipse dimensions express absolute 2σ errors ................53
Figure 25. Plot of all ages from all speleothems investigated in this study. Samples are
site-based color-coded and labeled. Errors bars are absolute 2σ. Shaded area
represents the U-series limit range ................................................................................54

vii
Figure 26. Ages of the speleothems from our study and eustatic sea level (ESL)
reconstructions from Naish and Wilson (2008) (orange curve), and Spratt and
Lisiecki (2016) (blue curve). Speleothem samples are color-coded. All age
errors are absolute 2σ. Gray shaded box indicates the period of possible
breakdown and dismantling of the paleo-caves investigated in this study.
Marine Isotopes Stages (MIS) are also labeled ............................................................57
Figure 27. Conceptual model showing the different speleogenetic stages in the evolution
of the coastal caves in the eastern Mallorca [modified after Ginés and Ginés
(1992) and Ginés et al. (2014)]: 1) Cave genesis in the mixing zone, 2) Sea level
rise and further cave development, 3) Collapses following sea level drop,
4) Vadose speleothems precipitation, 5) Partial collapse of ceiling and
cementation of breakdowns, and 6) Coastal erosion that exposes speleothems at
surface. See text for detailed explanation .....................................................................59
Figure 28. Images of Cala Falcó site: A) General view of the cala, cave entrance, and
collapsed blocks, B) Image of the paleokarst features outcropping on the cliff
outside the cave, and C) Close up of the paleo-flowstones and stalagmites.
Yellow stars represent the sampling points, whereas the white lines highlight
the contour of the speleothems (photo credits: B.P. Onac and J. McIlrath) .................63
Figure 29. Sa Ferradura and Dimoni sites: A) Aerial view of the two engulfments,
B) Panoramic photograph of the Sa Ferradura site, C) Flowstone sequence
outcropping in between breccia deposits, D) Fossil flowstones and stalagmites
exposed at Dimoni, and E) Funnel-like embayment produced by the Messinian
paleokarst structure and cave developed in the breccia at present sea level
(photo credits: B.P. Onac, J.J. Fornós, and J. Ginés) ....................................................66
Figure 30. Na Mitjana site: A) Paleokarst structures and cavities (highlighted), B) Various
speleothems in one of the cavities, C) Close image of the sample MIP-5,
D) Mammillary-like speleothem MIP-3, and E) Flowstone MIP-4 (photo
credits: B.P. Onac) ........................................................................................................68
Figure 31. Image of Llac de les Delícies (Coves del Drac) showing the hypothetical phases
of DR-D20 precipitation: a) soda straws/stalactites reaching the cave floor,
b) hanging portions of broken stalactites c) stalagmite covering the broken part
of a soda straw/stalactite at the cave floor (photo credits: J.J. Fornós) .........................71

viii
Figure 32. MC-ICP-MS U-series ages for DR-D20 speleothem (red triangle) are
compared with the Argentarola stalagmites (Bard et al., 2002; Dutton
et al., 2009) (orange, purple and black squares), POS TIMS and α-spectrometry
ages from Grotta del Nettuno, Sardinia (Tuccimei et al., 2000a), and POS α-
spectrometry ages from Cove den Passol and Na Mitjana Cave, Mallorca
(Tuccimei et al., 2000b; Vesica et al., 2000). RSL curve (Waelbroeck et al.,
2002) and Red Sea level reconstruction (Siddall et al., 2003) are also shown
(solid and dashed blue lines). All errors are absolute 2σ, except for α-spectrometry
ages from Tuccimei et al. (2000a, b), which are 1σ) ....................................................72
Figure 33. Conceptual drawing of CF-11 stalagmite evolution and sea level implications:
A) stalagmite precipitation in vadose conditions during sea level lowstand,
B) cave partial flooding during MIS 5a sea level higstand cause the cessation of
the stalagmite growth, and C) sea level fall and subaerially exposure of the
stalagmite ......................................................................................................................75
Figure 34. Comparison of Cala Falcó (CF-11) stalagmite oxygen composition with other
local and global records: a) NGRIP (North Greenland Ice Core Project members,
2004; Rasmussen et al., 2014), b) δ18O records of CF-11, c) Campanet stalagmite
δ18O values (Dumitru et al., 2018), d) δ18O of Cala Falcó (CFF-03-03-1)
stalagmite (Hodge et al., 2008), and e) Sea level reconstructions for Mallorca
during MIS 5a, based on phreatic overgrowths on speleothems (Tuccimei
et al., 2006; Dorale et al., 2010) (blue and red circles, respectively). U-series
ages of the POS (2σ absolute errors) and elevations related to present sea level
are shown. MIS boundaries are also displayed. MIS 5a highstand is shown in
light blue .......................................................................................................................76
Figure 35. δ13C comparison between: a) Cala Falcó (CFF-03-03-1) stalagmite (Hodge et
al., 2008), b) Cala Falcó (CF-11) stalagmite, and c) Campanet speleothem
(Dumitru et al., 2018), MIS 5b/5a boundary is shown..................................................78
Figure B1. Authorship permission provided by Joaquin Ginés for using a picture from
Mondragó Natural Park in the present study (Fig. 5)..................................................103
Figure B2. Permission granted from Joaquin Ginés to use his images from Mallorca
Island in the present study (Figs. 12 and 29) ..............................................................103
Figure B3. Permission provided from Joan Fornós to use some pictures in this thesis
(Fig. 29 and 31 ............................................................................................................104

ix
Figure B4. Permission granted by Judy Mcllrath to use some pictures of Mallorca
Island in this study (Figs. 8A, 9B-D, and 29A) ..........................................................104
Figure B5. Permission granted by Bogdan P. Onac to use the pictures of his property
in the present study (Figs. 4, 8, 9, 10, 11, 28, 29, and 30) ..........................................105
Figure B6. Permission obtained by Elsevier to use a picture (Fig. 6 in the present
study) originally published in the book Treatise on Geochemistry ............................106

x
ABSTRACT
Sea level affects the littoral morphology and structure in different ways. In coastal karst basins,
dissolutional and depositional processes are strictly related to sea level variation. A great variety of
karst-related geomorphological features and cave deposits exist above, below, and at sea level, and are
extremely useful to study past changes of relative sea level. Within these, vadose speleothems such as
flowstones and stalagmite, can document unequivocal maximum sea level constraints as well as record
phreatic phases of sea level rise. Here we present a series of geochronological data from the eastern
Mallorca and show the implication of relative sea level oscillations in the coastal karst evolution over
the last 750 kyr. We investigate a total number of twenty-two samples between flowstones and
stalagmites from different paleokarst sites and coastal caves. U-series ages of samples ranged between
650 and 450 kyr for the paleo-flowstones, and 225-198 ka and 85.7-83.7 ka for the stalagmites. The
paleo-speleothems records provide new timing constraints regarding periods of vadose conditions
suggesting that sea level did not exceed 2 mapsl during the interglacial highstands 17, 15, and 13.
Periodic sea level oscillations following glacial/interglacial cycles caused morphostructural changes of
the paleo-caves. We constrain the occurrence of breakdown events to intervals succeeding the sea
level highstands 11, 9, 7, and 5, and further total breakdowns and dismantling of caves throughout the
Holocene. We also present two stalagmite records of relative sea level maximum at ~1 mbpsl during
the MIS 7, and constraints for sea level rise and paleoenvironmental changes during the MIS 5a. We
conclude pointing out the necessity to use vadose speleothems along with other RSL records to
precisely estimate past sea level changes.

1
CHAPTER ONE:
INTRODUCTION
Sea level change is among the most debated and studied research topic in science,
because of its direct concern to human society and economy (Clark et al., 2016).
Understanding the mechanisms controlling sea level fluctuations, such as the connection
between polar-ice sheet growth/melt and changing global temperatures, help us to better
estimate and predict potential future scenarios (Dutton and Lambeck, 2012; DeConto and
Pollard, 2016). Nevertheless, data sets generated from accurate monitoring and direct
observations are not sufficient per se to produce future projections, and the study of past sea
level oscillations is somehow essential to accomplish this purpose (Dutton et al., 2015).
Variations in mass and /or volume of ocean water in response to ice-sheet growth/
reduction is reflected in global changes of mean sea level and is defined as eustatic sea level
(ESL) (Suess, 1906; Gornitz, 2005), whereas variations of sea level related to any land-linked
reference point is defined as relative sea level (RSL) (Kemp et al., 2015). RSL is mainly
associated with land movement (e.g., uplift, subsidence, etc.) and may or may not directly
reflect global mean sea level changes (Rovere et al., 2016). However, many locations
worldwide present moderately stable tectonic settings and host coastal geologic archives that
are extremely useful to investigate past sea level variations.
In the western Mediterranean region, Mallorca represents a benchmark site for paleo
sea level studies, due to its steady, low tectonic movements and the great variety of coastal
records and karst-based sea level indicators that recorded sea level fluctuations over the past
2
~10 million years (Fornós et al., 2002a; Giménez and Gelabert, 2002; Just et al., 2011; Ginés et
al., 2012). Coastal geomorphologic RSL archives include beach rocks, marine terraces, tidal
notches, shore platforms, coral reef terraces, beach deposits, and fossil fixed biological
indicators (Rovere et al., 2016). The structural and morphological features of littoral records
contributed to the estimate the relative sea level elevations during the warm intervals MIS 5e
and MIS 11 in Mallorca (Cuerda, 1989; Zazo et al., 2003, 2013; Lorscheid et al., 2017).
Among the coastal karst deposits having a great importance for sea-level studies are the
phreatic overgrowths on speleothems (POS), defined as carbonatic encrustations that
precipitate over preexisting speleothems and cave walls in brackish water sea level related
pools (Pomar et al., 1979; Ginés, 2000). Previous investigations of POS in Mallorca have
precisely documented paleo sea level positions during the Holocene (Tuccimei et al., 2010),
the last interglacial period (Vesica et al., 2000; Tuccimei et al., 2006; Dorale et al., 2010;
Polyak et al., 2018), as well as throughout the middle Pliocene (Dumitru et al., 2018a). Beside
these, vadose speleothems such as stalagmites, flowstones, and stalactites, precipitated in
coastal caves also provide indirect information about sea level, particularly, they define the
maximum sea level boundary during periods of relatively low sea-stands, as well as indicate
phases of relative sea level rise that caused floods in the caves stopping the precipitation of
carbonate speleothems (Onac et al., 2012).
A series of radiometric data on stalagmites and flowstones from different paleokarst structures
and coastal caves of Mallorca is presented. These results will be used to discuss the
correlation between coastal karst processes and sea level variations that occurred on this island
over the past 750 kyr. The study also places minimum and maximum age constraints for the
timing of sea-level rise and fall during the penultimate and the last interglacial periods.

3
1.1 Aim of the Research
Our project seeks to improve the knowledge regarding coastal dynamics, karst processes, and
sea level changes in Mallorca. By analyzing the vadose speleothems exposed in coastal paleokarst
structures along the eastern coast of the island, an attempt will be made to provide new timing
constraints in the speleogenetic phases of the paleo-coastal caves. Another goal is to precisely
describe the periods when vadose conditions existed that allowed the precipitation of thick sequences
of flowstones and stalagmites, at times when sea level regressed. The use of new radiometric data
will be used to offer the previous coastal cave genetic models a geochronological timeframe, and to
define the intervals when the breakdown of the paleo-caves occurred. Furthermore, U-series dating
and oxygen and carbon stable isotope investigations on stalagmites from two littoral caves were used
to characterize the paleoenvironmental conditions and sea level variations during the past
glacial/interglacial cycles in the western Mediterranean.
1.2 Thesis Structure
The thesis consists of six chapters. Chapter One will introduce the reader to the topics
described in the research. Various information regarding the geological, geomorphological, and
speleological characteristics of Mallorca, along with some background data regarding the analytical
techniques are given in Chapter Two. Detailed descriptions of the investigated sites and samples,
along with the methodology, are described in Chapter Three. The results of the U-series, U-Pb, and
stable isotope geochemical analyses are presented in Chapter Four. In Chapter Five I interpret the
radiometric age data of various vadose speleothems in order to add new chronological insights into
the speleogenetic phases and coastal karst evolution, both directly related to changes in sea level. I
will also provide new karst-based sea level constraints during the penultimate and ultimate
interglacials. The thesis ends with a summary of outcomes and conclusions in Chapter Six.
4
CHAPTER TWO:
BACKGROUND
2.1 Study Area Description
2.1.1 Geographic and Geomorphologic Settings
Mallorca Island extends between the 39°58’ N (Cap de Formentor), 3°28’ E (Punta de
Capdepera), 39°15’ N (Cap de ses Salines), and 2°17’ E (Sant Elm), with a NE-SW
arrangement of its major structural geomorphic units. The island represents the widest
emerged portion of the Balearic Promontory, with a surface area of ~3,650 km2 and a perimeter
of about 560 km. The promontory is surrounded by the Valencia Basin (NW), the Liguro-
Provencal Basin (NE), the Algerian Basin (SSE) and a steep escarpment (Emile Baudot
Escarpment) on the SE side (Fig. 1). Geomorphologically, Mallorca can be subdivided into
three morphostructural units: Serra de Tramuntana, Es Pla, and Serres de Llevant, all of which
are the result of complex extensional features of horsts and grabens (Gelabert, 1998). Serra de
Tramuntana is the most remarkable mountain range extending along all of the western side of
the island, with a structural alignment NE-SW, mostly characterized by rough landscapes and
well-karstified carbonate bedrock. The highest point on the island, Puig Major (1,445 m), is
localized in the middle section of the Tramuntana massif. The territory has been modified by
human activities over time as testified by the presence of terraces and farmlands spread all over
the region (Ginés, 1999). Serres de Llevant is the second important orogenic range of
Mallorca, lengthened in the eastern region along a NE-SW direction parallel to the coast. The
ridge consists predominantly of rounded and gentle promontories, shaped by complex thrust

5
structures (Gelabert, 1998). Es Pla, is a depression extending between the two mountain belts
and generally characterized by a flat landscape. In this area consisting of recent colluvial
deposits and red soils, is where most of the agriculture activities of the island are located.
Apart from these principal structural units, other areas have relevance for their geomorphologic
characteristics. The central part of the depression, for instance, is marked by a hilly landscape
known as Serres Centrals, whose outcropping is connected to post-orogenic extensional
features. Furthermore, in the southeastern regions of Migjorn and Llevant, carbonate platform
deposits crop out along the coastline in outstanding cliffs interrupted by morphologic incisions
locally known as “calas” (bays) (Gómez-Pujol et al., 2013).
Figure 1. Localization of Mallorca Island in the western Mediterranean. It is visible the structural
alignment NE-SW of the Balearic Promontory and the surrounding basins.
Image modified from Google Earth.

6
2.1.2 Climate
The island of Mallorca is characterized by a typical Mediterranean climate showing two
distinct seasonal trends. Dry and hot summers alternate with mild-humid winters, with an annual
temperature mean of about 17°C. The average annual precipitation reaches 570 mm/yr, with
most of the rainfalls recorded in the Tramuntana range and less in the interior, eastern, and south-
eastern coast of the island (Guijarro, 1995). The rainfall events show an irregular pattern
throughout the year, being concentrated particularly during the winter period (Sumner et al.,
2001). In the past decades, increasing episodes of extreme precipitation events and storm surges
have been recorded at local and regional scale, predominantly during late summer and autumn.
Occasionally, the magnitude of these events were rather significant causing serious infrastructure
damages especially in the coastal areas, where most of the economic activities on the island are
concentrated (Ramis et al., 2009).
2.1.3 Geologic Settings
The geologic structure of Mallorca has been heavily affected by complex tectonic events,
principally thrusts and folds, connected to the Alpine orogenesis (Fornós and Gelabert, 1995).
The stratigraphic succession includes rocks formed from the Triassic to the Quaternary period,
with a hiatus between Paleocene and lower Eocene (Fig. 2). The Mesozoic section (Triassic-
Upper Cretaceous) is well exposed in the thick cliffs of Serra de Tramuntana, as well as in the
promontories of Serres des Llevant, and the outcrops of Serres Centrals. The sequence consists
of micritic limestones with different textural characteristics that vary for each environment of
formation from shallow marine to pelagic, hemi-pelagic, lacustrine, and littoral (Rodríguez-Perea
and Gelabert, 1998). Gypsum and dolomites are also present in alternation with sandstones and
mudstones deposits, particularly in the Triassic and the early Jurassic periods. The Cenozoic

7
succession is predominantly composed of marine lithofacies, with little presence of continental
deposits (Fornós et al., 2002b).
Figure 2. Simplified geological map of Mallorca showing the principal morphostructural
and stratigraphic units (modified from Fornós et al., 2019).
The synorogenic sediment sequences (Eocene-Middle Miocene) are represented by
calcarenites and marls, interbedded with bioclastic limestones, which emerge principally in the
Serra de Tramuntana and Serres de Llevant regions and, sporadically in the central area of Es Pla.
The post-orogenic units (Upper Miocene) are made up of sequences of reefal limestones, bioclastic
calcarenites, and calcisiltites well exposed in the SE part of the island (Reef Complex Unit of

8
Llucmajor and Migjorn regions, Santanyì Limestone) (Fornós and Pomar, 1983a; Pomar et al.,
1996). The Plio-Quaternary deposits of calcisiltites and calcarenites are interlayered with strata of
carbonate conglomerates overlying most of the Es Pla Depression and the piedmont areas of Serra
Tramuntana (Inca-sa Pobla and Palma basins), as well as the southern part of the island (Campos
Basin) (Fig. 2). The Upper Miocene limestones of Llevant and Migjorn platforms are covered by
aeolian (eolianites) and colluvial deposits that accumulated during the quaternary glacial periods
when sea-level dropped down about 150 m (Clemmensen et al., 2001). These Pleistocene deposits
are primarilly composed of cross stratified bioclastic carbonate sand and terrigenous material,
interlayered with carbonate silt and matrix-supported breccias (Clemmensen et al., 1997).
Stratigraphic and geodynamic investigations documented slightly low post-orogenic tectonic
activity on the island, mainly consisting of Neogene – Quaternary extensional faulting and low
vertical movements (Giménez and Gelabert, 2002; Just et al., 2011). Thermal anomalies have been
also documented in the southeastern region of Llucmajor-Campos Basin (López, 2007).
2.1.4 Mallorcan Karst: Speleogenetic Processes and Cave Types
The carbonate lithologies of Mallorca have been affected by long-lasting karst processes
that generated distinctive dissolution morphologies, both at the surface (exokarst) and
underground (endokarst) as defined by Bögli (1980). The exokarst of Mallorca includes karren
landscapes, biokarst morphologies, canyons, and solutional depressions (Ginés and Ginés, 1995).
These are predominant in the karst areas of Serra de Tramuntana and Serres des Llevant,
although coastal karren and dissolution features such as pans (kaminitza) and grooves are also
present on the southeastern Miocene carbonate cliffs. On the other hand, the endokarst features
refers to conduits and caves generated in the subsurface carbonate environments by waters
flowing along various underground paths. In this context, the lithological and hydrogeological

9
settings, as well as the climatic conditions, control most of the speleogenetic
processes/mechanisms. On the island of Mallorca, Ginés and Ginés (2011) described five major
categories of caves: vadose shafts, and vadose caves, phreatic caves, coastal caves, and
hypogenic caves (Fig. 3).
Vadose shafts are vertically-shaped conduits, particularly abundant at the high elevations
in the Serra de Tramuntana karst region (1a-c in Fig. 3). These are cavities formed by solutional
processes of descending meteoric waters in the vadose zone with preferential flowing along
joints and fractures in the karst massif (Ginés and Ginés, 1987).
Vadose caves refer to a series of air-filled, sub-horizontal cavities (mostly occurring in
the Tramuntana-Llevant karst ranges) consisting of galleries, extensive chambers, and canyon-
type passages (2a-b in Fig. 3). Their morphologic features are controlled by the
lithostratigraphic disposition of structural discontinuities such as bedding planes, joints, and
faults, as well as by the precipitation regime affecting the karst massifs (Palmer, 1991).
Breakdown processes are also very common in the vadose caves on Mallorca, with breakdown
blocks usually covered by outstanding speleothem decorations (Ginés and Ginés, 2011).
The phreatic-type caves consist of circular and oval-shaped passages formed below the
water table (saturation zone) (3a-b in Fig. 3). Network patterns, as well as horizontal conduits
with phreatic solutional morphologies like cupolas, are also very common features. Various
cavities developing both inland or near the coast have been included in this morphogenetic
category, particularly those located in the coastal phreatic areas of Tramuntana region.
Nevertheless, following variations in the hydrological settings, some of the phreatic caves have
undergone considerable morphological changes while exposed to vadose conditions (Ginés,
1995).
10
Coastal/Littoral caves represent the most distinctive endokarst features of many karst
areas of Mallorca (4a-b in Fig. 3), although they are particularly concentrated in the eastern and
southeastern region of Migjorn. In this part of the island, karstification took place synchronously
with the early diagenetic processes (eogenetic karst), due to the hydrologic interconnection
between the coastal (unconfined) aquifers and the marine groundwater, as well as the high
porosity of the Upper Miocene carbonate lithofacies (Ginés, 2000). In this context, the coastal
speleogenesis of Mallorca shows similarities with the Carbonate Island Karst Model described
by Mylroie and Mylroie (2007), but their flank margin cave model does not apply to this karst
(Ginés et al., 2013). Instead, Ginés et al. (2014) suggested the use of the Carbonate Coast Karst
Model to describe the complexity of the littoral endokarst processes developing on the island.
Figure 3. Idealized model of the different cave typologies developing in the island of Mallorca
(modified from Ginés and Ginés, 2011).

11
The chemical interactions between freshwater and saltwater in the coastal phreatic zone
(so-called mixing zone) generate undersaturated conditions with respect to the CaCO3, increasing
the dissolution process of limestone, causing the formation of initial solutional conduits (Ginés
and Ginés, 2007). Multiple sea-level variations over the past 6 million years led to a series of
conspicuous ceiling breakdown and speleothems precipitation, thus significantly influencing the
morphology of the littoral caves. During sea-level still stands, recurrent cave precipitates like
phreatic overgrowth on speleothems (POS) formed at the vadose/phreatic interface of brackish
sea-level associated cave pools, recording the past sea level positions through the Pliocene and
Pleistocene eustatic oscillations (Ginés et al., 1981; Dorale et al., 2010; Tuccimei et al., 2010;
Polyak et al., 2018; Dumitru et al., 2018a). Whenever the sea-level was below the caves, these
have been exposed to vadose conditions, favoring the precipitation of stalactites, stalagmites, and
flowstones. Later on, ceiling collapse episodes provided access into some of the caves and
caused major morphological changes (Fornós et al., 2019).
Recent investigations in some caves located in the southeastern part of the island, have
identified peculiar morphologies of hypogene origin (5 in Fig. 3), such as feeder-like vertical
conduits, rising solutional grooves, corrosion cupolas, and alveoli (Ginés et al., 2009). The
proximity of certain cavities to thermal active zones supports the possible role of ascending
waters from deep-seated aquifers through extensional faults in the speleogenetic processes
(Ginés et al., 2017).
2.1.5 Paleokarst Features: Structural and Morphogenetic Aspects
In the eastern littoral cliffs of Mallorca abundant paleokarst structures can be observed.
The cliffs are built up of carbonate deposits accumulated in different depositional environments
during the Upper Miocene and consist of three principal lithologic units: the Calcisiltites Unit
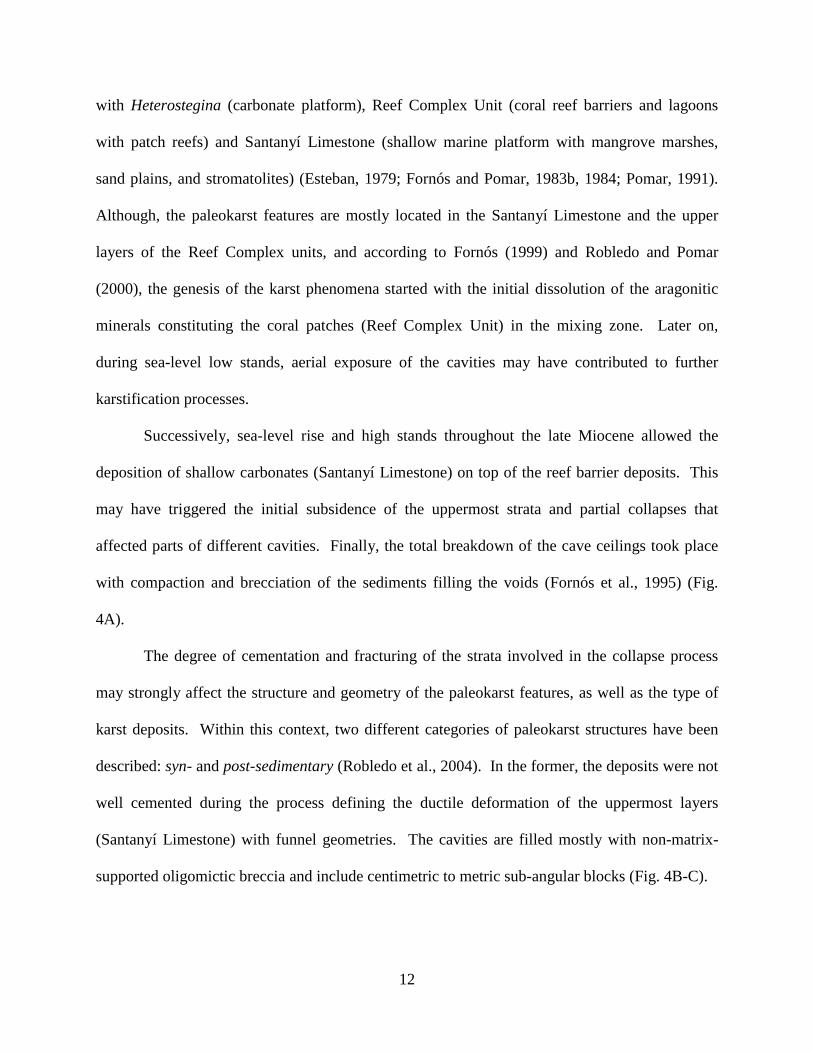
12
with Heterostegina (carbonate platform), Reef Complex Unit (coral reef barriers and lagoons
with patch reefs) and Santanyí Limestone (shallow marine platform with mangrove marshes,
sand plains, and stromatolites) (Esteban, 1979; Fornós and Pomar, 1983b, 1984; Pomar, 1991).
Although, the paleokarst features are mostly located in the Santanyí Limestone and the upper
layers of the Reef Complex units, and according to Fornós (1999) and Robledo and Pomar
(2000), the genesis of the karst phenomena started with the initial dissolution of the aragonitic
minerals constituting the coral patches (Reef Complex Unit) in the mixing zone. Later on,
during sea-level low stands, aerial exposure of the cavities may have contributed to further
karstification processes.
Successively, sea-level rise and high stands throughout the late Miocene allowed the
deposition of shallow carbonates (Santanyí Limestone) on top of the reef barrier deposits. This
may have triggered the initial subsidence of the uppermost strata and partial collapses that
affected parts of different cavities. Finally, the total breakdown of the cave ceilings took place
with compaction and brecciation of the sediments filling the voids (Fornós et al., 1995) (Fig.
4A).
The degree of cementation and fracturing of the strata involved in the collapse process
may strongly affect the structure and geometry of the paleokarst features, as well as the type of
karst deposits. Within this context, two different categories of paleokarst structures have been
described: syn- and post-sedimentary (Robledo et al., 2004). In the former, the deposits were not
well cemented during the process defining the ductile deformation of the uppermost layers
(Santanyí Limestone) with funnel geometries. The cavities are filled mostly with non-matrix-
supported oligomictic breccia and include centimetric to metric sub-angular blocks (Fig. 4B-C).

13
Figure 4. A) Schematic summary of the paleokarst development in the Upper Miocene limestones
(modified from Fornós, 1999). Syn-sedimentary paleokarst structures: B) The eastern coastal zone of
Portocolom village, and C) Punta des Savinar (Mondragó). Post-sedimentary paleokarst features:
D) Littoral area near the entrance of Cova del Dimoni (Porto Cristo), and E) Cova des Pont (Manacor)
(photo credit: B.P. Onac).

14
In the post-sedimentary paleokarst, the upper strata were consolidated and fractured while the
collapse took place with blocks displacement involving the uppermost Santanyí Limestone, as well
as the Reef Complex lithologies. Crackle-chaotic-matrix supported breccia and angular boulders of
metric dimensions, filled the caves (Fig. 4D-E). Both types of paleokarst structures have undergone
morphologic evolution due to coastal dynamics and subaerial weathering (Balaguer, 2005).
The morpho-structural processes consist of different phases: 1) differential erosion of the
lateral parts of the collapse deposits (breccia) and mechanical displacement of the lateral blocks (a
in Fig. 5); 2) formation of littoral arches, natural bridges, and caves by erosion/corrosion processes
in the mixing zone (coastal caves) (b and c in Fig. 5); 3) breakdown of the karst features (d in Fig.
5), and 4) debris washout along the coastline and platform retreatment (e in Fig. 5) (Rosselló et al.,
2007). Intraparticle cementation may have occurred either in the phreatic or vadose conditions.
Figure 5. Morphological evolution of paleokarst structures in the eastern coastal region of Mallorca
(Solimina, Mondragó Natural Park) (photo credit: J. Ginés) (see text for explanations).

15
In some locations of the eastern coastal area, the post-sedimentary paleokarst structures
show distinctive features that are related to the endokarst processes in the vadose zone. The
speleothems exposed at these sites, especially stalagmites and flowstones, have been
precipitated when the paleo-coastal caves were air-filled (free of water) and meteoric processes
had a major contribution in the endokarst development. Most of these exposed speleothems
appear particularly old, thus potentially providing key information regarding the antiquity of
the karst and caves on Mallorca. To date, no geochronological studies of speleothems
preserved in paleokarst structures have been conducted on the island.
2.2 U-Th-Pb Geochronology of Speleothems
2.2.1 U, Th, and Pb in Natural Environments
Uranium is an element belonging to the actinide series of the periodic table with atomic
number 92 and two prevalent oxidation states, U4+ and U6+. The following three main isotopes
238U, 235U, and 234U, with abundances of 99.27%, 0.72%, and 0.0055% respectively, are present
in nature. Redox potential and pH variations, along with temperature and pressure mainly affect
uranium mobility in crustal fluids, as well as precipitation of uranium-bearing compounds in
sedimentary environments (Shock et al., 1997). In near-surface ground waters, U6+ is more
prevalent and usually bonded with two oxygen atoms to form the polyatomic uranyl cation
(UO22+), which may occur in hydrate complexes and as carbonate species under more oxidizing
conditions (Langmuir, 1978). In contrast, U4+ is extremely insoluble in waters with pH ranges of
6-8.5, although present in hydroxyl complexes and hydrated phosphates in highly reducing
environments. In carbonate minerals, Extended X-Ray Absorption Fine structure (EXAFS)
analyses demonstrated UO22+ substitution of Ca2+ and axial oxygen replacement of the (CO3)
2-
compounds in the calcite lattice, producing little structural deformation (Kelly et al., 2003). U4+
16
replacing Ca2+ have been also described in different calcite samples as being particularly stable
in the crystal structure, a reasonable condition due to the similarities of the ionic radius (Sturchio
et al., 1998; Cole et al., 2004).
Thorium is an actinide element of atomic number 90, with only one oxidation state, Th4+
and two naturally occurring isotopes, 232Th (~99.98 %) and 230Th (~0.02%). In the Earth’s crust,
thorium is found as a trace element in solid compounds like phosphates, silicates, and oxides, as
well as occluded in soil colloids and clay minerals (Langmuir and Herman, 1980). Although
mostly insoluble in surface and groundwater under the oxide form ThO2, Th mobility increases
when complexed with sulfates, carbonates, hydroxides, and organic molecules. Its presence in
the crystal lattice of carbonate minerals is related to detrital sources (terrigenous), and occurring
as a radiogenic product.
Lead is a metallic element (Group IVA) of atomic number 82 having two oxidation
states, Pb2+ and Pb4+, and four natural stable isotopes, 204Pb, 206Pb, 207Pb, and 208Pb, with
abundances of 1.4%, 24.1%, 22.1%, and 52.4%, respectively. In the natural systems, most of the
lead has oxidation state Pb2+. Dissolution of Pb in normal conditions of temperature and
pressure does not occur, although dissolved forms may be associated with carbonates [PbCO3,
Pb(CO3)22-] in acidic water solutions. Despite the low concentration of Pb in calcite minerals
(ppb), ionic substitution of Ca2+ in the octahedral coordination has been observed, showing low
distortion of the crystal lattice and relatively high stability (Reeder et al., 1999).
2.2.2 Overview of Radioactive Decay Mechanisms and Laws
Radioactivity is the spontaneous process of transformation of an element into another by
the emission of energy. Based on the type of subatomic particles emitted by the element
undergoing radioactive decay, three principal forms can be described: alpha (α), beta (β) and

17
gamma (γ) decays; nevertheless, other modes also occur such as electron capture, spontaneous
fission, and neutron emission (White, 2015). In α-decay, unstable nuclides (parent) disintegrate
to a radiogenic nucleus (daughter) releasing two protons and two neutrons (α particle), thus the
mass and atomic numbers decrease for the parent (A-4 and Z-2) in this transformation. In β-
decay, a neutron of a parent nuclide is converted into a proton with the release of an electron (β-
particle) plus an electron antineutrino without changing of mass number in the radiogenic
daughter. Likewise, a proton can convert into a neutron emitting a positively charged electron
(β+ particle) and an electron neutrino. In γ-decay, a nuclide energetically excited, resulting from
previous decay or a reaction, releases high energetic electromagnetic radiation (gamma rays)
transforming the nuclide into a lower, and more stable, energy state.
The number of unstable nuclides (N) that disintegrate per unit of time (t) is directly
proportional to the amount of the nuclides present at any stated time (universal law of
radioactivity) (Rutherford and Soddy, 1902):
−
𝑑𝑁
𝑑𝑡= 𝜆𝑁
(1)
where λ is the decay constant, which defines the probability that any radionuclide atom will
decay within a given time.
By integrating the equation (1) and rearranging the values, a new equation is obtained:
𝑁 = 𝑁0𝑒−𝜆𝑡 (2)
The rate law is related to the half-life (t1/2) of a specific parent isotope, which is defined as the
time necessary for half of the radionuclide to decay into a daughter isotope, thus depending on
the decay constant according to the equation below:
𝑡1/2 =
𝑙𝑛2
𝜆=
0.693
𝜆
(3)

18
In a closed system, the radiogenic daughter number (D*) forming at any time t is equal to the
number of parent isotope expired (N0-N). At t = 0, the daughter isotope value is defined as D0.
Therefore, the overall number of radiogenic nuclides (D*) at a given time t is calculated as:
𝐷 = 𝐷0+𝑁(𝑒−𝜆𝑡 − 1) (4)
which is the cornerstone equation (age equation) of most of the radiometric dating techniques
(U-series, U-Pb, Rb-Sr, etc.). Details for all the equations, steps, and geochronological
applications can be found in Dickin (2005).
2.2.3 U-Th-Pb Decay Systems and Dating Methods
The isotopes of uranium and thorium, 238U, 235U, and 232Th, are moderately unstable in
the Earth’s crust and undergo complex, long-lasting decay chains to form the stable radiogenic
isotopes of lead (206Pb, 207Pb, and 208Pb, respectively), known as uranium, actinium, and
thorium radioactive series (Fig. 6).
Figure 6. Uranium (green), Actinium (yellow), and Thorium (orange) decay series. Intermediate
radioactive daughter and half-lives (>10 years) are shown. Decay constants of 238U, 235U, and 232Th
are dispayed (from Schoene, 2014).

19
238U has a half-life of 4.4683×10⁹ years and decay constant of 1.55125e-10 yr-1,
whereas 235U half-life is 7.0381×10⁸ years and decay constant of 9.8485e-10 yr-1 (Jaffey et al.,
1971; Schoene et al., 2006). 232Th half-life is 1.405 ×10¹⁰ years, having a constant decay of
4.475 e-11 yr-1 (Steiger and Jäger, 1977). The less abundant isotopes 234U and 230Th are
intermediate decay products of the parent 238U, with half-lives of 2.4562×10⁵ and 7.5584×10⁻⁴
years, and decay constants of 2.8221 e-6 yr-1 and 9.1705e-6 yr-1, respectively (Cheng et al.,
2013). The geochronology community regarding the decay constant values and relative
uncertainties continues to search for further improved values (Boehnke and Harrison, 2014;
Villa et al., 2016).
In U-Pb dating, ages can be calculated using more than one independent radioactive
decay system, and the three most important ones are 238U-206Pb, 235U-207Pb, and 232Th-208Pb
(Schoene, 2014):
𝑃206 𝑏
𝑃204 𝑏= (
𝑃206 𝑏
𝑃204 𝑏)
𝑖
+ (𝑈238
𝑃204 𝑏) (𝑒−𝜆238𝑡 − 1)
(5)
𝑃207 𝑏
𝑃204 𝑏= (
𝑃207 𝑏
𝑃204 𝑏)
𝑖
+ (𝑈235
𝑃204 𝑏) (𝑒−𝜆235𝑡 − 1)
(6)
𝑃208 𝑏
𝑃204 𝑏= (
𝑃208 𝑏
𝑃204 𝑏)
𝑖
+ (𝑇ℎ232
𝑃204 𝑏) (𝑒−𝜆232𝑡 − 1)
(7)
where 204Pb is the only non-radiogenic isotope of lead and is commonly used as reference in
the age calculation. In considering the reliability of the U-Pb radiometric dating, some
assumptions need to be made: 1) the system (mineral) must have remained closed to both
parent (U) and daughter (Pb) isotopes, as well as to all the intermediate radionuclides since the
time of crystallization and throughout successive perturbations (U loss, secular disequilibrium,
Pb loss/gain); 2) if present, initial Pb (common Pb) must be considered in the age calculation;

20
3) precise and accurate values of the 238U and 235U decay constants must be known, and 4) the
parent and daughter isotopic concentrations must be accurately measured with no systematic
errors (Faure and Mensing, 2005).
However, natural processes such as erosion, diagenesis and/or melting may cause U-
system perturbation and some intermediate decay products can be added or removed to/from
the system generating a condition where the decay activities of the parent and daughter
radioisotopes are not in equilibrium (activity ratios different from 1). When these fractionation
events take place, the system is reset to different disequilibrium states, known as daughter
excess (activity ratios > 1) and daughter deficiency (activity ratios < 1). In the former, a
daughter radioisotope (i.e. 234U) is initially present in large amounts with respect to its parent
(i.e., 238U). Through time, the nuclide excess is reduced by radioactive decay until the secular
equilibrium is reached, and the extent by which this process occurred, can be used as a dating
tool. In the daughter deficiency system, the parent radionuclide is independently deposited
with no radiogenic daughter present. With time, the amount of daughter increases until the
secular equilibrium is established. By measuring how much of the radiogenic product is
formed, the age of the mineral can be calculated (Dorale and Richards, 2003). This method,
known as 238U-234U-230Th disequilibrium or U-series dating, is one of the widest techniques
applied in speleothems’ geochronology (Dorale et al., 2004).
2.2.4 U-Pb Age Determination Methods
A widely used approach for U-Pb age calculation is the two-dimensional (2D) isochron
method, which plot the ratio 238U/204Pb or 235U/204Pb on the x-axis and 206Pb/204Pb or
207Pb/204Pb on the y-axis. This procedure allows to determine the initial ratio of common Pb
(Pbi) and to define the age of the sample analysed by using linear regression (the slope of the

21
line is time dependent). Three dimensional (3D) isochrons are also used for U-Pb system to
precisely define the age of samples formed at the same time (co-genetic), as well as the initial
ratio of 206Pb/204Pb and 207Pb/204Pb (Zheng, 1992). One of the advantages of using the 3D
isochron method in which 238U/206Pb vs. 207Pb/206Pb and 204Pb/206Pb (third axis) are
simultaneously plotted, is that it allows the estimation of Pb gain or loss in/from the system
(Ludwig, 1998). Because of differences between the decay system of 238U and 235U, cross-
checking of age suitability can be defined using the Wetherill Concordia (Wetherill, 1956) and
the Tera-Wasserburg Concordia methods (Tera and Wasserburg, 1972), plotting the 207Pb/235U
(x-axis) vs. 206Pb/238U (y-axis), and 238U/206Pb vs. 207Pb/206Pb, respectively. These methods are
useful to detect the period during which the samples remained in a closed system, i.e., since the
calcite (or aragonite) precipitation took place (concordant ages), as well as the time when
system perturbation occurred (discordant ages). Concordant ages lie on the concordia curve,
whereas the discordant ones fall outside the curve; a discordia line intercepting the curve
determines the time of mineral formation and system alteration. Furthermore, in the Tera-
Wasserburg Concordia, the x-y values error correlation is minimized, and do not require
common Pb (Pbc) isotopic composition for the age calculation, which can be determined by
combining 3D isochrons to the Concordia method (Wendt, 1984; Ludwig, 1998).
2.2.5 Previous U-Pb Dating Studies of Speleothems
Secondary cave deposits, particularly flowstones and stalagmites, have been widely
used in the past decades as exceptional archives for paleoclimate studies, recording
information about past variations in temperature and humidity, tectonic processes, vegetation,
sea level, as well as landscape and human evolution (Gascoyne, 1992; Richards and Dorale,
2003; Fairchild and Baker, 2012). Furthermore, radiometric dating techniques, especially U-

22
series, demonstrated the extraordinary suitability of speleothems for geochronological
investigations, although showing age accuracy limitations in samples older than ~500 kyr
(Ludwig et al., 1992; Dorale et al., 2004). In this context, U-Pb dating method, first applied on
carbonate deposits by Moorbath et al. (1987), has been extended to the speleothem realm
allowing researchers to document karst-based paleoclimate and geomorphology records
beyond the U-Th boundaries (Richards et al., 1998; Lundberg et al., 2000; Woodhead et al.,
2006; Polyak et al., 2008).
In their pioneering work, Richards et al. (1998) analyzed a stalactite from Winnats
Head Cave (UK), using thermal ionization mass spectrometry (TIMS) for U/Pb ratio
measurements and isotope dilution (228Th/232U spike) for U and Th determination. Although
the sample revealed a relatively young age (248 ± 10 ka), the investigation proved the
successful application of U-Pb dating technique in the study of cave formation. Furthermore,
Richards et al. (1998) denoted that for speleothems younger than 1 Myr, accurate correction
for initial isotopic disequilibrium (intermediate radiogenic isotopes) needs to be made.
Soon after, Lundberg et al. (2000) performed U-Pb analyses on a calcite spar sample
from Big Canyon in the Guadalupe Mountains National Park (USA). Isotopic ratio
measurements were carried out by using TIMS, whereas the age calculations were obtained
using the isochron method and Concordia plot. An estimated calcite spar age between 87 and
98 Myr suggests the occurrence of hydrothermal-driven karst process during the Upper
Cretaceous, along with the uplift of Guadalupe Mountains during the Laramide Orogeny.
Woodhead et al. (2006) applied the U-Pb method by using multi-collector inductively
coupled plasma mass spectrometry (MC-ICPMS) technique to measure the U/Pb ratios in
different speleothems from Leana’s Breath Cave (Nullarbor, Australia) and Antro del Corchia

23
(Alpi Apuane, Italy). In this study, the analytical issues denoted by Richards et al. (1998),
such as mass fractionation and impurity sensitivity, were partially solved by the
instrumentation resolution improvement of the MC-ICPMS, coupled with the use of a mixed
tracer 233U-205Pb.
U-Pb dating performed on flowstone samples (interbedded with hominid fossil-bearing
deposits) from different cave sites in the “Cradle of Humanity” region in South Africa
(Sterkfontein, Swartkrans, Coopers and Malapa), revealed new insights in the Pre-Olduvai
human history (Walker et al., 2006; Pickering et al., 2019). Uranium presence in the
flowstones’ layers were pre-examined using the beta scanning method (digital
autoradiography), useful to improve the preciseness of the technique by selecting calcite within
the stratigraphy having more abundant concentrations of uranium (Pickering et al., 2010).
Polyak et al. (2008) investigated speleothems that characteristically form near the water
table (mammillary) located in some caves in the Grand Canyon National Park (USA), using U-
Pb dating analysis. These usually precipitate along the cave walls and roofs in phreatic
environments due to high saturation conditions of water with respect to the CaCO3 (Hill and
Forti, 1997). The U-Pb dates of the cave deposits yielded the timing and position of the water
table in different locations within the Grand Canyon. This permitted the interpretation of
Grand Canyon incision history and defined different incision rates for the western (55 to 223
m/Myr) and eastern (166 to 411 m/Myr) sectors, respectively.
Besides these high-profile investigations, peer-reviewed studies using U-Pb dating of
speleothems have been published in the last few decades, confirming the potential
opportunities (and challenges) of the method in different geological research fields (Cliff et al.,
2010; Polyak et al., 2016; Decker et al., 2017). Detailed reviews of the U-Pb geochronology

24
strategies of application to old cave formations, as well as the methodological and analytical
aspects can be found in Woodhead et al. (2012) and Woodhead and Pickering (2012).
2.2.6 U-series Age Determination
U-series dating method of secondary cave precipitates relies on the basis that uranium
radionuclides (238U and 234U) are highly fractionated (chemically and/or physically) from the
radiogenic daughter 230Th in the hydrosphere, due to the high solubility of the firsts compared
to the second (Dorale and Richards, 2003). However, in water-bedrock interactions 234U is
preferentially carried in the fluid phase than 238U, resulting in a 234U-238U disequilibrium at the
moment of cave calcite (or aragonite) precipitation. By considering these initial disequilibrium
conditions, U-series age of the speleothems can be calculated using the following equation
from Kaufman and Broecker (1965):
[
𝑇ℎ230
𝑈238 ] = 1 − 𝑒−𝜆230𝑇 + (𝛿234𝑈(𝑚)
1000) (
𝜆230
𝜆230−𝜆234) (1 − 𝑒(𝜆234−𝜆230)𝑇)
(8)
where λ230 and λ234 represent respectively the decay constants of 230Th and 234U, [230Th/238U] is
the activity ratio of 230Th/238U, and δ234U(m) is determined from the activity ratio [234U/238U] by
the relationship: ([234U/238U] - 1) × 1000 (Edwards et al., 1987). The activity ratios 230Th/238U
and 234U/238U are measured using different mass spectrometric instrumentations (TIMS, MC-
ICP-MS, etc.), and when these values are known, the equation can be solved for time (T).
Even though, the equation assumes an ideal initial absence of 230Th, some non-radiogenic 230Th
can be trapped in the cave calcite (or aragonite) minerals and initial 230Th correction is
necessary in the age calculation (Hellstrom, 2006).

25
2.2.7 Previous U-series Investigations of Secondary Cave Deposits
Although the discovery of uranium radioisotopes dates back to the end of the nineteenth
(Bequerel, 1896; Curie, 1898) and early twentieth century (Thomson, 1914), first attempts of U-
series geochronological studies were made only in the 1950’ and 1960’ (Barnes et al., 1956;
Rosholt and Antal, 1962; Cherdyntsev et al., 1965). Only in the 1970’ the U-series techniques
began to be applied as a routine technique to date secondary cave deposits (Ford et al., 1972;
Thompson et al., 1974, 1975; Harmon et al; 1975). However, major issues about the age
accuracy were concerning the ability of measure such low isotopic concentrations in the samples.
Analytical improvements were gained in the late 1980’ with the advance of thermal ionization
mass spectrometry (TIMS) for 234U and 230Th measurements (Chen et al., 1986; Edwards et al.,
1987), and applied for the first time on speleothems by Li et al. (1989). Successively, the
development of the inductively coupled plasma mass spectrometry (ICP-MS) and multi-collector
inductively coupled mass spectrometry (MC-ICP-MS), allowed to precisely measure extremely
low isotopic concentrations (ppb-ppt), increasing the age accuracy of the method for samples
older than ~ 500 kyr (Luo et al, 1997; Cheng et al., 2000; Hellstrom, 2003; Andersen et al.,
2004). A detailed review of the analytical history, improvements and challenges can be found in
Cheng et al. (2013).
2.3 Oxygen and Carbon Isotope Geochemistry of Speleothems
Geochemical analyses of speleothems, and particularly the oxygen and carbon isotopic
compositions, have been widely applied in the past decades to investigate paleoclimate
conditions in terrestrial environments (Hendy and Wilson, 1968; Hendy, 1971; Schwarcz, 1986;
Gasconye, 1992; Dorale et al. (2002), McDermott (2004), Mickler et al., 2004; Fairchild and
Baker, 2012). Variations of oxygen (δ18O) and carbon (δ13C) isotopes in secondary cave calcite

26
reflect changes in the surface and groundwater chemistry, air-water interaction, air masses
circulation, as well as soil component and relative biological activity (Salomon and Mook, 1986;
Smart and Friedrich, 1987; Koster et al., 1993; Baskaran and Krishnamurthy, 1993). In
particular, changes of spelean δ18O values are significantly influenced by the so-called: i)
temperature effect, documented as a positive correlation between mean δ18O value and mean
annual temperature at the cave site; ii) amount effect that reflects an increased δ18O value of
rainwater with the decrease of rainfall amount; iii) ice volume effect, which is a consequence of
changes in isotopic composition of ocean water due to waxing/waning of ice sheets; iv) source
effect that causes δ18O values of rainfalls to vary when they have different moisture sources, and
v) the continental effect manifested by more negative δ18O values with increased distances from
the ocean (Dorale et al., 2002; McDermott, 2004; Mickler et al., 2004; Lachniet, 2009). δ13C
variations in speleothems are largely influenced by: abundance of C3 and C4 plants above the
cave, soil respiration and contribution of soil-derived and atmospheric CO2 to the dissolved
inorganic carbon (DIC), CO2 degassing in the epikarst (prior calcite precipitation; PCP) and
cave, and fluid-bedrock interaction (residence time) during water seepage from the surface to the
cave (Dorale et al., 1998; Mickler, 2004; Hartman and Baker, 2017). More detailed reviews on
oxygen and carbon isotopic variations in speleothems and their application as indicators of
environmental and climatic changes can be found in McDermott (2004); McDermott et al.
(2006); Fairchild et al. (2006), Lachniet (2009), and Fairchild and Baker (2012).

27
CHAPTER THREE:
MATERIALS AND METHODS
3.1 Investigation Sites and Samples Description
A total number of twenty speleothem samples, both flowstones and stalagmites, were
collected from different locations of the eastern region of Mallorca between 2014 and 2018
(Fig. 7). Most of the speleothems were exposed in paleokarst structures developed along the
coastline, at different elevations from the present sea level position. In addition to these, two
stalagmites samples (CF-11 and DR-D20) were recovered respectively from Cova de Cala Falcó and
the worldwide renown touristic attraction Coves del Drac. All the sites investigated in this research
project are shown in Figure 7.
Figure 7. Map of Mallorca showing the location of the sampling sites: Cala Falcó (CF), Coves del Drac
(DR), Dimoni (DIP), sa Ferradura (FE), and na Mitjana (MIP). All locations are color coded.

28
Cala Falcó site (hereafter CF) is a small bay located in the Manacor area, at about 2 km
south of the touristic location of Estany den Mas (Cala Romantica). The cala, like most of the
eastern rocky coastline inlets of Mallorca, developed in the Upper Miocene limestone from the
combined action of coastal erosion and hydrographic incision (Gómez-Pujol et al., 2013). A
conspicuous quantity of meter-size boulders overspread the shoreline, in proximity of which, the
homonym cave (Cova de Cala Falcó) is situated (Fig. 8A). Near the current cave entrance,
collapsed blocks cropping out on the cliffs are covered by a series of cave formations, in which
well-preserved flowstones and stalagmites can be observed (Fig. 8B, E). Sampling campaign
took place between 2017 and 2018.
Figure 8. Cala Falcó site: A) Overview of the cala and the cave entrance; B) Panorama of the paleokarst
structure outcropping on the cliff; C-E) Close up of the sampling points
(photo credits: B.P. Onac and J. McIlrath).
Samples CF-10 and CF-11 were collected a few meters from the cave entrance: CF-10
represents the lowermost part of a well layered, crystalline flowstone unit exposed on the

29
roof of the cavity at ca. 1.5-2 m above present sea level (mapsl) (Fig. 8C); the 4.5 cm tall
stalagmite CF-11 was recovered at ~ 1 mapsl from the upper section of a flowstone formed on
top of a red matrix carbonate sand-size deposit in which fragments of Myotragus sp. bones were
observed (Fig. 8D). The stalagmite was partially broken and highly weathered on its upper
surface. Two samples collected in the paleokarst structure exposed on the cliff outside the cave
from a ~ 23 cm thick flowstone; samples CF-12 and CF-13 represent the inner and lower
portions of the flowstone unit, respectively, whereas CF-14 is the uppermost part of the entire
speleothem section (Fig. 8E). All samples appeared nicely bedded with layers of translucent
compact calcite that alternate with ‘dirty’ calcite strata with detrital presence.
Dimoni site (DIP) is an embayed coastline landform located at ca. 1 km NE of the Porto
Cristo municipality, characterized by polymictic breccia deposits cemented in a red matrix of
carbonate sand and silt (Fornós, 1999) (Fig. 9A-B). Within these sediments, a series of
secondary cave formations of vadose origin, mostly flowstones and stalagmites, are present.
These cave precipitates, along with the breccia deposits, testify to the presence of coastal paleo-
caves, which may have undergone breakdown processes following past sea level oscillations.
Successively, coastal erosion affected the paleokarst structure and modeled the bay geometry.
Although several voids and minor cavities can be observed within these breccias, of great
interest, both scientific and touristic, is Cova del Dimoni. The cave develops in the Tortonian
(Upper Miocene) carbonate units and hosts extraordinary speleothem decorations and spectacular
cave pools directly connected to the sea via submerged passages.
Well preserved flowstones were identified and sampled during the 2014 sampling
campaign in two different locations of the paleokarst structure. DIP-1-A sample was
collected from a 20 cm thick flowstone located at about 5 mapsl. The flowstone is embedded

30
between centimeter- to meter-size cemented carbonate blocks and show well crystallized
columnar compact calcite layers alternating with red-brown, columnar open calcite rich in
detrital impurities (Fig. 9C). Sample DIP-1-B was recovered from an 8-cm thick flowstone
located at ca. 3 mapsl, which consists of cm-size layers of white crystalline calcite
interbedded with thin laminae of red detrital sediment (Fig. 9D).
Figure 9. A) Dimoni outcrop the breccia deposits with flowstones and stalagmites exposed, both
truncated and/or embedded; B) Close up of the red polymictic breccias; C) DIP-1-A and D: DIP-1-B
flowstones, respectively (photo credits: B.P. Onac and J. McIlrath).
Sa Ferradura site (FE) is located at about 500 m NE of Dimoni site. The area is
mostly composed of deposits of meter-to-centimeter size large blocks cemented in a red
carbonate sandy matrix. Embedded in the breccia sediments, a 2 m thick section of

31
flowstone outcrops between ca. 3.5 and 5.5 mapsl. The flowstone presents different
crystalline fabrics, from columnar open to compact, and/or fibrous, and its color varies from
white-grey to red-brown. Three samples were collected from this outcrop (sampling
campaign 2014): FE-1-A (10 cm, white, columnar open calcite) was recovered from the
lower portion at. 3.5 mapsl; FE-1-E (11 cm, dark brown, columnar compact calcite with
coarse crystals) comes from the middle part ~ 4 mapsl; and FE-1-F (7 cm, grey, compact-
microcrystalline calcite alternating with thin layers of detrital sediment) was sampled from
the top flowstone at ca. 5.5 mapsl (Fig.10).
Figure 10. The 2 m thick section of flowstone located in the sa Ferradura site. The sampling points are
shown: FE-1-A (lower), FE-1-E (middle), and FE-1-F (top) (photo credits: B.P. Onac).
Na Mitjana site (MIP) is situated in the northeastern coastline of Mallorca, at about 1
km N of the touristic Coves d’Artà. The bedrock geology of this area consists of Jurassic

32
limestones overlaid by Pleistocene eolianites (Fornós et al., 2012). Na Mitjana Cave
develops within the limestone unit and has its entrance located at ca. 6 mapsl. Surrounding
the cave, remnants of several paleokarst structures comprised of angular metric blocks
cemented in red carbonate sand matrix can be observed. Well preserved flowstones and
other secondary cave precipitates are embedded between boulders and/or in minor voids and
cavities (Fig. 11).
Figure 11. Na Mitjana site. A) Cemented blocks in which embedded speleothems are exposed; B) MIP-1
and MIP-2 sampling points; C) Small cavity on the right side of na Mitjana Cave entrance; D) Close up of
MIP-3 sampling point; E) Close up of the flowstone from which MIP-4-A and MIP-4-B were collected;
F) View of the MIP-5 sample (photo credits: B.P. Onac).
During the 2014 sampling campaign, a total of five samples were collected from different
points of the paleokarst outcrops. Samples MIP-1 and MIP-2 were recovered from a 27 cm thick
flowstone at ca. 7 mapsl. MIP-1 was part of the lower flowstone portion and appeared nicely layered

33
with compact calcite crystals with colors ranging from white to dark-brown, whereas MIP-2 was a 4
cm tall stalagmite formed on top of the flowstone section, 35 cm away from MIP-1 (Fig. 11B).
Samples MIP-3, MIP-4A, and 4B were collected from a cavity located at ca.10-11 mapsl,
on the right side of the Na Mitjana Cave entry (Fig. 11C). MIP-3, consisting of fascicular-fibrous,
white-gray calcite crystals of 3 cm in thickness, was sampled from a mammillary-like speleothem
coating the walls and roof of the void (Fig. 11D). The base of the cavity, at ca. 10.2 mapsl, hosts a
21 cm thick dark-brown flowstone composed of columnar compact calcite, in which two
discontinuities were observed at 5.5 and 11 cm in depth. Samples MIP-4-A and MIP-4-B were
collected from the base and top of the flowstone unit, respectively (Fig. 11E). A few meters above
the Na Mitjana Cave entrance another cavity is present (~ 12 mapsl); from this one, sample MIP-5
was recovered (Fig. 11F). The speleothem growing from the roof of the void showed similarities
to the POS already described in other caves of the island by Ginés et al. (1981), Fornós et al.
(2002a), and Ginés et al. (2012). Two main crystallization patterns were observed on the 7 cm
thick MIP-5 sample: an inner part composed of translucent columnar-crystalline calcite layers
interrupted by thin white inter-strata; and an outer section characterized by brownish, columnar
open-compact calcite laminae interbedded with detrital-rich thin red layers (Fig. 11F).
Lastly, a 10 cm tall stalagmite was collected from Llac Delícìes located in the
easternmost area of the touristic Coves del Drac, very close to the present-day seashore (Fig.
12A and B). It was recovered from ~ 1.1 m below present sea level and appeared highly
weathered on its outer surface (Fig. 12C). However, the cross-section of the sample revealed
distinct morphological features (Fig. 12D). A soda straw was identified in the central part,
surrounded by translucent calcite layers parallel to the growth axis (stalactite) (Fig. 12D). The
smaller part (stalagmite) shows translucent calcite crystals of dark grey color, precipitated on

34
the side and partially englobing the stalactite component. On the upper section, thin white
nicely banded laminae of (probably) aragonite cover the speleothem.
Figure 12. A) Aerial picture of the Portocristo area and location of the Coves del Drac (from Ginés et al.,
2014), B) Image of the Llac Delícìes (photo credit: J. Ginés) , C) Stalagmite DR-D20 showing in its outer
surface weathered white layers; and D) Sample cross-section displaying soda straw, stalactite, and stalagmite
components with the thin white weathered laminae on the upper part.
The in-situ speleothems from Cala Falcó, Dimoni, Sa Ferradura, and Na Mitjana were
particularly well preserved, and indicate the presence of paleo-coastal caves showing evolution under
vadose conditions. The investigation of such cave deposits by means of U-series dating indirectly
imply lower sea level positions and constrain the timing when breakdown and dismantling of the
paleo-caves occurred.

35
3.2 U-series and U-Pb Dating Analyses
Dating analyses were performed in 2018 at the Radiogenic Isotope Laboratory, Department
of Earth and Planetary Sciences, University of New Mexico (Albuquerque, NM) under the
supervision of Drs. Y. Asmerom and V.J. Polyak.
3.2.1 Samples Preparation
All samples were carefully selected and cleaned before the chemical analyses. Wet
cutting procedures were performed using a trim saw with a RIDGID Diamond edge blade
(1.21 mm) and, where applicable, clean and crystalline calcite layers were extracted, cleaned,
and broken into smaller pieces. A few samples, such as CF-11, MIP-5, and DR-D20, were
sliced parallel to the growth axis and instead of pieces, powder sub-samples (0.04-0.12 g)
were drilled from different individual growth layers. Before drilling sample powders, all
surfaces were cleaned to remove external detrital particles from the mineral surface by using
compress air, washed with ionized water, and cleaned with methanol. Prior to column
chemistry, all sub-sample ‘pieces’ were etched for a few seconds with 3% HNO3 in a
Polytetrafluoroethylene (PTFE) cup, rinsed three times in ultra-pure deionized water (18
MΩ), and dried on a hotplate at a temperature of ca. 150-180°C (below PTFE melting
temperature).
3.2.2 Chemical Procedures
Dried etched pieces were wrapped in a clean napkin and crushed in a plastic bag using
a 3" Agate mortar and pestle (Fig. 13A). The smaller pieces were collected in 8 mm
(diameter) plastic tubes (Fig. 13B) and each piece selected for analyses was weighted using a
Mettler Toledo AT261 DeltaRange balance. To avoid any sample contamination throughout
the chemical processes, Teflon still distilled ultra-pure acids were used.

36
Figure 13. Sub-samples preparation and chemical proceedings. Sub-samples are crushed (A), and
stored in tubes (B); C) Dissolved aliquots are spiked, purified and dried down on hotplate;
D-E) U, Th, and Pb are chemically separated (see text for detailed explanation).
For U-series analyses, 0.05-0.15 g mineral aliquots were chosen and dissolved in 15N
HNO3. Solutions were spiked with a synthetic 229Th-233U-236U mixed tracer, fluxed for ~1-2
hours, and dried down at 180°C (Fig. 12C). Additional conditioning steps were made by
adding drops of 15N HNO3 and HClO4 to eliminate any presence of organic contaminants
and to equilibrate the spike with the sample.
For U-Pb dating, I used five mineral aliquots (0.05-0.2 g) for each sub-sample (plus one
blank). These were dissolved in concentrated HNO3, spiked with 229Th-233U-236U-205Pb
mixed solution, and fluxed for ~1-2 hours. Conditioning procedures included several steps
of drying at 180°C and dissolving in 6N HCl, 2N HCl, and 1N HBr.
U, Th, and Pb chemical separations were performed using Eichrom 1x8 chloride form
200-400 mesh anion resin and 2-ml anion exchange disposable polypropylene
37
chromatography columns (Fig. 13D, E). Cations (Ca2+, Mg2+, etc.) were flushed by making
precise loadings of 7N HNO3 for U-Th dating, and 1N HBr for U-Pb dating. U and Th were
collected with 1N HBr and 2N HCl, and Pb was collected with 6N HCl in the first column
set. Th and U were separated in a second set of anion resin columns and collected using 6N
HCl and H2O, respectively. Collected solutions were dried down and were analyzed in 0.4
ml of 3% HNO3.
3.2.3 Analytical Methods
U, Th, and Pb isotopes were measured in separate runs using a Thermo NEPTUNE
multi-collector inductively coupled plasma mass spectrometer (MC-ICPMS), which provided
a simultaneous analysis of up to nine distinct isotopes. Instrumental sensitivity has been
enhanced by a factor of 4 using a Cetac Aridus II desolvating nebulizer system. Ion signals
(counts per seconds [cps]) were measured using a secondary electron multiplier (SEM) and
signals larger than 0.5 E6 cps were measured in volts in the Faraday cups. The SEM detector
in the central position (C in Fig. 14A, B) was used to measure the isotopes of least abundant,
which were 234U and 230Th. The Faraday cups were set to measure the other more abundant
isotopes (L1-L4 and H1-H4 in Fig. 14A, B).
Three different resistors, 1010, 1011, and 1012 Ω, were linked to Faraday cups to
optimize the signal detection up to 500, 50, and 5 volts, respectively. For Pb measurements,
the central position (C in Fig. 14C) was assigned to a Faraday cup with 1012 Ω resistor,
whereas the other isotopic analyses (204Pb, 206Pb, 207Pb, and 208Pb) were assessed to Faraday
cup detectors coupled with 1011 Ω resistors (L1-L4 and H1-H4 in Fig. 14C).

38
Figure 14. Cup configurations and resistors settings on the Thermo NEPTUNE MC-ICPMS for the U
(A), Th (B), and Pb (C) isotopic measurements (modified from LaPointe, 2013).
3.2.4 Data Processing, Age Models and Calculations
The mass spectrometric analyses generated the isotopic ratios datasets; 233U, 234U,
235U/233U, 234U/235U, 235U/233U, and 238U/233U ratios were reported for uranium, whereas 229Th,
230Th, 230Th/229Th, 238U/233U, 230Th/232Th, and 232Th/ 229Th ratios were measured for thorium, and
204Pb, 205Pb, 206Pb/204Pb, 207Pb/204Pb, 208Pb/204Pb, 206Pb/208Pb, 206Pb/207Pb, and 206Pb/205Pb for lead.
For U-Pb age calculations, data reduction was performed using the PBDAT computer
program (Ludwig, 1993). Excess/deficiency of 206Pb and 207Pb from initial disequilibrium were
corrected from initial excess/lack of 234U/238U, 230Th/238U, and 231Pa/235U, respectively (see
Supplementary Material in Polyak et al., 2008). U-Pb ages were calculated following equations 5
and 6 from Schoene (2014).
H4 H4 238U 10
10 Ω H4
H3 238U 10
10 Ω H3 235
U 1011
Ω H3 208Pb 10
10 Ω
H2 236U 10
12 Ω H2 233
U 1012
Ω H2 207Pb 10
11 Ω
H1 235U 10
11 Ω H1 232
U 1011
Ω H1 206Pb 10
11 Ω
C 234U SEM C 230
Th SEM C 205Pb 10
12 Ω
L1 233U 10
12 Ω L1 229
Th 1012
Ω L1 204Pb 10
11Ω
L2 232Th 10
11 Ω L2 L2
L3 L3 L3
L4 229Th 10
12 Ω L4 L4
U configuration Th configuration Pb configuration
Thermo NEPTUNE Cup Settings
B CA

39
Isochron ages were determined using the computer program ISOPLOT (Ludwig, 2001),
and ages expressed as two dimensional (2D) and three dimensional (3D) isochron dates. Updated
decay constants for 235U and 238U are reported by Schoene et al. (2006).
U-series ages were calculated following the equation (8) from Kaufman and Broecker
(1965) and modified by Dorale et al. (2004). Updated 234U and 230Th decay constants are from
Cheng et al. (2013).
δ234U model age was generated for samples that lied outside the U-Th dating range (~500-
600 kyr) using the 234U/238U geo-chronometer. In creating the model, assumptions for initial δ234U
were needed and those estimations, taken from dateable samples, were used to calculate the ages
using the following equation from Edwards et al. (1987):
𝛿234
𝑈(𝑚) = 𝛿234
𝑈(𝑖)𝑒−𝜆234𝑇 (9)
Finally, a uranium-evolution curve was created using ISOPLOT computer program
(Ludwig, 2001), plotting the activity ratios of 234U/238U (y-axis) and 230Th/238U (x-axis), which was
useful to assess the uranium systematics of the samples. This allowed to check if the speleothems
analyzed showed evidence supporting that they have remained in a closed system since their
formation or have undergone any alteration process (erosion, diagenesis, etc.) through time. Age-
depth model for the stalagmite CF-11 was generated in the open source statistical software R using
the algorithm StalAge developed from Scholz and Hoffmann (2011).
3.3 Oxygen and Carbon Isotopic Analysis
A total of 72 powders (50-120 g each) were micro-milled at 0.5 mm distance along the
growth axis of stalagmite CF-11 using a SHERLINE (model 5410) vertical drilling device. The
sample was positioned on a mobile platform connected to a readout tachometer in order to ensure
a stable and precise/controlled spacing during the drilling. The calcite powders were

40
subsequently reacted with concentrated H3PO4 at 25C in airtight vials for 24 hours, and the CO2
generated from the reaction was measured for oxygen and carbon isotopic ratios. The analyses
were performed in the Stable Isotope Laboratory of the School of Geosciences (University of
South Florida) using a ThermoFisher Scientific Delta V Advantage isotope ratio mass
spectrometer (IRMS). The 13C/12C and 18O/16O values were reported as δ-values (δ13C and δ18O)
in ‰ (permil), and corrected to the Vienna Pee Dee Belemnite (VPDB) scale using repetitive
analyses of the NBS-19 and Old-Car standards. The replicate measurements showed
reproducibility of ± 0.06 for δ13C and ± 0.11 for δ18O.

41
CHAPTER FOUR:
RESULTS
This chapter presents the results of the U-series and U-Pb analyses performed on speleothems
from the eastern part of Mallorca. In the first section, samples are discussed individually on a
location basis, whereas in the second part, the ages and uranium systematics are collectively
presented. All the speleothems showed low uranium content, ranging between 30 and 400 ppb, and
low to moderately high detrital Th variations (from 20 to 31,600 ppt). The majority of investigated
samples revealed ages close to the U-series dating limit (~600 kyr) and exhibited high age
uncertainties. Apart from these, samples CF-11, MIP-5, and DR-D20 indicate younger ages,
between 200 and 80 kyr, and are presented in separate paragraphs.
4.1 Cala Falcó
The samples CF-10, CF-12, CF-13, and CF-14 (Fig. 15A-D) from Cala Falcó had uranium (238U)
concentrations, ranging from 256 to 388 parts per billion (ppb). Moderately high thorium (232Th)
contents (relative to 238U concentrations) of 1,259 and 6,934 parts per trillion (ppt) were measured in
flowstones CF-10 and CF-12, respectively, whereas Th concentrations vary between 20 and 30 ppt in
CF-13 and CF-14 flowstones (see Appendix A, Table A1). Soil and bedrock are the principal
sources of detrital Th in vadose speleothems, such as flowstones and stalagmites (Polyak and
Asmerom, 2009). Thorium (mostly 232Th, and subordinately detrital 230Th) is absorbed at the surface
of clays minerals, colloids, and/or organic matter into the soil-zone and transported by the water
through the bedrock fractures inside the cave, where it is trapped in the speleothem, along with 238U
and 234U at the time of calcite precipitation (Richards and Dorale, 2003). Higher 232Th

42
concentrations, as observed in the samples CF-10 and CF-12, may suggest a major contribution of
soil-derived detrital Th, whereas lower concentrations, like those measured in the samples CF-13 and
CF-14, may indicate a more bedrock-derived input.
Figure 15. Speleothem samples from Cala Falcó used for U-series dating. The yellow bands mark
the position and code of each subsample.
The U-series age of flowstone CF-10 was 465 (+26/-22) kyr. The CF-12 inner flowstone and
the uppermost part of the CF-14 outcrop in the paleokarst structure on the cliff outside the cave (Fig.
8B, E), yielded U-series ages of 558 (+75/-50) and 500 (+51/-38) kyr, respectively. For the CF-13
flowstone, two U-series dating attempts were made, but none yielded robust results. The 230Th/234U
activity ratios of CF-13 indicate an age older than ~650 kyr, which is the 230Th-234U dating limit.
Nevertheless, initial δ234U values of 111‰ and 117‰ obtained from our analyses allowed the
generation of a δ234U model age of 653 (+32/-30) kyr (following the Eq. 9 in Chapter 3) with the
assumption that the initial δ234U of all these older flowstones does not differ significantly.

43
4.1.1 Stalagmite CF-11
The 4.5 cm tall stalagmite CF-11 from Cova de Cala Falcó shows concentrations of U
between 225 to 393 ppb and high variation in Th contents from 72 to 10,177 ppt (see Appendix
A, Table A1). Five U-series ages, at 35, 21, 18, 13, and 10 mm from top-down (color-coded
bands; Fig. 16A) were measured; the lowermost subsample (CF-11-35) formed 85.7 ± 0.5 ka,
whereas the uppermost CF-11-10 is 84.4 ± 0.4 kyr. The intermediate laminae (CF-11-18 and
CF-11-13) revealed U-series ages of 85.5 (+1.19/-1.17) kyr and 84.6 ± 0.9 kyr, respectively.
Subsample CF-11-21 has an age of 84.1 (+1.7/-1.2) kyr, thus is out of stratigraphic order (black
band in Fig. 16A), but its error range makes it acceptable. The high-resolution stratigraphy of
the CF-11 stalagmite is shown in Figure 16B.
Figure 16. Stalagmite CF-11. A) Cross section of the sample showing its individual growth layers and
internal corrosion features. The subsamples (color bands) used for U-series dating are also marked. CF-
11-21 (black band) denotes the outlier age. The double white lines represent brief hiatuses (corrosion
layers) at 20 and 11 mm from the top, respectively. B) Age-depth model for CF-11 stalagmite
(see text for details).

44
Even though most of the 230Th in speleothems is originating from the 234U decay, small
amounts of 230Th (detrital) are initially incorporated in the calcite minerals at the time of precipitation
and must to be accounted for in the age calculation. The 230Th/232Th atomic ratio commonly used in
the literature for the initial 230Th-232Th age correction is 4.4 × 10⁻⁶ ppm, which is assumed from the
Bulk Earth 232Th/238U ratio at secular equilibrium of ~3.8 (Ivanovich and Harmon, 1993; Kaufmann,
1993). However, soil and bedrock sources may contribute different isotopic ratios to the initial
230Th/232Th in the samples, with the soil-zone having 230Th/232Th signature very small (~0.0000044
ppm) compared to the bedrock 230Th/232Th values (~100 ppm) (Dorale et al., 2004). Presuming that
‘detrital’ 230Th and 232Th are chemically equivalent, and 232Th can be used to monitor 230Th, the
initial 230Th/232Th ratios were calculated for all the subsamples following the equation shown in
Figure 17.
Figure 17. Plot of 232Th vs Initial 230Th/232Th correction for all the subsamples (color-coded) and their
corresponding absolute 2σ errors. The equation used to calculate the initial 230Th/232Th correction is also
shown. The x values were assumed for each subsample from different 230Th concentrations in accordance
with the stratigraphic order.
CF.11.13
CF.11.10
CF.11.35
CF.11.21CF.11.18
0.0E+00
2.0E-05
4.0E-05
6.0E-05
8.0E-05
1.0E-04
1.2E-04
1.4E-04
1.6E-04
0 2000 4000 6000 8000 10000 12000
Init
ial
23
0T
h/2
32T
h
232Th (ppt)
(𝑇ℎ230
𝑇ℎ232 )𝐼𝑛𝑖𝑡𝑖𝑎𝑙 = 0.000562 · 𝑇ℎ232 – 𝑥

45
As suggested by Polyak and Asmerom (2009), relatively young vadose speleothems with low
uranium content, exhibit very high sensitivity to this correction for initial 230Th concentrations. The
correction curve generated by plotting the calculated initial 230Th/232Th ratios vs 232Th, shows a non-
linear trend (Fig. 17). Initial 230Th/232Th variations showed an inverse correlation with the 232Th
content. Subsamples with high detrital 232Th (CF-11-21, CF-11-18, and CF-11-13) in this model
exhibited low 230Th/232Th values, indicating a major contribution of detrital Th from the soil zone,
whereas those with low 232Th concentrations (CF-11-35 and CF-11-10) exhibit higher initial
230Th/232Th, evidencing more detrital Th coming from the bedrock. Moreover, at 20 and 11 mm
from the upper part, two corroded (reddish) laminae were identified (white double lines in Fig. 16A),
suggesting potential hiatuses caused by corrosion/weathering processes at ca. 85 and 84.5 ka.
The δ18O values (blue curve in Fig. 18) range from -5.1 to -2.0 ‰ with an average of -3.2 ‰.
From 85.7 to 85.6 ka the oxygen isotope values show a sharp decrease from -3.07 to -5.01 ‰, then
increase to -2.5 ‰ before dropping back to -3.78 ‰ at 85.5 ka.
Figure 18. The 18 O and 13C time series for stalagmite CF-11.

46
Between 86.4 and 84.7 ka, the δ18O values fluctuate between -2.6 and -3.94 ‰ (mean of -
3.39 ‰), with negative peaks at -4.14 and -4.52 ‰ at 85.3 and 85 ka, respectively. Subsequently,
another rise of -1.50 ‰ is observed from 84.76 (-3.50 ‰) to 84.7 ka (-2.0 ‰). After this change,
δ18O values fluctuate between -3.52 and -2.35 ‰ from 84.6 to 83.7 ka, reaching -4.06 ‰ at 83.6 ka.
The carbon isotope values (orange curve in Fig. 18) range between -7.07 and -1.03 ‰ with a
mean of -4.87 ‰. The δ13C record exhibits an overall similar trend with the δ18O profile, although
showing larger fluctuations and higher values between the period 85-84.4 kyr and 84-83.6 kyr.
The highest δ13C values are recorded at 84.5 ka (-1.23 ‰) and 83.7 ka (-1.03 ‰), whereas the
lowest were measured at 85.4 ka (-6.86 ‰) and at 84.1 ka (-7.07 ‰). From 85.7 to 85 ka, the carbon
isotopic profile displays a gradual increase with small fluctuations. After the peak at 84.5ka, δ13C
values present a rapid decrease within a range of -4.74 ‰ between 84.4 and 84.1 ka, and suddenly
rise to -1.03 ‰ at 83.7 ka, before dropping abruptly to -5.23 ‰ at 83.6 ka.
4.2 Dimoni
Two subsamples (DIP-1A-1 and DIP-1A-2) from flowstone DIP-1A and one from DIP-1B
(DIP-1B-1) were analyzed by U-series dating (Fig. 19A, B); uranium concentrations vary between
313 and 458 ppb. DIP-1A subsamples exhibit moderate detrital 232Th content (1.1 ppb and 2.7 ppb),
whereas DIP-1B-1 shows very low detrital 232Th value (17 ppt) (see Appendix A, Table A1).
Although no robust U-series dates were obtained, the 230Th and 234U values indicate a
potential age beyond 600 kyr. However, the δ234U model ages for the samples followed the Eq. 9 in
Chapter 3. According to Ludwig et al. (1992) and Polyak et al. (2013), single speleothem samples
spatially distant may show a relative concordance of initial δ234U values over a long time. For the
DIP flowstones, initial δ234U values were assumed to be concordant with the nearby sample FE-1-F l
from sa Ferradura site, with δ234U variations of 45 ‰ (low) and 50 ‰ (high).
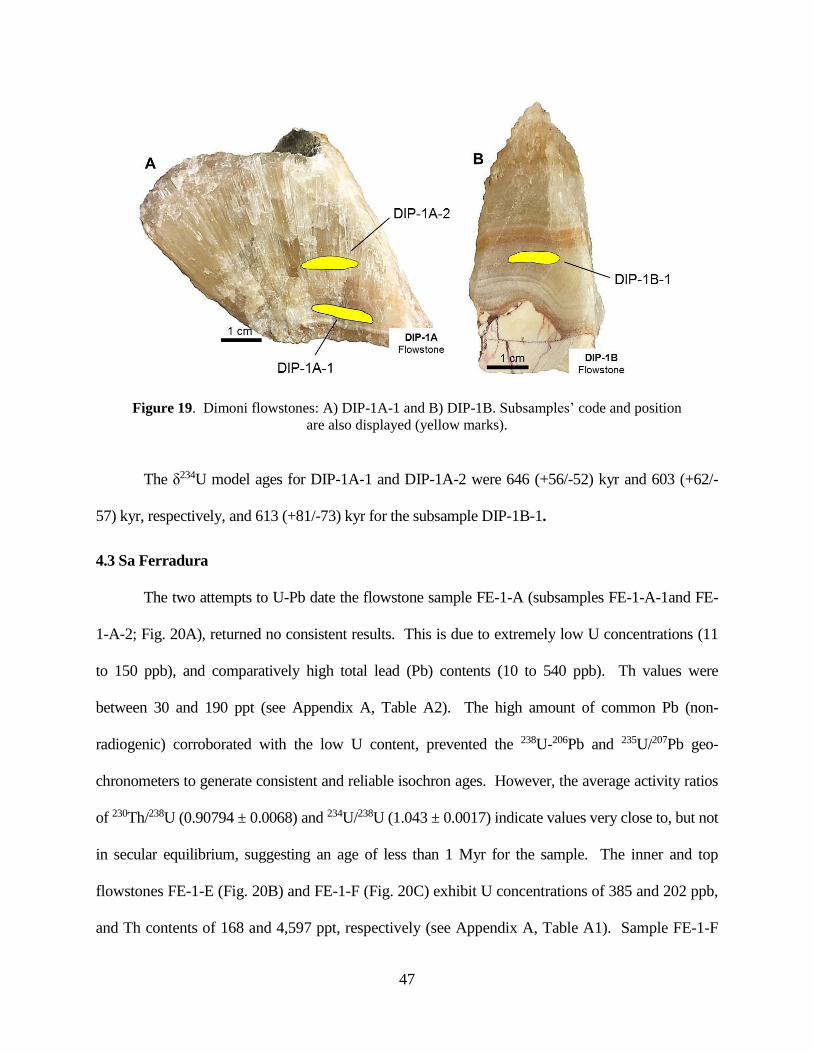
47
Figure 19. Dimoni flowstones: A) DIP-1A-1 and B) DIP-1B. Subsamples’ code and position
are also displayed (yellow marks).
The δ234U model ages for DIP-1A-1 and DIP-1A-2 were 646 (+56/-52) kyr and 603 (+62/-
57) kyr, respectively, and 613 (+81/-73) kyr for the subsample DIP-1B-1.
4.3 Sa Ferradura
The two attempts to U-Pb date the flowstone sample FE-1-A (subsamples FE-1-A-1and FE-
1-A-2; Fig. 20A), returned no consistent results. This is due to extremely low U concentrations (11
to 150 ppb), and comparatively high total lead (Pb) contents (10 to 540 ppb). Th values were
between 30 and 190 ppt (see Appendix A, Table A2). The high amount of common Pb (non-
radiogenic) corroborated with the low U content, prevented the 238U-206Pb and 235U/207Pb geo-
chronometers to generate consistent and reliable isochron ages. However, the average activity ratios
of 230Th/238U (0.90794 ± 0.0068) and 234U/238U (1.043 ± 0.0017) indicate values very close to, but not
in secular equilibrium, suggesting an age of less than 1 Myr for the sample. The inner and top
flowstones FE-1-E (Fig. 20B) and FE-1-F (Fig. 20C) exhibit U concentrations of 385 and 202 ppb,
and Th contents of 168 and 4,597 ppt, respectively (see Appendix A, Table A1). Sample FE-1-F

48
indicates a U-series age of 478 (+29/-25) kyr, whereas FE-1-E shows 234U/238U and 230Th/238U
activity ratios of 0.9991 ± 0.0014, suggesting secular equilibrium.
Figure 20. Flowstone samples from sa Ferradura site: A: FE-1-A; B: FE-1-E; and C: FE-1-F.
Subsamples location (in yellow) and related codes are also shown.
Therefore, no robust U-series age was determined for this sample. However, a δ234U model age
was attempted assuming a present δ234U value of 10 ± 1 ‰ and a variation of the initial δ234U
between 45 ‰ (low) and 60 ‰ (high). These values represent the measured and initial δ234U of
the younger sample FE-1-F. The obtained δ234U model age of 583 (+88/-85) kyr is in agreement
with the stratigraphy of the flowstone.
4.4 Na Mitjana
Samples MIP-1 (Fig. 20A) from na Mitjana show very low uranium concentrations of 80
ppb and thorium content around 650 ppt. The uranium value in MIP-2 (Fig. 21B) was about 139
ppb, whereas Th concentration was 3,040 ppt (see Appendix A, Table A1).

49
Figure 21. Na Mitjana samples: A) MIP-1; B) MIP-2; C) MIP-3; D) MIP-4A; and E) MIP-4B.
Subsamples position (in yellow) and code are indicated for each speleothem.
U-series analyses indicate an age of 451 (+46/-35) kyr for the flowstone MIP-1 and 515
(+74/-49) kyr for stalagmite MIP-2. The mammillary-like speleothem MIP-3 (Fig. 21C) had
very low U content (82 ppb) and somewhat elevated Th concentration (5,730 ppt). The amount
of uranium in the flowstone samples MIP-4A (Fig. 21D) and MIP-4B (Fig. 21E) was 176 and
115 ppb, and Th contents of 1,085 and 203 ppt, respectively (Appendix A, Table A1). MIP-4B
revealed a U-series age of 507 (+89/-55) kyr. For the samples MIP-3 and MIP-4A, δ234U model ages
were generated assuming initial δ234U values varying from 33 ‰ (low) to 37 ‰ (high). These
assumptions result from calculating the average initial δ234U values from MIP-1, MIP-2, and MIP-4B
(33 ‰) for the low end, and taking as higher δ234U limit (37 ‰) the initial δ234U of MIP-4B sample
was used. The δ234U model produced ages of 580 (+77/-69) kyr for the mammillary-like calcite
MIP-3, and 590 (+78/-71) kyr for the top flowstone MIP-4A.

50
4.4.1 Sample MIP-5
Five powder aliquots, corresponding to 3, 8, 16, 18, and 25 mm from the outer surface,
were milled-out from speleothem MIP-5 (Fig. 22). Their uranium concentrations vary between
35 to 271 ppb, whereas the Th content was relatively high (3.5 to 16.5 ppb; see Appendix A,
Table A1). The presence at 20 and 23 mm below surface of thin interlayers of white color,
suggest distinct intervals of calcite precipitation hiatuses. Four subsamples located above (3 to
18 mm) and one below (25 mm) the hiatuses were dated by means of U-series technique. Due
to the higher detrital 232Th contamination, age calculations were corrected for the initial
230Th/232Th using an atomic ratio of 2.0 × 10⁻⁵ ppm (higher than the bulk Earth ratio). MIP-5-
18 revealed an age of 296 ± 2.7 kyr and MIP-5-16 of 284 ± 2.8 kyr. The outer subsamples
MIP-5-8 and MIP-5-3 yielded U-series ages of 224 ± 1.5 kyr and 186 ± 1.5 kyr, respectively.
Figure 22. Cross-section of MIP-5 sample. Powder subsamples and codes are displayed in yellow.
Hiatuses at 20 and 23 mm (from the outer surface) are shown in white.
The innermost MIP-5-25 (drilled below the hiatuses) did not returned a finite age,
indicating that it is potentially older than 600 kyr. A δ234U model age of 1.08 ± 0.06 Myr was
generated for the subsample using assumed initial δ234U values of 249‰ and 303‰ from the

51
lowest and highest initial δ234U, respectively. These ages document a long period (1.08 to 0.3
Ma) during which calcite precipitation ceased.
4.5 Coves del Drac
4.5.1 Speleothem DR-D20
From a short, 8 cm sample (DR-20) collected for a Holocene sea-level study, a total of
11 U-series analyses were measured as follows: one powder from the center section of the soda
straw and 3 aliquots at 3.5, 12.5, and 16.5 mm away from the straw (Fig. 23). Only one
subsample (DR-D20-4S) comes from the outer part of the smaller stalagmite (Fig. 23 left).
Uranium concentrations varied between 135 and 371 ppb, whereas thorium content ranged
from 36 to 1,113 ppt (see Appendix A, Table A1). Age correction of detrital Th assumed an
initial 230Th/232Th atomic ratio of 4.4 × 10⁻⁵ ppm, which is higher than the widely used 4.4 ×
10-6 ppm and to be applicable to the large 232Th variation observed in the speleothem. These
four subsamples of DR-20 represent a stalactite with a soda straw inner core. The age of the
soda straw sample is 225 ± 1 kyr, and the stalactite subsamples produced ages of 221 ± 1 kyr
(3.5 mm), 217 ± 0.8 kyr (12.5 mm), and 212 ± 0.7 kyr. The other subsamples of DR-20
represent a stalagmite that engulfed the stalactite. The age generated from the small stalagmite
(code 4S) was 199 ± 2.1 kyr at the top. Four U-series dates were measured from the uppermost
thin white layers: three at 3 mm (3A, 3B, and 3C) and one at 6 mm from the top surface (6).
The elevated U contents, between 2,450 and 4,820 ppb, and Th concentrations from
4,000 to 31,600 ppt (see Appendix A, Table A1), suggest a possible aragonitic composition
of the subsamples, but with high detrital component. The U-series age obtained for DR-D20-
6 was of 84 ± 0.3 kyr, whereas the DR-D20 (3A, 3B, and 3C) revealed discordant ages of 55
± 0.07, 64 ± 0.08, and 61 ± 0.3 kyr.

52
Figure 23. Cross section of sample DR-D20. Morphological components of the speleothem are indicated
and labeled. The original soda straw is shown in orange (dashed) and the stalactite-stalagmite contact in
black (line). Yellow: subsamples for U-series ages used in this study; Grey: subsamples that provided
unreliable U-series ages; Red: subsamples of whose ages were discarded and not included in the study.
Although all three calculated ages are very precise, the results are rather inconsistent
between them, which may suggest carbonate deposition and successive weathering anytime
between 85 and 60 ka.
4.6 U-series Systematics and Ages of Investigated Speleothems
To test the uranium systematics of all samples, an evolution curve (234U/238U ratio vs
230Th/238U) was generated using the Isoplot computer program (Ludwig, 2001) (Fig. 24).
The graphic displays the evolution patterns of samples having different initial δ234U
values. This allows to identify any obvious alteration of the calcite/aragonite minerals after
precipitation, and thus, an effective test supporting the reliability of the U-series ages. As
mentioned earlier, most samples with ages between 450 and 700 kyr cluster close to the secular
equilibrium (s.e.) line (red dashed in Fig. 24). A number of samples, specifically DIP-
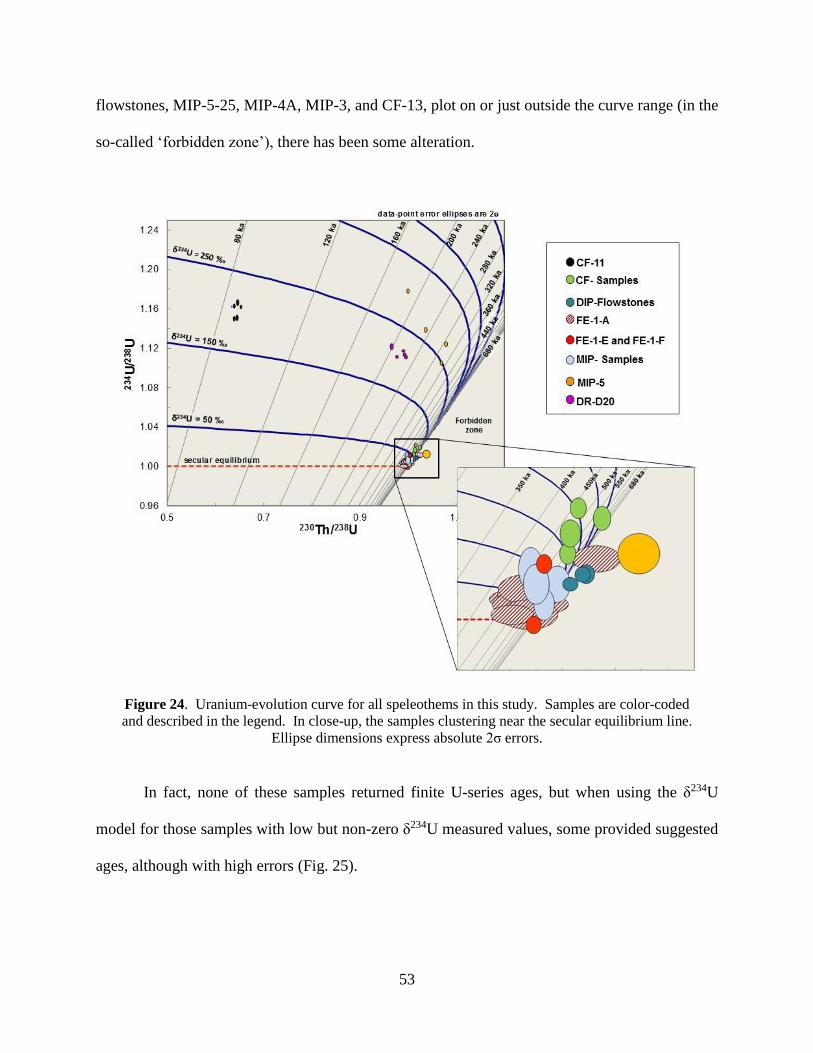
53
flowstones, MIP-5-25, MIP-4A, MIP-3, and CF-13, plot on or just outside the curve range (in the
so-called ‘forbidden zone’), there has been some alteration.
Figure 24. Uranium-evolution curve for all speleothems in this study. Samples are color-coded
and described in the legend. In close-up, the samples clustering near the secular equilibrium line.
Ellipse dimensions express absolute 2σ errors.
In fact, none of these samples returned finite U-series ages, but when using the δ234U
model for those samples with low but non-zero δ234U measured values, some provided suggested
ages, although with high errors (Fig. 25).
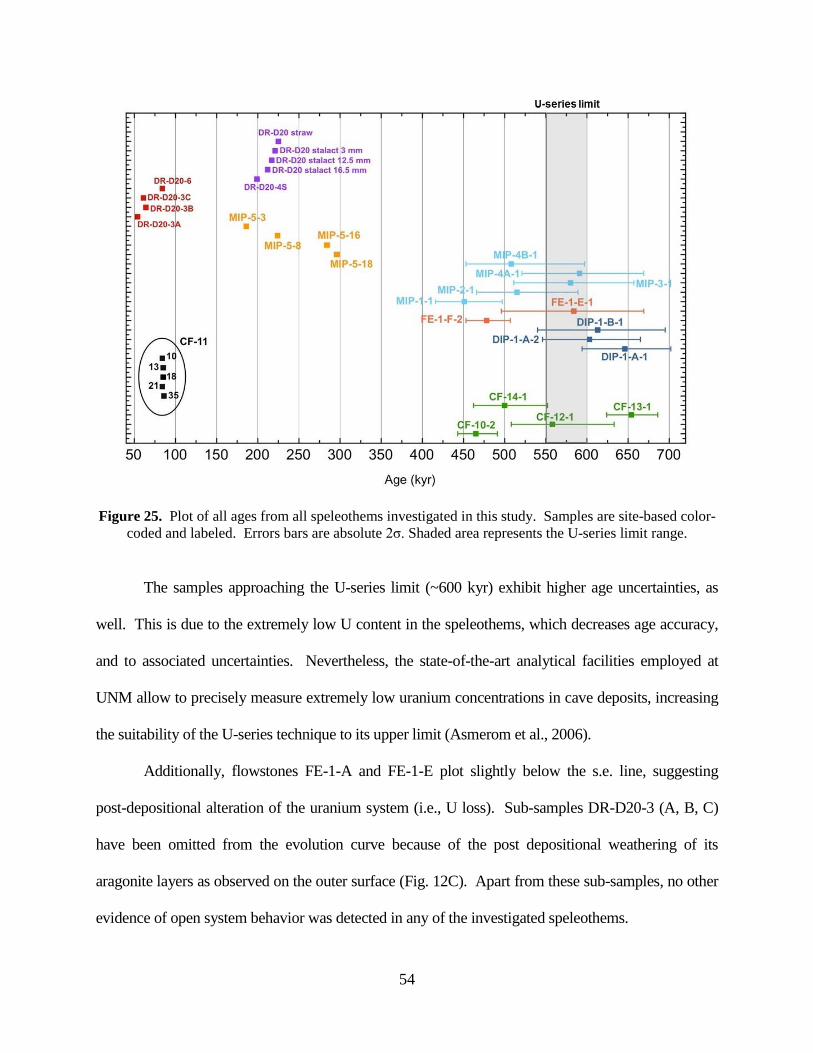
54
Figure 25. Plot of all ages from all speleothems investigated in this study. Samples are site-based color-
coded and labeled. Errors bars are absolute 2σ. Shaded area represents the U-series limit range.
The samples approaching the U-series limit (~600 kyr) exhibit higher age uncertainties, as
well. This is due to the extremely low U content in the speleothems, which decreases age accuracy,
and to associated uncertainties. Nevertheless, the state-of-the-art analytical facilities employed at
UNM allow to precisely measure extremely low uranium concentrations in cave deposits, increasing
the suitability of the U-series technique to its upper limit (Asmerom et al., 2006).
Additionally, flowstones FE-1-A and FE-1-E plot slightly below the s.e. line, suggesting
post-depositional alteration of the uranium system (i.e., U loss). Sub-samples DR-D20-3 (A, B, C)
have been omitted from the evolution curve because of the post depositional weathering of its
aragonite layers as observed on the outer surface (Fig. 12C). Apart from these sub-samples, no other
evidence of open system behavior was detected in any of the investigated speleothems.

55
CHAPTER FIVE:
DISCUSSION
Here I discuss the results of our investigations suggesting new timeline insights on the
coastal caves genetic processes in the eastern Mallorca. In the first section, I describe in detail
the evolution of the different paleo-caves on a location-basis with major emphasis on the sea
level implications in the various speleogenetic phases. In the second part, I concentrate on two
of the speleothems examined, DR-D20 (Coves del Drac) and CF-11 (Cova de Cala Falcó),
discussing how they constrain the relative sea level between Marine Isotope Stages 7 and 5a and
their paleoenvironmental significance.
5.1 Mallorcan Coastal Karst and Relative Sea Level Changes over the Past 750 kyr
The long-term sea level variations in the western Mediterranean are mainly controlled by:
changes in size and distribution of ice sheets, which cause glacial isostatic (GIA) effects, thermal
expansion/contraction, dynamic topography (DT), and meteorological components (wind,
atmospheric pressure) (Gamis et al., 2012). The reconstruction of Mediterranean sea-level
(especially the western basin) using benthic and planktonic foraminifera δ18O is more complex
than at other sites (e.g., Red Sea) (Rohling et al., 2009). This is due to changes in salinity caused
by the Atlantic water input through the Strait of Gibraltar and the catchment basins of rivers
entering the Mediterranean Sea, which collect water from different climate regions (Rohling et
al., 2014). Given all these, sea level reconstructions based on oxygen isotopic composition of
carbonate microfossils in the central and western Mediterranean cannot be applied per se and
relative sea level (RSL) indicators such as speleothems (POS, submerged stalagmites with marine

56
biogenic encrustations, etc.), beach deposits, marine terraces, and shore platforms are
unequivocally essential to investigate past sea level changes in the central-western Mediterranean
region (Fornós et al., 2002a; Antonioli et al., 2004; Tuccimei et al., 2006; Dutton et al., 2009;
Dorale et al., 2010; Zazo et al., 2013; Lorscheid et al., 2017; Polyak et al., 2018). However, RSL
records for periods before ~250 kyr are rather poorly preserved and documented, most of which
have been described in the coastal caves of Mallorca Island (Dumitru et al., 2018). Alongside with
the POS, which are direct sea-level markers, vadose speleothems such as flowstones and
stalagmites are also used as indirect evidence of maximum past sea level stands (Onac et al., 2012;
Van Hengstum et al., 2015). These types of speleothems can precipitate under vadose conditions
in coastal caves by dripping/seeping of water percolating from surface into the cavities. In coastal
caves, episodes of flooding, mainly linked with sea level rise and/or increase of rainfall, cease
calcite (or aragonite) deposition, causing corrosion and weathering of the speleothems surface
(Harmon, 1978; Richards, 1994). Investigating such secondary cave deposits, relevant information
regarding coastal karst basins evolution, dynamics, and processes can be generated.
Our radiometric dating of speleothems exposed on the eastern coastline karst of Mallorca
suggest they formed between 650 and 450 ka when the relative sea level fluctuated from at least
two or more meters below present sea level (mbpsl) during MIS 17, 15, and 13 (interglacials) to
tens of meters below the present-day datum during cool stadials 16, 14, and 12 (Fig. 26). Since
RSL estimates of this period are rather scarce in the western Mediterranean, our results are
compared with two eustatic sea level (ESL) curves from Naish and Wilson (2008), and Spratt and
Lisiecki (2016), both generated from a stack of globally scattered benthic foraminiferal δ18O
records (Lisiecki and Raymo, 2005). The ESL curves (orange and blue in Fig. 26) suggest that
global mean sea level did not reached the present-day elevation, but peaked at ~5-7 mbpsl during

57
the MIS 17 and 15 interglacials. These reconstructions indirectly support our records from
Mallorca, although no precise estimates of relative sea level position can be generated for this
interval. Nevertheless, new benchmarks regarding the timing of distinct speleogenetic stages and
the alternation of phreatic-vadose conditions in the coastal karst of Mallorca are provided.
Figure 26. Ages of the speleothems from our study and eustatic sea level (ESL) reconstructions from
Naish and Wilson (2008) (orange curve), and Spratt and Lisiecki (2016) (blue curve). Speleothem
samples are color-coded. All age errors are absolute 2σ. Gray shaded box indicates the period of possible
breakdown and dismantling of the paleo-caves investigated in this study. Marine Isotopes Stages (MIS)
are also labeled.
In addition, I propose new insights into the littoral dynamics that occurred during the
precipitation of vadose speleothems and cave breakdown events as a consequence of multiple
cycles of sea level transgressions/regressions.
Models of coastal speleogenesis in the eogenetic karst of Mallorca were earlier presented
by Ginés and Ginés (1992) and Ginés (2000). More recent explorations of subaqueous passages in
58
caves such as Coves del Drac, Cova de sa Gleda, Cova Genovesa, and Cova des Pas de
Vallgornera brought new information on the speleogenetic processes, particularly those related
with the role of ceiling collapse in the caves’ development (Ginés et al., 2008; Gràcia et al., 2009,
2010; Ginés et al., 2014). By integrating our radiometric investigations with these previous
models, better frame the timescale of various speleogenetic phases (see Fig. 27) were provided,
which in turn allowed to place constraints on sea level changes during middle-to-late Pleistocene in
Mallorca. Sea level regression during late Messinian caused the subaerial exposure of the upper
Tortonian-early Messinian carbonate lithostratigraphic sequences (calcisiltites, calcarenites, and
reefal limestones). During this period, referred as the Messinian Salinity Crisis peak (MSC, 5.9-
5.3 Ma), the Mediterranean basin may have experienced a sea level drop of about 800-1200 m,
opening migration corridors that allowed terrestrial mammalian fauna (i.e., Myotragus sp.,
Hypolagus sp., etc.) to colonize the Balearic Islands (Mas et al., 2018). Before and after the MSC
peak, sea level may have oscillated at different rates and magnitudes. At times during these
intervals the mixtures of fresh and marine waters initiate the dissolution of the aragonitic
component of the reefal unit, generating proto-voids in the so-called mixing zone (Fig. 27-1).
Successive sea level rise during the early-middle Pliocene yielded to an upward movement of
mixing-corrosion zone intensifying the carbonate dissolution and further development of the
cavities (Fig. 27-2). U-Pb dating analyses of POS from Coves d’Artà (NE Mallorca) recorded sea
level positions between 23 and 32 mapsl from 4.5 to 3 Ma corroborating a rather long period of
high sea-stands in the western Mediterranean corresponding to the Pliocene Climatic Optimum
(4.4-4 Ma) and the Mid-Pliocene Warm Period (3.3-3 Ma) (Dumitru et al., 2018a). These new
Pliocene RSL records add relevant information to the sea level history of the Mediterranean basin
and support our interpretations of this coastal speleogenetic stage (Fig. 27-2) in Mallorca.

59
Figure 27. Conceptual model showing the different speleogenetic stages in the evolution of the coastal
caves in the eastern Mallorca [modified after Ginés and Ginés (1992) and Ginés et al. (2014)]:
1) Cave genesis in the mixing zone, 2) Sea level rise and further cave development, 3) Collapses
following sea level drop, 4) Vadose speleothems precipitation, 5) Partial collapse of ceiling and
cementation of breakdowns, and 6) Coastal erosion that exposes speleothems at surface
(See text for detailed explanation).

60
After this interval of relatively high sea-level stands, glacio- and hydro-eustatic-related
sea level variations continued to manifest throughout the late Pliocene-early Pleistocene in this
region of the Mediterranean as a response to ice-sheet waxing/waning (Raymo et al., 2006; Naish
et al., 2009; Pollard and DeConto, 2009). The proto-caves formed in the mixing zone
experienced periodic episodes of evolution under vadose (water free) and phreatic (flooded)
conditions. During sea-level high stands (phreatic stage), the cavities continued to increase their
volume due to further dissolution caused by mixing of marine and fresh water. As sea level
dropped, water abandoned the caves, and this triggered episodes of conspicuous breakdown
along the fractures and joints, generating larger caves (Fig. 27-3). In some cases, the limestone
blocks that accumulated on the cave floor were partially filled with fine-grained sand and clay
containing fossil remains. The sediments were transported underground by surficial runoff or via
percolating meteoric water during exceptional rainfall events. These periodic flooding and
collapse events may have persisted until middle-Pleistocene, creating caves of remarkable
dimensions.
As already mentioned, some middle Pleistocene sea level reconstructions indicate high
stands lower than today, and the caves along the eastern coast of the island may have
experienced long and substantial phases of development under vadose conditions. By applying a
conservative approach regarding the global mean sea level estimates to Mallorca (Fig. 26 the
seashore may have experienced significant regressions within ~100-200 m seawards linked
particularly to cool events (Fig. 27-4), which exposed extensive portions of the carbonate
platform to subaerial conditions. During this time, meteoric and sub-surface hydrological
processes (e.g., percolation, etc.) were the major factors in the development of caves by means of
extensive breakdown mechanisms (passage morphology, pattern, etc.), and noteworthy amounts

61
of flowstones and stalagmites were deposited (Fig. 27-4). Our study documents a synchronous
precipitation of vadose speleothems happening in different cave locations between ~650 and
~450 ka. This suggests periods with frequent rainfall events that helped maintaining a steady
drip water supply to caves and thus abundant speleothem deposition. The presence of a
conspicuous vegetation coverage may have increased the organic matter content in the soil, and
consequently more availability of CO2 in the percolating waters increased the dissolution of the
carbonate layers. This hypothesis is supported by our measurements that reveal moderately high
values of 232Th in the speleothem samples, indicating a strong contribution of non-radiogenic Th
from soil. Besides our radiometric investigations, dating of various speleothems from other
Mallorcan and western Mediterranean caves (Hodge, 2004), support our interpretations regarding
these vadose phases and RSL low stands during middle Pleistocene. However, the
geomorphological settings may have undergone significant changes throughout the middle and
upper Pleistocene, when sea level fluctuations caused recurrent flooding of the cavities that
ceased speleothems growth. Estimates of ESL variations, and RSL indicators from Spain and
Italy, suggest that sea level high stands occurred during the MIS 11, 9, 7, and 5 (Lisiecki and
Raymo, 2005; Tuccimei et al., 2006; Naish and Wilson, 2008; Dutton et al., 2009; Dorale et al.,
2010; Rohling et al., 2010; Zazo et al., 2013; Spratt and Lisiecki, 2016; Lorscheid et al., 2017;
Polyak et al., 2018; Stocchi et al., 2018). Throughout the interglacial periods the coastal caves of
Mallorca may have experienced complete or partial inundations, followed by intervals when
caves were water free (during glacials and stadials). Collapse events during sea-level low stands
may have triggered partial ceiling breakdowns, opening the cave to the surface (Fig. 27-5). This
process is in fact responsible for providing access to many of the littoral caves in this region, like
for instance Cova des Pas de Vallgornera (Ginés et al., 2014). The collapsed blocks along with

62
the speleothems accumulated inside the caves were subsequently cemented by carbonate sands
and red clay sediments containing fossil remains of terrestrial fauna. Sea level rise and
mechanico-chemical coastal erosion dissolution of the carbonate bedrock throughout the
Holocene induced the total collapse and destruction of the caves and removal of the breakdowns,
exposing the speleothems at surface (Fig. 27-6). A great variety of paleokarst structures are
nowadays visible along the eastern coast of Mallorca, showing distinct features and
morphologies that testify active coastal processes and RSL changes over the past 750 kyr. Here I
focus and describe in detail the following four sites: Cala Falcó, Sa Ferradura, Dimoni, and Na
Mitjana.
5.1.1 Cala Falcó Paleo-cave
The present-day morphology of Cala Falcó site is characterized by a narrow cala (bay)
and a small cave (Cova de Cala Falcó) opening at ~2 mapsl on the east side of a spectacular cliff
(Fig. 28A). Numerous breakdown blocks covering the bay and the first section of the cave,
along with abundant vadose speleothems outcropping near the current cave entrance (Fig. 28B-
C), attest episodic collapses and different speleogenetic phases occurred as direct consequence of
past sea level fluctuations.
The U-series dating of the exposed flowstones (yellow stars in Fig. 28C and
Appendix A, Table A1) indicate a period of vadose deposition between 650 and 450 ka
(Fig. 26), suggesting a relative sea level in the western Mediterranean basin lower than
today. Considering the ESL reconstructions produced by Naish and Wilson (2008) and
Spratt and Lisiecki (2016), a remarkable seashore regression during this interval at Cala
Falcó site may have exposed an extensive surface of the carbonate platform to meteoric
weathering and stream incision. In this coastal setting, a paleo-cave of large dimensions

63
must have been existed in Cala Falcó since flowstones and stalagmites were precipitated in
it, although no precise estimates regarding the size of this cavity can be put forward. The
outstanding sequences of vadose speleothems that nowadays outcrop in this site suggest that
the vadose conditions may have persisted for quite long time.
Figure 28. Images of Cala Falcó site: A) General view of the cala, cave entrance, and collapsed blocks,
B) Image of the paleokarst features outcropping on the cliff outside the cave, and C) Close up of the
paleo-flowstones and stalagmites. Yellow stars represent the sampling points, whereas the white lines
highlight the contour of the speleothems (photo credits: B.P. Onac and J. McIlrath).

64
In this coastal setting, a paleo-cave of large dimensions must have been existed in
Cala Falcó since flowstones and stalagmites were precipitated in it, although no precise
estimates regarding the size of this cavity can be put forward. The outstanding sequences of
vadose speleothems that are now exposed at this site suggest that the vadose conditions may
have persisted for quite long time.
As already described in our model (Fig. 27-5), consequent upper Pleistocene sea level
oscillations may have strongly influenced the morphology of the paleo-cave. Particularly,
during the last interglacial period (MIS 5e), RSL at Mallorca rose ~2 mapsl from 127 and
116 kyr, and GIA corrected POS records suggest that ESL rose up to ~6-7 mapsl early in
MIS 5e and dropped down to ~2 mapsl between at ~122 ka (Polyak et al., 2018).
Throughout this interval, the Cala Falcó paleo-cave was partially flooded. The sea level low
stands between MIS 5e and 5a and the drop following MIS 5a high stand (Dorale et al.,
2010) may have triggered a partial collapse of the present-day cave entrance and part of the
breakdown blocks were washed out throughout the Holocene exposing the vadose paleo-
speleothems that are visible today on the cliff.
5.1.2 Sa Ferradura and Dimoni Paleokarst
Sa Ferradura and Dimoni sites are two small littoral embayments graved in the upper
Miocene paleokarst funnel-like structures developed along the eastern coast of Mallorca, and
separated by a quite prominent promontory (Fig. 29A). The volumes of breccia deposits
existing at these two sites are rather conspicuous and document a long-lasting exposure of the
carbonate cliff to various coastal karst processes. Based on the morphology, abundance of
breakdowns, and widespread occurrences of exposed speleothems, different conditions must
have been existed in the past (Fig. 29B-D). In fact, the U-series ages obtained on flowstone

65
samples indicate an active interval of vadose speleothem deposition between ~650 and 470 ka
(Fig. 26). This clearly suggests that a series of well-developed littoral caves already existed at
Sa Ferradura and Dimoni prior to the deposition of speleothems, which may be somehow
related to the syngenetic paleokarst structures developed early during Messinian times (Fornós,
1999; Ginés et al., 2011). These ages are rather consistent with those from Cala Falcó
emphasizing our interpretations of lower RSL in Mallorca during this time period.
Considering the significant amounts of breccias and stacks of meter-size boulders, the paleo-
caves may have reached moderately large dimensions. Although I cannot estimate their exact
size, based on our geomorphological survey and data collection, a tentative reconstruction of
the extent of these paleo-caves is highlighted by the red dashed lines in Figure 29A.
According to our coastal karst timescale model, the paleo-caves may have developed and
expanded during the late Pliocene-early Pleistocene following sea level oscillations that
triggered periodic collapse events (see Fig. 27-3 and explanation therein for details).
Throughout the middle-Pleistocene when even the high sea level stands (MIS 17, 15, and 13)
were below present sea level, suitable conditions existed in these paleo-caves for the
precipitation of outstanding sequences of flowstones and stalagmites. The U-series dating
performed on the lower section of the Sa Ferradura flowstone (Fig. 29B) suggests that the
onset of vadose conditions may have occurred before ~650 ka, but later than ~1 Ma.
The sea level oscillations that occurred between ~400 and 150 ka (MIS 11-6) prompted
frequent changes from phreatic to vadose conditions in these caves and paleokarst voids, and
may have triggered the beginning of extensive collapses that affected many littoral caves.
During MIS 5e when the sea-level in Mallorca stood ~2 mapsl (Polyak et al., 2018), the caves
became once again partly or totally flooded.

66
Figure 29. Sa Ferradura and Dimoni sites: A) Aerial view of the two engulfments, B) Panoramic photograph of the Sa Ferradura site,
C) Flowstone sequence outcropping in between breccia deposits, D) Fossil flowstones and stalagmites exposed at Dimoni, and E) Funnel-like
embayment produced by the Messinian paleokarst structure and cave developed in the breccia at present sea level
(photo credits: B.P. Onac, J.J. Fornós, and J. Ginés).

67
The stability of drowned caves is normally higher then air-filled chambers since the
water provides support to walls and ceiling. At the end of MIS 5e (~116 ka), and especially
after the onset of MIS 4, the total collapse of the paleo-caves may have occurred as sea-level
dropped and water retreated from the cavities. This is when impressive limestone boulders and
broken speleothems accumulated on what was then the cave floor and were later cemented.
Ever since they formed, the chemical and mechanical actions of seawater during
Holocene, led to the development of several cavities within this breccia in the proximity of the
present-day seashore (Fig. 29E).
5.1.3 Na Mitjana Paleokarst
The paleokarst structures present at the Na Mitjana site (Fig. 30A) show evidence for a
more complex coastal karst evolution than at other sites previously described. One possible
reason for such complexity may be related with the longer time the Jurassic limestones were
exposed to both littoral and meteoric weathering.
Our speleothems’ data (see Appendix A, Table A1) reveal various possible scenarios and
speleogenetic processes that occurred at different times over the past ~1 Myr. The MIP-1
flowstone and stalagmite MIP-2 (Fig. 11B) indicate the presence of vadose conditions during the
period ~520-450 kyr, and are consistent with the speleothems from Cala Falcó, Sa Ferradura, and
Dimoni, further supporting our suggestion that the RSL in Mallorca was lower than today during
the above-mentioned interval. The elevations of the cave deposits (~7 mapsl), along with the
rough and steep morphology of the cliff in which they appear, imply the presence of once a
spacious littoral cave and/or different chambers interconnected by smaller voids.
Some of these little cavities that are today exposed in the paleokarst structure near the Na
Mitjana cave entrance (see B and C in Fig. 30A) present mammillary-like speleothems (MIP-3

68
and MIP-5) covering the walls and ceilings (Fig.30C and D). Their presence indicates intervals
of subaqueous conditions that may or may not be primarily related to sea level.
Figure 30. Na Mitjana site: A) Paleokarst structures and cavities (highlighted), B) Various speleothems
in one of the cavities, C) Close image of the sample MIP-5, D) Mammillary-like speleothem MIP-3,
and E) Flowstone MIP-4 (photo credits: B.P. Onac).
However, the speleothems are rather uniform and, unlike most POS deposits and the
mammillary calcite described by Polyak et al. (2008), were probably formed in a meteoric water
setting (vadose pool/geode). Thus, the sample MIP-3 that deposited ~580 ka (close to the MIS
15 peak) is in discordance with our overall vadose speleothems results and dismiss the sea level
implications in the underwater onset. The hypothetical precipitation of subaqueous calcite pool
coating in meteoric water is supported by the moderately high non-radiogenic Th (initial) values
measured in the samples (see Appendix A, Table A1). Moreover, these type of vadose pool
subaqueous calcite deposits, have been identified in other Mallorcan caves, i.e. Cova des Pas de

69
Vallgornera and Coves d’Artà. In the phases that preceded and followed these subaqueous
depositions (between ~590 and ~510 ka), precipitation of MIP-4 flowstone occurred (Fig. 30E).
According to our data on MIP-5 (see Appendix A, Table A1), favorable conditions for
calcite deposition in subaqueous conditions also existed in Mallorca at least during two other
periods: at ~1.1 Ma and between 296 and 186 ka. The latter interval (296-185 ka), which
includes the penultimate interglacial (MIS 7), was probably characterized by warmer and wetter
climate conditions that caused recurrent flooding of the voids.
5.2 Constraining Relative Sea Level Maximum in Mallorca during the MIS 7
Relative sea level during the penultimate interglacial (MIS 7) is poorly documented in the
central and western Mediterranean, and the few records available from different sites (i.e., E.
Spain, W. Italy, etc.) are rather contrasting. One of the main reasons for such mismatching data
is associated with the site-specific relationship between geological RSL indicators and tectonic
settings (e.g., uplifting, subsidence, relative stability, etc.) of the areas investigated. Marine
terraces that crop out in the eastern coast of Spain (La Marina-El Pinet) suggest the presence of
‘Senegalese’ warm fauna during MIS 7 in the western Mediterranean (Zazo et al., 2003). Open-
system U-series ages of ‘in situ’ coral colonies of Cladocora caespitosa and Strombus bubonius
shells from this site, yielded an indicative RSL estimate in the Spanish Mediterranean between
~1 mbpsl and ~1 mapsl (Goy et al., 2006; Zazo et al., 2013).
The POS record presented by Vesica et al. (2000) from Mallorca indicates a RSL
highstand of ~5 mapsl at ~233 ± 30 ka. Tuccimei et al. (2000a) documented RSL elevations
from POS in Grotta del Nettuno (NW Sardinia, Italy) at ~1.9 and ~2.5 mapsl at 234 ± 18 and 195
± 5 ka, respectively. Tuccimei et al. (2000b) also reported a RSL position at 8 mbpsl based on a
submerged POS in Cova den Passol (E. Mallorca) that precipitated ~201 ± 16 ka. Bard et al.

70
(2002) and Dutton et al. (2009) identified three major relative sea level highstands during the
MIS 7 from submerged stalagmites in Argentarola Cave (W. Italy). U-series measurements of
the cave calcite lamina alternating with serpulids layers, suggest that relative sea level in
Argentarola occurred above -18 m (relative to present datum) during MIS 7e (248-231 ka) and
MIS 7a (201-189 ka), but remained at or below 18 mbpsl during the MIS 7c (217-206 ka).
The speleothem DR-D20 from Coves del Drac shows different phases of precipitation,
revealed by an inner soda staw/stalactite section covered by layers of stalagmitic calcite and/or
aragonite (Fig. 12D). Similar features have been observed in many other coastal caves of
Mallorca, like for instance Cova des Pas de Vallgornera (Onac, pers. comm.). In the case of Llac
de les Delícies, steady dripping of water provided the suitable conditions for rapid soda
straw/stalactite formation between 225 and 212 ka.
Subsequently, the soda straw/stalactite reached the cave floor or top of the stalagmite
underlying the straw (ex, Fig. 31a), allowing for the growth of stalagmitic calcite layers to engulf
it. Thereafter, the stalactite broke or was corroded above the stalagmite (ex, Fig. 31b), and the
remaining stalactite was preserved within the stalagmite up until 198ka, when the stalagmite
growth ceased (Fig. 31c). Deposition of thin white aragonitic lamina on top of the stalagmite
(Fig. 12C) may have occurred at a later stage, but however, our U-series analyses on four
subsamples from this upper part have not returned reliable ages, indicating possible weathering
(see Appendix A, Table A1). This could suggest that recurrent cave flooding during the last
interglacial (MIS 5) and late Holocene, submerged the stalagmite and caused
corrosion/dissolution of the aragonitic layers.

71
Figure 31. Image of Llac de les Delícies (Coves del Drac) showing the hypothetical phases of DR-D20
precipitation: a) soda straws/stalactites reaching the cave floor, b) hanging portions of broken stalactites c)
stalagmite covering the broken part of a soda straw/stalactite at the cave floor (photo credits: J.J. Fornós).
The top of stalagmite DR-D20 is located at 1 mbpsl, and if growth was continuous from
225 to 198ka, this suggests that during MIS 7c and MIS 7a highstands, sea level did not peaked
above this depth. Figure 32 shows the DR-D20 records (red triangles) along with submerged
stalagmites from Argentarola and other POS-based RSL reconstructions previously published
(Vesica et al., 2000; Tuccimei et al., 2000a, b), which are compared with the RSL curve from
Waelbroeck et al. (2002) and the sea level reconstruction for the Red Sea (Siddal et al., 2003),
both generated using δ18O values from marine sediment (dashed and solid blue line,
respectively). Timing of DR-D20 stalagmite growth is consistent with both sea level curves but
show only a partial agreement with the RSL estimates based on the Argentarola samples.

72
Figure 32. MC-ICP-MS U-series ages for DR-D20 speleothem (red triangle) are compared with the
Argentarola stalagmites (Bard et al., 2002; Dutton et al., 2009) (orange, purple and black squares), POS
TIMS and α-spectrometry ages from Grotta del Nettuno, Sardinia (Tuccimei et al., 2000a), and POS
α-spectrometry ages from Cove den Passol and Na Mitjana Cave. Mallorca (Tuccimei et al., 2000b;
Vesica et al., 2000). RSL curve (Waelbroeck et al., 2002) and Red Sea level reconstruction (Siddall
et al., 2003) are also shown (solid and dashed blue lines). All errors are absolute 2σ, except for
α-spectrometry ages from Tuccimei et al. (2000a, b), which are 1σ).
Discrepancies between our data and the POS records from Mallorca and Sardinia also are
noted. This could be explain in four ways: 1) problems associated with the MIS 7 POS ages that
show rather large uncertainties since they were obtained using U-series α-spectrometry
technique; 2) post-depositional diagenetic and/or weathering processes affected POS and hence
altered the true age; 3) POS-sea level elevations were not corrected for GIA and DT effects; and
4) different uplift rates between Mallorca and Sardinia islands (Polyak et al., 2018).

73
Although the GIA-corrected POS-based MIS 5e sea level record of Polyak et al. (2018)
compare well with the Waelbroeck-based GIA model, for the penultimate glacial/interglacial
cycle, the latter is rather contrasting with some of the Mediterranean RSL records shown in
Figure 32. Particularly, when comparing this curve with the sea level estimates from
Argentarola, many of the stalagmite ages plot below Waelbroeck-inferred sea surface. In
contrast, the comparison between the sea level reconstructions for Red Sea (Siddall et al., 2003)
and the RSL records from central and western Mediterranean are in better agreement. In a more
general sense, mismatching between benthic ESL reconstructions and RSL geological archives is
related to changes in deep water temperature, temporal variations of the melted ice isotopic
composition, as well as salinity and local δ18O benthic variations not related to sea level changes
(Chappel and Shackelton, 1986; Shackleton, 1987; Rohling and Bigg, 1998; Clarke et al., 2002).
In contrast, the geological RSL indicators can be affected by different local and regional
uplift/subsidence movements. In any case, due to such potential complications of the sea level
records, over-/underestimates of global mean and relative sea level variations can occur. In our
dataset, these discrepancies are not present, hence it can be suggested that DR-D20 provides
reliable constraints for a maximum relative sea level below 1 m relative to present during the
penultimate interglacial in Mallorca within the limits of the U-series absolute ages and errors.
However, precisely RSL elevations were determined due to the heterogeneity of the other direct
RSL markers. Thus, further investigations on POS and additional sea level records are needed to
make precise estimates of RSL elevations in the western Mediterranean basin.
5.3 MIS 5b/5a Transition and MIS 5a Sea Level Highstand in Mallorca
The last interglacial is one of the most studied and documented interval of the Quaternary
climatic history since it is often used as a potential analogue for future scenarios of sea level rise

74
(Kopp et al., 2009; Dutton and Lambeck, 2012; Dutton et al., 2015). However, during the MIS 5
(substages a-e) the global sea level fluctuated significantly in response to waxing/waning of the
ice sheets, and the magnitude and timing of these oscillations are still a matter of debate. In
particular, the MIS 5a sea level highstand has been recorded from different locations around the
world ranging between -30 to +3 m compared to present sea level ( Gallup et al., 1994; Lambeck
et al., 2001; Muhs et al., 2002; Wehmiller et al., 2004).
In the western Mediterranean region, investigations of POS from various caves of
southeastern Mallorca documented a RSL highstand at ~1-1.5 mapsl between 82 and 80 ka
(Tuccimei et al., 2006; Dorale et al., 2010). The CF-11 stalagmite from Cova de Cala Falcó was
recovered at ~1 mapsl, and the U-series measurements indicate it grew from 85.7 to 83.7 ka,
corresponding to the transition from substage MIS 5b to MIS 5a. During this interval, suitable
conditions of steady drip water supply must have existed in the cave, allowing the precipitation
of CF-11 stalagmite (Fig. 33A). Tuccimei et al. (2006) also documented a POS-based RSL in
Mallorca lower than ~15 mbpsl between 86.5 and 85.5 ka, which corroborates the existence of
vadose conditions in Cova de Cala Falcó at the time when CF-11 began to grow. The subsequent
rapid sea level rise between 83.7 and 80 ka caused the partial flooding of the cave that
submerged the stalagmite ceasing calcite precipitation (Fig. 33B). As described by Dorale et al.
(2010), sea level in Mallorca persisted at ~1.5 mapsl for a relatively short time (~2 kyr) and
rapidly dropped to -15 m (relative to present sea level) by ~78.6 ± 0.8 ka at the onset of MIS 4
cold stadial (Tuccimei et al., 2006). This sudden sea level fall exposed the CF-11 stalagmite to
subaerial processes that caused partial corrosion/weathering of the outer surface (Fig. 33C). In
this interpretation, dripping and continued precipitation of the stalagmite ceased.

75
High-resolution U-series analysis of the stalagmite CFF-03-03-1 from Cova de Cala
Falcó recorded a substantial growth hiatus from ca. 85 to 80 ka, coincident with the MIS 5a
marine transgression (Hodge et al., 2008). However, CF-11 stalagmite suggests that until ~83.7
ka the cave remained water-free, and the flooding took place after (~83 ka) in the early part of
the MIS 5a.
Figure 33. Conceptual drawing of CF-11 stalagmite evolution and sea level implications: A) stalagmite precipitation in vadose conditions during sea level lowstand, B) cave partial flooding
during MIS 5a sea level higstand cause the cessation of the stalagmite growth, and C) sea level fall
and subaerially exposure of the stalagmite.
In contrast, the CAM-1 stalagmite from Cova de Campanet (NW Mallorca) shows a
continuous precipitation throughout the MIS 5b and 5a interval (Dumitru et al., 2018b). This
confirms that in inland caves located at higher elevations, optimal conditions continued to exist

76
for speleothem deposition, whereas in coastal caves (e.g., Cala Falcó), the sea-level rise
associated with MIS 5a highstand caused a temporal or complete cessation of stalagmite growth.
Figure 34. Comparison of Cala Falcó (CF-11) stalagmite oxygen composition with other local and
global records: a) NGRIP (North Greenland Ice Core Project members, 2004; Rasmussen et al., 2014),
b) δ18O records of CF-11, c) Campanet stalagmite δ18O values (Dumitru et al., 2018b), d) δ18O of Cala
Falcó (CFF-03-03-1) stalagmite (Hodge et al., 2008), and e) Sea level reconstructions for Mallorca during
MIS 5a, based on phreatic overgrowths on speleothems (Tuccimei et al., 2006; Dorale et al., 2010) (blue
and red circles, respectively). U-series ages of the POS (2σ absolute errors) and elevations related to
present sea level are shown. MIS boundaries are also displayed. MIS 5a highstand is shown in light blue.
An overall positive trend of the δ18O values is observed in Greenland ice core, CF-11,
and Campanet between 85.5 and 84.9 ka (Fig. 34 a-c), suggesting for Mallorca a period of

77
ameliorated (milder) climate conditions when cave drip waters mainly originated from 18O-
enriched Mediterranean-sourced moisture (Fig. 34b and c).
Thereafter, CF-11 δ18O values show a sudden decrease coinciding with a century-long
cold event (see arrow in Fig. 34a and b) recorded towards the end of the Greenland Stadial 22
(Rasmussen et al., 2014). The complex δ18O profile reported by Hodge (2004) for CFF-03-03-1
stalagmite, not only vary between 0 and -10‰ (double than our range), but also shows a large
number of rather regular zigzagging back and forth of the data compare to CF-11 data (Fig. 34d).
Because of this direct comparison between the two records could not be made. It could be that
this fluctuating pattern prevented Hodge et al. (2008) to use the δ18O values in their study.
The δ13C values in the Cala Falcó stalagmites (CF-11 and CFF-03-03-1) are rather
consistent and show a small increase between 85 and 84.6 ka. Slightly different variation trends
are observed at 84.6 ka and from 84.4 to 84.2 ka, which could be related with distinct percolating
water paths and/or dripping rates in the different parts of the cave. When comparing the δ13C
values for the two Cala Falcó stalagmites with the record from Campanet, a general positive
trend can observed until ~84.7 ka (Fig. 35).
Afterwards, a step-wise δ13C decrease is observed in Cala Falcó (Fig. 35a and b), whereas
the records from Campanet show a slow increase (Fig.35c). During the MIS 5b/5a transition
(~84.2-83.8 ka), the δ13C values from CF-11 and CAM-1 present opposite trends. One
explanation for these contrasting δ13C trends could be the difference in the amount of biogenic
CO2 production/supply and/or the C3/C4 plant ratio above the caves. Nevertheless, no C4 plant
species have been documented in Mallorca (Bolòs, 1996), and speleothem C3-sourced δ13C
values are generally more negative (between -14 and -6‰; Rudzka et al., 2011) than those
observed in the Mallorcan stalagmites.

78
Figure 35. δ13C comparison between: a) Cala Falcó (CFF-03-03-1) stalagmite (Hodge et al., 2008),
b) Cala Falcó (CF-11) stalagmite, and c) Campanet speleothem (Dumitru et al., 2018b), MIS 5b/5a
boundary is shown.
Therefore, I suggest that the differences in the δ13C values between Cala Falcó and
Campanet stalagmites are related to more local imprints, such as thickness of the soil horizon and
biological activity therein, prior calcite precipitation in the epikarst zone (Fairchild and Treble,
2009), and possibly the storage capacity above the two caves, which regulates the amount of
percolating water and consequently the cave drip rate.

79
CHAPTER SIX:
CONCLUSIONS
Our findings yield new geochronological insights regarding the speleogenetic evolution
of paleo-coastal caves and sea level variations in Mallorca over the last 750 kyr. Specifically, I
provide additional timeframe evidences for the previous coastal karst models proposed by Ginés
and Ginés (1992) and Ginés et al. (2014), and used these data to constraint sea level positions
during the different speleogenetic stages. Our radiometric analyses of paleo-speleothems
indicate long-lasting phases of vadose conditions along the present-day eastern coastline between
650 and 450 ka, suggesting that relative sea level positions during the MIS 17, 15, and 13
highstands may not have exceeded ~2 mapsl. The occurrence of conspicuous sequences of
flowstones and stalagmites at the various investigated paleokarst sites (e.g., Cala Falcó, Sa
Ferradura, Dimoni, and Na Mitjana) also hint to the presence of caves having remarkable
dimensions, and at the same time, indicate that suitable conditions (warm and wet) existed
throughout this interval. However, no precise assessments concerning the paleo-caves extension
can be formulated from the data available. Sea level fluctuations during the glacial/interglacial
cycles caused caves to experience periodic phreatic and vadose phases that affected the structure
and morphology of these paleo-caves. I suggest that recurrent floodings occurred during MIS
11, 9, 7, and 5e interglacials, followed by periodic drawdowns during the glacial stages of MIS
10, 8, 6, and 4. Throughout these cool stadials, the paleo-caves were affected by partial ceiling
breakdowns and subsequently cementation of the collapsed blocks and speleothems. Since the
last interglacial sea level highstands and throughout the Holocene, littoral erosion and dissolution

80
processes caused partial/total collapse of the paleo-caves, exposing a variety of vadose
speleothems at the surface.
Records of sea level maximum are documented in the stalagmite DR-D20 from Coves del
Drac. The speleothem precipitated between 225 and 198 ka, suggesting that the relative sea level
in Mallorca did not reach 1.1 mbpsl during the MIS 7a and MIS 7c highstands. The data are
partly in agreement with distinct RSL records from the central Mediterranean and fairly
consistent with other sea level reconstructions (global and Red Sea), although show various
degrees of discordances with some POS-based RSL records from Mallorca and Sardinia islands.
Because of the scarcity of RSL records for MIS 7 in the western and central Mediterranean, and
the rather heterogeneity of the data available, no precise sea level estimates are generated.
Further investigations are necessary in order to precisely assess the RSL positions during the
penultimate interglacial.
Additionally, the U-series ages of the CF-11 stalagmite from Cova de Cala Falcó indicate
an interval of precipitation between 85.7 and 83.7 ka, coinciding with the latter phase of the
stadial MIS 5b and the onset of MIS 5a (MIS 5b/5a transition). High-resolution isotopic
comparisons between CF-11 and other local and global proxy records suggest that mild climate
conditions were present in Mallorca from 85.5 to 84.9 ka with Mediterranean-sourced
precipitations that supplied steady dripping water into the cave. At the beginning of the MIS 5a,
Cala Falcó stalagmites ceased to grow, whereas the inland speleothem from NW Mallorca
continued to precipitate throughout all the interval. POS-based RSL reconstructions for
Mallorca document that between 85 and 82 sea level rapidly arose to ~1.5 mapsl, confirming that
partial flooding of the cave occurred soon after 83.7 ka, submerging the stalagmite, which
stopped growing.

81
In conclusion, our records from Mallorca further our understanding of coastal karst
processes and their relationship with past sea level changes in the western Mediterranean,
indicating the suitable utility of vadose speleothems (with their limitations) as records of past sea
level variations. Our study suggests that the application of such records along with other direct
sea level markers (e.g., POS), will constitute extremely powerful tools for future sea level
investigations.

82
REFERENCES
Andersen, M.B., Stirling, C.H., Potter, E.K., Halliday, A.N. (2004). Toward epsilon levels of
measurement precision on 234U/238U by using MC-ICPMS. International Journal of Mass
Spectrometry, 237 (2-3): 107-118.
Antonioli, F., Bard, E., Potter, E.K., Silenzi, S., Improta, S. (2004). 215-ka History of sea-level
oscillations from marine and continental layers in Argentarola Cave speleothems (Italy). Global
and Planetary Change, 43 (1-2): 57-78.
Asmerom, Y., Polyak, V.J.., Schwieters, J., Bouman, C. (2006). Routine high-precision U–Th
isotope analyses for paleoclimate chronology. Geochimica et Cosmochimica Acta, 70 (18): A24.
Balaguer, P. (2005). Tipus i evolució de les costes rocoses de Mallorca. Unpublished PhD
Thesis. Palma de Mallorca: Universitat de les Illes Balears, 373 p.
Bard, E., Antonioli, F., Silenzi, S. (2002). Sea-level during the penultimate interglacial period
based on a submerged stalagmite from Argentarola Cave (Italy). Earth and Planetary Science
Letters, 196 (3-4): 135-146.
Barnes, J.W., Lang, E.J., Potratz, H.A. (1956). Ratio of ionium to uranium in coral limestone.
Science, 124: 175-176.
Baskaran, M., Krishnamurthy, R.V. (1993). Speleothems as proxy for the carbon isotope
composition of atmospheric CO2. Geophysical Research Letters, 20: 2905-2908.
Becquerel, H. (1986). Émission de radiation nouvelles par l'uranium métallique. Comptes
Rendus, 122: 1086.
Boehnke, P., Harrison, T.M. (2014). A meta-analysis of geochronologically relevant half-lives:
what’s the best decay constant? International Geology Review, 56: 905-914.
Bögli, A. (1980). Karst hydrology and physical speleology. Berlin: Springer-Verlag, 284 p.
Bolòs, O. (1996). La vegetació de les Illes Balears. Barcelona: Institut d'Estudis Catalans, 269 p.
Chappell, J., Shackleton, N. (1986). Oxygen isotopes and sea level. Nature, 324(6093): 137-140.
Chen, J.H., Edwards, R.L., Wasserburg, G.J. (1986). 238U, 234U and 232Th in seawater. Earth and
Planetary Science Letters, 80 (3-4): 241-251.
Cheng, H., Edwards, R.L., Hoff, J., Gallup, C.D., Richards, D.A., Asmerom, Y. (2000). The
half-lives of uranium-234 and thorium-230. Chemical Geology, 169 (1-2): 17-33.

83
Cheng, H., Edwards, R.L., Shen, C.C., Polyak, V.J., Asmerom, Y., Woodhead, J., Hellstrom, J.,
Wang, Y., Kong, X., Spötl, C., Wang, X., Alexander Jr., C.E. (2013). Improvements in 230Th
dating, 230Th and 234U half-life values, and U–Th isotopic measurements by multi-collector
inductively coupled plasma mass spectrometry. Earth and Planetary Science Letters, 371-372:
82-91.
Cherdyntsev, V.V., Kazache. I., Kuzmina, Y.A. (1965). Dating of Pleistocene carbonate
formations by Thorium and Uranium isotopes. Geochemistry International, 2 (5): 794-798.
Clark, P.U., Shakun, J.D., Marcott, S.A., Mix, A.C., Eby, M., Kulp, S., Schrag, D. P., et al.
(2016). Consequences of twenty-first-century policy for multi-millennial climate and sea-level
change. Nature Climate Change, 6 (4): 360-369.
Clarke, G.K., Marshall, S.J. (2002). Isotopic balance of the Greenland Ice Sheet: modelled
concentrations of water isotopes from 30,000 BP to present. Quaternary Science Reviews, 21 (1-3):
419-430.
Clemmensen, L.B., Fornós, J.J., Rodríguez-Perea, A. (1997). Morphology and architecture of a
late Pleistocene cliff -front dune, Mallorca, Western Mediterranean, Terra Nova. 9: 251-254.
Clemmensen, L., Lisborg, T., Fornós, J., Bromley, R.G. (2001). Cliff-front aeolian and colluvial
deposits, Mallorca, Western Mediterranean: A record of climatic and environmental change
during the last glacial period. Bulletin of the Geological Society of Denmark, 48: 217-232.
Cliff, R.A., Spötl, C., Magini, A., (2010). U\Pb dating of speleothems from Spannagel Cave,
Austrian Alps: a high-resolution comparison with U-series ages. Quaternary Geochronology, 5:
452-458.
Cole, J.M., Rasbury, E.T., Montañez, I.P., Pedone, V.A., Lanzirotti, A., Hanson, G.N. (2004).
Petrographic and trace element analysis of uranium‐rich tufa calcite, middle Miocene Barstow
Formation, California, USA, Sedimentology, 51: 433-453.
Curie, M.S., (1898) Rayons emis par les composes de l’uranium et du thorium, Comptes Rendus.
126: 1101.
Decker, D.D., Polyak, V.J., Asmerom, Y., Lachniet, M.S. (2018). U–Pb dating of cave spar: A
new shallow crust landscape evolution tool. Tectonics, 37: 208-223.
DeConto, R.M., Pollard, D. (2016). Contribution of Antarctica to past and future sea-level rise.
Nature, 531: 591-597.
Dickin, A.P. (2005). Radiogenic Isotope Geology (2nd edition). Cambridge: Cambridge
University Press, 508 p.
Dorale, J.A., Edwards, R.L., Ito, E., Gonzalez, L.A. (1998). Climate and vegetation history of the
midcontinent from 75 to 25 ka: a speleothem record from Crevice Cave, Missouri, USA. Science,
282: 1871-1874.

84
Dorale, J.A., Edwards, R.L., Onac, B.P. (2002). Stable Isotopes as Environmental Indicators in
Speleothems. In: Yuan, D., Zhang, C. (eds.), Karst Processes and the Carbon Cycle. Beijing:
Final Report of IGCP 379, Geological Publishing House, pp. 107-120.
Dorale, J.A., Edwards, R.L., Alexander, E.C., Shen, C.C., Richards, D.A., Cheng, H. (2004)
Uranium-Series Dating of Speleothems: Current Techniques, Limits, & Applications. In:
Sasowsky, I.D., Mylroie, J. (eds). Studies of Cave Sediments. Boston: Springer, pp. 177-197.
Dorale, J.A., Onac, B.P., Fornós, J.J., Ginés, J., Ginés, A., Tuccimei, P., Peate, D.W. (2010).
Sea- level 81,000 years ago in Mallorca. Science, 327: 860-863.
Dumitru, O.A., Onac, B.P., Polyak, V.J., Austermann, J., Fornos, J.J., Gines J., Gines A.,
Asmerom, Y. (2018a). A U-Pb Dated Glacial Isostasy corrected Pliocene sea-level record in
Mallorca (western Mediterranean) based on phreatic overgrowths on speleothems. Geological
Society of America, Abstracts with Programs, 50 (6): 222-7.
Dumitru, O.A., Onac, B.P., Polyak, V.J., Wynn, J.G., Asmerom, Y., Fornós, J.J. (2018b). Climate
variability in the western Mediterranean between 121 and 67 ka derived from a Mallorcan
speleothem record. Palaeogeography, Palaeoclimatology, Palaeoecology, 506: 128-138.
Dutton, A., Bard, E., Antonioli, F., Esat, T.M., Lambeck, K., McCulloch, M.T. (2009). Phasing
and amplitude of sea-level and climate change during the penultimate interglacial. Nature
Geoscience, 2 (5): 355-359.
Dutton, A., Lambeck, K. (2012). Ice volume and sea level during the last interglacial. Science,
337: 216-219.
Dutton, A., Carlson, A. E., Long, A., Milne, G. A., Clark, P. U., DeConto, R., Horton, B.P.,
Rahmstorf, S., Raymo, M. E. (2015). Sea-level rise due to polar ice-sheet mass loss during past
warm periods. Science, 349: 153-aaa4019.
Edwards, R.L, Chen J.H., Wasserburg G.J. (1987). 238U-234U-230Th-232Th systematics and the
precise measurement of time over the past 500,000 y. Earth and Planetary Science Letters, 81:
175-192.
Esteban, M. (1979). Significance of the Upper Miocene reefs of the Western Mediterranean.
Paleogeography, Paleoclimatology, Paleoecology, 29: 169-188.
Faure, G., Mensing, T.M. (2005) Isotope Principle and Applications (3rd edition). Hoboken: John
Wiley & Sons, 928 p.
Fairchild, I.J., Smith, C.L., Baker, A., Fuller, L., Spötl, C., Mattey, D., McDermott, F. (2006).
Modification and preservation of environmental signals in speleothems. Earth-Science Reviews,
75 (1-4): 105-153.
Fairchild, I.J., Treble, P.C. (2009). Trace elements in speleothems as recorders of environmental
change. Quaternary Science Reviews, 28 (5-6): 449-468.
Fairchild, I.J., Baker, A. (2012). Speleothem science: from process to past environments.
Chichester: John Wiley & Sons, 432 p.

85
Ford, D.C., Thompson, P.L., Schwarcz, H.P., (1972). Dating cave calcite by the uranium
disequilibrium method; some preliminary results from Crowsnest Pass, Alberta, International
Geography, 22: 21.
Fornós, J.J., Pomar, L. (1983a). Mioceno superior de Mallorca: Unidad Calizas de Santanyí
(“ComplejoTerminal”). In: Pomar, L., Obrador, A., Fornós, J.J., Rodriguez-Perea, A. (eds.), El
Terciario de las Baleares (Mallorca-Menorca). Palma de Mallorca: Guía de excursiones, 10th
Congreso Nacional de Sedimentología, Institut d’Estudis Balearics and Universidad de Illes
Balears, 177-206.
Fornós J.J., Pomar L. (1983b). El complejo de manglar del Mioceno terminal de la isla de
Mallorca. Bulletí de la Societat d’Història Natural de les Illes Balears, 26: 207-228.
Fornós J.J., Pomar L. (1984). Facies, ambientes y secuencias de plataforma carbonatada somera
(Formación de Calizas de Santanyí), en el Mioceno Terminal de Mallorca (Islas Baleares),
Publicaciones de Geología. 20: 319-330.
Fornós, J.J., Gelabert, B. (1995). Litologia i tectònica del carst de Mallorca/ Lithology and
tectonics of the Majorcan karst. In A. Ginés, J. Ginés (eds.), El carst i les coves de
Mallorca/Karst and caves in Mallorca. Palma de Mallorca: Endins/Monografies de la Societat
d’Historia Natural de les Balears, 20 (3): 27-43.
Fornós, J.J., Ginés, J., Ginés, A., Rodríguez-Perea, A. (1995). Paleokarst in Mallorca.
Endins/Monografies de la Societat. d’Historia Natural de les Balears, 20 (3): 113-124.
Fornós. J.J. (1999). Karst collapse phenomena in the Upper Miocene of Mallorca (Balearic
Islands, Western Mediterranean). Acta Geologica Hungarica, 42 (2): 237-250.
Fornós, J.J., Gelabert, B., Ginés, A., Ginés, J., Tuccimei, P., Vesica, P. (2002a). Phreatic
overgrowths on speleothems: a useful tool in structural geology in littoral karstic landscapes. The
example of eastern Mallorca (Balearic Islands). Geodinamica Acta, 15 (2): 113-125.
Fornós, J.J., Pomar, L., Ramos-Guerrero, E. (2002b). Balearic Islands, Tertiary. In Gibbons, W.,
Moreno, T. (eds.), The geology of Spain. London: The Geological Society, pp. 327-334, 405-406.
Fornós, J.J., Clemmensen, L.B., Gómez-Pujol, L., Ginés, A., Ginés, J. (2012). Pleistocene
eolianites and low sea levels. In: Ginés, A., Ginés, J., Gómez-Pujol, L., Onac, B.P., Fornós, J.J.
(eds.), Mallorca: A Mediterranean Benchmark for Quaternary Studies. Monografies de la
Societat d’Historia Natural de les Balears, 18: 85-110.
Fornós J.J., Ginés À., Ginés J., Gràcia F., Merino A. (2019). Littoral Endokarst from Mallorca
Island (Western Mediterranean): Dynamic processes, Sediments and Management. In: Morales J.
(eds), The Spanish Coastal Systems. Cham: Springer Nature, pp. 143-166.
Gallup, C.D., Edwards, R.L., Johnson, R.G. (1994). The timing of high sea levels over the past
200,000 years. Science, 263: 796-800.
Gascoyne, M. (1992). Palaeoclimate determination from cave calcite deposits. Quaternary
Science Reviews, 11: 609-632.
86
Gelabert-Ferrer, B. (1998). La estructura geológica de la mitad occidental de la isla de
Mallorca. Madrid: Memorias del Instituto Tecnológico Geominero de España, 129 p.
Giménez, J., Gelabert, B. (2002). Recent Tectonic Activity Analysis of Mallorca Island. EGS
General Assembly Conference Abstracts, 27: 390-394.
Ginés, A.; Ginés, J., Pomar, L. (1981). Phreatic speleothems in coastal caves of Majorca (Spain)
as indicators of Mediterranean Pleistocene paleolevels. Bowling Green: Proc. 8th International
Congress of Speleology, 2: 533-536.
Ginés, A., Ginés, J. (1987). Características espeleológicas del karst de Mallorca. Endins, 13: 3-19.
Gines A., Gines J. (1992). Las Coves del Drac (Manacor, Mallorca). Apuntes historicos y
espeleogeneticos. Endins, 17-18: 5-20.
Ginés, A., Ginés, J. (1995). The exokarstic landforms of Mallorca Island. In: Ginés, A., Ginés, J
(eds.). Karst and Caves in Mallorca. Endins/Monografies de la Societat d’Historia Natural de
les Balears, 20 (3): 56-70.
Ginés, A. (1999). Agriculture, grazing and land use changes at the Serra de Tramuntana karstic
mountains. International Journal of Speleology, 28 B (1/4): 5-14.
Ginés, A., Ginés, J. (2007). Eogenetic karst, glacioeustatic cave pools and anchialine
environments on Mallorca Island: A discussion of coastal speleogenesis. International Journal of
Speleology, 36 (2): 57-67.
Gines J., Gines A., Fornos J.J., Gràcia F., Merino A., (2008). Noves observacions sobre
l’espeleogenesi en el Migjorn de Mallorca: els condicionants litologics en alguns grans sistemes
subterranis litorals. Endins, 32: 49-79.
Ginés, A., Ginés, J. (2011). Classificació morfogenètica de les cavitats càrstiques de les Illes
Balears. Endins/Monografies de la Societat d’Historia Natural de les Balears, 17 (35): 85-102.
Ginés, A., Ginés, J., Fornós, J. J., Bover, P., Gómez-Pujol, L., Gràcia, F., Merino, A., Vicens, D.
(2012). An introduction to the Quaternary of Mallorca. In: Ginés, A., Ginés, J., Gómez-Pujol, L.,
Onac, B.P., Fornós, J.J. (eds.), Mallorca: A Mediterranean Benchmark for Quaternary Studies.
Monografies de la Societat d’Historia Natural de les Balears, 18: 13-53.
Ginés, J. (1995). L’endocarst de Mallorca: els mecanismes espeleogenètics / Mallorca’s
endokarst: the speleogenetic mechanisms. Endins/Monografies de la Societat. d’Historia Natural
de les Balears, 20 (3): 71-86.
Ginés, J. (2000). El karst litoral en el levante de Mallorca: una aproximación al conocimiento de
su morfogénesis y cronología. Unpublished PhD Thesis. Palma de Mallorca: Departament de
Ciències de la Terra, Universitat de les Illes Balears, p. 595.
Ginés, J., Ginés, A., Fornós, J.J., Merino, A., Gràcia, F. (2009). On the role of hypogene
speleogenesis in shaping the coastal endokarst of southern Mallorca (western Mediterranean). In
A.B. Klimchouk, D.C. Ford (eds.), Hypogene speleogenesis and karst hydrogeology of artesian
basins. Simferopol: Ukrainian Institute of Speleology and Karstology, Special Paper 1: 91-99.

87
Ginés, J., Ginés, A., Fornós, J.J. (2011). Dades sobre paleokarst i espeleocronología de les illes
balears. Endins, 35 (17): 213-226.
Ginés, J., Ginés, A., Fornós, J.J., Tuccimei, P., Onac, B.P., Gràcia, F. (2012). Phreatic
Overgrowths on Speleothems (POS) from Mallorca, Spain: Updating forty years of research. In:
Ginés, A., Ginés, J., Gómez-Pujol, L., Onac, B.P., Fornós, J.J. (eds.), Mallorca: A
Mediterranean Benchmark for Quaternary Studies. Monografies de la Societat. d’Historia
Natural de les Balears, 18: 111-146.
Ginés, J., Fornós, J.J., Ginés, A., Merino, A., Gràcia, F. (2014). Geologic constraints and
speleogenesis of Cova des Pas de Vallgornera, a complex coastal cave from Mallorca Island
(Western Mediterranean). International Journal of Speleology, 43 (2): 105-124.
Ginés, J., Fornós, J.J., Gràcia, F., Merino, A., Onac, B.P., Ginés, A. (2017). Hypogene Imprints
in Coastal Karst Caves from Mallorca Island (Western Mediterranean): Morphological Features
and Speleogenetic Approach. In: Klimchouk, A., Palmer, N.A., De Waele, J., Auler, A.S, Audra,
P. (eds.), Hypogene Karst Regions and Caves of the World. Cham: Springer International
Publishing, pp. 99-112.
Gómez-Pujol, L., Gelabert, B., Fornós, J.J., Pardo-Pascual, J.E., Rosselló, V.M., Segura, F.S.,
Onac, B.P. (2013). Structural control on the presence and character of calas: Observations from
Balearic Islands limestone rock coast macroforms. Geomorphology, 194: 1-15.
Gomis, D., Tsimplis, M., Marcos, M., Fenoglio-Marc, L., Pérez, B., Raicich, F., Vilibić, I.,
Wöppelmann, G., Monserrat, S. (2012). Mediterranean Sea-level variability and trends. In:
Lionello, P. (ed.), The climate of the Mediterranean region: From the past to the future. London:
Elsevier, pp. 257-299.
Gornitz, V. (2005). Eustasy. In: Schwartz, M.L. (ed.), Encyclopedia of Coastal Science.
Encyclopedia of Earth Sciences Series. Springer, pp. 439-442.
Goy, J.L., Hillaire-Marcel, C.I., Zazo, C., Ghaleb, B., Dabrio, C.J., Bardají, T., Civis, J., Preda,
M., Yébenes, A., Forte, A. M. (2006). Further evidence for a relatively high sea level during the
penultimate interglacial: open-system U-series ages from La Marina (Alicante, East Spain).
Geodinamica Acta, 19 (6): 409-426.
Gràcia, F., Fornos J.J. & Merino A. (2009) Corrosion patterns related to meteoric-marine mixing
zone in coastal cave systems of Mallorca Island (Western Mediterranean). In: White W.B. (eds.),
Proceedings of the 15th International Congress of Speleology, Kerrville, TX, 1: 496-500.
Gràcia, F., Clamor B., Gamundi P., Fornos J.J. (2010). El sistema de cavitats Gleda - Camp des
Pou (Manacor, Mallorca). Endins, 34: 35-68.
Guijarro, J.A. (1995). Aspectes bioclimatics del karst de Mallorca / Bioclimatic aspects of karst
in Mallorca. In: Ginés, A., Ginés, J. (eds.) El carst i les coves de Mallorca / Karst and caves in
Mallorca. Palma de Mallorca: Endins/Monografies de la Societat. d’Historia Natural de les
Balears, 20 (3): 17-26.

88
Harmon, R.S., Thompson, P., Schwarcz, H.P., Ford, D.C. (1978). Late Pleistocene Paleoclimates
of North America as Inferred from Stable Isotope Studies of Speleothems. Quaternary Research,
9 (1): 54-70.
Harmon, R.S., Land, L.S., Mitterer, R.M., Garett, P., Schwarcz, H.P., Larson, G.J. (1981).
Bermuda sea level during the last interglacial. Nature, 289: 481-483.
Hartmann, A., Baker, A. (2017). Modelling karst vadose zone hydrology and its relevance for
paleoclimate reconstruction. Earth-Science Reviews, 172: 178-192.
Hellstrom, J. (2006). U-Th dating of speleothems with high initial 230 Th using stratigraphical
constraint. Quaternary Geochronology, 1: 289-295.
Hendy, C.H., Wilson, A.T. (1968). Palaeoclimatic data from speleothems. Nature, 219: 48-51.
Hendy, C.H. (1971). The isotopic geochemistry of speleothems-I. The calculation of the effects
of different modes of formation on the isotopic composition of speleothems and their
applicability as palaeoclimatic indicators. Geochimica et Cosmochimica Acta, 35 (8): 801-824.
Hill, C., Forti, P. (1997). Cave Minerals of the World (2nd edition). Huntsville: National
Speleological Society, 463 p.
Hodge E.J. (2004). Palaeoclimate of the Western Mediterranean region: results from
speleothems. Unpublished Ph.D. Thesis, University of Bristol, 246 p.
Hodge, E.J., Richards, D.A., Smart, P.L., Ginés, A., Mattey, D.P. (2008). Sub‐millennial climate
shifts in the western Mediterranean during the last glacial period recorded in a speleothem from
Mallorca, Spain. Journal of Quaternary Science, 23: 713-718
Ivanovich, M., Harmon, R.S. (1992). Uranium-series disequilibrium: applications to earth,
marine, and environmental sciences (2nd edition). United Kingdom: Clarendon Press, 910 p.
Jaffey, A.H., Flynn, K.F., Glendenin, L.E., Bentley, W.C., Essling, A.M. (1971). Precision
measurement of half-lives and specific activities of 235U and 238U. Physical Review C, 4: 1889-
1906.
Just, J., Hübscher, C., Betzler, C., Lüdmann, T., & Reicherter, K. (2011). Erosion of continental
margins in the Western Mediterranean due to sea-level stagnancy during the Messinian Salinity
Crisis. Geo-Marine Letters, 31 (1): 51-64.
Kaufman, A. (1993). An evaluation of several methods for determining 230Th/U ages in impure
carbonates. Geochimica et Cosmochimica Acta, 57: 2303-2317.
Kelly, S.D., Newville, M.G., Cheng, L., Kemner, K.M., Sutton, S.R., Fenter, P., Sturchio, N. C.,
Spötl, C. (2003). Uranyl incorporation in natural calcite, Environmental Science Technology, 37:
1284-1287.
Kemp, A.C., Dutton, A., Raymo, M.E. (2015). Paleo constraints on future sea-level rise. Current
Climate Change Reports, 1 (3): 205-215.
89
Kopp, R.E., Simons, F.J., Mitrovica, J.X., Maloof, A.C., Oppenheimer, M. (2009). Probabilistic
assessment of sea level during the last interglacial stage. Nature, 462: 863-867.
Koster, R.D., De Valpine, D.P., Jouzel, J. (1993). Continental water recycling and H218O
concentrations. Geophysical Research Letters, 20 (20): 2215-2218.
Lachniet, M.S. (2009). Climatic and environmental controls on speleothem oxygen-isotope
values. Quaternary Science Reviews, 28 (5-6): 412-432.
Lambeck, K., Chappell, J. (2001). Sea level change through the last glacial cycle. Science, 292:
679-686.
Langmuir, D. (1978). Uranium solution‐mineral equilibria at low temperatures with applications
to sedimentary ore deposits, Geochimica et Cosmochimica Acta, 42: 547-569.
Langmuir, D., Herman, J.S. (1980). The mobility of thorium in natural waters at low
temperatures. Geochimica et Cosmochimica Acta, 44: 1753-1766.
Li, W.X., Lundberg, J., Dickin, A.P., Ford, D.C., Schwarcz, H.P., McNutt, R., Williams, D.
(1989). High-precision mass-spectrometric uranium-series dating of cave deposits and
implications for palaeoclimate studies. Nature, 339: 534-536.
Lisiecki, L. E., Raymo, M. E. (2005). A Plio-Pleistocene stack of 57 globally distributed benthic
δ18O records. Paleoceanography, 20: 1-17.
Lopez, J.M. (2007). Las manifestaciones hidrotermales del sur de Llucmajor, Mallorca.
Unpublished Memoria d’Investigacio. Palma de Mallorca: Universitat de les Illes Balears,
Departament de Ciencies de la Terra, 132 p.
Lorscheid, T., Stocchi, P., Casella, E., Gómez-Pujol, L., Vacchi, M., Mann, T., Rovere, A.
(2017). Paleo sea-level changes and relative sea-level indicators: Precise measurements,
indicative meaning and glacial isostatic adjustment perspectives from Mallorca (Western
Mediterranean). Palaeogeography, Palaeoclimatology, Palaeoecology, 473: 94-107.
Ludwig, K.R., Simmons, K.R., Szabo, B.J., Winograd, I.J., Landwehr, J.M., Riggs, A.C,
Hoffman, R.J. (1992). Mass-spectrometric 230Th-234U-238U dating of the Devils Hole calcite vein.
Science, 258: 284-287.
Ludwig, K.R. (1998). On the treatment of concordant uranium–lead ages. Geochimica et
Cosmochimica Acta, 62: 665-676.
Ludwig, K.R. (2001). User manual for Isoplot/Ex version 2.05. Berkeley Geochronology Center,
Special Publication, 1a, 2455 p.
Luo, X., Rehkämper, M., Lee, D.C., Halliday, A.N. (1997). High precision 230Th/232Th and 234U/238U measurements using energy filtered ICP magnetic sector multiple collector mass
spectrometry. International Journal of Mass Spectrometry and Ion Processes, 171 (1-3): 105-117.

90
Mas, G., Maillard, A., Alcover, J.A., Fornós, J.J., Bover, P., Torres-Roig, E. (2018). Terrestrial
colonization of the Balearic Islands: New evidence for the Mediterranean sea-level drawdown
during the Messinian Salinity Crisis. Geology, 46 (6): 527-530.
McDermott, F. (2004). Palaeo-climate reconstruction from stable isotope variations in
speleothems: a review. Quaternary Science Reviews, 23 (7-8): 901-918.
McDermott, F., Schwarcz, H.P., Rowe, P.J. (2006). Isotopes in speleothems In: M.J., Leng (ed.),
Isotopes in Palaeoenvironmental Research, Dordrecht: Springer, 185-226.
Mickler, P.J., Banner, J.L., Stern, L., Asmerom, Y., Edwards, R. L., Ito, E. (2004). Stable isotope
variations in modern tropical speleothems: evaluating equilibrium vs. kinetic isotope effects.
Geochimica et Cosmochimica Acta, 68 (21): 4381-4393.
Moorbath, S., Taylor, P.N., Orpen, J.L., Treloar, P., Wilson, J.F. (1987). First direct radiometric
dating of Archaen stromatolitic limestone. Nature, 326: 865-867.
Muhs, D.R., Simmons, K.R., Steinke, B. (2002). Timing and warmth of the Last Interglacial
period: new U-series evidence from Hawaii and Bermuda and a new fossil compilation for North
America. Quaternary Science Reviews, 21 (12-13): 1355-1383.
Mylroie, J.E., Mylroie, J.R. (2007). Developments of the Carbonate Island Karst Model. Journal
of Cave and Karst Studies, 69: 59-75.
Naish, T., Powell, R., Levy, R., Wilson, G., Scherer, R., Talarico, F., et al. (2009). Obliquity-
paced Pliocene West Antarctic ice sheet oscillations. Nature, 458: 322-328.
Naish, T.R., Wilson, G.S. (2008). Constraints on the amplitude of Mid-Pliocene (3.6-2.4 Ma)
eustatic sea-level fluctuations from the New Zealand shallow-marine sediment record.
Philosophical Transactions of the Royal Society A: Mathematical, Physical and Engineering
Sciences, 367: 169-187.
Onac, B.P., Ginés, A., Ginés, J., Fornós, J.J., Dorale, J.A. (2012). Late Quaternary sea-level
history: a speleothem perspective. In: Ginés, A., Ginés, J., Gómez-Pujol, L., Onac, B.P., Fornós,
J.J. (eds.), Mallorca: A Mediterranean Benchmark for Quaternary Studies. Monografies de la
Societat. d’Historia Natural de les Balears, 18: 147-162.
Palmer, A.N. (1991). Origin and morphology of limestone caves. Geological Society of America
Bulletin, 103 (1): 1-21.
Pickering, R., Kramers, J.D., Partridge, T., Kodolanyi, J., Pettke, T. (2010). U–Pb dating of
calcite–aragonite layers in speleothems from hominin sites in South Africa by MC-ICP-MS.
Quaternary Geochronology, 5 (5): 544-558.
Pickering, R., Dirks, P.H.G.M., Jinnah, Z., de Ruiter, D.J., Churchill, S.E., Herrires, A.I.R.,
Woodhead, J.D., Hellstrom, J.C., Berger, L.R. (2011). Australopithecus sediba at 1.977 Ma and
implications for the origins of genus Homo. Science, 333: 1421-1423.
91
Pickering, R., Kramers, J.D., Hancox, P.J., de Ruiter, D.J., Woodhead, J.D. (2011).
Contemporary flowstone development links early hominin bearing cave deposits in South Africa.
Earth and Planetary Science Letters, 306: 23-32.
Pickering, R., Herries, A.I., Woodhead, J.D., Hellstrom, J.C., Green, H.E., Paul, B., Ritzman, T.,
Strait, D.S., Schoville, B.J., Hancox, P.J. (2019). U–Pb-dated flowstones restrict South African
early hominin record to dry climate phases. Nature, 565: 226-229.
Pollard, D., DeConto, R. M. (2009). Modelling West Antarctic ice sheet growth and collapse
through the past five million years. Nature, 458: 329-332.
Polyak, V.J., Hill, C., Asmerom, Y. (2008). Age and evolution of the Grand Canyon revealed by
U\Pb dating of water-table-type speleothems. Science, 319: 1377-1380.
Polyak, V.J., Asmerom, Y. (2009). Overcoming initial 230Th problems in Uranium-series dating
without using 234U/232Th - 230Th/232Th isochrons. Proceedings of the 15th International Congress
of Speleology, Kerrville, TX, 2 (2): 1060-1064.
Polyak, V.J., DuChene, H.R., Davis, D.G., Palmer, A.N., Palmer, M.V., Asmerom, Y. (2013).
Incision history of Glenwood Canyon, Colorado, USA, from the uranium-series analyses of
water-table speleothems. International Journal of Speleology, 42 (3): 193-202.
Polyak, V.J., Provencio, P.P., Asmerom, Y., (2016). U-Pb dating of speleogenetic dolomite: A new
sulfuric acid speleogenesis chronometer. International Journal of Speleology, 45 (2): 103-109.
Polyak, V.J., Onac, B.P., Fornós, J.J., Hay, C., Asmerom, Y., Dorale, J.A., Ginés, J., Tuccimei,
P., Ginés, A. (2018). A highly resolved record of relative sea level in the western Mediterranean
Sea during the last interglacial period. Nature Geoscience, 11: 860-864.
Pomar, L., Ginés, A., Ginés, J. (1979). Morfología, estructura y origen de los espeleotemas
epiacuáticos. Endins, 5: 3-17.
Pomar, L. (1991). Reef geometries, erosion surfaces and high frequency sea level changes,
Upper Miocene Reef Complex, Mallorca, Spain. Sedimentology, 38: 243-269.
Pomar, L., Ward, W.C., Green, D. (1996). Upper Miocene reef complex of the Llucmajor area,
Mallorca, Spain. In: Franseen, E., Esteban, M., Ward, W.C., Rouch, J.M. (eds.) Models for
carbonate stratigraphy from Miocene reef complexes of Mediterranean regions. SEPM Concepts
in Sedimentology and Paleontology, 5: 191-225.
Ramis, C., Romero, R., Homar, V. (2009). The severe thunderstorm of 4 October 2007 in
Mallorca: an observational study. Natural Hazards and Earth System Sciences, 9 (4): 1237-1245.
Rasmussen, S.O., Bigler, M., Blockley, S.P., Blunier, T., Buchardt, S.L., Clausen, H.B.,
Cvijanovic, I., Dahl-Jensen, D., Johnsen, S.J., Fischer, H., Gkinis, V. et al. (2014). A
stratigraphic framework for abrupt climatic changes during the Last Glacial period based on
three synchronized Greenland ice-core records: refining and extending the INTIMATE event
stratigraphy. Quaternary Science Reviews, 106: 14-28.

92
Raymo, M.E., Lisiecki, L.E., Nisancioglu, K.H. (2006). Plio-Pleistocene ice volume, Antarctic
climate, and the global δ18O record. Science, 313: 492-495.
Reeder, R.J., Lamble, G.M., Northrup, P.A. (1999). XAFS study of the coordination and local
relaxation around Co2+, Zn2+, Pb2+, and Ba2+ trace elements, American Mineralogist, 84: 1049-1060.
Richards, D.A., Smart, P.L., Edwards, R.L. (1994). Maximum sea levels for the last glacial
period from U‐series ages of submerged speleothems. Nature, 367: 357–360.
Richards, D.A., Bottrell, S.H., Cliff, R.A., Strohle, K., Rowe, P.J. (1998). U/Pb dating of a
speleothem of Quaternary age. Geochimica et Cosmochimica Acta, 62: 3683-3688.
Richards, D.A., Dorale, J.A. (2003). Uranium-series chronology and environmental applications
of speleothems. Reviews in Mineralogy and Geochemistry, 52 (1): 407-460.
Robledo P.A., Pomar L. (2000). Upper Miocene karst collapse structures of the east coast,
Mallorca, Spain. Acta Carsologica, 29: 2-12.
Robledo Ardila, P.A., Durán, J.J., Pomar, L. (2004). Paleocollapse structures as geological
record for reconstruction of past karst processes during the Upper Miocene of Mallorca Island.
International Journal of Speleology, 33 (1-4): 81-95.
Rodríguez-Perea, A., Gelabert, B. (1998). Geologia de Mallorca. In: Fornós, J.J. (ed.) Aspectes
Geològics de les Balears. Palma de Mallorca, Universitat de les Illes Balears, pp. 11-38.
Rohling, E.J., Bigg, G.R. (1998). Paleosalinity and δ18O: a critical assessment. Journal of
Geophysical Research: Oceans, 103 (C1): 1307-1318.
Rohling, E.J., Grant, K., Bolshaw, M., Roberts, A.P., Siddall, M., Hemleben, C., Kucera, M.
(2009). Antarctic temperature and global sea level closely coupled over the past five glacial
cycles. Nature Geoscience, 2 (7): 500-504.
Rohling, E.J., Braun, K., Grant, K., Kucera, M., Roberts, A.P., Siddall, M., Trommer, G. (2010).
Comparison between Holocene and Marine Isotope Stage-11 sea-level histories. Earth and
Planetary Science Letters, 291 (1-4): 97-105.
Rohling, E.J., Foster, G.L., Grant, K.M., Marino, G., Roberts, A.P., Tamisiea, M.E., Williams, F.
(2014). Sea-level and deep-sea-temperature variability over the past 5.3 million years. Nature,
508: 477-482.
Rosholt, J.N., Antal, P.S. (1962). Evaluation of the 231Pa/U-230Th/U method for dating
Pleistocene carbonate rocks. US Geological Survey Professional Paper, 450: 108-111.
Rosselló, V.M., Balaguer, P., Fornós, J.J., Ginés, J., Gómez-Pujol, Ll., Pardo-Pascual, J.E.,
Segura, F. (2007). El modelado de la costa rocosa oriental de Mallorca: macro, meso y
microformas. In: Fornós, J.J., Ginés, J., Gómez-Pujol, Ll. (eds.). Geomorfología Litoral:
Llevant y Migjorn de Mallorca. Monografies de la Societat. d’Historia Natural de les Balears,
15: 153-172.

93
Rovere, A., Raymo, M.E., Vacchi, M., Lorscheid, T., Stocchi, P., Gomez-Pujol, L., Harris, D.L.,
Casella, E., O’Leary, M.J., Hearty, P.J. (2016). The analysis of Last Interglacial (MIS 5e)
relative sea-level indicators: Reconstructing sea-level in a warmer world. Earth-Science Reviews,
159: 404-427.
Rovere, A., Stocchi, P., Vacchi, M. (2016). Eustatic and relative sea level changes. Current
Climate Change Reports, 2 (4): 221-231.
Rudzka, D., McDermott, F., Baldini, L.M., Fleitmann, D., Moreno, A., Stoll, H. (2011). The
coupled δ13C-radiocarbon systematics of three Late Glacial/early Holocene speleothems; insights
into soil and cave processes at climatic transitions. Geochimica et Cosmochimica Acta, 75 (15):
4321-4339.
Rutherford, E., Soddy, F. (1902). The radioactivity of thorium compounds II. The cause and
nature of radioactivity. Journal of the Chemical Society, Transactions, 81: 837-860.
Salomons, W., Mook, W.G. (1986). Isotope geochemistry of carbonates in the weathering zone.
In: Fontes, J.C., Fritz, P. (eds), Handbook of environmental isotope geochemistry: the terrestrial
environment. Amsterdam: Elsevier, 8: 239-270.
Schoene, B. (2014). 4.10 U–Th–Pb Geochronology. In: Turekian, H.D.H.K. (ed.) Treatise on
Geochemistry (2nd edition). Oxford: Elsevier, pp. 341-378.
Schwarcz, H.P. (1986). Geochronology and isotopic geochemistry of speleothems. In: Fontes,
J.C., Fritz, P. (eds), Handbook of environmental isotope geochemistry: the terrestrial
environment. Amsterdam: Elsevier, 8: 271-303.
Shackleton, N.J. (1987). Oxygen isotopes, ice volume and sea level. Quaternary Science
Reviews, 6 (3-4): 183-190.
Shen, C.C., Edwards, R.L., Cheng, H., Dorale, J.A., Thomas, R.B., Moran, S.B., Weinstein, S.E,
Edmonds, H.N. (2002). Uranium and thorium isotopic and concentration measurements by
magnetic sector inductively coupled plasma mass spectrometry. Chemical Geology, 185 (3-4):
165-178.
Siddall, M., Rohling, E.J., Almogi-Labin, A., Hemleben, C., Meischner, D., Schmelzer, I.,
Smeed, D.A. (2003). Sea-level fluctuations during the last glacial cycle. Nature, 423: 853-858.
Smart, P.L., Friedrich, H. (1987). Water movement and storage in the unsaturated zone of a
maturaly karstified aquifer, Mendip Hills, England. Proceedings of the Conference on
Environmental Problems in Karst Terrains and their Solution, Bowling Green, Kentucky.
National Water Well Association, pp. 57-87.
Spratt, R.M., Lisiecki, L.E. (2016). A Late Pleistocene sea level stack. Climate of the Past, 12
(4): 1079-1092.
Steiger, R.H., Jäger, E. (1977) Subcommission on Geochronology: Convention on the use of decay
constants in geo- and cosmochronology. Earth and Planetary Science Letters, 36: 359-362.

94
Stocchi, P., Vacchi, M., Lorscheid, T., de Boer, B., Simms, A.R., van de Wal, R.S., Vermeersen,
B.L.A., Pappalardo, M., Rovere, A. (2018). MIS 5e relative sea-level changes in the
Mediterranean Sea: Contribution of isostatic disequilibrium. Quaternary Science Reviews, 185:
122-134.
Sturchio, N.C., Antonio, M.R., Saderholm, L., Sutton, S.R., Brannon, J.C. (1998). Tetravalent
uranium in calcite. Science, 281: 971-973.
Suess, E. (1909). The face of the earth (Das antlitz der erde) (Vol. 4). Clarendon Press.
Sumner, G., Homar, V., Ramis, C. (2001). Precipitation seasonality in the Eastern and Southern
Coastal Spain. International Journal of Climatology, 21: 219-247.
Tera, F., Wasserburg, G.J. (1972). U–Th–Pb systematics in three Apollo 14 basalts and the
problem of initial Pb in lunar rocks. Earth and Planetary Science Letters, 4: 281-304.
Thomson, J.J. (1914). Rays of positive electricity, Proceedings of the Royal Society of London,
89: 1.
Thompson, P., Schwarcz, H.P., Ford, D.C. (1974). Continental Pleistocene climatic variations
from speleothem age and isotopic data. Science, 184: 893-895.
Thompson, P., Ford, D.C., Schwarcz, H.P. (1975). 234U/238U ratios in limestone cave seepage
waters and speleothem from West Virginia. Geochimica et Cosmochimica Acta, 39 (5): 661-669.
Tuccimei, P., Antonioli, F., Delitala, M.C., Fornós, J.J., Ginés, A., Ginés, J., Mucedda, M., Orrù,
P., Taddeucci, A. (2000a). Sea level changes during oxygen isotope stage 5 and 7 at capo Caccia
(Alghero, Sardinia), based on U/Th datings of phreatic overgrowths on speleothems and
geomorphological evidences. Proceedings of AIQUA Workshop: ‘‘Tyrrhenian in Italy’’, pp. 24-26.
Tuccimei, P., Ginés, J., Delitala, C., Pazzelli, L., Taddeucci, A., Clamor, B., Fornós, J.J., Ginés,
A., Gràcia, F. (2000b). Dataciones Th/U de espeleotemas freáticos recolectados a cotas inferiores
al actual nivel marino en cuevas costeras de Mallorca (España): Aportaciones a la construcción
de una curva eustática detallada de los últimos 300 ka para el Mediterráneo occidental. Endins,
23: 59-72.
Tuccimei, P., Ginés, J., Delitala, M.C., Ginés, A., Gràcia, F., Fornós, J.J., Taddeucci, A. (2006).
Last interglacial sea level changes in Mallorca island (Western Mediterranean). High precision U-
series data from phreatic overgrowths on speleothems. Zeitschrift für Geomorphologie, 50 (1): 1-
21.
Tuccimei, P.; Soligo, M.; Ginés, J.; Ginés, A.; Fornós, J.J.; Kramers, J., Villa, I.M. (2010).
Constraining Holocene sea levels using U-Th ages of phreatic overgrowths on speleothems from
coastal caves in Mallorca (Western Mediterranean). Earth Surface Processes and Landforms, 35
(7): 782-790.
Van Hengstum, P.J., Richards, D.A., Onac, B.P., Dorale, J.A. (2015). Coastal caves and
sinkholes. In: Shennan, I., Long, A.J., Horton, B.P. (eds.), Handbook of sea-level research. New
York: John Wiley & Sons, pp. 83-103.

95
Vesica, P.L., Tuccimei, P., Turi, B., Fornós, J.J., Ginés, A., Ginés, J. (2000). Late Pleistocene
paleoclimates and sea-level change in the Mediterranean as inferred from stable isotope and U-
series studies of overgrowths on speleothems, Mallorca, Spain. Quaternary Science Reviews, 19
(9): 865-879.
Villa, I.M., Bonardi, M.L., De Bièvre, P., Holden, N.E., Renne, P.R. (2016). IUPAC-IUGS status
report on the half-lives of 238U, 235U and 234U. Geochimica et Cosmochimica Acta, 172: 387-392.
Waelbroeck, C., Labeyrie, L., Michel, E., Duplessy, J. C., McManus, J. F., Lambeck, K., Balbon,
E., Labracherie, M. (2002). Sea-level and deep water temperature changes derived from benthic
foraminifera isotopic records. Quaternary Science Reviews, 21 (1-3): 295-305.
Walker, J., Cliff, R.A., Latham, A.G. (2006). U\Pb isotopic age of the StW 573 hominid from
Sterkfontein, South Africa. Science, 314: 1592-1594.
Wehmiller, J.F., Simmons, K.R., Cheng, H., Edwards, R.L., Martin-McNaughton, J., York, L.L.,
Krantz, D.E., Shen, C.C. (2004). Uranium-series coral ages from the US Atlantic Coastal Plain–
the “80 ka problem” revisited. Quaternary International, 120 (1): 3-14.
Wendt, I. (1984). A three-dimensional U/Pb discordia plane to evaluate samples with common
lead of unknown isotopic composition. Chemical Geology, 46: 1-12.
Wetherill, G.W. (1956). Discordant uranium-lead ages. Transactions of American Geophysical
Union, 37: 320-326.
White, W.M. (2015). Isotope Geochemistry (1st edition). Oxford: John Wiley & Sons, 496 p.
Woodhead, J., Hellstrom, J., Maas, R., Drysdale, R., Zanchetta, G., Devine, P., Taylor, E. (2006).
U-Pb geochronology of speleothems by MC-ICPMS. Quaternary Geochronology, 1 (3): 208-221.
Woodhead, J., Pickering, R. (2012). Beyond 500 ka: progress and prospects in the U-Pb
chronology of speleothems, and their application to studies in palaeoclimate, human evolution,
biodiversity and tectonics. Chemical Geology, 322-323: 290-299.
Woodhead, J.D., Hellstrom, J., Pickering, R., Drysdale, R., Paul, B, Bajo, P. (2012). U and Pb
variability in older speleothems and strategies for their chronology. Quaternary Geochronology,
14: 105-113.
Zazo, C., Goy, J.L., Dabrio, C. J., Bardajı, T., Hillaire-Marcel, C., Ghaleb, B., González-
Delgado, J.Á, Soler, V. (2003). Pleistocene raised marine terraces of the Spanish Mediterranean
and Atlantic coasts: records of coastal uplift, sea-level highstands and climate changes. Marine
Geology, 194 (1-2): 103-133.
Zazo, C., Goy, J.L., Dabrio, C.J., Lario, J., González-Delgado, J.A., Bardají, T., Hillaire-Marcel,
C., Cabero, A., Ghaleb, B., Borja, F., Silva, P.G. (2013). Retracing the Quaternary history of sea-
level changes in the Spanish Mediterranean–Atlantic coasts: Geomorphological and
sedimentological approach. Geomorphology, 196: 36-49.
Zheng, Y. F. (1992) The three-dimensional U/Pb method: Generalized models and implications
for U–Pb two-stage systematics. Chemical Geology, 100: 3-18.

96
APPENDIX A:
DATA

97
Table A1. U-series dataset and ages of the samples in this study*.
* Initial 230Th/232Th corrections are: a Computed from Eq. 12; b Assumed 230Th/232Th atomic ratio of 2.0 × 10⁻⁵ ppm ±50%; c Assumed 230Th/232Th
atomic ratio of 4.4 × 10⁻⁵ ppm ± 50%. Not marked samples are ages corrected using an initial 230Th/232Th atomic ratio of 4.4 ppm ± 50%. Ages are
reported in years before present (BP), where the present is 2018. All errors are absolute 2σ.
Location Sample CodeElevation
(mapsl)
Corrected
Age
(yr BP)
errors
(+)errors (-)
CF-10-2 2 m 388 ± 0.5 1259 ± 51 956 ± 39 1.0164 ± 0.0025 1.022 ± 0.0016 22 ± 2 83 ± 7 465132 +26402 -22491CF-12-1 2.9 m 353 ± 0.5 6934 ± 47 158 ± 1 1.0121 ± 0.0025 1.013 ± 0.0017 13 ± 2 62 ± 13 558020 +75337 -50357CF-13-1 2.8 m 331 ± 0.4 20 ± 30 51183 ± 75235 1.0231 ± 0.0024 1.020 ± 0.0020 18 ± 1 653948 +31672 -30346CF-14-1 3 m 256 ± 0.4 32 ± 57 24439 ± 43175 1.0135 ± 0.0032 1.017 ± 0.0022 17 ± 2 70 ± 12 500322 +51562 -38491
CF-11-35 a 298 ± 0.5 72 ± 10 8156 ± 1134 0.6461 ± 0.0020 1.167 ± 0.0026 167 ± 3 212 ± 3 85690 +512 -509
CF-11-21 a 229 ± 0.3 7368 ± 10 61 ± 0.2 0.6445 ± 0.0018 1.152 ± 0.0023 152 ± 2 192 ± 3 84097 +1673 -1649
CF-11-18 a 393 ± 0.5 10177 ± 9 77 ± 0.2 0.6530 ± 0.0017 1.163 ± 0.0017 163 ± 2 207 ± 2 85452 +1190 -1178
CF-11-13 a 225 ± 0.3 2822 ± 4 155 ± 0.5 0.6388 ± 0.0019 1.150 ± 0.0020 150 ± 2 191 ± 3 84666 +950 -942
CF-11-10 a 283 ± 0.4 281 ± 4 1962 ± 31 0.6382 ± 0.0015 1.163 ± 0.0018 163 ± 2 207 ± 2 84349 +405 -403
DIP-1-A-1 393 ± 0.5 2664 ± 49 460 ± 8 1.0189 ± 0.0026 1.009 ± 0.0015 9.3 ± 1 646459 +55877 -51727DIP-1-A-2 313 ± 0.4 1096 ± 2 890 ± 2 1.0180 ± 0.0024 1.009 ± 0.0012 8.7 ± 1 602644 +62150 -57393DIP-1-B-1 3 m 458 ± 0.6 17 ± 1 84347 ± 4139 1.0126 ± 0.0024 1.007 ± 0.0011 6.6 ± 1 613333 +81615 -73455FE-1-F-2 5.5 m 202 ± 0.2 4597 ± 32 135 ± 1 1.0033 ± 0.0024 1.011 ± 0.0015 11 ± 2 44 ± 7 478301 +29487 -24658FE-1-E-1 4.5 m 385 ± 0.5 168 ± 2 6989 ± 94 0.9991 ± 0.0024 0.999 ± 0.0014 -1 ± 1 583942 +88305 -84743MIP-1-1 7 m 80 ± 0.2 654 ± 47 371 ± 27 0.9982 ± 0.0038 1.010 ± 0.0034 10 ± 3 37 ± 13 450976 +46187 -34984MIP-2-1 7 m 139 ± 0.3 3037 ± 4 140 ± 0.4 1.0026 ± 0.0030 1.008 ± 0.0028 8 ± 3 35 ± 14 515426 +74049 -49002MIP-3-1 10.8 m 82 ± 0.1 5727 ± 52 44 ± 0.4 1.0076 ± 0.0040 1.007 ± 0.0029 7 ± 3 579998 +76635 -68888MIP-4A-1 10.2 m 176 ± 0.3 1085 ± 61 497 ± 28 1.0026 ± 0.0032 1.003 ± 0.0026 3 ± 3 590577 +78492 -70262MIP-4B-1 10.4 m 115 ± 0.2 203 ± 49 1731 ± 415 0.9996 ± 0.0040 1.007 ± 0.0032 7 ± 3 27 ± 16 507683 +88854 -55352MIP-5-25 35 ± 0.1 5015 ± 40 22 ± 0.2 1.0386 ± 0.0065 1.013 ± 0.0033 13 ± 3 1080999 +63139 -61036
MIP-5-18 b 179 ± 0.2 13565 ± 28 43 ± 0.1 1.0693 ± 0.0024 1.106 ± 0.0017 106 ± 2 249 ± 5 296210 +2733 -2654
MIP-5-16 b 227 ± 0.3 3435 ± 45 218 ± 2.9 1.0783 ± 0.0027 1.125 ± 0.0020 125 ± 2 280 ± 6 284449 +2818 -2733
MIP-5-8 b 201 ± 0.3 16439 ± 46 39 ± 0.1 1.0363 ± 0.0026 1.139 ± 0.0020 139 ± 2 261 ± 4 223532 +1509 -1481
MIP-5-3 b 271 ± 0.4 3832 ± 35 216 ± 2.0 1.0001 ± 0.0024 1.179 ± 0.0016 179 ± 2 303 ± 3 185904 +1542 -1524
DR-D20-3A c 3266 ± 4.3 8373 ± 11 554 ± 1 0.4650 ± 0.0011 1.160 ± 0.0012 160 ± 1 187 ± 1 54466 +75 -75
DR-D20-3B c 4815 ± 5.6 31605 ± 13 247 ± 1 0.5306 ± 0.0012 1.160 ± 0.0012 160 ± 1 191 ± 1 63968 +92 -92
DR-D20-3C c 2499 ± 4.5 4053 ± 106 948 ± 25 0.5029 ± 0.0014 1.159 ± 0.0014 159 ± 1 189 ± 2 60695 +323 -322
DR-D20-6 c 3129 ± 2.8 4711 ± 72 1288 ± 20 0.6344 ± 0.0014 1.163 ± 0.0012 163 ± 1 206 ± 1 83663 +354 -353
DR-D20-4S 135 ± 0.2 1113 ± 57 359 ± 57 0.9655 ± 0.0027 1.122 ± 0.0025 122 ± 3 214 ± 5 198923 +2116 -2082
DR-D20-16.5 mm c 328 ± 0.3 755 ± 2 1296 ± 4 0.9771 ± 0.0022 1.112 ± 0.0011 112 ± 1 204 ± 2 211817 +755 -747
DR-D20-12.5 mm c 371 ± 0.4 36 ± 1 30839 ± 1022 0.9903 ± 0.0022 1.118 ± 0.0011 118 ± 1 217 ± 2 216704 +793 -785
DR-D20-3 mm c 286 ± 0.5 105 ± 2 8258 ± 196 0.9928 ± 0.0027 1.114 ± 0.0014 114 ± 1 213 ± 3 221155 +1043 -1029
DR-D20-straw c 228 ± 0.2 252 ± 3 2757 ± 31 0.9954 ± 0.0023 1.111 ± 0.0014 111 ± 1 210 ± 3 224736 +1092 -1077
1 m
Cala Falcó
model age =
model age =
model age =
model age =
Dimoni
238U
(ppb)
232Th
(ppt)
Initial
δ234
U
(‰)
234U/
238U
activity
230Th/
232Th
activity
230Th/
238U
activity
Measured
δ234
U
(‰)
sa
Ferradura
5 m
model age =
na Mitjana
12.3 m
-1.1 mCoves del
Drac
model age =
model age =
model age =

98
Table A2. U-Pb data for the flowstone FE-1-A.
Location Sample CodeElevation
(mapsl)
FE-1-A-1-Pb-A 74 ± 0.1 91 ± 34 27 ± 0.10 18 ± 0.102 7.6 ± 0.205 139 ± 0.2 1.003 ± 0.008 1.003 ± 0.002 3.0 ± 1.5
FE-1-A-1-Pb-B 95 ± 0.1 79 ± 41 276 ± 0.05 21 ± 0.101 0.9 ± 0.174 18 ± 0.1 0.994 ± 0.005 1.003 ± 0.001 3.2 ± 1.4
FE-1-A-1-Pb-C 46 ± 0.1 33 ± 30 541 ± 0.14 18 ± 0.102 1.3 ± 0.233 23 ± 0.2 1.023 ± 0.007 1.012 ± 0.002 12.2 ± 2.1
FE-1-A-1-Pb-D 149 ± 0.2 121 ± 31 208 ± 0.06 18 ± 0.101 2.0 ± 0.186 36 ± 0.2 0.988 ± 0.005 1.004 ± 0.001 3.8 ± 1.3
FE-1-A-1-Pb-E 74 ± 0.1 97 ± 40 49 ± 0.06 18 ± 0.102 4.2 ± 0.216 76 ± 0.2 0.993 ± 0.006 1.005 ± 0.002 4.8 ± 2.5
FE-1-A-2-Pb-A 11 ± 0.1 102 ± 44 153 ± 0.06 18 ± 0.121 1.2 ± 0.243 22 ± 0.2 0.997 ± 0.009 1.001 ± 0.002 1.3 ± 2.4
FE-1-A-2-Pb-B 84 ± 0.1 191 ± 39 79 ± 0.05 18 ± 0.103 2.9 ± 0.198 53 ± 0.2 0.993 ± 0.008 1.003 ± 0.002 3.3 ± 1.9
FE-1-A-2-Pb-C 73 ± 0.1 44 ± 27 104 ± 0.14 18 ± 0.121 1.9 ± 0.230 35 ± 0.2 0.996 ± 0.005 1.005 ± 0.001 5.2 ± 1.4
FE-1-A-2-Pb-D 84 ± 0.1 72 ± 33 199 ± 0.06 18 ± 0.101 1.1 ± 0.186 20 ± 0.2 0.991 ± 0.007 1.001 ± 0.002 0.7 ± 1.6
FE-1-A-2-Pb-E 95 ± 0.1 179 ± 33 9 ± 0.16 19 ± 0.129 29.7 ± 0.310 552 ± 0.3 0.996 ± 0.008 1.006 ± 0.002 5.7 ± 2.3
3.5 m
206Pb/
204Pb
Total Pb
(ppb)
232Th
(ppt)
238U
(ppb)238
U/206
Pb 238
U/204
Pb 230
Th/238
U
activity
234U/
238U
activity
Measured
δ234
U
(‰)
sa
Ferradura

99
Table A3. Carbon and Oxygen isotopic data for CF-11 stalagmite.
Continue next page.
Depth from top
(mm)
Age
(ka)
δ13
C
(‰ VPDB)
δ18
O
(‰ VPDB)
0.0 83.69 -5.23 -4.06
0.5 83.72 -1.03 -3.35
1.0 83.75 -5.53 -3.28
1.5 83.79 -3.00 -2.80
2.0 83.82 -5.20 -2.78
2.5 83.86 -4.86 -3.25
3.0 83.89 -4.36 -3.08
3.5 83.92 -3.11 -3.12
4.0 83.96 -4.71 -2.58
4.5 83.99 -5.07 -2.46
5.0 84.02 -5.99 -2.95
5.5 84.06 -4.41 -2.35
6.0 84.09 -5.11 -2.96
6.5 84.13 -7.07 -3.19
7.0 84.16 -5.57 -2.92
7.5 84.19 -6.61 -3.31
8.0 84.23 -5.65 -2.58
8.5 84.26 -5.27 -2.65
9.0 84.30 -5.07 -2.66
9.5 84.34 -4.85 -2.97
10.0 84.38 -6.05 -2.61
10.5 84.43 -2.33 -3.18
11.0 84.47 -4.11 -3.52
11.5 84.52 -2.17 -2.46
12.0 84.57 -1.29 -2.49
12.5 84.61 -2.84 -3.10
13.0 84.64 -4.62 -3.06
13.5 84.68 -4.61 -3.05
14.0 84.71 -1.83 -2.00
14.5 84.74 -3.23 -2.27
15.0 84.76 -6.10 -3.50
15.5 84.79 -3.96 -2.86
16.0 84.82 -2.62 -3.83
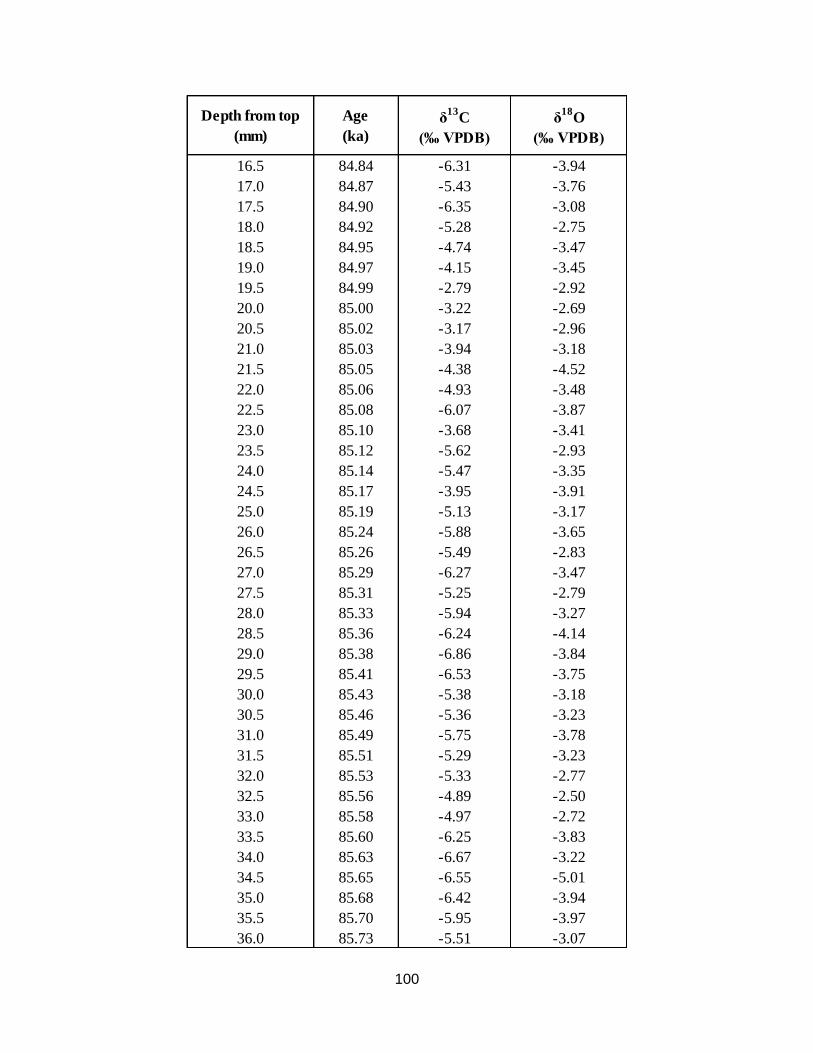
100
Depth from top
(mm)
Age
(ka)
δ13
C
(‰ VPDB)
δ18
O
(‰ VPDB)
16.5 84.84 -6.31 -3.94
17.0 84.87 -5.43 -3.76
17.5 84.90 -6.35 -3.08
18.0 84.92 -5.28 -2.75
18.5 84.95 -4.74 -3.47
19.0 84.97 -4.15 -3.45
19.5 84.99 -2.79 -2.92
20.0 85.00 -3.22 -2.69
20.5 85.02 -3.17 -2.96
21.0 85.03 -3.94 -3.18
21.5 85.05 -4.38 -4.52
22.0 85.06 -4.93 -3.48
22.5 85.08 -6.07 -3.87
23.0 85.10 -3.68 -3.41
23.5 85.12 -5.62 -2.93
24.0 85.14 -5.47 -3.35
24.5 85.17 -3.95 -3.91
25.0 85.19 -5.13 -3.17
26.0 85.24 -5.88 -3.65
26.5 85.26 -5.49 -2.83
27.0 85.29 -6.27 -3.47
27.5 85.31 -5.25 -2.79
28.0 85.33 -5.94 -3.27
28.5 85.36 -6.24 -4.14
29.0 85.38 -6.86 -3.84
29.5 85.41 -6.53 -3.75
30.0 85.43 -5.38 -3.18
30.5 85.46 -5.36 -3.23
31.0 85.49 -5.75 -3.78
31.5 85.51 -5.29 -3.23
32.0 85.53 -5.33 -2.77
32.5 85.56 -4.89 -2.50
33.0 85.58 -4.97 -2.72
33.5 85.60 -6.25 -3.83
34.0 85.63 -6.67 -3.22
34.5 85.65 -6.55 -5.01
35.0 85.68 -6.42 -3.94
35.5 85.70 -5.95 -3.97
36.0 85.73 -5.51 -3.07

101
Table A4. Age-depth model dataset for CF-11 stalagmite generated from StalAge algorithm
(Scholz and Hoffmann, 2011).
Continue next page.
Depth from top
(mm)
Age
(ka)
Error (+)
(ka)
Error (-)
(ka)
0 83.69 84.55 81.76
0.5 83.72 84.55 81.88
1 83.75 84.56 81.99
1.5 83.79 84.57 82.11
2 83.82 84.57 82.23
2.5 83.86 84.58 82.34
3 83.89 84.59 82.46
3.5 83.92 84.60 82.57
4 83.96 84.60 82.69
4.5 83.99 84.61 82.80
5 84.02 84.62 82.91
5.5 84.06 84.62 83.02
6 84.09 84.64 83.14
6.5 84.13 84.65 83.24
7 84.16 84.67 83.35
7.5 84.19 84.69 83.47
8 84.23 84.70 83.58
8.5 84.26 84.70 83.70
9 84.30 84.70 83.81
9.5 84.34 84.72 83.91
10 84.38 84.77 83.98
10.5 84.43 84.85 84.02
11 84.47 84.96 84.04
11.5 84.52 85.07 84.05
12 84.57 85.17 84.07
12.5 84.61 85.23 84.09
13 84.64 85.27 84.12
13.5 84.68 85.31 84.15
14 84.71 85.34 84.17
14.5 84.74 85.40 84.17
15 84.76 85.46 84.17
15.5 84.79 85.54 84.17
16 84.82 85.61 84.17

102
Depth from top
(mm)
Age
(ka)
Error (+)
(ka)
Error (-)
(ka)
16.5 84.84 85.65 84.18
17 84.87 85.69 84.18
17.5 84.90 85.73 84.20
18 84.92 85.77 84.23
18.5 84.95 85.82 84.25
19 84.97 85.86 84.28
19.5 84.99 85.89 84.32
20 85.00 85.89 84.34
20.5 85.02 85.89 84.36
21 85.03 85.89 84.38
21.5 85.05 85.89 84.41
22 85.06 85.89 84.44
22.5 85.08 85.89 84.48
23 85.10 85.89 84.54
23.5 85.12 85.89 84.59
24 85.14 85.89 84.64
24.5 85.17 85.89 84.68
25 85.19 85.90 84.71
26 85.24 85.92 84.76
26.5 85.26 85.93 84.79
27 85.29 85.94 84.82
27.5 85.31 85.95 84.85
28 85.33 85.96 84.88
28.5 85.36 85.97 84.91
29 85.38 85.99 84.93
29.5 85.41 86.00 84.96
30 85.43 86.01 84.98
30.5 85.46 86.03 85.00
31 85.49 86.04 85.02
31.5 85.51 86.05 85.04
32 85.53 86.07 85.05
32.5 85.56 86.08 85.07
33 85.58 86.10 85.09
33.5 85.60 86.11 85.10
34 85.63 86.13 85.12
34.5 85.65 86.15 85.13
35 85.68 86.18 85.14
35.5 85.70 86.22 85.15
36 85.73 86.26 85.16

103
APPENDIX B:
COPYRIGHT PERMISSIONS
Figure B1. Authorship permission provided by Joaquin Ginés for using a picture from Mondragó
Natural Park in the present study (Fig. 5).
Figure B2. Permission granted from Joaquin Ginés to use his images from Mallorca Island in the present
study (Figs. 12 and 29)
104
Figure B3. Permission provided from Joan Fornós to use some pictures in this thesis (Fig. 29 and 31)
Figure B4. Permission granted by Judy Mcllrath to use some pictures of Mallorca Island in this study
(Figs. 8A, 9B-D, and 29A).

105
Figure B5. Permission granted by Bogdan P. Onac to use the pictures of his property in the present study
(Figs. 4, 8, 9, 10, 11, 28, 29, and 30).

106
Figure B6. Permission obtained by Elsevier to use a picture (Fig. 6 in the present study) originally
published in the book Treatise on Geochemistry.