the south florida report september 2013 - trustedpartnercdn.trustedpartner.com/docs/library... ·...
TRANSCRIPT
South Florida Drug Trends Update
Jim Hall [email protected] 1
The South Florida Report
September 2013
Community Epidemiology Drug Report
James N. Hall NIDA-CEWG Report # 57
Center for Applied Research on Substance Use and Health Disparities
Nova Southeastern University
South Florida Drug Trends Update
Jim Hall [email protected] 2
Flagler
Highlands
Hardee
Polk
Martin
St. Lucie
Okeechobee
Indian River
PutnamAlachua
Bra
dfor
dUnion
Col
umbia
Gilchrist
Levy
Dixie
Suwannee
Hamilton
St.JohnsClay
Duval
Nas sau
Baker
Pinellas
Pasco
Manatee
Hillsborough
Bre
vard
Osceola
Orange
Seminole
Collier
HendryLee
Glades
De SotoSarasota
Palm Beach
LakeSumter
Hernando
Citrus
Marion
Taylor
Madison
Jeffe
rson
Wakulla
Leon
Franklin
Liberty
Gadsden
Jacks on
Calhoun
Gulf
BayW
ashin
gton
Escambia
Santa
RosaOkaloosa
Walton
Broward
Dade
Holmes
Monroe
Volusia
Lafayette
Charlotte
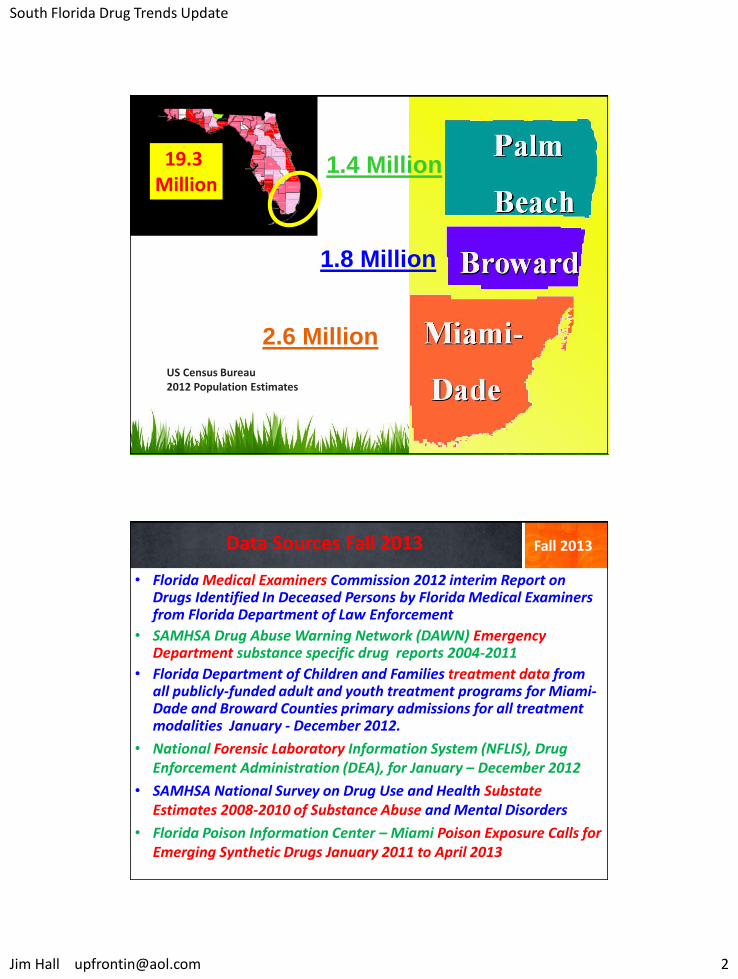
1.8 Million
1.4 Million
2.6 Million
19.3 Million
US Census Bureau 2012 Population Estimates
Data Sources Fall 2013
• Florida Medical Examiners Commission 2012 interim Report on Drugs Identified In Deceased Persons by Florida Medical Examiners from Florida Department of Law Enforcement
• SAMHSA Drug Abuse Warning Network (DAWN) Emergency Department substance specific drug reports 2004-2011
• Florida Department of Children and Families treatment data from all publicly-funded adult and youth treatment programs for Miami-Dade and Broward Counties primary admissions for all treatment modalities January - December 2012.
• National Forensic Laboratory Information System (NFLIS), Drug Enforcement Administration (DEA), for January – December 2012
• SAMHSA National Survey on Drug Use and Health Substate Estimates 2008-2010 of Substance Abuse and Mental Disorders
• Florida Poison Information Center – Miami Poison Exposure Calls for Emerging Synthetic Drugs January 2011 to April 2013
Fall 2013
South Florida Drug Trends Update
Jim Hall [email protected] 3
South Florida’s Most Recent Indicator Changes
• Marijuana: High and Increasing • Cocaine: 5-Year Decline Reversing • Rx Opioids: Deaths Declining 12-% • Benzodiazepines: Deaths Declining 13-%
• Ecstasy: Mostly “Mollys” tests as bk-Methylone • Heroin: Epidemic Underway Deaths Up 120 %
• Cannabinmimetics: Types & Problems + “Pot Pens” • Methamphetamine: Low but Returning Key Issue for Gay Males and “Heavy Club Druggers”
HIG
H
Mo
der
ate
Lo
we
r
Levels of Indicator Intensity: HIGH Moderate Lower
Fall 2013
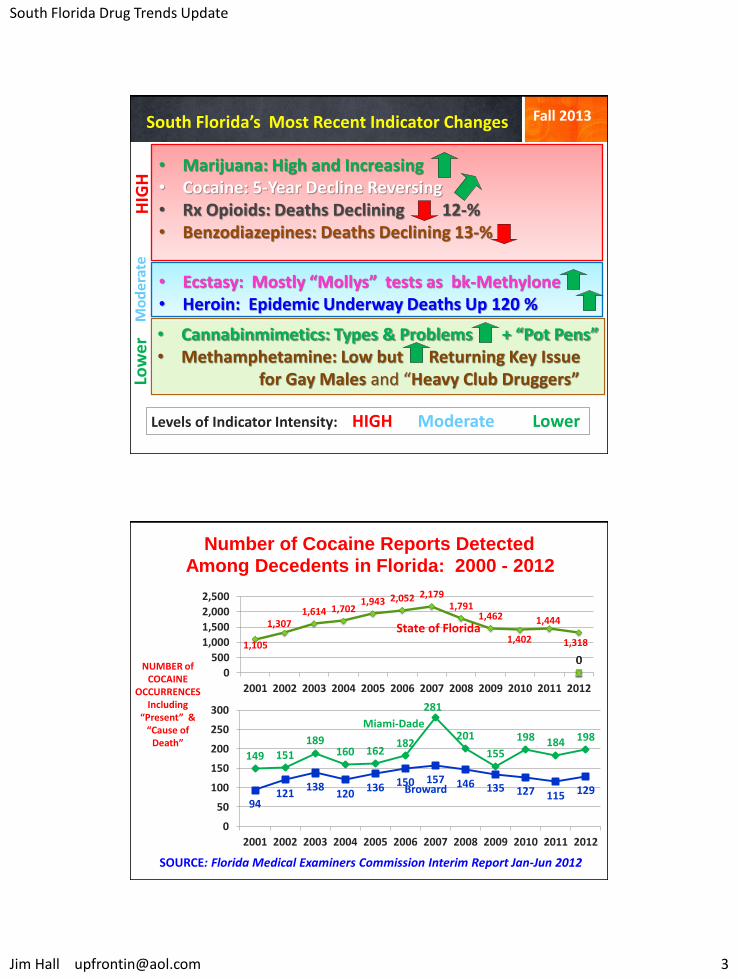
Number of Cocaine Reports Detected Among Decedents in Florida: 2000 - 2012
NUMBER of COCAINE
OCCURRENCES Including
“Present” & “Cause of
Death”
SOURCE: Florida Medical Examiners Commission Interim Report Jan-Jun 2012
1,105
1,307 1,614 1,702
1,943 2,052 2,179 1,791
1,462
1,402
1,444
1,318
0 0 0 0
500
1,000
1,500
2,000
2,500
2001 2002 2003 2004 2005 2006 2007 2008 2009 2010 2011 2012
State of Florida
149 151 189
160 162 182
281
201
155
198 184 198
94 121
138 120
136 150 157 146 135 127 115 129
0
50
100
150
200
250
300
2001 2002 2003 2004 2005 2006 2007 2008 2009 2010 2011 2012
Miami-Dade
Broward
South Florida Drug Trends Update
Jim Hall [email protected] 4
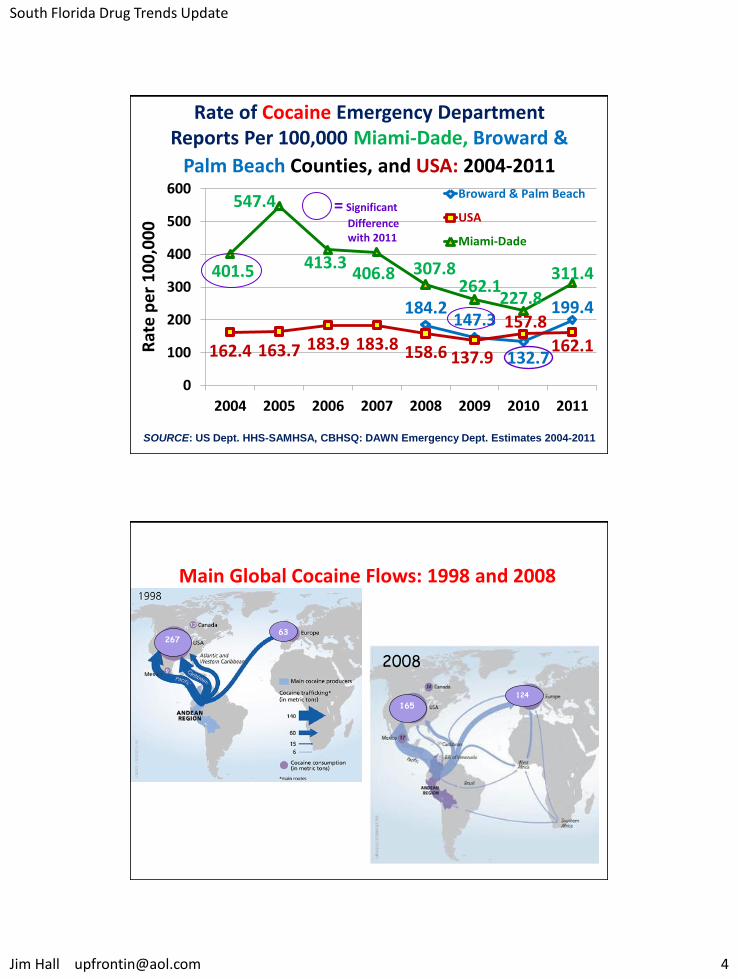
Rate of Cocaine Emergency Department Reports Per 100,000 Miami-Dade, Broward &
Palm Beach Counties, and USA: 2004-2011
184.2 147.3
132.7
199.4
162.4 163.7 183.9 183.8 158.6 137.9
157.8
162.1
401.5
547.4
413.3 406.8 307.8
262.1 227.8
311.4
0
100
200
300
400
500
600
2004 2005 2006 2007 2008 2009 2010 2011
Broward & Palm Beach
USA
Miami-Dade
SOURCE: US Dept. HHS-SAMHSA, CBHSQ: DAWN Emergency Dept. Estimates 2004-2011
Rat
e p
er
10
0,0
00
= Significant
Difference with 2011
Main Global Cocaine Flows: 1998 and 2008
UNODC, World Drug Report , Drug Trafficking, 1998 & 2010
2008
165
124
267 63
South Florida Drug Trends Update
Jim Hall [email protected] 5
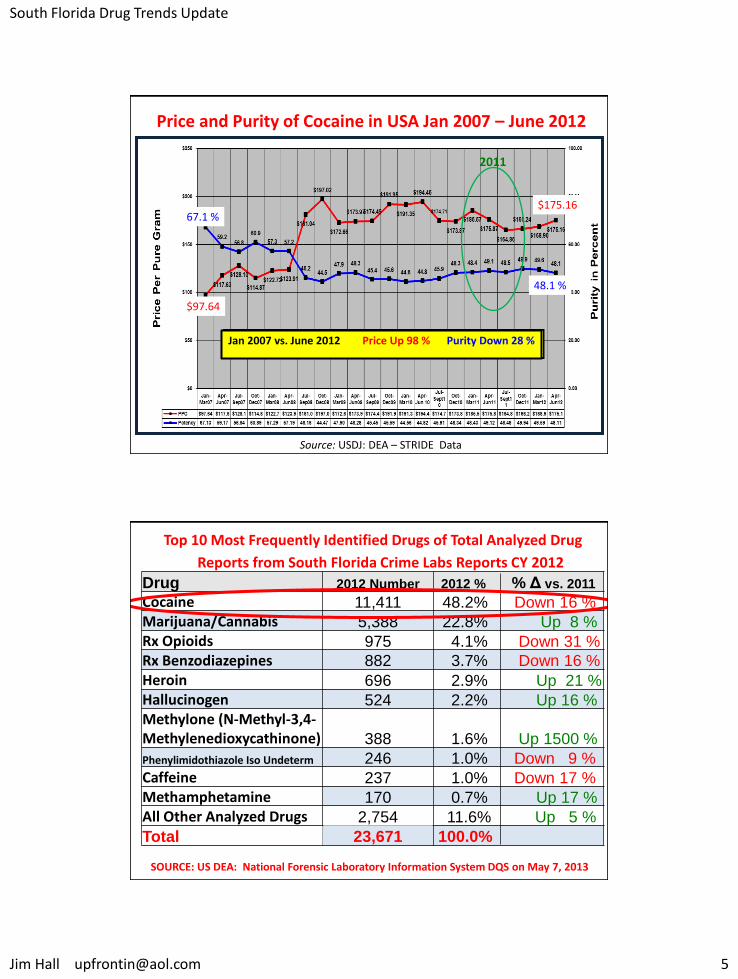
$97.64
$175.16 67.1 %
48.1 %
Price and Purity of Cocaine in USA Jan 2007 – June 2012
2011
Jan 2007 vs. June 2012 Price Up 98 % Purity Down 28 %
Source: USDJ: DEA – STRIDE Data
Top 10 Most Frequently Identified Drugs of Total Analyzed Drug
Reports from South Florida Crime Labs Reports CY 2012
Drug 2012 Number 2012 % % Δ vs. 2011
Cocaine 11,411 48.2% Down 16 %
Marijuana/Cannabis 5,388 22.8% Up 8 %
Rx Opioids 975 4.1% Down 31 %
Rx Benzodiazepines 882 3.7% Down 16 %
Heroin 696 2.9% Up 21 %
Hallucinogen 524 2.2% Up 16 %
Methylone (N-Methyl-3,4-Methylenedioxycathinone) 388 1.6% Up 1500 %
Phenylimidothiazole Iso Undeterm 246 1.0% Down 9 %
Caffeine 237 1.0% Down 17 %
Methamphetamine 170 0.7% Up 17 %
All Other Analyzed Drugs 2,754 11.6% Up 5 %
Total 23,671 100.0%
SOURCE: US DEA: National Forensic Laboratory Information System DQS on May 7, 2013
South Florida Drug Trends Update
Jim Hall [email protected] 6
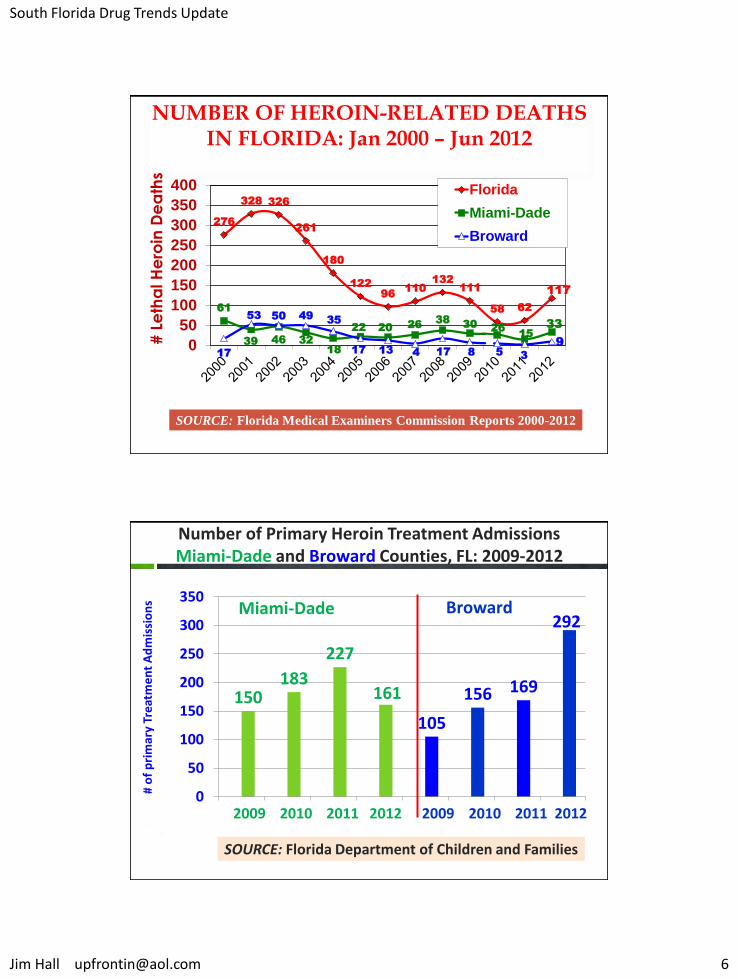
NUMBER OF HEROIN-RELATED DEATHS IN FLORIDA: Jan 2000 – Jun 2012
276
328 326
261
180
122
96 110
132
111
58 62
117
61
39 46 32
18
22 20 26
38 30
26 15
33
17
53 50 49 35
17 13 4 17 8 5 3
9 0
50
100
150
200
250
300
350
400 Florida
Miami-Dade
Broward
SOURCE: Florida Medical Examiners Commission Reports 2000-2012
# L
eth
al H
ero
in D
ea
ths
Number of Primary Heroin Treatment Admissions Miami-Dade and Broward Counties, FL: 2009-2012
150 183
227
161
105
156 169
292
0
50
100
150
200
250
300
350
1 2 3 4 5 6 7 8
# o
f p
rim
ary
Tre
atm
en
t A
dm
issi
on
s
SOURCE: Florida Department of Children and Families
2009 2010 2011 2012 2009 2010 2011 2012
Miami-Dade Broward
South Florida Drug Trends Update
Jim Hall [email protected] 7
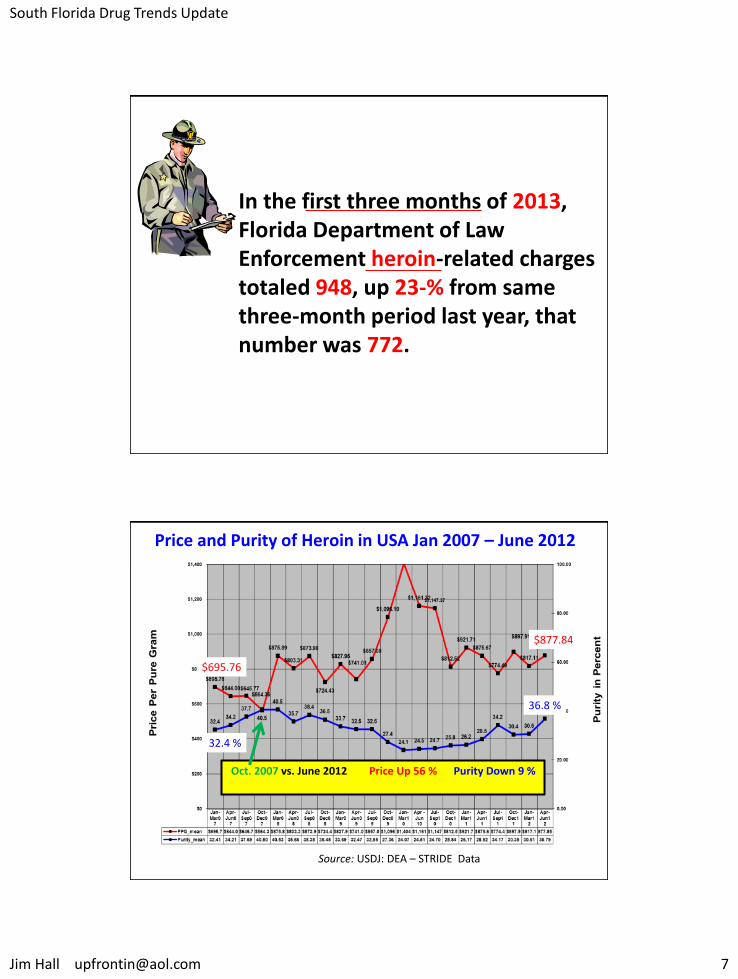
In the first three months of 2013, Florida Department of Law Enforcement heroin-related charges totaled 948, up 23-% from same three-month period last year, that number was 772.
Price and Purity of Heroin in USA Jan 2007 – June 2012
Oct. 2007 vs. June 2012 Price Up 56 % Purity Down 9 %
$695.76
$877.84
32.4 %
36.8 %
Source: USDJ: DEA – STRIDE Data
South Florida Drug Trends Update
Jim Hall [email protected] 8
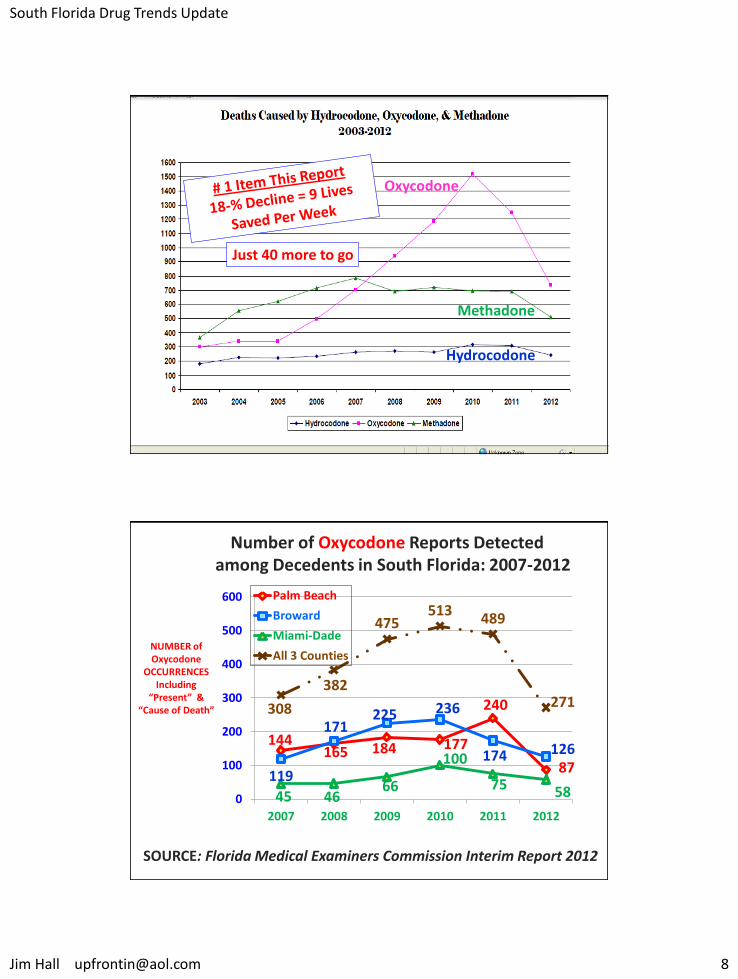
Oxycodone
Methadone
Hydrocodone
Just 40 more to go
Number of Oxycodone Reports Detected among Decedents in South Florida: 2007-2012
NUMBER of Oxycodone
OCCURRENCES Including
“Present” & “Cause of Death”
SOURCE: Florida Medical Examiners Commission Interim Report 2012
144 165 184 177
240
87 119
171 225 236
174 126
45 46 66
100
75 58
308
382
475 513
489
271
0
100
200
300
400
500
600
2007 2008 2009 2010 2011 2012
Palm Beach
Broward
Miami-Dade
All 3 Counties
South Florida Drug Trends Update
Jim Hall [email protected] 9
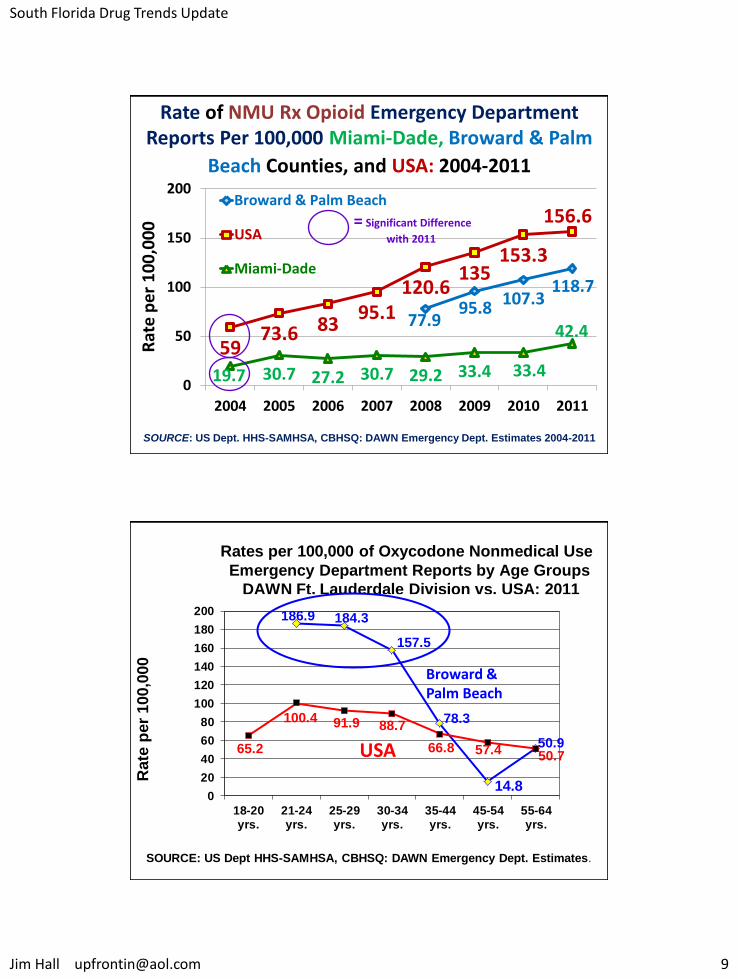
Rate of NMU Rx Opioid Emergency Department Reports Per 100,000 Miami-Dade, Broward & Palm
Beach Counties, and USA: 2004-2011
77.9 95.8 107.3
118.7
59 73.6 83
95.1 120.6
135 153.3
156.6
19.7 30.7 27.2 30.7 29.2 33.4
42.4
0
50
100
150
200
2004 2005 2006 2007 2008 2009 2010 2011
Broward & Palm Beach
USA
Miami-Dade
SOURCE: US Dept. HHS-SAMHSA, CBHSQ: DAWN Emergency Dept. Estimates 2004-2011
Rat
e p
er
10
0,0
00
= Significant Difference
with 2011
33.4
Rates per 100,000 of Oxycodone Nonmedical Use
E Emergency Department Reports by Age Groups
DAWN Ft. Lauderdale Division vs. USA: 2011
186.9 184.3
157.5
78.3
14.8
50.965.2
100.4 91.9 88.7
66.8 57.4 50.7
0
20
40
60
80
100
120
140
160
180
200
18-20yrs.
21-24yrs.
25-29yrs.
30-34yrs.
35-44yrs.
45-54yrs.
55-64yrs.
Rate
per
100,0
00
SOURCE: US Dept HHS-SAMHSA, CBHSQ: DAWN Emergency Dept. Estimates.
Broward & Palm Beach
USA
South Florida Drug Trends Update
Jim Hall [email protected] 10
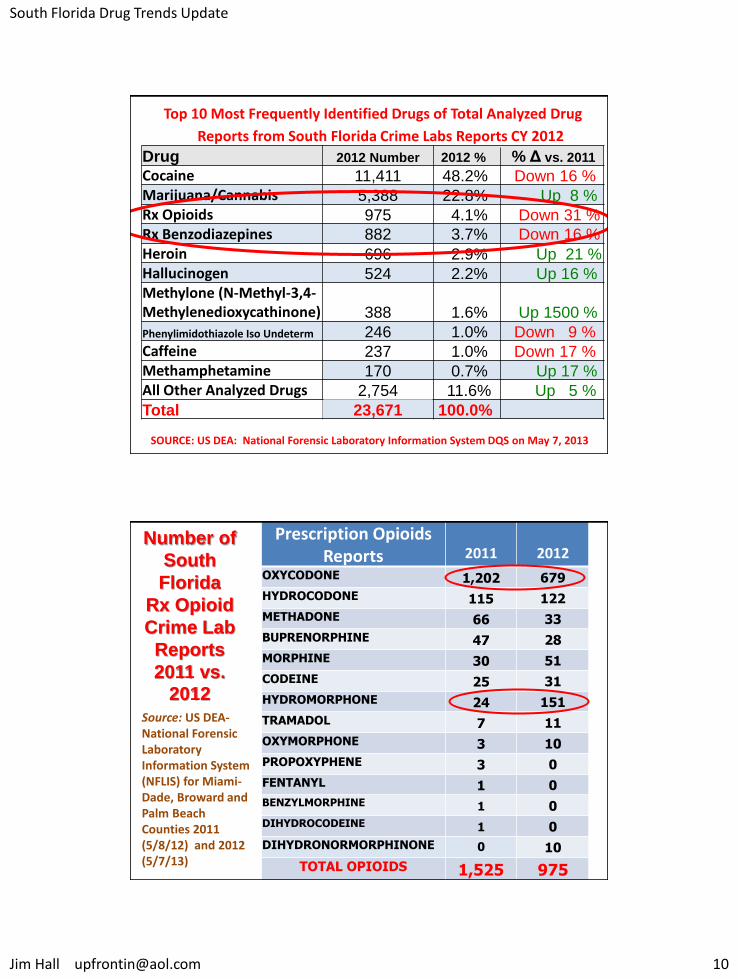
Top 10 Most Frequently Identified Drugs of Total Analyzed Drug
Reports from South Florida Crime Labs Reports CY 2012
Drug 2012 Number 2012 % % Δ vs. 2011
Cocaine 11,411 48.2% Down 16 %
Marijuana/Cannabis 5,388 22.8% Up 8 %
Rx Opioids 975 4.1% Down 31 %
Rx Benzodiazepines 882 3.7% Down 16 %
Heroin 696 2.9% Up 21 %
Hallucinogen 524 2.2% Up 16 %
Methylone (N-Methyl-3,4-Methylenedioxycathinone) 388 1.6% Up 1500 %
Phenylimidothiazole Iso Undeterm 246 1.0% Down 9 %
Caffeine 237 1.0% Down 17 %
Methamphetamine 170 0.7% Up 17 %
All Other Analyzed Drugs 2,754 11.6% Up 5 %
Total 23,671 100.0%
SOURCE: US DEA: National Forensic Laboratory Information System DQS on May 7, 2013
Number of
South
Florida
Rx Opioid
Crime Lab
Reports
2011 vs. 2012
Source: US DEA-National Forensic Laboratory Information System (NFLIS) for Miami-Dade, Broward and Palm Beach Counties 2011 (5/8/12) and 2012 (5/7/13)
Prescription Opioids Reports
2011
2012
OXYCODONE 1,202 679
HYDROCODONE 115 122
METHADONE 66 33
BUPRENORPHINE 47 28
MORPHINE 30 51
CODEINE 25 31
HYDROMORPHONE 24 151
TRAMADOL 7 11
OXYMORPHONE 3 10
PROPOXYPHENE 3 0
FENTANYL 1 0
BENZYLMORPHINE 1 0
DIHYDROCODEINE 1 0
DIHYDRONORMORPHINONE 0 10
TOTAL OPIOIDS 1,525 975
South Florida Drug Trends Update
Jim Hall [email protected] 11
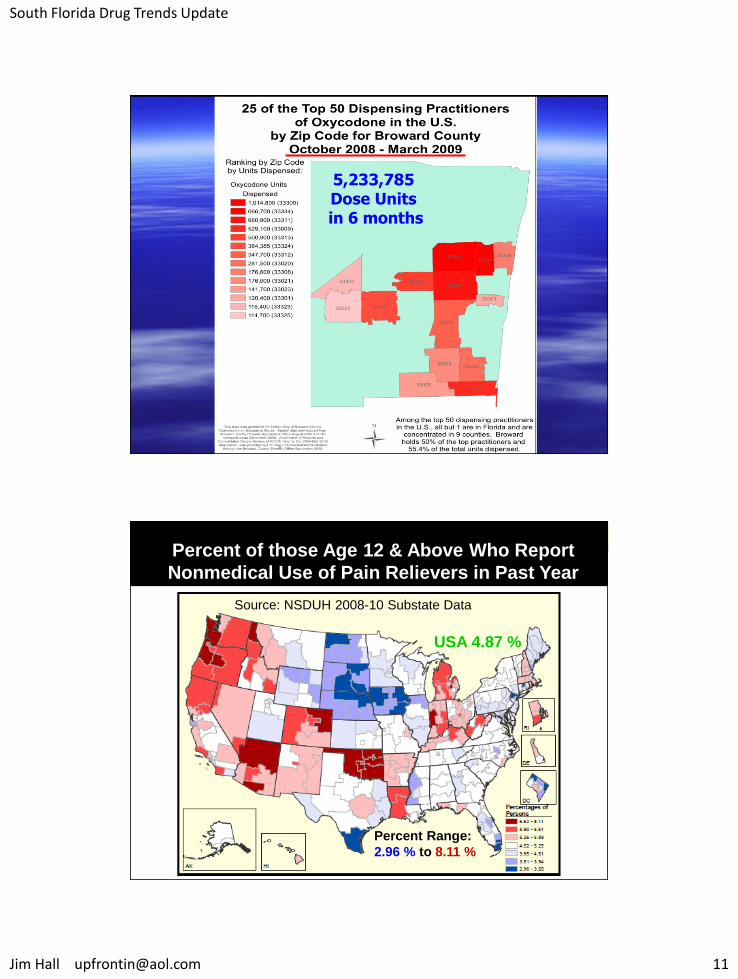
5,233,785 Dose Units in 6 months
Percent of those Age 12 & Above Who Report
Nonmedical Use of Pain Relievers in Past Year
Source: NSDUH 2008-10 Substate Data
USA 4.87 %
Percent Range:
2.96 % to 8.11 %
South Florida Drug Trends Update
Jim Hall [email protected] 12
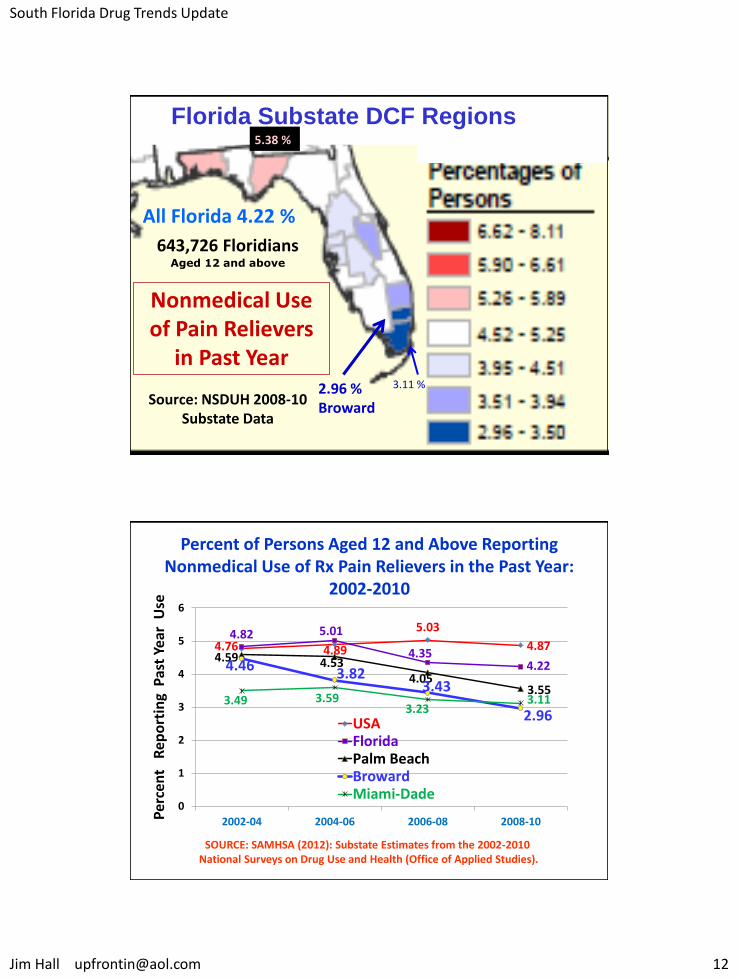
Florida Substate DCF Regions
All Florida 4.22 %
Nonmedical Use of Pain Relievers
in Past Year
Source: NSDUH 2008-10 Substate Data
643,726 Floridians Aged 12 and above
5.38 %
2.96 % Broward
3.11 %
Percent of Persons Aged 12 and Above Reporting Nonmedical Use of Rx Pain Relievers in the Past Year:
2002-2010
4.76 4.89
5.03
4.87 4.82 5.01
4.35 4.22
4.59 4.53 4.05
3.55
4.46 3.82
3.43
2.96 3.49 3.59
3.23 3.11
0
1
2
3
4
5
6
2002-04 2004-06 2006-08 2008-10
USAFloridaPalm BeachBrowardMiami-Dade
SOURCE: SAMHSA (2012): Substate Estimates from the 2002-2010 National Surveys on Drug Use and Health (Office of Applied Studies).
Per
cen
t R
epo
rtin
g P
ast
Year
Use
South Florida Drug Trends Update
Jim Hall [email protected] 13
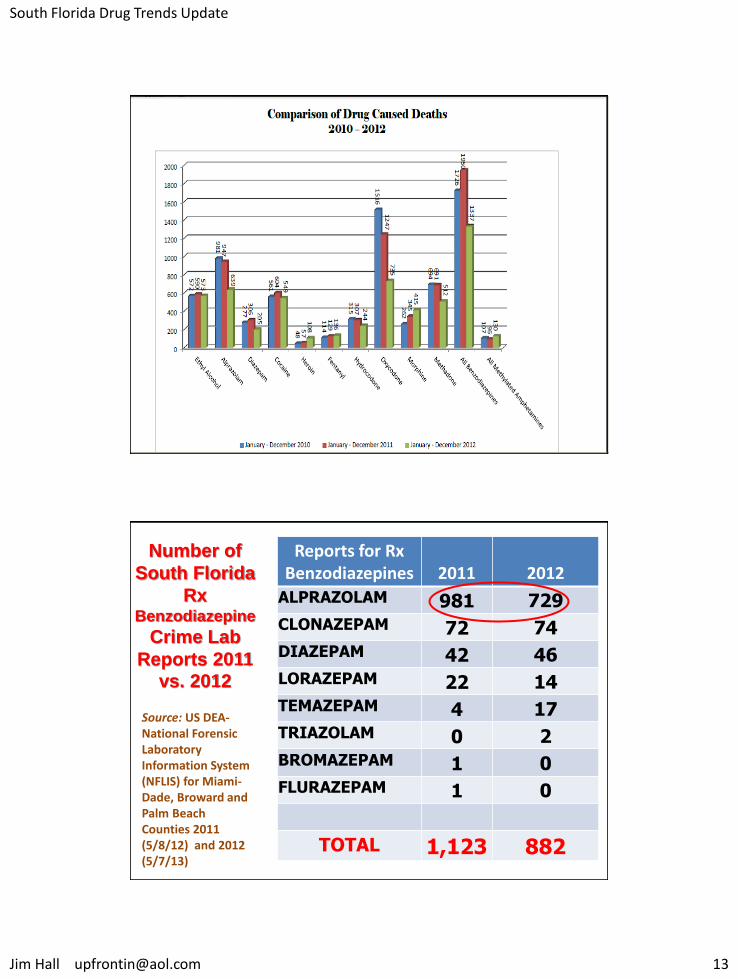
Number of
South Florida
Rx Benzodiazepine
Crime Lab
Reports 2011 vs. 2012
Source: US DEA-National Forensic Laboratory Information System (NFLIS) for Miami-Dade, Broward and Palm Beach Counties 2011 (5/8/12) and 2012 (5/7/13)
Reports for Rx Benzodiazepines
2011
2012
ALPRAZOLAM 981 729
CLONAZEPAM 72 74
DIAZEPAM 42 46
LORAZEPAM 22 14 TEMAZEPAM 4 17 TRIAZOLAM 0 2
BROMAZEPAM 1 0
FLURAZEPAM 1 0
TOTAL 1,123 882
South Florida Drug Trends Update
Jim Hall [email protected] 14
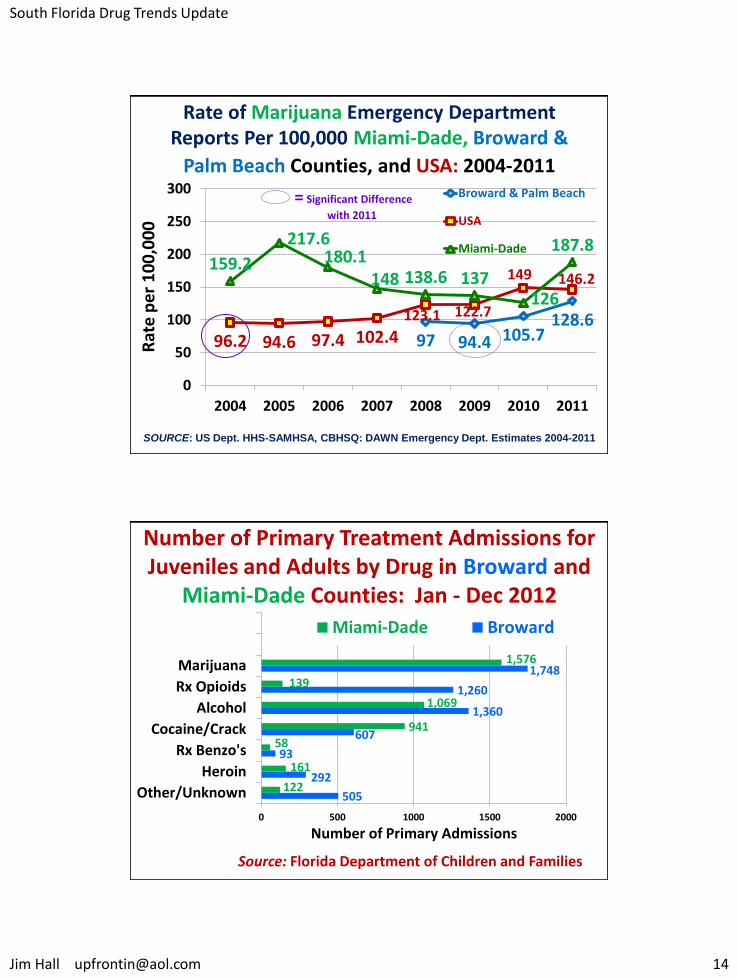
Rate of Marijuana Emergency Department Reports Per 100,000 Miami-Dade, Broward &
Palm Beach Counties, and USA: 2004-2011
97 94.4 105.7 128.6
96.2 94.6 97.4 102.4 123.1 122.7
149 146.2 159.2
217.6 180.1
148 138.6 137 126
187.8
0
50
100
150
200
250
300
2004 2005 2006 2007 2008 2009 2010 2011
Broward & Palm Beach
USA
Miami-Dade
SOURCE: US Dept. HHS-SAMHSA, CBHSQ: DAWN Emergency Dept. Estimates 2004-2011
Rat
e p
er
10
0,0
00
= Significant Difference
with 2011
Number of Primary Treatment Admissions for Juveniles and Adults by Drug in Broward and
Miami-Dade Counties: Jan - Dec 2012
Source: Florida Department of Children and Families
505
292
93
607
1,360
1,260
1,748
122
161
58 941
1,069
139
1,576
0 500 1000 1500 2000
Other/Unknown
Heroin
Rx Benzo's
Cocaine/Crack
Alcohol
Rx Opioids
Marijuana
Miami-Dade Broward
Number of Primary Admissions
South Florida Drug Trends Update
Jim Hall [email protected] 15
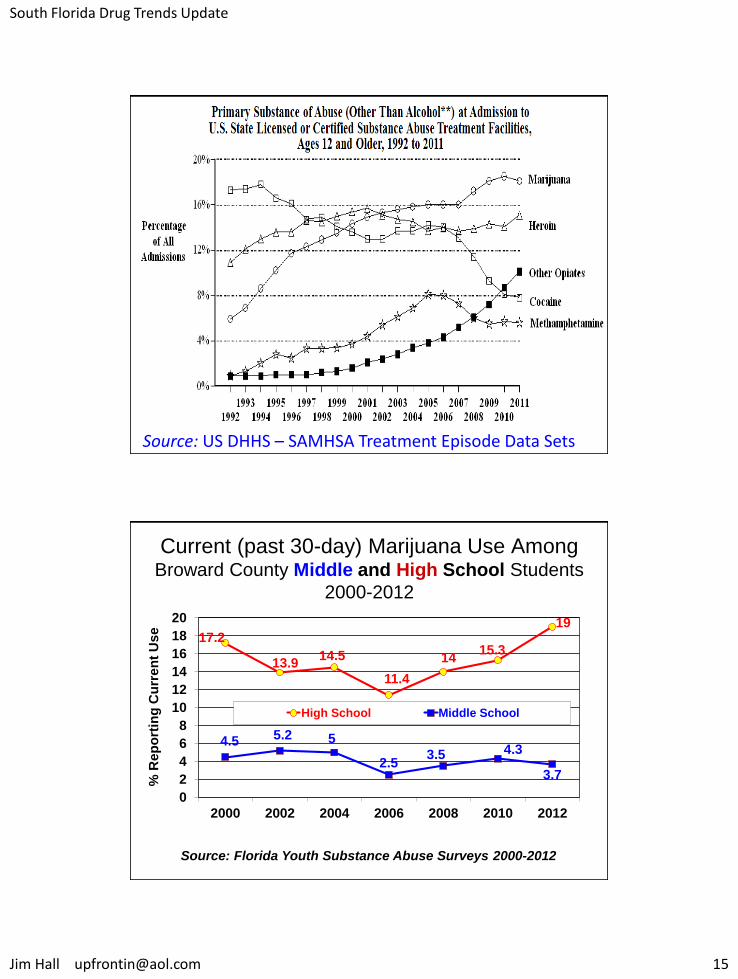
Source: US DHHS – SAMHSA Treatment Episode Data Sets
Current (past 30-day) Marijuana Use Among Broward County Middle and High School Students
2000-2012
Source: Florida Youth Substance Abuse Surveys 2000-2012
17.2
13.9 14.5
11.4
14 15.3
19
4.5 5.2 5
2.5 3.5 4.3
3.7
0
2
4
6
8
10
12
14
16
18
20
2000 2002 2004 2006 2008 2010 2012
% R
ep
ort
ing
Cu
rre
nt
Us
e
High School Middle School
South Florida Drug Trends Update
Jim Hall [email protected] 16
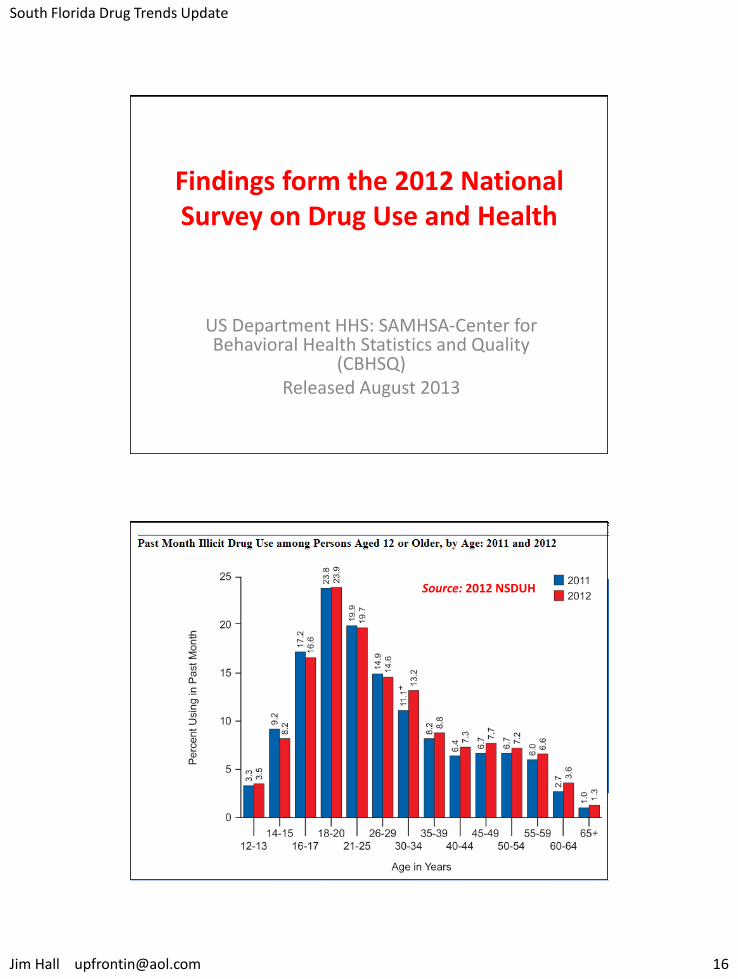
Findings form the 2012 National Survey on Drug Use and Health
US Department HHS: SAMHSA-Center for Behavioral Health Statistics and Quality
(CBHSQ) Released August 2013
Source: 2012 NSDUH

South Florida Drug Trends Update
Jim Hall [email protected] 17
Past Month Illicit Drug Use among Persons
Aged 12 and Older, by Age, 2002-2012
20.2 20.3 19.4
20.1 19.8 19.8 19.7
21.4 21.6 21.4 21.3
11.6 11.2 10.6
9.9 9.8 9.6 9.3 10.1 10.1 10.1
9.5
5.8 5.6 5.5 5.8 6.1 5.8 5.9 6.3 6.5 6.3 7
5
7
9
11
13
15
17
19
21
23
2002 2003 2004 2005 2006 2007 2008 2009 2010 2011 2012
Source: US Dept. HHS – SAMHSA National Survey on Drug Use and Health 2012
Perc
en
t U
sin
g In
P
ast
Mo
nth
Young Adult 18 to 25 yrs.
Children & Youth 12 to 17 yrs.
Adult 26 yrs. and Older
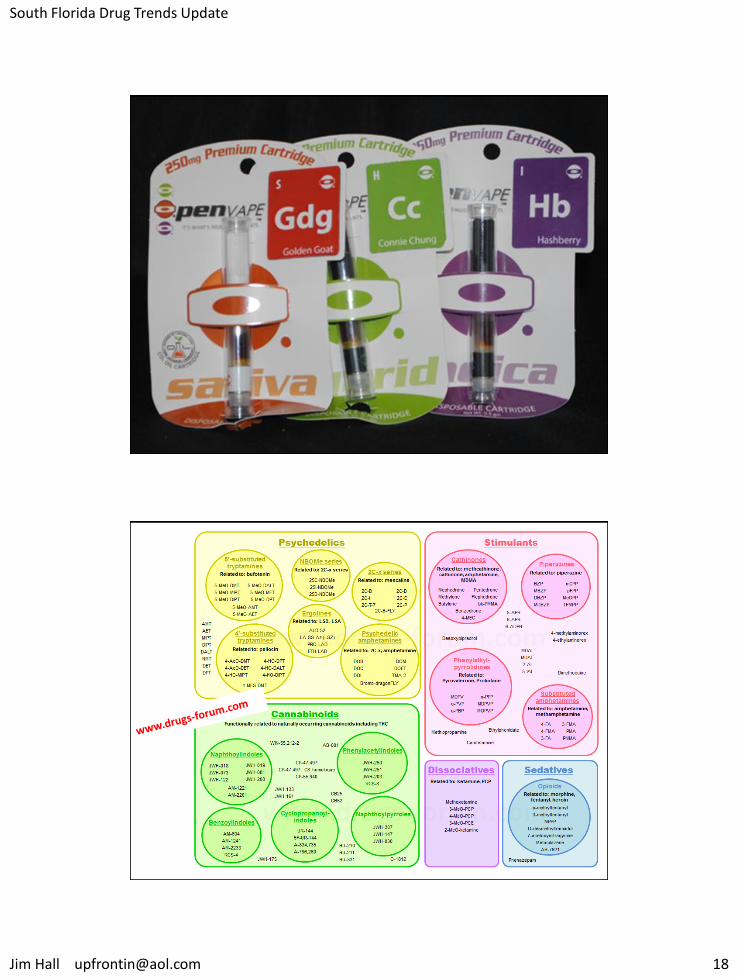
The pen is mightier than the pipe?
South Florida Drug Trends Update
Jim Hall [email protected] 19
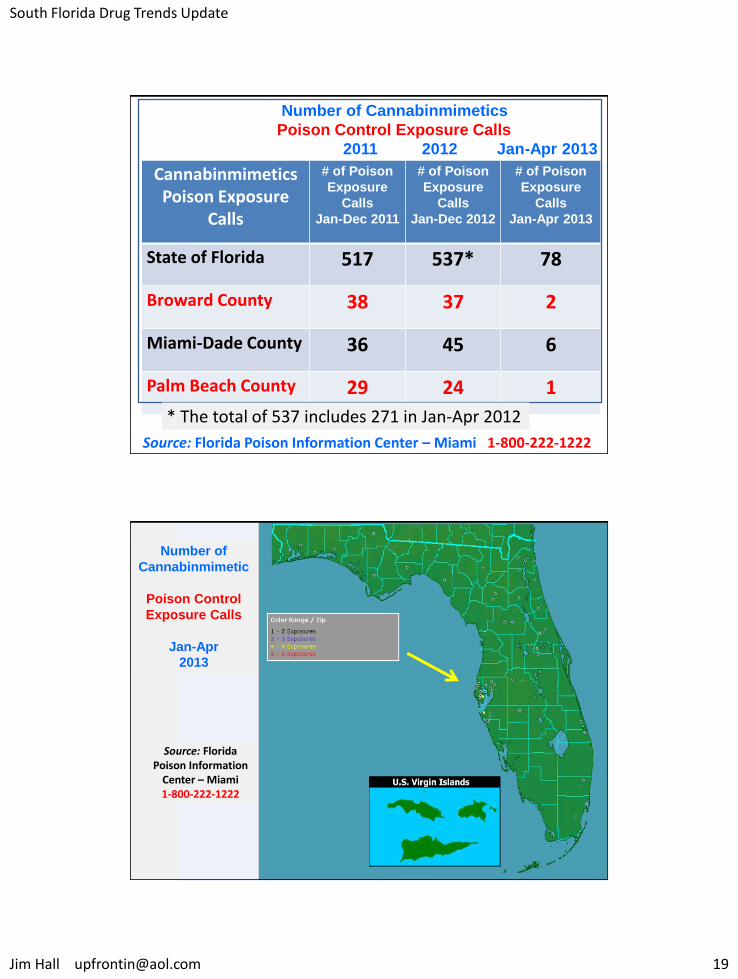
Number of Cannabinmimetics
Poison Control Exposure Calls
2011 2012 Jan-Apr 2013
Source: Florida Poison Information Center – Miami 1-800-222-1222
Cannabinmimetics Poison Exposure
Calls
# of Poison
Exposure
Calls
Jan-Dec 2011
# of Poison
Exposure
Calls
Jan-Dec 2012
# of Poison
Exposure
Calls
Jan-Apr 2013
State of Florida 517 537* 78
Broward County 38 37 2
Miami-Dade County 36 45 6
Palm Beach County 29 24 1
* The total of 537 includes 271 in Jan-Apr 2012
Number of
Cannabinmimetic
Poison Control
Exposure Calls
Jan-Apr
2013
Source: Florida Poison Information
Center – Miami 1-800-222-1222
South Florida Drug Trends Update
Jim Hall [email protected] 20
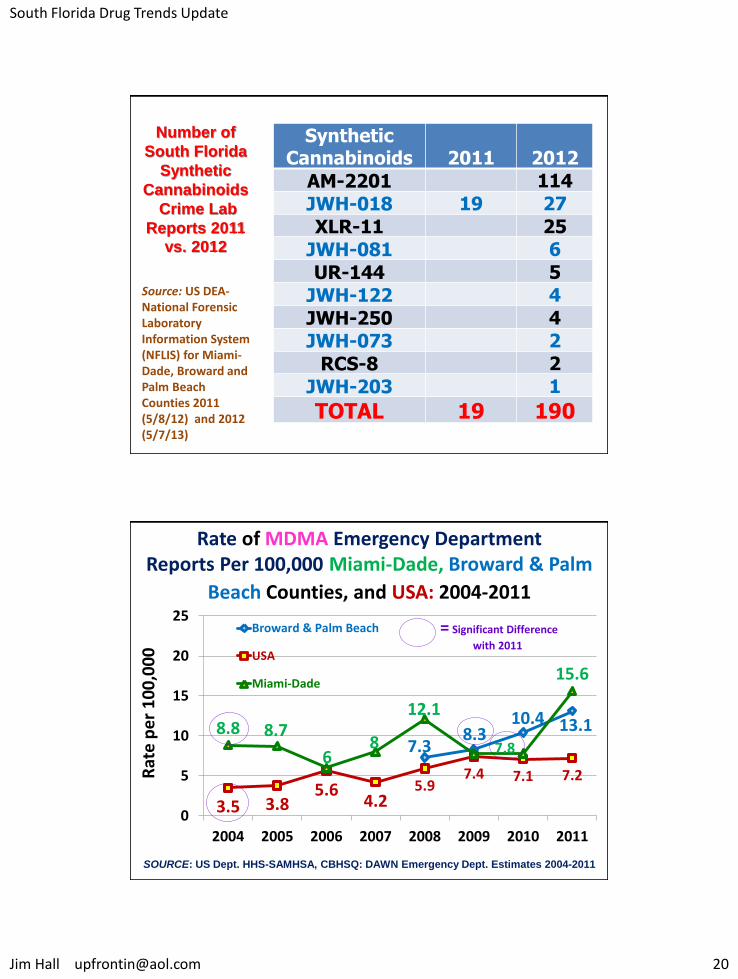
Number of
South Florida
Synthetic
Cannabinoids
Crime Lab
Reports 2011 vs. 2012
Source: US DEA-National Forensic Laboratory Information System (NFLIS) for Miami-Dade, Broward and Palm Beach Counties 2011 (5/8/12) and 2012 (5/7/13)
Synthetic Cannabinoids 2011 2012
AM-2201 114
JWH-018 19 27
XLR-11 25
JWH-081 6
UR-144 5
JWH-122 4
JWH-250 4
JWH-073 2
RCS-8 2
JWH-203 1
TOTAL 19 190
Rate of MDMA Emergency Department Reports Per 100,000 Miami-Dade, Broward & Palm
Beach Counties, and USA: 2004-2011
7.3 8.3
10.4 13.1
3.5 3.8 5.6
4.2 5.9
7.4 7.1 7.2
8.8 8.7
6 8
12.1
7.8
15.6
0
5
10
15
20
25
2004 2005 2006 2007 2008 2009 2010 2011
Broward & Palm Beach
USA
Miami-Dade
SOURCE: US Dept. HHS-SAMHSA, CBHSQ: DAWN Emergency Dept. Estimates 2004-2011
Rat
e p
er
10
0,0
00
= Significant Difference
with 2011
South Florida Drug Trends Update
Jim Hall [email protected] 21
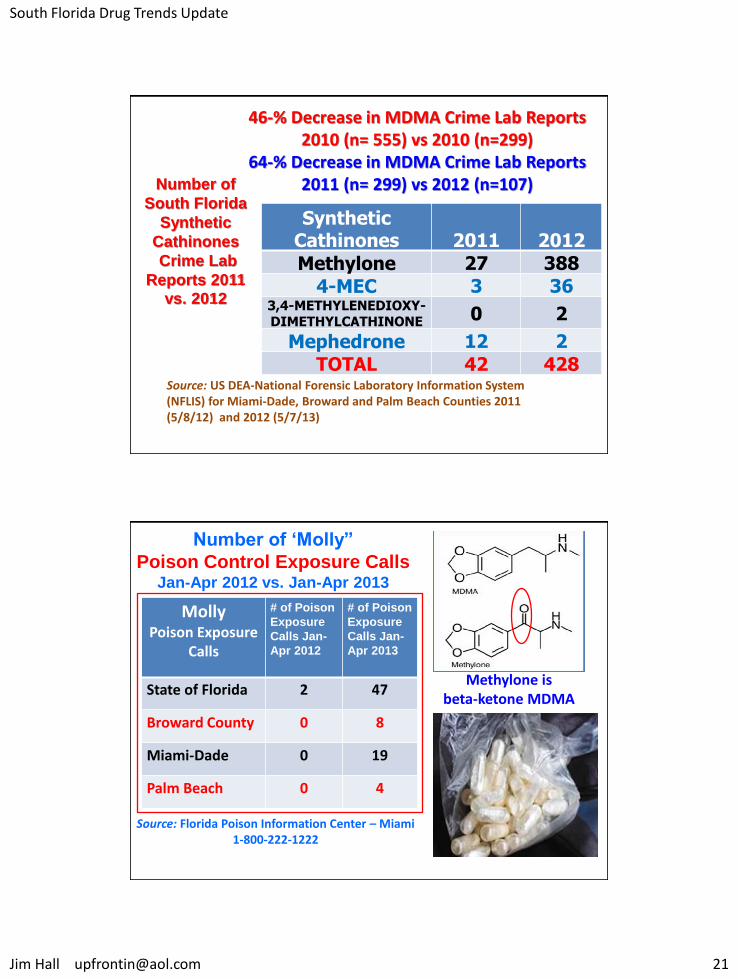
Number of
South Florida
Synthetic
Cathinones
Crime Lab
Reports 2011 vs. 2012
Source: US DEA-National Forensic Laboratory Information System (NFLIS) for Miami-Dade, Broward and Palm Beach Counties 2011 (5/8/12) and 2012 (5/7/13)
Synthetic Cathinones 2011 2012
Methylone 27 388
4-MEC 3 36 3,4-METHYLENEDIOXY-DIMETHYLCATHINONE 0 2
Mephedrone 12 2
TOTAL 42 428
46-% Decrease in MDMA Crime Lab Reports 2010 (n= 555) vs 2010 (n=299)
64-% Decrease in MDMA Crime Lab Reports 2011 (n= 299) vs 2012 (n=107)
Number of ‘Molly”
Poison Control Exposure Calls Jan-Apr 2012 vs. Jan-Apr 2013
Source: Florida Poison Information Center – Miami 1-800-222-1222
Molly Poison Exposure
Calls
# of Poison
Exposure
Calls Jan-
Apr 2012
# of Poison
Exposure
Calls Jan-
Apr 2013
State of Florida 2 47
Broward County 0 8
Miami-Dade 0 19
Palm Beach 0 4
Methylone is beta-ketone MDMA
South Florida Drug Trends Update
Jim Hall [email protected] 22
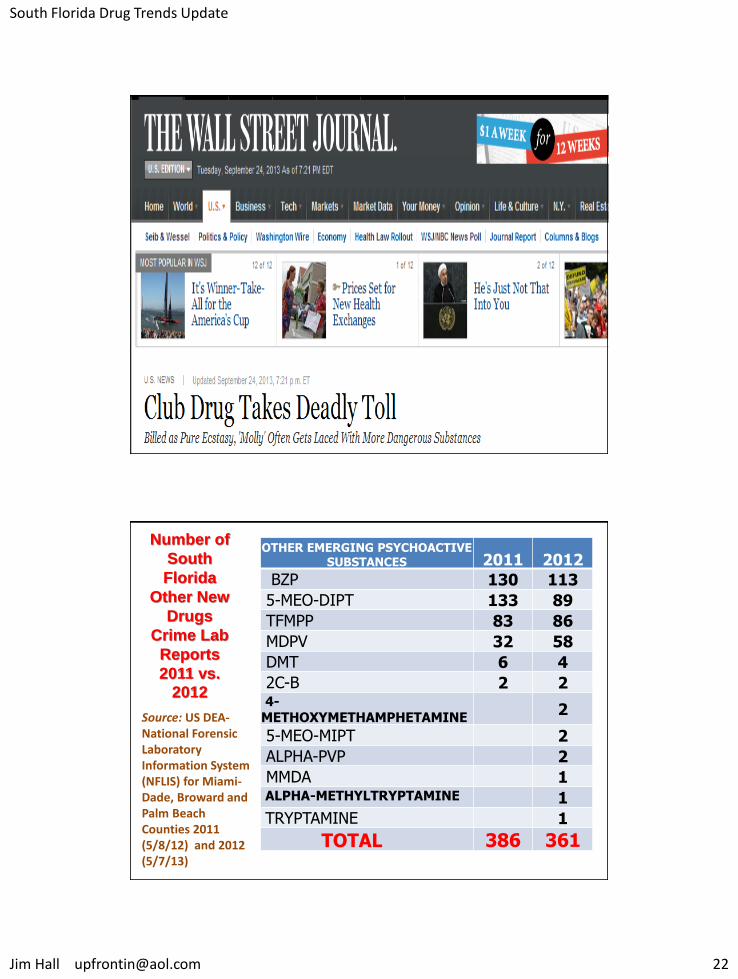
Number of
South
Florida
Other New
Drugs
Crime Lab
Reports
2011 vs. 2012
Source: US DEA-National Forensic Laboratory Information System (NFLIS) for Miami-Dade, Broward and Palm Beach Counties 2011 (5/8/12) and 2012 (5/7/13)
OTHER EMERGING PSYCHOACTIVE SUBSTANCES 2011 2012
BZP 130 113
5-MEO-DIPT 133 89
TFMPP 83 86
MDPV 32 58
DMT 6 4
2C-B 2 2 4-METHOXYMETHAMPHETAMINE
2
5-MEO-MIPT 2
ALPHA-PVP 2
MMDA 1 ALPHA-METHYLTRYPTAMINE 1 TRYPTAMINE 1
TOTAL 386 361
South Florida Drug Trends Update
Jim Hall [email protected] 23
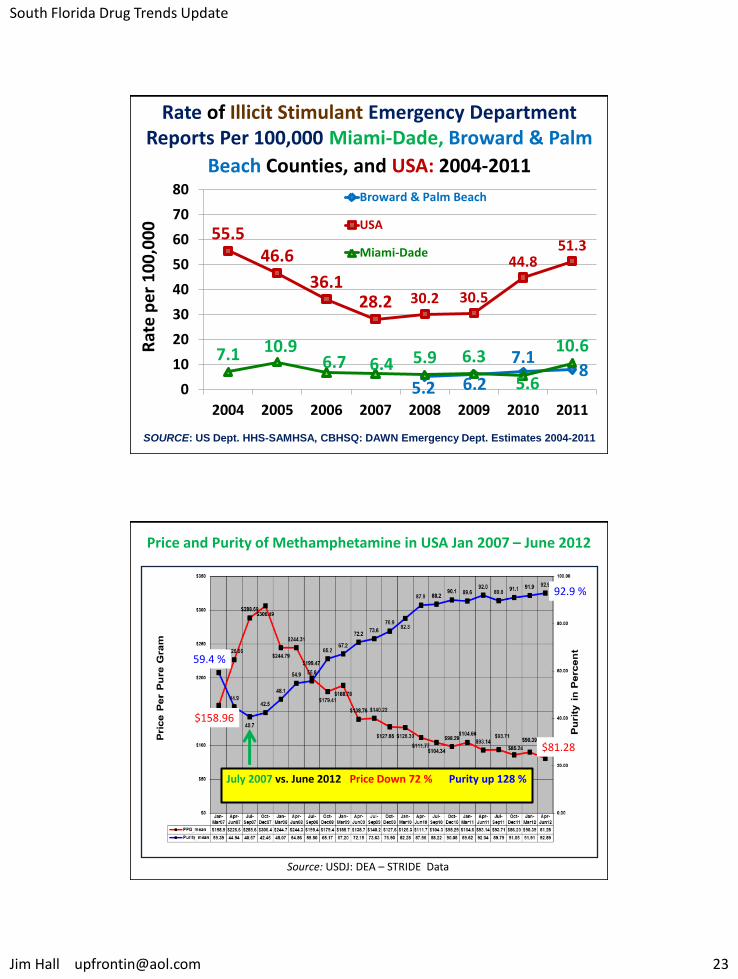
Rate of Illicit Stimulant Emergency Department Reports Per 100,000 Miami-Dade, Broward & Palm
Beach Counties, and USA: 2004-2011
5.2 6.2
7.1 8
55.5 46.6
36.1 28.2 30.2 30.5
44.8 51.3
7.1 10.9 6.7 6.4 5.9 6.3
5.6
10.6
0
10
20
30
40
50
60
70
80
2004 2005 2006 2007 2008 2009 2010 2011
Broward & Palm Beach
USA
Miami-Dade
SOURCE: US Dept. HHS-SAMHSA, CBHSQ: DAWN Emergency Dept. Estimates 2004-2011
Rat
e p
er
10
0,0
00
Price and Purity of Methamphetamine in USA Jan 2007 – June 2012
July 2007 vs. June 2012 Price Down 72 % Purity up 128 %
$158.96
$81.28
59.4 %
92.9 %
Source: USDJ: DEA – STRIDE Data
South Florida Drug Trends Update
Jim Hall [email protected] 24
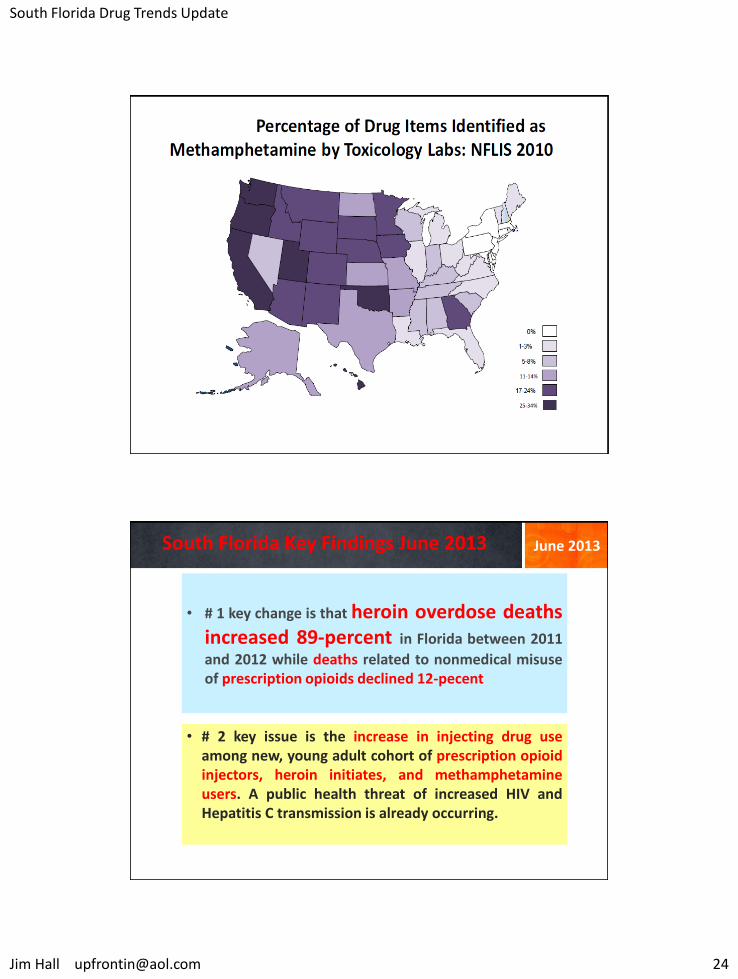
South Florida Key Findings June 2013
• # 1 key change is that heroin overdose deaths increased 89-percent in Florida between 2011
and 2012 while deaths related to nonmedical misuse of prescription opioids declined 12-pecent
June 2013
• # 2 key issue is the increase in injecting drug use among new, young adult cohort of prescription opioid injectors, heroin initiates, and methamphetamine users. A public health threat of increased HIV and Hepatitis C transmission is already occurring.
South Florida Drug Trends Update
Jim Hall [email protected] 25
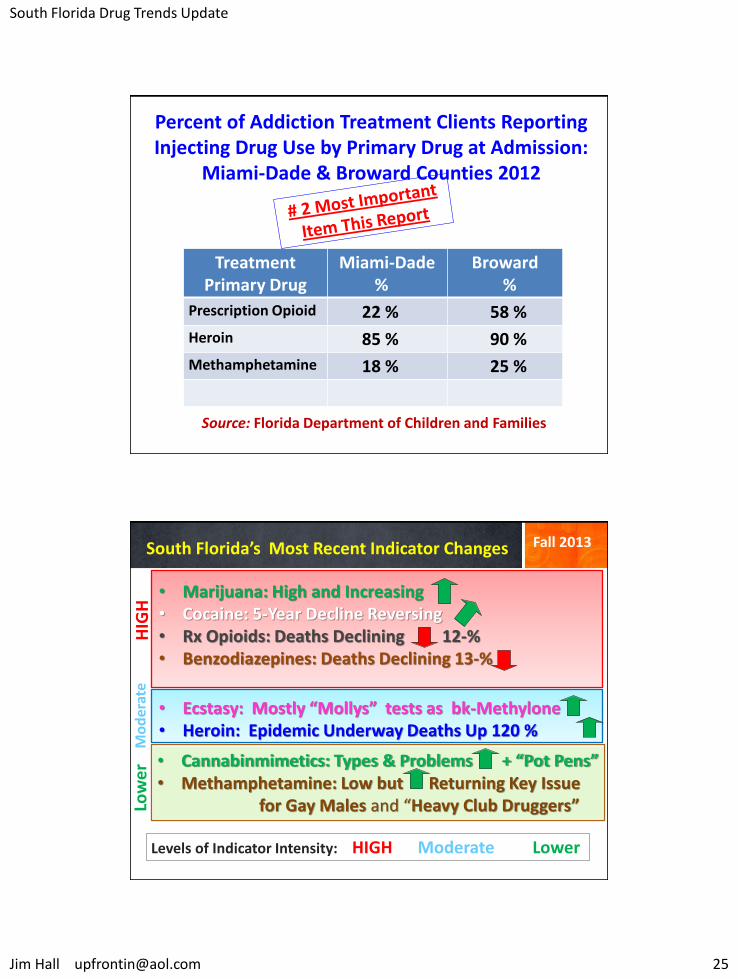
Percent of Addiction Treatment Clients Reporting Injecting Drug Use by Primary Drug at Admission:
Miami-Dade & Broward Counties 2012
Source: Florida Department of Children and Families
Treatment Primary Drug
Miami-Dade %
Broward %
Prescription Opioid 22 % 58 %
Heroin 85 % 90 %
Methamphetamine 18 % 25 %
South Florida’s Most Recent Indicator Changes
• Marijuana: High and Increasing • Cocaine: 5-Year Decline Reversing • Rx Opioids: Deaths Declining 12-% • Benzodiazepines: Deaths Declining 13-%
• Ecstasy: Mostly “Mollys” tests as bk-Methylone • Heroin: Epidemic Underway Deaths Up 120 %
• Cannabinmimetics: Types & Problems + “Pot Pens” • Methamphetamine: Low but Returning Key Issue for Gay Males and “Heavy Club Druggers”
HIG
H
Mo
der
ate
Lo
we
r
Levels of Indicator Intensity: HIGH Moderate Lower
Fall 2013
South Florida Drug Trends Update
Jim Hall [email protected] 26
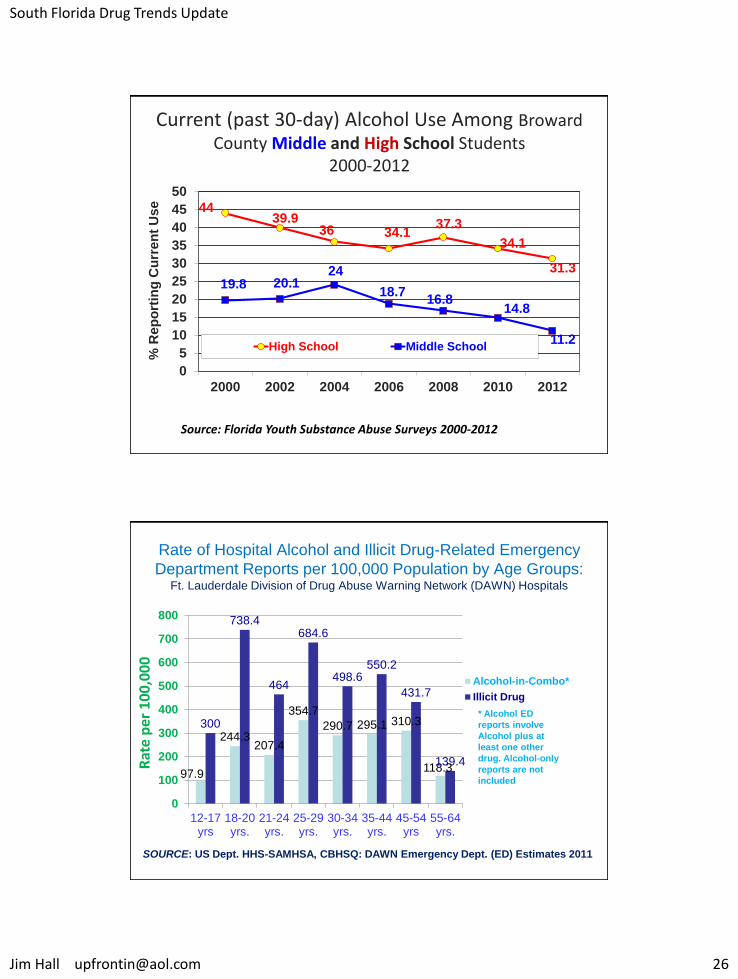
Current (past 30-day) Alcohol Use Among Broward County Middle and High School Students
2000-2012
Source: Florida Youth Substance Abuse Surveys 2000-2012
44 39.9
36 34.1 37.3
34.1
31.3
19.8 20.1 24
18.7 16.8
14.8
11.2
0
5
10
15
20
25
30
35
40
45
50
2000 2002 2004 2006 2008 2010 2012
% R
ep
ort
ing
Cu
rre
nt
Us
e
High School Middle School
Rate of Hospital Alcohol and Illicit Drug-Related Emergency
Department Reports per 100,000 Population by Age Groups: Ft. Lauderdale Division of Drug Abuse Warning Network (DAWN) Hospitals
97.9
244.3 207.4
354.7
290.7 295.1 310.3
118.3
300
738.4
464
684.6
498.6 550.2
431.7
139.4
0
100
200
300
400
500
600
700
800
12-17yrs
18-20yrs.
21-24yrs.
25-29yrs.
30-34yrs.
35-44yrs.
45-54yrs
55-64yrs.
Alcohol-in-Combo*
Illicit Drug
* Alcohol ED
reports involve
Alcohol plus at
least one other
drug. Alcohol-only
reports are not
included
Rat
e p
er 1
00
,00
0
SOURCE: US Dept. HHS-SAMHSA, CBHSQ: DAWN Emergency Dept. (ED) Estimates 2011
South Florida Drug Trends Update
Jim Hall [email protected] 28
The South Florida Report
September 2013
Community Epidemiology Drug Report
James N. Hall NIDA-CEWG Report # 57
Center for Applied Research on Substance Use and Health Disparities
Nova Southeastern University