university of study of naples federico ii
TRANSCRIPT
UNIVERSITY OF STUDY OF NAPLES
FEDERICO II
Ph.D thesis in Chemical Engineering
(XXI Cycle)
HYDROGEN AS ENERGY CARRIER:
DECENTRALIZED PRODUCTION BY AUTOTHERMAL REFORMING OF METHANE
Relatore: Candidato:
Prof. Pier Luca Maffettone Ing. Diego Scognamiglio Comitato scientifico Prof. Silvestro Criscitelli Prof. Gennaro Volpicelli Ing. Lucia Russo Ing. Marino Simeone

2
3
Index INTRODUCTION ..................................................................................................................................................................7
HYDROGEN AS ENERGY CARRIER ...............................................................................................................................7 PRODUCTION AND USES ................................................................................................................................................8 TRANSPORT AND STORAGE...........................................................................................................................................8
PRODUCTION PROCESS FROM METHANE...............................................................................................................11 STEAM REFORMING.......................................................................................................................................................11 THERMAL PARTIAL OXIDATION.................................................................................................................................15 CATALYTIC PARTIAL OXIDATION ..............................................................................................................................17 AUTOTHERMAL REFORMING ......................................................................................................................................19 PROCESS CHOISE ............................................................................................................................................................22
EXSPERIMENTAL SETUP ................................................................................................................................................23 EXPERIMENTAL SYSTEM ..............................................................................................................................................23
FEEDING SECTION ....................................................................................................................................................23 REACTOR SECTION....................................................................................................................................................26 PRETREATING AND DISPOSAL SECTION .............................................................................................................27 ANALYSIS SECTION ..................................................................................................................................................28
EXPERIMENTAL PROCEDURE .....................................................................................................................................29 REACTOR LOADING ..................................................................................................................................................29 CATALYST PRETREATMENT...................................................................................................................................29 IGNITION......................................................................................................................................................................30 EXPERIMENTAL RUNS .............................................................................................................................................30
MATHEMATICAL MODEL OF FIXED BED REACTOR UNDER STEADY-STATE CONDITIONS ..................31 INTRODUCTION .............................................................................................................................................................31 MATHEMATICAL MODEL..............................................................................................................................................32
GEOMETRY ..................................................................................................................................................................32 MATHEMATICAL MODEL: MASS AND ENERGY BALANCE.............................................................................33 ESTABLISHMENT OF BOUNDARY CONDITIONS .................................................................................................35
ANALYSIS OF THE HYPOTHESES OF THE MODEL ..................................................................................................36 STATE OF GASES.......................................................................................................................................................37 ANALYSIS OF THE PRESSURE DROP..................................................................................................................37 KINETICS IN HOMOGENEOUS PHASE .............................................................................................................38 HETEROGENEITY ...................................................................................................................................................39 MASS AND HEAT DISPERSION IN GAS PHASE ................................................................................................41 DETERMINATION OF THE EXTERNAL HEAT TRANSFER COEFFICIENT ...........................................45 PHYSICAL AND TRANSPORT PROPERTIES......................................................................................................47
NUMERICAL METHOD...................................................................................................................................................47 DISCRETIZATION OF THE SYSTEM ........................................................................................................................48
RESULTS ON NICKEL BASIS CATALYST......................................................................................................................50 THERMODYNAMIC ANALYSIS .....................................................................................................................................50 KINETIC MODEL.............................................................................................................................................................53
MECHANISM AND KINETIC SCHEME....................................................................................................................53 EQUATIONS OF KINETIC SCHEME .........................................................................................................................55 KINETIC EVOLUTION OF THE PROCESSES ..........................................................................................................55 EXPRESSION AND KINETIC PARAMETERS..........................................................................................................57
KINETIC DELAY: THEORETICAL AND EXPERIMENTAL ANALYSIS ....................................................................60 EXPERIMENTAL RUNS AND COMPARISON WITH THE SIMULATED DATA........................................................64
4
RUNS VARYING THE FLOW RATE .........................................................................................................................65 RUNS VARYING THE FEED COMPOSITION ..........................................................................................................69
OBSERVATIONS ON MATHEMATICAL MODEL ........................................................................................................74 TRANSPORT PHENOMENA ANALYSIS..................................................................................................................75 IMPORTANCE OF IR ANALYSIS: HETEROGENEITY ...........................................................................................79 EFFECT OF PRESSURE ..............................................................................................................................................82 EFFECT OF PREHEATING TEMPERATURE ..........................................................................................................84 LIMITS OF MATHEMATICAL MODEL.....................................................................................................................85
CONCLUSIONS ON NICKEL CATALYST......................................................................................................................86 RESULTS ON RHODIUM CATALYST ............................................................................................................................88
KINETIC MECHANISM: DIRECT OR INDIRCT? ..........................................................................................................89 ASSUMPTION: INDIRECT KINETIC MECHANISM.................................................................................................91 EQUATIONS AND PARAMETERS OF KINETIC REACTIONS ..............................................................................91 KINETIC EVOLUTION OF CHEMICAL PROCESSES..............................................................................................94
MATHEMATICAL MODEL AND KINETIC HYPOTHESIS VALIDATION ................................................................95 EXPERIMENTAL RUNS AND COMPARISON WITH SIMULATED DATA ................................................................98
RUNS AT DIFFERENT VALUE OF AIR TO CARBON FEEDING RATIO ............................................................98 AUTOTHERMAL REFORMING RUNS....................................................................................................................101
THEORETICAL EFFECT OF OPERATIVE FEED CONDITIONS ON KINETIC MECHANISM ............................105 RUN1: CPO WITH A HIGH PREHEATING TEMPERATURE AND A LOW FEED RATIO Air to Methane .........107 RUN 2,3: ATR WITH HIGH PREHEATING TEMPERATURE AND LOW FEED RATIO Air to Methane............109
CONCLUSIONS ON RHODIUM CATALYST ...............................................................................................................112 COMPARISON BETWEEN NICKEL AND RHODIUM CATALYST UNDER CPO AND ATR PROCESSES OF METHANE..........................................................................................................................................................................113
DISTRIBUITION OF KINETIC ZONE .........................................................................................................................113 THERMAL PROFILES: HOT SPOT AND MAXIMUM TEMPERATURES ..................................................................117 PERFORMANCE: CONVERSION AND YIELD ...........................................................................................................121 CONCLUSION ON COMPARISON BETWEEN NICKEL AND RHODIUM CATALYST .........................................124
DEVELOPMENT ...............................................................................................................................................................126 EFFECT OF CATALYST TYPE: NUMERICAL INVESTIGATION..............................................................................126 NON CONVENTIONAL REACTORS ...........................................................................................................................128
MEMBRANE REACTORS..........................................................................................................................................128 CATALYTIC WALLS REACTORS ............................................................................................................................130 FORCED REACTORS.................................................................................................................................................132
NOMENCLATURE............................................................................................................................................................139 SYMBOLS.........................................................................................................................................................................139 GREEK SYMBOLS ..........................................................................................................................................................139 SUBSCRIPT ......................................................................................................................................................................139
REFERENCES....................................................................................................................................................................140 FIGURES INDEX ...............................................................................................................................................................145

5

6
7
INTRODUCTION
HYDROGEN AS ENERGY CARRIER Hydrogen is considered the most abundant element in the universe, though it is not available as pure component (hydrogen reserves do not exist). Hydrogen was discovered in 1766 by Cavendish, who named it “inflammable air", then Lavoisier named it “hydrogen” (from greek “hydro”, meaning water and “genes”, meaning creator). Hydrogen has been employed as fuel for domestic use for more than a century: the so-called “city gas”, in fact, consists mainly in hydrogen and carbon monoxide (about 50%). The diffusion of this gas has been limited for the toxicity of carbon monoxide and the increased use of methane as fuel. As electricity, hydrogen can be seen as an energy vector, that doesn’t contain carbon and gives zero emissions in the operation point; moreover, differently from electricity, hydrogen can be stored, having in this way a potential for its employment in internal combustion heat engines and in fuel cell, for electricity generation through electrochemical reaction between a fuel and an oxidant. In particular, PEM fuel cells fed with hydrogen are the most promising device for decentralized energy production, both in stationary and automotive field, thanks to high compactness, low weight (high power-to weight ratio), high modularity, good efficiency and fast start-up and response to load changes. The scientists define hydrogen as “the fuel for excellence”, in fact it is the cleaner method to store, transport and utilize energy; to this aim it can be reminded that the hydrogen combustion produce only steam and energy:
H2 + ½ O2 = H2O + energy Hydrogen, though, is not a primary source, but it is substantially an energy carrier, that can be stored, transported and used as gaseous fuel, but must be produced from other sources. Hydrogen is an ideal complement to the electricity; both hydrogen and electricity are premium quality energy carriers, do not contain carbon and generate little or no polluting emissions at the point of use. The electricity, however, presents some disadvantages concerning the storage, whereas hydrogen is more satisfactory and its versatility is demonstrated by the possibility of obtaining it from a variety of primary sources that can be fossil or not. So, a hydrogen supply infrastructure could be developed, according to available reserves, in every region. This could provide concrete benefits to energy supply and could ease the transition towards a sustainable energy system.
8
PRODUCTION AND USES The main hydrogen source is actually represented by hydrocarbons, although there is an increasing interest in hydrogen production from renewable sources, due to the depletion of fossil fuels and to the possibility of introducing Third World States in hydrogen economy. However, in the middle term vision, the presence of a valid infrastructures for fossil fuels transportation makes this kind of source the best candidate for hydrogen generation through classical Steam Reforming or Partial Oxidation process. Current world hydrogen production is approximately 45 million tons/year, and 90% of the produced hydrogen is generated from fossil fuels (oil, carbon and natural gas). Hydrogen is mostly employed in the field of nitrogen fertilizers and in the petrochemical processes. World hydrogen consumption is due to 50% for ammonia production, 37% for oil refinery, 8% for methanol production, 4% for general uses and 1% for aerospace activities. Unfortunately, hydrogen production from renewable sources is not economically competitive with production from fossil fuels in the near future, but hydrogen production in controlled conditions (for example by coupling the hydrogen production process with CO2 sequestration) could allow a reduction of pollutants emissions, especially in the highly urbanized zone, characterized by intense truck traffic. This effect could contribute to respect emission limits imposed by Kyoto protocol and, obviously, to make the air more breathable in urbanized centres. However, since hydrogen is an energy carrier and not an “alternative fuel source”, an hydrogen-based economy needs the determination of the optimal hydrogen utilization (from economical and technical point of view) in order to solve problems related both to its production and to global environmental impacts.
TRANSPORT AND STORAGE After the production, hydrogen has to be transported or stored properly. This operation represents one of the main problems that need to be solved for the transition to a hydrogen economy. In fact, even if it is true that hydrogen is the substance that allows the best ratio between stored energy and weight from gravimetric point of view (about 2.5 time higher than methane), it is necessary to consider that it has a lower energy density (about 3.2 time lower than methane), a high volatility and a dew point of -250°C. Moreover, the safety issue due to hydrogen extreme reactivity and explosivity are not negligible. The US Department of Energy (DOE) established that hydrogen will be considered an acceptable fuel when the following target will be fulfilled:
Energy density of 6.5% wt. of total drum weight in hydrogen; Volumetric density of 62 Kg/m3.
9
These targets are based on hydrogen fuel cell vehicles with autonomy of 560 Km. Actually, there are three fundamental options for hydrogen storage:
Compressed gas in pressurized cylinders; Liquid in vessel at low temperature and pressure; In solid solution with other compounds, generally as simple or composite metal
hydrides. Hydrogen is commonly stored in high pressure cylinders (200-350 bar). The heavy industrial cylinders can be usefully replaced with dual walls ones made of aluminium. Research is also focusing on cylinders made of carbon fibres, that allow pressures of about 700 bar. The disadvantage of this system is that hydrogen forms hydrides with metal, resulting from the internal wall of the cylinder, weakening its structure. For the liquid storage, it should be considered that it is not necessary that tanks both undergo high pressure and have a high weight (generally the thermal insulation don’t require materials with an high specific weight), so it can be easily reach a weight ratio that satisfy the DOE target (6.5%), as long as the system is adequately insulated in double wall tanks provided by cavity wall insulation; moreover, the low chemical reactivity of hydrogen at low temperature eliminates the problem of metal fragility. This technology has been widely developed for aerospace missions (NASA, ESA) and hydrogen, in liquid phase, has been considered very interesting for high distance transport, like planes and rockets. It is necessary to take into account the cost related to hydrogen condensation (the energetic costs are about 30-40% of the liquid intrinsic energy), to thermal insulation and the safety issue. Another transportation method is based on the capability of hydrogen to form hydrides; the reaction often occurs spontaneously also at room temperature and proceeds to right or left, depending on the gaseous hydrogen pressure. The advantages in the use of hydrides are the greater safety and the higher density reached; the disadvantage is represented by the high temperatures (150-300°C) required for hydrogen extraction from metal hydrides and, obviously, by the related cost. In the future, the research work will focus on the production of tanks made of composite materials for compressed hydrogen and complex metal hydrides, whereas new techniques under experimentation are hydrogen adsorption in carbon nanostructures and encapsulation in glass microstructures. In order to use hydrogen as energy carrier, hydrogen has to be easily transportable in safety conditions minimizing gas losses. A possible transport system is represented by pipelines equivalent to methane pipeline, but with an improvement in piping materials. A possible alternative could be the building of decentralized hydrogen production plants, starting from methane, thus leaving unchanged the methane pipeline.
10
The aim of this PhD thesis will be the mathematical modeling of an autothermal reactor for hydrogen production from methane, followed by an experimental campaign. Commercial pellets catalysts will be employed, in particular Ni-based and Rh-based catalyst, and the reactor will be designed in order to be highly compact, since the system is substantially thought for automotive and/or residential purposes. The attention will be focused on thermal profile developed along the catalytic bed, so that catalyst thermal stress can be evaluated; indeed, the main problem that inhibits the development of autothermal catalytic processes is the thermal deactivation due to high temperatures reached. Catalyst thermal profile will be experimentally evaluated by means of IR technology, in order to have a reliable validation of the mathematical model developed for the reactor; then, simulations will be carried out on the reactor behaviour in situations prohibitive from an experimental point of view. The results will also be used for a comparison between the two commercial catalysts selected. In the following chapters the hydrogen production processes from methane will be introduced, starting from the already known industrial technologies for large scale hydrogen production, highlighting limits for their development in decentralized hydrogen production. The experimental apparatus and procedures used in the laboratory will be also shown. The experimental and numerical results obtained on the two catalytic systems and their comparison will be illustrated, and finally a small section on possible future developments will be presented, together with an overview of literature on non-conventional reactors that can be possibly employed for hydrogen production.
11
PRODUCTION PROCESS FROM METHANE
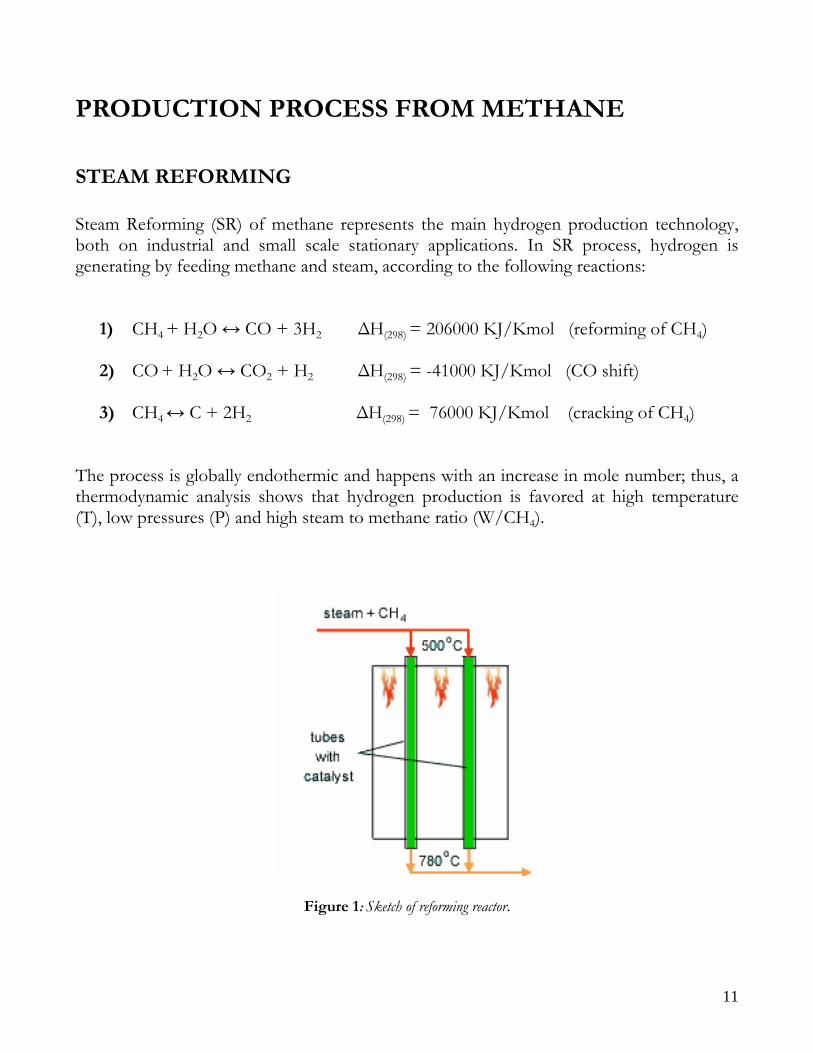
STEAM REFORMING Steam Reforming (SR) of methane represents the main hydrogen production technology, both on industrial and small scale stationary applications. In SR process, hydrogen is generating by feeding methane and steam, according to the following reactions:
1) CH4 + H2O ↔ CO + 3H2 ΔH(298) = 206000 KJ/Kmol (reforming of CH4)
2) CO + H2O ↔ CO2 + H2 ΔH(298) = -41000 KJ/Kmol (CO shift)
3) CH4 ↔ C + 2H2 ΔH(298) = 76000 KJ/Kmol (cracking of CH4) The process is globally endothermic and happens with an increase in mole number; thus, a thermodynamic analysis shows that hydrogen production is favored at high temperature (T), low pressures (P) and high steam to methane ratio (W/CH4).
Figure 1: Sketch of reforming reactor.
12
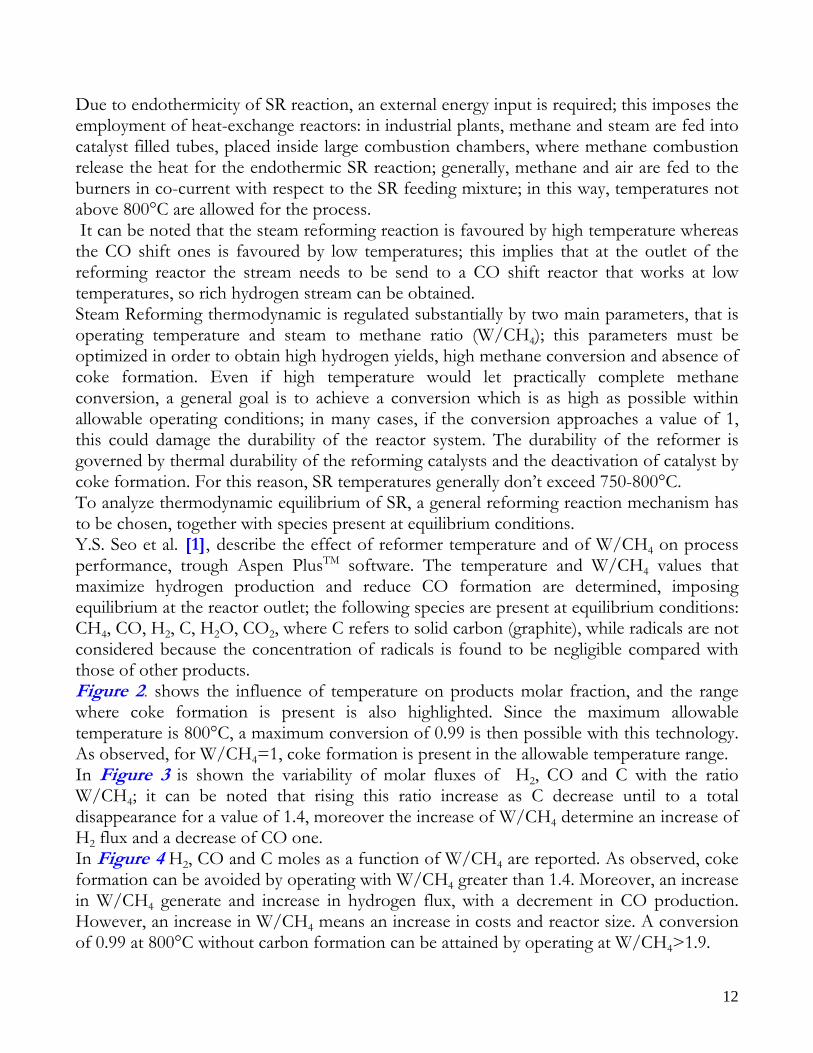
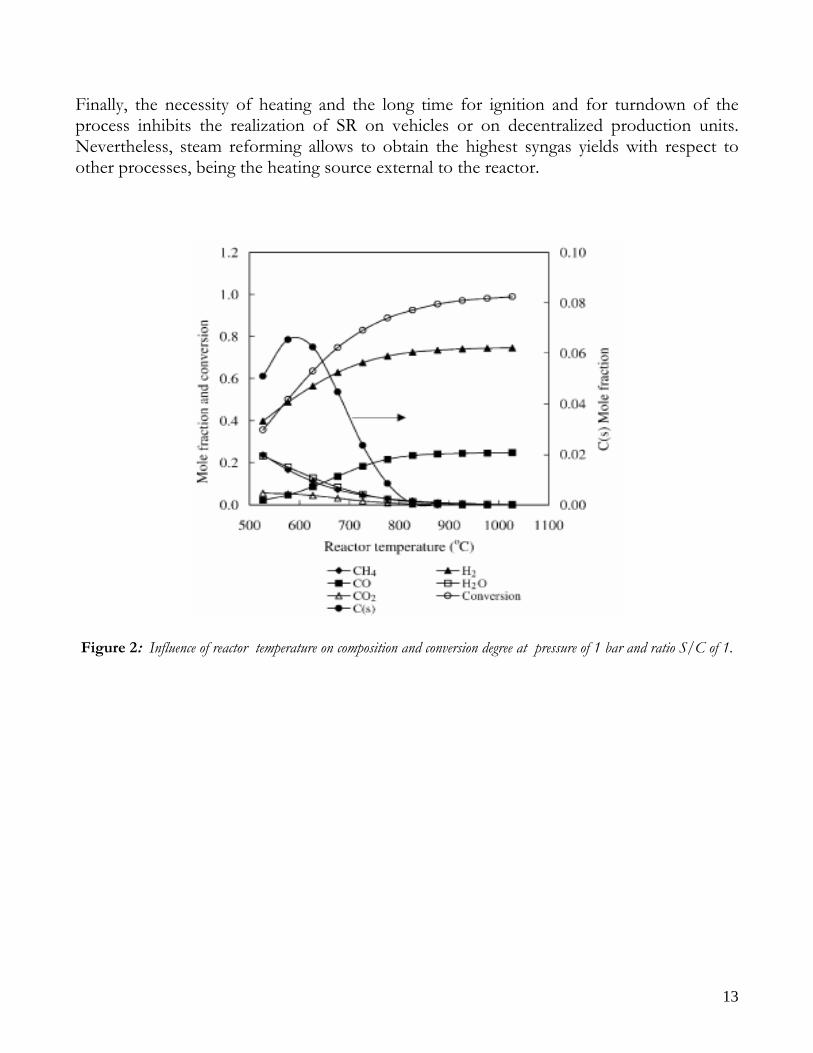
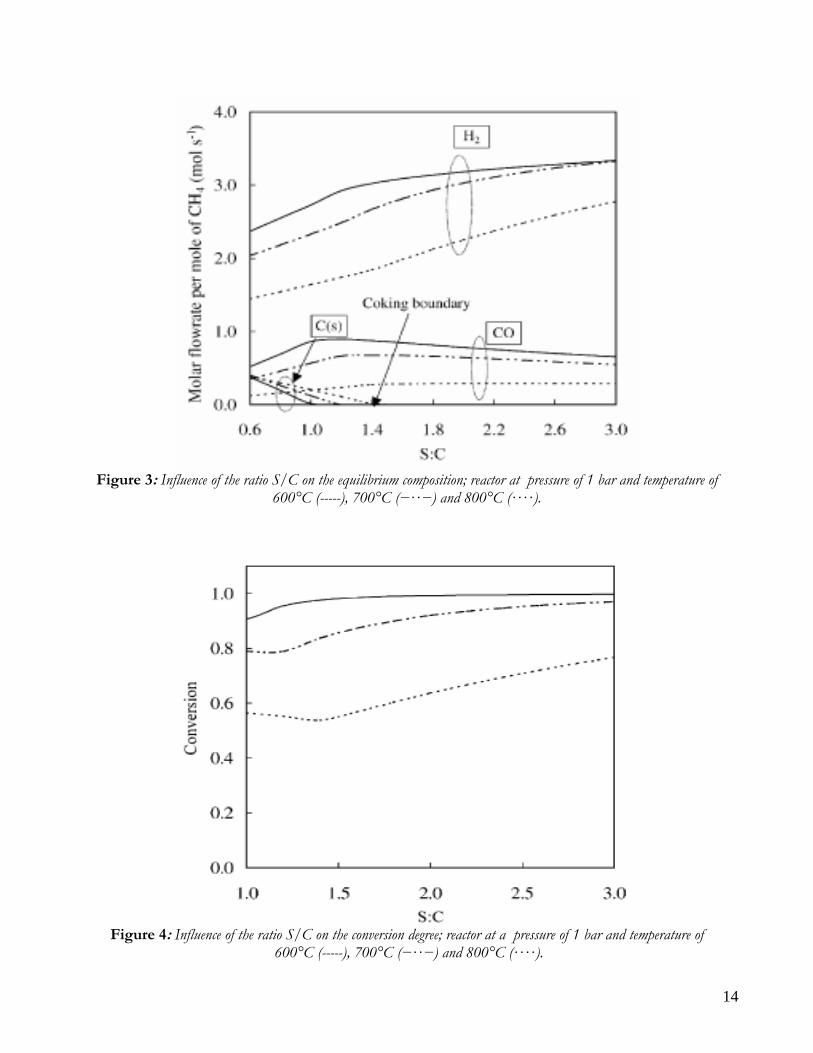
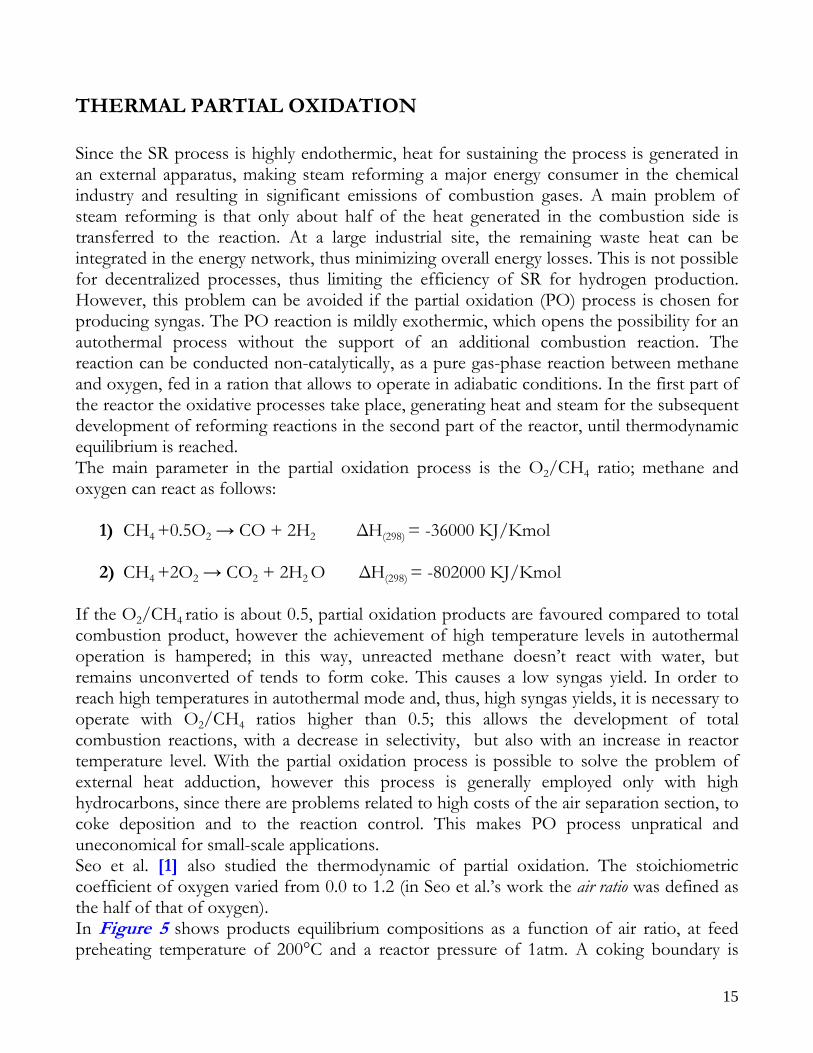
Due to endothermicity of SR reaction, an external energy input is required; this imposes the employment of heat-exchange reactors: in industrial plants, methane and steam are fed into catalyst filled tubes, placed inside large combustion chambers, where methane combustion release the heat for the endothermic SR reaction; generally, methane and air are fed to the burners in co-current with respect to the SR feeding mixture; in this way, temperatures not above 800°C are allowed for the process. It can be noted that the steam reforming reaction is favoured by high temperature whereas the CO shift ones is favoured by low temperatures; this implies that at the outlet of the reforming reactor the stream needs to be send to a CO shift reactor that works at low temperatures, so rich hydrogen stream can be obtained. Steam Reforming thermodynamic is regulated substantially by two main parameters, that is operating temperature and steam to methane ratio (W/CH4); this parameters must be optimized in order to obtain high hydrogen yields, high methane conversion and absence of coke formation. Even if high temperature would let practically complete methane conversion, a general goal is to achieve a conversion which is as high as possible within allowable operating conditions; in many cases, if the conversion approaches a value of 1, this could damage the durability of the reactor system. The durability of the reformer is governed by thermal durability of the reforming catalysts and the deactivation of catalyst by coke formation. For this reason, SR temperatures generally don’t exceed 750-800°C. To analyze thermodynamic equilibrium of SR, a general reforming reaction mechanism has to be chosen, together with species present at equilibrium conditions. Y.S. Seo et al. [1], describe the effect of reformer temperature and of W/CH4 on process performance, trough Aspen PlusTM software. The temperature and W/CH4 values that maximize hydrogen production and reduce CO formation are determined, imposing equilibrium at the reactor outlet; the following species are present at equilibrium conditions: CH4, CO, H2, C, H2O, CO2, where C refers to solid carbon (graphite), while radicals are not considered because the concentration of radicals is found to be negligible compared with those of other products. Figure 2. shows the influence of temperature on products molar fraction, and the range where coke formation is present is also highlighted. Since the maximum allowable temperature is 800°C, a maximum conversion of 0.99 is then possible with this technology. As observed, for W/CH4=1, coke formation is present in the allowable temperature range. In Figure 3 is shown the variability of molar fluxes of H2, CO and C with the ratio W/CH4; it can be noted that rising this ratio increase as C decrease until to a total disappearance for a value of 1.4, moreover the increase of W/CH4 determine an increase of H2 flux and a decrease of CO one. In 2Figure 4 H2, CO and C moles as a function of W/CH4 are reported. As observed, coke formation can be avoided by operating with W/CH4 greater than 1.4. Moreover, an increase in W/CH4 generate and increase in hydrogen flux, with a decrement in CO production. However, an increase in W/CH4 means an increase in costs and reactor size. A conversion of 0.99 at 800°C without carbon formation can be attained by operating at W/CH4>1.9.
13
Finally, the necessity of heating and the long time for ignition and for turndown of the process inhibits the realization of SR on vehicles or on decentralized production units. Nevertheless, steam reforming allows to obtain the highest syngas yields with respect to other processes, being the heating source external to the reactor.
Figure 2: Influence of reactor temperature on composition and conversion degree at pressure of 1 bar and ratio S/C of 1.
14
Figure 3: Influence of the ratio S/C on the equilibrium composition; reactor at pressure of 1 bar and temperature of
600°C (-----), 700°C (−··−) and 800°C (····).
Figure 4: Influence of the ratio S/C on the conversion degree; reactor at a pressure of 1 bar and temperature of
600°C (-----), 700°C (−··−) and 800°C (····).
15
THERMAL PARTIAL OXIDATION Since the SR process is highly endothermic, heat for sustaining the process is generated in an external apparatus, making steam reforming a major energy consumer in the chemical industry and resulting in significant emissions of combustion gases. A main problem of steam reforming is that only about half of the heat generated in the combustion side is transferred to the reaction. At a large industrial site, the remaining waste heat can be integrated in the energy network, thus minimizing overall energy losses. This is not possible for decentralized processes, thus limiting the efficiency of SR for hydrogen production. However, this problem can be avoided if the partial oxidation (PO) process is chosen for producing syngas. The PO reaction is mildly exothermic, which opens the possibility for an autothermal process without the support of an additional combustion reaction. The reaction can be conducted non-catalytically, as a pure gas-phase reaction between methane and oxygen, fed in a ration that allows to operate in adiabatic conditions. In the first part of the reactor the oxidative processes take place, generating heat and steam for the subsequent development of reforming reactions in the second part of the reactor, until thermodynamic equilibrium is reached. The main parameter in the partial oxidation process is the O2/CH4 ratio; methane and oxygen can react as follows:
1) CH4 +0.5O2 → CO + 2H2 ΔH(298) = -36000 KJ/Kmol
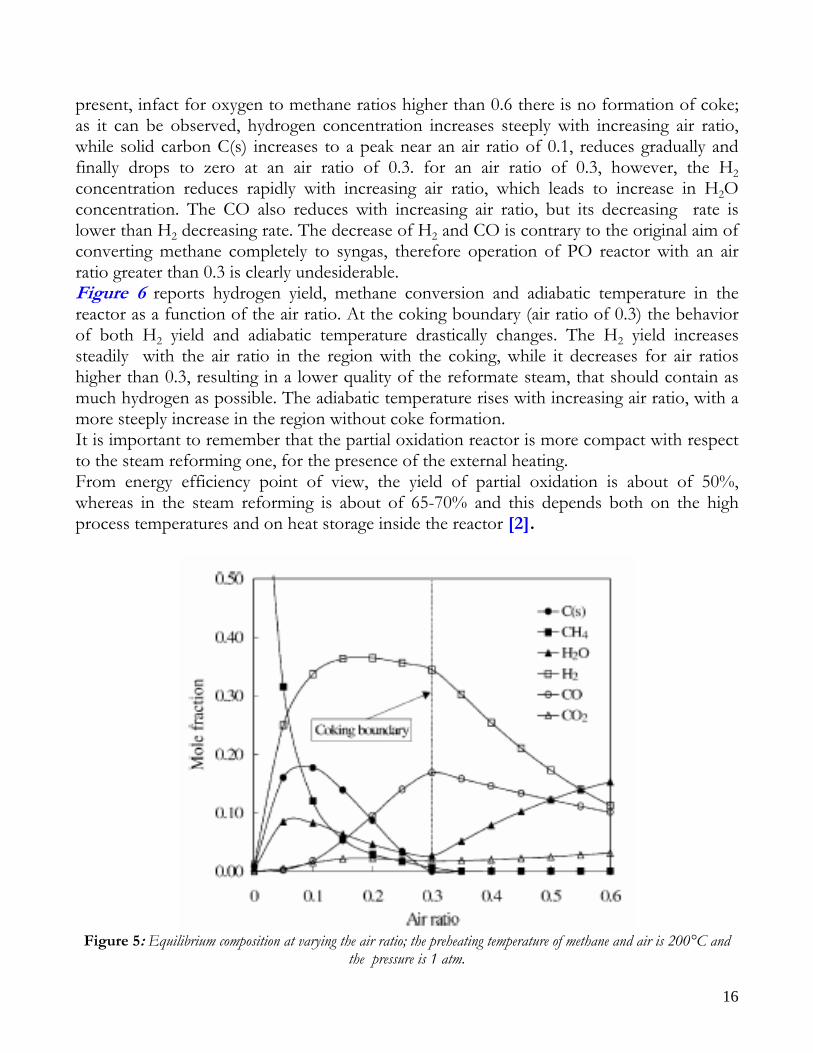
2) CH4 +2O2 → CO2 + 2H2 O ΔH(298) = -802000 KJ/Kmol If the O2/CH4 ratio is about 0.5, partial oxidation products are favoured compared to total combustion product, however the achievement of high temperature levels in autothermal operation is hampered; in this way, unreacted methane doesn’t react with water, but remains unconverted of tends to form coke. This causes a low syngas yield. In order to reach high temperatures in autothermal mode and, thus, high syngas yields, it is necessary to operate with O2/CH4 ratios higher than 0.5; this allows the development of total combustion reactions, with a decrease in selectivity, but also with an increase in reactor temperature level. With the partial oxidation process is possible to solve the problem of external heat adduction, however this process is generally employed only with high hydrocarbons, since there are problems related to high costs of the air separation section, to coke deposition and to the reaction control. This makes PO process unpratical and uneconomical for small-scale applications. Seo et al. [1] also studied the thermodynamic of partial oxidation. The stoichiometric coefficient of oxygen varied from 0.0 to 1.2 (in Seo et al.’s work the air ratio was defined as the half of that of oxygen). In Figure 5 shows products equilibrium compositions as a function of air ratio, at feed preheating temperature of 200°C and a reactor pressure of 1atm. A coking boundary is
16
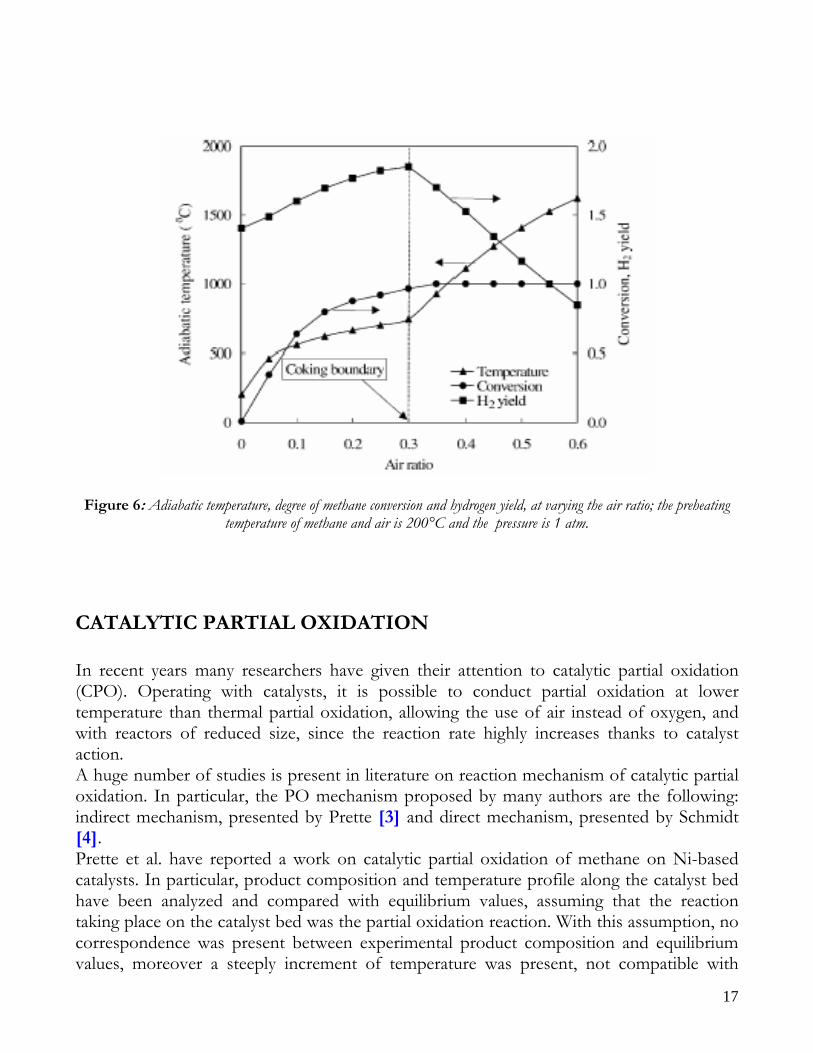
present, infact for oxygen to methane ratios higher than 0.6 there is no formation of coke; as it can be observed, hydrogen concentration increases steeply with increasing air ratio, while solid carbon C(s) increases to a peak near an air ratio of 0.1, reduces gradually and finally drops to zero at an air ratio of 0.3. for an air ratio of 0.3, however, the H2 concentration reduces rapidly with increasing air ratio, which leads to increase in H2O concentration. The CO also reduces with increasing air ratio, but its decreasing rate is lower than H2 decreasing rate. The decrease of H2 and CO is contrary to the original aim of converting methane completely to syngas, therefore operation of PO reactor with an air ratio greater than 0.3 is clearly undesiderable. Figure 6 reports hydrogen yield, methane conversion and adiabatic temperature in the reactor as a function of the air ratio. At the coking boundary (air ratio of 0.3) the behavior of both H2 yield and adiabatic temperature drastically changes. The H2 yield increases steadily with the air ratio in the region with the coking, while it decreases for air ratios higher than 0.3, resulting in a lower quality of the reformate steam, that should contain as much hydrogen as possible. The adiabatic temperature rises with increasing air ratio, with a more steeply increase in the region without coke formation. It is important to remember that the partial oxidation reactor is more compact with respect to the steam reforming one, for the presence of the external heating. From energy efficiency point of view, the yield of partial oxidation is about of 50%, whereas in the steam reforming is about of 65-70% and this depends both on the high process temperatures and on heat storage inside the reactor [2].
Figure 5: Equilibrium composition at varying the air ratio; the preheating temperature of methane and air is 200°C and
the pressure is 1 atm.
17
Figure 6: Adiabatic temperature, degree of methane conversion and hydrogen yield, at varying the air ratio; the preheating temperature of methane and air is 200°C and the pressure is 1 atm.
CATALYTIC PARTIAL OXIDATION In recent years many researchers have given their attention to catalytic partial oxidation (CPO). Operating with catalysts, it is possible to conduct partial oxidation at lower temperature than thermal partial oxidation, allowing the use of air instead of oxygen, and with reactors of reduced size, since the reaction rate highly increases thanks to catalyst action. A huge number of studies is present in literature on reaction mechanism of catalytic partial oxidation. In particular, the PO mechanism proposed by many authors are the following: indirect mechanism, presented by Prette [3] and direct mechanism, presented by Schmidt [4]. Prette et al. have reported a work on catalytic partial oxidation of methane on Ni-based catalysts. In particular, product composition and temperature profile along the catalyst bed have been analyzed and compared with equilibrium values, assuming that the reaction taking place on the catalyst bed was the partial oxidation reaction. With this assumption, no correspondence was present between experimental product composition and equilibrium values, moreover a steeply increment of temperature was present, not compatible with
18
exothermicity of the PO reaction, followed by a temperature decrease, strong soon after the maximum and then more gradual, due to the development of endothermic reactions inside the reactor. These results are explained by the indirect mechanism; according to it, primary products are represented by CO2 and H2O, generated by total combustion of a fraction of fed methane with the oxygen present in the feed, while secondary products are CO and H2, given by reforming reactions of unreacted methane with CO2 e l’H2O former produced. Schmidt et al., in 1993, presented a work on direct oxidation of methane to CO and H2 at high temperatures on alumina monoliths coated with platinum and rhodium; the mechanism proposed by Schmidt foresees direct partial oxidation of methane to CO and H2 through methane pirolisis, followed by carbon oxidation to CO. Many researchers believe that the reaction mechanism depends on the catalyst employed; in particular, both on active metal and on support nature, together with operating conditions. Yan et al, on 2004 [5] studied the reaction mechanism of partial oxidation of methane on two catalyst that have the same support but different active principles: Rh/SiO2 and Ru/SiO2. They showed that the partial oxidation on Ru/SiO2 took place according to mechanism proposed by Prette, whereas on Rh/SiO2 according to mechanism proposed by Schmidt. The authors justified these results on the basis of the different bond strength of M – O. The strong bond Ru – O prevents the reduction of metal during the partial oxidation process, favouring the formation of the products derived from the total combustion. The bond Rh – O instead is very weaker and it facilitates the reduction of Rh promoting the dissociation of methane and the successive formation of products from partial oxidation. The authors of this work studied also the reaction mechanism of partial oxidation on two catalysts characterized by two different supports but having the same active principle: Rh/SiO2 and Rh/Al2O3. They showed that the partial oxidation on Rh/Al2O3 took place toward an indirect mechanism whereas on Rh/SiO2 toward a direct mechanism. The authors justified this result on the basis of the different interaction between active principle and support: a strong interaction inhibits metal reduction, thus favouring total partial oxidation products. Veser et al [6] instead, sustain that the partial oxidation mechanism is always the direct one, not depending on catalyst employed. According to them, the reason for the different behaviors related to different types of catalyst is not based on a sequential reaction mechanism, but rather on the adsorption characteristics of the main reactants CH4 and O2. Since the sticking coefficient of O2 is considerably higher than the hydrocarbon one, O2 is preferentially adsorbed on catalyst surface. This leads to an “over-oxidized” surface state before ignition of the reaction, with the catalyst surface is predominantly oxygen covered. Upon ignition, this ad layer is reacted off. During this process, the CH4/O2 ratio on the surface is initially very low, therefore leading to total combustion of hydrocarbon; after this ignition pulse, however, a rather high carbon coverage builds up on the surface and the reaction proceeds very selectively towards the partial oxidation products.
19
However, the development of catalytic partial oxidation in the industrial technology field is actually inhibited by the presence of peak temperatures (hot spot) along the catalyst bed, that shorten catalyst life.
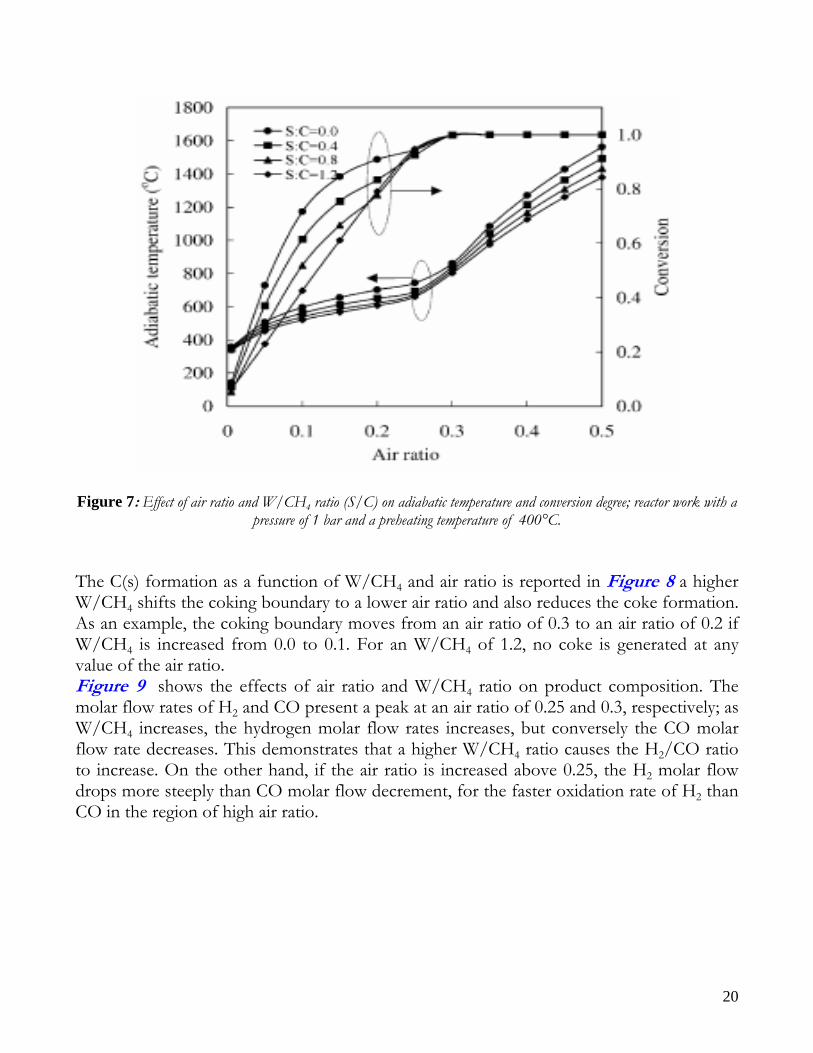
AUTOTHERMAL REFORMING Decentralized hydrogen production and high efficiency due to internal heating supply of autothermal process have pushed researchers effort toward the optimization of the Autothermal Reforming. This process couples catalytic Steam Reforming and Partial Oxidation by feeding methane, water and air to a catalyst bed; in this way, the heat for endothermic reforming reactions is supplied by partial oxidation reactions. The catalytic ATR, indeed, has received much attention in research during the recent years as a viable process for hydrogen generation for fuel cell systems. It offers advantages of small unit size and low operational temperature, easier start-up, and wider choice of materials. Moreover, ATR has low energy requirements, high gas hourly space velocity (GHSV=Inlet flow rate/Catalyst Volume) – at least one order of magnitude relative to SR – and lower process temperature than PO, higher H2/CO ratio, and easily regulated H2/CO ratio by the inlet gas composition. Recent works report detailed ATR analysis, in particular for small scale application. Many authors have shown than water addition to the PO mixture allows an increase in hydrogen yield together with a decrease in operating temperature (lower thermal stress for the catalyst bed). In the work of Seo et al. [1] (2002) a thermodynamic analysis on autothermal reforming is also present. In Figure 7 conversion of methane, x, and temperature, T, as a function of air ratio and water to methane ratio W/CH4 are reported. The air ratio significantly affects the conversion and the adiabatic temperature; conversion rapidly increases with the air ratio and reaches 1.0 at an air ratio of 0.3. For air ratios greater than 0.3, the adiabatic temperature continues to increase, although the conversion remains at 1.0; this is due to oxidation of H2 and CO to H2O and CO2 by excessive O2 supply. The W/CH4 ratio also affects both the conversion and the adiabatic temperature of ATR reactor. As the W/CH4 ratio increases at a fixed air ratio, the conversion becomes lower and the adiabatic temperature decreases. When steam is supplied to the ATR reactor, the steam reforming reaction occurs, which is strongly endothermic; therefore, a higher W/CH4 results in a lower reactor temperature. As a result, the conversion is reduced.
20
Figure 7: Effect of air ratio and W/CH4 ratio (S/C) on adiabatic temperature and conversion degree; reactor work with a
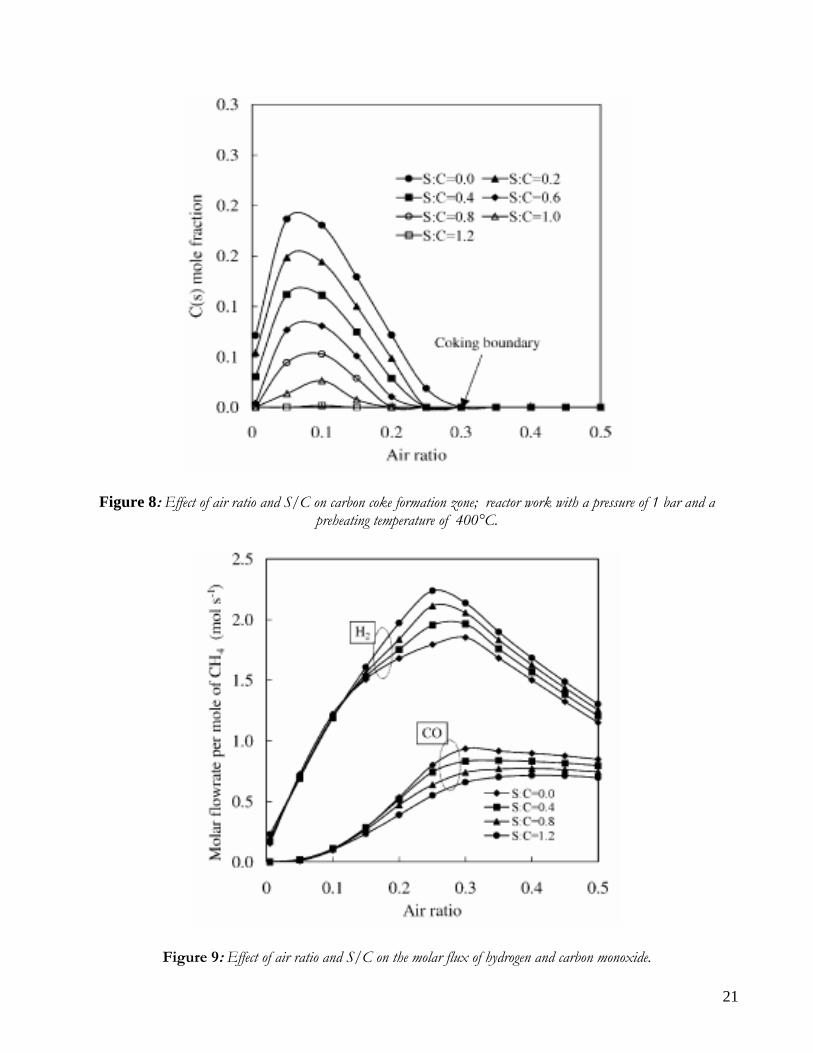
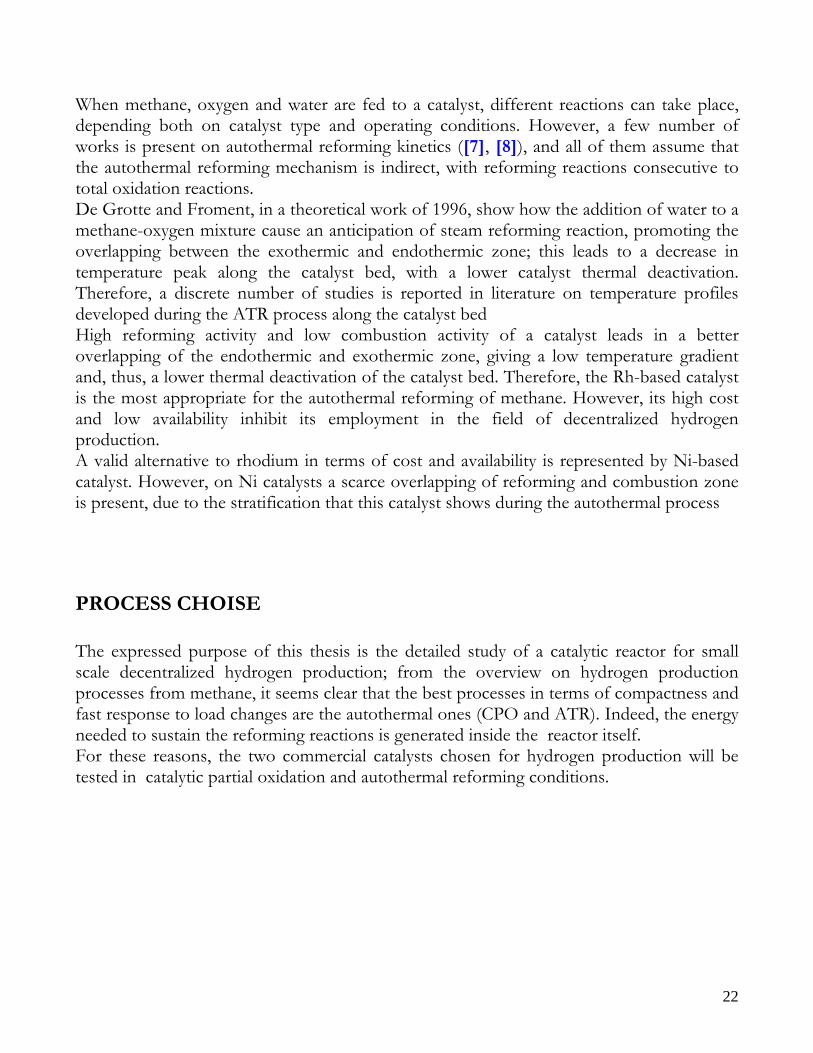
pressure of 1 bar and a preheating temperature of 400°C. The C(s) formation as a function of W/CH4 and air ratio is reported in Figure 8 a higher W/CH4 shifts the coking boundary to a lower air ratio and also reduces the coke formation. As an example, the coking boundary moves from an air ratio of 0.3 to an air ratio of 0.2 if W/CH4 is increased from 0.0 to 0.1. For an W/CH4 of 1.2, no coke is generated at any value of the air ratio. Figure 9 shows the effects of air ratio and W/CH4 ratio on product composition. The molar flow rates of H2 and CO present a peak at an air ratio of 0.25 and 0.3, respectively; as W/CH4 increases, the hydrogen molar flow rates increases, but conversely the CO molar flow rate decreases. This demonstrates that a higher W/CH4 ratio causes the H2/CO ratio to increase. On the other hand, if the air ratio is increased above 0.25, the H2 molar flow drops more steeply than CO molar flow decrement, for the faster oxidation rate of H2 than CO in the region of high air ratio.
21
Figure 8: Effect of air ratio and S/C on carbon coke formation zone; reactor work with a pressure of 1 bar and a preheating temperature of 400°C.
Figure 9: Effect of air ratio and S/C on the molar flux of hydrogen and carbon monoxide.
22
When methane, oxygen and water are fed to a catalyst, different reactions can take place, depending both on catalyst type and operating conditions. However, a few number of works is present on autothermal reforming kinetics ([7], [8]), and all of them assume that the autothermal reforming mechanism is indirect, with reforming reactions consecutive to total oxidation reactions. De Grotte and Froment, in a theoretical work of 1996, show how the addition of water to a methane-oxygen mixture cause an anticipation of steam reforming reaction, promoting the overlapping between the exothermic and endothermic zone; this leads to a decrease in temperature peak along the catalyst bed, with a lower catalyst thermal deactivation. Therefore, a discrete number of studies is reported in literature on temperature profiles developed during the ATR process along the catalyst bed High reforming activity and low combustion activity of a catalyst leads in a better overlapping of the endothermic and exothermic zone, giving a low temperature gradient and, thus, a lower thermal deactivation of the catalyst bed. Therefore, the Rh-based catalyst is the most appropriate for the autothermal reforming of methane. However, its high cost and low availability inhibit its employment in the field of decentralized hydrogen production. A valid alternative to rhodium in terms of cost and availability is represented by Ni-based catalyst. However, on Ni catalysts a scarce overlapping of reforming and combustion zone is present, due to the stratification that this catalyst shows during the autothermal process
PROCESS CHOISE The expressed purpose of this thesis is the detailed study of a catalytic reactor for small scale decentralized hydrogen production; from the overview on hydrogen production processes from methane, it seems clear that the best processes in terms of compactness and fast response to load changes are the autothermal ones (CPO and ATR). Indeed, the energy needed to sustain the reforming reactions is generated inside the reactor itself. For these reasons, the two commercial catalysts chosen for hydrogen production will be tested in catalytic partial oxidation and autothermal reforming conditions.
23
EXSPERIMENTAL SETUP In the following sections the experimental apparatus employed in the autothermal reforming runs will be described. Moreover, the scheme of experimental runs employed for the validation of the mathematical model will be described and discussed.
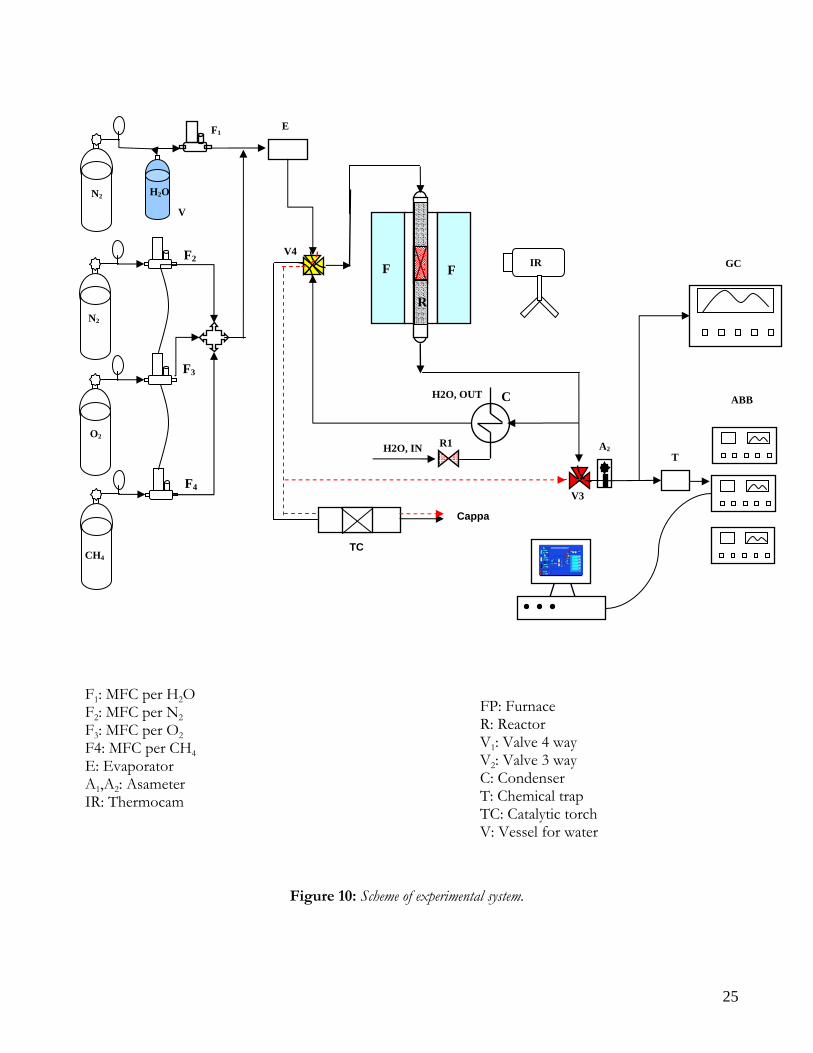
EXPERIMENTAL SYSTEM The experimental system employed is described Figure 10 It consists of the following parts:
• Feeding section; • Reactor section; • Pre-treatment and gas disposal section; • Analysis section.
FEEDING SECTION Feeding section consists of three cylinders for the feeding of oxygen, methane and nitrogen at high purity equipped with pressure regulators that allow a delivery pressure of 0-6 bar. Flowrates of gaseous reactants are regulated by means of Mass Flow Controllers (MFC) purchased from Brooks, having the following characteristics:
• Model MFC 5850; • Gas: Methane; nitrogen; oxygen; • Flow range: 0-5 l/min; • Maximum temperature: 65°C; • Maximum pressure: 100bar; • Serial communication :RS232; • Feeding: 24V DC; • Accuracy: 0.7% vl; 0.2%fs.
24
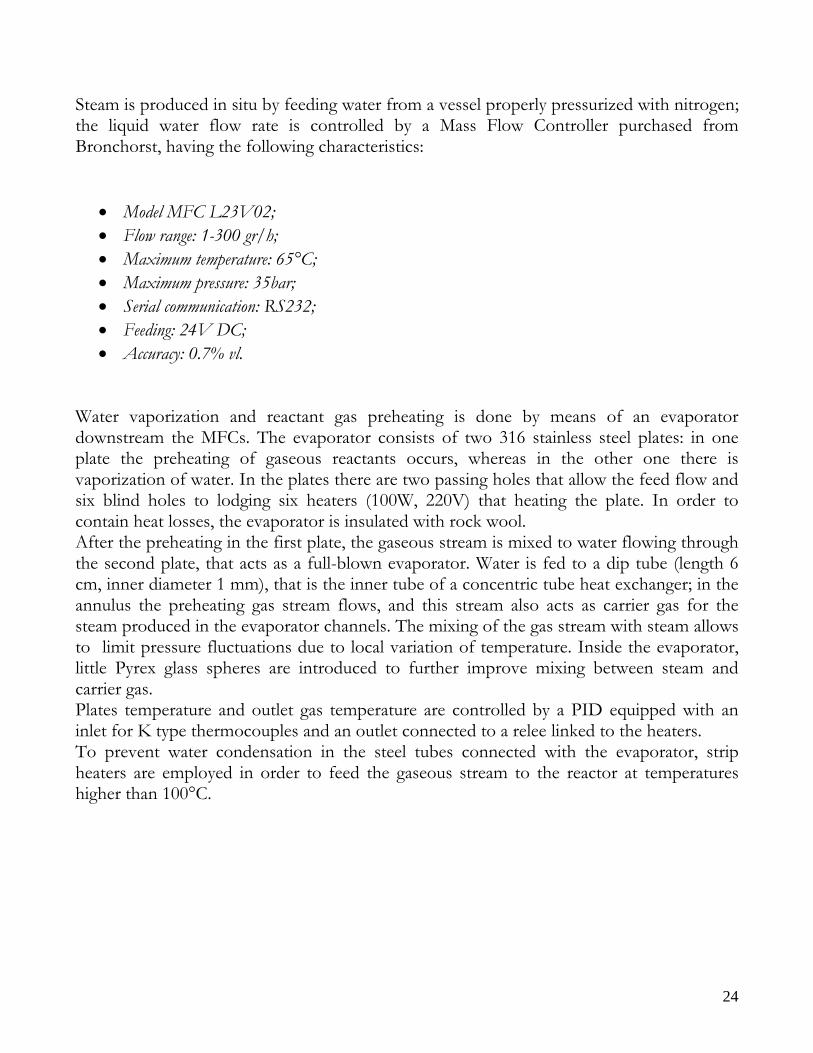
Steam is produced in situ by feeding water from a vessel properly pressurized with nitrogen; the liquid water flow rate is controlled by a Mass Flow Controller purchased from Bronchorst, having the following characteristics:
• Model MFC L23V02; • Flow range: 1-300 gr/h; • Maximum temperature: 65°C; • Maximum pressure: 35bar; • Serial communication: RS232; • Feeding: 24V DC; • Accuracy: 0.7% vl.
Water vaporization and reactant gas preheating is done by means of an evaporator downstream the MFCs. The evaporator consists of two 316 stainless steel plates: in one plate the preheating of gaseous reactants occurs, whereas in the other one there is vaporization of water. In the plates there are two passing holes that allow the feed flow and six blind holes to lodging six heaters (100W, 220V) that heating the plate. In order to contain heat losses, the evaporator is insulated with rock wool. After the preheating in the first plate, the gaseous stream is mixed to water flowing through the second plate, that acts as a full-blown evaporator. Water is fed to a dip tube (length 6 cm, inner diameter 1 mm), that is the inner tube of a concentric tube heat exchanger; in the annulus the preheating gas stream flows, and this stream also acts as carrier gas for the steam produced in the evaporator channels. The mixing of the gas stream with steam allows to limit pressure fluctuations due to local variation of temperature. Inside the evaporator, little Pyrex glass spheres are introduced to further improve mixing between steam and carrier gas. Plates temperature and outlet gas temperature are controlled by a PID equipped with an inlet for K type thermocouples and an outlet connected to a relee linked to the heaters. To prevent water condensation in the steel tubes connected with the evaporator, strip heaters are employed in order to feed the gaseous stream to the reactor at temperatures higher than 100°C.
25
Figure 10: Scheme of experimental system.
N2
O2
ABB
GC
H2O
E
R
T
F2
F3
F4
F F
A2
F1
C
TC
H2O, IN R1
V3
V4
H2O, OUT
N2
V
IR
R
Cappa
CH4
F1: MFC per H2O F2: MFC per N2 F3: MFC per O2 F4: MFC per CH4 E: Evaporator A1,A2: Asameter IR: Thermocam
FP: Furnace R: Reactor V1: Valve 4 way V2: Valve 3 way C: Condenser T: Chemical trap TC: Catalytic torch V: Vessel for water
26
REACTOR SECTION The reactor section consists of a reactor placed inside a furnace. In order to study the autothermal reforming processes, a tubular reactor with a gas inlet and outlet is employed, equipped of a housing for a thermocouple. The choice of reactor material is done taking into account the high temperatures needed for reaching the desired syngas yield and the nature of gaseous species. The necessity to operate at temperatures higher than 800°C restricts the choice at quartz, incoloy and steel; steel is discarded for the formation of hydrides due to the contemporary presence of hydrogen and of high temperatures inside the reactor. The incoloy, instead, is an alloy of nickel and chromium often employed in operations at high temperatures and in presence of hydrogen, thus it could be employed for the construction of our reactor. However, the presence of nickel in this alloy could misstate the measures by catalyzing the reforming reaction of methane. For these reasons, a reactor made of quartz has been chosen: this material resists at temperatures higher than 1200°C and is inert toward the different compounds of gas stream. The main difficulty in the utilization of quartz is related to the scarce resistance at thermal oscillations; this conducts to the determination of a specific procedure for the start up and the shut-down of the reactor, avoiding to expose it to strong thermal shock that could lead to its breaking. The tubular reactor has an outer diameter of 25 mm and a thickness of about 2 mm; the total length is 60 cm; gas inlet and outlet have an outer diameter of 6mm. Only a small part of the reactor (e.g. 14 mm, corresponding to 5gr of Nickel catalyst in pellet of about 1 mm) is filled with the catalyst; the remaining part is filled with an inert material of the same type of catalytic support (Al2O3 with size of about 1 mm). Al2O3 is employed both for preheating of reactants at the inlet of the catalytic bed and for reducing the issue of possible flame propagation due to the presence of methane and oxygen, which concentrations are inside the flammability limits; moreover, Al2O3 can work as thermal barrier, capturing radiation emitted from catalytic bed, thus increasing the thermal efficiency of the process. The insulation of the reactor is realized by a cylindrical block made of ceramic material with a length of 15 cm, an inner diameter of 2.5 cm and a width of 2 cm. As mentioned above, the reactor is placed inside a vertical furnace, having a length of heated zone of 40 cm and a reachable maximum temperature of 1200°C. The furnace is equipped with a PID temperature controller, connected to PC by means of RS232, that allows to reach the desired temperature in a set mode (with appropriate heating ramps) by employing an algorithm realized in Labview; this procedures avoids strong thermal shock to the quartz. Pressure transducers with a measuring range of 0-6 bar and analogic output pressure measure are placed upstream and downstream the reactor. An overpressure valve has been placed upstream to the quartz reactor to avoid the broken in case of anomalous pressure increasing (release pressure of about 2.5 bar).
27
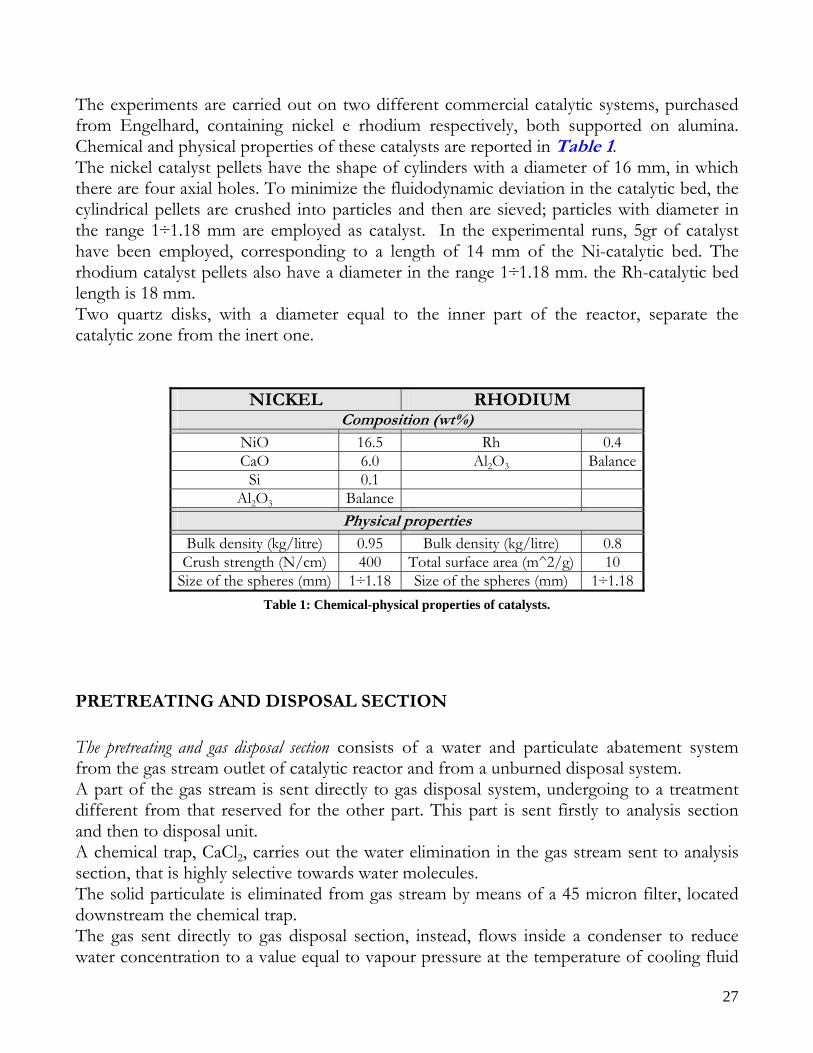
The experiments are carried out on two different commercial catalytic systems, purchased from Engelhard, containing nickel e rhodium respectively, both supported on alumina. Chemical and physical properties of these catalysts are reported in Table 1. The nickel catalyst pellets have the shape of cylinders with a diameter of 16 mm, in which there are four axial holes. To minimize the fluidodynamic deviation in the catalytic bed, the cylindrical pellets are crushed into particles and then are sieved; particles with diameter in the range 1÷1.18 mm are employed as catalyst. In the experimental runs, 5gr of catalyst have been employed, corresponding to a length of 14 mm of the Ni-catalytic bed. The rhodium catalyst pellets also have a diameter in the range 1÷1.18 mm. the Rh-catalytic bed length is 18 mm. Two quartz disks, with a diameter equal to the inner part of the reactor, separate the catalytic zone from the inert one.
Table 1: Chemical-physical properties of catalysts.
PRETREATING AND DISPOSAL SECTION The pretreating and gas disposal section consists of a water and particulate abatement system from the gas stream outlet of catalytic reactor and from a unburned disposal system. A part of the gas stream is sent directly to gas disposal system, undergoing to a treatment different from that reserved for the other part. This part is sent firstly to analysis section and then to disposal unit. A chemical trap, CaCl2, carries out the water elimination in the gas stream sent to analysis section, that is highly selective towards water molecules. The solid particulate is eliminated from gas stream by means of a 45 micron filter, located downstream the chemical trap. The gas sent directly to gas disposal section, instead, flows inside a condenser to reduce water concentration to a value equal to vapour pressure at the temperature of cooling fluid
NICKEL RHODIUM Composition (wt%)
NiO 16.5 Rh 0.4 CaO 6.0 Al2O3 Balance
Si 0.1 Al2O3 Balance
Physical properties Bulk density (kg/litre) 0.95 Bulk density (kg/litre) 0.8
Crush strength (N/cm) 400 Total surface area (m^2/g) 10 Size of the spheres (mm) 1÷1.18 Size of the spheres (mm) 1÷1.18
28
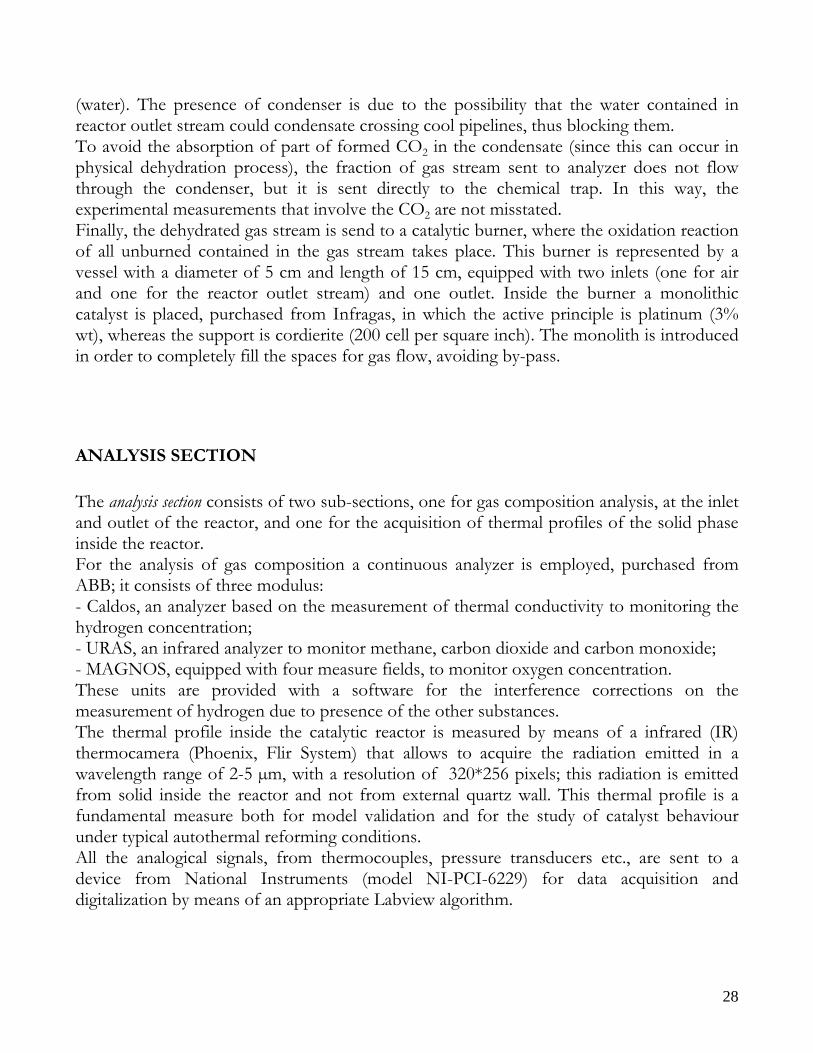
(water). The presence of condenser is due to the possibility that the water contained in reactor outlet stream could condensate crossing cool pipelines, thus blocking them. To avoid the absorption of part of formed CO2 in the condensate (since this can occur in physical dehydration process), the fraction of gas stream sent to analyzer does not flow through the condenser, but it is sent directly to the chemical trap. In this way, the experimental measurements that involve the CO2 are not misstated. Finally, the dehydrated gas stream is send to a catalytic burner, where the oxidation reaction of all unburned contained in the gas stream takes place. This burner is represented by a vessel with a diameter of 5 cm and length of 15 cm, equipped with two inlets (one for air and one for the reactor outlet stream) and one outlet. Inside the burner a monolithic catalyst is placed, purchased from Infragas, in which the active principle is platinum (3% wt), whereas the support is cordierite (200 cell per square inch). The monolith is introduced in order to completely fill the spaces for gas flow, avoiding by-pass.
ANALYSIS SECTION The analysis section consists of two sub-sections, one for gas composition analysis, at the inlet and outlet of the reactor, and one for the acquisition of thermal profiles of the solid phase inside the reactor. For the analysis of gas composition a continuous analyzer is employed, purchased from ABB; it consists of three modulus: - Caldos, an analyzer based on the measurement of thermal conductivity to monitoring the hydrogen concentration; - URAS, an infrared analyzer to monitor methane, carbon dioxide and carbon monoxide; - MAGNOS, equipped with four measure fields, to monitor oxygen concentration. These units are provided with a software for the interference corrections on the measurement of hydrogen due to presence of the other substances. The thermal profile inside the catalytic reactor is measured by means of a infrared (IR) thermocamera (Phoenix, Flir System) that allows to acquire the radiation emitted in a wavelength range of 2-5 µm, with a resolution of 320*256 pixels; this radiation is emitted from solid inside the reactor and not from external quartz wall. This thermal profile is a fundamental measure both for model validation and for the study of catalyst behaviour under typical autothermal reforming conditions. All the analogical signals, from thermocouples, pressure transducers etc., are sent to a device from National Instruments (model NI-PCI-6229) for data acquisition and digitalization by means of an appropriate Labview algorithm.
29
EXPERIMENTAL PROCEDURE The experimental procedure is divided in following phases:
• Reactor loading; • Catalyst pretreatment; • Ignition; • Experimental runs.
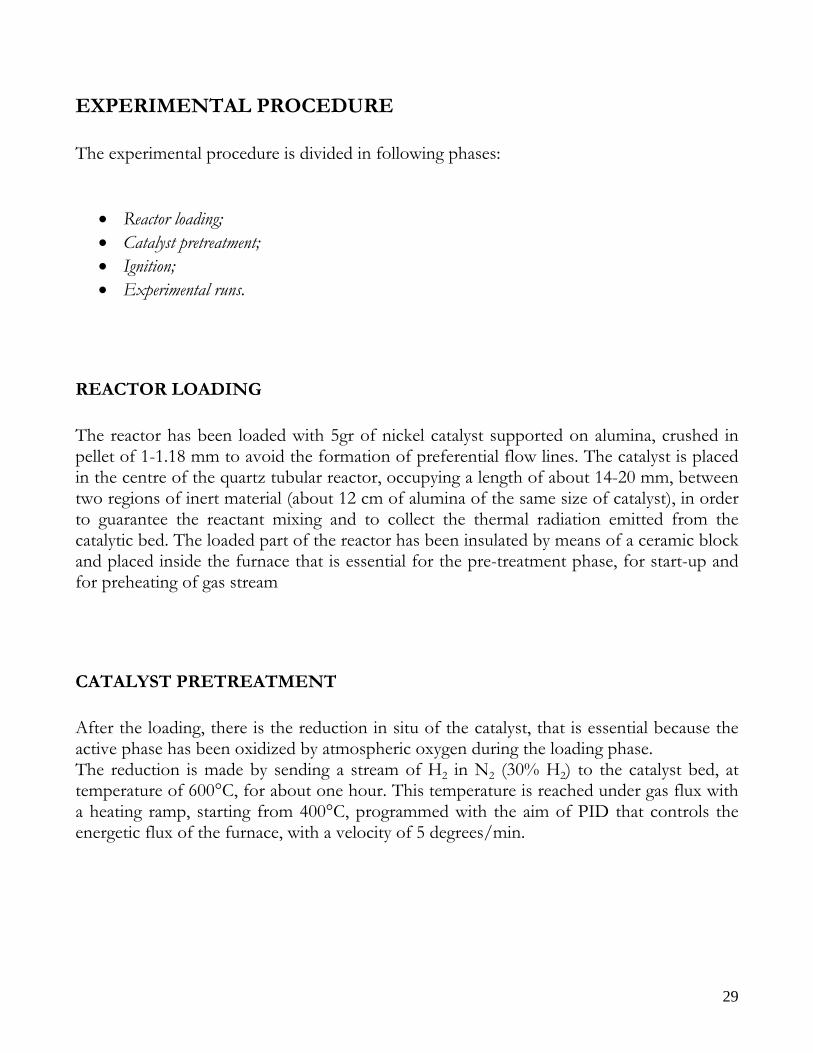
REACTOR LOADING The reactor has been loaded with 5gr of nickel catalyst supported on alumina, crushed in pellet of 1-1.18 mm to avoid the formation of preferential flow lines. The catalyst is placed in the centre of the quartz tubular reactor, occupying a length of about 14-20 mm, between two regions of inert material (about 12 cm of alumina of the same size of catalyst), in order to guarantee the reactant mixing and to collect the thermal radiation emitted from the catalytic bed. The loaded part of the reactor has been insulated by means of a ceramic block and placed inside the furnace that is essential for the pre-treatment phase, for start-up and for preheating of gas stream
CATALYST PRETREATMENT After the loading, there is the reduction in situ of the catalyst, that is essential because the active phase has been oxidized by atmospheric oxygen during the loading phase. The reduction is made by sending a stream of H2 in N2 (30% H2) to the catalyst bed, at temperature of 600°C, for about one hour. This temperature is reached under gas flux with a heating ramp, starting from 400°C, programmed with the aim of PID that controls the energetic flux of the furnace, with a velocity of 5 degrees/min.
30
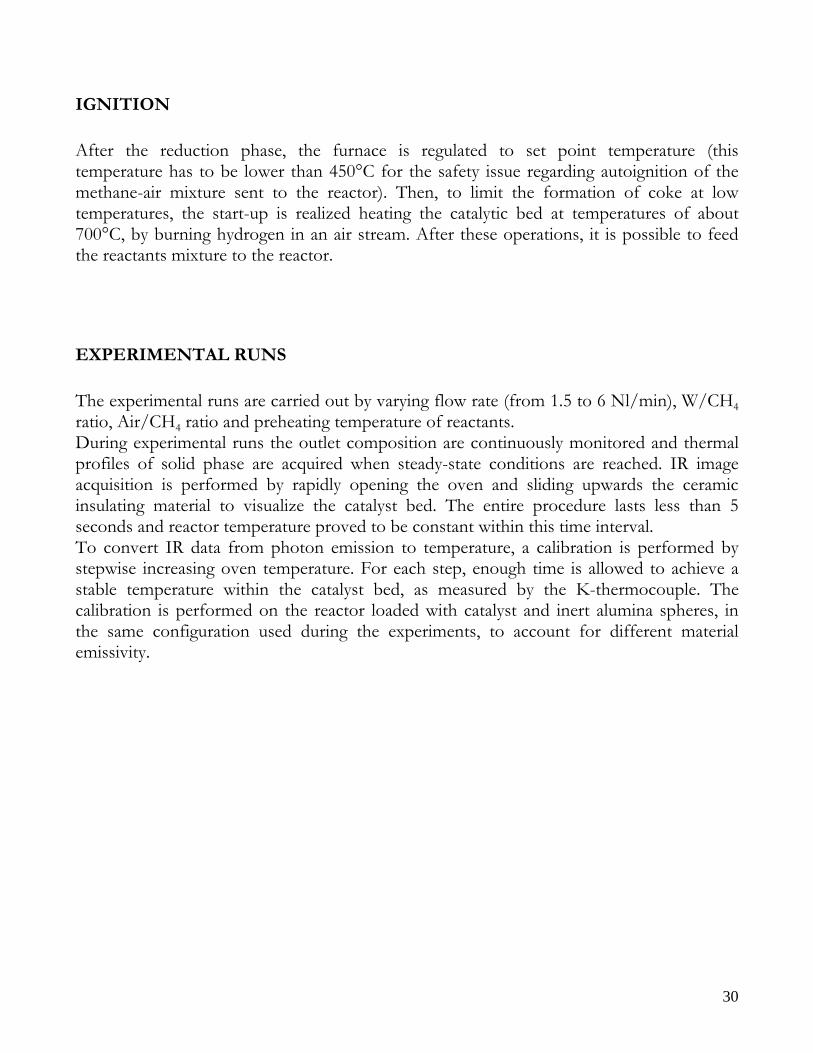
IGNITION After the reduction phase, the furnace is regulated to set point temperature (this temperature has to be lower than 450°C for the safety issue regarding autoignition of the methane-air mixture sent to the reactor). Then, to limit the formation of coke at low temperatures, the start-up is realized heating the catalytic bed at temperatures of about 700°C, by burning hydrogen in an air stream. After these operations, it is possible to feed the reactants mixture to the reactor.
EXPERIMENTAL RUNS The experimental runs are carried out by varying flow rate (from 1.5 to 6 Nl/min), W/CH4 ratio, Air/CH4 ratio and preheating temperature of reactants. During experimental runs the outlet composition are continuously monitored and thermal profiles of solid phase are acquired when steady-state conditions are reached. IR image acquisition is performed by rapidly opening the oven and sliding upwards the ceramic insulating material to visualize the catalyst bed. The entire procedure lasts less than 5 seconds and reactor temperature proved to be constant within this time interval. To convert IR data from photon emission to temperature, a calibration is performed by stepwise increasing oven temperature. For each step, enough time is allowed to achieve a stable temperature within the catalyst bed, as measured by the K-thermocouple. The calibration is performed on the reactor loaded with catalyst and inert alumina spheres, in the same configuration used during the experiments, to account for different material emissivity.
31
MATHEMATICAL MODEL OF FIXED BED REACTOR UNDER STEADY-STATE CONDITIONS
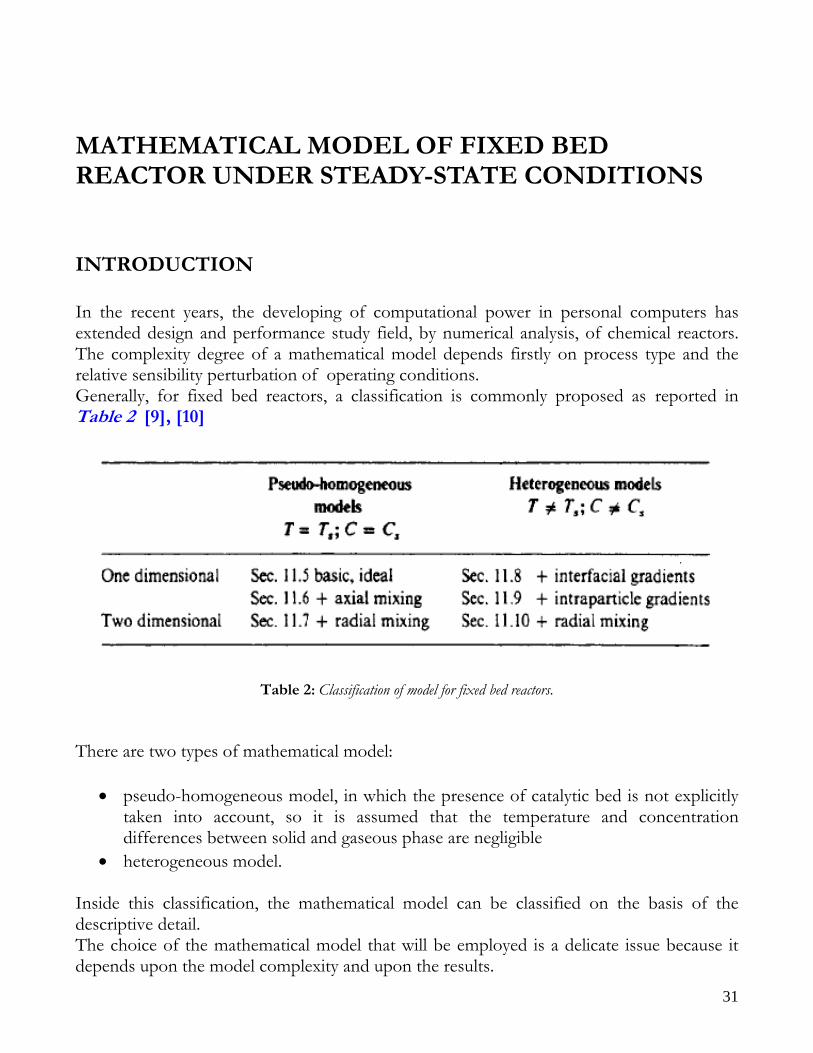
INTRODUCTION In the recent years, the developing of computational power in personal computers has extended design and performance study field, by numerical analysis, of chemical reactors. The complexity degree of a mathematical model depends firstly on process type and the relative sensibility perturbation of operating conditions. Generally, for fixed bed reactors, a classification is commonly proposed as reported in Table 2 [9], [10]
Table 2: Classification of model for fixed bed reactors. There are two types of mathematical model:
• pseudo-homogeneous model, in which the presence of catalytic bed is not explicitly taken into account, so it is assumed that the temperature and concentration differences between solid and gaseous phase are negligible
• heterogeneous model.
Inside this classification, the mathematical model can be classified on the basis of the descriptive detail. The choice of the mathematical model that will be employed is a delicate issue because it depends upon the model complexity and upon the results.
32
MATHEMATICAL MODEL
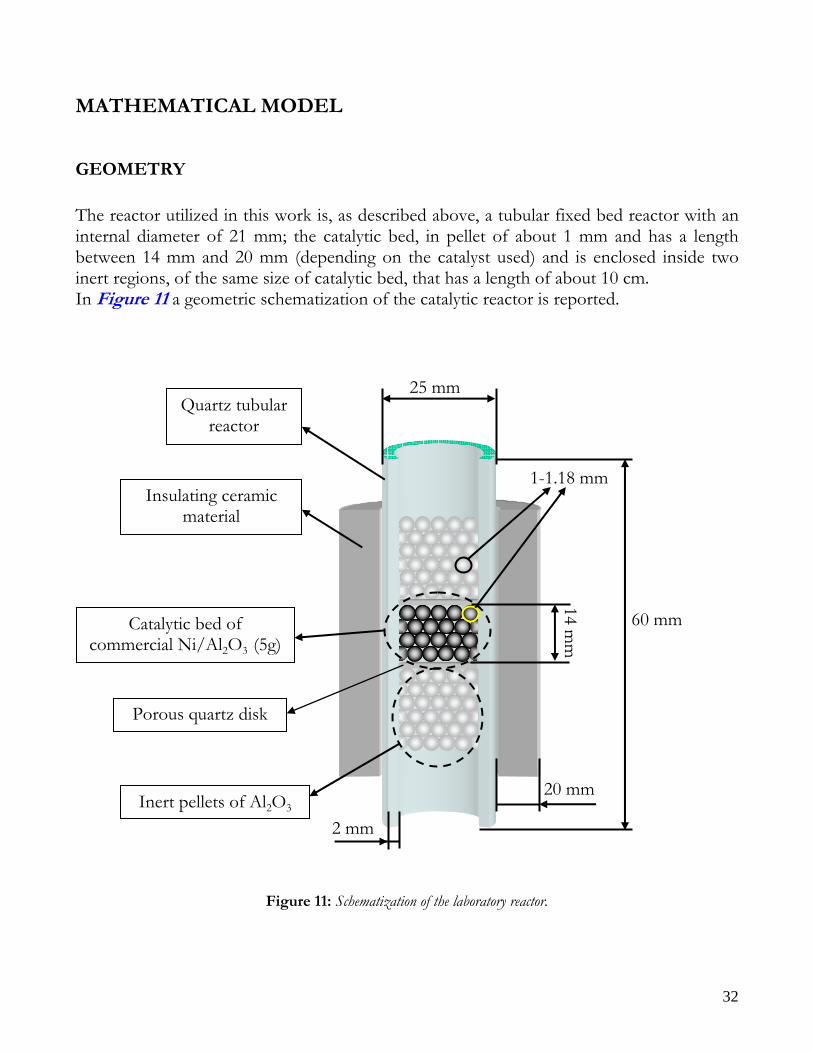
GEOMETRY The reactor utilized in this work is, as described above, a tubular fixed bed reactor with an internal diameter of 21 mm; the catalytic bed, in pellet of about 1 mm and has a length between 14 mm and 20 mm (depending on the catalyst used) and is enclosed inside two inert regions, of the same size of catalytic bed, that has a length of about 10 cm. In Figure 11 a geometric schematization of the catalytic reactor is reported.
Figure 11: Schematization of the laboratory reactor.
60 mm
25 mm
Catalytic bed of commercial Ni/Al2O3 (5g)
Inert pellets of Al2O3
Insulating ceramic material
Quartz tubular reactor
1-1.18 mm
2 mm
20 mm
Porous quartz disk
14 mm
33
MATHEMATICAL MODEL: MASS AND ENERGY BALANCE Mathematical model utilized for the simulation is one-dimensional, dynamic, and heterogeneous with an axial dispersion, both for heat and mass transfer, which is extended both in catalytic zone and surrounding inert one. In the results analysis section the necessity to use a heterogeneous description of the process, differently from reactor models often presented in literature for ATR; moreover, the thermal barrier provided by the inert packing upstream of the catalytic bed will be widely discussed. In the next section the mathematical equations that constitutes the model are discussed. In the following paragraphs, model assumptions and their analysis will be reported in details. Mass balances During autothermal reforming of methane, inside of chemical reactor there are the following species: CH4, O2, H2O, CO, CO2, H2 and N2. A mass balance for each chemical species will be written; due to the model heterogeneity, the balance equations will be formulated both for solid and gaseous phase. General form of mass balance, in terms of volumetric concentration, is:
(1)
(2)
where i indicated the progressive number of the chemical specie; all the other symbols are shown in the nomenclature at the end of this document. Equation (1) represents the equation relative to the gaseous phase: there is an accumulation term on the left, whereas on the right there are the axial dispersive term, which accounts for flux perturbation effect induced by the presence of catalytic bed, the mass diffusion term, the convective term and the term related to the interphase mass transfer.
)()(
,,,,int
2,
2
,,
sigigivgigi
ieffgi CC
katCv
zC
Dt
C−⋅
⋅−
∂⋅∂
−∂∂
=∂
∂ε
issigigivsi rCC
kat
C⋅−−⋅
−
⋅=
∂
∂ρ
ε)(
)1( ,,,,
34
Equation (2), instead, represents the mass balance for solid phase; there is an accumulation term on the left, whereas on the right there are the interphase mass transfer and the generation term. The same equations are solved also in the inert regions where, obviously, the reaction rates are zero. Energy balance In the following part it is reported the general form of energy balances that are utilized in the mathematical modelling , both for solid and gaseous phase.
(3)
(4)
where j is the progressive number of investigated chemical reactions. The eq. (3) represents the energy balance for gaseous phase; on the left there is an accumulation term, whereas on the right there are the axial thermal dispersion term, due to back-mixing effect and thermal diffusion, interphase mass transfer term and, at last, the energy exchange with external environment. The eq. (4), instead, represents the energy balance for solid phase; on the left there is an accumulation term, whereas on the right there are the axial thermal dispersion term, that contains both radiant and conductive heat transfer, the interphase energy transfer term and, at last, the generation one.
)(14
)(,,
int2
2
,
,oveng
gpgoven
rgs
gpg
fvgg
gpg
geffg TTC
hd
TTCha
zT
vzT
Ck
tT
−⋅⋅⋅
⋅⋅−−⋅⋅⋅
⋅+
∂
∂−
∂
∂
⋅=
∂
∂
ερρερ
)()()1( 1,,
2
2
,
,j
N
jj
sp
sgs
sp
fvs
sp
seffs HrC
TTC
hazT
Ck
tT R
Δ⋅+−⋅⋅−
⋅−
∂∂
=∂∂ ∑
=
ρε
35
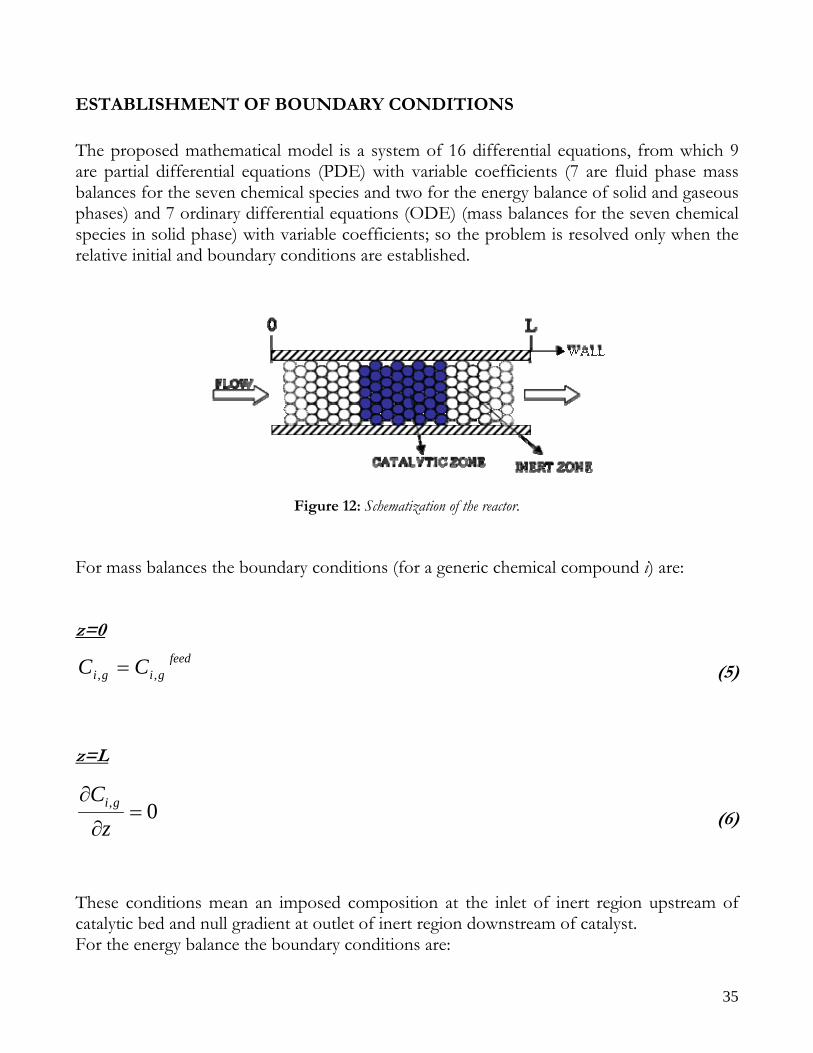
ESTABLISHMENT OF BOUNDARY CONDITIONS The proposed mathematical model is a system of 16 differential equations, from which 9 are partial differential equations (PDE) with variable coefficients (7 are fluid phase mass balances for the seven chemical species and two for the energy balance of solid and gaseous phases) and 7 ordinary differential equations (ODE) (mass balances for the seven chemical species in solid phase) with variable coefficients; so the problem is resolved only when the relative initial and boundary conditions are established.
Figure 12: Schematization of the reactor. For mass balances the boundary conditions (for a generic chemical compound i) are: z=0
(5)
z=L
(6)
These conditions mean an imposed composition at the inlet of inert region upstream of catalytic bed and null gradient at outlet of inert region downstream of catalyst. For the energy balance the boundary conditions are:
feedgigi CC ,, =
0, =∂
∂
zC gi
36
z=0
(7)
(8)
z=L
(9)
(10)
At the inlet of inert region upstream of catalytic bed there is known temperature (equal to that of alimentation) for the gaseous phase whereas there is a radiation condition for the solid phase; in outlet of reactor instead is supposed a null temperature gradient in gas phase and radiation condition for the solid phase. Regarding interface section between inert material and catalytic bed it is imposed the continuity of the mass and enthalpy flows, for the compositions, and for the temperatures.
ANALYSIS OF THE HYPOTHESES OF THE MODEL In this section a detailed analysis of the principal assumption made for the writing of the mathematical model is reported, which is the outcome of an off-line analysis related to:
feedgg TT =
)( 44, sgs
sseff TTe
zT
k −⋅⋅=∂∂⋅− σ
)( 44, gss
sseff TTe
zT
k −⋅⋅=∂∂⋅− σ
0=∂
∂
zTg
37
• State of gases; • Analysis of the pressure drop; • Kinetics in homogeneous phase; • Heterogeneity; • Mass and heat dispersion in gas phase; • Thermal conductibility and radiation; • Determination of external heat transfer coefficient; • Physical and transport properties.
STATE OF GASES The operative conditions of pressure and temperature at which the autothermal reforming process of methane is conducted are: - Pressure relatively low (experimentally lower than 2 bar): - Temperatures higher than 400 Kelvin along the length of reactor. In these conditions, both gas and steam are considered in ideal state, so gas density can be written as follows:
(11)
ANALYSIS OF THE PRESSURE DROP With regard to the analysis of pressure drop in fixed bed reactor, Ergun equation is used [11], according to it, the friction factor defined from eq. (13) is equal to:
(12)
(13)
)Re1*15075.1(*1
3p
f εεε −
+−
=
2****
GLdgP
f pgρΔ=
gg RT
MMP *=ρ
38
The Ergun equation for fixed bed reactors was revised from Hicks [12] whose work concludes that Ergun equation is applicable until the following condition is satisfied:
(14)
Hicks, instead, proposed the following expression:
(15)
that is applicable for Reynolds values:
(16)
A conservative estimation of pressure drop induced from catalytic bed can be done assuming a temperature around to 1000 K, a flow rate of 0.5 Nm^3/h, a void fraction of 0.42 and a pellet diameter of about 1 mm; under these circumstances it is obtained a value of Rep/(1-ε) around to 15, so the Ergun equation is applicable; from which result an f value around to 100 corresponding to a pressure loss of about 0.008 bar/cm, that is negligible along the narrow length of catalytic bed. This assumption is very common in literature and involves the absence of the equation for conservation of momentum inside the mathematical model. KINETICS IN HOMOGENEOUS PHASE With regard to the kinetics, in homogeneous phase it is well-known that their contribute, with respect to those in heterogeneous phase, is negligible. In particular, in literature ([13], [14]) an estimation, done by means of kinetic mechanism included in GRI MECH 2.11 ([15], [16]) is reported, calculated in partial oxidation conditions with stoichiometric feeding. From Figure 13, taken from Bizzi et al’s work (2002) [13], it can be noted that the ratio between two reaction rates as order of magnitude is about 10^-15 in a wide range of temperatures.
2.03
2.1
Re)1(8.6 −∗−
∗=εεf
5000)1/(Re1000 ≤−≤ εp
500)1/(Re ≤−εp
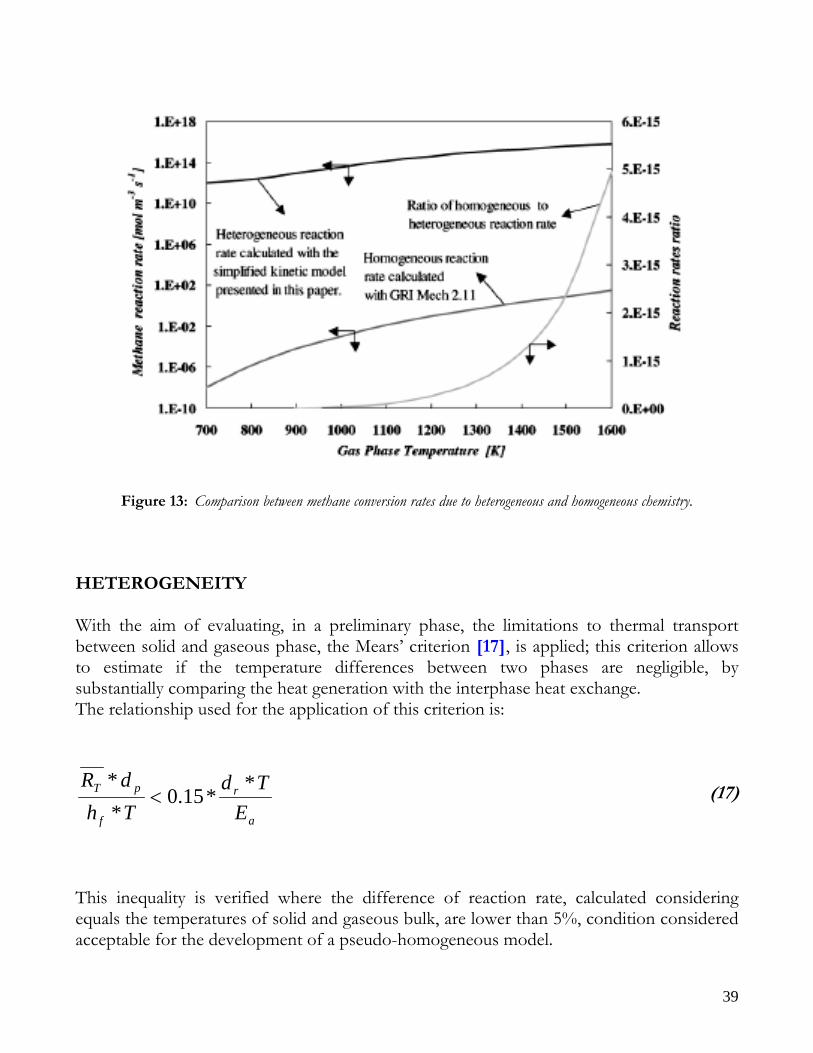
39
Figure 13: Comparison between methane conversion rates due to heterogeneous and homogeneous chemistry. HETEROGENEITY With the aim of evaluating, in a preliminary phase, the limitations to thermal transport between solid and gaseous phase, the Mears’ criterion [17], is applied; this criterion allows to estimate if the temperature differences between two phases are negligible, by substantially comparing the heat generation with the interphase heat exchange. The relationship used for the application of this criterion is:
(17)
This inequality is verified where the difference of reaction rate, calculated considering equals the temperatures of solid and gaseous bulk, are lower than 5%, condition considered acceptable for the development of a pseudo-homogeneous model.
a
r
f
pT
ETd
ThdR *
*15.0**
<
40
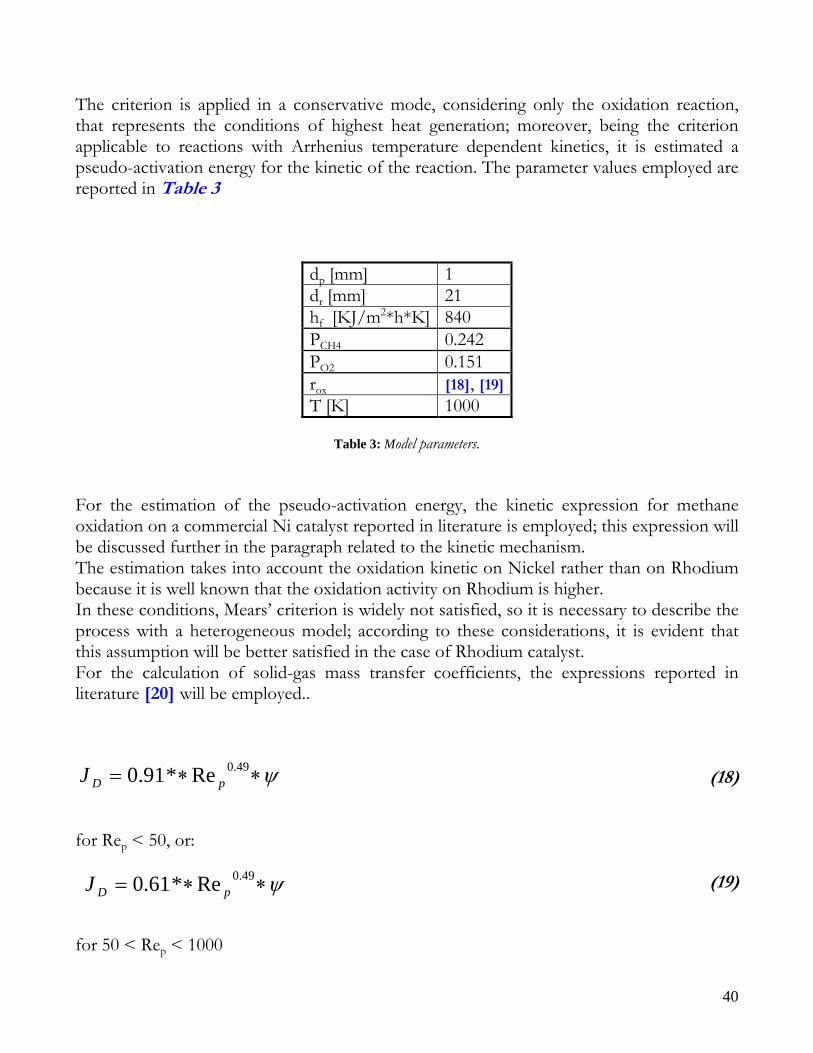
The criterion is applied in a conservative mode, considering only the oxidation reaction, that represents the conditions of highest heat generation; moreover, being the criterion applicable to reactions with Arrhenius temperature dependent kinetics, it is estimated a pseudo-activation energy for the kinetic of the reaction. The parameter values employed are reported in Table 3
dp [mm] 1 dr [mm] 21 hf [KJ/m2*h*K] 840 PCH4 0.242 PO2 0.151 rox [18], [19]T [K] 1000
Table 3: Model parameters.
For the estimation of the pseudo-activation energy, the kinetic expression for methane oxidation on a commercial Ni catalyst reported in literature is employed; this expression will be discussed further in the paragraph related to the kinetic mechanism. The estimation takes into account the oxidation kinetic on Nickel rather than on Rhodium because it is well known that the oxidation activity on Rhodium is higher. In these conditions, Mears’ criterion is widely not satisfied, so it is necessary to describe the process with a heterogeneous model; according to these considerations, it is evident that this assumption will be better satisfied in the case of Rhodium catalyst. For the calculation of solid-gas mass transfer coefficients, the expressions reported in literature [20] will be employed..
(18)
for Rep < 50, or:
(19)
for 50 < Rep < 1000
ψ∗∗= 49.0Re*91.0 pDJ
ψ∗∗= 49.0Re*61.0 pDJ
41
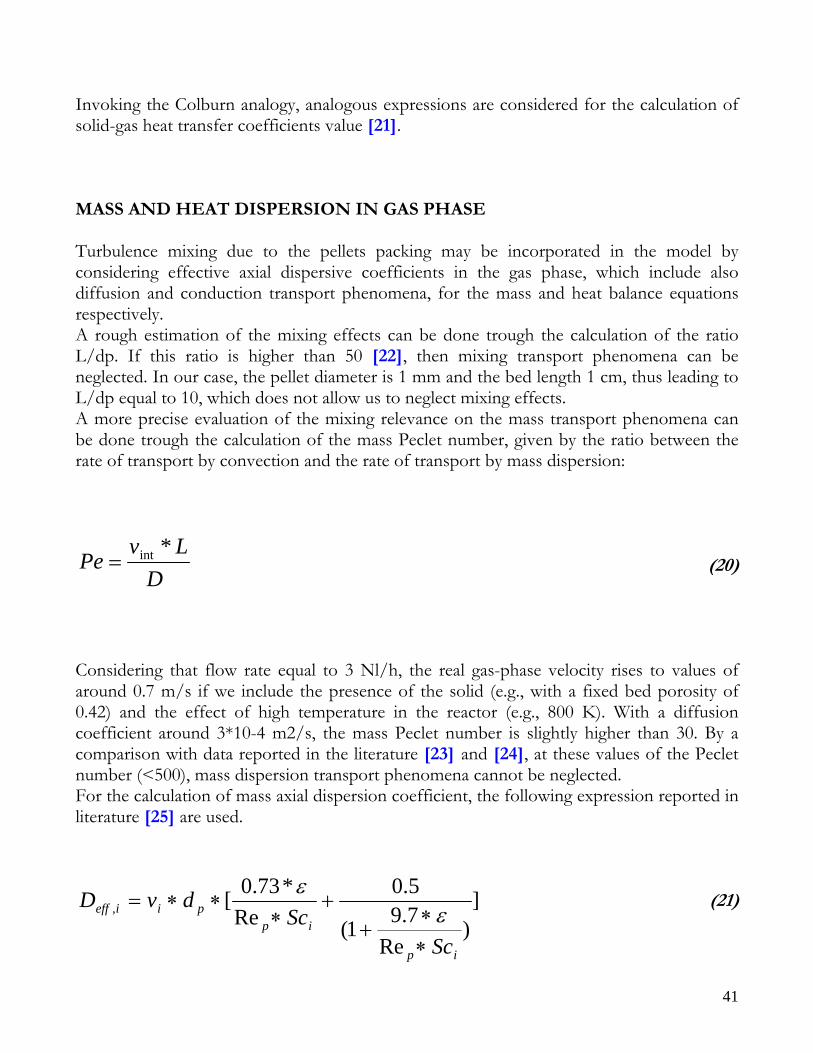
Invoking the Colburn analogy, analogous expressions are considered for the calculation of solid-gas heat transfer coefficients value [21]. MASS AND HEAT DISPERSION IN GAS PHASE Turbulence mixing due to the pellets packing may be incorporated in the model by considering effective axial dispersive coefficients in the gas phase, which include also diffusion and conduction transport phenomena, for the mass and heat balance equations respectively. A rough estimation of the mixing effects can be done trough the calculation of the ratio L/dp. If this ratio is higher than 50 [22], then mixing transport phenomena can be neglected. In our case, the pellet diameter is 1 mm and the bed length 1 cm, thus leading to L/dp equal to 10, which does not allow us to neglect mixing effects. A more precise evaluation of the mixing relevance on the mass transport phenomena can be done trough the calculation of the mass Peclet number, given by the ratio between the rate of transport by convection and the rate of transport by mass dispersion:
(20)
Considering that flow rate equal to 3 Nl/h, the real gas-phase velocity rises to values of around 0.7 m/s if we include the presence of the solid (e.g., with a fixed bed porosity of 0.42) and the effect of high temperature in the reactor (e.g., 800 K). With a diffusion coefficient around 3*10-4 m2/s, the mass Peclet number is slightly higher than 30. By a comparison with data reported in the literature [23] and [24], at these values of the Peclet number (<500), mass dispersion transport phenomena cannot be neglected. For the calculation of mass axial dispersion coefficient, the following expression reported in literature [25] are used.
(21)
DLv
Pe*int=
])
Re7.91(
5.0Re
*73.0[,
ip
ippiieff
ScSc
dvD
∗∗
++
∗∗∗=
εε
42
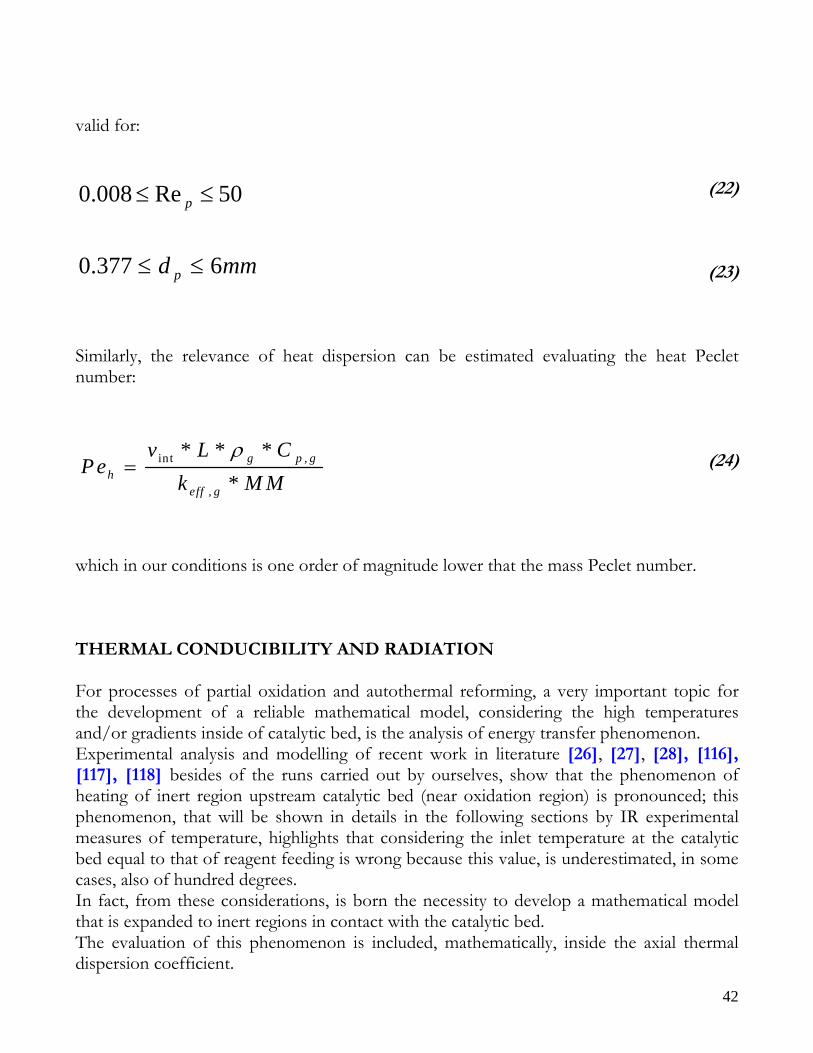
valid for:
(22)
(23)
Similarly, the relevance of heat dispersion can be estimated evaluating the heat Peclet number:
(24)
which in our conditions is one order of magnitude lower that the mass Peclet number. THERMAL CONDUCIBILITY AND RADIATION For processes of partial oxidation and autothermal reforming, a very important topic for the development of a reliable mathematical model, considering the high temperatures and/or gradients inside of catalytic bed, is the analysis of energy transfer phenomenon. Experimental analysis and modelling of recent work in literature [26], [27], [28], [116], [117], [118] besides of the runs carried out by ourselves, show that the phenomenon of heating of inert region upstream catalytic bed (near oxidation region) is pronounced; this phenomenon, that will be shown in details in the following sections by IR experimental measures of temperature, highlights that considering the inlet temperature at the catalytic bed equal to that of reagent feeding is wrong because this value, is underestimated, in some cases, also of hundred degrees. In fact, from these considerations, is born the necessity to develop a mathematical model that is expanded to inert regions in contact with the catalytic bed. The evaluation of this phenomenon is included, mathematically, inside the axial thermal dispersion coefficient.
50Re008.0 ≤≤ p
mmd p 6377.0 ≤≤
int ,
,
* * **
g p gh
eff g
v L CP e
k M Mρ
=
43
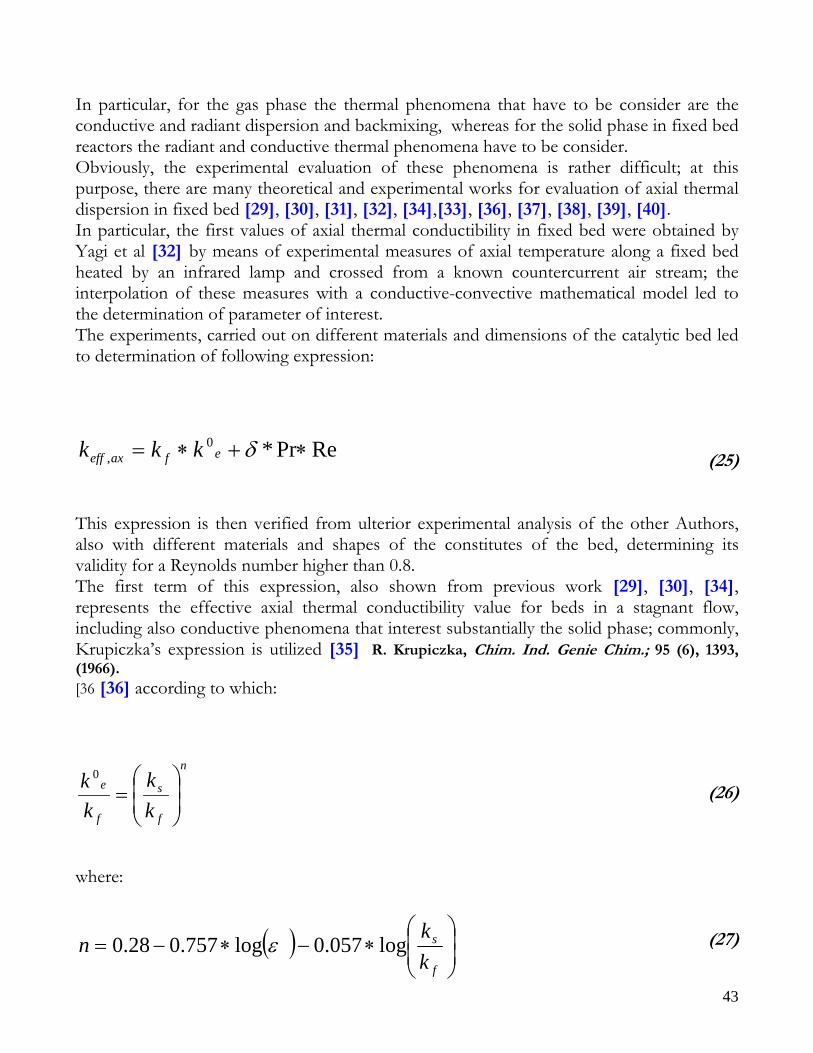
In particular, for the gas phase the thermal phenomena that have to be consider are the conductive and radiant dispersion and backmixing, whereas for the solid phase in fixed bed reactors the radiant and conductive thermal phenomena have to be consider. Obviously, the experimental evaluation of these phenomena is rather difficult; at this purpose, there are many theoretical and experimental works for evaluation of axial thermal dispersion in fixed bed [29], [30], [31], [32], [34],[33], [36], [37], [38], [39], [40]. In particular, the first values of axial thermal conductibility in fixed bed were obtained by Yagi et al [32] by means of experimental measures of axial temperature along a fixed bed heated by an infrared lamp and crossed from a known countercurrent air stream; the interpolation of these measures with a conductive-convective mathematical model led to the determination of parameter of interest. The experiments, carried out on different materials and dimensions of the catalytic bed led to determination of following expression:
(25)
This expression is then verified from ulterior experimental analysis of the other Authors, also with different materials and shapes of the constitutes of the bed, determining its validity for a Reynolds number higher than 0.8. The first term of this expression, also shown from previous work [29], [30], [34], represents the effective axial thermal conductibility value for beds in a stagnant flow, including also conductive phenomena that interest substantially the solid phase; commonly, Krupiczka’s expression is utilized [35] R. Krupiczka, Chim. Ind. Genie Chim.; 95 (6), 1393, (1966). [36 [36] according to which:
(26)
where:
(27)
RePr*0, ∗+∗= δefaxeff kkk
n
f
s
f
e
kk
kk
⎟⎟⎠
⎞⎜⎜⎝
⎛=
0
( ) ⎟⎟⎠
⎞⎜⎜⎝
⎛∗−∗−=
f
s
kk
n log057.0log757.028.0 ε
44
The experiments are carried out at low temperatures and in absence of high temperature gradients so, it is evident, that in the above expression are considered conductive, and convective phenomena but not the radiation ones. Instead, when the bed is submitted to high thermal levels and gradients, as in autothermal processes for the hydrogen production, it is necessary to consider also the radiant effects. With this purpose, Wakao and Kato [37] proposed the following expression:
(28)
where
(29)
valid for
(30)
(31)
and where
(32)
100020 ≤≤f
s
kk
3.0≤rNu
s
prr k
dhNu
∗=
)() ( 00 0 RADIANTkCONDUCTIVE k k ee e +=
11.1
96.00 707. 0)( ⎟⎟⎠
⎞⎜⎜⎝
⎛∗∗∗=
f
srf e
kkNuk RADIANT k
45
and
(33)
For the presence of water and carbon dioxide, also for the gas phase would be considered the radiant phenomenon; with this purpose Wakao [41] proposed also a modified expression of hr for gas phase. But it has to be considered that the emissivity of gaseous compounds is strongly dependent from temperature, void dimension and partial pressure, that in fixed bed generally have very low value and so, in this work, it is neglected. For example, the emissivity of CO2 at high temperature (about 1200 K) and in a void radius of 1 cm has a value of just 0.05 [42]. DETERMINATION OF THE EXTERNAL HEAT TRANSFER COEFFICIENT In equation (3) of the proposed mathematical model there is the external heat transfer term and it is necessary to know global external heat transfer coefficient hOVEN. The determination of this value is done off-line by means of experimental measures opportunely realized. The energy balance, in steady-state for a non-reactive fixed bed reactor, is written as follows:
(34)
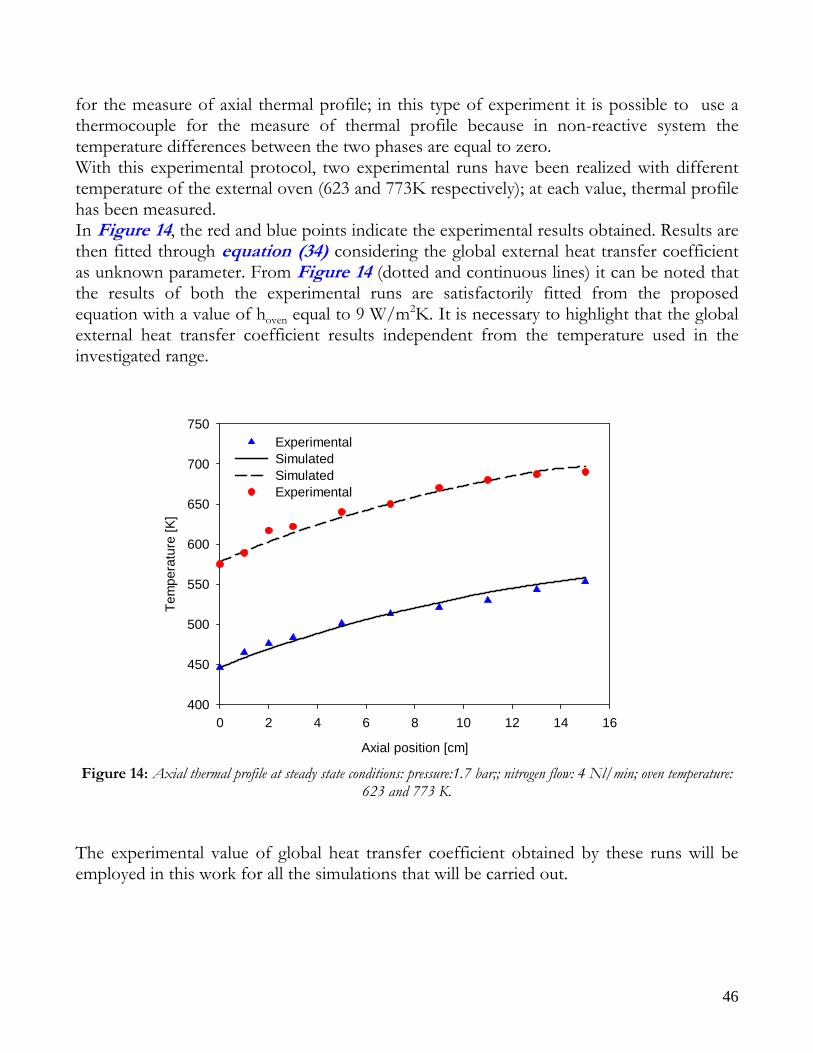
So, if the reactor is submitted to a non-reactive mixture flow (with known physical and transport properties) and the thermal profile inside the bed is measured, it is possible to determine the global heat transfer coefficient, if the external temperature is known. On the basis of these observations, experimental runs were conducted on the same reactor of reforming runs (with the same insulating ceramic material) placed inside the furnace with a fixed temperature and submitted to a known nitrogen flow (non-reactive mixture). The reactor was equipped with a mobile thermocouple, by means a quartz coaxial sleeve,
3
100264.022268.0
⎟⎠⎞
⎜⎝⎛∗
−=
T
e
hr
)(140,
int2
2
,
,oveng
gpgoven
r
gg
gpg
geff TTC
hdz
Tv
zT
Ck
−⋅⋅⋅
⋅⋅−∂
∂−
∂
∂
⋅=
ερρ
46
for the measure of axial thermal profile; in this type of experiment it is possible to use a thermocouple for the measure of thermal profile because in non-reactive system the temperature differences between the two phases are equal to zero. With this experimental protocol, two experimental runs have been realized with different temperature of the external oven (623 and 773K respectively); at each value, thermal profile has been measured. In Figure 14, the red and blue points indicate the experimental results obtained. Results are then fitted through equation (34) considering the global external heat transfer coefficient as unknown parameter. From Figure 14 (dotted and continuous lines) it can be noted that the results of both the experimental runs are satisfactorily fitted from the proposed equation with a value of hoven equal to 9 W/m2K. It is necessary to highlight that the global external heat transfer coefficient results independent from the temperature used in the investigated range.
Figure 14: Axial thermal profile at steady state conditions: pressure:1.7 bar;; nitrogen flow: 4 Nl/min; oven temperature:
623 and 773 K. The experimental value of global heat transfer coefficient obtained by these runs will be employed in this work for all the simulations that will be carried out.
Axial position [cm]
0 2 4 6 8 10 12 14 16
Tem
pera
ture
[K]
400
450
500
550
600
650
700
750Experimental Simulated Simulated Experimental
47
PHYSICAL AND TRANSPORT PROPERTIES Inside the proposed mathematical model the kinetic law and all the physical and transport properties of gaseous and solid phases have to be defined. The kinetic law, that is strongly dependent of nature of the catalyst, will be discussed in the following sections, where results obtained with both Nickel and Rhodium catalytic systems will be reported, whereas the physical and transport parameters will not be discussed here; these parameters, indeed, are all function of temperature and composition, and so they are variable along the reactor, so they are calculated by means of well-known relationships commonly employed in chemical engineering field [20].
NUMERICAL METHOD The mathematical model, constituted by differential equations of material balances and heat balances (16 differential equations, 9 partial derivative “PDE” and 7 ordinary differential equations “ODE”, all with variable coefficients), has to be numerically solved, so it is necessary to approximate the problem with differential formulas [60]. From the solution of these approximated equations, scalar values of unknown functions can be obtained, that are a series of values that correspond to a set of points on the domain. These values are the scalar unknown quantity of the “approximate problem”, that substitutes the real problem. The differential equations with partial derivative represent a good relation on all the points of the integration domain. For this reason, it is possible to write for each point an equation as long as the partial derivatives are expressed in function of the scalar unknown quantity. The expressions of the partial derivative approximate from functions with scalar unknown quantity determine the solve method adopted, implicit or explicit. Moreover, depending on the way the partial derivative are expressed, there are discretization errors with respect to integration step in space and in time. The truncation error that represents the difference between the solution of the starting differential equation and its approximation, depends on the form of the truncation error itself (round off), related to finite dimension of the machine registry. Another important information is the definition of local and global truncation error: the first correspond to the difference between the exact solution starting from the previous step and the calculated value, whereas the second is the difference between the exact solution and the calculated value. In conclusion, the global error is due to combination of the different local errors but is not really the arithmetic sum. The amplification of the errors in the solutions represents the so-called instability phenomenon of numerical method chosen. A method is defined stable if the difference
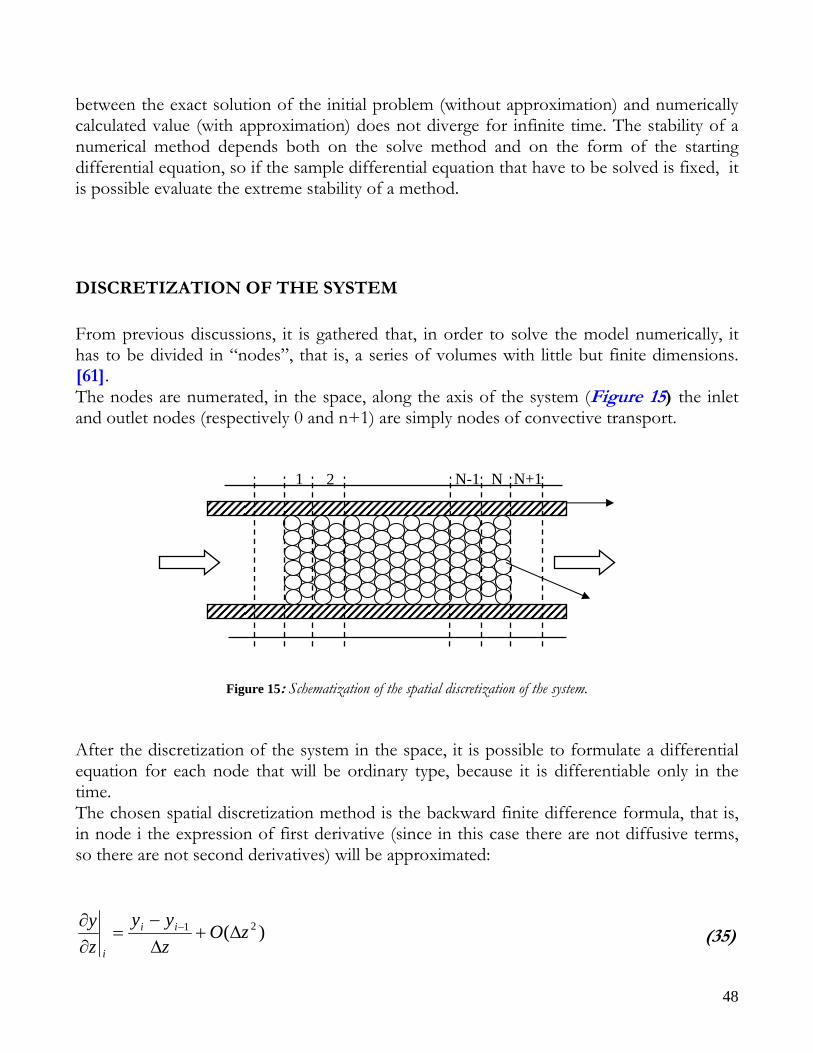
48
between the exact solution of the initial problem (without approximation) and numerically calculated value (with approximation) does not diverge for infinite time. The stability of a numerical method depends both on the solve method and on the form of the starting differential equation, so if the sample differential equation that have to be solved is fixed, it is possible evaluate the extreme stability of a method.
DISCRETIZATION OF THE SYSTEM From previous discussions, it is gathered that, in order to solve the model numerically, it has to be divided in “nodes”, that is, a series of volumes with little but finite dimensions. [61]. The nodes are numerated, in the space, along the axis of the system (Figure 15) the inlet and outlet nodes (respectively 0 and n+1) are simply nodes of convective transport.
Figure 15: Schematization of the spatial discretization of the system. After the discretization of the system in the space, it is possible to formulate a differential equation for each node that will be ordinary type, because it is differentiable only in the time. The chosen spatial discretization method is the backward finite difference formula, that is, in node i the expression of first derivative (since in this case there are not diffusive terms, so there are not second derivatives) will be approximated:
)( 21 zOzyy
zy ii
i
Δ+Δ−
=∂∂ −
(35)
1 2 N-1 N N+1
49
where y represents the generic unknown function and i the nodes studied. So the model is constituted of a set of ordinary differential equations (ODE) that are solved by means of numerical methods with a computer. With this aim it was chosen a solver found in the library of the software of “WolframResearch” Mathematica® that is named NDsolve. The syntax of this solver is the following: NDsolve[{y’1[t]==y1[t],…,y’n[t]==yn[t]},{y1[0]==y0
1,…,yn[0]==y0n},{y1[t],…,yn[t]},{t,tmin,tmax}]
In the syntax, the vector of the differential equation system is assigned, together with the vector of the starting conditions, of the solution functions and finally the integration time span; then the software calculates the numerical solution of each system, employing the explicit Runge-Kutta method as integration method, which order is automatically managed by the solver (this is a default option, but a manually management is possible).
50
RESULTS ON NICKEL BASIS CATALYST The main purpose of the present work is the validation of the proposed mathematical model by comparing the calculated results with the experimental data. These data are obtained through runs performed with the experimental device previously presented. In particular, the present chapter shows data obtained using a commercial Nickel catalyst. The performed analysis is summarized in the following steps:
• Thermodynamic analysis for the evaluation of the experimental conditions that avoid coke formation • Analysis of the kinetic mechanism of the autothermal reforming of methane over Nickel catalyst • Numerical-experimental prediction of the overlapping between the oxidative and the reforming zone • Runs at different flow rates and feed compositions • Numerical simulations and comparison with the experimental data • Numerical-experimental considerations on transport phenomena and model limitations • Conclusions for CPO and ATR processes on commercial Nickel catalyst.
Each simulation reported is performed at an inlet bed temperature higher then 750K (near the activation temperature of the catalyst), as previously described in the experimental section, and a start-up with an empty reactor is assumed, that is, a the reactor is assumed to be vessel initially filled with nitrogen (no reactants at initial conditions). This situation does not influence the process kinetic, so the vessel, at the start-up, can be considered in stationary conditions.
THERMODYNAMIC ANALYSIS The experimental program is performed making a thermodynamic preliminary study to obtain the feed ratio (Air/CH4) that avoids coke formation. Indeed, coke formation is undesired and, consequently, it is not foreseen by the kinetic models adopted. It is important to note that the thermodynamic information reported in the present paragraph, independently from the catalyst, are considered a pattern also for the compilation of the experimental program on the commercial Rhodium catalyst shown in the next sections. The thermodynamic analysis of the target process is realized using Aspen Plus, the software of the Aspen Technology [65].
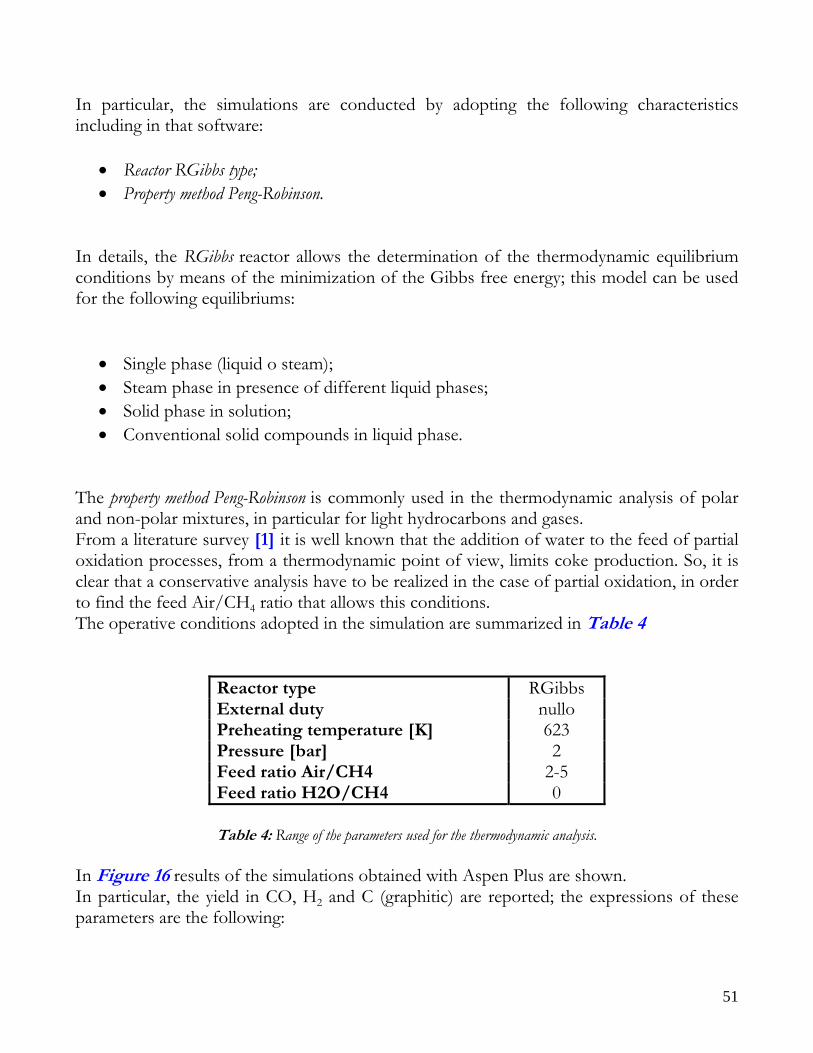
51
In particular, the simulations are conducted by adopting the following characteristics including in that software:
• Reactor RGibbs type; • Property method Peng-Robinson.
In details, the RGibbs reactor allows the determination of the thermodynamic equilibrium conditions by means of the minimization of the Gibbs free energy; this model can be used for the following equilibriums:
• Single phase (liquid o steam); • Steam phase in presence of different liquid phases; • Solid phase in solution; • Conventional solid compounds in liquid phase.
The property method Peng-Robinson is commonly used in the thermodynamic analysis of polar and non-polar mixtures, in particular for light hydrocarbons and gases. From a literature survey [1] it is well known that the addition of water to the feed of partial oxidation processes, from a thermodynamic point of view, limits coke production. So, it is clear that a conservative analysis have to be realized in the case of partial oxidation, in order to find the feed Air/CH4 ratio that allows this conditions. The operative conditions adopted in the simulation are summarized in Table 4
Reactor type RGibbs External duty nullo Preheating temperature [K] 623 Pressure [bar] 2 Feed ratio Air/CH4 2-5 Feed ratio H2O/CH4 0
Table 4: Range of the parameters used for the thermodynamic analysis.
In Figure 16 results of the simulations obtained with Aspen Plus are shown. In particular, the yield in CO, H2 and C (graphitic) are reported; the expressions of these parameters are the following:
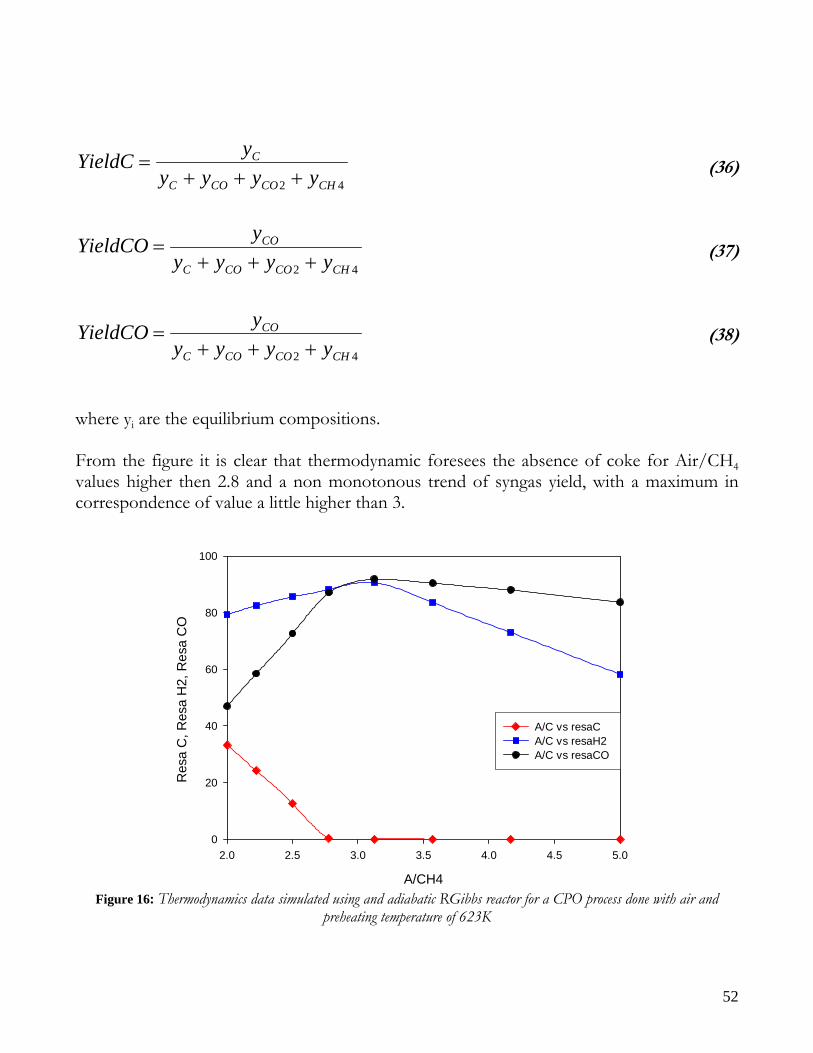
52
(36)
(37)
(38) where yi are the equilibrium compositions. From the figure it is clear that thermodynamic foresees the absence of coke for Air/CH4 values higher then 2.8 and a non monotonous trend of syngas yield, with a maximum in correspondence of value a little higher than 3.
A/CH4
2.0 2.5 3.0 3.5 4.0 4.5 5.0
Res
a C
, Res
a H
2, R
esa
CO
0
20
40
60
80
100
A/C vs resaC A/C vs resaH2 A/C vs resaCO
Figure 16: Thermodynamics data simulated using and adiabatic RGibbs reactor for a CPO process done with air and
preheating temperature of 623K
42 CHCOCOC
C
yyyyyYieldC
+++=
42 CHCOCOC
CO
yyyyyYieldCO
+++=
42 CHCOCOC
CO
yyyyyYieldCO
+++=
53
It is important to stress that the reported estimation have a qualitative significance because it is based on particular assumptions; in fact, the reactor is assumed to be adiabatic and the thermodynamic parameters of carbon are assumed to be the parameters of graphite. For these reasons, experimentally, it is preferred to work in conservative condition (referred to coke formation), so an air/methane ratio of about 3.125 is assumed, in order to be sure to avoid coke formation. On the basis of previous considerations, the experimental program, at fixed Air/CH4 ratio and fixed preheating temperature, foresees runs at different H2O/CH4 ratios (in the range 0-2) and at different the total flow rates, in the range 1.5-6 Nl/min.
KINETIC MODEL In the present work, according to literature information, the ATR (autothermal reforming) is defined as the combination between CPO (catalytic partial oxidation) and SR (steam reforming), at operative conditions that allows the process to be autothermic; it is important to note that also the CPO is potentially an autothermal process. During the evolution of this type of processes, the chemical compounds that have to be taken in account are CH4, H2O, O2, N2, CO2, CO, H2, C; among these, CH4, H2O, O2, N2 constitute the feed (nitrogen has to be considered when the oxygen is fed through air).
MECHANISM AND KINETIC SCHEME From a literature investigation on the reactive mechanism of the CPO and ATR processes, it is clear that there are two possibilities, that is, direct and indirect mechanism [4], [3], depending on the catalyst and on the support. Substantially, the direct mechanism foresees the direct conversion of the methane in CO and H2 according to the following reaction: CH4 + ½ O2 → CO + 2H2 partial oxidation this reaction is obviously in competition with the total oxidation and with the reforming reactions.
54
The indirect mechanism, instead, foresees only the total combustion reaction with the production of CO2, H2O and heat. This step allows the development of the endothermic reactions of reforming: in fact, the produced H2O is a reactant for the refroming reactions, and the heat released in the first step substains the endothermicity of the steam reforming process. In the case of commercial Nickel supported on alumina, it is well known that the mechanism is indirect [43], [44], [45] so it is possible to write the following reactions:
1) CH4 + 2O2 → CO2 + 2H2O total combustion
2) CH4 + H2O ↔ CO + 3H2 steam reforming a CO 3) CO + H2O ↔ CO2 + H2 CO shift
4) CH4 + 2H2O ↔ CO2 + 4H2 direct steam reforming to CO2
5) 2CO ↔ C + CO2 Boudouard reaction
6) CH4 ↔ C + 2H2 cracking
7) C + H2O ↔ CO + H2 carbon gasification with H2O
8) C+ O2 ↔ CO2 carbon gasification with O2
Generally, it is important to know the weight of the reactions numbers 5 and 8 on the processes economy. From literature indications based on different thermodynamic criteria, it is clear that these reactions, in general, are negligible. In fact, a detailed analysis of these reactions by means of a model that well describes also carbon production and gasification is impossible, for the absences of reliable kinetic data. At the moment, De Groote et al. [43] only had a kinetic approach to this problem, but they used kinetic data not published; Van Hook [46] and Wagner e Froment [47] instead, proposed a thermodynamic criteria applied in order to eliminate coke formation. In the present work, the thermodynamic analysis shown in the previous paragraph is used to evaluate the experimental conditions that avoid coke formation.
55
EQUATIONS OF KINETIC SCHEME Based on the previous considerations the target reaction network is completely identified:
1) CH4 + 2O2 → CO2 + 2H2O ΔH(298) = -802000 KJ/Kmol
2) CH4 + H2O ↔ CO + 3H2 ΔH(298) = 206000 KJ/Kmol 3) CO + H2O ↔ CO2 + H2 ΔH(298) = -41000 KJ/Kmol
4) CH4 + 2H2O ↔ CO2 + 4H2 ΔH(298) = 165000 KJ/Kmol
Related to this reaction network, there are many studies devoted to determinate reliable kinetic model. Obviously, for catalytic processes, the determinations of the kinetic model is various and debated, since it is strongly affected by the catalyst (first of all, it is affected by the active site, but also by eventual chemical promoter in addition to the active site). On the other hand, since the research on the catalysis of this process is continually in evolution, at the moment a catalyst standard does not exist, so the references are the industrial ones; among these, the most used is the nickel catalyst.
KINETIC EVOLUTION OF THE PROCESSES Once the reaction network is known, the successive step is the individuation of temporal evolution of these processes; in other words, it is important to determinate how the processes develop (series or parallel). Since the feed of autothermal reforming is constituted by methane, water and oxygen, it is possible to imagine that the reactions develop at the same time (in parallel), but this is a wrong conclusion, because the processes are catalyzed, so it is important to know the conditions, imposed by the catalyst, that promote one reaction instead of another. To this aim, it is important to note that the activation of a Nickel catalyst toward reforming processes is obtained by reducing it; this operation is physically reliable by making a reduction of the catalyst, for example, with a stream of hydrogen at high temperature (about 900 K) in situ (because the catalyst in contact with air re-oxides itself). However,
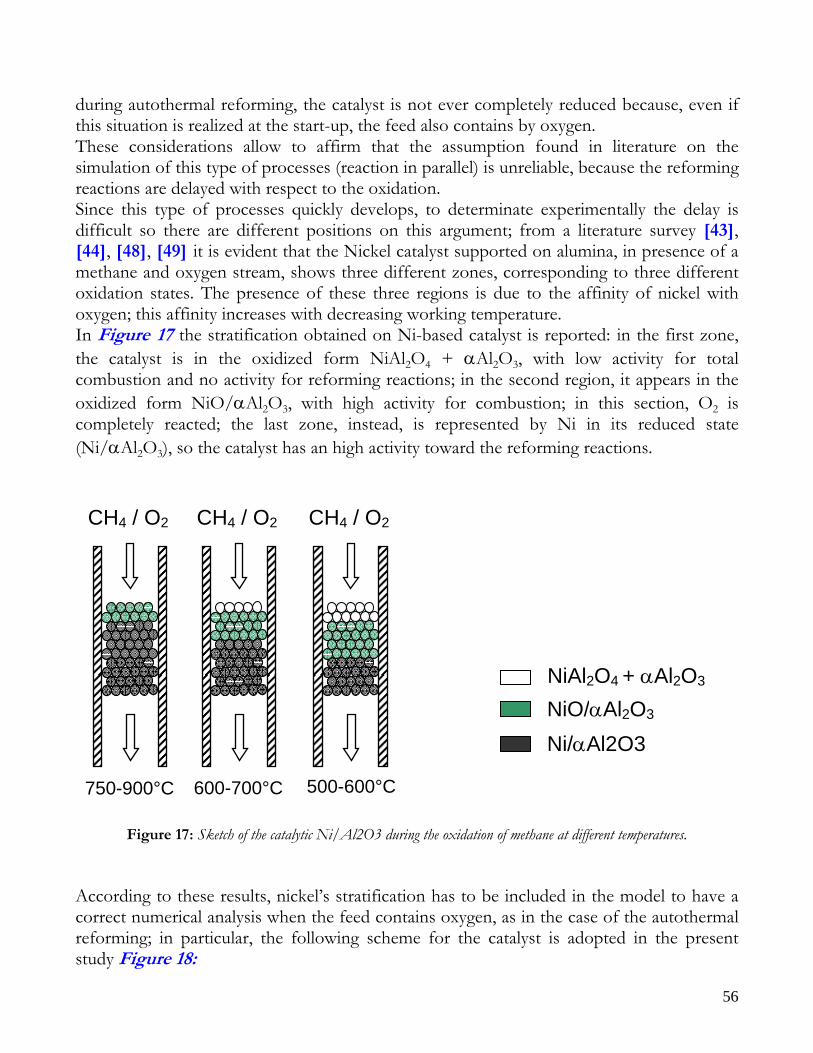
56
during autothermal reforming, the catalyst is not ever completely reduced because, even if this situation is realized at the start-up, the feed also contains by oxygen. These considerations allow to affirm that the assumption found in literature on the simulation of this type of processes (reaction in parallel) is unreliable, because the reforming reactions are delayed with respect to the oxidation. Since this type of processes quickly develops, to determinate experimentally the delay is difficult so there are different positions on this argument; from a literature survey [43], [44], [48], [49] it is evident that the Nickel catalyst supported on alumina, in presence of a methane and oxygen stream, shows three different zones, corresponding to three different oxidation states. The presence of these three regions is due to the affinity of nickel with oxygen; this affinity increases with decreasing working temperature. In Figure 17 the stratification obtained on Ni-based catalyst is reported: in the first zone, the catalyst is in the oxidized form NiAl2O4 + αAl2O3, with low activity for total combustion and no activity for reforming reactions; in the second region, it appears in the oxidized form NiO/αAl2O3, with high activity for combustion; in this section, O2 is completely reacted; the last zone, instead, is represented by Ni in its reduced state (Ni/αAl2O3), so the catalyst has an high activity toward the reforming reactions.
Figure 17: Sketch of the catalytic Ni/Al2O3 during the oxidation of methane at different temperatures. According to these results, nickel’s stratification has to be included in the model to have a correct numerical analysis when the feed contains oxygen, as in the case of the autothermal reforming; in particular, the following scheme for the catalyst is adopted in the present study Figure 18:
CH4 / O2 CH4 / O2 CH4 / O2
750-900°C 600-700°C 500-600°C
NiO/αAl2O3
Ni/αAl2O3
NiAl2O4 + αAl2O3
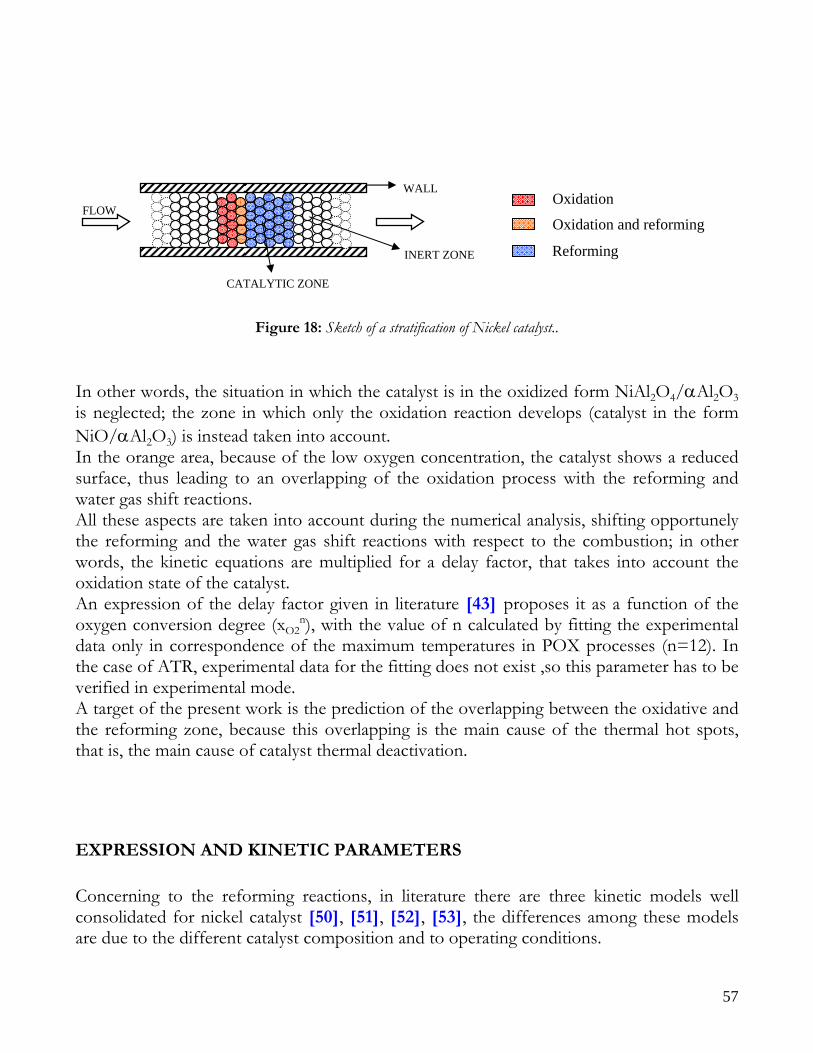
57
Figure 18: Sketch of a stratification of Nickel catalyst.. In other words, the situation in which the catalyst is in the oxidized form NiAl2O4/αAl2O3 is neglected; the zone in which only the oxidation reaction develops (catalyst in the form NiO/αAl2O3) is instead taken into account. In the orange area, because of the low oxygen concentration, the catalyst shows a reduced surface, thus leading to an overlapping of the oxidation process with the reforming and water gas shift reactions. All these aspects are taken into account during the numerical analysis, shifting opportunely the reforming and the water gas shift reactions with respect to the combustion; in other words, the kinetic equations are multiplied for a delay factor, that takes into account the oxidation state of the catalyst. An expression of the delay factor given in literature [43] proposes it as a function of the oxygen conversion degree (xO2
n), with the value of n calculated by fitting the experimental data only in correspondence of the maximum temperatures in POX processes (n=12). In the case of ATR, experimental data for the fitting does not exist ,so this parameter has to be verified in experimental mode. A target of the present work is the prediction of the overlapping between the oxidative and the reforming zone, because this overlapping is the main cause of the thermal hot spots, that is, the main cause of catalyst thermal deactivation.
EXPRESSION AND KINETIC PARAMETERS Concerning to the reforming reactions, in literature there are three kinetic models well consolidated for nickel catalyst [50], [51], [52], [53], the differences among these models are due to the different catalyst composition and to operating conditions.
WALL
INERT ZONE
FLOW
CATALYTIC ZONE
Oxidation
Oxidation and reforming
Reforming
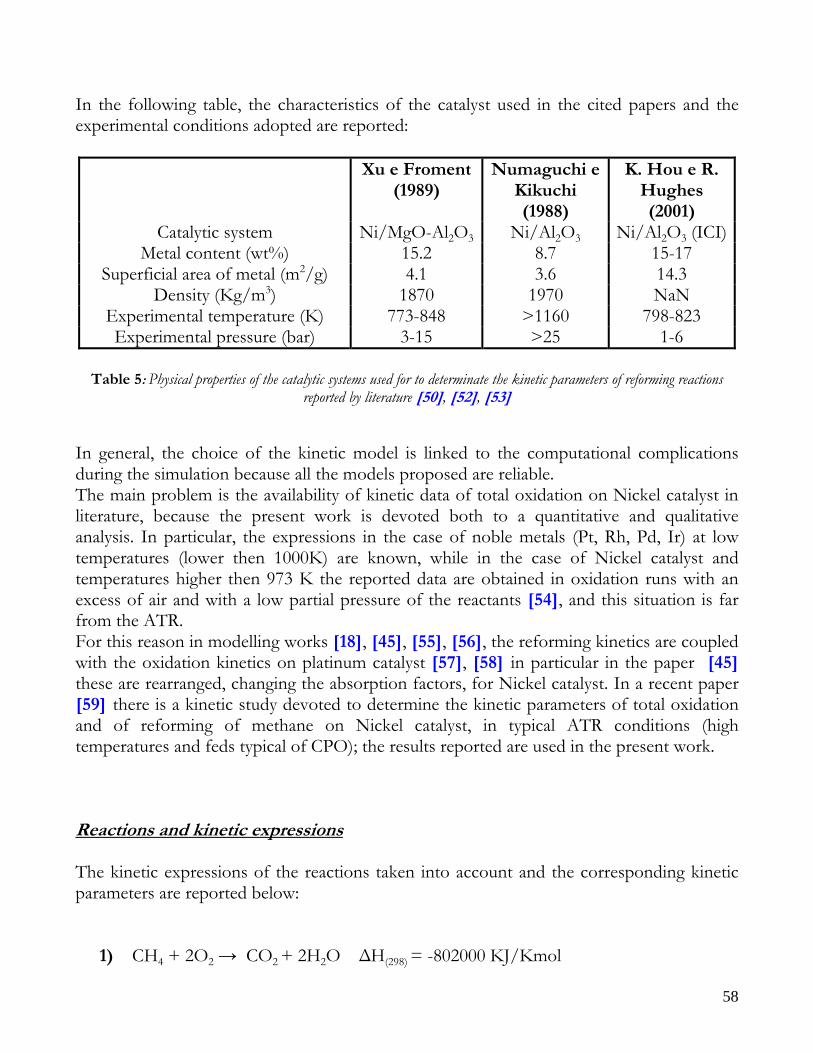
58
In the following table, the characteristics of the catalyst used in the cited papers and the experimental conditions adopted are reported:
Xu e Froment (1989)
Numaguchi e Kikuchi (1988)
K. Hou e R. Hughes (2001)
Catalytic system Ni/MgO-Al2O3 Ni/Al2O3 Ni/Al2O3 (ICI)Metal content (wt%) 15.2 8.7 15-17
Superficial area of metal (m2/g) 4.1 3.6 14.3 Density (Kg/m3) 1870 1970 NaN
Experimental temperature (K) 773-848 >1160 798-823 Experimental pressure (bar) 3-15 >25 1-6
Table 5: Physical properties of the catalytic systems used for to determinate the kinetic parameters of reforming reactions
reported by literature [50], [52], [53] In general, the choice of the kinetic model is linked to the computational complications during the simulation because all the models proposed are reliable. The main problem is the availability of kinetic data of total oxidation on Nickel catalyst in literature, because the present work is devoted both to a quantitative and qualitative analysis. In particular, the expressions in the case of noble metals (Pt, Rh, Pd, Ir) at low temperatures (lower then 1000K) are known, while in the case of Nickel catalyst and temperatures higher then 973 K the reported data are obtained in oxidation runs with an excess of air and with a low partial pressure of the reactants [54], and this situation is far from the ATR. For this reason in modelling works [18], [45], [55], [56], the reforming kinetics are coupled with the oxidation kinetics on platinum catalyst [57], [58] in particular in the paper [45] these are rearranged, changing the absorption factors, for Nickel catalyst. In a recent paper [59] there is a kinetic study devoted to determine the kinetic parameters of total oxidation and of reforming of methane on Nickel catalyst, in typical ATR conditions (high temperatures and feds typical of CPO); the results reported are used in the present work. Reactions and kinetic expressions The kinetic expressions of the reactions taken into account and the corresponding kinetic parameters are reported below:
1) CH4 + 2O2 → CO2 + 2H2O ΔH(298) = -802000 KJ/Kmol
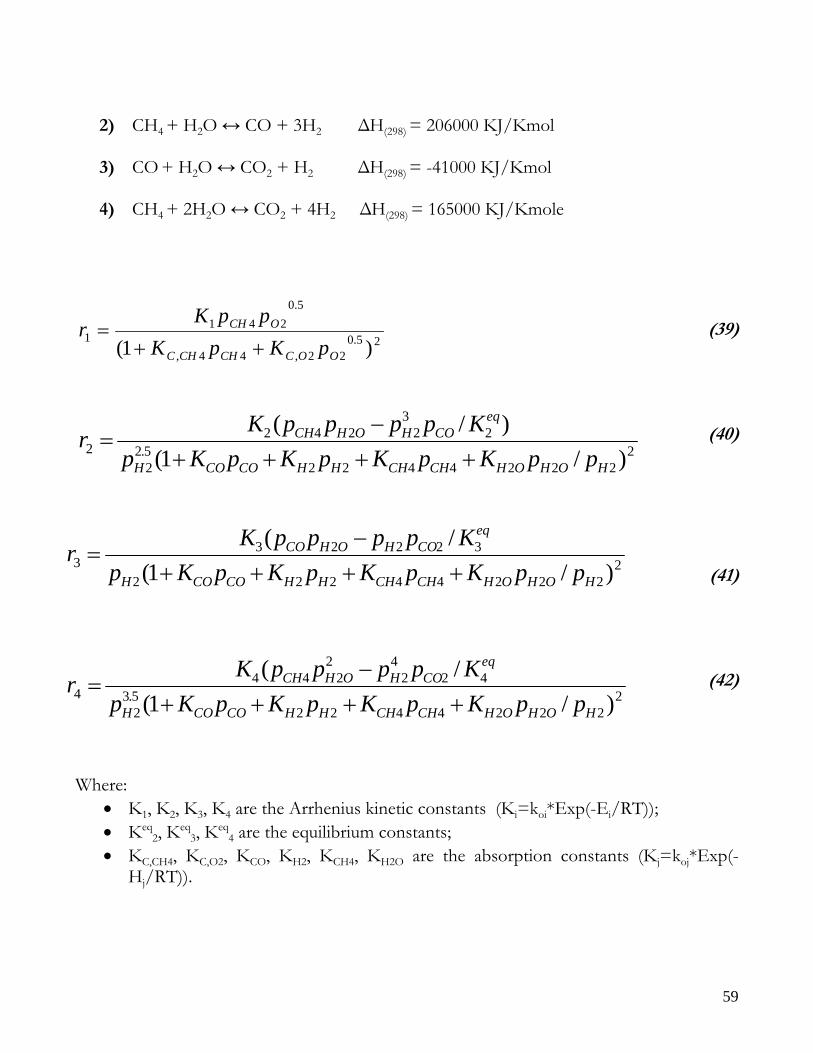
59
2) CH4 + H2O ↔ CO + 3H2 ΔH(298) = 206000 KJ/Kmol 3) CO + H2O ↔ CO2 + H2 ΔH(298) = -41000 KJ/Kmol
4) CH4 + 2H2O ↔ CO2 + 4H2 ΔH(298) = 165000 KJ/Kmole
(39)
(40)
(41)
(42)
Where:
• K1, K2, K3, K4 are the Arrhenius kinetic constants (Ki=koi*Exp(-Ei/RT)); • Keq
2, Keq3, Keq
4 are the equilibrium constants; • KC,CH4, KC,O2, KCO, KH2, KCH4, KH2O are the absorption constants (Kj=koj*Exp(-
Hj/RT)).
25.022,44,
5.0241
1 )1( OOCCHCHC
OCH
pKpKppK
r++
=
22224422
5.22
23
22422 )/1(
)/(
HOHOHCHCHHHCOCOH
eqCOHOHCH
ppKpKpKpKpKppppK
r++++
−=
222244222
322233 )/1(
/(
HOHOHCHCHHHCOCOH
eqCOHOHCO
ppKpKpKpKpKppppK
r++++
−=
22224422
5.32
424
22
2444 )/1(
/(
HOHOHCHCHHHCOCOH
eqCOHOHCH
ppKpKpKpKpKppppK
r++++
−=
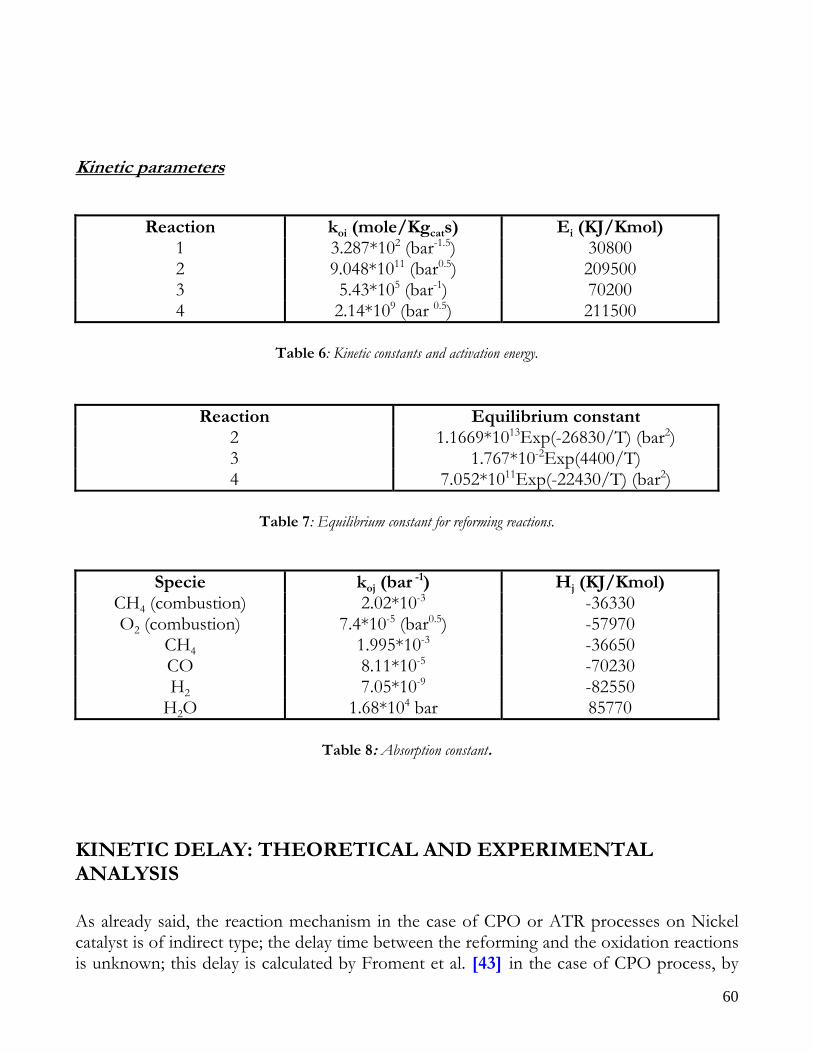
60
Kinetic parameters
Reaction koi (mole/Kgcats) Ei (KJ/Kmol) 1 3.287*102 (bar-1.5) 30800 2 9.048*1011 (bar0.5) 209500 3 5.43*105 (bar-1) 70200 4 2.14*109 (bar 0.5) 211500
Table 6: Kinetic constants and activation energy.
Reaction Equilibrium constant 2 1.1669*1013Exp(-26830/T) (bar2) 3 1.767*10-2Exp(4400/T) 4 7.052*1011Exp(-22430/T) (bar2)
Table 7: Equilibrium constant for reforming reactions.
Specie koj (bar -1) Hj (KJ/Kmol) CH4 (combustion) 2.02*10-3 -36330 O2 (combustion) 7.4*10-5 (bar0.5) -57970
CH4 1.995*10-3 -36650 CO 8.11*10-5 -70230 H2 7.05*10-9 -82550
H2O 1.68*104 bar 85770
Table 8: Absorption constant.
KINETIC DELAY: THEORETICAL AND EXPERIMENTAL ANALYSIS As already said, the reaction mechanism in the case of CPO or ATR processes on Nickel catalyst is of indirect type; the delay time between the reforming and the oxidation reactions is unknown; this delay is calculated by Froment et al. [43] in the case of CPO process, by
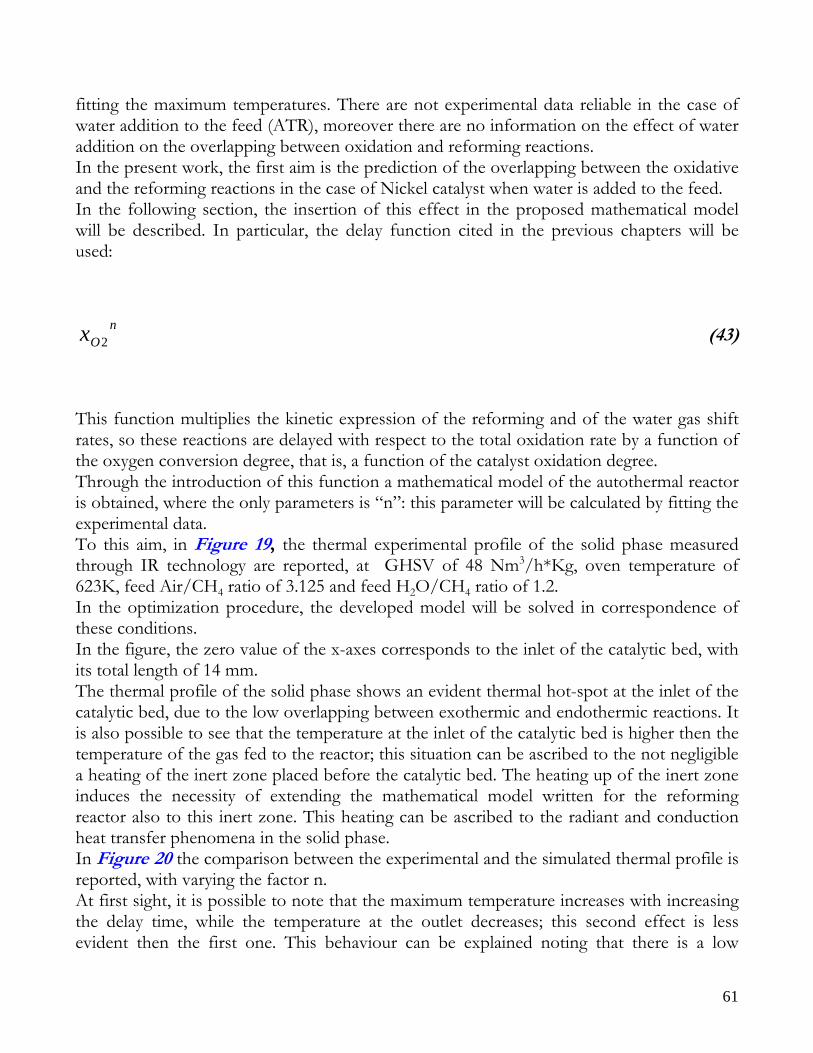
61
fitting the maximum temperatures. There are not experimental data reliable in the case of water addition to the feed (ATR), moreover there are no information on the effect of water addition on the overlapping between oxidation and reforming reactions. In the present work, the first aim is the prediction of the overlapping between the oxidative and the reforming reactions in the case of Nickel catalyst when water is added to the feed. In the following section, the insertion of this effect in the proposed mathematical model will be described. In particular, the delay function cited in the previous chapters will be used:
(43)
This function multiplies the kinetic expression of the reforming and of the water gas shift rates, so these reactions are delayed with respect to the total oxidation rate by a function of the oxygen conversion degree, that is, a function of the catalyst oxidation degree. Through the introduction of this function a mathematical model of the autothermal reactor is obtained, where the only parameters is “n”: this parameter will be calculated by fitting the experimental data. To this aim, in Figure 19, the thermal experimental profile of the solid phase measured through IR technology are reported, at GHSV of 48 Nm3/h*Kg, oven temperature of 623K, feed Air/CH4 ratio of 3.125 and feed H2O/CH4 ratio of 1.2. In the optimization procedure, the developed model will be solved in correspondence of these conditions. In the figure, the zero value of the x-axes corresponds to the inlet of the catalytic bed, with its total length of 14 mm. The thermal profile of the solid phase shows an evident thermal hot-spot at the inlet of the catalytic bed, due to the low overlapping between exothermic and endothermic reactions. It is also possible to see that the temperature at the inlet of the catalytic bed is higher then the temperature of the gas fed to the reactor; this situation can be ascribed to the not negligible a heating of the inert zone placed before the catalytic bed. The heating up of the inert zone induces the necessity of extending the mathematical model written for the reforming reactor also to this inert zone. This heating can be ascribed to the radiant and conduction heat transfer phenomena in the solid phase. In Figure 20 the comparison between the experimental and the simulated thermal profile is reported, with varying the factor n. At first sight, it is possible to note that the maximum temperature increases with increasing the delay time, while the temperature at the outlet decreases; this second effect is less evident then the first one. This behaviour can be explained noting that there is a low
nOx 2
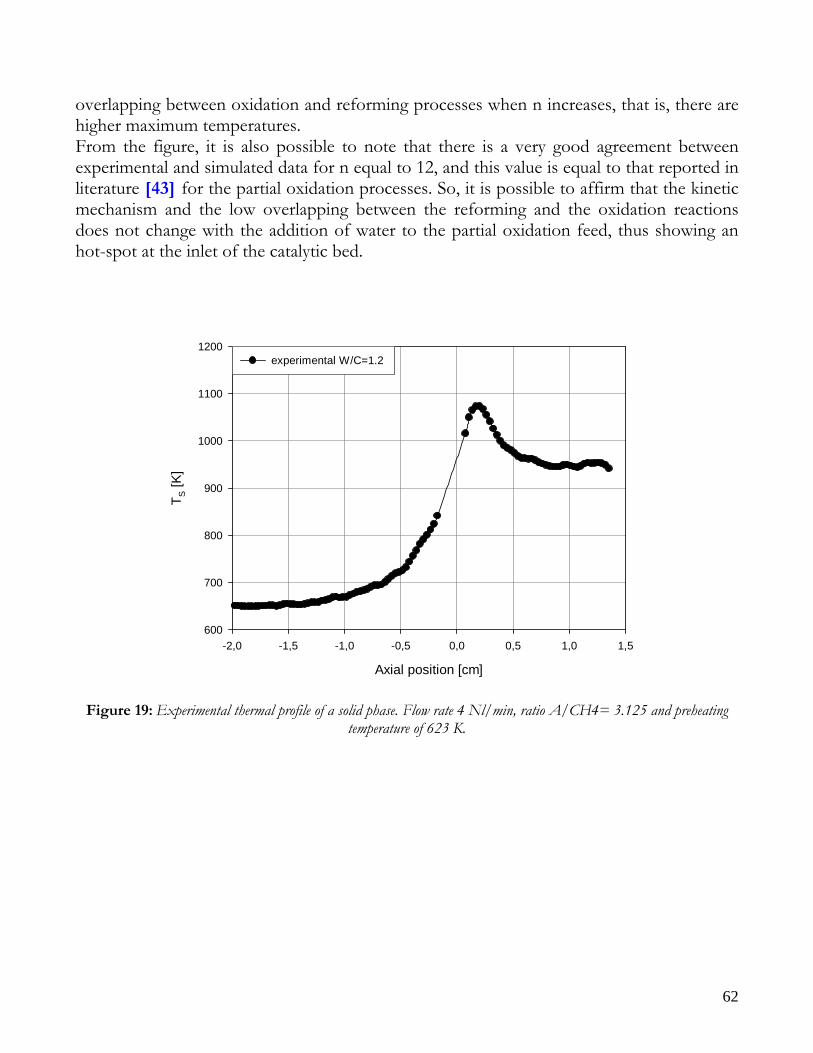
62
overlapping between oxidation and reforming processes when n increases, that is, there are higher maximum temperatures. From the figure, it is also possible to note that there is a very good agreement between experimental and simulated data for n equal to 12, and this value is equal to that reported in literature [43] for the partial oxidation processes. So, it is possible to affirm that the kinetic mechanism and the low overlapping between the reforming and the oxidation reactions does not change with the addition of water to the partial oxidation feed, thus showing an hot-spot at the inlet of the catalytic bed.
Axial position [cm]
-2,0 -1,5 -1,0 -0,5 0,0 0,5 1,0 1,5
T S [K
]
600
700
800
900
1000
1100
1200experimental W/C=1.2
Figure 19: Experimental thermal profile of a solid phase. Flow rate 4 Nl/min, ratio A/CH4= 3.125 and preheating temperature of 623 K.
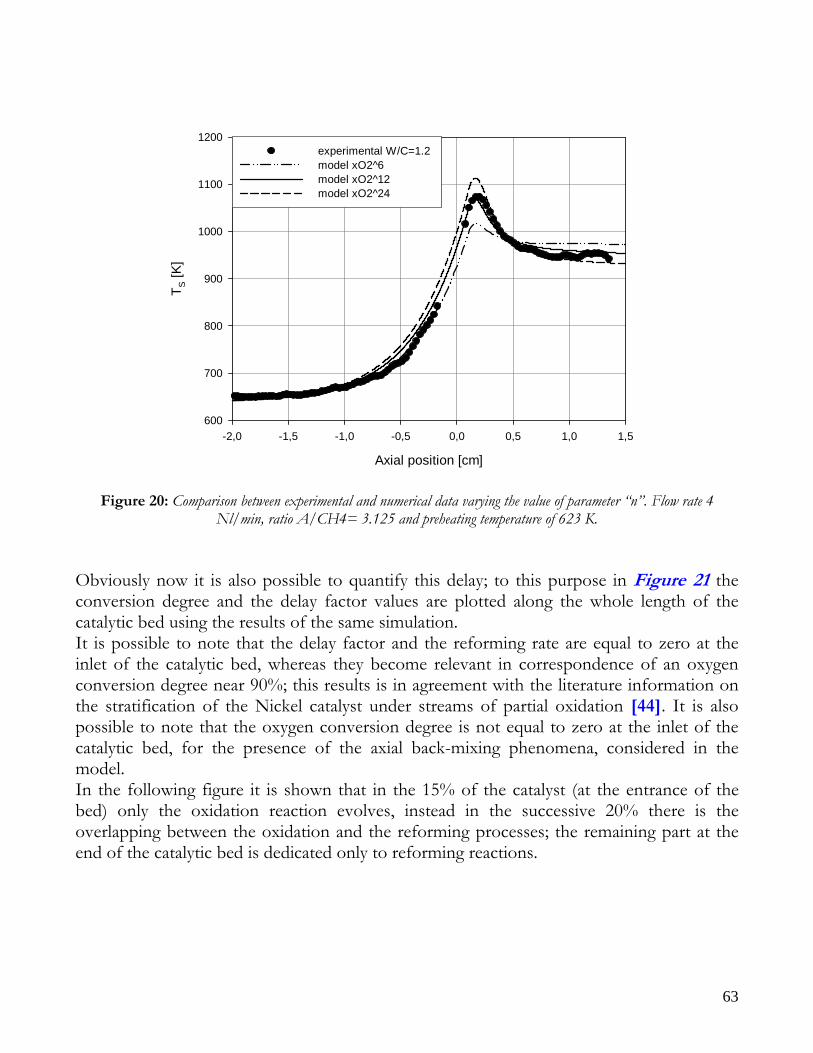
63
Axial position [cm]
-2,0 -1,5 -1,0 -0,5 0,0 0,5 1,0 1,5
T S [K
]
600
700
800
900
1000
1100
1200experimental W/C=1.2 model xO2^6model xO2^12model xO2^24
Figure 20: Comparison between experimental and numerical data varying the value of parameter “n”. Flow rate 4 Nl/min, ratio A/CH4= 3.125 and preheating temperature of 623 K.
Obviously now it is also possible to quantify this delay; to this purpose in Figure 21 the conversion degree and the delay factor values are plotted along the whole length of the catalytic bed using the results of the same simulation. It is possible to note that the delay factor and the reforming rate are equal to zero at the inlet of the catalytic bed, whereas they become relevant in correspondence of an oxygen conversion degree near 90%; this results is in agreement with the literature information on the stratification of the Nickel catalyst under streams of partial oxidation [44]. It is also possible to note that the oxygen conversion degree is not equal to zero at the inlet of the catalytic bed, for the presence of the axial back-mixing phenomena, considered in the model. In the following figure it is shown that in the 15% of the catalyst (at the entrance of the bed) only the oxidation reaction evolves, instead in the successive 20% there is the overlapping between the oxidation and the reforming processes; the remaining part at the end of the catalytic bed is dedicated only to reforming reactions.
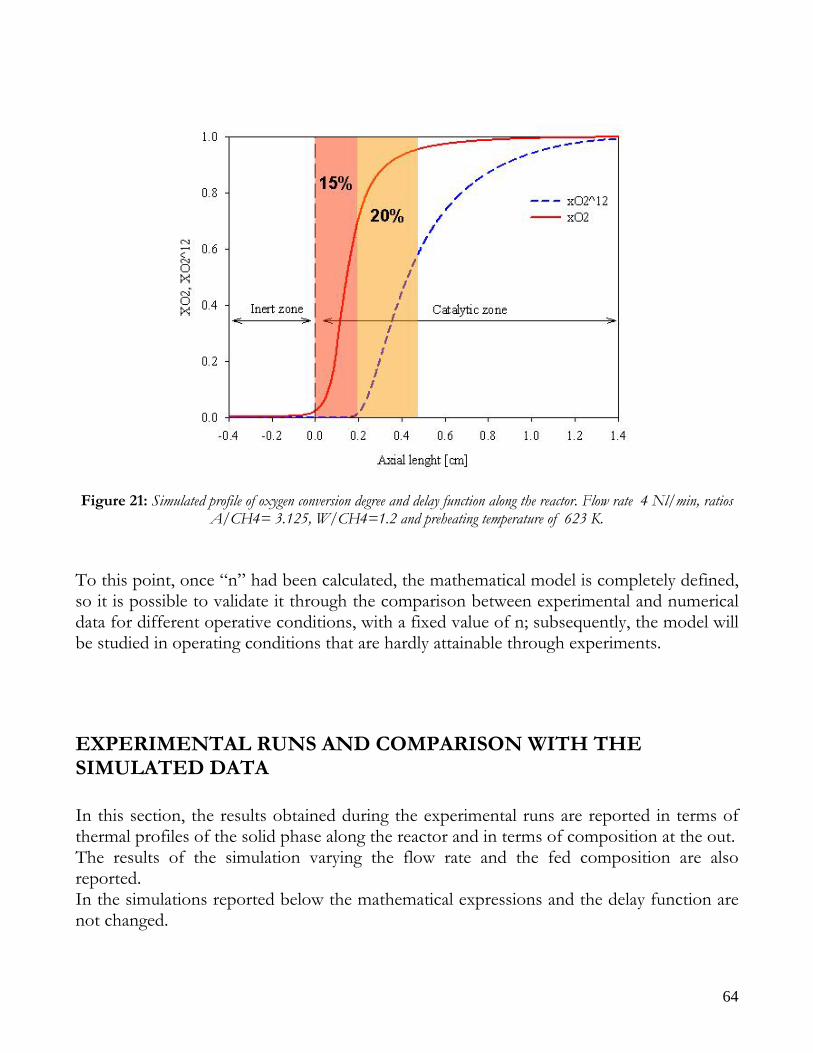
64
Figure 21: Simulated profile of oxygen conversion degree and delay function along the reactor. Flow rate 4 Nl/min, ratios
A/CH4= 3.125, W/CH4=1.2 and preheating temperature of 623 K. To this point, once “n” had been calculated, the mathematical model is completely defined, so it is possible to validate it through the comparison between experimental and numerical data for different operative conditions, with a fixed value of n; subsequently, the model will be studied in operating conditions that are hardly attainable through experiments.
EXPERIMENTAL RUNS AND COMPARISON WITH THE SIMULATED DATA In this section, the results obtained during the experimental runs are reported in terms of thermal profiles of the solid phase along the reactor and in terms of composition at the out. The results of the simulation varying the flow rate and the fed composition are also reported. In the simulations reported below the mathematical expressions and the delay function are not changed.
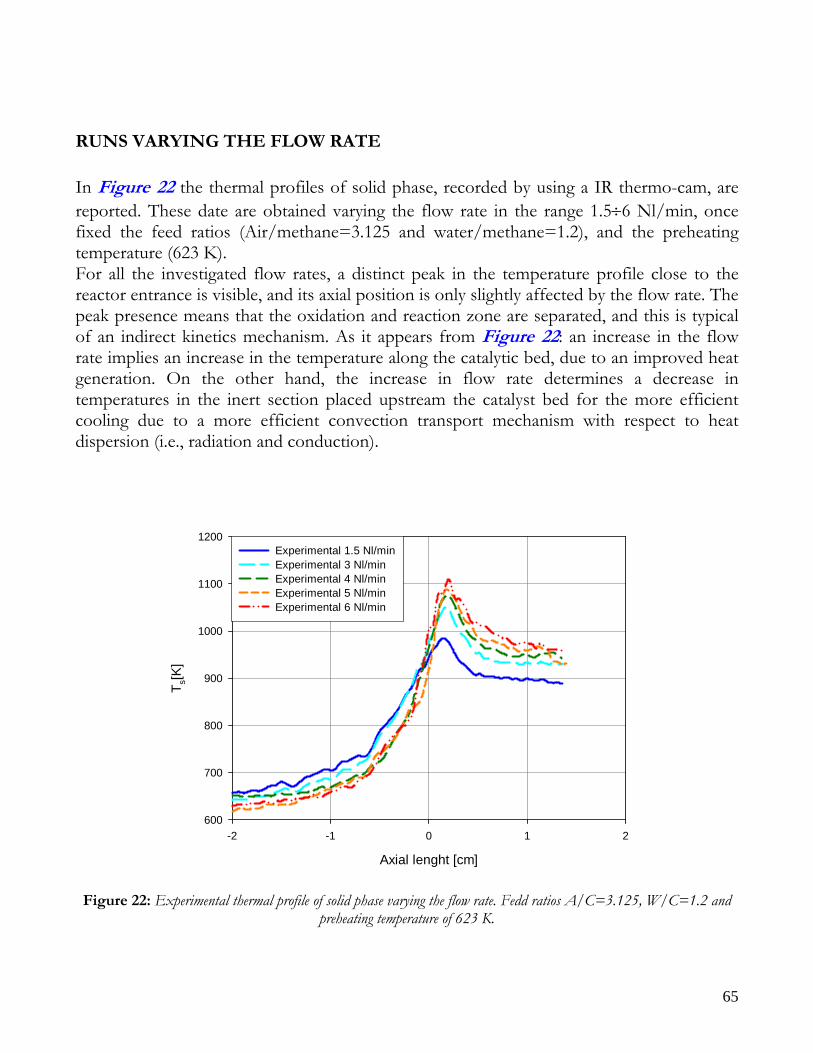
65
RUNS VARYING THE FLOW RATE In Figure 22 the thermal profiles of solid phase, recorded by using a IR thermo-cam, are reported. These date are obtained varying the flow rate in the range 1.5÷6 Nl/min, once fixed the feed ratios (Air/methane=3.125 and water/methane=1.2), and the preheating temperature (623 K). For all the investigated flow rates, a distinct peak in the temperature profile close to the reactor entrance is visible, and its axial position is only slightly affected by the flow rate. The peak presence means that the oxidation and reaction zone are separated, and this is typical of an indirect kinetics mechanism. As it appears from Figure 22: an increase in the flow rate implies an increase in the temperature along the catalytic bed, due to an improved heat generation. On the other hand, the increase in flow rate determines a decrease in temperatures in the inert section placed upstream the catalyst bed for the more efficient cooling due to a more efficient convection transport mechanism with respect to heat dispersion (i.e., radiation and conduction).
Axial lenght [cm]
-2 -1 0 1 2
T s[K]
600
700
800
900
1000
1100
1200Experimental 1.5 Nl/minExperimental 3 Nl/min Experimental 4 Nl/minExperimental 5 Nl/minExperimental 6 Nl/min
Figure 22: Experimental thermal profile of solid phase varying the flow rate. Fedd ratios A/C=3.125, W/C=1.2 and
preheating temperature of 623 K.
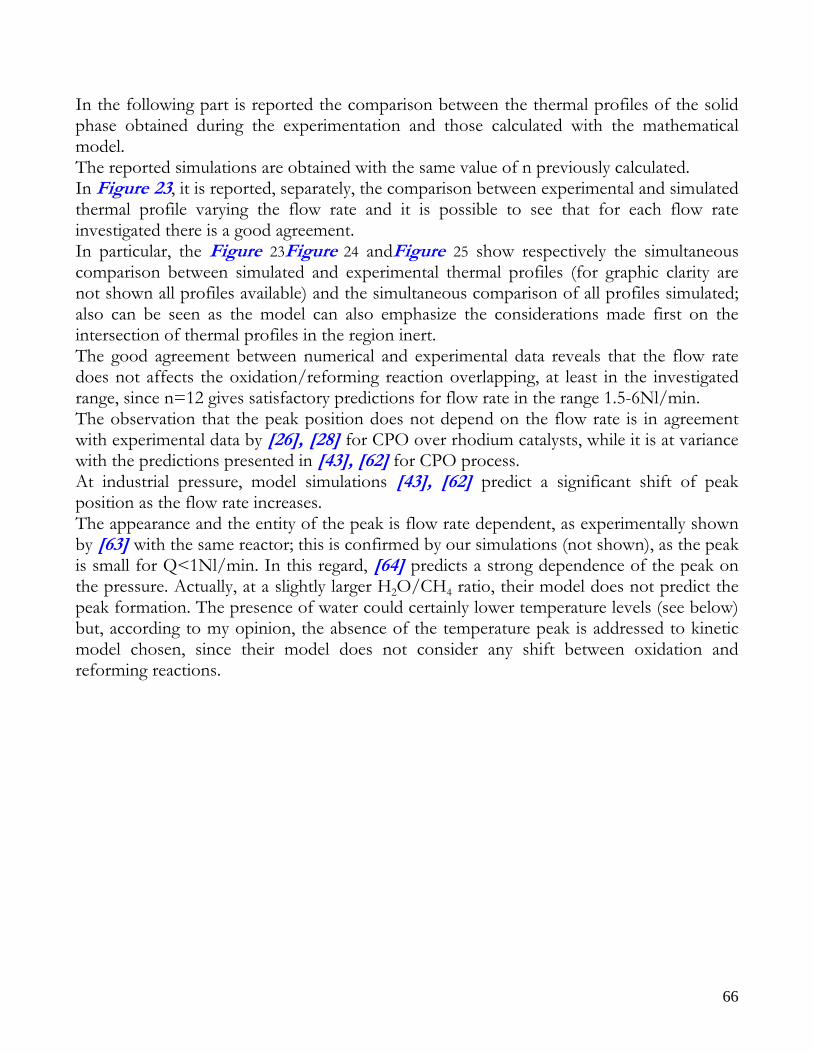
66
In the following part is reported the comparison between the thermal profiles of the solid phase obtained during the experimentation and those calculated with the mathematical model. The reported simulations are obtained with the same value of n previously calculated. In Figure 23, it is reported, separately, the comparison between experimental and simulated thermal profile varying the flow rate and it is possible to see that for each flow rate investigated there is a good agreement. In particular, the Figure 23Figure 24 andFigure 25 show respectively the simultaneous comparison between simulated and experimental thermal profiles (for graphic clarity are not shown all profiles available) and the simultaneous comparison of all profiles simulated; also can be seen as the model can also emphasize the considerations made first on the intersection of thermal profiles in the region inert. The good agreement between numerical and experimental data reveals that the flow rate does not affects the oxidation/reforming reaction overlapping, at least in the investigated range, since n=12 gives satisfactory predictions for flow rate in the range 1.5-6Nl/min. The observation that the peak position does not depend on the flow rate is in agreement with experimental data by [26], [28] for CPO over rhodium catalysts, while it is at variance with the predictions presented in [43], [62] for CPO process. At industrial pressure, model simulations [43], [62] predict a significant shift of peak position as the flow rate increases. The appearance and the entity of the peak is flow rate dependent, as experimentally shown by [63] with the same reactor; this is confirmed by our simulations (not shown), as the peak is small for Q<1Nl/min. In this regard, [64] predicts a strong dependence of the peak on the pressure. Actually, at a slightly larger H2O/CH4 ratio, their model does not predict the peak formation. The presence of water could certainly lower temperature levels (see below) but, according to my opinion, the absence of the temperature peak is addressed to kinetic model chosen, since their model does not consider any shift between oxidation and reforming reactions.
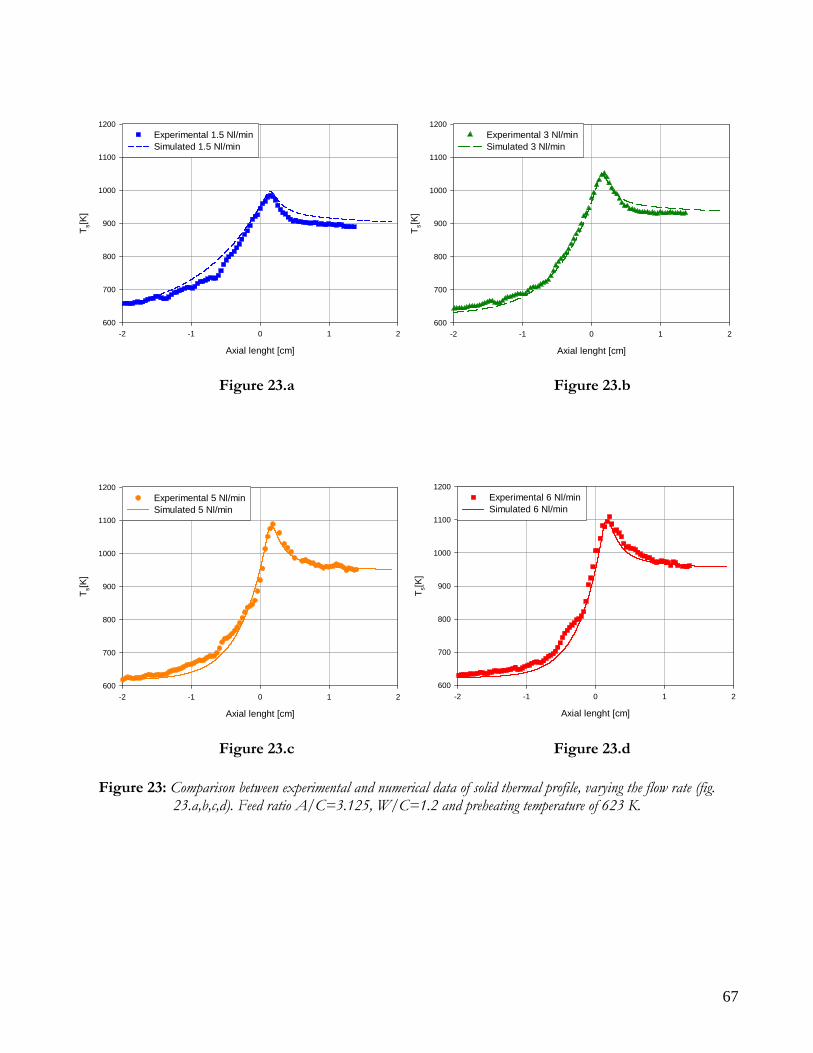
67
Axial lenght [cm]
-2 -1 0 1 2
T s[K]
600
700
800
900
1000
1100
1200Experimental 1.5 Nl/minSimulated 1.5 Nl/min
Figure 23.a Figure 23.b
Axial lenght [cm]
-2 -1 0 1 2
T s[K]
600
700
800
900
1000
1100
1200Experimental 5 Nl/minSimulated 5 Nl/min
Figure 23.c Figure 23.d
Figure 23: Comparison between experimental and numerical data of solid thermal profile, varying the flow rate (fig. 23.a,b,c,d). Feed ratio A/C=3.125, W/C=1.2 and preheating temperature of 623 K.
Axial lenght [cm]
-2 -1 0 1 2
T s[K]
600
700
800
900
1000
1100
1200Experimental 3 Nl/minSimulated 3 Nl/min
Axial lenght [cm]
-2 -1 0 1 2
T s[K]
600
700
800
900
1000
1100
1200Experimental 6 Nl/minSimulated 6 Nl/min
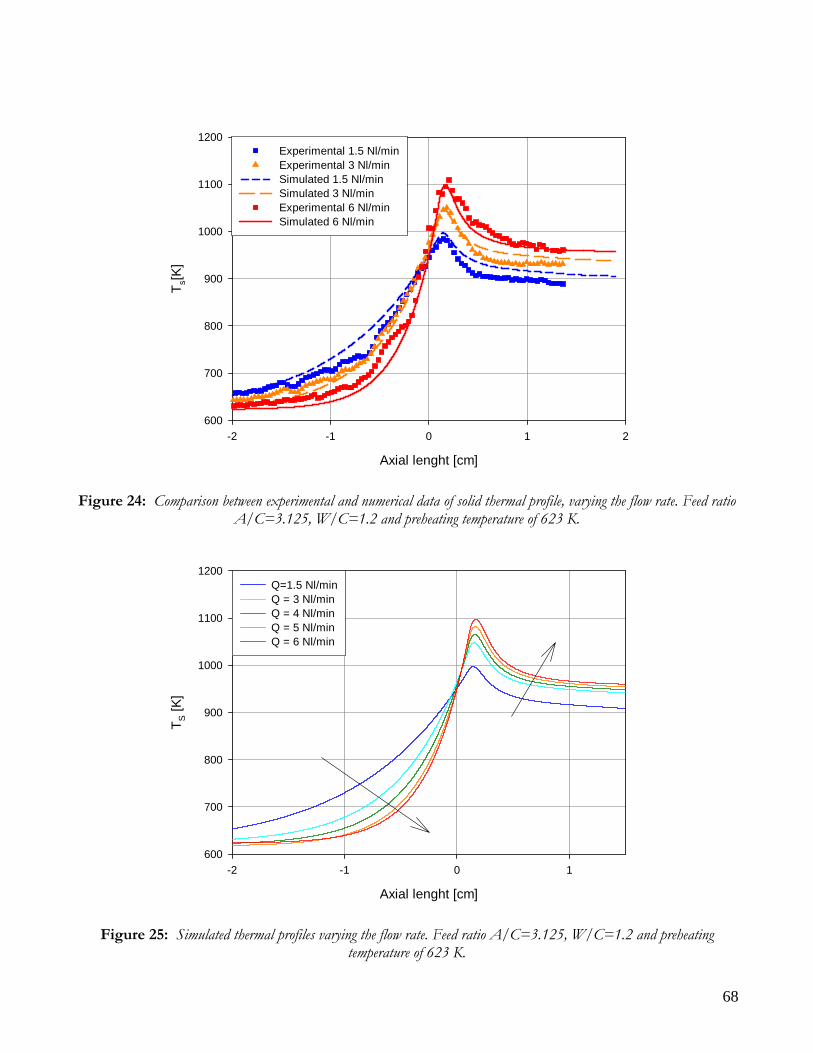
68
Axial lenght [cm]
-2 -1 0 1 2
T s[K]
600
700
800
900
1000
1100
1200Experimental 1.5 Nl/minExperimental 3 Nl/minSimulated 1.5 Nl/min Simulated 3 Nl/minExperimental 6 Nl/minSimulated 6 Nl/min
Figure 24: Comparison between experimental and numerical data of solid thermal profile, varying the flow rate. Feed ratio
A/C=3.125, W/C=1.2 and preheating temperature of 623 K.
Axial lenght [cm]
-2 -1 0 1
T S [K
]
600
700
800
900
1000
1100
1200Q=1.5 Nl/minQ = 3 Nl/minQ = 4 Nl/minQ = 5 Nl/minQ = 6 Nl/min
Figure 25: Simulated thermal profiles varying the flow rate. Feed ratio A/C=3.125, W/C=1.2 and preheating temperature of 623 K.
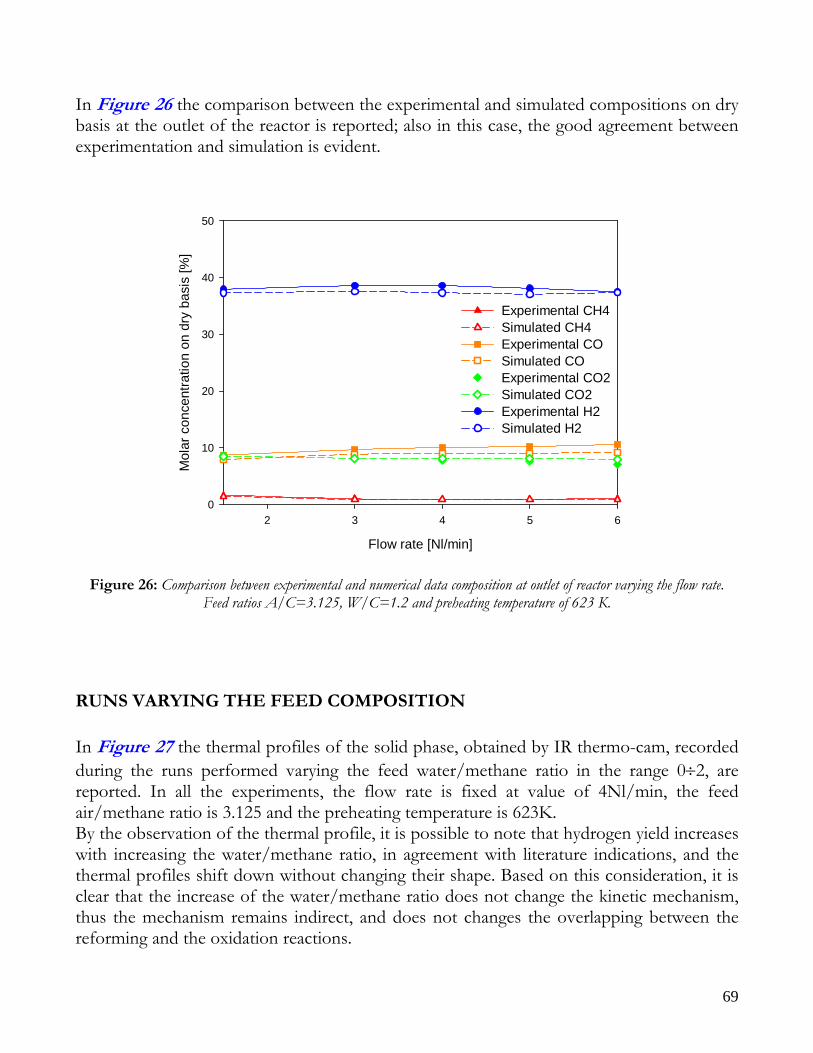
69
In Figure 26 the comparison between the experimental and simulated compositions on dry basis at the outlet of the reactor is reported; also in this case, the good agreement between experimentation and simulation is evident.
Flow rate [Nl/min]
2 3 4 5 6
Mol
ar c
once
ntra
tion
on d
ry b
asis
[%]
0
10
20
30
40
50
Experimental CH4Simulated CH4Experimental COSimulated COExperimental CO2Simulated CO2Experimental H2Simulated H2
Figure 26: Comparison between experimental and numerical data composition at outlet of reactor varying the flow rate. Feed ratios A/C=3.125, W/C=1.2 and preheating temperature of 623 K.
RUNS VARYING THE FEED COMPOSITION In Figure 27 the thermal profiles of the solid phase, obtained by IR thermo-cam, recorded during the runs performed varying the feed water/methane ratio in the range 0÷2, are reported. In all the experiments, the flow rate is fixed at value of 4Nl/min, the feed air/methane ratio is 3.125 and the preheating temperature is 623K. By the observation of the thermal profile, it is possible to note that hydrogen yield increases with increasing the water/methane ratio, in agreement with literature indications, and the thermal profiles shift down without changing their shape. Based on this consideration, it is clear that the increase of the water/methane ratio does not change the kinetic mechanism, thus the mechanism remains indirect, and does not changes the overlapping between the reforming and the oxidation reactions.
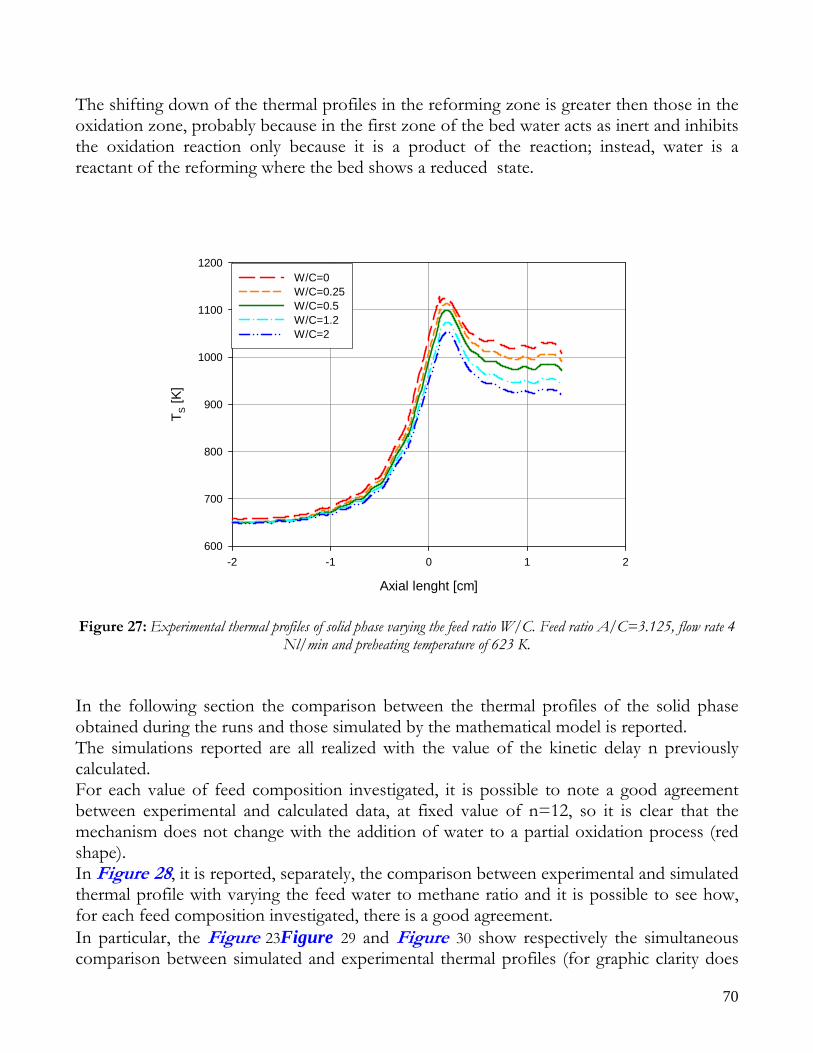
70
The shifting down of the thermal profiles in the reforming zone is greater then those in the oxidation zone, probably because in the first zone of the bed water acts as inert and inhibits the oxidation reaction only because it is a product of the reaction; instead, water is a reactant of the reforming where the bed shows a reduced state.
Axial lenght [cm]
-2 -1 0 1 2
T S [K
]
600
700
800
900
1000
1100
1200W/C=0 W/C=0.25W/C=0.5W/C=1.2W/C=2
Figure 27: Experimental thermal profiles of solid phase varying the feed ratio W/C. Feed ratio A/C=3.125, flow rate 4
Nl/min and preheating temperature of 623 K. In the following section the comparison between the thermal profiles of the solid phase obtained during the runs and those simulated by the mathematical model is reported. The simulations reported are all realized with the value of the kinetic delay n previously calculated. For each value of feed composition investigated, it is possible to note a good agreement between experimental and calculated data, at fixed value of n=12, so it is clear that the mechanism does not change with the addition of water to a partial oxidation process (red shape). In Figure 28, it is reported, separately, the comparison between experimental and simulated thermal profile with varying the feed water to methane ratio and it is possible to see how, for each feed composition investigated, there is a good agreement. In particular, the Figure 23Figure 29 and Figure 30 show respectively the simultaneous comparison between simulated and experimental thermal profiles (for graphic clarity does
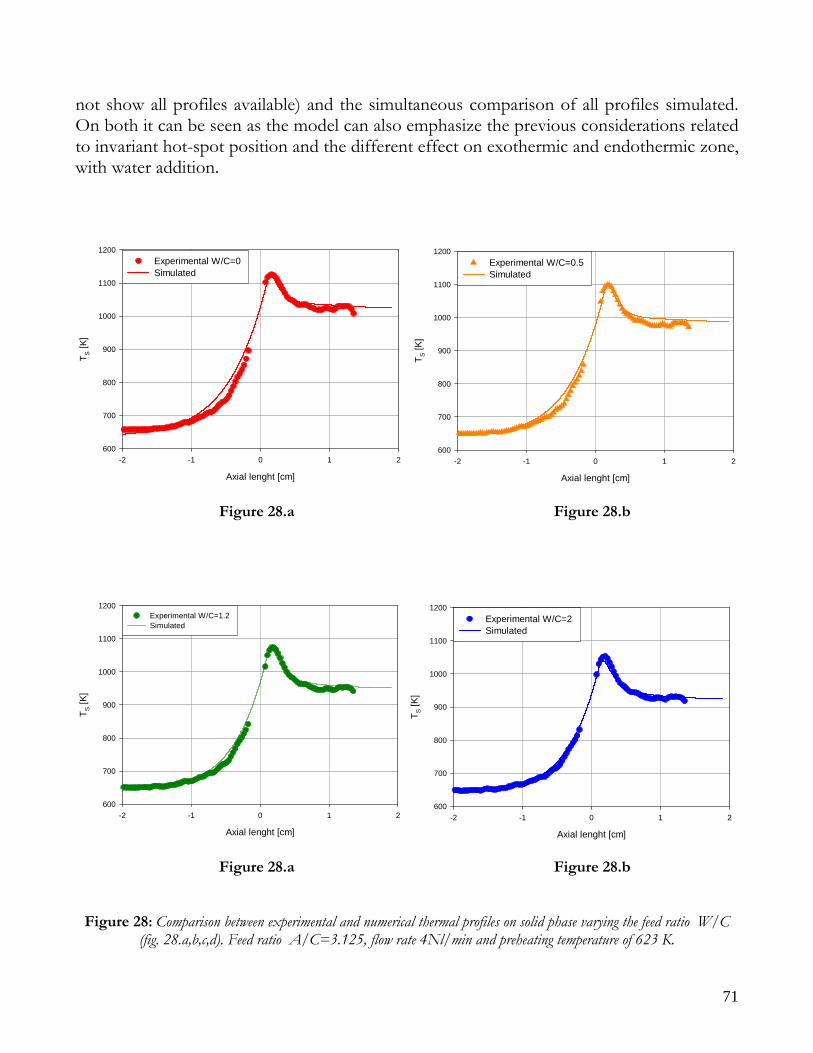
71
not show all profiles available) and the simultaneous comparison of all profiles simulated. On both it can be seen as the model can also emphasize the previous considerations related to invariant hot-spot position and the different effect on exothermic and endothermic zone, with water addition.
Axial lenght [cm]
-2 -1 0 1 2
T S [K
]
600
700
800
900
1000
1100
1200Experimental W/C=0 Simulated
Figure 28.a Figure 28.b
Axial lenght [cm]
-2 -1 0 1 2
T S [K
]
600
700
800
900
1000
1100
1200Experimental W/C=1.2 Simulated
Figure 28.a Figure 28.b
Figure 28: Comparison between experimental and numerical thermal profiles on solid phase varying the feed ratio W/C (fig. 28.a,b,c,d). Feed ratio A/C=3.125, flow rate 4Nl/min and preheating temperature of 623 K.
Axial lenght [cm]
-2 -1 0 1 2
T S [K
]
600
700
800
900
1000
1100
1200Experimental W/C=0.5 Simulated
Axial lenght [cm]
-2 -1 0 1 2
T S [K
]
600
700
800
900
1000
1100
1200Experimental W/C=2 Simulated

72
Axial lenght [cm]
-2 -1 0 1 2
T S [K
]
600
700
800
900
1000
1100
1200Experimental W/C=0 Simulated W/C=0 Experimental W/C=0.5Simulated W/C=0.5Experimental W/C=2Simulated W/C=2
Figure 29: Comparison between experimental and numerical data of solid thermal profile, varying the feed ratio W/C. Feed ratio A/C=3.125, flow rate 4Nl/min and preheating temperature of 623 K.
Axial lenght [cm]
-2 -1 0 1
T S [K
]
600
700
800
900
1000
1100
1200W/C = 0W/C = 0.25W/C = 0.5W/C = 1.2W/C = 2
Figure 30: Simulated thermal profiles of solid phase. Feed ratio A/C=3.125, flow rate 4 Nl/min and preheating temperature of 623 K.
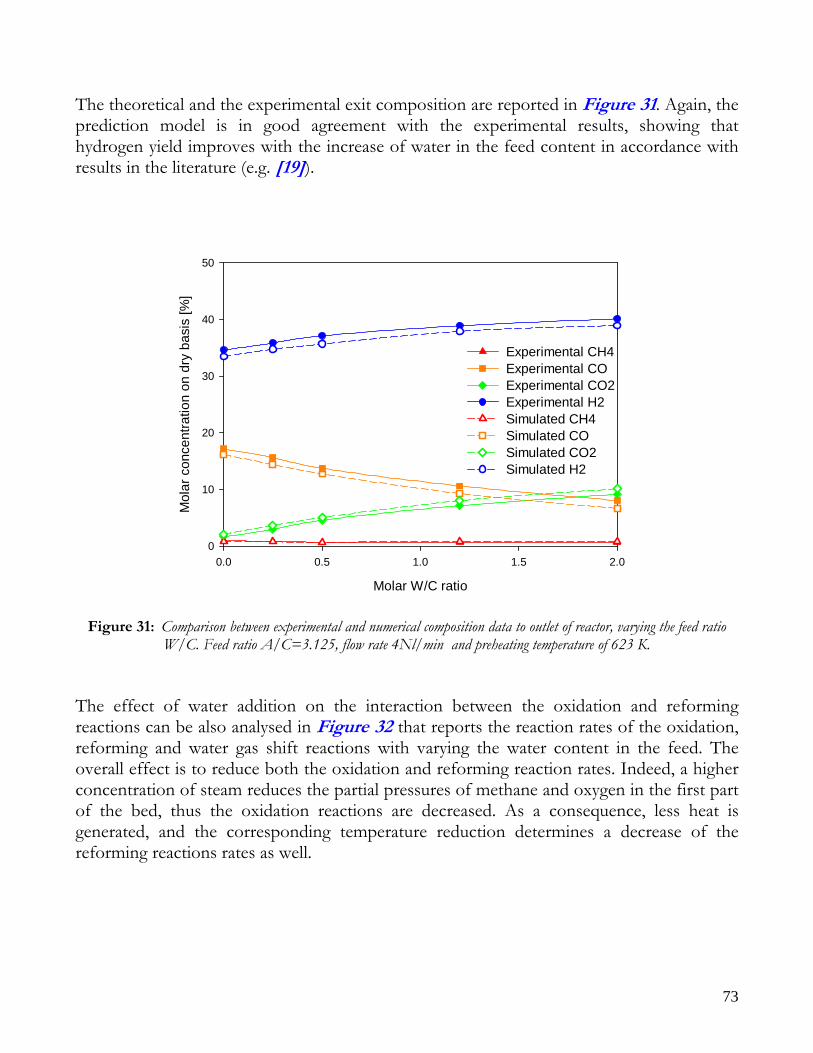
73
The theoretical and the experimental exit composition are reported in Figure 31. Again, the prediction model is in good agreement with the experimental results, showing that hydrogen yield improves with the increase of water in the feed content in accordance with results in the literature (e.g. [19]).
Molar W/C ratio
0.0 0.5 1.0 1.5 2.0
Mol
ar c
once
ntra
tion
on d
ry b
asis
[%]
0
10
20
30
40
50
Experimental CH4 Experimental CO Experimental CO2 Experimental H2 Simulated CH4 Simulated CO Simulated CO2 Simulated H2
Figure 31: Comparison between experimental and numerical composition data to outlet of reactor, varying the feed ratio W/C. Feed ratio A/C=3.125, flow rate 4Nl/min and preheating temperature of 623 K.
The effect of water addition on the interaction between the oxidation and reforming reactions can be also analysed in Figure 32 that reports the reaction rates of the oxidation, reforming and water gas shift reactions with varying the water content in the feed. The overall effect is to reduce both the oxidation and reforming reaction rates. Indeed, a higher concentration of steam reduces the partial pressures of methane and oxygen in the first part of the bed, thus the oxidation reactions are decreased. As a consequence, less heat is generated, and the corresponding temperature reduction determines a decrease of the reforming reactions rates as well.
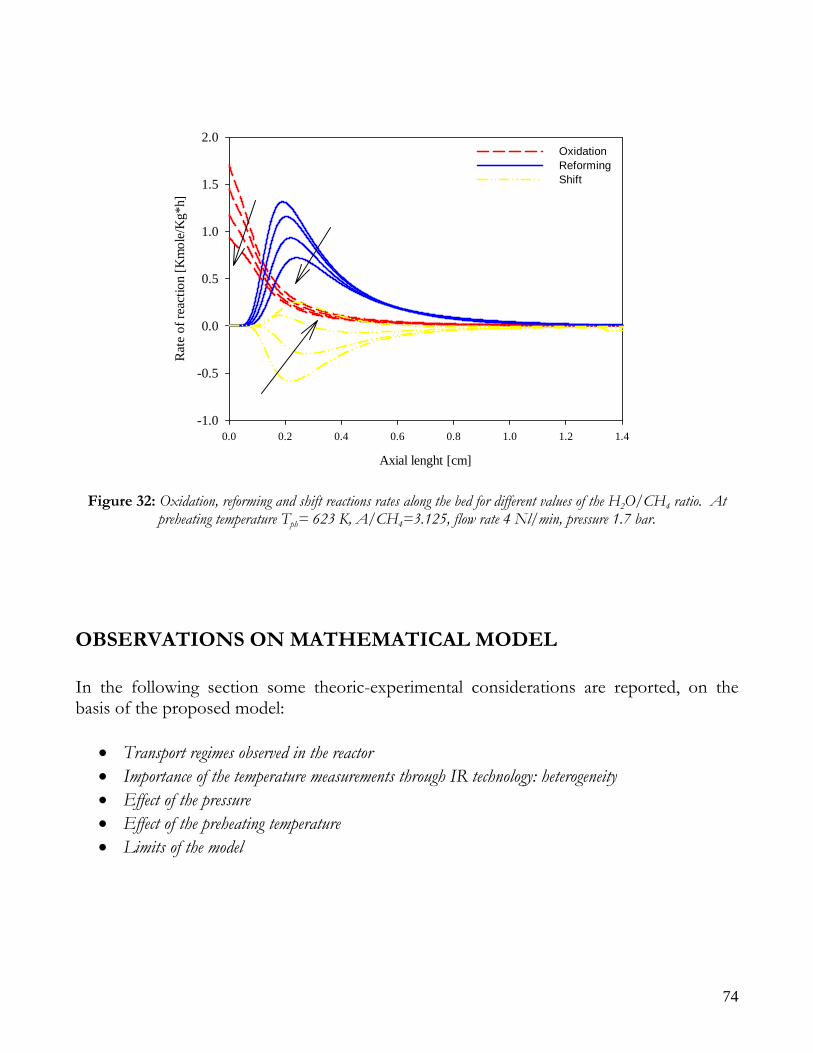
74
Axial lenght [cm]
0.0 0.2 0.4 0.6 0.8 1.0 1.2 1.4
Rat
e of
reac
tion
[Km
ole/
Kg*
h]
-1.0
-0.5
0.0
0.5
1.0
1.5
2.0Oxidation Reforming Shift
Figure 32: Oxidation, reforming and shift reactions rates along the bed for different values of the H2O/CH4 ratio. At preheating temperature Tph= 623 K, A/CH4=3.125, flow rate 4 Nl/min, pressure 1.7 bar.
OBSERVATIONS ON MATHEMATICAL MODEL In the following section some theoric-experimental considerations are reported, on the basis of the proposed model:
• Transport regimes observed in the reactor • Importance of the temperature measurements through IR technology: heterogeneity • Effect of the pressure • Effect of the preheating temperature • Limits of the model
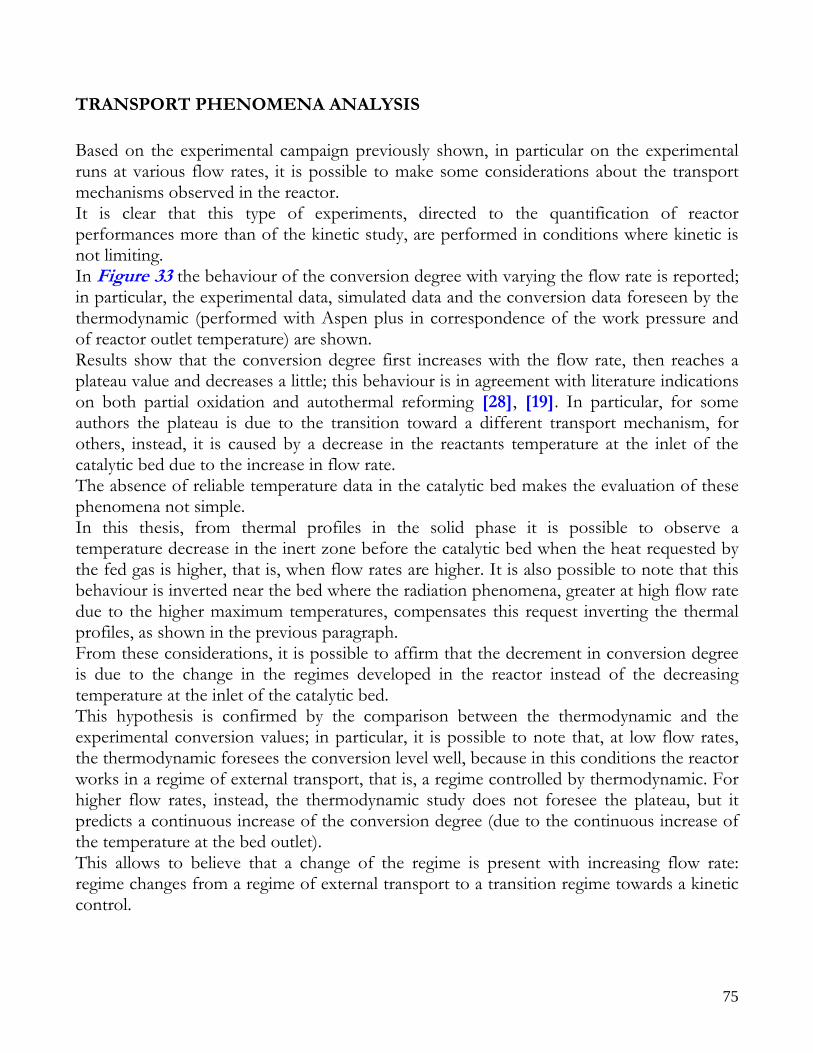
75
TRANSPORT PHENOMENA ANALYSIS Based on the experimental campaign previously shown, in particular on the experimental runs at various flow rates, it is possible to make some considerations about the transport mechanisms observed in the reactor. It is clear that this type of experiments, directed to the quantification of reactor performances more than of the kinetic study, are performed in conditions where kinetic is not limiting. In Figure 33 the behaviour of the conversion degree with varying the flow rate is reported; in particular, the experimental data, simulated data and the conversion data foreseen by the thermodynamic (performed with Aspen plus in correspondence of the work pressure and of reactor outlet temperature) are shown. Results show that the conversion degree first increases with the flow rate, then reaches a plateau value and decreases a little; this behaviour is in agreement with literature indications on both partial oxidation and autothermal reforming [28], [19]. In particular, for some authors the plateau is due to the transition toward a different transport mechanism, for others, instead, it is caused by a decrease in the reactants temperature at the inlet of the catalytic bed due to the increase in flow rate. The absence of reliable temperature data in the catalytic bed makes the evaluation of these phenomena not simple. In this thesis, from thermal profiles in the solid phase it is possible to observe a temperature decrease in the inert zone before the catalytic bed when the heat requested by the fed gas is higher, that is, when flow rates are higher. It is also possible to note that this behaviour is inverted near the bed where the radiation phenomena, greater at high flow rate due to the higher maximum temperatures, compensates this request inverting the thermal profiles, as shown in the previous paragraph. From these considerations, it is possible to affirm that the decrement in conversion degree is due to the change in the regimes developed in the reactor instead of the decreasing temperature at the inlet of the catalytic bed. This hypothesis is confirmed by the comparison between the thermodynamic and the experimental conversion values; in particular, it is possible to note that, at low flow rates, the thermodynamic foresees the conversion level well, because in this conditions the reactor works in a regime of external transport, that is, a regime controlled by thermodynamic. For higher flow rates, instead, the thermodynamic study does not foresee the plateau, but it predicts a continuous increase of the conversion degree (due to the continuous increase of the temperature at the bed outlet). This allows to believe that a change of the regime is present with increasing flow rate: regime changes from a regime of external transport to a transition regime towards a kinetic control.
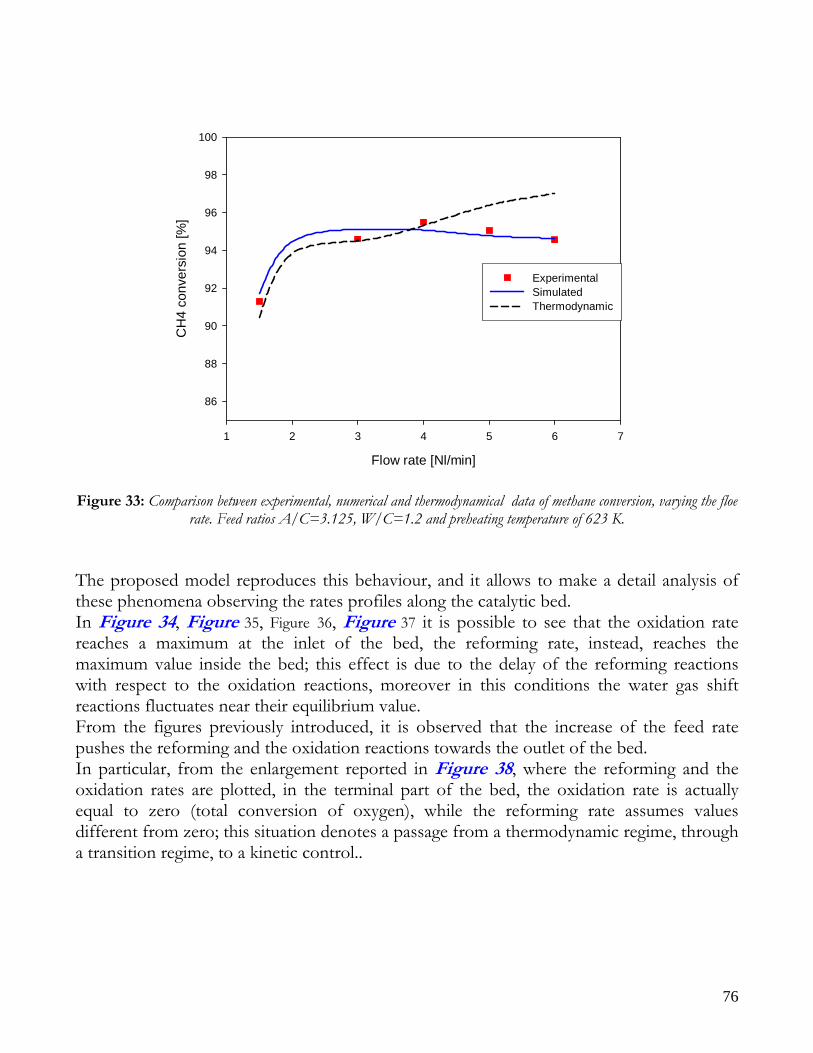
76
Flow rate [Nl/min]
1 2 3 4 5 6 7
CH
4 co
nver
sion
[%]
86
88
90
92
94
96
98
100
ExperimentalSimulatedThermodynamic
Figure 33: Comparison between experimental, numerical and thermodynamical data of methane conversion, varying the floe
rate. Feed ratios A/C=3.125, W/C=1.2 and preheating temperature of 623 K. The proposed model reproduces this behaviour, and it allows to make a detail analysis of these phenomena observing the rates profiles along the catalytic bed. In Figure 34, Figure 35, Figure 36, Figure 37 it is possible to see that the oxidation rate reaches a maximum at the inlet of the bed, the reforming rate, instead, reaches the maximum value inside the bed; this effect is due to the delay of the reforming reactions with respect to the oxidation reactions, moreover in this conditions the water gas shift reactions fluctuates near their equilibrium value. From the figures previously introduced, it is observed that the increase of the feed rate pushes the reforming and the oxidation reactions towards the outlet of the bed. In particular, from the enlargement reported in Figure 38, where the reforming and the oxidation rates are plotted, in the terminal part of the bed, the oxidation rate is actually equal to zero (total conversion of oxygen), while the reforming rate assumes values different from zero; this situation denotes a passage from a thermodynamic regime, through a transition regime, to a kinetic control..
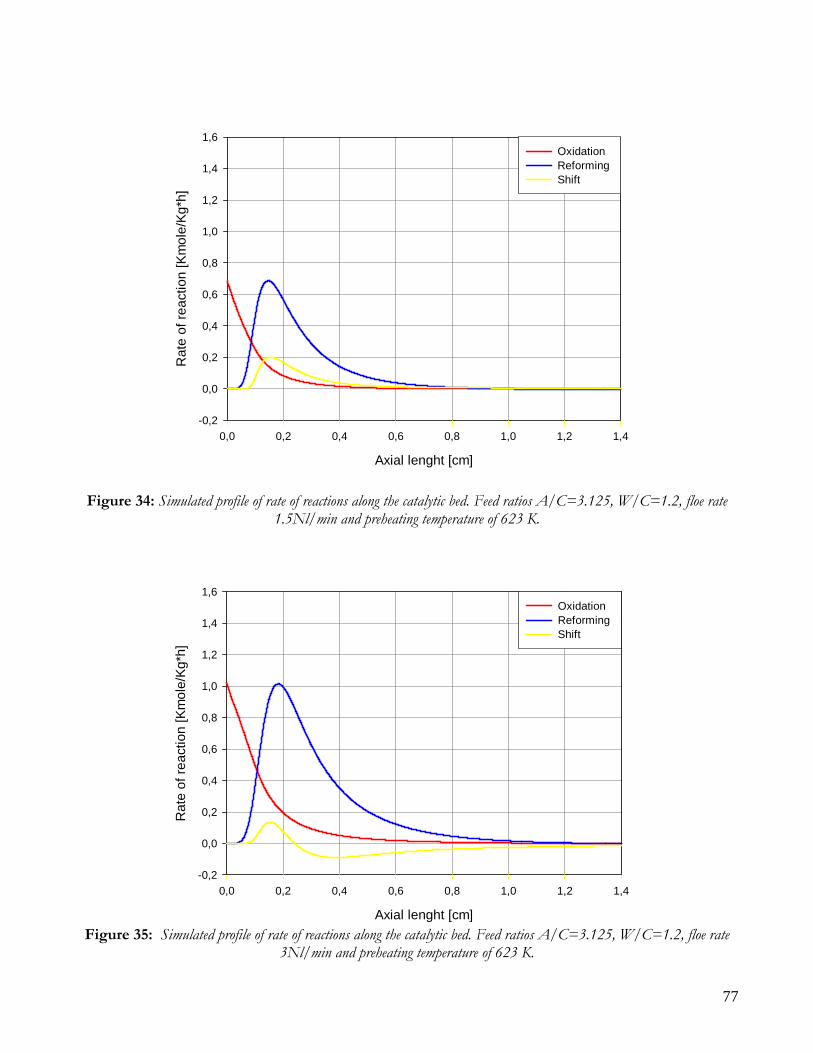
77
Axial lenght [cm]
0,0 0,2 0,4 0,6 0,8 1,0 1,2 1,4
Rat
e of
reac
tion
[Km
ole/
Kg*h
]
-0,2
0,0
0,2
0,4
0,6
0,8
1,0
1,2
1,4
1,6Oxidation Reforming Shift
Figure 34: Simulated profile of rate of reactions along the catalytic bed. Feed ratios A/C=3.125, W/C=1.2, floe rate 1.5Nl/min and preheating temperature of 623 K.
Axial lenght [cm]
0,0 0,2 0,4 0,6 0,8 1,0 1,2 1,4
Rat
e of
reac
tion
[Km
ole/
Kg*h
]
-0,2
0,0
0,2
0,4
0,6
0,8
1,0
1,2
1,4
1,6Oxidation Reforming Shift
Figure 35: Simulated profile of rate of reactions along the catalytic bed. Feed ratios A/C=3.125, W/C=1.2, floe rate
3Nl/min and preheating temperature of 623 K.
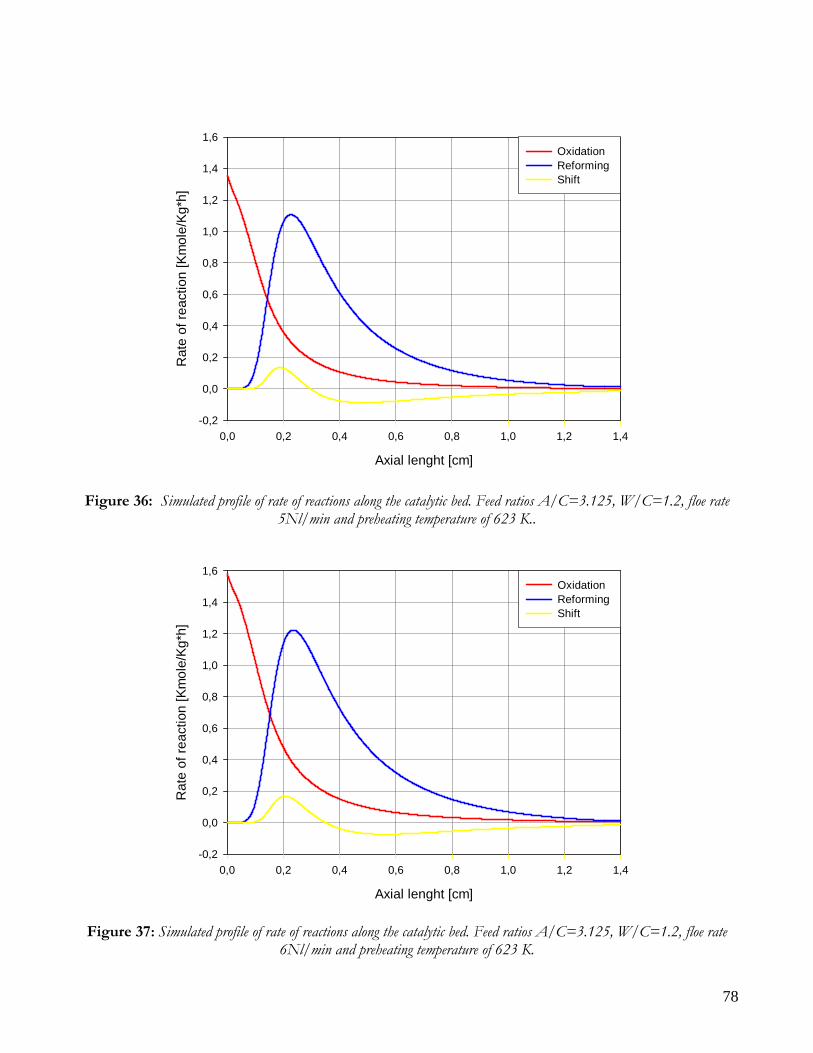
78
Axial lenght [cm]
0,0 0,2 0,4 0,6 0,8 1,0 1,2 1,4
Rat
e of
reac
tion
[Km
ole/
Kg*h
]
-0,2
0,0
0,2
0,4
0,6
0,8
1,0
1,2
1,4
1,6Oxidation Reforming Shift
Figure 36: Simulated profile of rate of reactions along the catalytic bed. Feed ratios A/C=3.125, W/C=1.2, floe rate 5Nl/min and preheating temperature of 623 K..
Axial lenght [cm]
0,0 0,2 0,4 0,6 0,8 1,0 1,2 1,4
Rat
e of
reac
tion
[Km
ole/
Kg*h
]
-0,2
0,0
0,2
0,4
0,6
0,8
1,0
1,2
1,4
1,6Oxidation Reforming Shift
Figure 37: Simulated profile of rate of reactions along the catalytic bed. Feed ratios A/C=3.125, W/C=1.2, floe rate 6Nl/min and preheating temperature of 623 K.
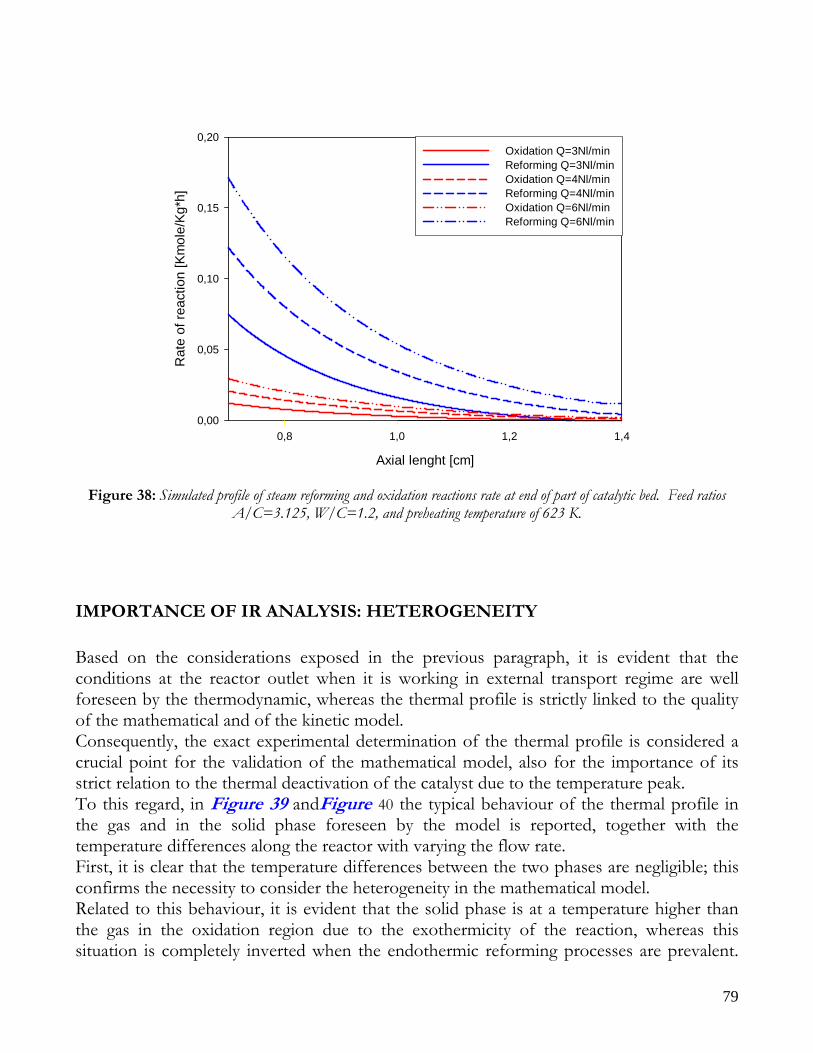
79
Axial lenght [cm]
0,8 1,0 1,2 1,4
Rat
e of
reac
tion
[Km
ole/
Kg*h
]
0,00
0,05
0,10
0,15
0,20Oxidation Q=3Nl/minReforming Q=3Nl/minOxidation Q=4Nl/minReforming Q=4Nl/minOxidation Q=6Nl/minReforming Q=6Nl/min
Figure 38: Simulated profile of steam reforming and oxidation reactions rate at end of part of catalytic bed. Feed ratios A/C=3.125, W/C=1.2, and preheating temperature of 623 K.
IMPORTANCE OF IR ANALYSIS: HETEROGENEITY Based on the considerations exposed in the previous paragraph, it is evident that the conditions at the reactor outlet when it is working in external transport regime are well foreseen by the thermodynamic, whereas the thermal profile is strictly linked to the quality of the mathematical and of the kinetic model. Consequently, the exact experimental determination of the thermal profile is considered a crucial point for the validation of the mathematical model, also for the importance of its strict relation to the thermal deactivation of the catalyst due to the temperature peak. To this regard, in Figure 39 andFigure 40 the typical behaviour of the thermal profile in the gas and in the solid phase foreseen by the model is reported, together with the temperature differences along the reactor with varying the flow rate. First, it is clear that the temperature differences between the two phases are negligible; this confirms the necessity to consider the heterogeneity in the mathematical model. Related to this behaviour, it is evident that the solid phase is at a temperature higher than the gas in the oxidation region due to the exothermicity of the reaction, whereas this situation is completely inverted when the endothermic reforming processes are prevalent.
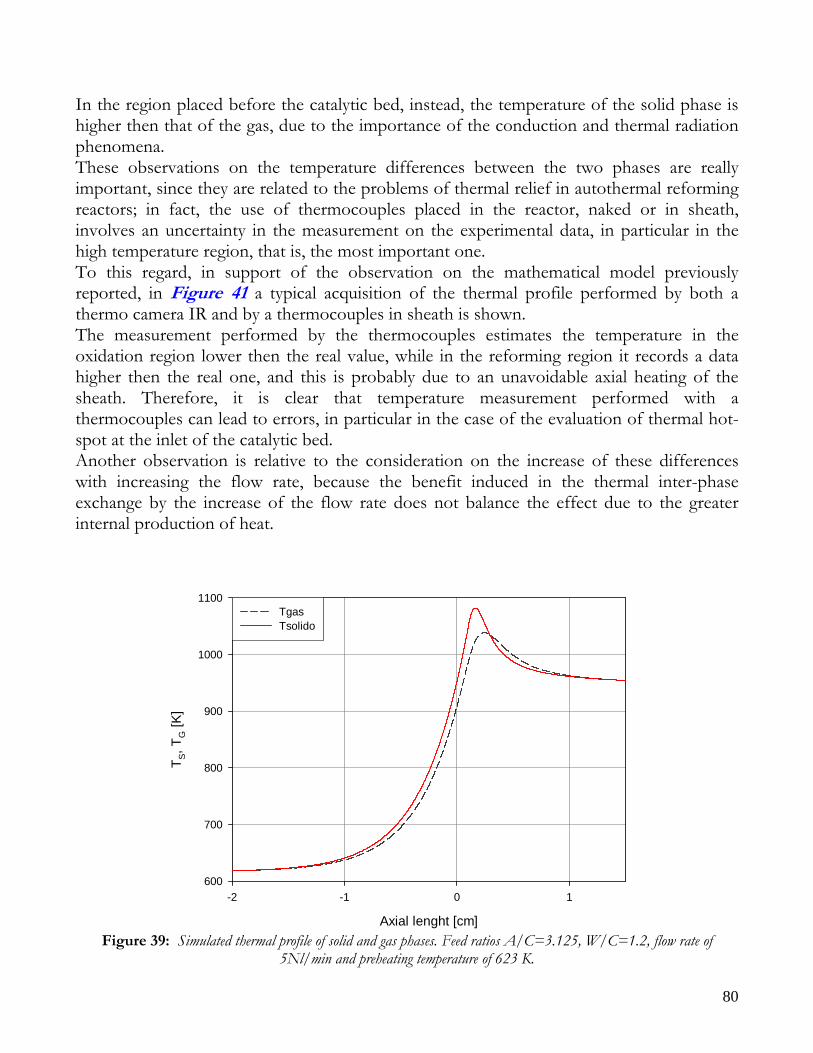
80
In the region placed before the catalytic bed, instead, the temperature of the solid phase is higher then that of the gas, due to the importance of the conduction and thermal radiation phenomena. These observations on the temperature differences between the two phases are really important, since they are related to the problems of thermal relief in autothermal reforming reactors; in fact, the use of thermocouples placed in the reactor, naked or in sheath, involves an uncertainty in the measurement on the experimental data, in particular in the high temperature region, that is, the most important one. To this regard, in support of the observation on the mathematical model previously reported, in Figure 41 a typical acquisition of the thermal profile performed by both a thermo camera IR and by a thermocouples in sheath is shown. The measurement performed by the thermocouples estimates the temperature in the oxidation region lower then the real value, while in the reforming region it records a data higher then the real one, and this is probably due to an unavoidable axial heating of the sheath. Therefore, it is clear that temperature measurement performed with a thermocouples can lead to errors, in particular in the case of the evaluation of thermal hot-spot at the inlet of the catalytic bed. Another observation is relative to the consideration on the increase of these differences with increasing the flow rate, because the benefit induced in the thermal inter-phase exchange by the increase of the flow rate does not balance the effect due to the greater internal production of heat.
Axial lenght [cm]
-2 -1 0 1
T S, T
G [K
]
600
700
800
900
1000
1100TgasTsolido
Figure 39: Simulated thermal profile of solid and gas phases. Feed ratios A/C=3.125, W/C=1.2, flow rate of
5Nl/min and preheating temperature of 623 K.
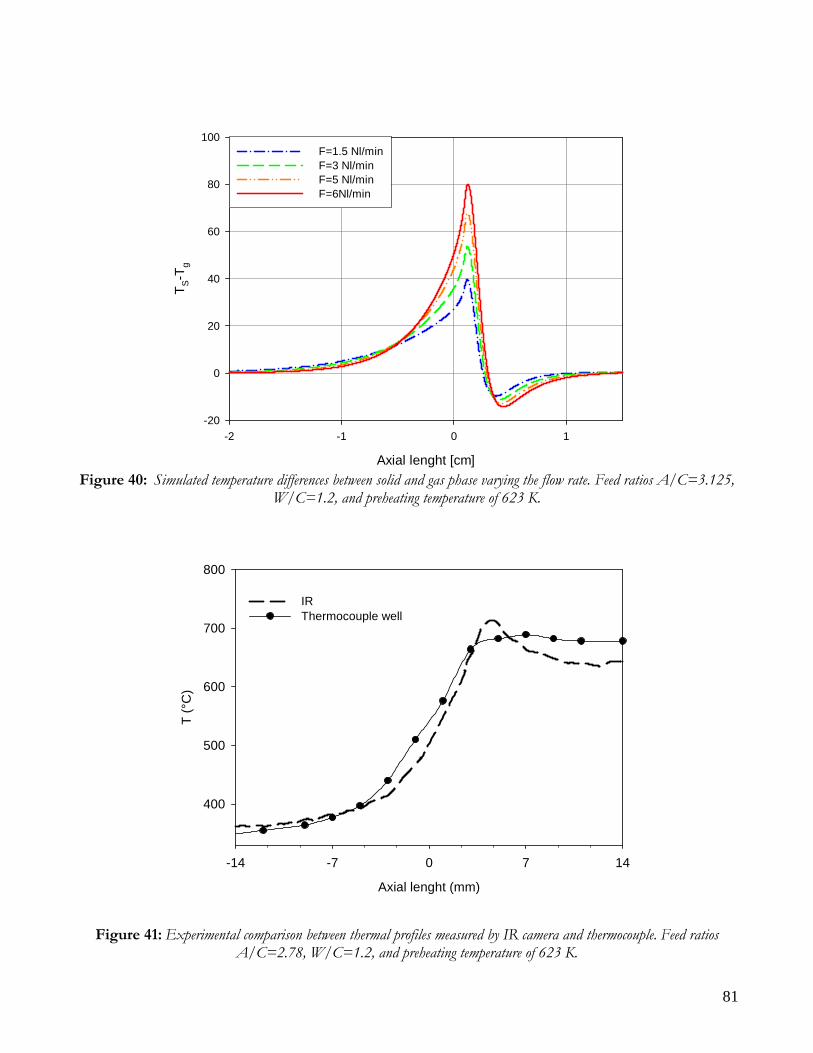
81
Axial lenght [cm]
-2 -1 0 1
T S-T
g
-20
0
20
40
60
80
100F=1.5 Nl/minF=3 Nl/minF=5 Nl/minF=6Nl/min
Figure 40: Simulated temperature differences between solid and gas phase varying the flow rate. Feed ratios A/C=3.125,
W/C=1.2, and preheating temperature of 623 K.
Axial lenght (mm)
-14 -7 0 7 14
T (°
C)
400
500
600
700
800
IRThermocouple well
Figure 41: Experimental comparison between thermal profiles measured by IR camera and thermocouple. Feed ratios A/C=2.78, W/C=1.2, and preheating temperature of 623 K.
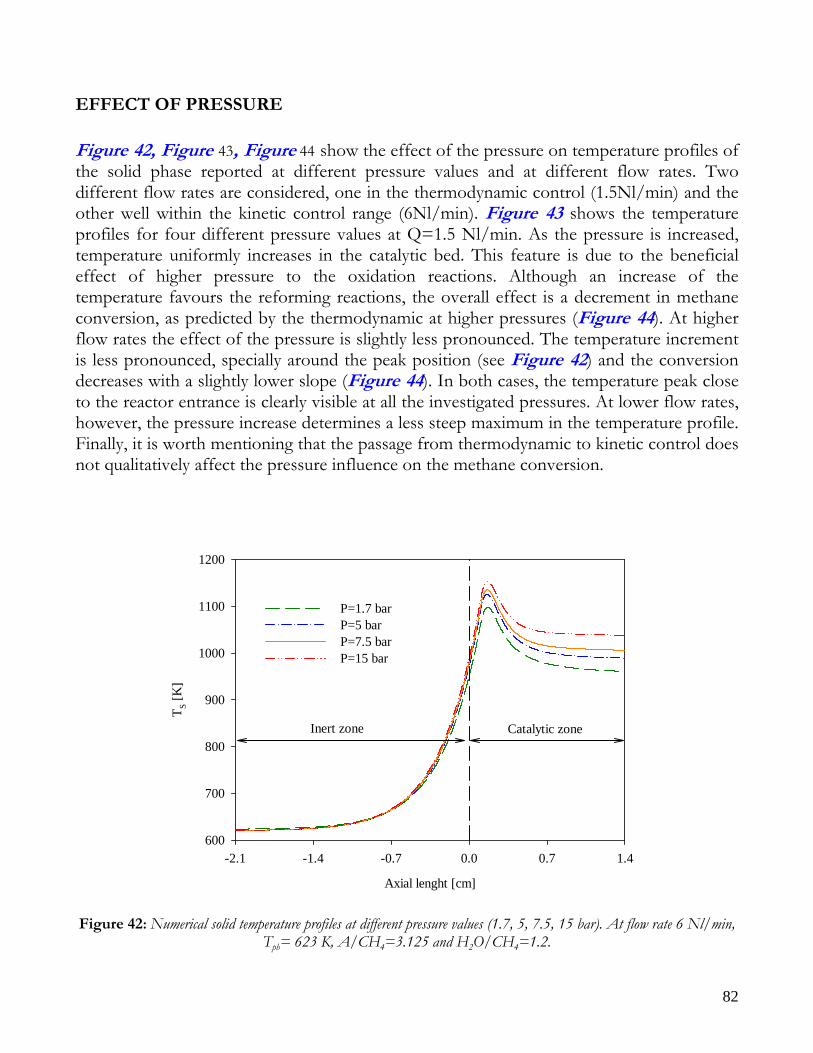
82
EFFECT OF PRESSURE Figure 42, Figure 43, Figure 44 show the effect of the pressure on temperature profiles of the solid phase reported at different pressure values and at different flow rates. Two different flow rates are considered, one in the thermodynamic control (1.5Nl/min) and the other well within the kinetic control range (6Nl/min). Figure 43 shows the temperature profiles for four different pressure values at Q=1.5 Nl/min. As the pressure is increased, temperature uniformly increases in the catalytic bed. This feature is due to the beneficial effect of higher pressure to the oxidation reactions. Although an increase of the temperature favours the reforming reactions, the overall effect is a decrement in methane conversion, as predicted by the thermodynamic at higher pressures (Figure 44). At higher flow rates the effect of the pressure is slightly less pronounced. The temperature increment is less pronounced, specially around the peak position (see Figure 42) and the conversion decreases with a slightly lower slope (Figure 44). In both cases, the temperature peak close to the reactor entrance is clearly visible at all the investigated pressures. At lower flow rates, however, the pressure increase determines a less steep maximum in the temperature profile. Finally, it is worth mentioning that the passage from thermodynamic to kinetic control does not qualitatively affect the pressure influence on the methane conversion.
Axial lenght [cm]
-2.1 -1.4 -0.7 0.0 0.7 1.4
T S [K
]
600
700
800
900
1000
1100
1200
P=1.7 barP=5 barP=7.5 barP=15 bar
Inert zone Catalytic zone
Figure 42: Numerical solid temperature profiles at different pressure values (1.7, 5, 7.5, 15 bar). At flow rate 6 Nl/min,
Tph= 623 K, A/CH4=3.125 and H2O/CH4=1.2.
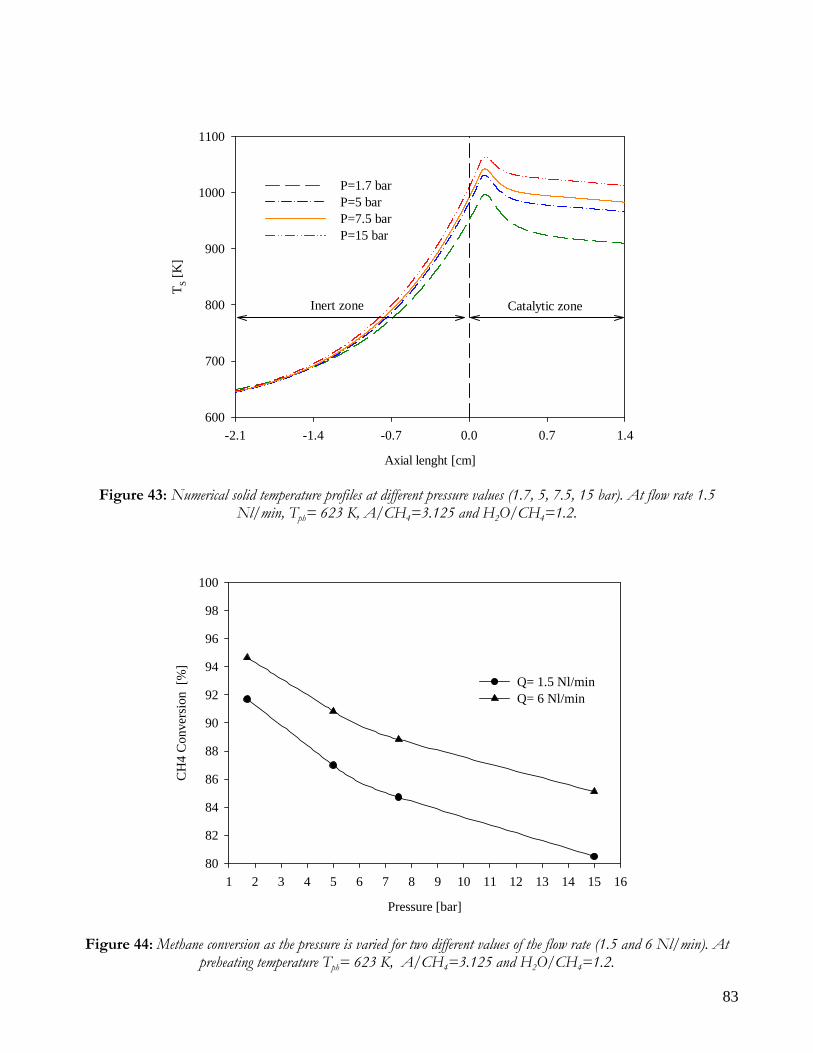
83
Axial lenght [cm]
-2.1 -1.4 -0.7 0.0 0.7 1.4
T S [K
]
600
700
800
900
1000
1100
P=1.7 barP=5 barP=7.5 barP=15 bar
Inert zone Catalytic zone
Figure 43: Numerical solid temperature profiles at different pressure values (1.7, 5, 7.5, 15 bar). At flow rate 1.5 Nl/min, Tph= 623 K, A/CH4=3.125 and H2O/CH4=1.2.
Pressure [bar]
1 2 3 4 5 6 7 8 9 10 11 12 13 14 15 16
CH
4 C
onve
rsio
n [%
]
80
82
84
86
88
90
92
94
96
98
100
Q= 1.5 Nl/minQ= 6 Nl/min
Figure 44: Methane conversion as the pressure is varied for two different values of the flow rate (1.5 and 6 Nl/min). At preheating temperature Tph= 623 K, A/CH4=3.125 and H2O/CH4=1.2.
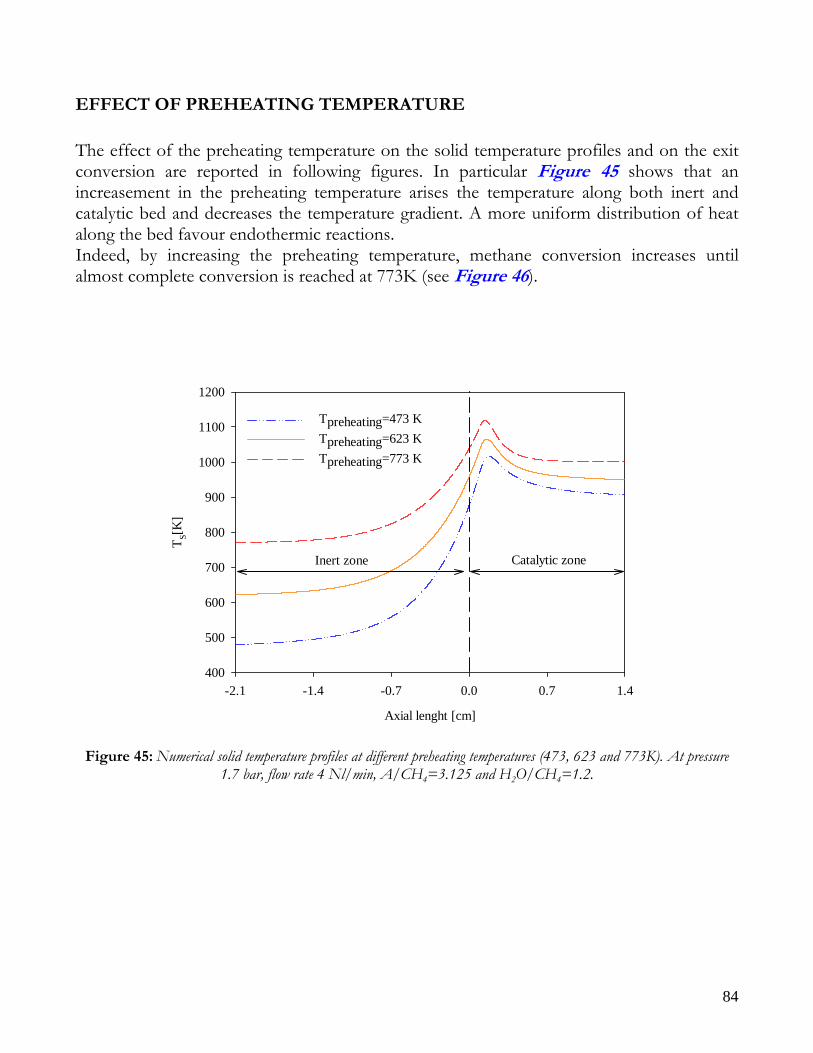
84
EFFECT OF PREHEATING TEMPERATURE The effect of the preheating temperature on the solid temperature profiles and on the exit conversion are reported in following figures. In particular Figure 45 shows that an increasement in the preheating temperature arises the temperature along both inert and catalytic bed and decreases the temperature gradient. A more uniform distribution of heat along the bed favour endothermic reactions. Indeed, by increasing the preheating temperature, methane conversion increases until almost complete conversion is reached at 773K (see Figure 46).
Axial lenght [cm]
-2.1 -1.4 -0.7 0.0 0.7 1.4
T S[K
]
400
500
600
700
800
900
1000
1100
1200
Tpreheating=473 KTpreheating=623 KTpreheating=773 K
Inert zone Catalytic zone
Figure 45: Numerical solid temperature profiles at different preheating temperatures (473, 623 and 773K). At pressure 1.7 bar, flow rate 4 Nl/min, A/CH4=3.125 and H2O/CH4=1.2.
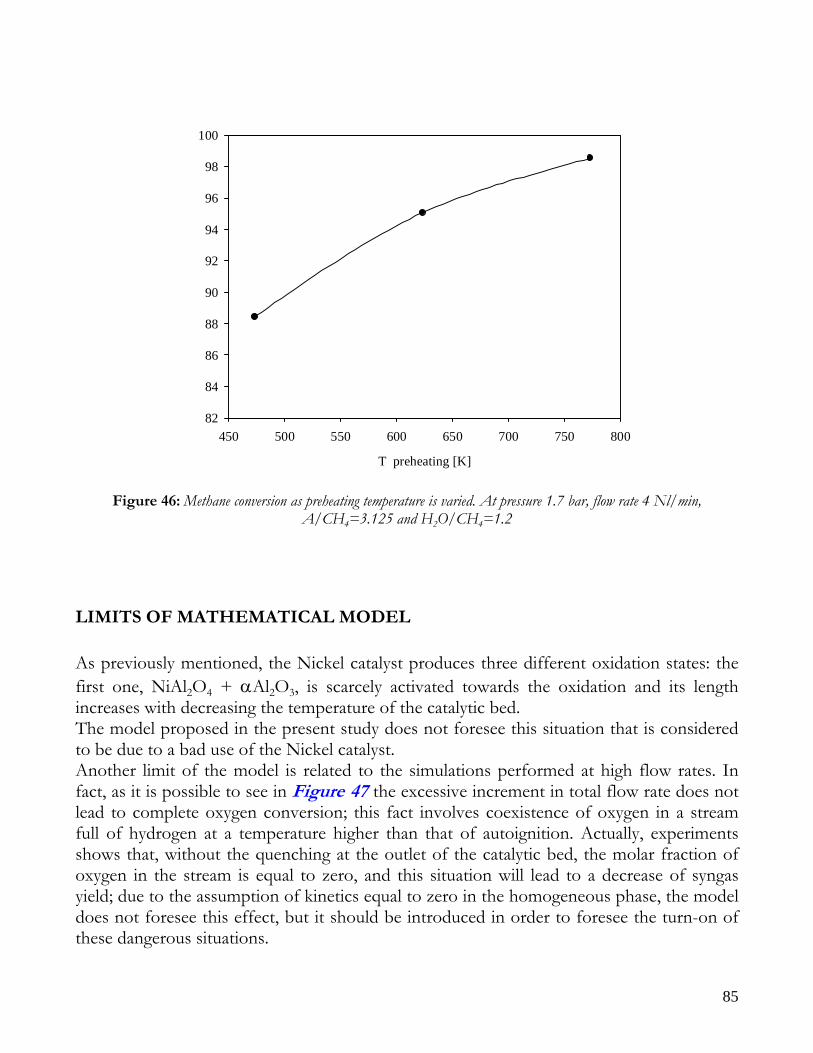
85
T preheating [K]
450 500 550 600 650 700 750 80082
84
86
88
90
92
94
96
98
100
Figure 46: Methane conversion as preheating temperature is varied. At pressure 1.7 bar, flow rate 4 Nl/min, A/CH4=3.125 and H2O/CH4=1.2
LIMITS OF MATHEMATICAL MODEL As previously mentioned, the Nickel catalyst produces three different oxidation states: the first one, NiAl2O4 + αAl2O3, is scarcely activated towards the oxidation and its length increases with decreasing the temperature of the catalytic bed. The model proposed in the present study does not foresee this situation that is considered to be due to a bad use of the Nickel catalyst. Another limit of the model is related to the simulations performed at high flow rates. In fact, as it is possible to see in Figure 47 the excessive increment in total flow rate does not lead to complete oxygen conversion; this fact involves coexistence of oxygen in a stream full of hydrogen at a temperature higher than that of autoignition. Actually, experiments shows that, without the quenching at the outlet of the catalytic bed, the molar fraction of oxygen in the stream is equal to zero, and this situation will lead to a decrease of syngas yield; due to the assumption of kinetics equal to zero in the homogeneous phase, the model does not foresee this effect, but it should be introduced in order to foresee the turn-on of these dangerous situations.
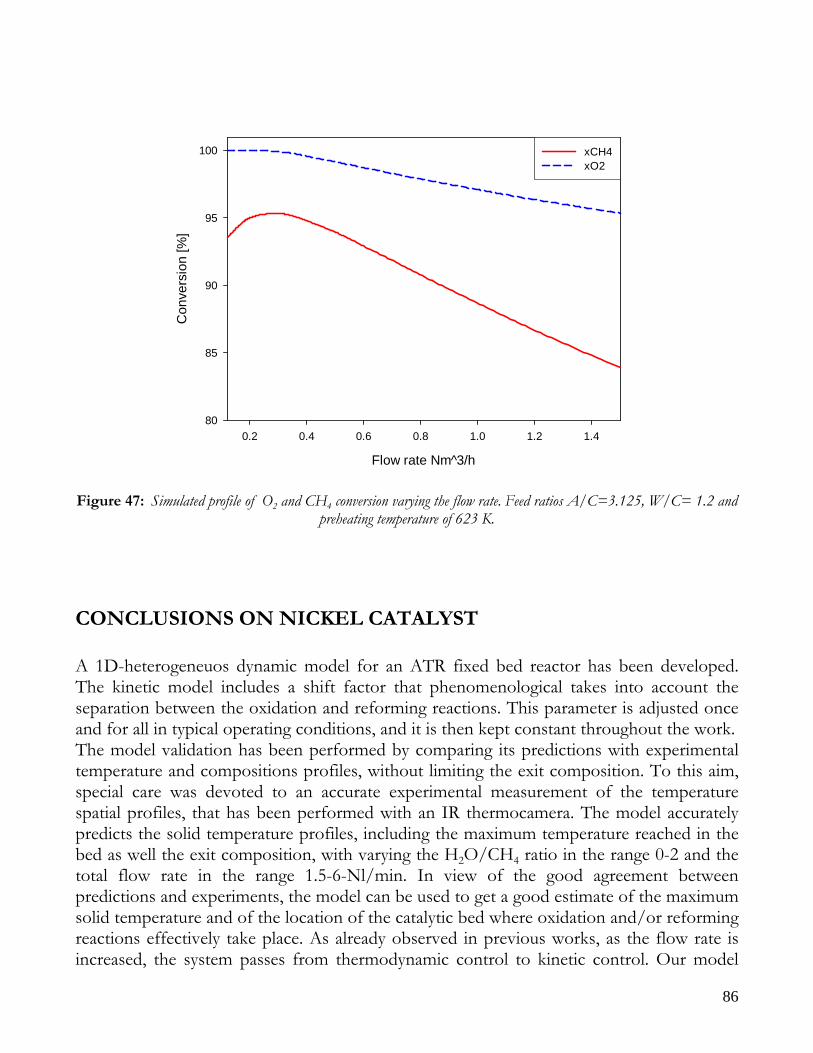
86
Flow rate Nm^3/h
0.2 0.4 0.6 0.8 1.0 1.2 1.4
Con
vers
ion
[%]
80
85
90
95
100 xCH4xO2
Figure 47: Simulated profile of O2 and CH4 conversion varying the flow rate. Feed ratios A/C=3.125, W/C= 1.2 and
preheating temperature of 623 K.
CONCLUSIONS ON NICKEL CATALYST A 1D-heterogeneuos dynamic model for an ATR fixed bed reactor has been developed. The kinetic model includes a shift factor that phenomenological takes into account the separation between the oxidation and reforming reactions. This parameter is adjusted once and for all in typical operating conditions, and it is then kept constant throughout the work. The model validation has been performed by comparing its predictions with experimental temperature and compositions profiles, without limiting the exit composition. To this aim, special care was devoted to an accurate experimental measurement of the temperature spatial profiles, that has been performed with an IR thermocamera. The model accurately predicts the solid temperature profiles, including the maximum temperature reached in the bed as well the exit composition, with varying the H2O/CH4 ratio in the range 0-2 and the total flow rate in the range 1.5-6-Nl/min. In view of the good agreement between predictions and experiments, the model can be used to get a good estimate of the maximum solid temperature and of the location of the catalytic bed where oxidation and/or reforming reactions effectively take place. As already observed in previous works, as the flow rate is increased, the system passes from thermodynamic control to kinetic control. Our model
87
gives good predictions of the exit composition in both ranges, even at high flow rates, where the control is kinetic. In all the explored conditions, the analysis of spatial profiles reveals that the oxidation and reforming reactions are rather separate in the space. In this regard, the shift factor between the oxidation and reforming reaction plays a very important role. The effect of flow rate, water content, and pressure on temperature profiles and reaction rates was then investigated. In agreement with the experimental data, the model shows that, as the flow rate is increased, the temperature peak position does not change. This information, together with the analysis of the reaction rates, indicates that the overlapping of the oxidation and reforming reactions is not enhanced by increasing the flow rate. Moreover, the effect of water addition to the feed is well described by the model. Again, the temperature peak position is not influenced by the water content in the feed, thus water overall effect is the reduction of the temperature along the bed. From the analysis of the kinetic rates, it results that water addition decreases both the oxidation and reforming reaction rates. Regarding the effect of the reactor pressure, in contrast with previous results presented in literature, the presence of the temperature peak at all the pressure values from atmospheric to 15 bar pressure has been observed. The pressure increment determines a rise in the temperature along the bed and, correspondingly, a decrement of the total methane conversion. Such a trend is more pronounced at low flow rates. Summarizing, it is possible to draw the following conclusions on the Nickel catalyst:
The kinetic mechanism of autothermal reforming of methane on commercial Nickel catalyst is indirect
The addition of water to the feed does not lead to an advance of the reforming
reactions and does not change the type of kinetic mechanism
The 15% of the catalytic bed is initially interested by the only oxidation reaction, for the presence of a stratification of Nickel catalyst when the feed contains a mixture of oxygen and methane
Not negligible differences of temperature between the solid and the gas phase
suggest the need of recording the thermal profiles by using a thermocamera IR and of employing an heterogeneous mathematical model for describing the process
An increase in the pressure causes a decrease of the conversion degree and an
increase of reactor thermal level.
88
RESULTS ON RHODIUM CATALYST In this section, experimental and numerical results on reactor for CPO and ATR processes will be shown in case of Rhodium catalyst. The mathematical model shown in previous sections and already used for Nickel catalyst, will be used for obtaining results on Rhodium catalyst. The objective is to understand the efficiency of the mathematical model in this new catalytic configuration and to obtain information about the kinetic mechanism; it is important to consider that the researchers still has different ideas on the possible kinetics mechanism that can develop on Rhodium catalyst in ATR and CPO processes. Later, a mathematical model will be performed for comparing the performance of both catalyst systems investigated in this work. Theoretical and experimental results on Rhodium catalysts are reported in literature [4], [13-14], [26-28], [66-71]). They show the good performance of Rhodium catalyst in case the of CPO process, though they also illustrate the difficulty relative to interpretation of kinetic mechanism (direct or indirect type). For ATR process with a Rhodium catalyst, very few data are available. The theoretical-experimental program that will be discussed should be summarized as follows:
• Analysis of kinetics mechanism for autothermal reforming of methane on Rhodium-based catalyst: direct or indirect type?
• Theoretical and experimental analysis of overlapping between oxidative and reforming zone • Experimental effect of water addition to CPO process • Numerical modelling and comparison with experimental data • Theoretical considerations on type of kinetic mechanism, of feeling conditions • Experimental runs and numerical comparison by varying the air to methane ratio and the feed
preheating temperature • General conclusion on CPO and ATR processes using Rhodium catalyst
As reported in previous section, all the numerical simulation runs will be performed considering a start-up from a catalytic bed to temperature higher than the activation one of Rhodium catalyst (about 750K). Furthermore, in all simulations the reactor will be considered empty from all reactants at starting condition and pressurized with nitrogen until steady state pressure, as done during experimental runs.
89
KINETIC MECHANISM: DIRECT OR INDIRCT? As already said, in literature it is debated the question relative the type of kinetic mechanism that involve in a CPO and ATR process on Rhodium catalyst. There are two different positions assumed by researchers: a part of them declares that the mechanism is direct, including [3], [4], [72], [73], while the other part believes that the mechanism is of indirect type, including [28], [74], [75], [76]. In this work for Rhodium catalyst, the main objective is the evaluation of the thermal profile on catalyst bed, both for the quantification of thermal hot spot and for obtaining information about the kinetic mechanism; this information has to be evaluate for both ATR and CPO feeds. In this way, it is necessary to consider that the feasible shapes of thermal profile of solid phase are direct dependent on kinetic mechanism; for this reason, in Figure 48 (source [77]) the typical thermal profiles developed in catalytic reactor in ATR and CPO process conditions are reported. The energy characteristics of the possible chemical reactions involved in a direct and indirect mechanism for reforming are reported below, so it is possible to understand better the figure 48:
• direct mechanism
ΔH = -36 KJ/mol
• indirect mechanism
ΔH = -802 KJ/mol
ΔH = +185 KJ/mol
Observing the enthalpy generation of oxidation reactions, it is possible to see that the amount of heat generated from total oxidation reaction it is very high, as for partial oxidation.
224 25.0 HCOOCH +⇒+
OHCOOCH 2224 22 +⇒+
224 3HCOOHCH +⇔+
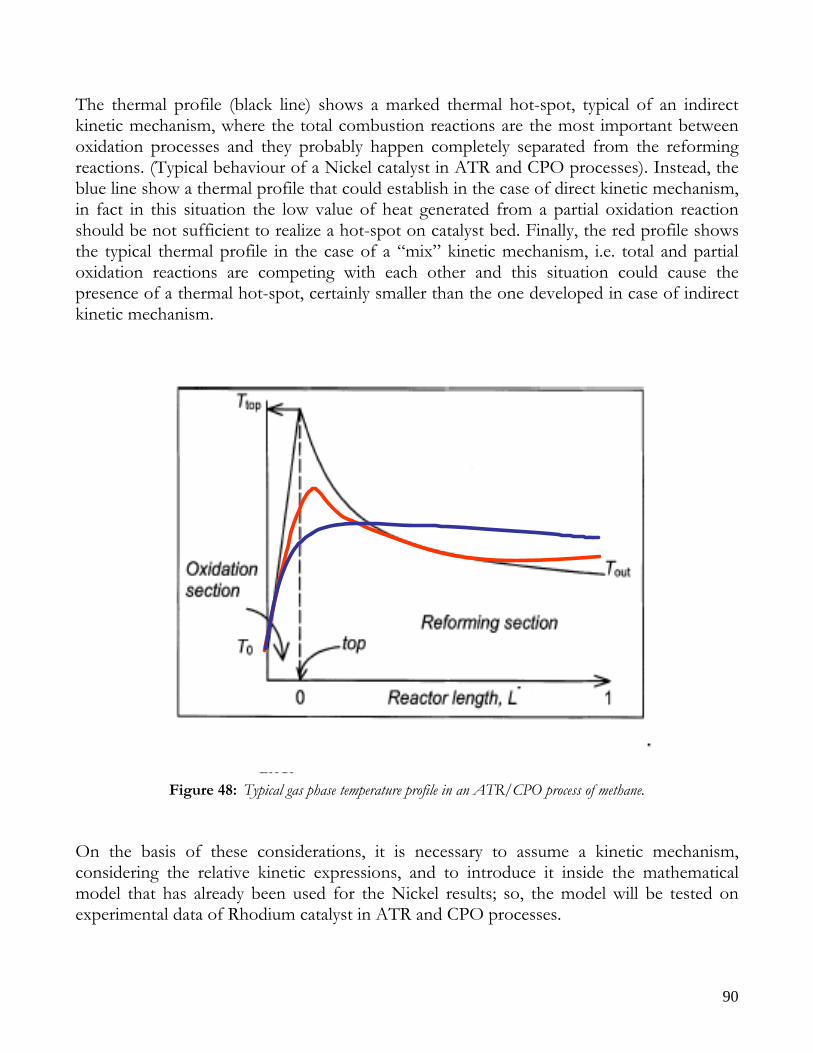
90
The thermal profile (black line) shows a marked thermal hot-spot, typical of an indirect kinetic mechanism, where the total combustion reactions are the most important between oxidation processes and they probably happen completely separated from the reforming reactions. (Typical behaviour of a Nickel catalyst in ATR and CPO processes). Instead, the blue line show a thermal profile that could establish in the case of direct kinetic mechanism, in fact in this situation the low value of heat generated from a partial oxidation reaction should be not sufficient to realize a hot-spot on catalyst bed. Finally, the red profile shows the typical thermal profile in the case of a “mix” kinetic mechanism, i.e. total and partial oxidation reactions are competing with each other and this situation could cause the presence of a thermal hot-spot, certainly smaller than the one developed in case of indirect kinetic mechanism.
Figure 48: Typical gas phase temperature profile in an ATR/CPO process of methane.
On the basis of these considerations, it is necessary to assume a kinetic mechanism, considering the relative kinetic expressions, and to introduce it inside the mathematical model that has already been used for the Nickel results; so, the model will be tested on experimental data of Rhodium catalyst in ATR and CPO processes.
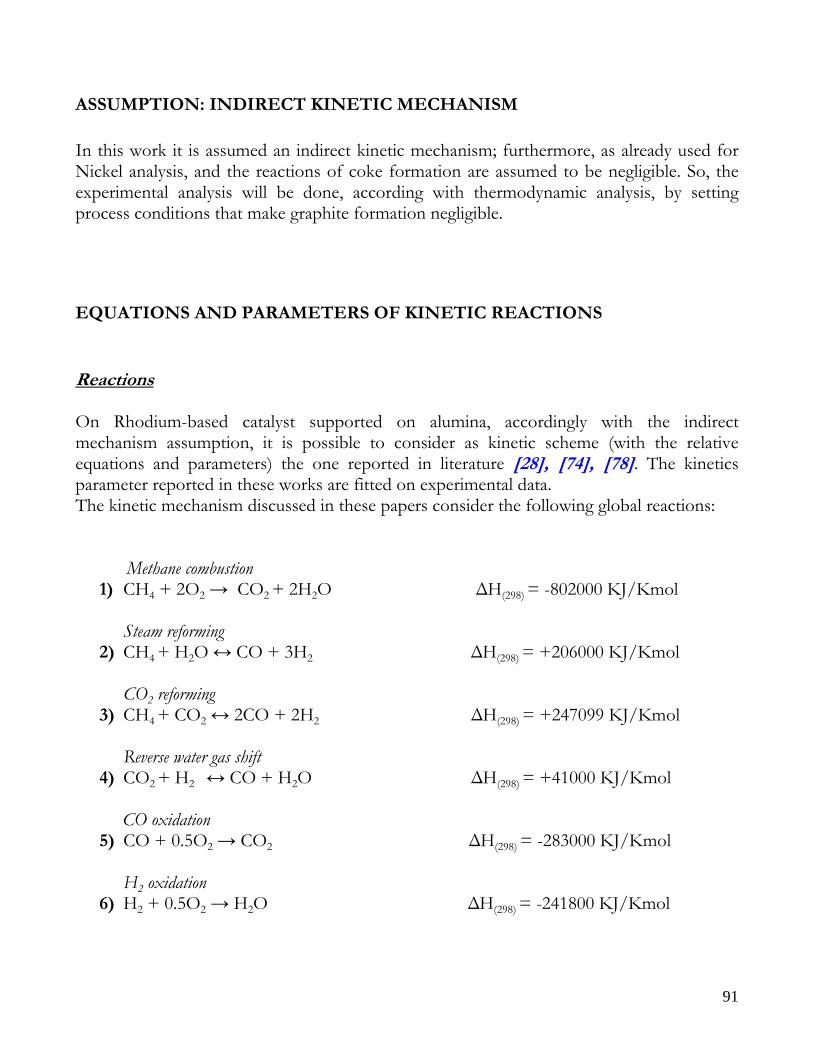
91
ASSUMPTION: INDIRECT KINETIC MECHANISM In this work it is assumed an indirect kinetic mechanism; furthermore, as already used for Nickel analysis, and the reactions of coke formation are assumed to be negligible. So, the experimental analysis will be done, according with thermodynamic analysis, by setting process conditions that make graphite formation negligible.
EQUATIONS AND PARAMETERS OF KINETIC REACTIONS Reactions On Rhodium-based catalyst supported on alumina, accordingly with the indirect mechanism assumption, it is possible to consider as kinetic scheme (with the relative equations and parameters) the one reported in literature [28], [74], [78]. The kinetics parameter reported in these works are fitted on experimental data. The kinetic mechanism discussed in these papers consider the following global reactions: Methane combustion
1) CH4 + 2O2 → CO2 + 2H2O ΔH(298) = -802000 KJ/Kmol
Steam reforming 2) CH4 + H2O ↔ CO + 3H2 ΔH(298) = +206000 KJ/Kmol
CO2 reforming 3) CH4 + CO2 ↔ 2CO + 2H2 ΔH(298) = +247099 KJ/Kmol
Reverse water gas shift
4) CO2 + H2 ↔ CO + H2O ΔH(298) = +41000 KJ/Kmol
CO oxidation 5) CO + 0.5O2 → CO2 ΔH(298) = -283000 KJ/Kmol
H2 oxidation
6) H2 + 0.5O2 → H2O ΔH(298) = -241800 KJ/Kmol
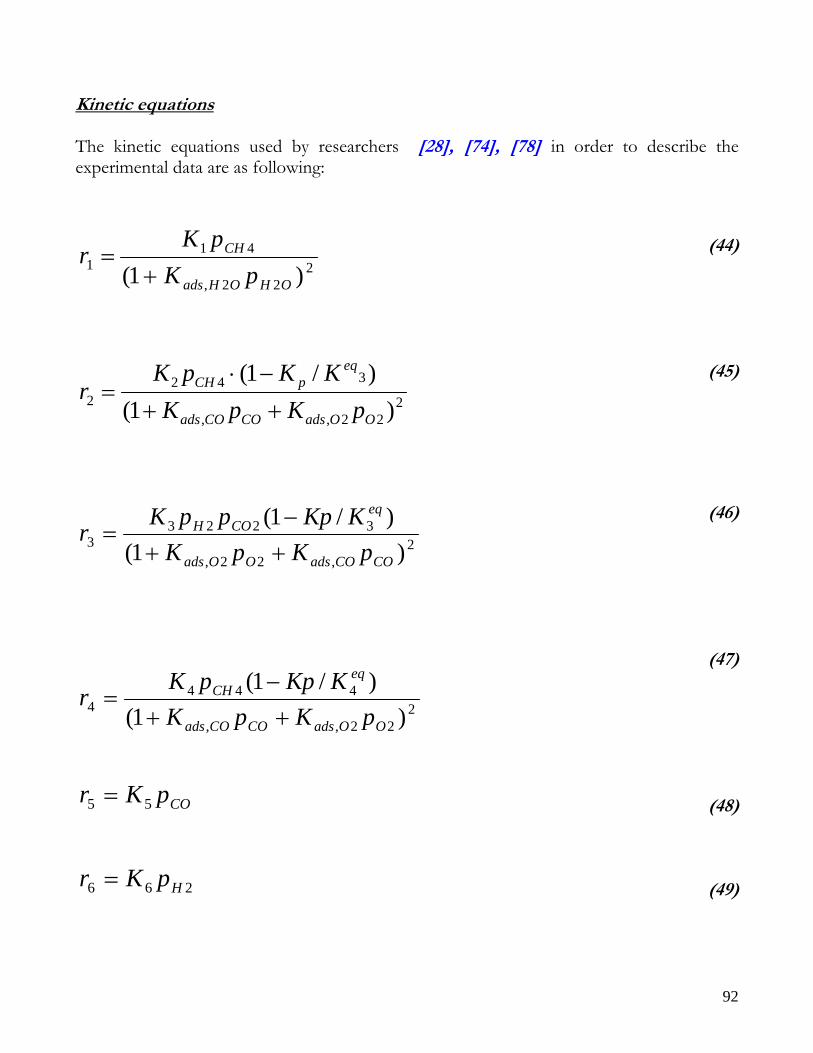
92
Kinetic equations The kinetic equations used by researchers [28], [74], [78] in order to describe the experimental data are as following:
(44)
(45)
(46)
(47)
(48)
(49)
222,
411 )1( OHOHads
CH
pKpK
r+
=
222,,
3422 )1(
)/1(
OOadsCOCOads
eqpCH
pKpKKKpK
r++−⋅
=
2,22,
32233 )1(
)/1(
COCOadsOOads
eqCOH
pKpKKKpppK
r++−
=
222,,
4444 )1(
)/1(
OOadsCOCOads
eqCH
pKpKKKppK
r++−
=
COpKr 55 =
266 HpKr =
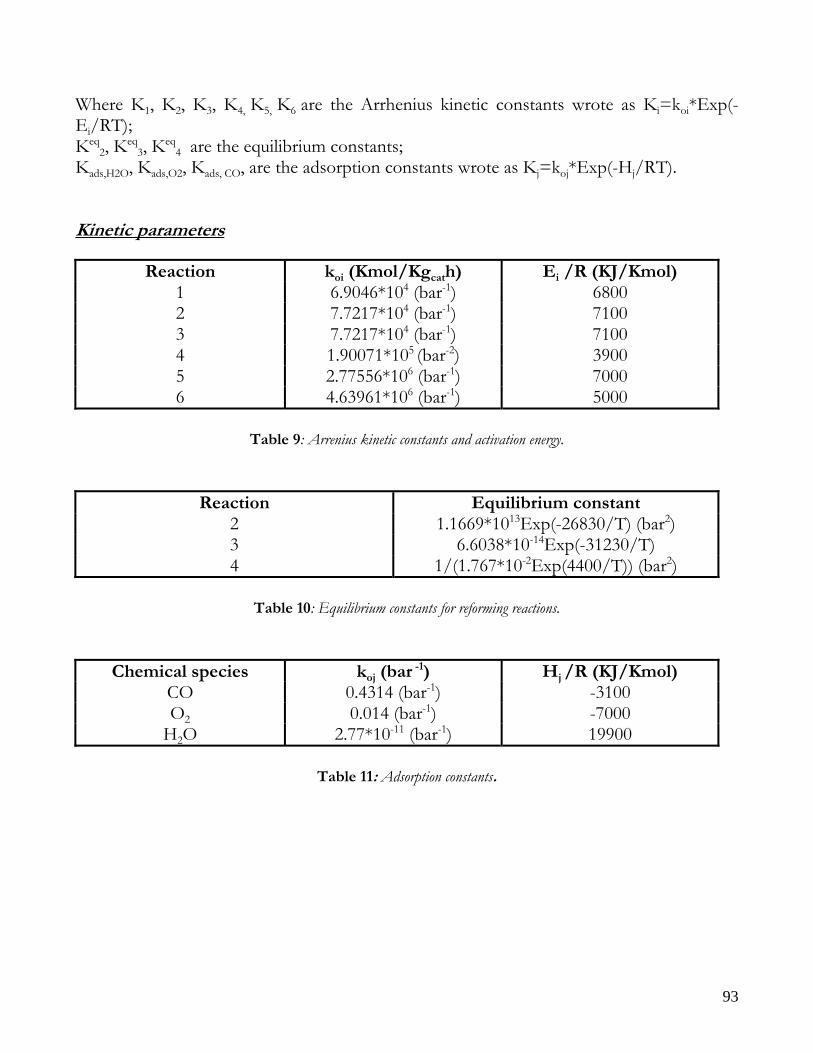
93
Where K1, K2, K3, K4, K5, K6 are the Arrhenius kinetic constants wrote as Ki=koi*Exp(-Ei/RT); Keq
2, Keq3, Keq
4 are the equilibrium constants; Kads,H2O, Kads,O2, Kads, CO, are the adsorption constants wrote as Kj=koj*Exp(-Hj/RT). Kinetic parameters
Reaction koi (Kmol/Kgcath) Ei /R (KJ/Kmol) 1 6.9046*104 (bar-1) 6800 2 7.7217*104 (bar-1) 7100 3 7.7217*104 (bar-1) 7100 4 1.90071*105 (bar-2) 3900 5 2.77556*106 (bar-1) 7000 6 4.63961*106 (bar-1) 5000
Table 9: Arrenius kinetic constants and activation energy.
Reaction Equilibrium constant 2 1.1669*1013Exp(-26830/T) (bar2) 3 6.6038*10-14Exp(-31230/T) 4 1/(1.767*10-2Exp(4400/T)) (bar2)
Table 10: Equilibrium constants for reforming reactions.
Chemical species koj (bar -1) Hj /R (KJ/Kmol) CO 0.4314 (bar-1) -3100 O2 0.014 (bar-1) -7000
H2O 2.77*10-11 (bar-1) 19900
Table 11: Adsorption constants.
94
KINETIC EVOLUTION OF CHEMICAL PROCESSES Once the reaction network is known, the following step is the individuation of the time-evolution of these processes, in other words it is important to determe how the processes develop (series or parallel). For the Nickel catalyst, the question was solved by considering the stratification exposed during a CPO process. Instead, for Rhodium catalyst, there are not precise information about the chemical species formed during ATR and CPO processes. Theoretically, a Rhodium-based catalyst should be always reduced or, anyway, should not expose chemical species (as chemical oxides) that inhibit the reforming activity; but the presence of both methane and oxygen, especially in the first part of catalytic bed, generates competition between reforming and oxidation reactions. Therefore, these processes, also on Rhodium catalyst, could not evolve at maximum potential from the inlet of reactive zone, and this situation could involve especially the oxidation reactions, because it is well know that the noble metals are a good activity for these reactions. In this work, it has been decided to use the developed mathematical model in order to know the mutual evolution between exothermic and endothermic reactions. Therefore, beyond the idea that the kinetic mechanism is an indirect type, it has also been decided to introduce the mathematical delay factor for the rate of reforming reactions, as done in case of Nickel catalyst (a mathematical function wrote as xO2
n). By this logic, the following cases may arise:
a) Direct or mix kinetic mechanism type. In this case, if a positive values of parameter “n” is assumed, the mathematical model will give an higher value of thermal hot-spot; this over-estimation will be more pronounced when the selectivity of partial oxidation is higher than the total oxidation reaction. Instead, in case of wrong kinetic hypothesis, the experimental data could be well estimate with a negative value of “n”; however, this situation it is not physically justifiable.
b) Indirect kinetic mechanism with parallel reaction scheme.
In this case, the mathematic model could well estimate a thermal profile with 0 as value of “n” parameter.
c) Indirect kinetic mechanism with reforming reactions delayed compared with those oxidation. The mathematical model could well describe the thermal profile with a positive value of parameter “n”. This value will increase with increasing the delay of reforming reaction in comparison to oxidation reaction.
95
MATHEMATICAL MODEL AND KINETIC HYPOTHESIS VALIDATION As already done for the mathematical model of ATR and CPO on Nickel catalyst, the delay function xO2
n will be introduced. This function multiplies the kinetic expression of the steam reforming and of the water gas shift rates, so these reactions are delayed with respect to the total oxidation through a function of the oxygen conversion degree, that is, through a function of the catalyst oxidation degree. Through the introduction of this function, it is obtained a mathematical model of the autothermal reactor in which the only parameter is “n”, and this parameter will be calculated through the fitting of the experimental data. To this aim in Figure 49, the thermal experimental profile of the solid phase is reported, measured through IR technology, obtained in an experimental run performed on Rhodium catalyst. This run is performed at flow rate of 4Nl/min, at an oven temperature of 623K and with a Air/CH4 feed ratio of 3.125 and with a W/CH4 feed ratio of 0 (CPO feed conditions). In the figure 49, the zero value of the x-axes is the inlet of the catalytic bed, while its total length is about 20 mm (5 gr of Rhodium commercial catalyst). It is possible to see that the thermal profile of solid phase exposes a pronounced hot spot just near the inlet of catalytic zone and this situation certainly is not typical of a direct kinetic mechanism. The figure 49 also shows that the inert material near the inlet of catalytic zone heats up to temperature higher than the feeding temperature, probably due the conduction and radiation phenomena in the first part of catalyst, where oxidation reaction are the most important. This situation has already been found for Nickel catalyst. Figure 50 shows the comparison between the experimental and simulated thermal profile along the reactor (inert and catalytic zones) with a fixed value of parameter. However, a parametric study on parameter “n” is done but, for a more simple description, it is not reported below. From the comparison, it is possible to see that the mathematical model well describe the thermal profile with a parameter “n” equal to 4. This shows that the kinetic hypothesis on global mechanism (indirect type) it is correct, and it shows that the chemical reactions do not proceed in a parallel scheme but the reforming it is delayed from the oxidation ones (this because the value of parameter “n” is ≥ 0). Obviously, although the strength of the mathematical model has been already widely tested on the Nickel catalyst, it should be verified for Rhodium catalyst, in different operating conditions of CPO and ATR, too.
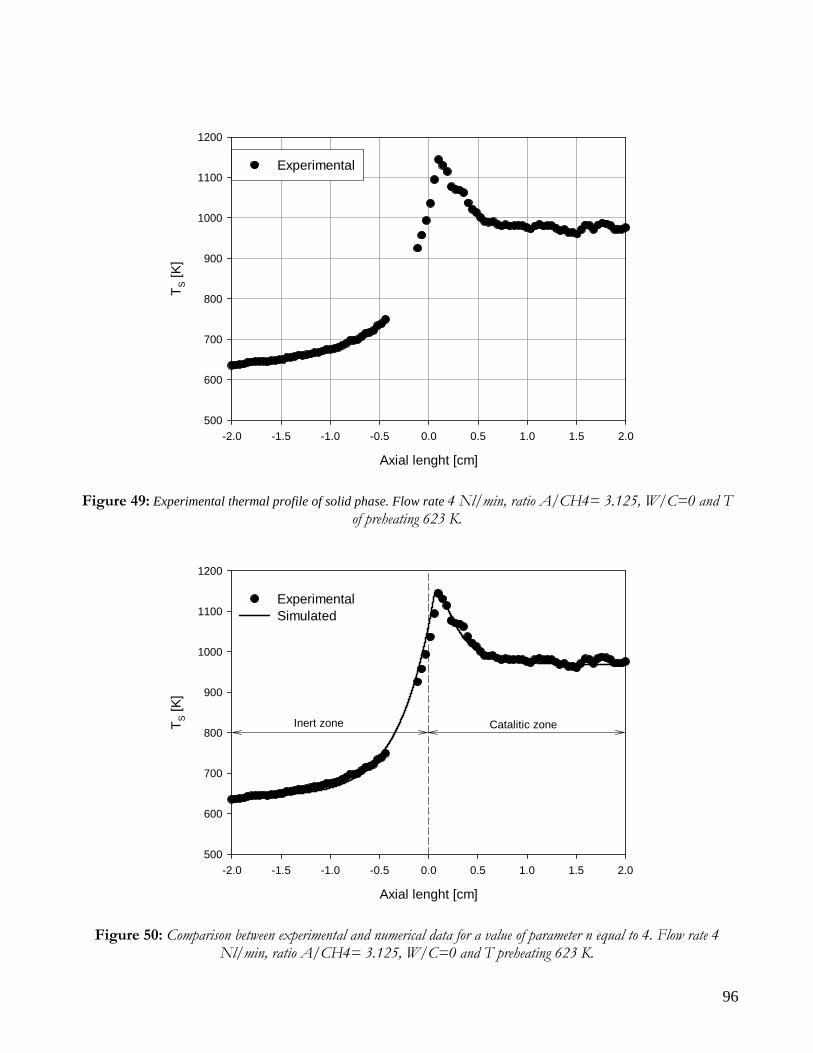
96
Axial lenght [cm]
-2.0 -1.5 -1.0 -0.5 0.0 0.5 1.0 1.5 2.0
T S [K
]
500
600
700
800
900
1000
1100
1200
Experimental
Figure 49: Experimental thermal profile of solid phase. Flow rate 4 Nl/min, ratio A/CH4= 3.125, W/C=0 and T
of preheating 623 K.
Figure 50: Comparison between experimental and numerical data for a value of parameter n equal to 4. Flow rate 4 Nl/min, ratio A/CH4= 3.125, W/C=0 and T preheating 623 K.
Axial lenght [cm]
-2.0 -1.5 -1.0 -0.5 0.0 0.5 1.0 1.5 2.0
T S [K
]
500
600
700
800
900
1000
1100
1200
ExperimentalSimulated
Inert zone Catalitic zone
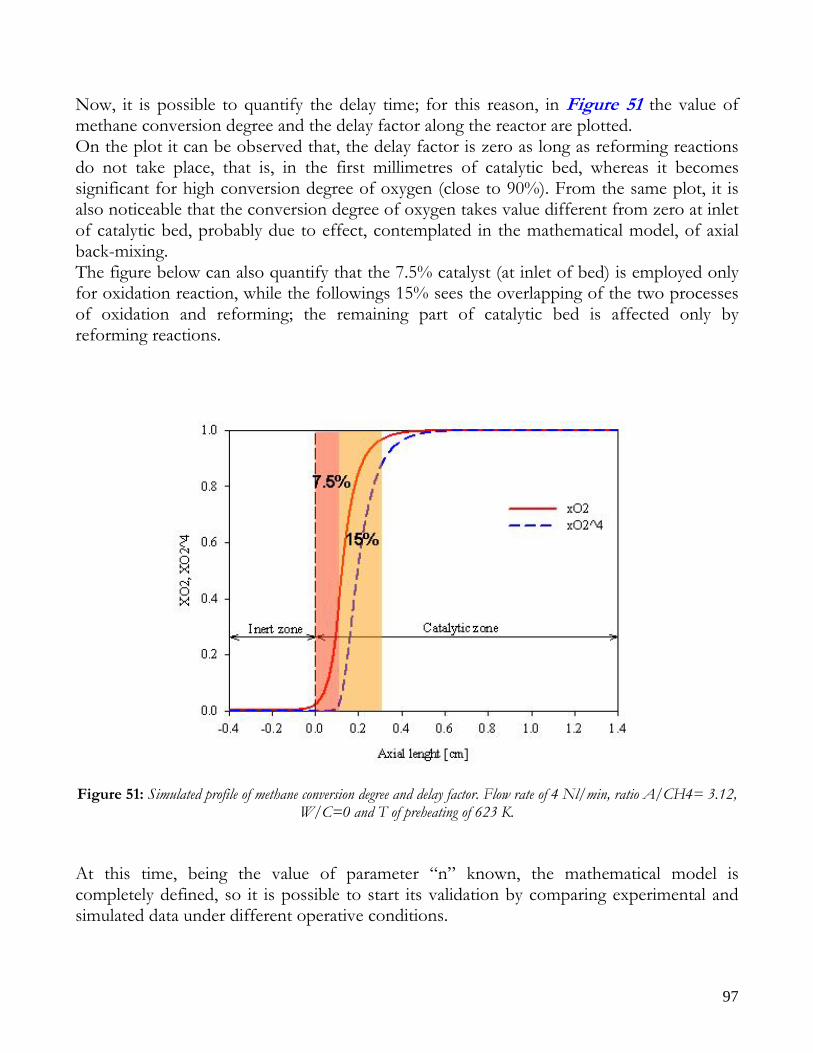
97
Now, it is possible to quantify the delay time; for this reason, in Figure 51 the value of methane conversion degree and the delay factor along the reactor are plotted. On the plot it can be observed that, the delay factor is zero as long as reforming reactions do not take place, that is, in the first millimetres of catalytic bed, whereas it becomes significant for high conversion degree of oxygen (close to 90%). From the same plot, it is also noticeable that the conversion degree of oxygen takes value different from zero at inlet of catalytic bed, probably due to effect, contemplated in the mathematical model, of axial back-mixing. The figure below can also quantify that the 7.5% catalyst (at inlet of bed) is employed only for oxidation reaction, while the followings 15% sees the overlapping of the two processes of oxidation and reforming; the remaining part of catalytic bed is affected only by reforming reactions.
Figure 51: Simulated profile of methane conversion degree and delay factor. Flow rate of 4 Nl/min, ratio A/CH4= 3.12,
W/C=0 and T of preheating of 623 K. At this time, being the value of parameter “n” known, the mathematical model is completely defined, so it is possible to start its validation by comparing experimental and simulated data under different operative conditions.
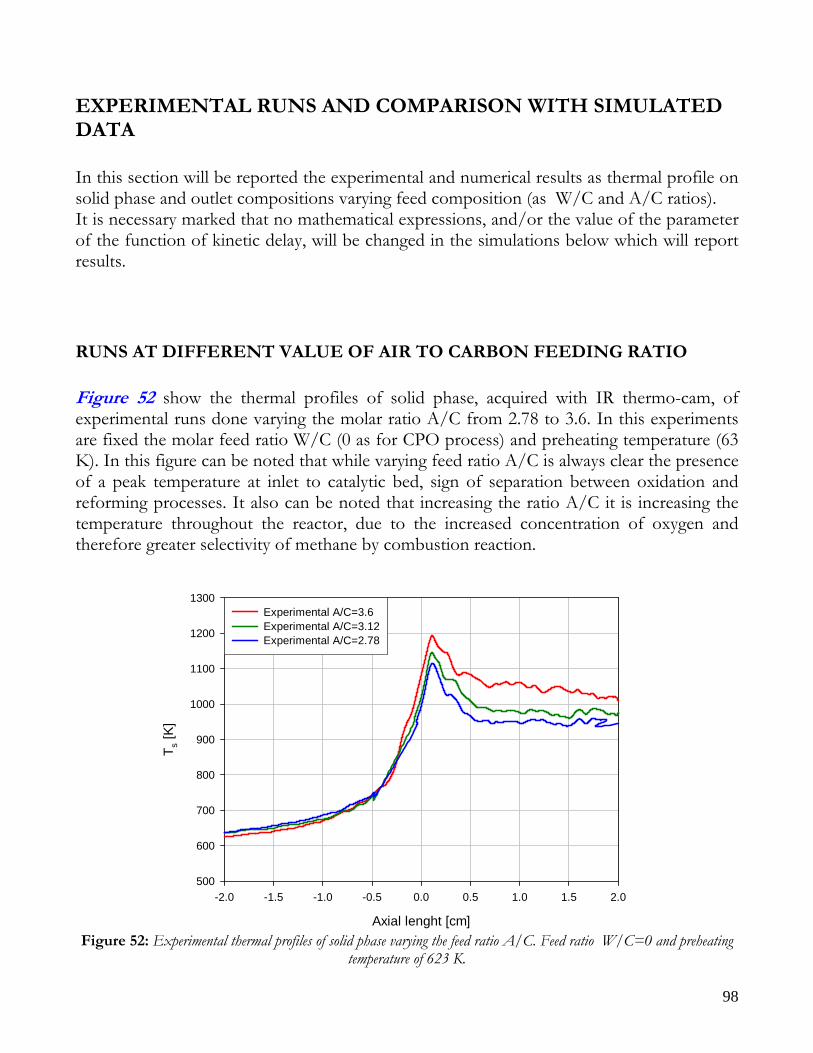
98
EXPERIMENTAL RUNS AND COMPARISON WITH SIMULATED DATA In this section will be reported the experimental and numerical results as thermal profile on solid phase and outlet compositions varying feed composition (as W/C and A/C ratios). It is necessary marked that no mathematical expressions, and/or the value of the parameter of the function of kinetic delay, will be changed in the simulations below which will report results.
RUNS AT DIFFERENT VALUE OF AIR TO CARBON FEEDING RATIO Figure 52 show the thermal profiles of solid phase, acquired with IR thermo-cam, of experimental runs done varying the molar ratio A/C from 2.78 to 3.6. In this experiments are fixed the molar feed ratio W/C (0 as for CPO process) and preheating temperature (63 K). In this figure can be noted that while varying feed ratio A/C is always clear the presence of a peak temperature at inlet to catalytic bed, sign of separation between oxidation and reforming processes. It also can be noted that increasing the ratio A/C it is increasing the temperature throughout the reactor, due to the increased concentration of oxygen and therefore greater selectivity of methane by combustion reaction.
Axial lenght [cm]
-2.0 -1.5 -1.0 -0.5 0.0 0.5 1.0 1.5 2.0
T s [K]
500
600
700
800
900
1000
1100
1200
1300Experimental A/C=3.6Experimental A/C=3.12Experimental A/C=2.78
Figure 52: Experimental thermal profiles of solid phase varying the feed ratio A/C. Feed ratio W/C=0 and preheating
temperature of 623 K.
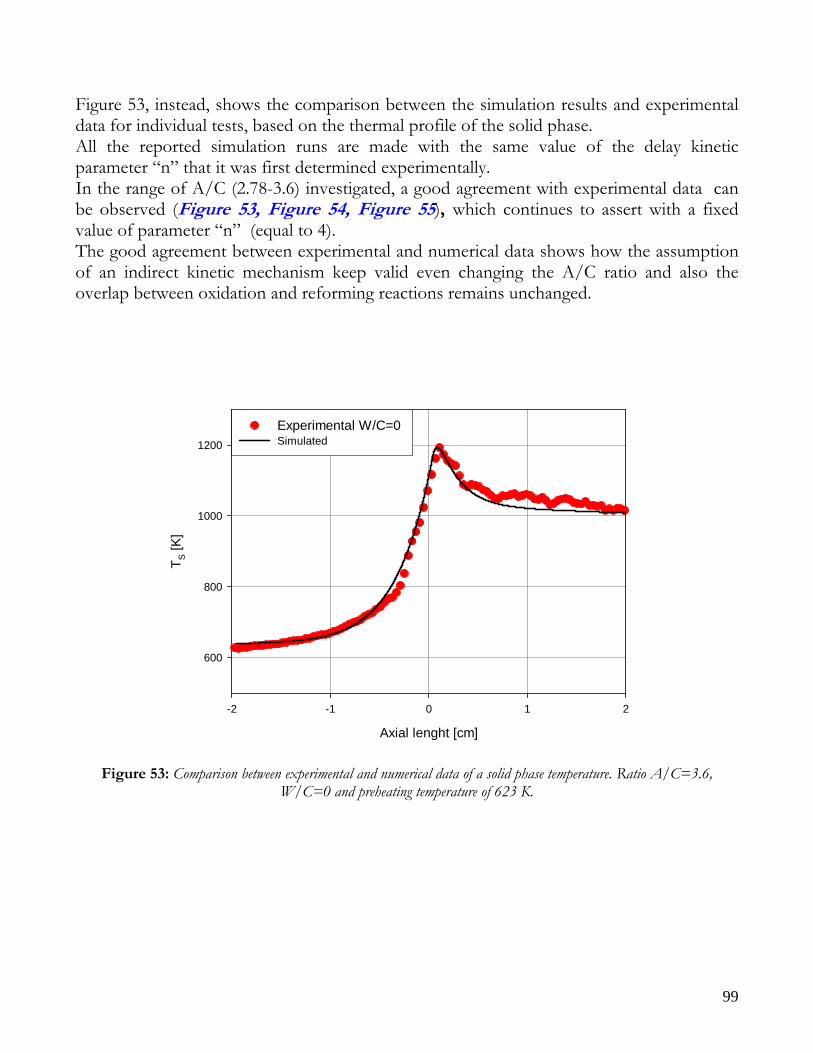
99
Figure 53, instead, shows the comparison between the simulation results and experimental data for individual tests, based on the thermal profile of the solid phase. All the reported simulation runs are made with the same value of the delay kinetic parameter “n” that it was first determined experimentally. In the range of A/C (2.78-3.6) investigated, a good agreement with experimental data can be observed (Figure 53, Figure 54, Figure 55), which continues to assert with a fixed value of parameter “n” (equal to 4). The good agreement between experimental and numerical data shows how the assumption of an indirect kinetic mechanism keep valid even changing the A/C ratio and also the overlap between oxidation and reforming reactions remains unchanged.
Axial lenght [cm]
-2 -1 0 1 2
T S [K
]
600
800
1000
1200
Experimental W/C=0 Simulated
Figure 53: Comparison between experimental and numerical data of a solid phase temperature. Ratio A/C=3.6, W/C=0 and preheating temperature of 623 K.
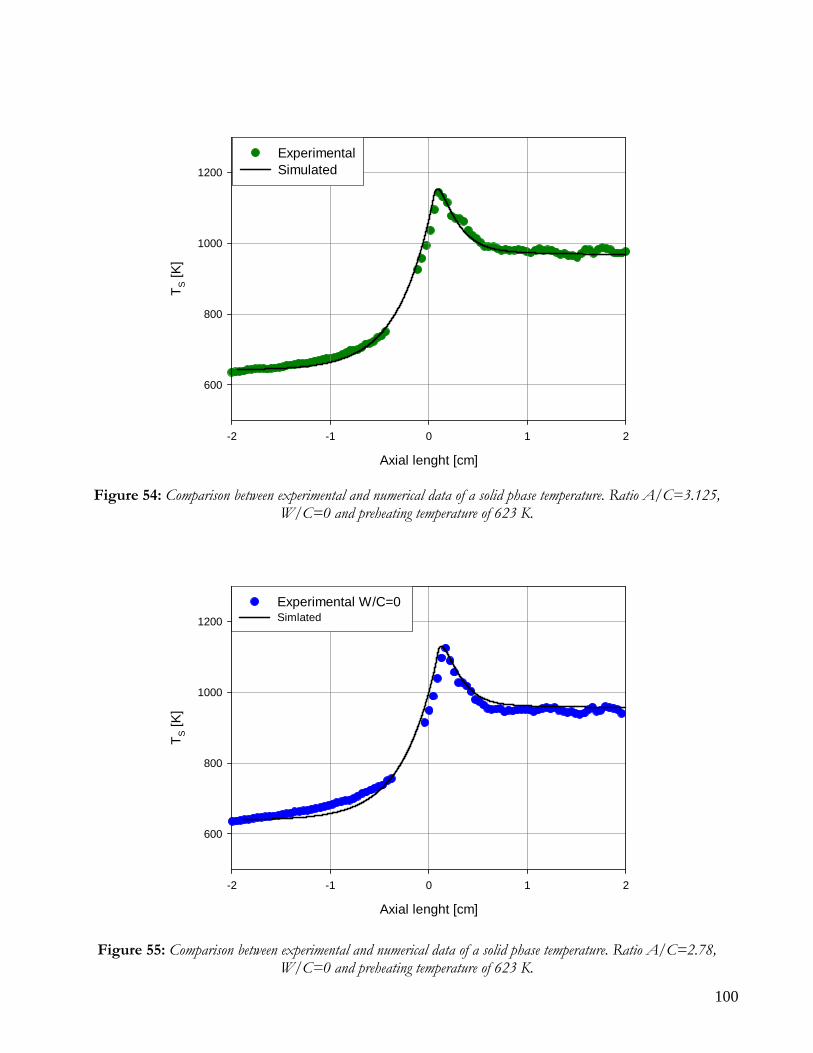
100
Axial lenght [cm]
-2 -1 0 1 2
T S [K
]
600
800
1000
1200
ExperimentalSimulated
Figure 54: Comparison between experimental and numerical data of a solid phase temperature. Ratio A/C=3.125, W/C=0 and preheating temperature of 623 K.
Axial lenght [cm]
-2 -1 0 1 2
T S [K
]
600
800
1000
1200
Experimental W/C=0 Simlated
Figure 55: Comparison between experimental and numerical data of a solid phase temperature. Ratio A/C=2.78, W/C=0 and preheating temperature of 623 K.
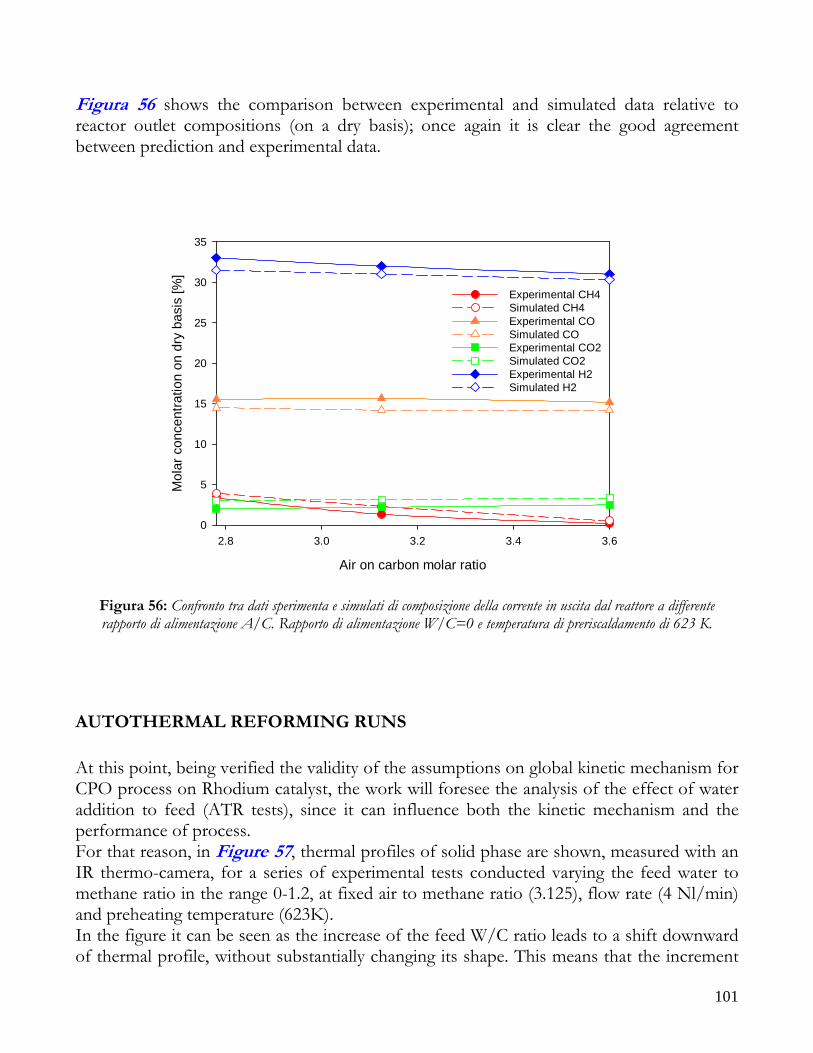
101
Figura 56 shows the comparison between experimental and simulated data relative to reactor outlet compositions (on a dry basis); once again it is clear the good agreement between prediction and experimental data.
Air on carbon molar ratio
2.8 3.0 3.2 3.4 3.6
Mol
ar c
once
ntra
tion
on d
ry b
asis
[%]
0
5
10
15
20
25
30
35
Experimental CH4Simulated CH4Experimental COSimulated COExperimental CO2Simulated CO2Experimental H2Simulated H2
Figura 56: Confronto tra dati sperimenta e simulati di composizione della corrente in uscita dal reattore a differente rapporto di alimentazione A/C. Rapporto di alimentazione W/C=0 e temperatura di preriscaldamento di 623 K.
AUTOTHERMAL REFORMING RUNS At this point, being verified the validity of the assumptions on global kinetic mechanism for CPO process on Rhodium catalyst, the work will foresee the analysis of the effect of water addition to feed (ATR tests), since it can influence both the kinetic mechanism and the performance of process. For that reason, in Figure 57, thermal profiles of solid phase are shown, measured with an IR thermo-camera, for a series of experimental tests conducted varying the feed water to methane ratio in the range 0-1.2, at fixed air to methane ratio (3.125), flow rate (4 Nl/min) and preheating temperature (623K). In the figure it can be seen as the increase of the feed W/C ratio leads to a shift downward of thermal profile, without substantially changing its shape. This means that the increment
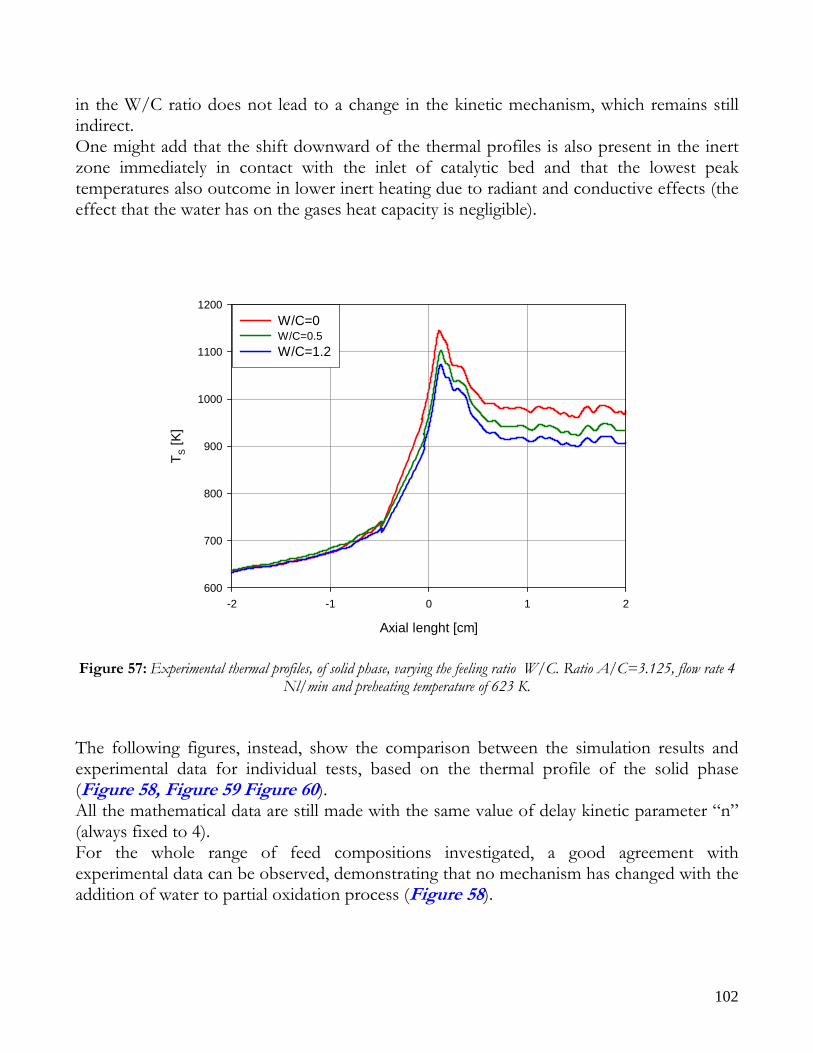
102
in the W/C ratio does not lead to a change in the kinetic mechanism, which remains still indirect. One might add that the shift downward of the thermal profiles is also present in the inert zone immediately in contact with the inlet of catalytic bed and that the lowest peak temperatures also outcome in lower inert heating due to radiant and conductive effects (the effect that the water has on the gases heat capacity is negligible).
Axial lenght [cm]
-2 -1 0 1 2
T S [K
]
600
700
800
900
1000
1100
1200W/C=0W/C=0.5W/C=1.2
Figure 57: Experimental thermal profiles, of solid phase, varying the feeling ratio W/C. Ratio A/C=3.125, flow rate 4
Nl/min and preheating temperature of 623 K. The following figures, instead, show the comparison between the simulation results and experimental data for individual tests, based on the thermal profile of the solid phase (Figure 58, Figure 59 Figure 60). All the mathematical data are still made with the same value of delay kinetic parameter “n” (always fixed to 4). For the whole range of feed compositions investigated, a good agreement with experimental data can be observed, demonstrating that no mechanism has changed with the addition of water to partial oxidation process (Figure 58).
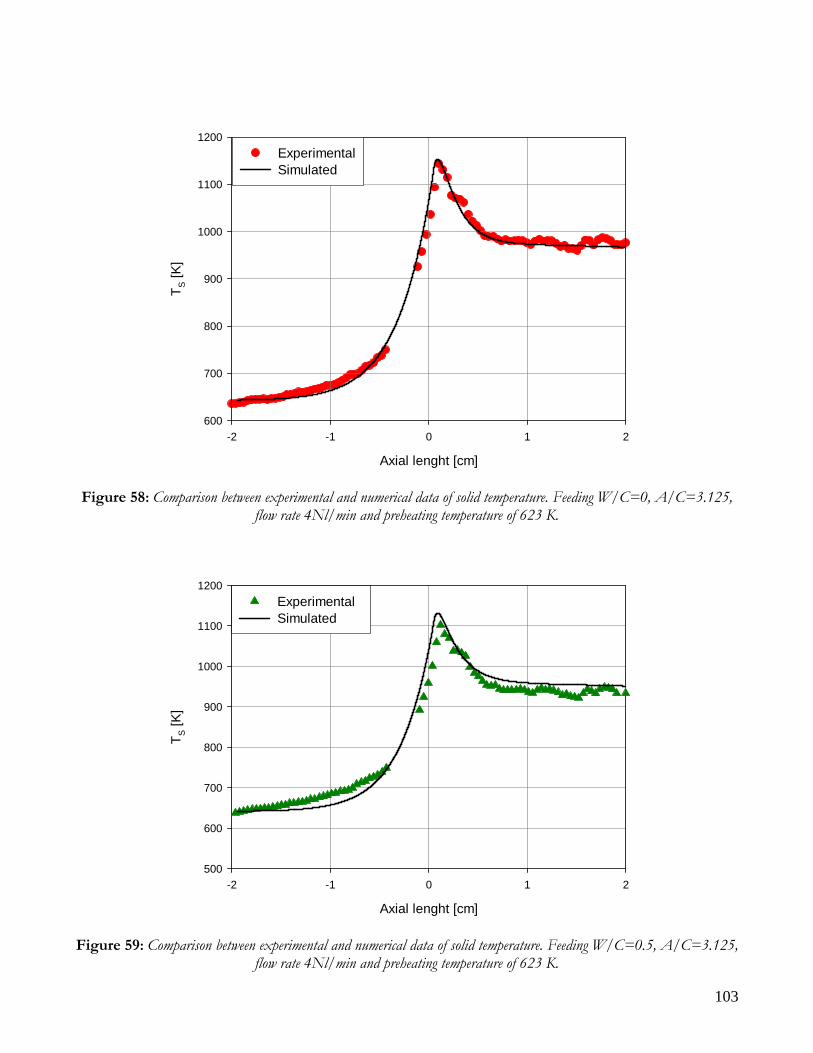
103
Axial lenght [cm]
-2 -1 0 1 2
T S [K
]
600
700
800
900
1000
1100
1200ExperimentalSimulated
Figure 58: Comparison between experimental and numerical data of solid temperature. Feeding W/C=0, A/C=3.125,
flow rate 4Nl/min and preheating temperature of 623 K.
Axial lenght [cm]
-2 -1 0 1 2
T S [K
]
500
600
700
800
900
1000
1100
1200Experimental Simulated
Figure 59: Comparison between experimental and numerical data of solid temperature. Feeding W/C=0.5, A/C=3.125,
flow rate 4Nl/min and preheating temperature of 623 K.
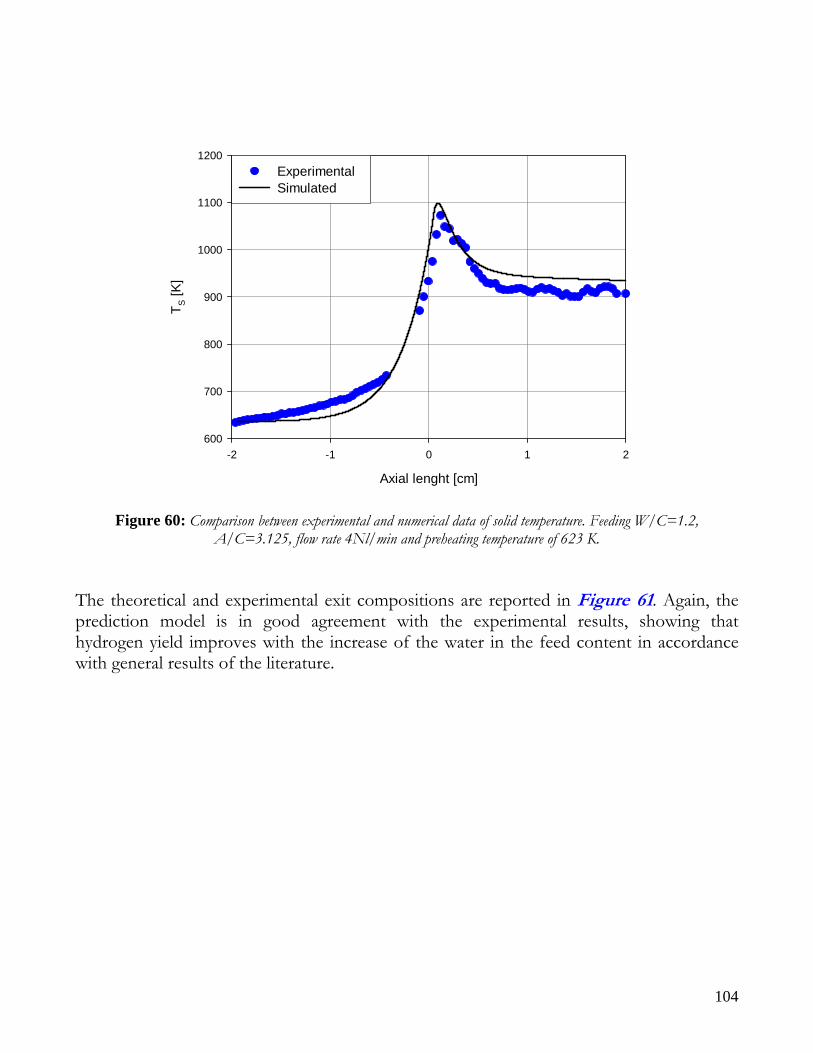
104
Axial lenght [cm]
-2 -1 0 1 2
T S [K
]
600
700
800
900
1000
1100
1200Experimental Simulated
Figure 60: Comparison between experimental and numerical data of solid temperature. Feeding W/C=1.2, A/C=3.125, flow rate 4Nl/min and preheating temperature of 623 K.
The theoretical and experimental exit compositions are reported in Figure 61. Again, the prediction model is in good agreement with the experimental results, showing that hydrogen yield improves with the increase of the water in the feed content in accordance with general results of the literature.
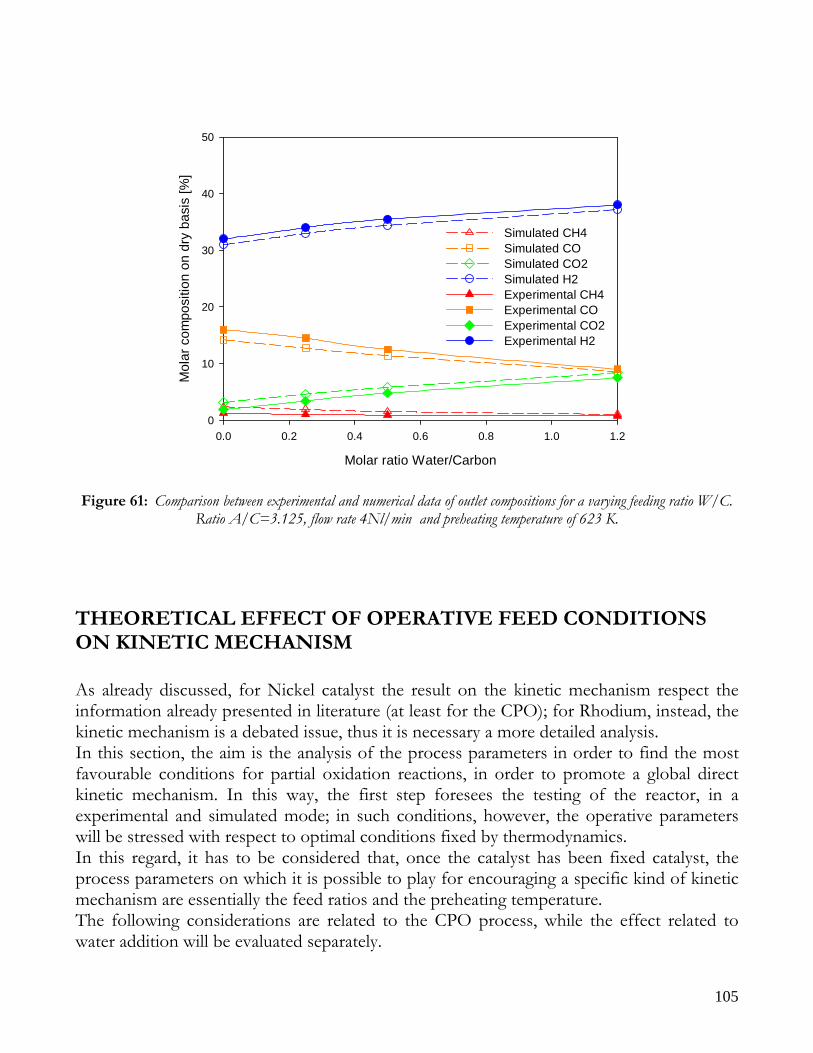
105
Molar ratio Water/Carbon
0.0 0.2 0.4 0.6 0.8 1.0 1.2
Mol
ar c
ompo
sitio
n on
dry
bas
is [%
]
0
10
20
30
40
50
Simulated CH4Simulated COSimulated CO2Simulated H2Experimental CH4Experimental COExperimental CO2Experimental H2
Figure 61: Comparison between experimental and numerical data of outlet compositions for a varying feeding ratio W/C.
Ratio A/C=3.125, flow rate 4Nl/min and preheating temperature of 623 K.
THEORETICAL EFFECT OF OPERATIVE FEED CONDITIONS ON KINETIC MECHANISM As already discussed, for Nickel catalyst the result on the kinetic mechanism respect the information already presented in literature (at least for the CPO); for Rhodium, instead, the kinetic mechanism is a debated issue, thus it is necessary a more detailed analysis. In this section, the aim is the analysis of the process parameters in order to find the most favourable conditions for partial oxidation reactions, in order to promote a global direct kinetic mechanism. In this way, the first step foresees the testing of the reactor, in a experimental and simulated mode; in such conditions, however, the operative parameters will be stressed with respect to optimal conditions fixed by thermodynamics. In this regard, it has to be considered that, once the catalyst has been fixed catalyst, the process parameters on which it is possible to play for encouraging a specific kind of kinetic mechanism are essentially the feed ratios and the preheating temperature. The following considerations are related to the CPO process, while the effect related to water addition will be evaluated separately.
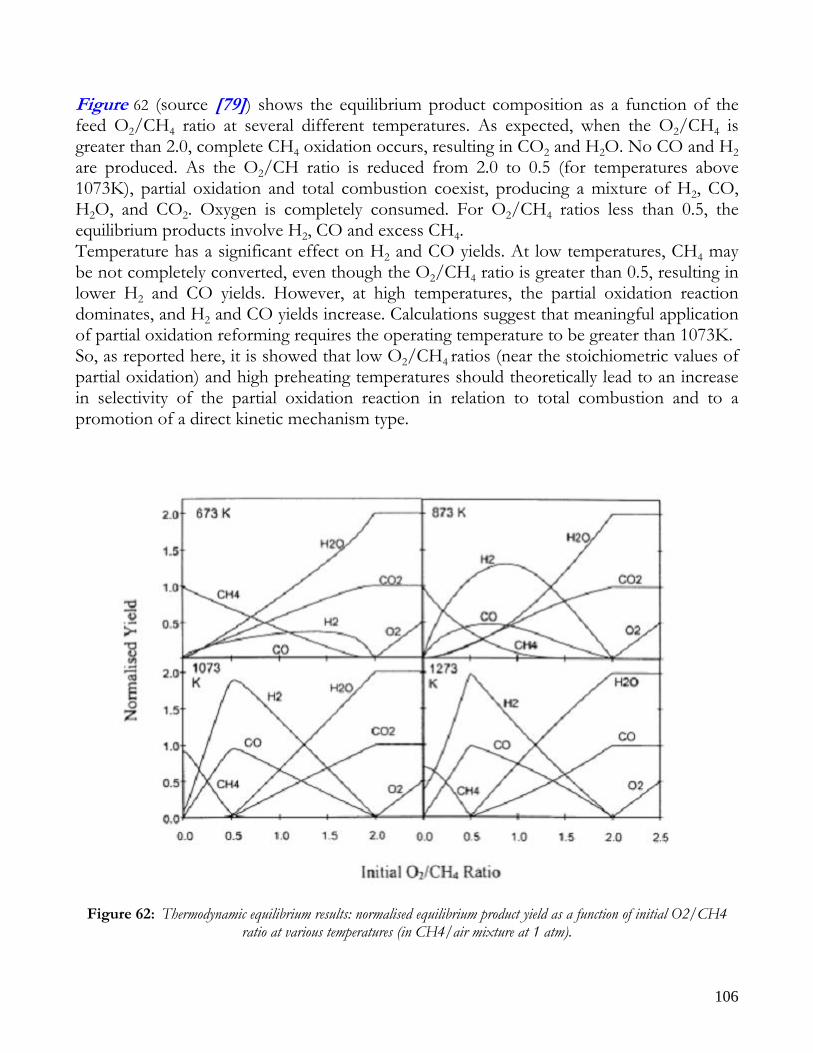
106
Figure 62 (source [79]) shows the equilibrium product composition as a function of the feed O2/CH4 ratio at several different temperatures. As expected, when the O2/CH4 is greater than 2.0, complete CH4 oxidation occurs, resulting in CO2 and H2O. No CO and H2 are produced. As the O2/CH ratio is reduced from 2.0 to 0.5 (for temperatures above 1073K), partial oxidation and total combustion coexist, producing a mixture of H2, CO, H2O, and CO2. Oxygen is completely consumed. For O2/CH4 ratios less than 0.5, the equilibrium products involve H2, CO and excess CH4. Temperature has a significant effect on H2 and CO yields. At low temperatures, CH4 may be not completely converted, even though the O2/CH4 ratio is greater than 0.5, resulting in lower H2 and CO yields. However, at high temperatures, the partial oxidation reaction dominates, and H2 and CO yields increase. Calculations suggest that meaningful application of partial oxidation reforming requires the operating temperature to be greater than 1073K. So, as reported here, it is showed that low O2/CH4 ratios (near the stoichiometric values of partial oxidation) and high preheating temperatures should theoretically lead to an increase in selectivity of the partial oxidation reaction in relation to total combustion and to a promotion of a direct kinetic mechanism type.
Figure 62: Thermodynamic equilibrium results: normalised equilibrium product yield as a function of initial O2/CH4 ratio at various temperatures (in CH4/air mixture at 1 atm).
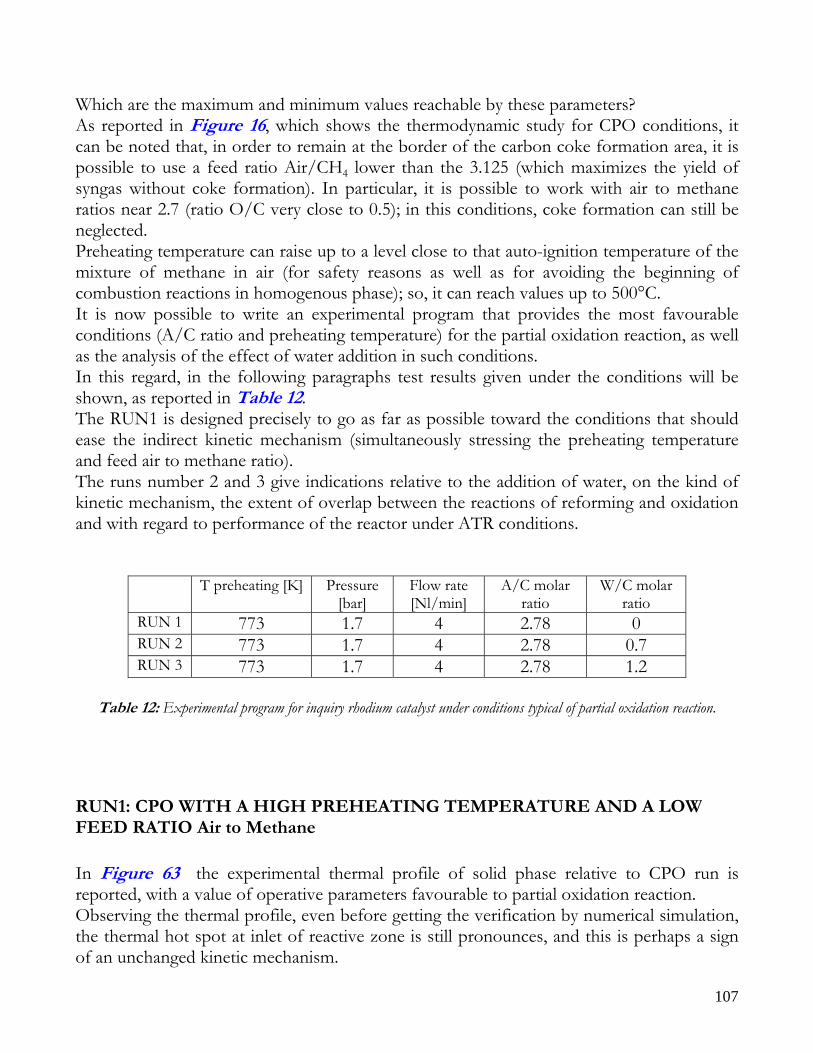
107
Which are the maximum and minimum values reachable by these parameters? As reported in Figure 16, which shows the thermodynamic study for CPO conditions, it can be noted that, in order to remain at the border of the carbon coke formation area, it is possible to use a feed ratio Air/CH4 lower than the 3.125 (which maximizes the yield of syngas without coke formation). In particular, it is possible to work with air to methane ratios near 2.7 (ratio O/C very close to 0.5); in this conditions, coke formation can still be neglected. Preheating temperature can raise up to a level close to that auto-ignition temperature of the mixture of methane in air (for safety reasons as well as for avoiding the beginning of combustion reactions in homogenous phase); so, it can reach values up to 500°C. It is now possible to write an experimental program that provides the most favourable conditions (A/C ratio and preheating temperature) for the partial oxidation reaction, as well as the analysis of the effect of water addition in such conditions. In this regard, in the following paragraphs test results given under the conditions will be shown, as reported in Table 12. The RUN1 is designed precisely to go as far as possible toward the conditions that should ease the indirect kinetic mechanism (simultaneously stressing the preheating temperature and feed air to methane ratio). The runs number 2 and 3 give indications relative to the addition of water, on the kind of kinetic mechanism, the extent of overlap between the reactions of reforming and oxidation and with regard to performance of the reactor under ATR conditions.
T preheating [K] Pressure [bar]
Flow rate [Nl/min]
A/C molar ratio
W/C molar ratio
RUN 1 773 1.7 4 2.78 0 RUN 2 773 1.7 4 2.78 0.7 RUN 3 773 1.7 4 2.78 1.2
Table 12: Experimental program for inquiry rhodium catalyst under conditions typical of partial oxidation reaction.
RUN1: CPO WITH A HIGH PREHEATING TEMPERATURE AND A LOW FEED RATIO Air to Methane In Figure 63 the experimental thermal profile of solid phase relative to CPO run is reported, with a value of operative parameters favourable to partial oxidation reaction. Observing the thermal profile, even before getting the verification by numerical simulation, the thermal hot spot at inlet of reactive zone is still pronounces, and this is perhaps a sign of an unchanged kinetic mechanism.
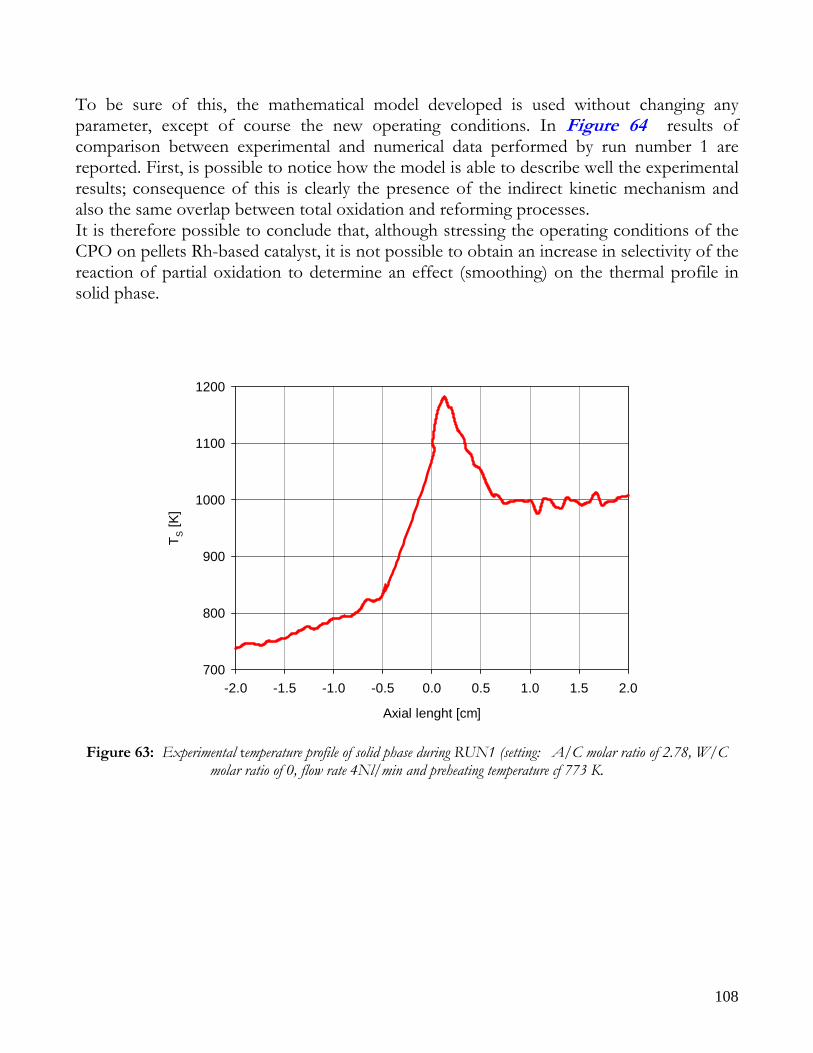
108
To be sure of this, the mathematical model developed is used without changing any parameter, except of course the new operating conditions. In Figure 64 results of comparison between experimental and numerical data performed by run number 1 are reported. First, is possible to notice how the model is able to describe well the experimental results; consequence of this is clearly the presence of the indirect kinetic mechanism and also the same overlap between total oxidation and reforming processes. It is therefore possible to conclude that, although stressing the operating conditions of the CPO on pellets Rh-based catalyst, it is not possible to obtain an increase in selectivity of the reaction of partial oxidation to determine an effect (smoothing) on the thermal profile in solid phase.
Axial lenght [cm]
-2.0 -1.5 -1.0 -0.5 0.0 0.5 1.0 1.5 2.0
T S [K
]
700
800
900
1000
1100
1200
Figure 63: Experimental temperature profile of solid phase during RUN1 (setting: A/C molar ratio of 2.78, W/C molar ratio of 0, flow rate 4Nl/min and preheating temperature cf 773 K.
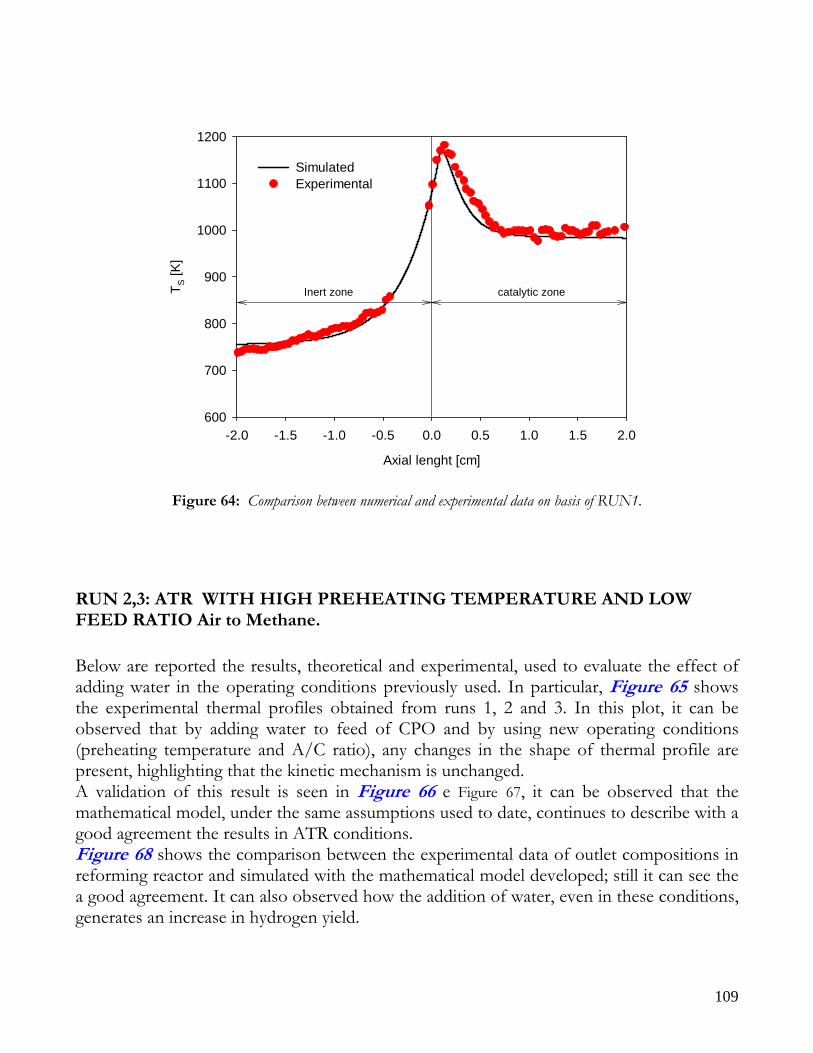
109
Figure 64: Comparison between numerical and experimental data on basis of RUN1.
RUN 2,3: ATR WITH HIGH PREHEATING TEMPERATURE AND LOW FEED RATIO Air to Methane. Below are reported the results, theoretical and experimental, used to evaluate the effect of adding water in the operating conditions previously used. In particular, Figure 65 shows the experimental thermal profiles obtained from runs 1, 2 and 3. In this plot, it can be observed that by adding water to feed of CPO and by using new operating conditions (preheating temperature and A/C ratio), any changes in the shape of thermal profile are present, highlighting that the kinetic mechanism is unchanged. A validation of this result is seen in Figure 66 e Figure 67, it can be observed that the mathematical model, under the same assumptions used to date, continues to describe with a good agreement the results in ATR conditions. Figure 68 shows the comparison between the experimental data of outlet compositions in reforming reactor and simulated with the mathematical model developed; still it can see the a good agreement. It can also observed how the addition of water, even in these conditions, generates an increase in hydrogen yield.
Axial lenght [cm]
-2.0 -1.5 -1.0 -0.5 0.0 0.5 1.0 1.5 2.0
T S [K
]
600
700
800
900
1000
1100
1200
SimulatedExperimental
Inert zone catalytic zone
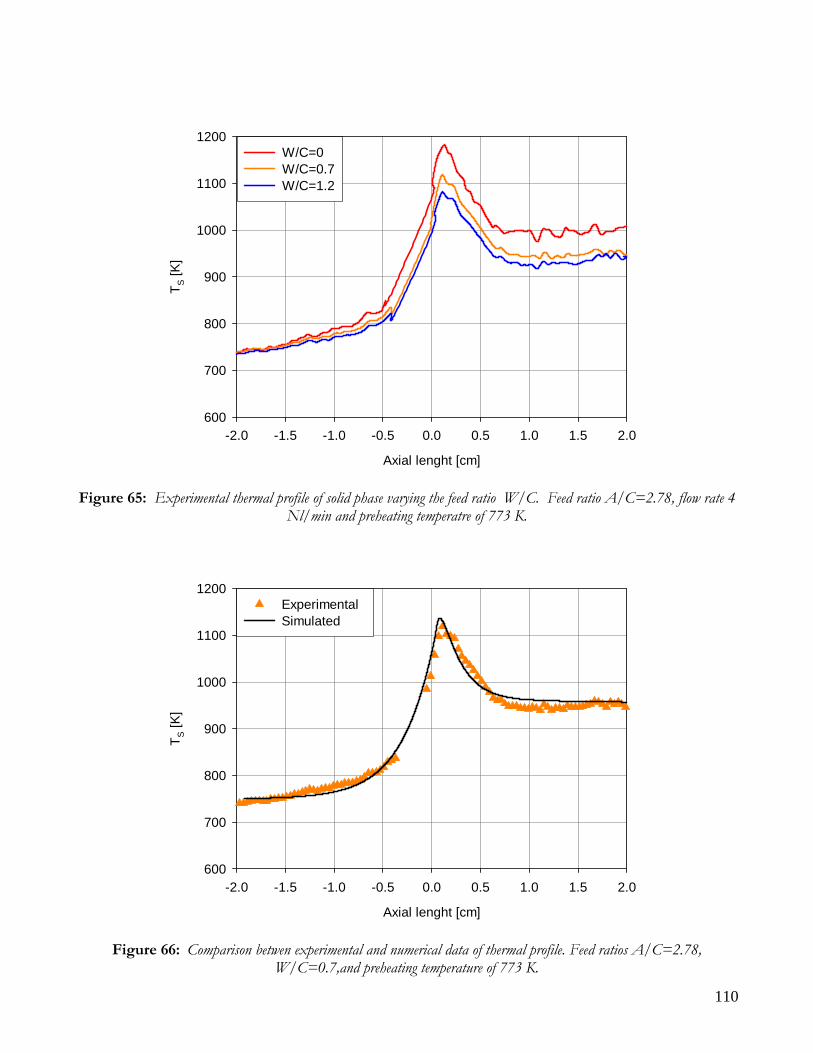
110
Axial lenght [cm]
-2.0 -1.5 -1.0 -0.5 0.0 0.5 1.0 1.5 2.0
T S [K
]
600
700
800
900
1000
1100
1200W/C=0W/C=0.7W/C=1.2
Figure 65: Experimental thermal profile of solid phase varying the feed ratio W/C. Feed ratio A/C=2.78, flow rate 4 Nl/min and preheating temperatre of 773 K.
Axial lenght [cm]
-2.0 -1.5 -1.0 -0.5 0.0 0.5 1.0 1.5 2.0
T S [K
]
600
700
800
900
1000
1100
1200Experimental Simulated
Figure 66: Comparison betwen experimental and numerical data of thermal profile. Feed ratios A/C=2.78, W/C=0.7,and preheating temperature of 773 K.
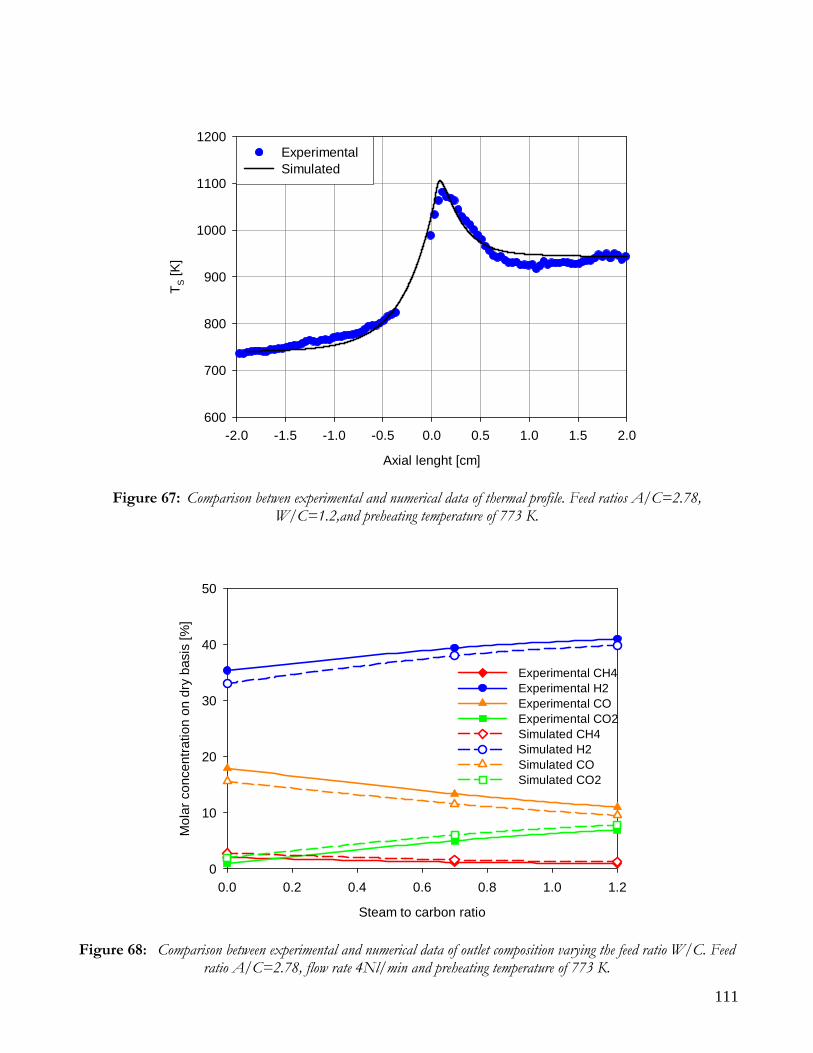
111
Axial lenght [cm]
-2.0 -1.5 -1.0 -0.5 0.0 0.5 1.0 1.5 2.0
T S [K
]
600
700
800
900
1000
1100
1200Experimental Simulated
Figure 67: Comparison betwen experimental and numerical data of thermal profile. Feed ratios A/C=2.78, W/C=1.2,and preheating temperature of 773 K.
Steam to carbon ratio
0.0 0.2 0.4 0.6 0.8 1.0 1.2
Mol
ar c
once
ntra
tion
on d
ry b
asis
[%]
0
10
20
30
40
50
Experimental CH4 Experimental H2Experimental COExperimental CO2Simulated CH4Simulated H2Simulated COSimulated CO2
Figure 68: Comparison between experimental and numerical data of outlet composition varying the feed ratio W/C. Feed
ratio A/C=2.78, flow rate 4Nl/min and preheating temperature of 773 K.
112
CONCLUSIONS ON RHODIUM CATALYST In Rhodium chapter, the model described for Nichel has been extended, for CPO and ATR process on the Rhodium-based catalyst. In the mathematical model, the kinetics of oxidation, reforming and water gas shift reported in the literature and typical of such a catalytic system have been employed. The idea of kinetic indirect mechanism, with shifting of the reforming region downstream the oxidative one, has been maintained, so the validity of this assumption has been verified even on Rhodium catalyst. An experimental campaign was carried out, firstly to demonstrate the kind of mechanism established for CPO and ATR processes and then operating conditions were stressed to those values which should favourite the selectivity of the partial oxidation reaction over the total oxidation. In particular performance in terms of thermal profiles in solid phase and outlet composition were estimated by varying the feed ratios H2O/CH4 in the range 0-2, Air/CH4 in the range 2.78-3125 and preheating temperature in 623-773K. For all operating conditions a good agreement between experimental and simulated data was obtained. Thus, the results obtained can be listed as follows:
The kinetic mechanism of methane ATR on Rhodium commercial catalyst (supported on alumina pellets) is indirect;
The addition of water to feed does not determine a better overlapping between the
reforming and oxidation reactions and it does not change the kinetic mechanism, that is still indirect;
The chemical stratification of the Rhodium catalyst under combined feed of oxygen
and methane determines that the 7.5% of the catalytic bed is initially employed only for the oxidation reaction;
The use of mixtures with a low methane to oxygen feed ratio does not favour
direct partial oxidation processes over the total combustion and does not change the entity of the overlapping between the endothermic and exothermic region;
A higher preheating temperature (close to the auto-ignition one) does not
advantage the selectivity of partial oxidation over the total combustion and does not modify the entity of the overlapping between the endothermic and exothermic region.
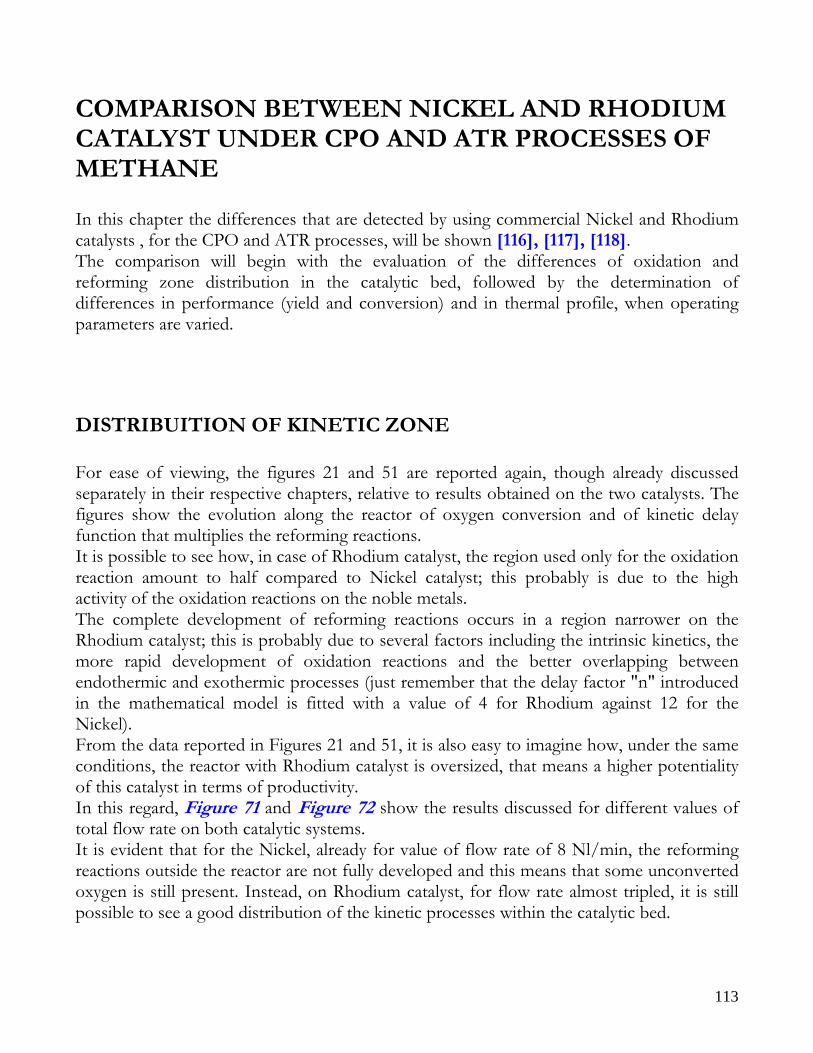
113
COMPARISON BETWEEN NICKEL AND RHODIUM CATALYST UNDER CPO AND ATR PROCESSES OF METHANE In this chapter the differences that are detected by using commercial Nickel and Rhodium catalysts , for the CPO and ATR processes, will be shown [116], [117], [118]. The comparison will begin with the evaluation of the differences of oxidation and reforming zone distribution in the catalytic bed, followed by the determination of differences in performance (yield and conversion) and in thermal profile, when operating parameters are varied.
DISTRIBUITION OF KINETIC ZONE For ease of viewing, the figures 21 and 51 are reported again, though already discussed separately in their respective chapters, relative to results obtained on the two catalysts. The figures show the evolution along the reactor of oxygen conversion and of kinetic delay function that multiplies the reforming reactions. It is possible to see how, in case of Rhodium catalyst, the region used only for the oxidation reaction amount to half compared to Nickel catalyst; this probably is due to the high activity of the oxidation reactions on the noble metals. The complete development of reforming reactions occurs in a region narrower on the Rhodium catalyst; this is probably due to several factors including the intrinsic kinetics, the more rapid development of oxidation reactions and the better overlapping between endothermic and exothermic processes (just remember that the delay factor "n" introduced in the mathematical model is fitted with a value of 4 for Rhodium against 12 for the Nickel). From the data reported in Figures 21 and 51, it is also easy to imagine how, under the same conditions, the reactor with Rhodium catalyst is oversized, that means a higher potentiality of this catalyst in terms of productivity. In this regard, Figure 71 and Figure 72 show the results discussed for different values of total flow rate on both catalytic systems. It is evident that for the Nickel, already for value of flow rate of 8 Nl/min, the reforming reactions outside the reactor are not fully developed and this means that some unconverted oxygen is still present. Instead, on Rhodium catalyst, for flow rate almost tripled, it is still possible to see a good distribution of the kinetic processes within the catalytic bed.
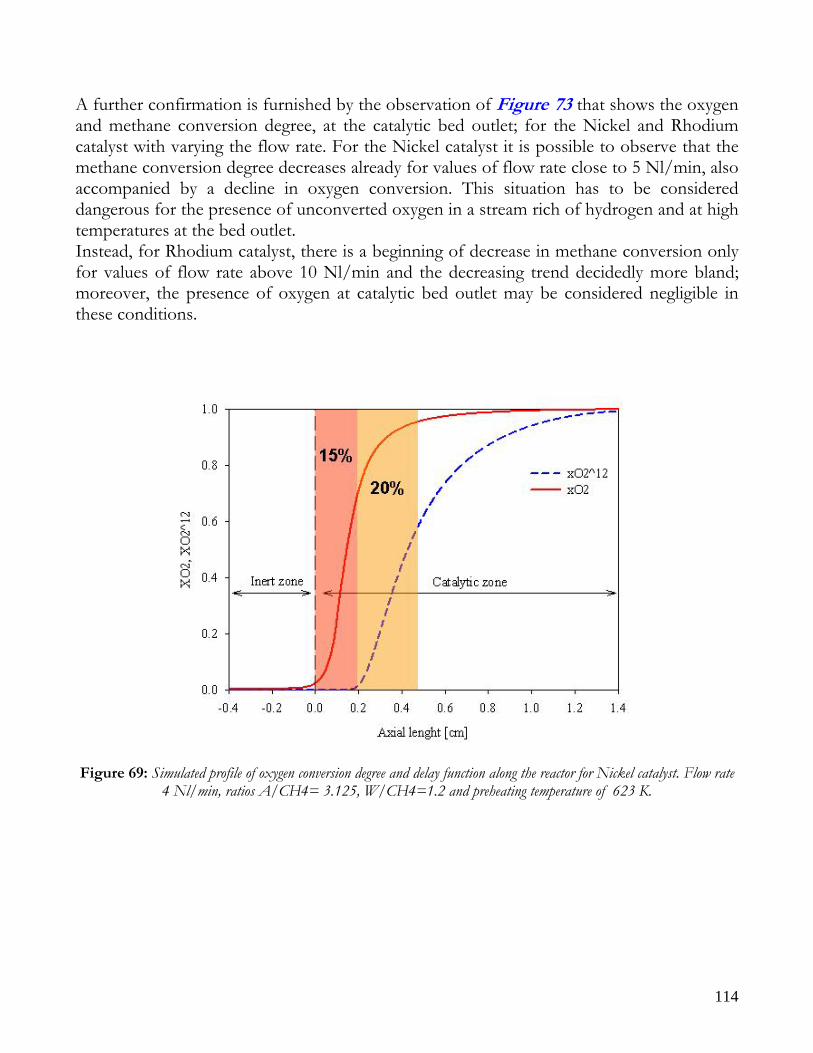
114
A further confirmation is furnished by the observation of Figure 73 that shows the oxygen and methane conversion degree, at the catalytic bed outlet; for the Nickel and Rhodium catalyst with varying the flow rate. For the Nickel catalyst it is possible to observe that the methane conversion degree decreases already for values of flow rate close to 5 Nl/min, also accompanied by a decline in oxygen conversion. This situation has to be considered dangerous for the presence of unconverted oxygen in a stream rich of hydrogen and at high temperatures at the bed outlet. Instead, for Rhodium catalyst, there is a beginning of decrease in methane conversion only for values of flow rate above 10 Nl/min and the decreasing trend decidedly more bland; moreover, the presence of oxygen at catalytic bed outlet may be considered negligible in these conditions.
Figure 69: Simulated profile of oxygen conversion degree and delay function along the reactor for Nickel catalyst. Flow rate
4 Nl/min, ratios A/CH4= 3.125, W/CH4=1.2 and preheating temperature of 623 K.
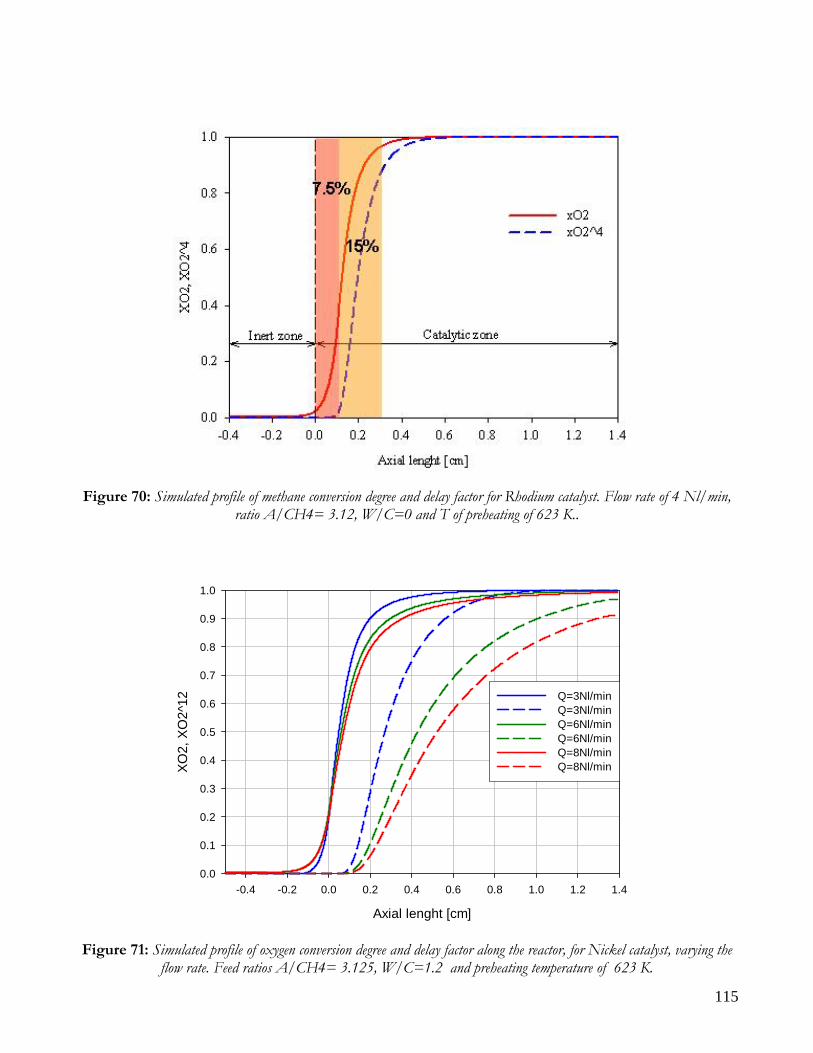
115
Figure 70: Simulated profile of methane conversion degree and delay factor for Rhodium catalyst. Flow rate of 4 Nl/min,
ratio A/CH4= 3.12, W/C=0 and T of preheating of 623 K..
Axial lenght [cm]
-0.4 -0.2 0.0 0.2 0.4 0.6 0.8 1.0 1.2 1.4
XO2,
XO
2^12
0.0
0.1
0.2
0.3
0.4
0.5
0.6
0.7
0.8
0.9
1.0
Q=3Nl/minQ=3Nl/minQ=6Nl/minQ=6Nl/minQ=8Nl/minQ=8Nl/min
Figure 71: Simulated profile of oxygen conversion degree and delay factor along the reactor, for Nickel catalyst, varying the
flow rate. Feed ratios A/CH4= 3.125, W/C=1.2 and preheating temperature of 623 K.
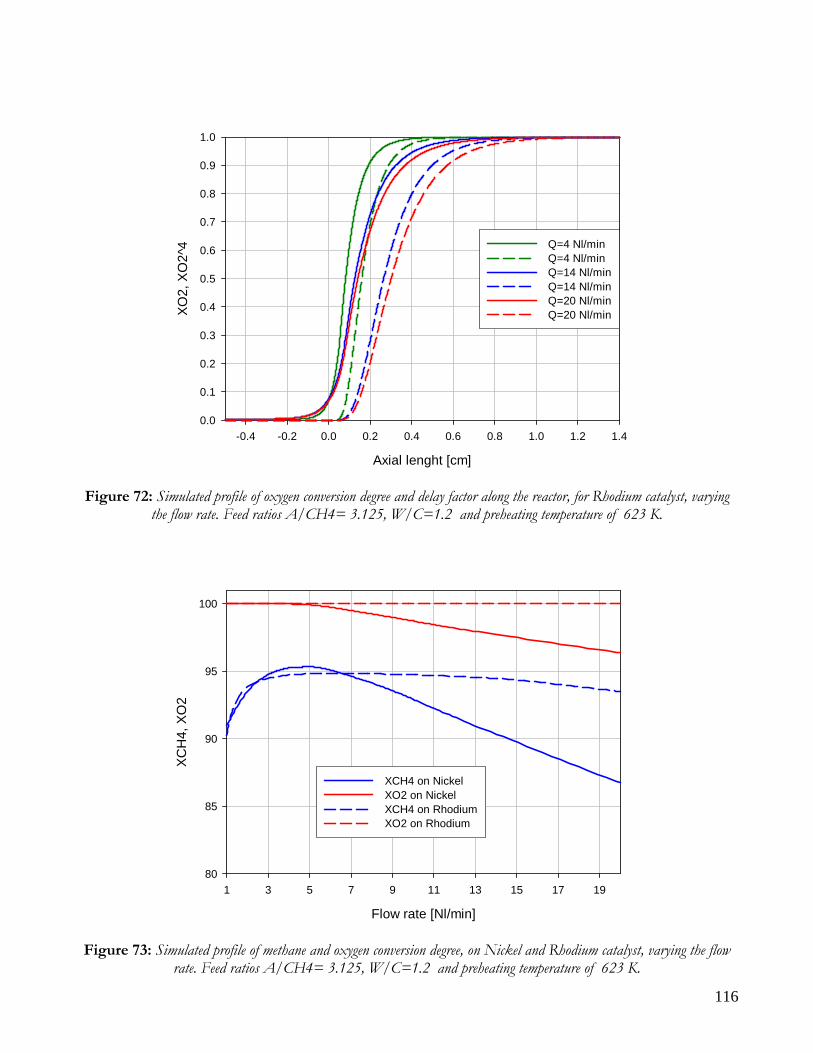
116
Axial lenght [cm]
-0.4 -0.2 0.0 0.2 0.4 0.6 0.8 1.0 1.2 1.4
XO2,
XO
2^4
0.0
0.1
0.2
0.3
0.4
0.5
0.6
0.7
0.8
0.9
1.0
Q=4 Nl/minQ=4 Nl/minQ=14 Nl/minQ=14 Nl/minQ=20 Nl/minQ=20 Nl/min
Figure 72: Simulated profile of oxygen conversion degree and delay factor along the reactor, for Rhodium catalyst, varying the flow rate. Feed ratios A/CH4= 3.125, W/C=1.2 and preheating temperature of 623 K.
Flow rate [Nl/min]
1 3 5 7 9 11 13 15 17 19
XCH
4, X
O2
80
85
90
95
100
XCH4 on NickelXO2 on NickelXCH4 on RhodiumXO2 on Rhodium
Figure 73: Simulated profile of methane and oxygen conversion degree, on Nickel and Rhodium catalyst, varying the flow rate. Feed ratios A/CH4= 3.125, W/C=1.2 and preheating temperature of 623 K.
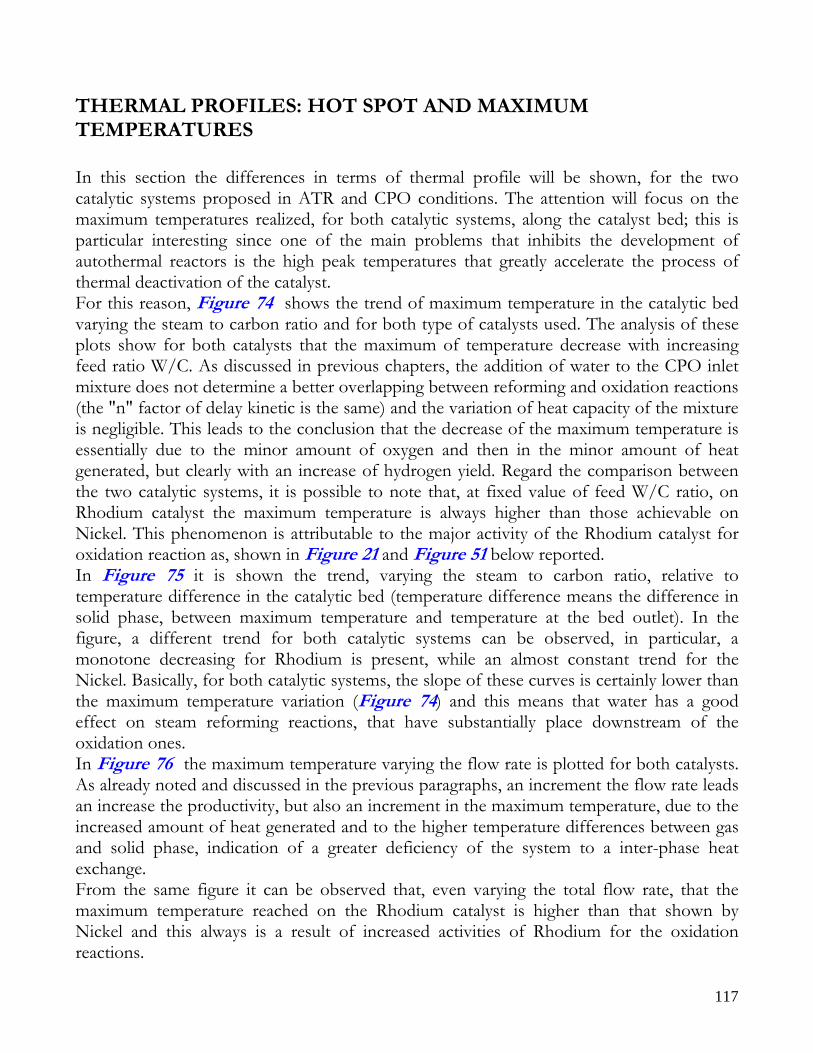
117
THERMAL PROFILES: HOT SPOT AND MAXIMUM TEMPERATURES In this section the differences in terms of thermal profile will be shown, for the two catalytic systems proposed in ATR and CPO conditions. The attention will focus on the maximum temperatures realized, for both catalytic systems, along the catalyst bed; this is particular interesting since one of the main problems that inhibits the development of autothermal reactors is the high peak temperatures that greatly accelerate the process of thermal deactivation of the catalyst. For this reason, Figure 74 shows the trend of maximum temperature in the catalytic bed varying the steam to carbon ratio and for both type of catalysts used. The analysis of these plots show for both catalysts that the maximum of temperature decrease with increasing feed ratio W/C. As discussed in previous chapters, the addition of water to the CPO inlet mixture does not determine a better overlapping between reforming and oxidation reactions (the "n" factor of delay kinetic is the same) and the variation of heat capacity of the mixture is negligible. This leads to the conclusion that the decrease of the maximum temperature is essentially due to the minor amount of oxygen and then in the minor amount of heat generated, but clearly with an increase of hydrogen yield. Regard the comparison between the two catalytic systems, it is possible to note that, at fixed value of feed W/C ratio, on Rhodium catalyst the maximum temperature is always higher than those achievable on Nickel. This phenomenon is attributable to the major activity of the Rhodium catalyst for oxidation reaction as, shown in Figure 21 and Figure 51 below reported. In Figure 75 it is shown the trend, varying the steam to carbon ratio, relative to temperature difference in the catalytic bed (temperature difference means the difference in solid phase, between maximum temperature and temperature at the bed outlet). In the figure, a different trend for both catalytic systems can be observed, in particular, a monotone decreasing for Rhodium is present, while an almost constant trend for the Nickel. Basically, for both catalytic systems, the slope of these curves is certainly lower than the maximum temperature variation (Figure 74) and this means that water has a good effect on steam reforming reactions, that have substantially place downstream of the oxidation ones. In Figure 76 the maximum temperature varying the flow rate is plotted for both catalysts. As already noted and discussed in the previous paragraphs, an increment the flow rate leads an increase the productivity, but also an increment in the maximum temperature, due to the increased amount of heat generated and to the higher temperature differences between gas and solid phase, indication of a greater deficiency of the system to a inter-phase heat exchange. From the same figure it can be observed that, even varying the total flow rate, that the maximum temperature reached on the Rhodium catalyst is higher than that shown by Nickel and this always is a result of increased activities of Rhodium for the oxidation reactions.
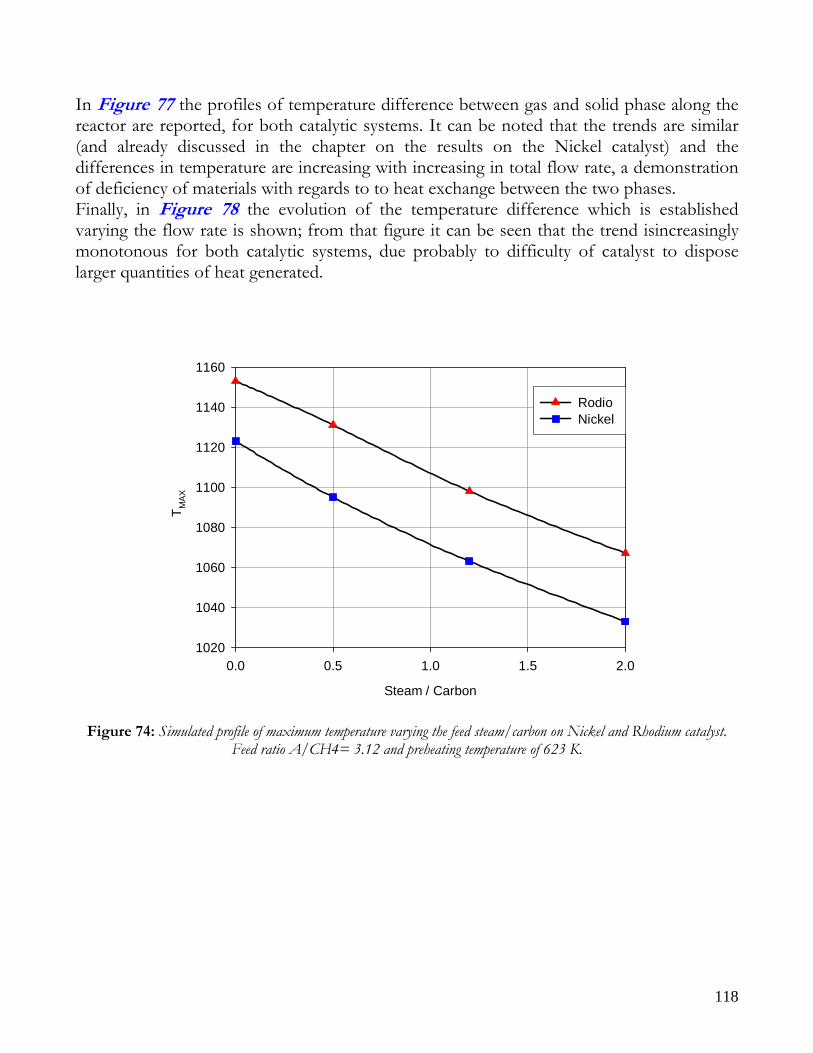
118
In Figure 77 the profiles of temperature difference between gas and solid phase along the reactor are reported, for both catalytic systems. It can be noted that the trends are similar (and already discussed in the chapter on the results on the Nickel catalyst) and the differences in temperature are increasing with increasing in total flow rate, a demonstration of deficiency of materials with regards to to heat exchange between the two phases. Finally, in Figure 78 the evolution of the temperature difference which is established varying the flow rate is shown; from that figure it can be seen that the trend isincreasingly monotonous for both catalytic systems, due probably to difficulty of catalyst to dispose larger quantities of heat generated.
Steam / Carbon
0.0 0.5 1.0 1.5 2.0
T MAX
1020
1040
1060
1080
1100
1120
1140
1160
Rodio Nickel
Figure 74: Simulated profile of maximum temperature varying the feed steam/carbon on Nickel and Rhodium catalyst. Feed ratio A/CH4= 3.12 and preheating temperature of 623 K.
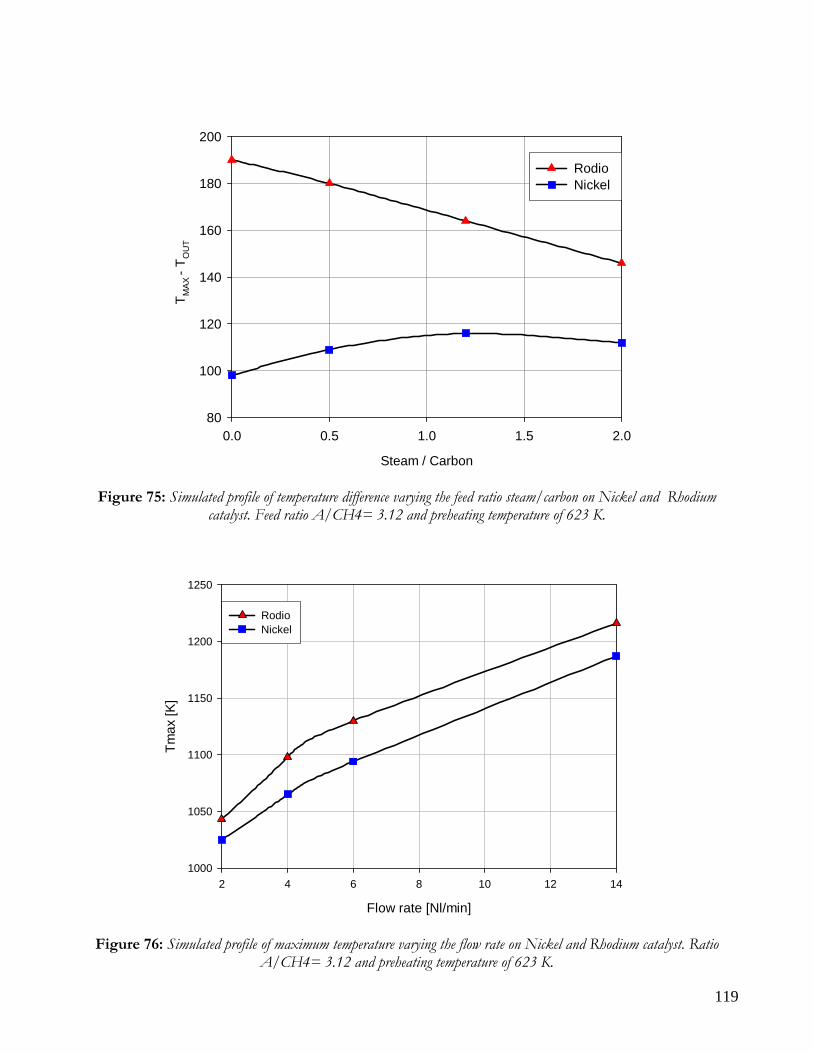
119
Steam / Carbon
0.0 0.5 1.0 1.5 2.0
T MAX
- T O
UT
80
100
120
140
160
180
200
Rodio Nickel
Figure 75: Simulated profile of temperature difference varying the feed ratio steam/carbon on Nickel and Rhodium catalyst. Feed ratio A/CH4= 3.12 and preheating temperature of 623 K.
Flow rate [Nl/min]
2 4 6 8 10 12 14
Tmax
[K]
1000
1050
1100
1150
1200
1250
RodioNickel
Figure 76: Simulated profile of maximum temperature varying the flow rate on Nickel and Rhodium catalyst. Ratio A/CH4= 3.12 and preheating temperature of 623 K.
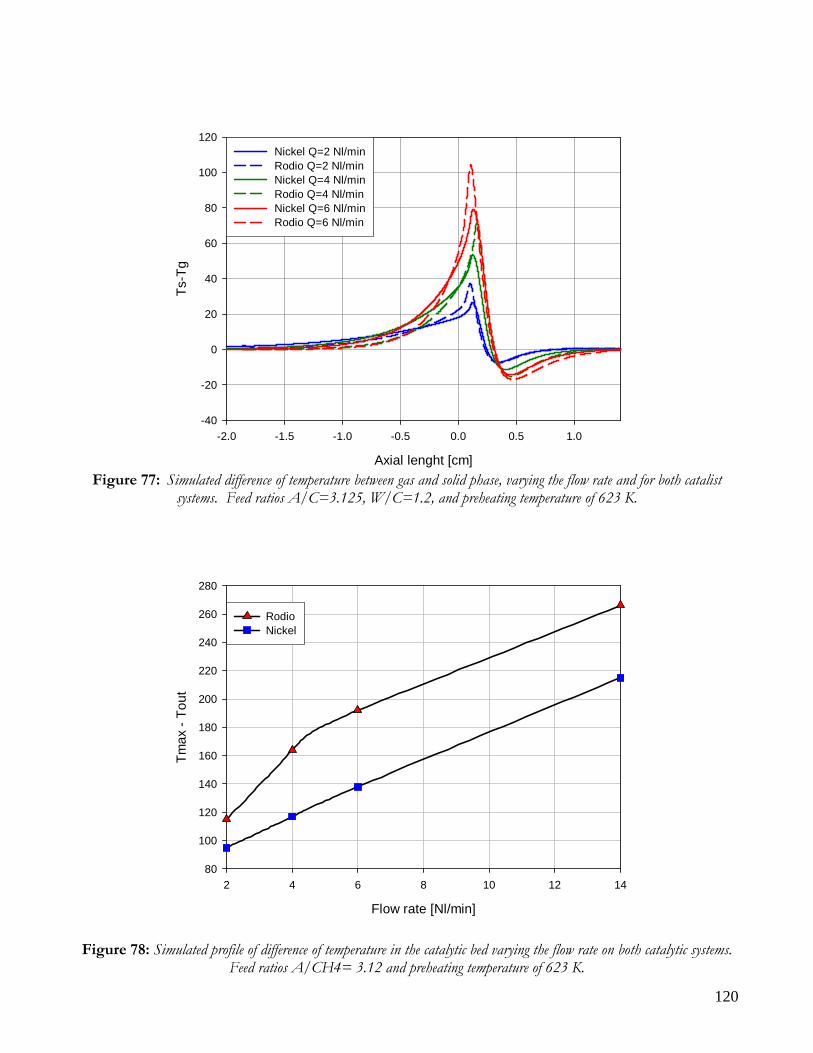
120
Axial lenght [cm]
-2.0 -1.5 -1.0 -0.5 0.0 0.5 1.0
Ts-T
g
-40
-20
0
20
40
60
80
100
120Nickel Q=2 Nl/minRodio Q=2 Nl/minNickel Q=4 Nl/minRodio Q=4 Nl/minNickel Q=6 Nl/minRodio Q=6 Nl/min
Figure 77: Simulated difference of temperature between gas and solid phase, varying the flow rate and for both catalist
systems. Feed ratios A/C=3.125, W/C=1.2, and preheating temperature of 623 K.
Flow rate [Nl/min]
2 4 6 8 10 12 14
Tmax
- To
ut
80
100
120
140
160
180
200
220
240
260
280
RodioNickel
Figure 78: Simulated profile of difference of temperature in the catalytic bed varying the flow rate on both catalytic systems.
Feed ratios A/CH4= 3.12 and preheating temperature of 623 K.
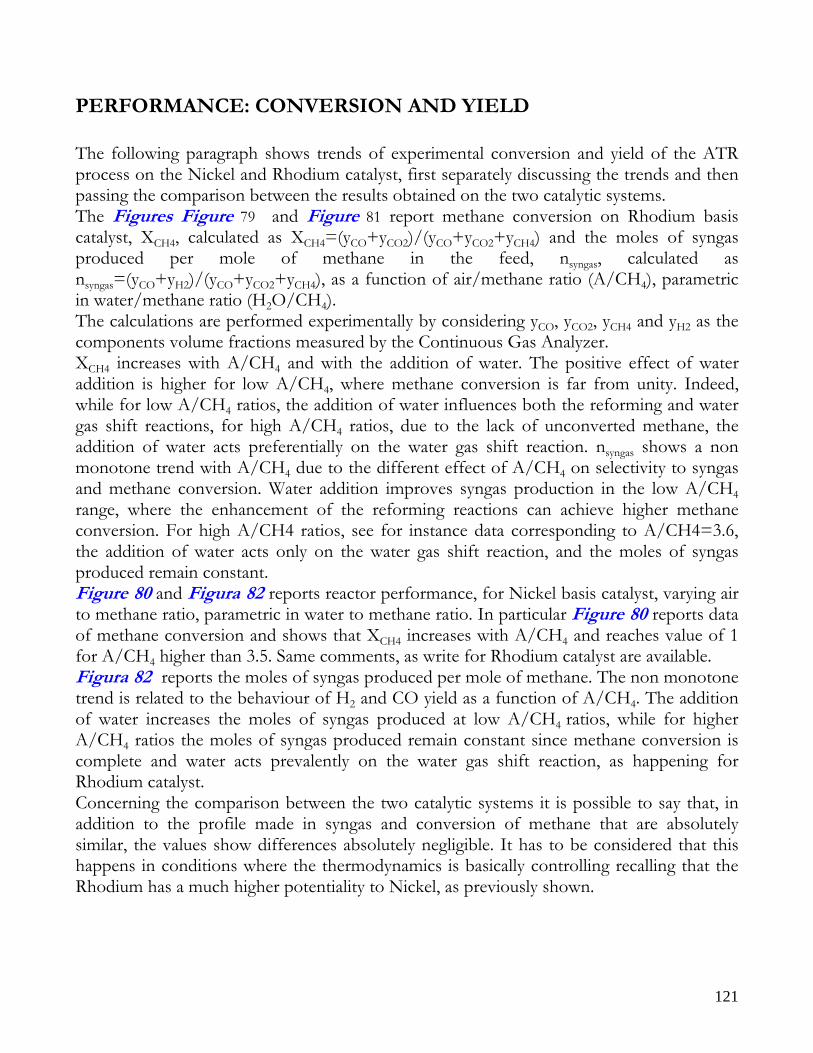
121
PERFORMANCE: CONVERSION AND YIELD The following paragraph shows trends of experimental conversion and yield of the ATR process on the Nickel and Rhodium catalyst, first separately discussing the trends and then passing the comparison between the results obtained on the two catalytic systems. The Figures Figure 79 and Figure 81 report methane conversion on Rhodium basis catalyst, XCH4, calculated as XCH4=(yCO+yCO2)/(yCO+yCO2+yCH4) and the moles of syngas produced per mole of methane in the feed, nsyngas, calculated as nsyngas=(yCO+yH2)/(yCO+yCO2+yCH4), as a function of air/methane ratio (A/CH4), parametric in water/methane ratio (H2O/CH4). The calculations are performed experimentally by considering yCO, yCO2, yCH4 and yH2 as the components volume fractions measured by the Continuous Gas Analyzer. XCH4 increases with A/CH4 and with the addition of water. The positive effect of water addition is higher for low A/CH4, where methane conversion is far from unity. Indeed, while for low A/CH4 ratios, the addition of water influences both the reforming and water gas shift reactions, for high A/CH4 ratios, due to the lack of unconverted methane, the addition of water acts preferentially on the water gas shift reaction. nsyngas shows a non monotone trend with A/CH4 due to the different effect of A/CH4 on selectivity to syngas and methane conversion. Water addition improves syngas production in the low A/CH4 range, where the enhancement of the reforming reactions can achieve higher methane conversion. For high A/CH4 ratios, see for instance data corresponding to A/CH4=3.6, the addition of water acts only on the water gas shift reaction, and the moles of syngas produced remain constant. Figure 80 and Figura 82 reports reactor performance, for Nickel basis catalyst, varying air to methane ratio, parametric in water to methane ratio. In particular Figure 80 reports data of methane conversion and shows that XCH4 increases with A/CH4 and reaches value of 1 for A/CH4 higher than 3.5. Same comments, as write for Rhodium catalyst are available. Figura 82 reports the moles of syngas produced per mole of methane. The non monotone trend is related to the behaviour of H2 and CO yield as a function of A/CH4. The addition of water increases the moles of syngas produced at low A/CH4 ratios, while for higher A/CH4 ratios the moles of syngas produced remain constant since methane conversion is complete and water acts prevalently on the water gas shift reaction, as happening for Rhodium catalyst. Concerning the comparison between the two catalytic systems it is possible to say that, in addition to the profile made in syngas and conversion of methane that are absolutely similar, the values show differences absolutely negligible. It has to be considered that this happens in conditions where the thermodynamics is basically controlling recalling that the Rhodium has a much higher potentiality to Nickel, as previously shown.
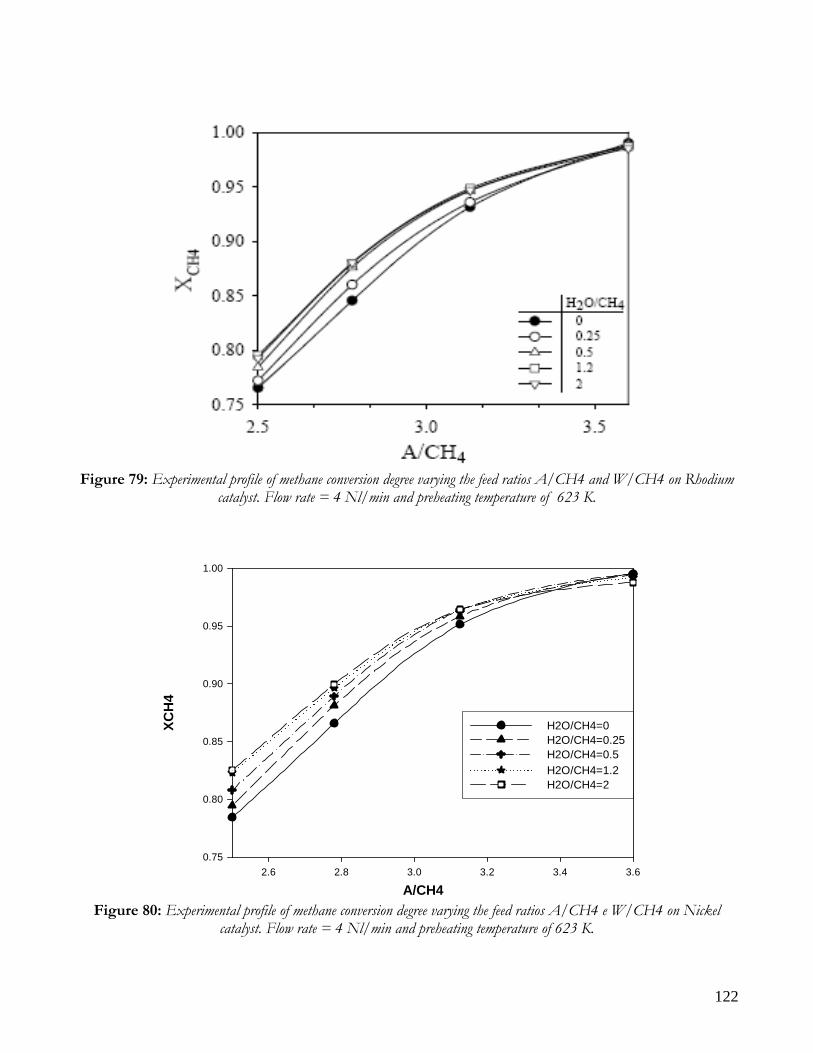
122
Figure 79: Experimental profile of methane conversion degree varying the feed ratios A/CH4 and W/CH4 on Rhodium
catalyst. Flow rate = 4 Nl/min and preheating temperature of 623 K.
A/CH42.6 2.8 3.0 3.2 3.4 3.6
XCH
4
0.75
0.80
0.85
0.90
0.95
1.00
H2O/CH4=0 H2O/CH4=0.25H2O/CH4=0.5H2O/CH4=1.2 H2O/CH4=2
Figure 80: Experimental profile of methane conversion degree varying the feed ratios A/CH4 e W/CH4 on Nickel
catalyst. Flow rate = 4 Nl/min and preheating temperature of 623 K.
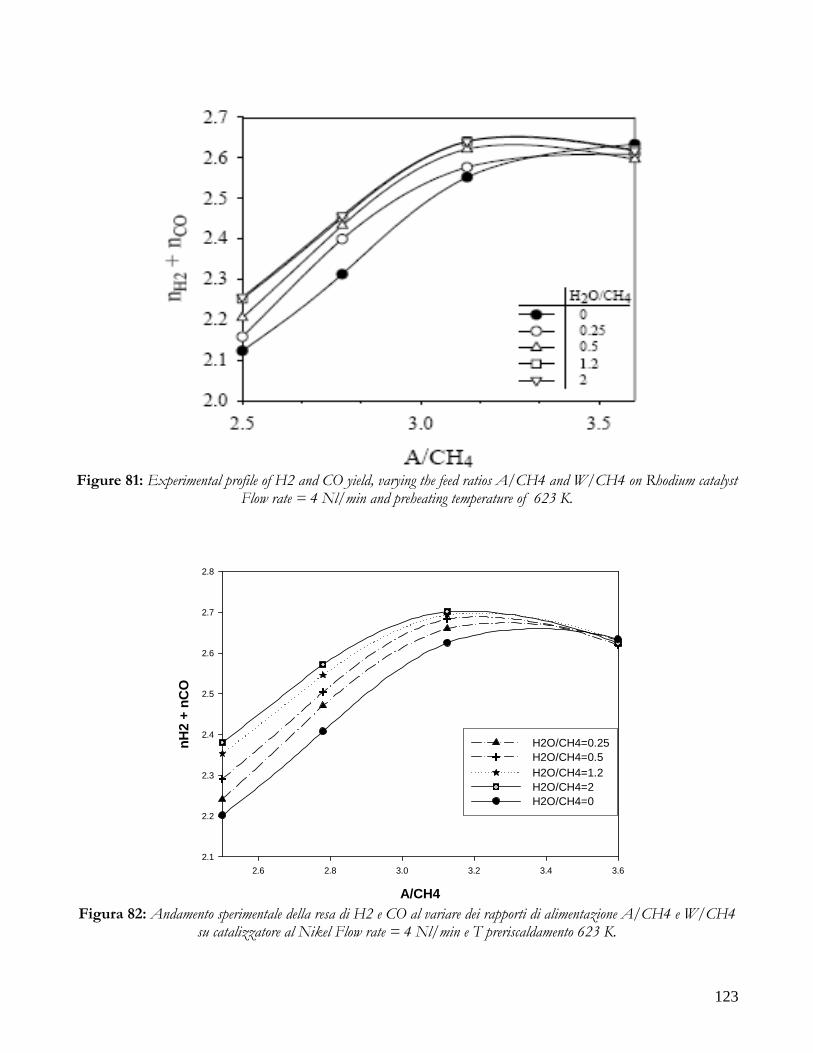
123
Figure 81: Experimental profile of H2 and CO yield, varying the feed ratios A/CH4 and W/CH4 on Rhodium catalyst
Flow rate = 4 Nl/min and preheating temperature of 623 K.
A/CH4
2.6 2.8 3.0 3.2 3.4 3.6
nH2
+ nC
O
2.1
2.2
2.3
2.4
2.5
2.6
2.7
2.8
H2O/CH4=0.25H2O/CH4=0.5H2O/CH4=1.2H2O/CH4=2H2O/CH4=0
Figura 82: Andamento sperimentale della resa di H2 e CO al variare dei rapporti di alimentazione A/CH4 e W/CH4
su catalizzatore al Nikel Flow rate = 4 Nl/min e T preriscaldamento 623 K.
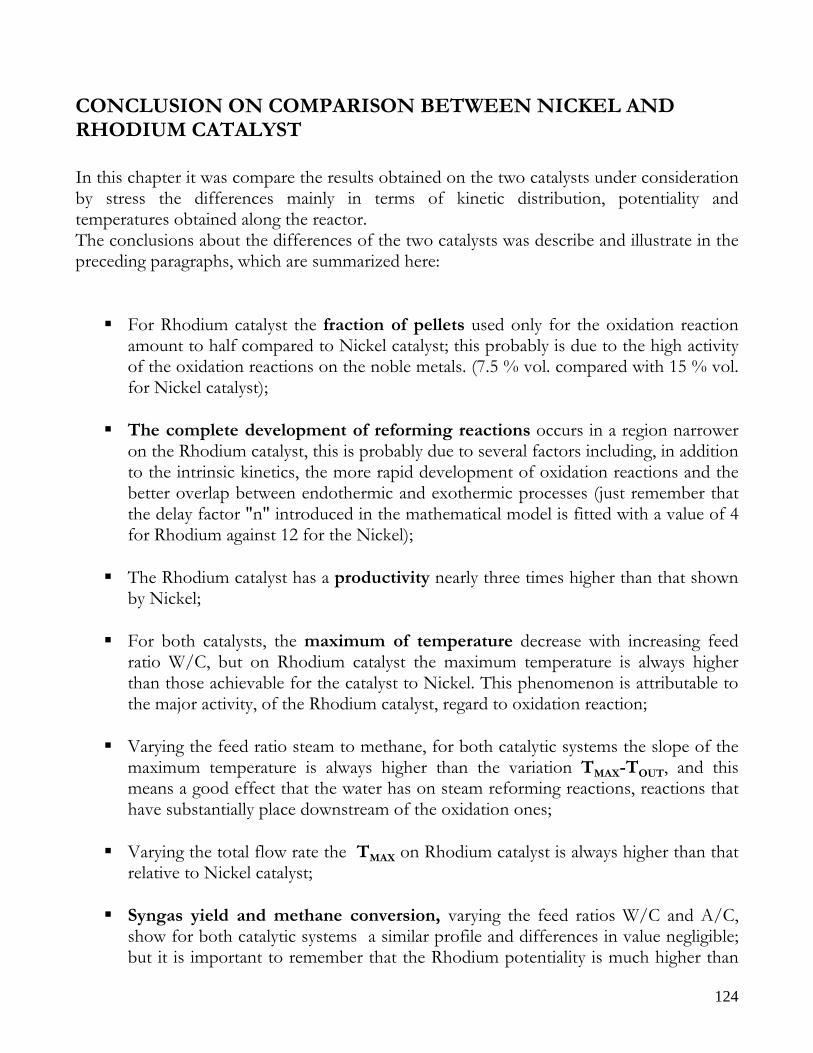
124
CONCLUSION ON COMPARISON BETWEEN NICKEL AND RHODIUM CATALYST In this chapter it was compare the results obtained on the two catalysts under consideration by stress the differences mainly in terms of kinetic distribution, potentiality and temperatures obtained along the reactor. The conclusions about the differences of the two catalysts was describe and illustrate in the preceding paragraphs, which are summarized here:
For Rhodium catalyst the fraction of pellets used only for the oxidation reaction amount to half compared to Nickel catalyst; this probably is due to the high activity of the oxidation reactions on the noble metals. (7.5 % vol. compared with 15 % vol. for Nickel catalyst);
The complete development of reforming reactions occurs in a region narrower
on the Rhodium catalyst, this is probably due to several factors including, in addition to the intrinsic kinetics, the more rapid development of oxidation reactions and the better overlap between endothermic and exothermic processes (just remember that the delay factor "n" introduced in the mathematical model is fitted with a value of 4 for Rhodium against 12 for the Nickel);
The Rhodium catalyst has a productivity nearly three times higher than that shown
by Nickel; For both catalysts, the maximum of temperature decrease with increasing feed
ratio W/C, but on Rhodium catalyst the maximum temperature is always higher than those achievable for the catalyst to Nickel. This phenomenon is attributable to the major activity, of the Rhodium catalyst, regard to oxidation reaction;
Varying the feed ratio steam to methane, for both catalytic systems the slope of the
maximum temperature is always higher than the variation TMAX-TOUT, and this means a good effect that the water has on steam reforming reactions, reactions that have substantially place downstream of the oxidation ones;
Varying the total flow rate the TMAX on Rhodium catalyst is always higher than that
relative to Nickel catalyst;
Syngas yield and methane conversion, varying the feed ratios W/C and A/C, show for both catalytic systems a similar profile and differences in value negligible; but it is important to remember that the Rhodium potentiality is much higher than

125
Nickel and this equality applies until the kinetic controlling regime is thermodynamic.
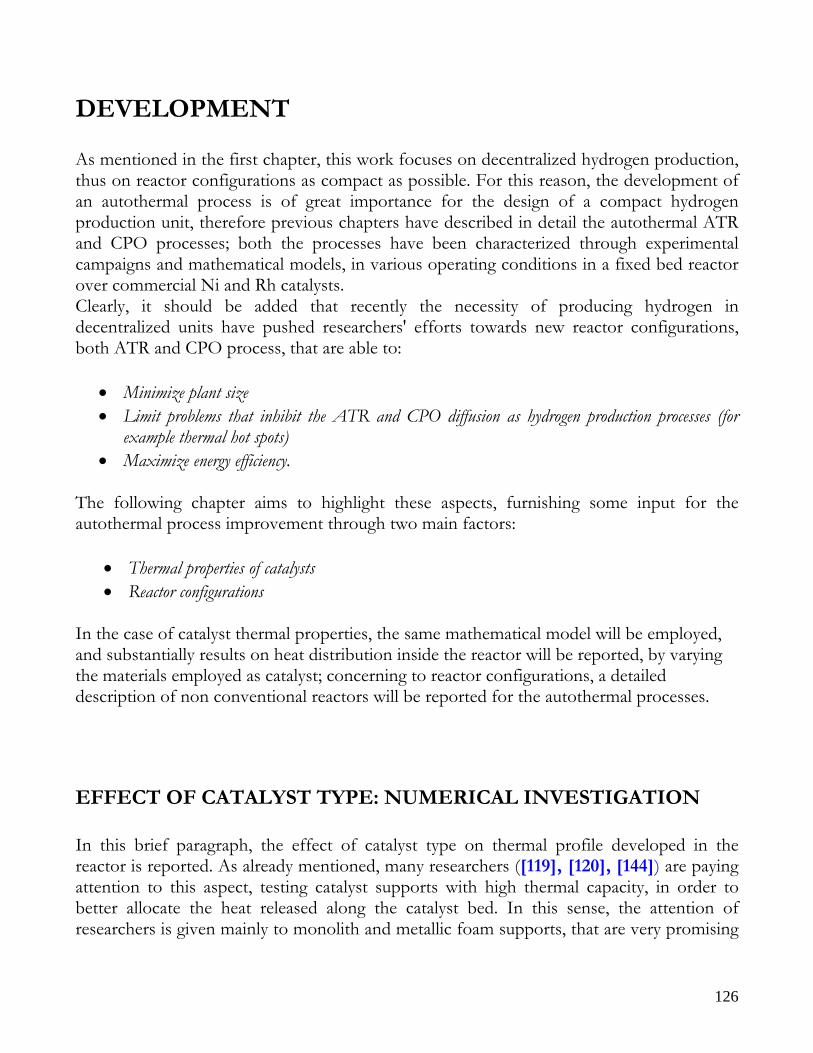
126
DEVELOPMENT As mentioned in the first chapter, this work focuses on decentralized hydrogen production, thus on reactor configurations as compact as possible. For this reason, the development of an autothermal process is of great importance for the design of a compact hydrogen production unit, therefore previous chapters have described in detail the autothermal ATR and CPO processes; both the processes have been characterized through experimental campaigns and mathematical models, in various operating conditions in a fixed bed reactor over commercial Ni and Rh catalysts. Clearly, it should be added that recently the necessity of producing hydrogen in decentralized units have pushed researchers' efforts towards new reactor configurations, both ATR and CPO process, that are able to:
• Minimize plant size • Limit problems that inhibit the ATR and CPO diffusion as hydrogen production processes (for
example thermal hot spots) • Maximize energy efficiency.
The following chapter aims to highlight these aspects, furnishing some input for the autothermal process improvement through two main factors:
• Thermal properties of catalysts • Reactor configurations
In the case of catalyst thermal properties, the same mathematical model will be employed, and substantially results on heat distribution inside the reactor will be reported, by varying the materials employed as catalyst; concerning to reactor configurations, a detailed description of non conventional reactors will be reported for the autothermal processes.
EFFECT OF CATALYST TYPE: NUMERICAL INVESTIGATION In this brief paragraph, the effect of catalyst type on thermal profile developed in the reactor is reported. As already mentioned, many researchers ([119], [120], [144]) are paying attention to this aspect, testing catalyst supports with high thermal capacity, in order to better allocate the heat released along the catalyst bed. In this sense, the attention of researchers is given mainly to monolith and metallic foam supports, that are very promising
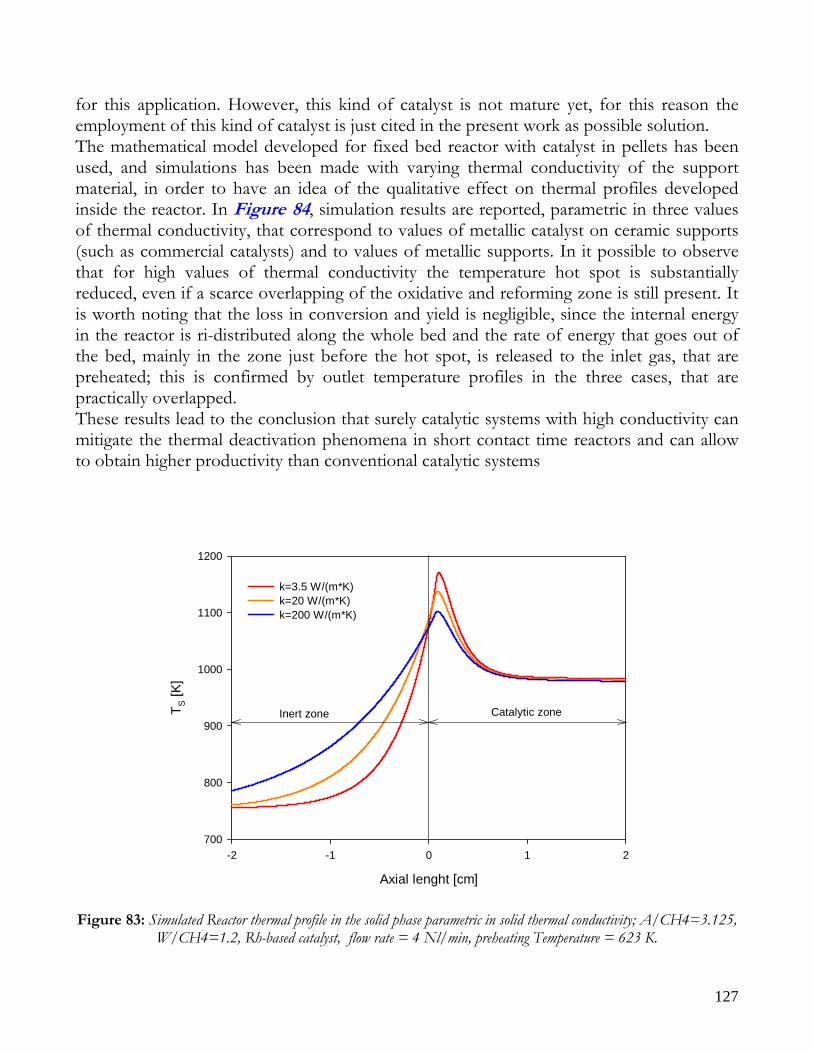
127
for this application. However, this kind of catalyst is not mature yet, for this reason the employment of this kind of catalyst is just cited in the present work as possible solution. The mathematical model developed for fixed bed reactor with catalyst in pellets has been used, and simulations has been made with varying thermal conductivity of the support material, in order to have an idea of the qualitative effect on thermal profiles developed inside the reactor. In Figure 84, simulation results are reported, parametric in three values of thermal conductivity, that correspond to values of metallic catalyst on ceramic supports (such as commercial catalysts) and to values of metallic supports. In it possible to observe that for high values of thermal conductivity the temperature hot spot is substantially reduced, even if a scarce overlapping of the oxidative and reforming zone is still present. It is worth noting that the loss in conversion and yield is negligible, since the internal energy in the reactor is ri-distributed along the whole bed and the rate of energy that goes out of the bed, mainly in the zone just before the hot spot, is released to the inlet gas, that are preheated; this is confirmed by outlet temperature profiles in the three cases, that are practically overlapped. These results lead to the conclusion that surely catalytic systems with high conductivity can mitigate the thermal deactivation phenomena in short contact time reactors and can allow to obtain higher productivity than conventional catalytic systems
Axial lenght [cm]
-2 -1 0 1 2
T S [K
]
700
800
900
1000
1100
1200
k=3.5 W/(m*K)k=20 W/(m*K)k=200 W/(m*K)
Inert zone Catalytic zone
Figure 83: Simulated Reactor thermal profile in the solid phase parametric in solid thermal conductivity; A/CH4=3.125,
W/CH4=1.2, Rh-based catalyst, flow rate = 4 Nl/min, preheating Temperature = 623 K.
128
NON CONVENTIONAL REACTORS This paragraph describes the state of art in innovative reactor configurations for ATR and CPO process, highlighting the limits and the advantages of each configuration investigated. The fixed bed reactor proposed in the present work requires an inlet gas preheating to temperatures near the catalyst activation temperatures, both for obtaining high productivity and for avoiding shut-down. This process requires an external heat exchanger, where it is possible to use the reactor outlet gas as hot fluid; this solution leads to a loss in reactor compactness, moreover it is difficult to obtain high energy efficiency by managing a gas stream at high temperature on small scale. In the following section In the following paragraphs the state of art on new reactor concept is reported, highlighting advantages with respect to conventional reactor configurations and disadvantages that inhibit their development in the small-scale hydrogen production field. In particular, the following reactors will be reported:
Membrane reactors Catalytic walls reactors Forced reactors
Membrane reactors are a technology where the hydrogen separation is integrated inside the reforming unit, and pure hydrogen production is obtained, that can be fed to fuel cells, such as Polymer Electrolyte/membrane (PEM) fuel cells; catalytic wall reactors and forced reactors, instead, foresees heat integration inside the reactor unit.
MEMBRANE REACTORS In recent years, many authors have paid much attention to membrane reactor for hydrogen production for PEM fuel cells [82], [88], [122]. In particular, palladium membranes allows to attain a high purity hydrogen steam (100% selectivity), operating reactors at temperatures below 800°C, far lower than operating temperatures of actual steam reforming systems. In the reactor, hydrogen is usually separated from the reaction mixture using palladium-based membranes, and the separation of hydrogen significantly increases the equilibrium conversion of methane. Uemiya et al. [122] reported methane conversion close to 90% at 500°C using this reactor. This is due to the fact that hydrogen removal shifts thermodynamic equilibrium towards the products, allowing the attainment of high methane conversion and syngas yields. Therefore, with this kind of reactor is possible to obtain the same conversions of a conventional steam
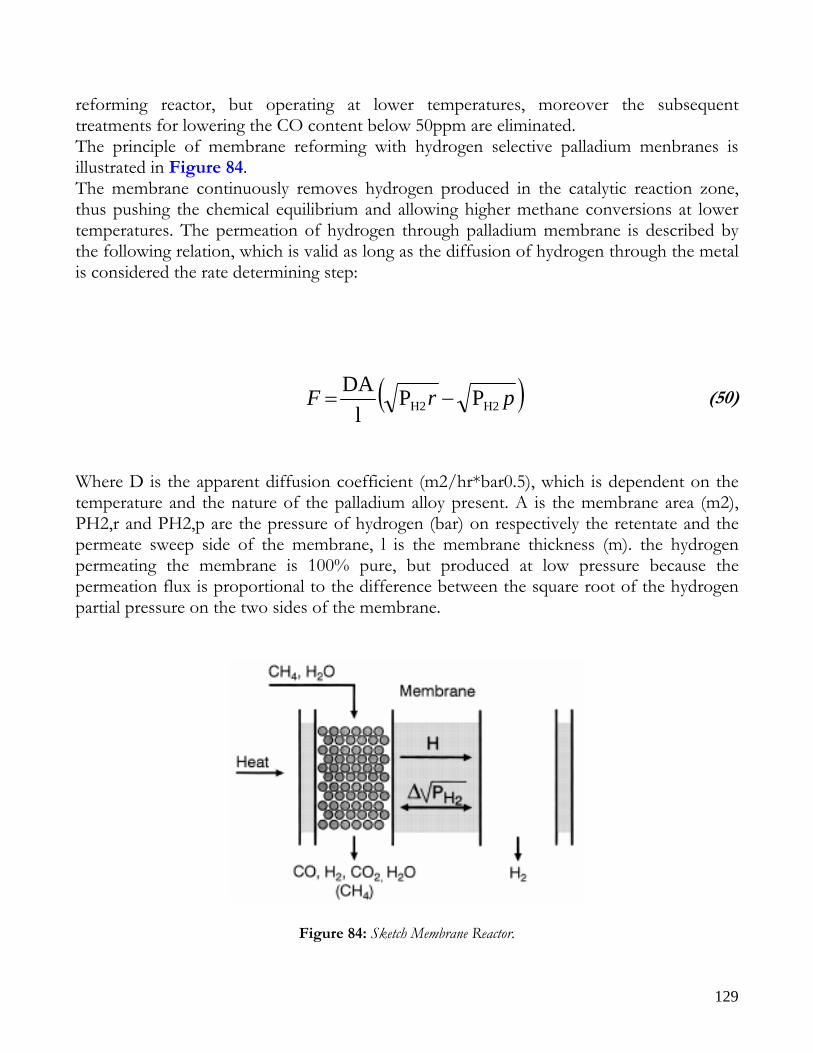
129
reforming reactor, but operating at lower temperatures, moreover the subsequent treatments for lowering the CO content below 50ppm are eliminated. The principle of membrane reforming with hydrogen selective palladium menbranes is illustrated in Figure 84. The membrane continuously removes hydrogen produced in the catalytic reaction zone, thus pushing the chemical equilibrium and allowing higher methane conversions at lower temperatures. The permeation of hydrogen through palladium membrane is described by the following relation, which is valid as long as the diffusion of hydrogen through the metal is considered the rate determining step:
(50) Where D is the apparent diffusion coefficient (m2/hr*bar0.5), which is dependent on the temperature and the nature of the palladium alloy present. A is the membrane area (m2), PH2,r and PH2,p are the pressure of hydrogen (bar) on respectively the retentate and the permeate sweep side of the membrane, l is the membrane thickness (m). the hydrogen permeating the membrane is 100% pure, but produced at low pressure because the permeation flux is proportional to the difference between the square root of the hydrogen partial pressure on the two sides of the membrane.
Figure 84: Sketch Membrane Reactor.
( )prF H2H2 PPl
DA−=
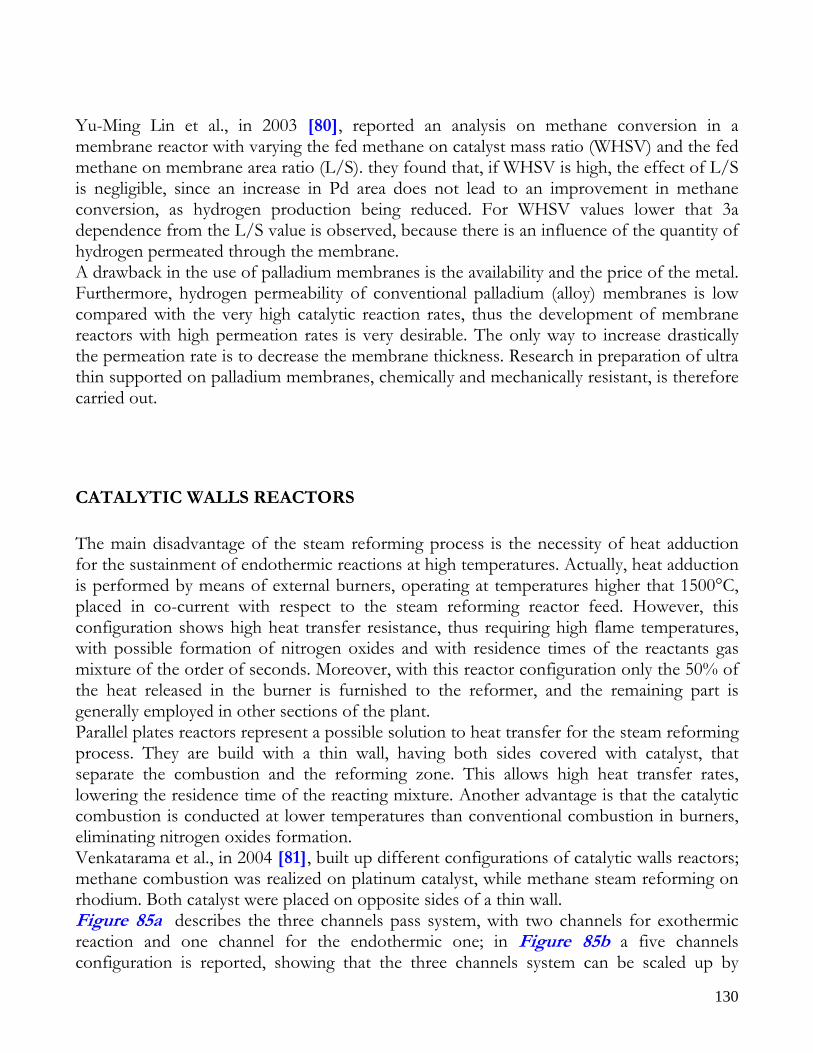
130
Yu-Ming Lin et al., in 2003 [80], reported an analysis on methane conversion in a membrane reactor with varying the fed methane on catalyst mass ratio (WHSV) and the fed methane on membrane area ratio (L/S). they found that, if WHSV is high, the effect of L/S is negligible, since an increase in Pd area does not lead to an improvement in methane conversion, as hydrogen production being reduced. For WHSV values lower that 3a dependence from the L/S value is observed, because there is an influence of the quantity of hydrogen permeated through the membrane. A drawback in the use of palladium membranes is the availability and the price of the metal. Furthermore, hydrogen permeability of conventional palladium (alloy) membranes is low compared with the very high catalytic reaction rates, thus the development of membrane reactors with high permeation rates is very desirable. The only way to increase drastically the permeation rate is to decrease the membrane thickness. Research in preparation of ultra thin supported on palladium membranes, chemically and mechanically resistant, is therefore carried out.
CATALYTIC WALLS REACTORS The main disadvantage of the steam reforming process is the necessity of heat adduction for the sustainment of endothermic reactions at high temperatures. Actually, heat adduction is performed by means of external burners, operating at temperatures higher that 1500°C, placed in co-current with respect to the steam reforming reactor feed. However, this configuration shows high heat transfer resistance, thus requiring high flame temperatures, with possible formation of nitrogen oxides and with residence times of the reactants gas mixture of the order of seconds. Moreover, with this reactor configuration only the 50% of the heat released in the burner is furnished to the reformer, and the remaining part is generally employed in other sections of the plant. Parallel plates reactors represent a possible solution to heat transfer for the steam reforming process. They are build with a thin wall, having both sides covered with catalyst, that separate the combustion and the reforming zone. This allows high heat transfer rates, lowering the residence time of the reacting mixture. Another advantage is that the catalytic combustion is conducted at lower temperatures than conventional combustion in burners, eliminating nitrogen oxides formation. Venkatarama et al., in 2004 [81], built up different configurations of catalytic walls reactors; methane combustion was realized on platinum catalyst, while methane steam reforming on rhodium. Both catalyst were placed on opposite sides of a thin wall. Figure 85a describes the three channels pass system, with two channels for exothermic reaction and one channel for the endothermic one; in 4Figure 85b a five channels configuration is reported, showing that the three channels system can be scaled up by
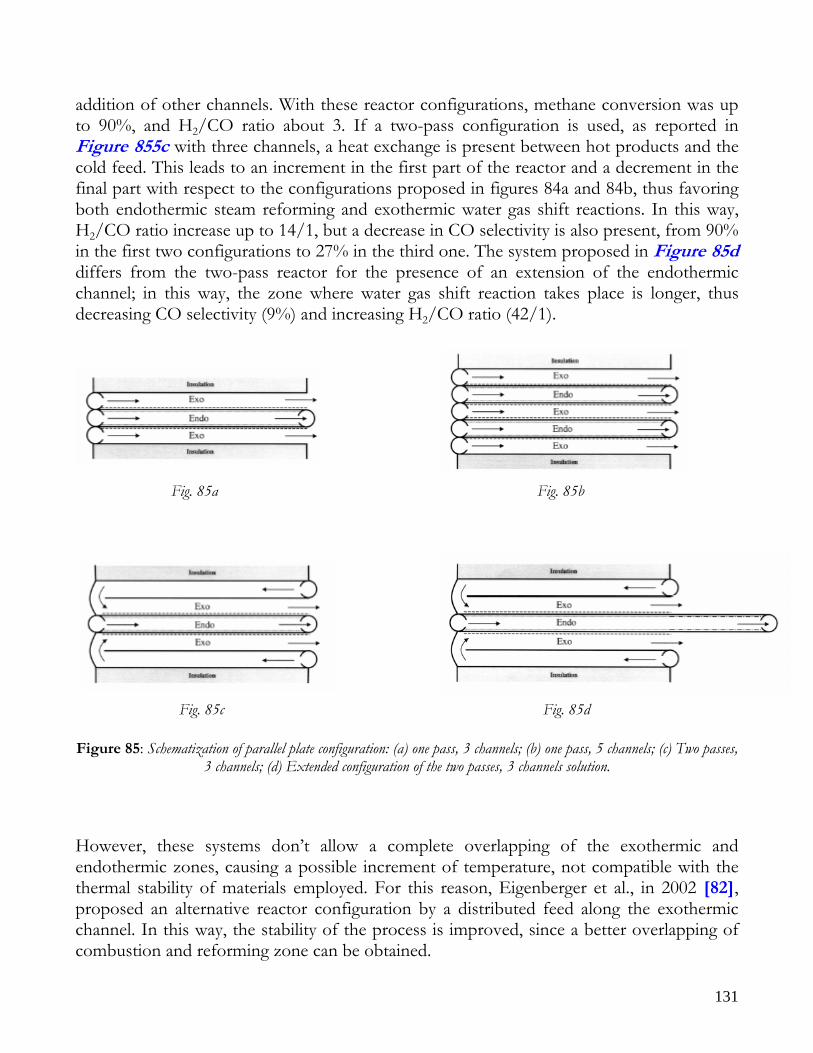
131
addition of other channels. With these reactor configurations, methane conversion was up to 90%, and H2/CO ratio about 3. If a two-pass configuration is used, as reported in 4Figure 855c with three channels, a heat exchange is present between hot products and the cold feed. This leads to an increment in the first part of the reactor and a decrement in the final part with respect to the configurations proposed in figures 84a and 84b, thus favoring both endothermic steam reforming and exothermic water gas shift reactions. In this way, H2/CO ratio increase up to 14/1, but a decrease in CO selectivity is also present, from 90% in the first two configurations to 27% in the third one. The system proposed in 4Figure 85d differs from the two-pass reactor for the presence of an extension of the endothermic channel; in this way, the zone where water gas shift reaction takes place is longer, thus decreasing CO selectivity (9%) and increasing H2/CO ratio (42/1).
Fig. 85a Fig. 85b
Fig. 85c Fig. 85d Figure 85: Schematization of parallel plate configuration: (a) one pass, 3 channels; (b) one pass, 5 channels; (c) Two passes,
3 channels; (d) Extended configuration of the two passes, 3 channels solution.
However, these systems don’t allow a complete overlapping of the exothermic and endothermic zones, causing a possible increment of temperature, not compatible with the thermal stability of materials employed. For this reason, Eigenberger et al., in 2002 4[82], proposed an alternative reactor configuration by a distributed feed along the exothermic channel. In this way, the stability of the process is improved, since a better overlapping of combustion and reforming zone can be obtained.
132
FORCED REACTORS INTRODUCTION When a heterogeneous catalytic reactor is forced to work in non stationary regimes, the factors that can positively influence the entire process are the following [83], [84], [85].
• Catalyst dynamic properties: temporal variations of the reactants mixture can induce changes in the state and in the structure of the catalyst, that lead to an increase in activity and/or selectivity with respect to stationary conditions.
• Dynamic characteristics of the whole reactor: forced variations of the reactor inlet variables
could allow to obtain a composition and temperature distribution closer to optimum conditions than stationary reactors
Catalytic processes conducted in dynamic regime can be obtained in different ways. If periodic time-changes are imposed to one or more operating parameters of the reactor, such as an inlet concentration of one or more reactants or the inlet temperature, the catalytic reactor is forced to work in non-stationary conditions. From 70s, some Russian researchers [86] and [87], proposed periodic regime induction in catalytic reactor by keeping constant the feed composition and temperature and by varying the feed position. In particular, [87] proposed a number of different reactor configurations where the feed position is changed and periodic regime induction is obtained. The most studied, however, has been the reactor with flow inversion. If the flow direction is changed with an appropriate frequency, concentration and temperature profiles developed along the catalyst bed allow to improve reactor performance with an increase in total conversion. The first studies on this periodic reactor configuration focused on catalytic processes that involve reversible exothermic reactions (methanol synthesis [88], [89]; ammonia synthesis [90], [91]; sulfur dioxide oxidation [86], [92], [93]; and irreversible exothermic reactions (catalytic combustion) [94], [95], [96], [97], [98]. In these cases, taking advantage of high catalyst thermal capacity, it has been possible to improve the process not only from a kinetic and thermodynamic point of view, but also from an energetic one, thus reducing plant and operative costs. This is confirmed by the fact that in U.S.A and in ex-URSS many conventional reactors with adiabatic state and inter-refrigeration have been placed by reactors with flow inversion in sulfuric acid and methanol production plants. Even if advantages are less visible, some recent studies are coupling reactors with flow inversion to processes that involve endothermic reactions. A number of studies, indeed, is present in literature on ethyl benzene dehydrogenation [99], [100] and methane steam reforming [101], [102], [103], [104], [105], [106], [107], [108].
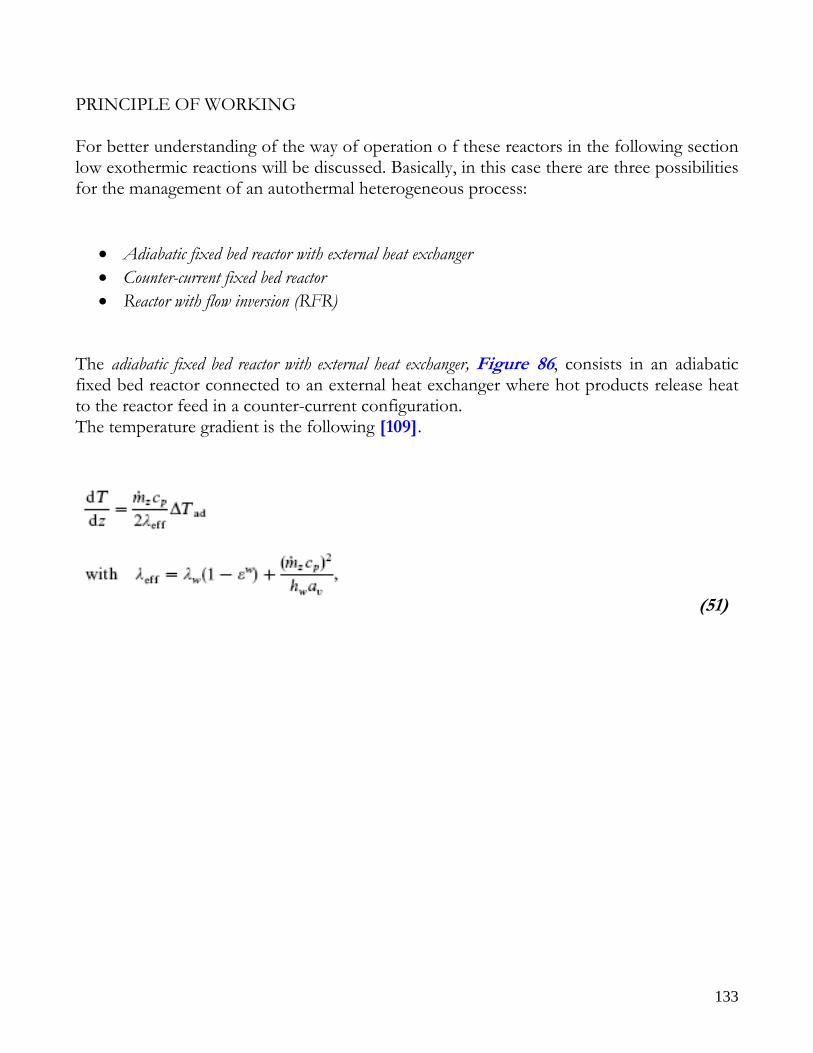
133
PRINCIPLE OF WORKING For better understanding of the way of operation o f these reactors in the following section low exothermic reactions will be discussed. Basically, in this case there are three possibilities for the management of an autothermal heterogeneous process:
• Adiabatic fixed bed reactor with external heat exchanger • Counter-current fixed bed reactor • Reactor with flow inversion (RFR)
The adiabatic fixed bed reactor with external heat exchanger, Figure 86, consists in an adiabatic fixed bed reactor connected to an external heat exchanger where hot products release heat to the reactor feed in a counter-current configuration. The temperature gradient is the following [109].
(51)
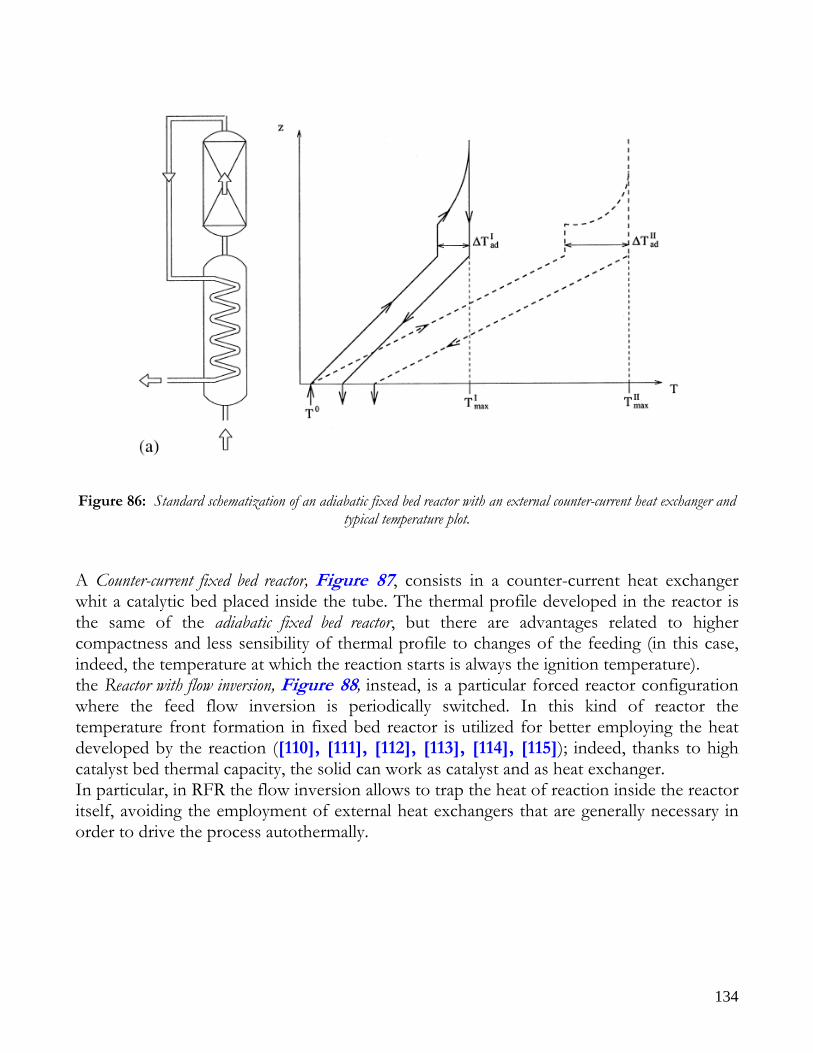
134
Figure 86: Standard schematization of an adiabatic fixed bed reactor with an external counter-current heat exchanger and
typical temperature plot. A Counter-current fixed bed reactor, Figure 87, consists in a counter-current heat exchanger whit a catalytic bed placed inside the tube. The thermal profile developed in the reactor is the same of the adiabatic fixed bed reactor, but there are advantages related to higher compactness and less sensibility of thermal profile to changes of the feeding (in this case, indeed, the temperature at which the reaction starts is always the ignition temperature). the Reactor with flow inversion, Figure 88, instead, is a particular forced reactor configuration where the feed flow inversion is periodically switched. In this kind of reactor the temperature front formation in fixed bed reactor is utilized for better employing the heat developed by the reaction ([110], [111], [112], [113], [114], [115]); indeed, thanks to high catalyst bed thermal capacity, the solid can work as catalyst and as heat exchanger. In particular, in RFR the flow inversion allows to trap the heat of reaction inside the reactor itself, avoiding the employment of external heat exchangers that are generally necessary in order to drive the process autothermally.
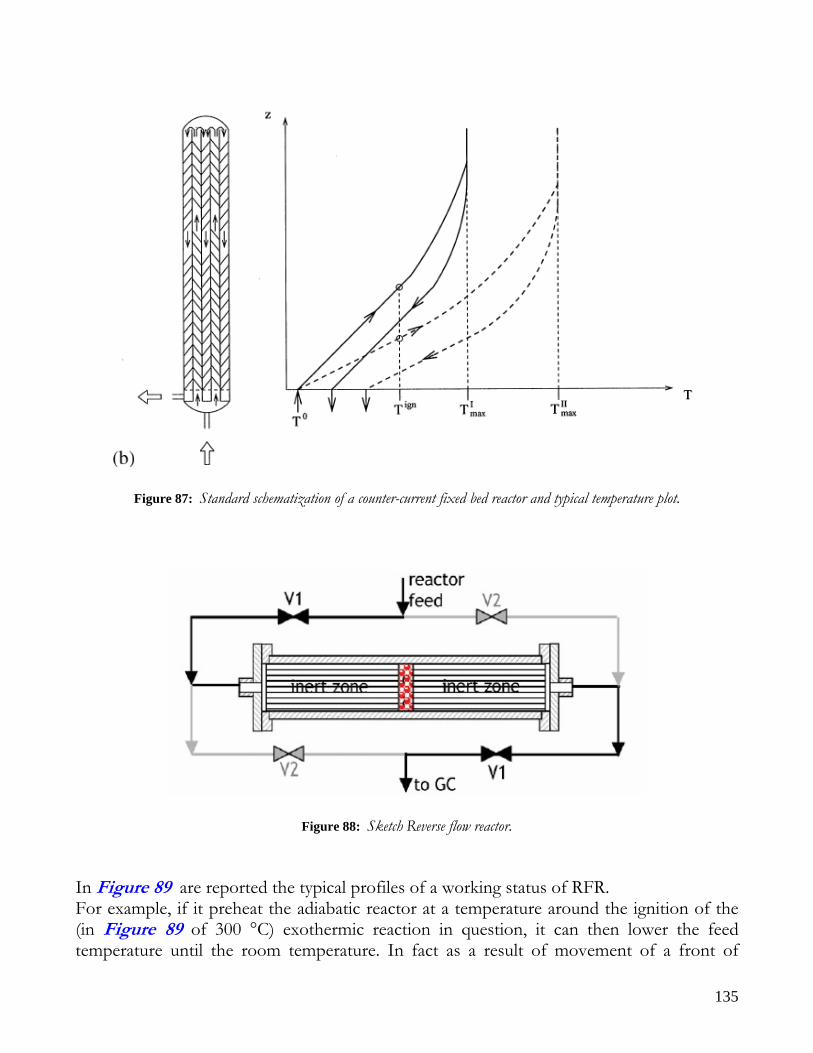
135
Figure 87: Standard schematization of a counter-current fixed bed reactor and typical temperature plot.
Figure 88: Sketch Reverse flow reactor. In Figure 89 are reported the typical profiles of a working status of RFR. For example, if it preheat the adiabatic reactor at a temperature around the ignition of the (in Figure 89 of 300 °C) exothermic reaction in question, it can then lower the feed temperature until the room temperature. In fact as a result of movement of a front of
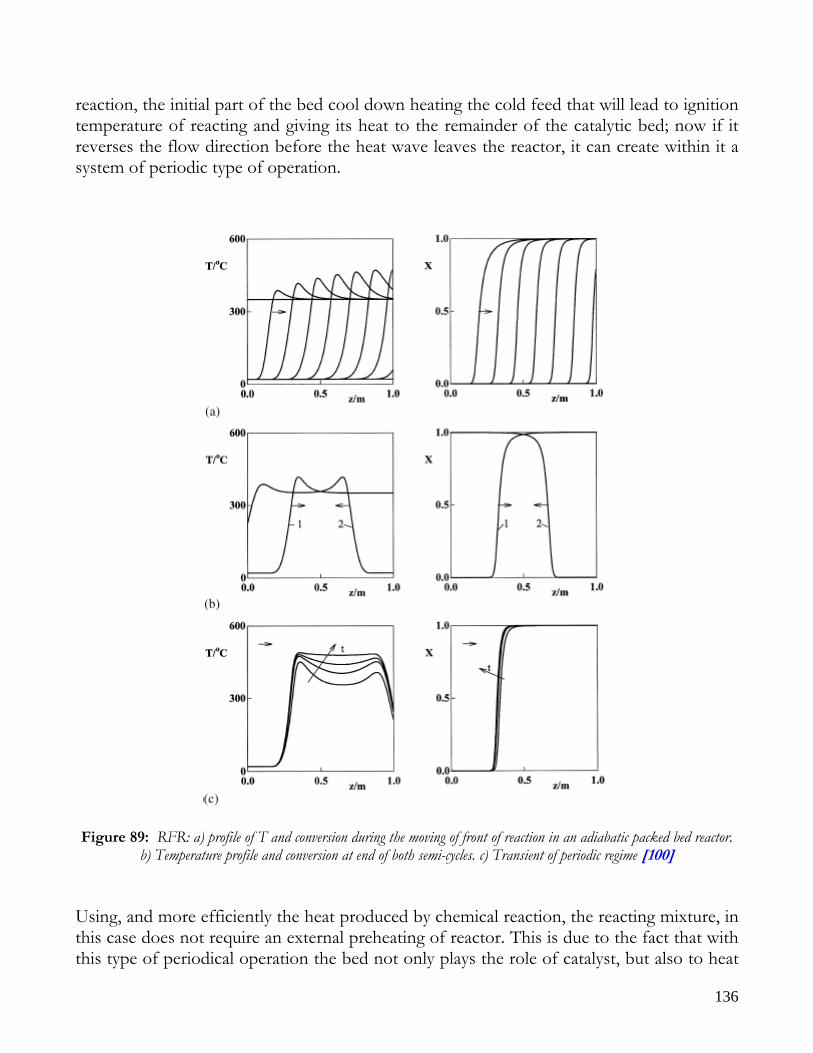
136
reaction, the initial part of the bed cool down heating the cold feed that will lead to ignition temperature of reacting and giving its heat to the remainder of the catalytic bed; now if it reverses the flow direction before the heat wave leaves the reactor, it can create within it a system of periodic type of operation.
Figure 89: RFR: a) profile of T and conversion during the moving of front of reaction in an adiabatic packed bed reactor.
b) Temperature profile and conversion at end of both semi-cycles. c) Transient of periodic regime [100] Using, and more efficiently the heat produced by chemical reaction, the reacting mixture, in this case does not require an external preheating of reactor. This is due to the fact that with this type of periodical operation the bed not only plays the role of catalyst, but also to heat
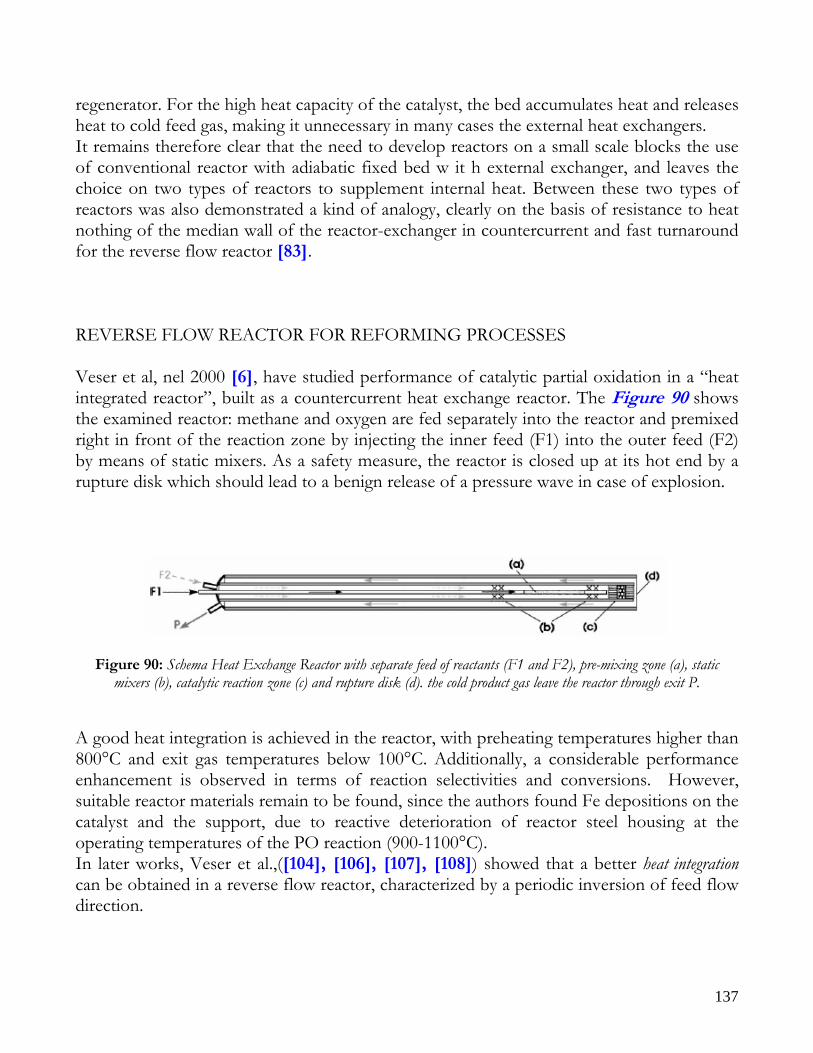
137
regenerator. For the high heat capacity of the catalyst, the bed accumulates heat and releases heat to cold feed gas, making it unnecessary in many cases the external heat exchangers. It remains therefore clear that the need to develop reactors on a small scale blocks the use of conventional reactor with adiabatic fixed bed w it h external exchanger, and leaves the choice on two types of reactors to supplement internal heat. Between these two types of reactors was also demonstrated a kind of analogy, clearly on the basis of resistance to heat nothing of the median wall of the reactor-exchanger in countercurrent and fast turnaround for the reverse flow reactor [83]. REVERSE FLOW REACTOR FOR REFORMING PROCESSES Veser et al, nel 2000 5[6], have studied performance of catalytic partial oxidation in a “heat integrated reactor”, built as a countercurrent heat exchange reactor. The 5Figure 90 shows the examined reactor: methane and oxygen are fed separately into the reactor and premixed right in front of the reaction zone by injecting the inner feed (F1) into the outer feed (F2) by means of static mixers. As a safety measure, the reactor is closed up at its hot end by a rupture disk which should lead to a benign release of a pressure wave in case of explosion.
Figure 90: Schema Heat Exchange Reactor with separate feed of reactants (F1 and F2), pre-mixing zone (a), static mixers (b), catalytic reaction zone (c) and rupture disk (d). the cold product gas leave the reactor through exit P.
A good heat integration is achieved in the reactor, with preheating temperatures higher than 800°C and exit gas temperatures below 100°C. Additionally, a considerable performance enhancement is observed in terms of reaction selectivities and conversions. However, suitable reactor materials remain to be found, since the authors found Fe depositions on the catalyst and the support, due to reactive deterioration of reactor steel housing at the operating temperatures of the PO reaction (900-1100°C). In later works, Veser et al.,([104], [106], [107], [108]) showed that a better heat integration can be obtained in a reverse flow reactor, characterized by a periodic inversion of feed flow direction.
138
Recently, the authors [104], [107], have compared results obtained in a reverse flow reactor (RFR) with those obtained in a conventional reactor operating in steady state (SS) on Pt and Rh based catalysts. In this reactor configuration the catalyst is placed between to inert packing materials, socalled inert zones that act as “heat reservoirs” that is as regenerative heat exchangers in addition to the catalyst bed. The periodic switching of flow direction is realized by means of four valves, synchronized in pairs. At the beginning, the V1 valves are open, and cold reactants enter the catalyst bed and react exothermically on the catalyst surface; the heat released by exothermic reactions increases catalyst and products temperature, thus the hot product gases exit the reaction zone and exchange heat with the inert zone downstream the catalyst, which is therefore heated up. When the gas flow through the reaction tube is reversed, V1 valves are closed and V2 valves are opened, so cold reactants entering the reactor are heated up by the hot inert zone, which is now located upstream the catalyst. The reactants enter the catalyst bed at an elevated temperature, which adds to the heat of reaction and leads to an overall increase of the catalyst temperature. Hot product gases exit the reaction zone and exchange heat with the cold inert zone downstream of the catalyst bed. The continuous heat exchange now leads to a cooling of the heat reservoir upstream and a heating of the heat reservoir downstream the catalyst bed. If flow inversion is realized in the right way, in order to prevent the catalyst temperature from dropping once the inert zone upstream of the catalyst has been cooled down, a periodic regime can be reached, characterized by the fact that temperature and concentration profiles of two subsequent half-periods are mirror images of each other.
139
NOMENCLATURE
SYMBOLS av specific exchange surface of pellets; Ci molar concentration of specie i; Cp thermal capacity; Deff,i effective diffusivity of specie i; dr reactor diameter; es emissivity; ΔH heat of reaction; hf heat exchange coefficient between solid-gas; hoven external heat exchange coefficient; Nr number of reactions; keff effective axial thermal conductibility; ki,g mass transfer coefficient between solid-gas; r reaction rate; T temperature; Toven external temperature; vint interstitial velocity;
GREEK SYMBOLS σ Stefan-Boltzmann constant; ρ density; ε empty fraction;
SUBSCRIPT s solid phase; g gas phase.
140
REFERENCES [1] Y.S. Seo, A. Shirley, S.T. Kolaczkowski, Journal of Power Sources, 108, (2002), 213. [2] Padrò C.E.G., Putsche V., Technical Report for the Department of energy, USA, “Survey of the Economics of Hydrogen Technologies. [3] M. Prettre, C. Eichner, M. Perrin, Chem. Rev., 27, (1945), 1. [4] D. A. Hickman and L. D. Schmidt, AIChE Journal., 39, (1993), 7. [5] Q.G. Yan , T.H. Wub, W.Z. Weng, H. Toghiani , R.K. Toghiani, H.L. Wan,, C.U. Pittman Jr., Journal of Catalysis, 226, (2004), 247. [6] G. Veser, J. Frauhammer, U. Friedle, Catalysis Today., 61, (2000), 55. [7] D.L. Hoang and S.H. Chan, Applied Catalysis, 268, (2004), 207. [8] P. Maarten Biesheuvel and Gert Jan Kramer, AIChE Journal., 49, 7 (2003).. [9] Froment. G. F. Chemical Reaction Engineering, Advances in Chemistry Series 109. Am. Chem. Soc. (1972). [10] Froment, G. F. Proc. 5th Eur. S~mpC. hem. React. Engng. Amsterdam (1972). Elsevier h b l . Co., New York (1972). [11] Ergun S. Flow through Packed Columns. Chemical Engineering Progress. 1952: 48(2); 89. [12] Hicks, R. E. Ind. Eng. Chem. Fd., 9, 500 (1970). [13] Bizzi M., Basini L., Saracco G., Specchia V. Short contact time catalytic partial oxidation of methane: analysis of trasport phenomena effects. Chem. Eng. J. 2002; 90: 97-106. [14] Schwiedernoch R., Tischer S., Correa C., Deutschmann O. Experimental and numerical study on the transient behavior of partial oxidation of methane in a catalytic monolith. Chem. Eng. Sci. 2003: 58; 633-642. [15] R.J. Kee, F.M. Rupley, J.A. Miller, Chemkin II: A Fortran Chemical Kinetic Package for the Analysis of Gas Phase Chemical Kinetics, Sandia National Laboraotry, SAND86-8246, 1989. [16] C.T. Bowman, R.K. Hanson, D.F. Davidson, W.C. Gardiner Jr, V. Lissianki, G.P. Smith, D.M. Golden, M. Frenklach, M. Goldenberg, GRI MECH 2.11, http://www.me.berkley.edu/gri_mech, 1995. [17] Mears, D. E., Diagnostics criteria for heat transport limitations in fixed bed reactors. J. Catalysis. 1971: 20; 127-131. [18] Hoang D.L., Chan S.H. Modeling of a catalytic autothermal methane reformer for fuel cell applications. App Cat. A Gen.. 2004: 268; 207-216. [19] Hoang D.L., Chan S.H., Ding O.L. Hydrogen production for fuel cells by autothermal reforming of methane over sulphide nickel catalyst on a gamma alumina support. J. Power Sources. 2006: 159; 1248-1257. [20] Perry R.H., Green D.W. Perry’s Chemical Engineers Handbook, 7th ed. McGraw-Hill 1997. [21] Chilton T.H., Colburn A.P. Mass Transfer Coefficients Prediction from Data on Heat Transfer and Fluid Friction. Ind. Eng. Chem. 1934:26; 1183-1187. [22] Froment G.F., Bischoff K.B. Chemical Reactor Analysis and Design. JohnWiley & Sons, New York 1990. [23] Levenspield O. Chemical Reaction Engineering. JohnWiley & Sons, New York 1962. [24] Scott Fogler, H. Elements of chemical reaction engineering 2nd ed. Prentice Hal International Edictions: Englewood Clifs NJ 1992. [25] Edwards M.F., Richardson J.F. Gas dispersion in packed beds. Chem. Eng. Sci. 1968: 23; 109-123. [26] Bizzi M., Saracco G., Schwiedernoch R., Deutschmann O. Modeling the Partial Oxidation of Methane in a Fixed Bed with Detailed Chemistry. AIChE J. 2004; 50: 1289-1299. [27] Bizzi M., Basini L., Saracco G., Specchia V. Modeling a trasport phenomena limited reactivity in short contact time catalytic partial oxidation reactors. Ind. Eng. Chem. Res. 2003; 42: 62-71. [28] Tavazzi I., Maestri M., Beretta A., Groppi G., Tronconi E. Steady-State and Transient Analysis of a CH4-Catalytic Partial Oxidation Reformer. AIChE J. 2006; 52: 3234-3244.
141
[29] S. Yagi,and D. Kuni, Kagaku Kogaky 18, 576, (1954). [30] S. Yagi,and D. Kuni, Aiche J. 3, 373, (1957). [31] S. Yagi,and D. Kuni, Aiche J. 6, 97, (1960). [32] S. Yagi,and D. Kuni, Aiche J. 6, 543, (1960). [33] J. Vortuba, V. Hlavacek and M. Marek, Chemical Engineering Science, 27, 1845-1851, (1972). [34] R. Krupiczka, Chemia Stosowana; 2B, 183, (1966). [35] R. Krupiczka, Chim. Ind. Genie Chim.; 95 (6), 1393, (1966). [36] R. Krupiczka, Int. Chem. Eng.; 7, 122, (1967). [37] Wakao N., Kato K. Effective Thermal Conductivity of Packed Beds. J. Chem. Eng. Japan. 1969:2; 24-33. [38] Wakao N.and Vortmeyer D. Chem. Eng. Sci. 1971:26; 1753. [39] Wakao N., Kaguei S. Heat and Mass Trensfer in Packed Beds. Gordon and Breach. New York 1982. [40] D. Vortmeyer, Fortschr. Ber. VDI-Z Reihe 3, Nr. (, VDI-Verlag, Dusseldorf (1966). [41] Wakao N. , Chem. Eng. Sci. 28, 1117, (1973). [42] H. C. Hottel, Heat Trasmission edited by W. C. McAdams, 2rd ediction, McGraw-Hill, New York, Ch.2 (1954). [43] De Groote A. M., Froment G. F., ., The Canadian J. Chem. Eng, 74, (1996), 735. [44] Dissanayake D., Rosynek P., Kharas K.C.C., Lunsford J.H. Partial oxidation of methane to carbon monoxide and Hydrogen over a Ni/Al2O3. J. Catalysis.. 1991: 132; 117-127. [45] De Smet C.R.H., De Croon M.H.J.M., Berger R.J., Marin G.B., Schouten J.C. Design of adiabatic fixed-bed reactors for the partial oxidation of methane to synthesis gas. Application to production of methanol and hydrogen for fuel cells. Chem. Eng. Sci. 2001: 56; 4849-4861. [46] Van Hook J.P., Catal. Rev.-Sci. Eng., 21, 1, (1980), 1. [47] Wagner E.S. and G.F. Froment, Hydrocarbon Processing, 71, (1992), 69. [48] Galavas G.R., Phichitkul C., Voecks G.E. Structure and activity of NiO/αAl2O3 and NiO/ZrO2 calcined at high temperature. I Structure. J. of Catalysis 1984: 88; 56-64. [49] Galavas G.R., Phichitkul C., Voecks G.E. Structure and activity of NiO/αAl2O3 and NiO/ZrO2 calcined at high temperature. II Activity in the Fuel-Rich Oxidation of Methane. J. of Catalysis 1984: 88; 65-72. [50] J. Xu and G. F. Froment, Aiche Journal, 35, 1, (1989a), 88. [51] J. Xu and G. F. Froment, Aiche Journal, 35, 1, (1989b), 97. [52] T. Numaguchi, K. Kikuchi, Chemical Engineering Science, 43, 8, (1988), 2295 [53] K. Hou and R.l Hughes, Chemical Engineering Journal, 82, (2001), 311. [54] Aryafar M., Zaera F. Kinetic study of the catalitic oxidation of alkanes over nikel, palladium and platinum foils. Catalysis Letters 1997: 48; 173-183. [55] Chan S.H., Hoang D.L., Ding O.L. Transient performance of an autothermal reformer-A 2D modeling approach. Int. J. of Heat and Mass Tran. 2005: 48; 4205-4214. [56] Tiemersa T.P., Patil C.S., Van Sint Annaland M., Kuipers J.A.M. Modelling of packed bed membrane reactors for autothermal production ultrapure hydrogen. Chem. Eng. Sci. 2006: 61; 1602-1616. [57] Trimm D.L., Lam CW. The combustion of methane on platinum-alumina fibre catalysts-Kinetics and mechanism. Chem. Eng. Sci. 1980: 35; 1405-1413. [58] Ma L., Trimm D.L., Jiang C. The design and testing of an autothermal reactor for the conversion of light hydrocarbons to hydrogen. Kinetics of the catalytic oxidation of light hydrocarbons. Applied Catalysis A. 1996: 138; 275-283. [59] Hoang D.L., Chan S.H., Ding O.L. Kinetic modelling of partial oxidation of methane in an oxigen permeable membrane reactor. Chem. Eng. Res. and Des. 2005: 83; 177-186. [60] G. Contillino, “Introduzione all’integrazione numerica di problemi di equazioni differenziali ordinarie”,
http://hp9.irc.na.cnr.it/gc/didattica/ode/.
142
[61] Comincioli, “Analisi numerica”, McGraw-Hill Libri Italia. [62] Ramaswamy R.C., Ramachandran P.A., and Dudkovic P. Modeling Catalytic Partial Oxidation of Methane to Syngas in Short-Contact-Time Packed-Bed Reactors Ind. Eng. Chem. Res. 2007; 46; 8638-8651. [63] Simeone M., Salemme L., Scognamiglio D., Allouis C., Volpicelli G., Effect of water addition and stechiometry variations on temperature profiles in an autothermal methane reforming reactor with Ni catalyst, Int. J. Hydrogen Energy, 2008, doi:10.1016/j.ijhydene.2007.12.034. [64] Halabi M.H., de Croon M.H.J.M., van der Schaaf J., Cobden P.D., Schouten J.C., Modeling and Analysis of autothermal reforming of methane to hydrogen in a fixed bed reformer, Chem. Eng. J., 2007, in press, doi:10.1016/j.cej.2007.05.019 [65] Aspen Technology Inc. http://www.aspentech.com [66] Mukainakano Y, Li B., Kado S., Miyazawa T., Okumura K., Miyao T., Naito S., Kunimori K., tomishige K. “Surface modification of Ni catalysts with trace Pt and Rh for oxidatiove steam reforming of methane.”, App. Cat. A, 318, 252 (2007). [67] Li B., Maruyama K., Nurunnabi M., Kunimori K., Tomishige K. “Temperature profile of alumina-supported noble metal catalyst in autothermal reforming of methane”, App. Cat. A, 275, 157-172 (2004). [68] Hohn K. L., Schmidt L.D., “ Partial oxidation oh methane to syngas at high space velocities over Rh-coated sphere.”, Appl. Catal., 211, 53 (2001). [69] Hickman H., Schmidt L.D., “The role of boundary layer mass transfer in partial oxidation selectivity”, J. Catal. 136, 300 (1992). [70] Deutschmann O., Schmidt L. D., “Partial oxidation of methane in a short contact time reactor: two dimensional modelling with detailed chemistry”, International symposium on combustion, Combustion institute (1998). [71] Hickman H., Schmidt L.D., “Production of syngas by direct catalytic oxidation of methane”, Science 259, 343 (1993). [72] Schwiedernoch R., Tischer S., Correa C., Deutschmann O., “Experimental and numerical study on the transient behaviour of partial oxidation of methane in a catalytic reactor”, Chem. Eng. Sci., 58, 633-642, (2003). [73] Yun Hang Hu, Eli Ruckenstein, “Catalytic Conversion of Methane to Synthesis Gas by Partial Oxidation and CO2 Reforming”, Advances in Catalysis, Volume 48, Pages 297-345 (2004). [74] Ivan Tavazzi, Alessandra Beretta, Gianpiero Groppi, Pio Forzatti, “An investigation of methane partial oxidation kinetics over Rh-supported catalyst ” Number 147 In Bao X, Xy Y, eds, Studies in Surface Science and Catalysis, Volume 147, Pages 163-168, (2004). [75] Horn R., Williams K.A., Degenstein N. J.,Schmidt L.D., ”Syngas by catalytic partial oxidation of methane on rhodium”, J.of Catal. 242, 92-102 (2006). [76] Raúl Quiceno, Javier Pérez-Ramírez, Jürgen Warnatz and Olaf Deutschmann, “Modeling the high-temperature catalytic partial oxidation of methane over platinum gauze: Detailed gas-phase and surface chemistries coupled with 3D flow field simulations”, App. Cat.A., 28, 166-176,(2006). [77] Maarten Biesheuvel P. and G. J. Kramer, ”Two-section reactor model for autothermal reforming of methane to synthesis gas”, Aiche J..,49, 7 ,1827 (2003). [78] I. Tavazzi, “Short contact time catalytic partial oxidation of methane over Rh/Al2O3: a kinetics study”,PhD thesis, Milan, Italy, (2005) (available at http://www.biblio.polimi.it/opac). [79] J. Zhu, D. Zhang and K. D. King., “Reforming of CH4 by partial oxidation: thermodynamic and kinetic analyses”, Fuel vol. 80., 7,899-905 (2001). [80] Yu-Ming Lin , Shu-Ling Liu , Chen-Hsien Chuang, Yao-Tung Chu, Catalysis Today, 82, (2003), 127. [81] K. Venkataraman, E. C. Wanat, and L. D. Schmidt, AIChE Journal., 49, 5 (2003). [82] Grigorios Kolios ., J'org Frauhammer, G. Eigenberger, Chemical Engineering Science., 57, (2002), 1505.
143
[83] Matros Y.S, “Performance of Catalytic Processes under Unsteady Conditions”, in Unsteady State Processes in Catalysis , Matros Y.S ed., VPS BV, Utrecht,(1990a). [84] Matros Y.S, “Performance of Catalytic Processes under Unsteady Conditions”, Chem. Eng. Sc.,45,2097 (1990b). [85] Matros Y.S., and Bunimovich G.A., “Reverse-flow Operation in Fixed Bed Catalytic Reactors”, Cat. Rev. Sci. Eng., 38, 1 (1996). [86] Boreskov G.K., Bunimovich G.A., Matros Y.S., Ivanov A.A., “ Catalytic processes under unsteady state conditions: II. Switching the direction for the feed of the reaction mixture to the catalyst bed. Experimental results.”, Kinet. Katal., 23, 402 (1982). [87] Matros Y.S. Catalytic proces under understeady-state condictions, Amsterdam, Elsevier, 43 (1989). [88] Neophydes S.G., and Froment G.G., “A Bench Scale Study of Reversed Flow Methanol Synthesis”, Ind. Eng. Chem. Res.,31,1583 (1992). [89] Van de Bussche K.M., Neophydes S.G., Zolotarskii I.A. and Froment G.F., “Modelling and Simulation of the Reversed Flow Operation of Fixed Bed Reactor for Methanol Synthesis”, Chem. Eng. Sc.,48,3335 (1993). [90] Krylova A.V., “Specific features of ammonia synthesis reaction under non-stationary conditions”, in Unsteady State Processes in Catalysis , Matros Y.S ed., VPS BV, Utrecht,(1990). [91] Gerasev A.P., Matros Yu. Sh., “Nonstationary method for ammonia synthesis”,Theoret. Foundation Chem. Engng., 25, 680 (1991). [92] Snyder J.D. and Subramanian S., “Numerical Simulation of a Periodic Flow Reversal Reactor for Sulfur Dioxide Oxidation”, Chem. Eng. Sci.,48,4051, (1993). [93] Xiao W.D.,Yuan W.K., ”Modelling and Simulation for Adiabatic Fixed Bed Reactor with Flow Reversal”, Chem. Eng. Sc.,21,3631 (1994). [94] Eigenberger G., and Nieken U., “Catalytic Combustion with Periodical flow Reversal”, Chem. Eng. Sc.,43,2109,(1988). [95] Haynes T.N., Georgakis C., and Caram H.S.,”The Design of Reverse Flow Reactors for Catalytic Combustion System”, Chem. Eng. Sc.,50,401 (1995). [96] Cittadini M., Vanni M., Barresi A.A., Baldi G., “Efficient Design and Scale-up of Reverse Flow Catalytic Combustors”,ICheaP-4, Florence, Italy, Maggio (1999). [97] Zufle H., and Turek T., “Catalytic Combustion in a Reactor with Periodic Flow Reversal: 1. Experimental Results”, Chem. Eng. Proc.,36,327 (1997a). [98] Zufle H., and Turek T., “Catalytic Combustion in a Reactor with Periodic Flow Reversal: 2. Steady State Reactor Model ”, Chem. Eng. Proc.,36,341(1997b) [99] Snyder J.D. and Subramanian S., “A Novel Reverse Flow Strategy for Ethylbenzene Dehydrogenation in a packed bed reactor”, Chem. Eng. Sci.,49,5585 (1994). [100] Kolios G., Eigenberger G., “Styrene Synthesis in a Reverse Flow Reactor”, Chem. Eng. Sc.,54,2637 (1999). [101] Blanks R.F.,Wittring T.S.,and Peterson D.A., “Bidiretional Adiabatic Synthesis Gas Reactor”, Chem. Eng. Sci., 45, 2407 (1990). [102] Kolios G., Frauhammer J., Eighemberger G.; Autothermal fixed-bed reactor concept. Chem. Eng. Sci., 55, (2000), 5945. [103] Gosiewski K.; Simulation of non-stationary reactors for the catalytic conversion of methane to synthesis gas. Chem. Eng. Sci. 56, (2001), 1501. [104] Bernd Glockler, Grigorios Kolios, Gerhart Eigenberger, Chemical Engineering Science., 58, (2003), 593. [105] Davide Fissore, Antonello A. Barresi,* and Giancarlo Baldi, Ind. Eng. Chem. Res., 42, (2003), 2489. [106] Dirk Neumann, Mark Kirchhoffb, Gotz Veser, Catalysis Today., 98, (2004), 565. [107] Dirk Neumann, Vanessa Gepert, Gotz Veser, Ind. Eng. Chem. Res., 43, (2004), 4657. [108] Dirk Neumann and Gotz Veser, AIChE Journal., 51, (2005).
144
[109] Nieken U., Kolios G., Eigenberger G., “Limiting Cases and Approximate Solutions for Fixed Bed Reactors with Periodic Flow Reversal”, AIChE J.,41,1915 (1995). [110] Wagner C.; Chemical Technology, 18 (1945), 28. [111] Wicke E., and Vortmeyer D.; Bericht Bunsengesellschaft; 63, (1959), 145. [112] Padberg G. and Wicke E.; Stabiles and instabiles Verhalten am Beispiel einnes adiabaten rohrreaktors. Chem. Eng. Sci. 22, (1967), 1035. [113] Gilles E. D.; Chem. Eng. Sci. 29, (1974), 1211. [114] Chen Y.C. and Luss D.; Wrong-wa [115] Burghardt A., Berezowski M. and Jaconsen E.W.; Approximate characteristics of moving tempereture front in a fixed-bed catalytic reactor. Chem. Eng. Precess, 38, (1999), 19. [116] Diego Scognamiglio, Lucia Russo, Pier Luca Maffettone, Lucia Salemme, Marino Simeone and Silvestro Cresciteli, “Modeling Temperature Profiles of a Catalytic Autothermal Methane Reformer with Nickel Catalyst”; Ind. Eng. Chem. Res. In press. [117] M. Simeone, L. Salemme, D. Scognamiglio, C. Allouis, G. Volpicelli; “Effect of water addition and stoichiometry variations on temperature profiles in an autothermal methane reforming reactor with Ni catalyst”; Int. Jour. of Hydrogen Energy, 33 ( 2008 ) 1252 – 1261. [118] M. Simeone, L. Salemme, C. Allouis; “Reactor temperature profile during autothermal methane reforming on Rh/Al2O3 catalyst by IR imaging”; Int. Jour. of Hydrogen Energy, In press. [119] E. Tronconi and G. Groppi; High conductivity monolith catalyst for gas-solid exothermic reaction; Chem. Eng. Tech. 25, 2002, 7. [120] Enrico Tronconi, Gianpiero Groppi, Thorsten Boger, Achim Heibel; Monolithic catalysts with ‘high conductivity’honeycomb supports for gas/solid exothermic reactions: characterization of the heat-transfer properties; Chemical Engineering Science 59 (2004) 4941 – 4949 [121] Gianpiero Groppi, Enrico Tronconi; Honeycomb supports with high thermal conductivity for gas/solid chemical processes; Catalysis Today 105 (2005) 297–304. [122] S. Uemiya, T. Matsuda, E. Kikuchi, J. Membr. Sci. 56 (1991) 315–325
145
FIGURES INDEX Figure 1: Sketch of reforming reactor............................................................................................................... 11 Figure 2: Influence of reactor temperature on composition and conversion degree at pressure of 1 bar and ratio S/C of 1.13 Figure 3: Influence of the ratio S/C on the equilibrium composition; reactor at pressure of 1 bar and temperature of 600°C (-----), 700°C (−··−) and 800°C (····). ........................................................................................................ 14 Figure 4: Influence of the ratio S/C on the conversion degree; reactor at a pressure of 1 bar and temperature of ............. 14 Figure 5: Equilibrium composition at varying the air ratio; the preheating temperature of methane and air is 200°C and the pressure is 1 atm. ......................................................................................................................................... 16 Figure 6: Adiabatic temperature, degree of methane conversion and hydrogen yield, at varying the air ratio; the preheating temperature of methane and air is 200°C and the pressure is 1 atm. ..................................................................... 17 Figure 7: Effect of air ratio and W/CH4 ratio (S/C) on adiabatic temperature and conversion degree; reactor work with a pressure of 1 bar and a preheating temperature of 400°C. ................................................................................... 20 Figure 8: Effect of air ratio and S/C on carbon coke formation zone; reactor work with a pressure of 1 bar and a preheating temperature of 400°C. ................................................................................................................... 21 Figure 9: Effect of air ratio and S/C on the molar flux of hydrogen and carbon monoxide......................................... 21 Figure 10: Scheme of experimental system. ....................................................................................................... 25 Figure 11: Schematization of the laboratory reactor............................................................................................ 32 Figure 12: Schematization of the reactor. ......................................................................................................... 35 Figure 13: Comparison between methane conversion rates due to heterogeneous and homogeneous chemistry. .................. 39 Figure 14: Axial thermal profile at steady state conditions: pressure:1.7 bar;; nitrogen flow: 4 Nl/min; oven temperature: 623 and 773 K. .......................................................................................................................................... 46 Figure 15: Schematization of the spatial discretization of the system. .................................................................... 48 Figure 16: Thermodynamics data simulated using and adiabatic RGibbs reactor for a CPO process done with air and preheating temperature of 623K....................................................................................................................... 52 Figure 17: Sketch of the catalytic Ni/Al2O3 during the oxidation of methane at different temperatures. ..................... 56 Figure 18: Sketch of a stratification of Nickel catalyst........................................................................................ 57 Figure 19: Experimental thermal profile of a solid phase. Flow rate 4 Nl/min, ratio A/CH4= 3.125 and preheating temperature of 623 K. ................................................................................................................................... 62 Figure 20: Comparison between experimental and numerical data varying the value of parameter “n”. Flow rate 4 Nl/min, ratio A/CH4= 3.125 and preheating temperature of 623 K. .............................................................................. 63 Figure 21: Simulated profile of oxygen conversion degree and delay function along the reactor. Flow rate 4 Nl/min, ratios A/CH4= 3.125, W/CH4=1.2 and preheating temperature of 623 K. .............................................................. 64 Figure 22: Experimental thermal profile of solid phase varying the flow rate. Fedd ratios A/C=3.125, W/C=1.2 and preheating temperature of 623 K...................................................................................................................... 65 Figure 23: Comparison between experimental and numerical data of solid thermal profile, varying the flow rate (fig. 23.a,b,c,d). Feed ratio A/C=3.125, W/C=1.2 and preheating temperature of 623 K. ........................................... 67 Figure 24: Comparison between experimental and numerical data of solid thermal profile, varying the flow rate. Feed ratio A/C=3.125, W/C=1.2 and preheating temperature of 623 K. .......................................................................... 68 Figure 25: Simulated thermal profiles varying the flow rate. Feed ratio A/C=3.125, W/C=1.2 and preheating temperature of 623 K. ................................................................................................................................... 68 Figure 26: Comparison between experimental and numerical data composition at outlet of reactor varying the flow rate. Feed ratios A/C=3.125, W/C=1.2 and preheating temperature of 623 K................................................................... 69 Figure 27: Experimental thermal profiles of solid phase varying the feed ratio W/C. Feed ratio A/C=3.125, flow rate 4 Nl/min and preheating temperature of 623 K.................................................................................................... 70
146
Figure 28: Comparison between experimental and numerical thermal profiles on solid phase varying the feed ratio W/C (fig. 28.a,b,c,d). Feed ratio A/C=3.125, flow rate 4Nl/min and preheating temperature of 623 K. .......................... 71 Figure 29: Comparison between experimental and numerical data of solid thermal profile, varying the feed ratio W/C. Feed ratio A/C=3.125, flow rate 4Nl/min and preheating temperature of 623 K.......................................................... 72 Figure 30: Simulated thermal profiles of solid phase. Feed ratio A/C=3.125, flow rate 4 Nl/min and preheating temperature of 623 K. .................................................................................................................................. 72 Figure 31: Comparison between experimental and numerical composition data to outlet of reactor, varying the feed ratio W/C. Feed ratio A/C=3.125, flow rate 4Nl/min and preheating temperature of 623 K........................................ 73 Figure 32: Oxidation, reforming and shift reactions rates along the bed for different values of the H2O/CH4 ratio. At preheating temperature Tph= 623 K, A/CH4=3.125, flow rate 4 Nl/min, pressure 1.7 bar. .................................... 74 Figure 33: Comparison between experimental, numerical and thermodynamical data of methane conversion, varying the floe rate. Feed ratios A/C=3.125, W/C=1.2 and preheating temperature of 623 K. ................................................... 76 Figure 34: Simulated profile of rate of reactions along the catalytic bed. Feed ratios A/C=3.125, W/C=1.2, floe rate 1.5Nl/min and preheating temperature of 623 K. .............................................................................................. 77 Figure 35: Simulated profile of rate of reactions along the catalytic bed. Feed ratios A/C=3.125, W/C=1.2, floe rate 3Nl/min and preheating temperature of 623 K.................................................................................................. 77 Figure 36: Simulated profile of rate of reactions along the catalytic bed. Feed ratios A/C=3.125, W/C=1.2, floe rate 5Nl/min and preheating temperature of 623 K.. ................................................................................................ 78 Figure 37: Simulated profile of rate of reactions along the catalytic bed. Feed ratios A/C=3.125, W/C=1.2, floe rate 6Nl/min and preheating temperature of 623 K.................................................................................................. 78 Figure 38: Simulated profile of steam reforming and oxidation reactions rate at end of part of catalytic bed. Feed ratios A/C=3.125, W/C=1.2, and preheating temperature of 623 K. ......................................................................... 79 Figure 39: Simulated thermal profile of solid and gas phases. Feed ratios A/C=3.125, W/C=1.2, flow rate of 5Nl/min and preheating temperature of 623 K................................................................................................................ 80 Figure 40: Simulated temperature differences between solid and gas phase varying the flow rate. Feed ratios A/C=3.125, W/C=1.2, and preheating temperature of 623 K............................................................................................... 81 Figure 41: Experimental comparison between thermal profiles measured by IR camera and thermocouple. Feed ratios A/C=2.78, W/C=1.2, and preheating temperature of 623 K. ........................................................................... 81 Figure 42: Numerical solid temperature profiles at different pressure values (1.7, 5, 7.5, 15 bar). At flow rate 6 Nl/min, Tph= 623 K, A/CH4=3.125 and H2O/CH4=1.2. ........................................................................................ 82 Figure 43: Numerical solid temperature profiles at different pressure values (1.7, 5, 7.5, 15 bar). At flow rate 1.5 Nl/min, Tph= 623 K, A/CH4=3.125 and H2O/CH4=1.2. ........................................................................................ 83 Figure 44: Methane conversion as the pressure is varied for two different values of the flow rate (1.5 and 6 Nl/min). At preheating temperature Tph= 623 K, A/CH4=3.125 and H2O/CH4=1.2.......................................................... 83 Figure 45: Numerical solid temperature profiles at different preheating temperatures (473, 623 and 773K). At pressure 1.7 bar, flow rate 4 Nl/min, A/CH4=3.125 and H2O/CH4=1.2.......................................................................... 84 Figure 46: Methane conversion as preheating temperature is varied. At pressure 1.7 bar, flow rate 4 Nl/min, A/CH4=3.125 and H2O/CH4=1.2 ............................................................................................................ 85 Figure 47: Simulated profile of O2 and CH4 conversion varying the flow rate. Feed ratios A/C=3.125, W/C= 1.2 and preheating temperature of 623 K...................................................................................................................... 86 Figure 48: Typical gas phase temperature profile in an ATR/CPO process of methane. .......................................... 90 Figure 49: Experimental thermal profile of solid phase. Flow rate 4 Nl/min, ratio A/CH4= 3.125, W/C=0 and T of preheating 623 K. .............................................................................................................. 96 Figure 50: Comparison between experimental and numerical data for a value of parameter n equal to 4. Flow rate 4 Nl/min, ratio A/CH4= 3.125, W/C=0 and T preheating 623 K. ................................................................... 96 Figure 51: Simulated profile of methane conversion degree and delay factor. Flow rate of 4 Nl/min, ratio A/CH4= 3.12, W/C=0 and T of preheating of 623 K. ........................................................................................................... 97
147
Figure 52: Experimental thermal profiles of solid phase varying the feed ratio A/C. Feed ratio W/C=0 and preheating temperature of 623 K. ................................................................................................................................... 98 Figure 53: Comparison between experimental and numerical data of a solid phase temperature. Ratio A/C=3.6, W/C=0 and preheating temperature of 623 K................................................................................................................ 99 Figure 54: Comparison between experimental and numerical data of a solid phase temperature. Ratio A/C=3.125, W/C=0 and preheating temperature of 623 K. ............................................................................................... 100 Figure 55: Comparison between experimental and numerical data of a solid phase temperature. Ratio A/C=2.78, W/C=0 and preheating temperature of 623 K. ............................................................................................... 100 Figura 56: Confronto tra dati sperimenta e simulati di composizione della corrente in uscita dal reattore a differente rapporto di alimentazione A/C. Rapporto di alimentazione W/C=0 e temperatura di preriscaldamento di 623 K................... 101 Figure 57: Experimental thermal profiles, of solid phase, varying the feeling ratio W/C. Ratio A/C=3.125, flow rate 4 Nl/min and preheating temperature of 623 K.................................................................................................. 102 Figure 58: Comparison between experimental and numerical data of solid temperature. Feeding W/C=0, A/C=3.125, flow rate 4Nl/min and preheating temperature of 623 K. .................................................................................. 103 Figure 59: Comparison between experimental and numerical data of solid temperature. Feeding W/C=0.5, A/C=3.125, flow rate 4Nl/min and preheating temperature of 623 K. .................................................................................. 103 Figure 60: Comparison between experimental and numerical data of solid temperature. Feeding W/C=1.2, A/C=3.125, flow rate 4Nl/min and preheating temperature of 623 K. .................................................................................. 104 Figure 61: Comparison between experimental and numerical data of outlet compositions for a varying feeding ratio W/C. Ratio A/C=3.125, flow rate 4Nl/min and preheating temperature of 623 K...................................................... 105 Figure 62: Thermodynamic equilibrium results: normalised equilibrium product yield as a function of initial O2/CH4 ratio at various temperatures (in CH4/air mixture at 1 atm). ............................................................................ 106 Figure 63: Experimental temperature profile of solid phase during RUN1 (setting: A/C molar ratio of 2.78, W/C molar ratio of 0, flow rate 4Nl/min and preheating temperature cf 773 K. ............................................................ 108 Figure 64: Comparison between numerical and experimental data on basis of RUN1. .......................................... 109 Figure 65: Experimental thermal profile of solid phase varying the feed ratio W/C. Feed ratio A/C=2.78, flow rate 4 Nl/min and preheating temperatre of 773 K. .................................................................................................. 110 Figure 66: Comparison betwen experimental and numerical data of thermal profile. Feed ratios A/C=2.78, W/C=0.7,and preheating temperature of 773 K.............................................................................................. 110 Figure 67: Comparison betwen experimental and numerical data of thermal profile. Feed ratios A/C=2.78, W/C=1.2,and preheating temperature of 773 K.............................................................................................. 111 Figure 68: Comparison between experimental and numerical data of outlet composition varying the feed ratio W/C. Feed ratio A/C=2.78, flow rate 4Nl/min and preheating temperature of 773 K.......................................................... 111 Figure 21: Simulated profile of oxygen conversion degree and delay function along the reactor for Nickel catalyst. Flow rate 4 Nl/min, ratios A/CH4= 3.125, W/CH4=1.2 and preheating temperature of 623 K. .................................... 114 Figure 51: Simulated profile of methane conversion degree and delay factor for Rhodium catalyst. Flow rate of 4 Nl/min, ratio A/CH4= 3.12, W/C=0 and T of preheating of 623 K.. ........................................................................ 115 Figure 71: Simulated profile of oxygen conversion degree and delay factor along the reactor, for Nickel catalyst, varying the flow rate. Feed ratios A/CH4= 3.125, W/C=1.2 and preheating temperature of 623 K. ................................... 115 Figure 72: Simulated profile of oxygen conversion degree and delay factor along the reactor, for Rhodium catalyst, varying the flow rate. Feed ratios A/CH4= 3.125, W/C=1.2 and preheating temperature of 623 K. ................................... 116 Figure 73: Simulated profile of methane and oxygen conversion degree, on Nickel and Rhodium catalyst, varying the flow rate. Feed ratios A/CH4= 3.125, W/C=1.2 and preheating temperature of 623 K........................................... 116 Figure 74: Simulated profile of maximum temperature varying the feed steam/carbon on Nickel and Rhodium catalyst. Feed ratio A/CH4= 3.12 and preheating temperature of 623 K........................................................................ 118 Figure 75: Simulated profile of temperature difference varying the feed ratio steam/carbon on Nickel and Rhodium catalyst. Feed ratio A/CH4= 3.12 and preheating temperature of 623 K........................................................................ 119
148
Figure 76: Simulated profile of maximum temperature varying the flow rate on Nickel and Rhodium catalyst. Ratio A/CH4= 3.12 and preheating temperature of 623 K. ..................................................................................... 119 Figure 77: Simulated difference of temperature between gas and solid phase, varying the flow rate and for both catalist systems. Feed ratios A/C=3.125, W/C=1.2, and preheating temperature of 623 K. ........................................... 120 Figure 78: Simulated profile of difference of temperature in the catalytic bed varying the flow rate on both catalytic systems. Feed ratios A/CH4= 3.12 and preheating temperature of 623 K. ..................................................................... 120 Figure 79: Experimental profile of methane conversion degree varying the feed ratios A/CH4 and W/CH4 on Rhodium catalyst. Flow rate = 4 Nl/min and preheating temperature of 623 K................................................................. 122 Figure 80: Experimental profile of methane conversion degree varying the feed ratios A/CH4 e W/CH4 on Nickel catalyst. Flow rate = 4 Nl/min and preheating temperature of 623 K.................................................................. 122 Figure 81: Experimental profile of H2 and CO yield, varying the feed ratios A/CH4 and W/CH4 on Rhodium catalyst Flow rate = 4 Nl/min and preheating temperature of 623 K. ........................................................................... 123 Figura 82: Andamento sperimentale della resa di H2 e CO al variare dei rapporti di alimentazione A/CH4 e W/CH4 su catalizzatore al Nikel Flow rate = 4 Nl/min e T preriscaldamento 623 K....................................................... 123 Figure 83: Simulated Reactor thermal profile in the solid phase parametric in solid thermal conductivity; A/CH4=3.125, W/CH4=1.2, Rh-based catalyst, flow rate = 4 Nl/min, preheating Temperature = 623 K. ................................. 127 Figure 84: Sketch Membrane Reactor. .......................................................................................................... 129 Figure 85: Schematization of parallel plate configuration: (a) one pass, 3 channels; (b) one pass, 5 channels; (c) Two passes, 3 channels; (d) Extended configuration of the two passes, 3 channels solution.......................................................... 131 Figure 86: Standard schematization of an adiabatic fixed bed reactor with an external counter-current heat exchanger and typical temperature plot. ............................................................................................................................... 134 Figure 87: Standard schematization of a counter-current fixed bed reactor and typical temperature plot..................... 135 Figure 88: Sketch Reverse flow reactor. ....................................................................................................... 135 Figure 89: RFR: a) profile of T and conversion during the moving of front of reaction in an adiabatic packed bed reactor. b) Temperature profile and conversion at end of both semi-cycles. c) Transient of periodic regime [100]............................. 136 Figure 90: Schema Heat Exchange Reactor with separate feed of reactants (F1 and F2), pre-mixing zone (a), static mixers (b), catalytic reaction zone (c) and rupture disk (d). the cold product gas leave the reactor through exit P....................... 137