university of naples federico ii department of political ... · university of naples federico ii...
TRANSCRIPT
UNIVERSITY OF NAPLES FEDERICO II
Department of Political Sciences and
ACTION CONTRE LA FAIM
FOOD SECURITY IMPACT OF 2014 EBOLA VIRUS
EPIDEMIC. POPULATION EXPOSED TO UNDERNOURISHMENT:
FORECASTS IN GUINEA, LIBERIA AND SIERRA LEONE
Prof. Giancarlo Ragozini Dott. Michel Maietta
October 2014
Department of Political Sciences - University of Naples Federico II and Action Contre la Faim
Food Security Impact of Ebola Virus Epidemic 2
CONTENT
Highlights 3
Backgrounds 4
The Data 6
Methodology 10
The Estimated Multiple Regression Models 12
Forecasts 15
STATEMENT ON COPYRIGHTS © Action Contre la Faim © Università degli Studi di Napoli Federico II, Dipartimento di Scienze Politiche Contacts: Dott. Michel Maietta, Director of Strategy and Analysis, Action Contre la Faim [email protected] Prof. Giancarlo Ragozini Università degli Studi di Napoli Féderico II, Dipartimento di Scienze Politiche [email protected]
Department of Political Sciences - University of Naples Federico II and Action Contre la Faim
Food Security Impact of Ebola Virus Epidemic 3
Highlights
The Ebola epidemic in West Africa is taking a severe toll on the affected countries in terms of human deaths, crumbling health systems, an economic crisis, extensive commercial restrictions and, of course, food insecurity and an increase in the number of people exposed to food deprivation and undernourishment.
The main purpose of this paper is to provide forecasts of the number of people that will be exposed to undernourishment in 2015.
Three databases have been developed, one for each country under analysis (Guinea, Liberia and Sierra Leone), we have made some preliminary analysis and have estimated three multiple regression models to be able to relate the selected drivers to the Prevalence of Undernourishment (PoU). The model selection has been performed on the base of both statistical criteria and theoretical hypothesis.
On the base of the estimated models, we have provided a set of forecasts for each country corresponding to three different kinds of scenarios, called Low Level Ebola Crisis (LLEC), Medium Level Ebola Crisis (MLEC), High Level Ebola Crisis (HLEC).
The forecasts are the follows:
Country People undernouris
hed 2012-2014
Forecast 2015 LLEC
Forecast 2015 MLEC
Forecast 2015 HLEC
No. No. Var. No. Var. No. Var. Guinea 2.1 2.126 0.026 2.294 0.194 2.407 0.307 Liberia 1.3 1.330 0.030 1.402 0.102 1.486 0.186 Sierra Leone 1.55 1.550 0.00 1.632 0.082 1.790 0.240 Total 4.95 5.006 0.056 5.328 0.378 5.683 0.733
Number in millions of people
In the LLEC the economic growth of the three countries will dramatically decrease and the expected improvements in terms of forecasted reductions in undernourishment will be not come to fruition. In case of HLEC, the percentage of people exposed to undernourishment, in the three countries will regress to levels last seen to five or six years ago.
Without any economic downturn, given the pre-crisis undernourishment trend, about 283,000 people would have been lifted out of hunger by the end of 2014 in the three countries with significant progress expected in Sierra Leone.
In the HLEC, it is forecasted that more than seven hundred thousand additional people will suffer from undernourishment in 2015 in the three most-affected countries.
The multiple regression estimated models can be used to update the forecasts when and if the scenarios will change, or adopting different assumptions.
Department of Political Sciences - University of Naples Federico II and Action Contre la Faim
Food Security Impact of Ebola Virus Epidemic 4
Backgrounds The Ebola epidemic in West Africa is taking a severe toll in terms of human deaths, crumbling health systems, an economic crisis, and extensive commercial restrictions. As a consequence, food insecurity and the number of people at risk of food deprivation are rapidly growing. This report focuses on the latter issues. The aim is to provide a set of forecasts corresponding to different scenarios for the evolution of the crisis. In order to pursue this task, this report analyses the Action Contre la Faim internal documents 140915 - EVD CRISIS - 6Months Scenarios.docx and 140915 - EVD CRISIS – Analysis. Other sources included:
the forecasts related to the economic issues made by World Bank research centre “The Economic Impact of the 2014 Ebola Epidemic: Short and Medium Term Estimates for Guinea, Liberia, and Sierra Leone”1;
the report on food security by FAO “Ebola Virus Disease Outbreak in West Africa”2;
the UNITED NATIONS-ECONOMIC AND SOCIAL COUNCIL report on “Status of Food Security in Africa” dating at 20123;
the country reports by the World Food Program4; the Alert by FEWSnet “Severe disruptions to markets and livelihoods if
Ebola case load grows drastically”5 of October 10, 2014 From analysis of these documents the main drivers that could affect the level of undernourishment were identified. The first and most obvious driver is income that could be measured both at country level and at the individual level. Income levels directly affect the purchasing power of food on the domestic markets and of food and commodity imports on the international markets. Another relevant factor is food price dynamics that are related to the income level, cereal and food productions and the food availability and variability. The relationships between the level of food imports and food production and consumption provide an indication of the dependency on imports of the internal food security. Food availability depends also on the quality and quantity of roads and transportations. Food availability, especially related to crop production, depends on the amount of land that is arable and devoted to food production, the labour force employed in the agriculture sector and on a well-functioning agricultural production cycle, from sowing to harvest.
1 http://www.worldbank.org/en/region/afr/publication/the-economic-impact-of-the-2014-ebola-epidemic-short-and-medium-term-estimates-for-west-africa 2http://www.fao.org/fileadmin/user_upload/emergencies/docs/FAO_EVD_ExecutiveBrief_20140922.pdf 3 http://www.uneca.org/sites/default/files/page_attachments/3._cfssd-8-0032-ore-status_of_food_security_in_africa_2012.pdf 4 http://www.wfp.org/countries 5 http://www.fews.net/west-africa/alert/october-10-2014
Department of Political Sciences - University of Naples Federico II and Action Contre la Faim
Food Security Impact of Ebola Virus Epidemic 5
The analysis highlights that the Ebola epidemic will have the following effects:
National and individual income will dramatically decrease and the economic growth observed in the three countries during the last few years will stall. Moreover, in the worst case scenario, an economic crisis due to a reduction in income at the national and individual level is highly probable.
Quoting the World Bank Analysis:
“Using a method based on sector decomposition, the short-term (2014) impact on output is estimated to be on the order of 2.1 percentage points (pp) of GDP in Guinea (reducing growth from 4.5 percent to 2.4 percent); 3.4 pp of GDP in Liberia (reducing growth from 5.9 percent to 2.5 percent) and 3.3 pp of GDP in Sierra Leone (reducing growth from 11.3 percent to 8.0 percent). This forgone output corresponds to US$359 million in 2014 prices.”
“The medium-term impact (2015) on output in Guinea is estimated to be negligible under Low Ebola, and 2.3pp of GDP under High Ebola. In Liberia, it is estimated to be 4.2pp of GDP under Low Ebola, or 11.7pp of GDP under High Ebola. In Sierra Leone, the impact would be 1.2pp of GDP under Low Ebola, and 8.9pp under High Ebola. These estimates of lost GDP in the core three countries (for calendar year 2015 alone) sum to US$97 million under Low Ebola (implying some recovery from 2014), and US$809 million under High Ebola”
Imposing a quarantine area and the ensuing mobility limitations for people
and goods, associated to the income reduction, will reduce the imports and will increase the food price levels and the fluctuations in price. Quoting the World Bank Analysis:
“Inflation and food prices were initially contained but are now showing upward movements in response to shortages, panic buying, and speculation. The food poor in these countries are becoming increasingly vulnerable. Exchange rate volatility has increased in all three countries, particularly since June, fuelled by uncertainty and some capital flight.”
The Ebola epidemic is affecting the sowing period of the agricultural production cycle. The imposition of quarantines, the increasing caseload of people sick from Ebola and the need for women (traditionally farm labourers) to become caregivers are directly reducing the labour force available to work in the fields. This driver will seriously reduce the harvests. Quoting the GIEWS Special Alert No: 333 - Guinea, Liberia and Sierra Leone (Ebola outbreak) by Food and Agriculture Organization of United Nation:
“Although necessary, these restrictions have resulted in food security concerns that curtailed the movement of goods and services, including
Department of Political Sciences - University of Naples Federico II and Action Contre la Faim
Food Security Impact of Ebola Virus Epidemic 6
food items, leading to panic buying, food shortages and significant price hikes. In addition, the ban on bush meat is expected to deprive some households of an important source of nutrition and income”. “Furthermore, with the peak of the crop harvesting, mainly cereals, due in a few weeks’ time, the likely labour shortages on farms would have severe implications for food and cash crop production in the affected areas, thus jeopardizing the food security of large numbers of people.”
Based on reports given by international news outlets the “Low Level Ebola Crisis” scenario seems very unlikely; the “Medium Level Ebola Crisis” scenario has very high probability. Unfortunately, the “High Level Ebola Crisis” scenario, which had a low probability at beginning of the outbreak, is now becoming more likely.
Department of Political Sciences - University of Naples Federico II and Action Contre la Faim
Food Security Impact of Ebola Virus Epidemic 7
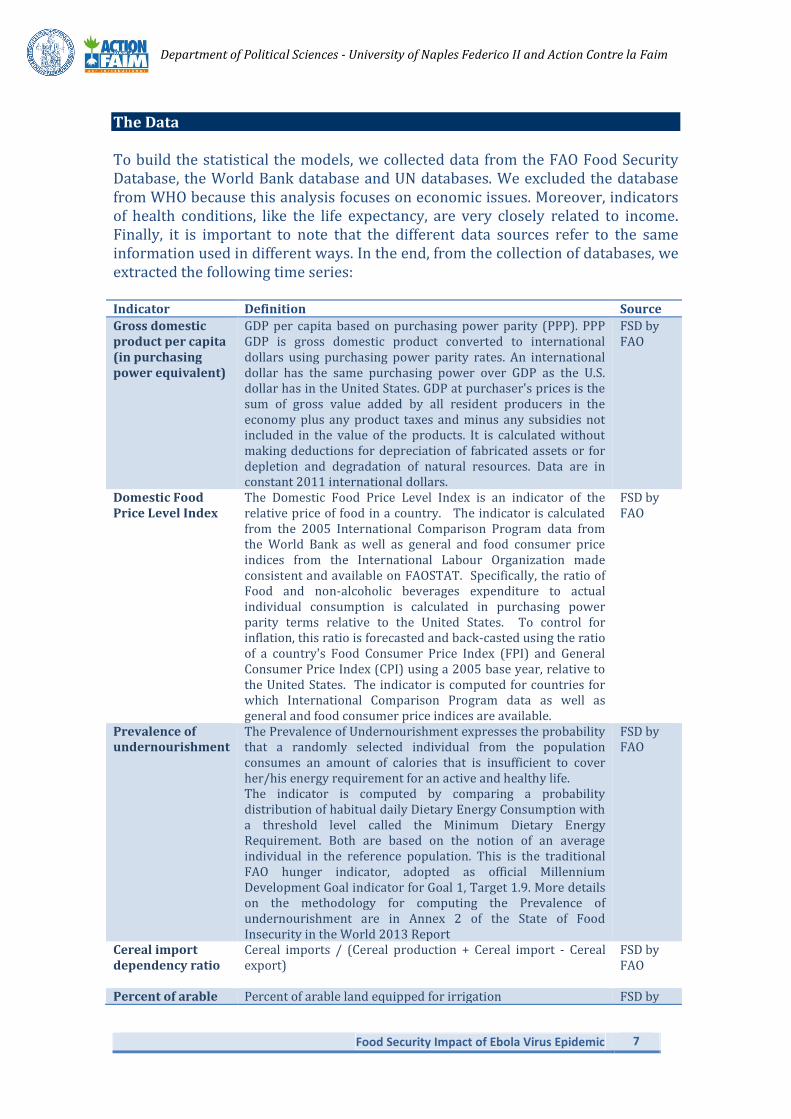
The Data To build the statistical the models, we collected data from the FAO Food Security Database, the World Bank database and UN databases. We excluded the database from WHO because this analysis focuses on economic issues. Moreover, indicators of health conditions, like the life expectancy, are very closely related to income. Finally, it is important to note that the different data sources refer to the same information used in different ways. In the end, from the collection of databases, we extracted the following time series: Indicator Definition Source
Gross domestic product per capita (in purchasing power equivalent)
GDP per capita based on purchasing power parity (PPP). PPP GDP is gross domestic product converted to international dollars using purchasing power parity rates. An international dollar has the same purchasing power over GDP as the U.S. dollar has in the United States. GDP at purchaser's prices is the sum of gross value added by all resident producers in the economy plus any product taxes and minus any subsidies not included in the value of the products. It is calculated without making deductions for depreciation of fabricated assets or for depletion and degradation of natural resources. Data are in constant 2011 international dollars.
FSD by FAO
Domestic Food Price Level Index
The Domestic Food Price Level Index is an indicator of the relative price of food in a country. The indicator is calculated from the 2005 International Comparison Program data from the World Bank as well as general and food consumer price indices from the International Labour Organization made consistent and available on FAOSTAT. Specifically, the ratio of Food and non-alcoholic beverages expenditure to actual individual consumption is calculated in purchasing power parity terms relative to the United States. To control for inflation, this ratio is forecasted and back-casted using the ratio of a country's Food Consumer Price Index (FPI) and General Consumer Price Index (CPI) using a 2005 base year, relative to the United States. The indicator is computed for countries for which International Comparison Program data as well as general and food consumer price indices are available.
FSD by FAO
Prevalence of undernourishment
The Prevalence of Undernourishment expresses the probability that a randomly selected individual from the population consumes an amount of calories that is insufficient to cover her/his energy requirement for an active and healthy life. The indicator is computed by comparing a probability distribution of habitual daily Dietary Energy Consumption with a threshold level called the Minimum Dietary Energy Requirement. Both are based on the notion of an average individual in the reference population. This is the traditional FAO hunger indicator, adopted as official Millennium Development Goal indicator for Goal 1, Target 1.9. More details on the methodology for computing the Prevalence of undernourishment are in Annex 2 of the State of Food Insecurity in the World 2013 Report
FSD by FAO
Cereal import dependency ratio
Cereal imports / (Cereal production + Cereal import - Cereal export)
FSD by FAO
Percent of arable Percent of arable land equipped for irrigation FSD by
Department of Political Sciences - University of Naples Federico II and Action Contre la Faim
Food Security Impact of Ebola Virus Epidemic 8
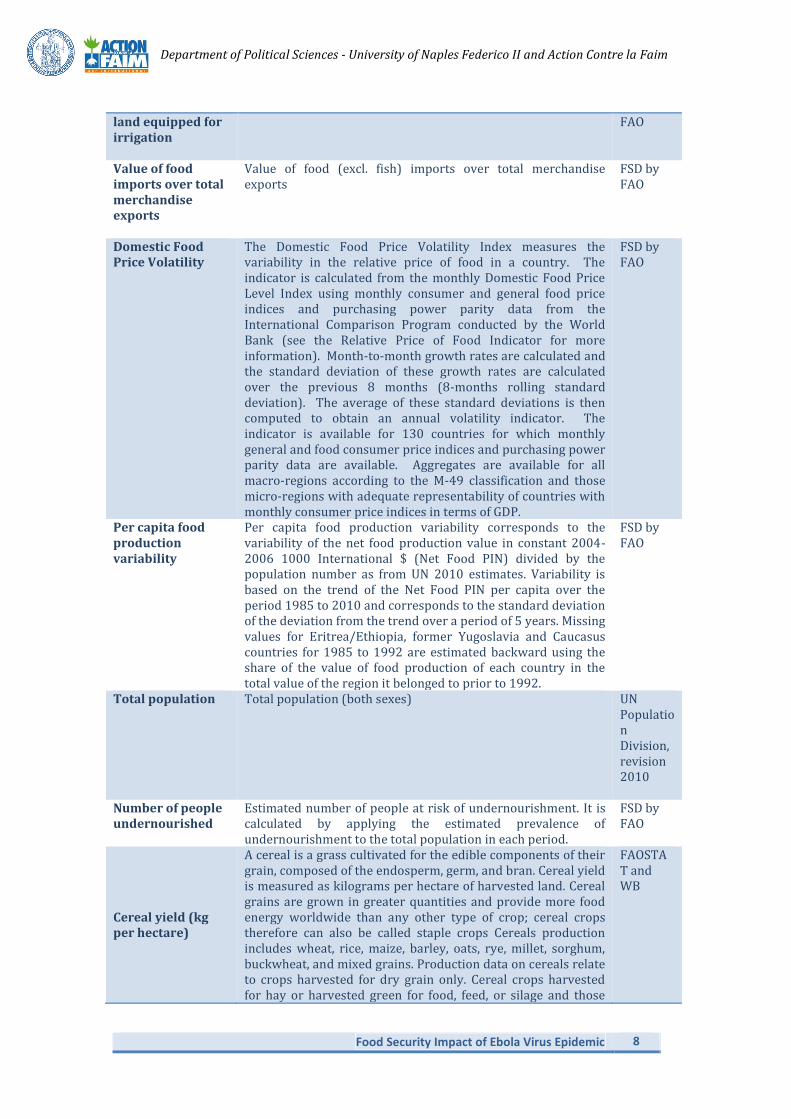
land equipped for irrigation
FAO
Value of food imports over total merchandise exports
Value of food (excl. fish) imports over total merchandise exports
FSD by FAO
Domestic Food Price Volatility
The Domestic Food Price Volatility Index measures the variability in the relative price of food in a country. The indicator is calculated from the monthly Domestic Food Price Level Index using monthly consumer and general food price indices and purchasing power parity data from the International Comparison Program conducted by the World Bank (see the Relative Price of Food Indicator for more information). Month-to-month growth rates are calculated and the standard deviation of these growth rates are calculated over the previous 8 months (8-months rolling standard deviation). The average of these standard deviations is then computed to obtain an annual volatility indicator. The indicator is available for 130 countries for which monthly general and food consumer price indices and purchasing power parity data are available. Aggregates are available for all macro-regions according to the M-49 classification and those micro-regions with adequate representability of countries with monthly consumer price indices in terms of GDP.
FSD by FAO
Per capita food production variability
Per capita food production variability corresponds to the variability of the net food production value in constant 2004-2006 1000 International $ (Net Food PIN) divided by the population number as from UN 2010 estimates. Variability is based on the trend of the Net Food PIN per capita over the period 1985 to 2010 and corresponds to the standard deviation of the deviation from the trend over a period of 5 years. Missing values for Eritrea/Ethiopia, former Yugoslavia and Caucasus countries for 1985 to 1992 are estimated backward using the share of the value of food production of each country in the total value of the region it belonged to prior to 1992.
FSD by FAO
Total population
Total population (both sexes)
UN Population Division, revision 2010
Number of people undernourished
Estimated number of people at risk of undernourishment. It is calculated by applying the estimated prevalence of undernourishment to the total population in each period.
FSD by FAO
Cereal yield (kg per hectare)
A cereal is a grass cultivated for the edible components of their grain, composed of the endosperm, germ, and bran. Cereal yield is measured as kilograms per hectare of harvested land. Cereal grains are grown in greater quantities and provide more food energy worldwide than any other type of crop; cereal crops therefore can also be called staple crops Cereals production includes wheat, rice, maize, barley, oats, rye, millet, sorghum, buckwheat, and mixed grains. Production data on cereals relate to crops harvested for dry grain only. Cereal crops harvested for hay or harvested green for food, feed, or silage and those
FAOSTAT and WB
Department of Political Sciences - University of Naples Federico II and Action Contre la Faim
Food Security Impact of Ebola Virus Epidemic 9
used for grazing are excluded.
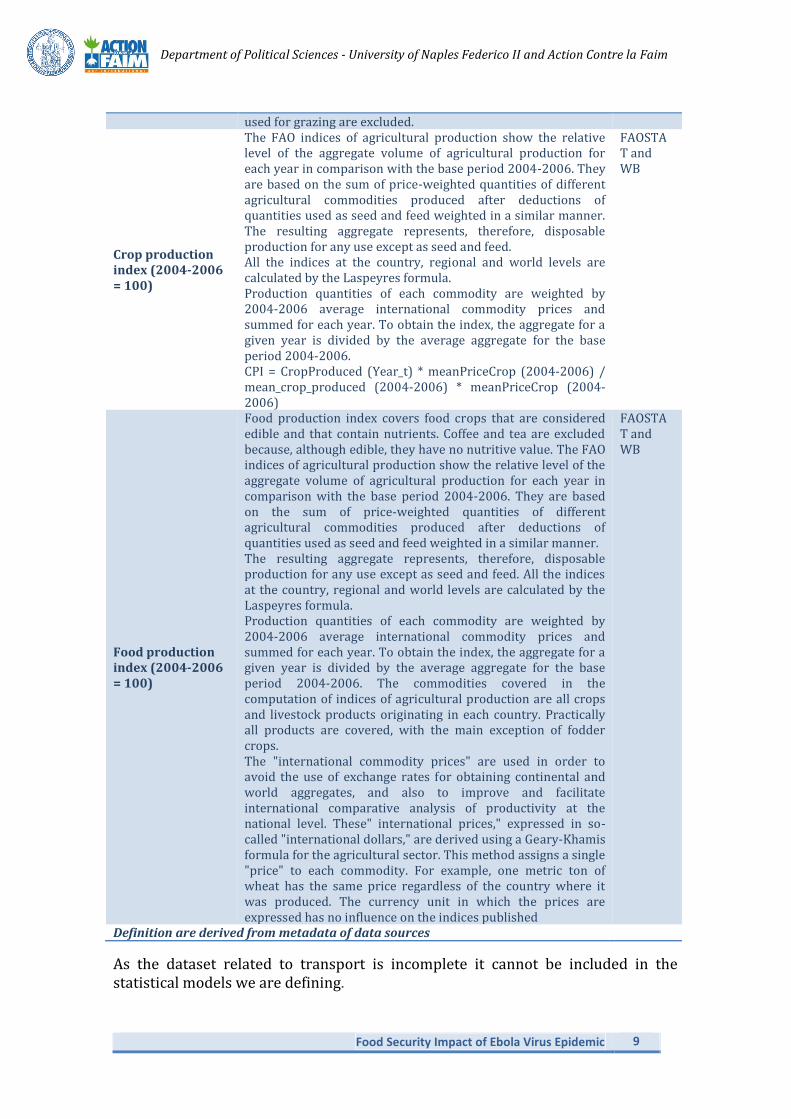
Crop production index (2004-2006 = 100)
The FAO indices of agricultural production show the relative level of the aggregate volume of agricultural production for each year in comparison with the base period 2004-2006. They are based on the sum of price-weighted quantities of different agricultural commodities produced after deductions of quantities used as seed and feed weighted in a similar manner. The resulting aggregate represents, therefore, disposable production for any use except as seed and feed. All the indices at the country, regional and world levels are calculated by the Laspeyres formula. Production quantities of each commodity are weighted by 2004-2006 average international commodity prices and summed for each year. To obtain the index, the aggregate for a given year is divided by the average aggregate for the base period 2004-2006. CPI = CropProduced (Year_t) * meanPriceCrop (2004-2006) / mean_crop_produced (2004-2006) * meanPriceCrop (2004-2006)
FAOSTAT and WB
Food production index (2004-2006 = 100)
Food production index covers food crops that are considered edible and that contain nutrients. Coffee and tea are excluded because, although edible, they have no nutritive value. The FAO indices of agricultural production show the relative level of the aggregate volume of agricultural production for each year in comparison with the base period 2004-2006. They are based on the sum of price-weighted quantities of different agricultural commodities produced after deductions of quantities used as seed and feed weighted in a similar manner. The resulting aggregate represents, therefore, disposable production for any use except as seed and feed. All the indices at the country, regional and world levels are calculated by the Laspeyres formula. Production quantities of each commodity are weighted by 2004-2006 average international commodity prices and summed for each year. To obtain the index, the aggregate for a given year is divided by the average aggregate for the base period 2004-2006. The commodities covered in the computation of indices of agricultural production are all crops and livestock products originating in each country. Practically all products are covered, with the main exception of fodder crops. The "international commodity prices" are used in order to avoid the use of exchange rates for obtaining continental and world aggregates, and also to improve and facilitate international comparative analysis of productivity at the national level. These" international prices," expressed in so-called "international dollars," are derived using a Geary-Khamis formula for the agricultural sector. This method assigns a single "price" to each commodity. For example, one metric ton of wheat has the same price regardless of the country where it was produced. The currency unit in which the prices are expressed has no influence on the indices published
FAOSTAT and WB
Definition are derived from metadata of data sources
As the dataset related to transport is incomplete it cannot be included in the statistical models we are defining.
Department of Political Sciences - University of Naples Federico II and Action Contre la Faim
Food Security Impact of Ebola Virus Epidemic 10
The Methodology As a first step we have harmonized the time series with respect to the time periods. Indeed, some of the selected indicators are collected annually, while others are moving averages over a time span of three years. Consequently, the data have been homogenized by constructing a series of three year moving averages over the same time span. The second step was to look at the series by using time series plots and scatter plots. These plots highlighted the presence of some structural breaks with respect to time and anomalous behaviour before the year 2000. For these reasons, we have decided to focus the analysis on data collected between 2000 and 2013, dropping data that refer to the 1992-1999 period. Consequently using selected databases, we specified multiple regression models setting the prevalence of undernourishment as response variable. Having explored the possibility of using all the selected variables as regressors, it was immediately clear that a significant contribution to the model was concentrated in only a few variables and in particular in: the GDP, the import, the import dependency ratio, the food production index and the crop production index. Then the estimated model assumed that the prevalence of undernourishment can be expressed as a linear function of the regressors with coefficients 𝛽𝑖, a constant term 𝛽0 and a casual error term 𝜖:
𝑃𝑟𝑒𝑣𝑢𝑛𝑑𝑒𝑟 = 𝛽0 + 𝛽1𝐺𝐷𝑃 + 𝛽2𝐼𝑚𝑝𝑜𝑟𝑡 + 𝛽3𝐼𝑚𝑝𝐷𝑒𝑝 + 𝛽4𝐹𝑜𝑜𝑑𝑃𝑟𝑜𝑑+ 𝛽5𝐶𝑟𝑜𝑝𝑃𝑟𝑜𝑑 + 𝜖
Looking at correlation matrices, strong relationships between the other variables and the ones listed above can also be observed. However, in many cases, introducing these variables as regressors in the regression models worsened the goodness-of-fit-measures of the estimated models. This is due to the correlation among regressors6. Given the parsimony principle and high goodness-of-fit-measures obtained, it was decided to use the simplest models to perform the requested forecasts. Moreover, it is worth noting that the automatic procedures of model selection implemented in standard software did not work properly in our case, yielding results that were unexpected and inconsistent with the hypothesis. As a result the three countries were modelled separately by adding and removing one variable at time and by looking at the adjusted R2 variations. Following this model selection strategy, it has been possible to obtain multiple regression models, with a very high explicative and predictive power, which are highly parsimonious 6 Note that we treat the correlation among regressors also for the remaining variables in the models. We constructed and estimated more complex models like path models or multiple regression models based on residuals (all these trials are available on request). However, we find that such models have goodness of fit measures similar, or in some cases even worse, to measures of simplest models. This means that the few selected regressors have a strong linear relationship with the response variable.
Department of Political Sciences - University of Naples Federico II and Action Contre la Faim
Food Security Impact of Ebola Virus Epidemic 11
and therefore founded on a small number of variables making them very useful in the interpretation of data. Using the selected models and the standard OLS methods (Ordinary Least Squares)
resulted in the estimates 𝛽�̂� for the coefficients 𝛽𝑖. In the last step (the forecasts), using the estimated models the three scenarios have been defined starting from the economic forecasts of the World Bank determining the hypothetic values that the regressors should take in each scenario. More precisely, on the base of the WB forecasts and FAO scenarios, it was hypothesized that there would be percentages of reduction in income, imports and food production. For each country, reduction percentages were derived for the best, worst and in the middle case scenario. Using those percentages, we reduced the income, the imports and the food production values observed in the last years. The newly reduced values were put in the estimated equation and the value for the prevalence of undernourishment was forecasted. Finally, as it is also done by FAO, the forecasted values were multiplied by the total population in order to obtain the number of people exposed to undernourishment.
Department of Political Sciences - University of Naples Federico II and Action Contre la Faim
Food Security Impact of Ebola Virus Epidemic 12
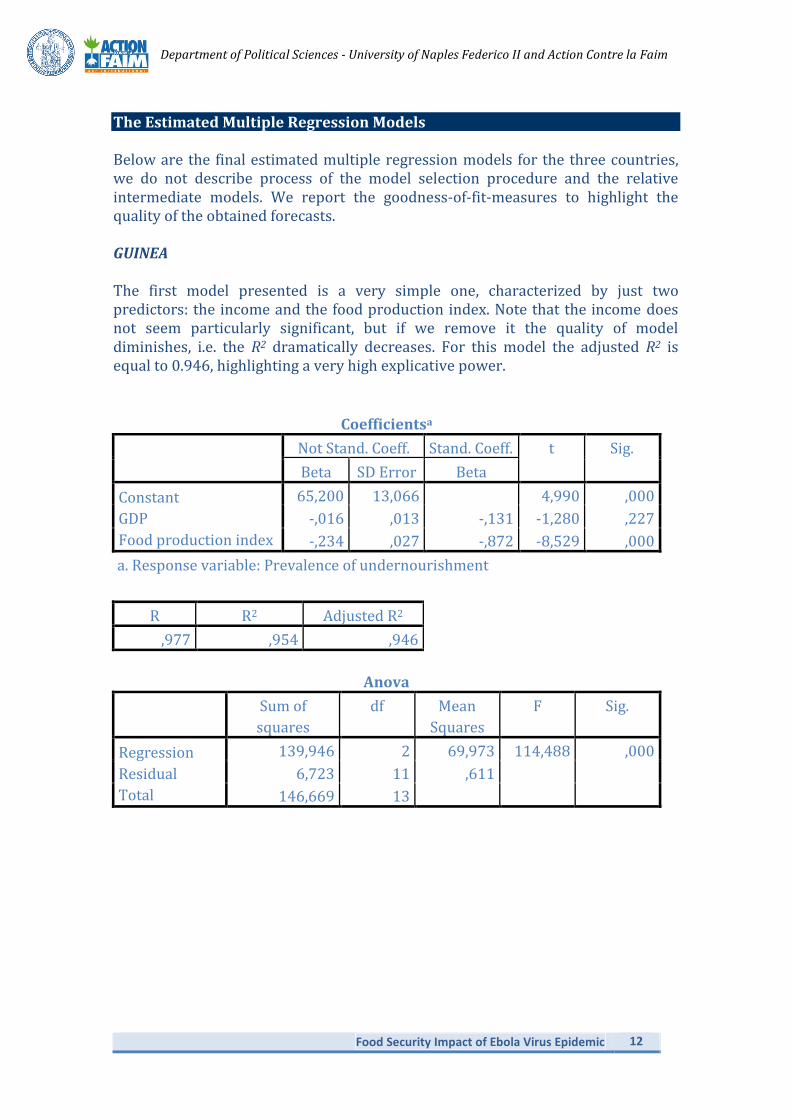
The Estimated Multiple Regression Models Below are the final estimated multiple regression models for the three countries, we do not describe process of the model selection procedure and the relative intermediate models. We report the goodness-of-fit-measures to highlight the quality of the obtained forecasts. GUINEA The first model presented is a very simple one, characterized by just two predictors: the income and the food production index. Note that the income does not seem particularly significant, but if we remove it the quality of model diminishes, i.e. the R2 dramatically decreases. For this model the adjusted R2 is equal to 0.946, highlighting a very high explicative power.
Coefficientsa
Not Stand. Coeff. Stand. Coeff. t Sig.
Beta SD Error Beta
Constant
GDP
Food production index
65,200 13,066 4,990 ,000
-,016 ,013 -,131 -1,280 ,227
-,234 ,027 -,872 -8,529 ,000
a. Response variable: Prevalence of undernourishment
R R2 Adjusted R2
,977 ,954 ,946
Anova
Sum of
squares
df Mean
Squares
F Sig.
Regression
Residual
Total
139,946 2 69,973 114,488 ,000
6,723 11 ,611
146,669 13
Department of Political Sciences - University of Naples Federico II and Action Contre la Faim
Food Security Impact of Ebola Virus Epidemic 13
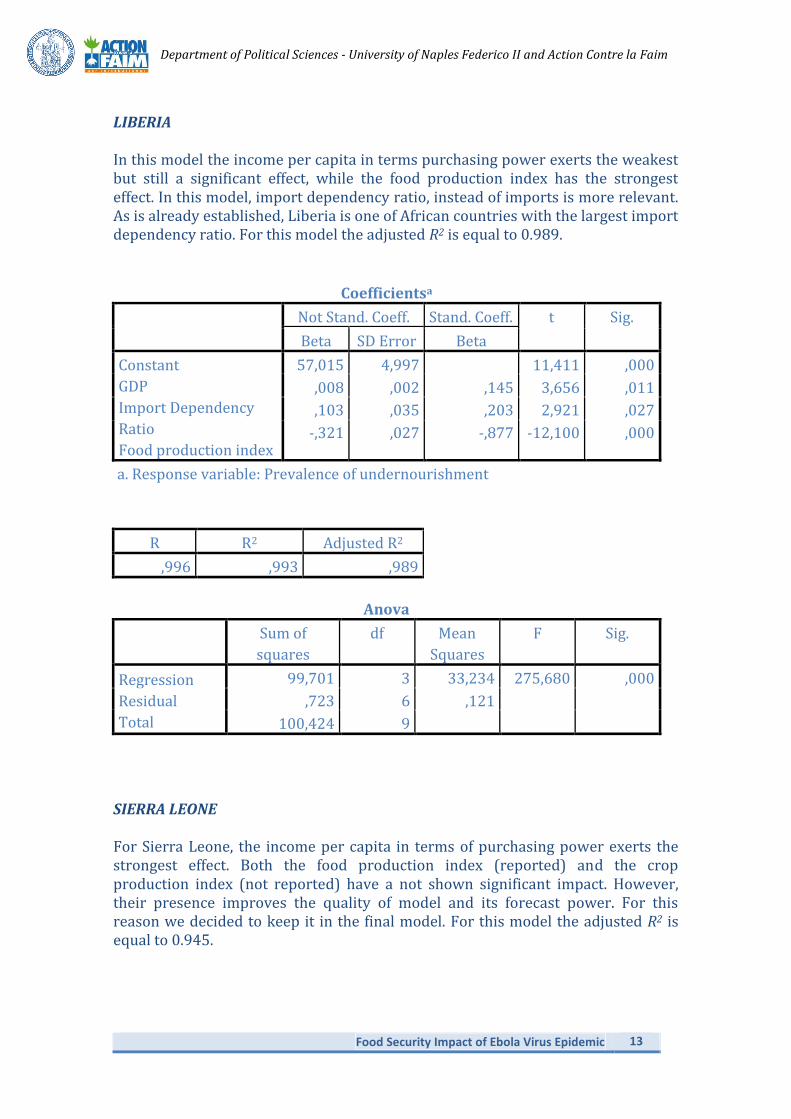
LIBERIA In this model the income per capita in terms purchasing power exerts the weakest but still a significant effect, while the food production index has the strongest effect. In this model, import dependency ratio, instead of imports is more relevant. As is already established, Liberia is one of African countries with the largest import dependency ratio. For this model the adjusted R2 is equal to 0.989.
Coefficientsa
Not Stand. Coeff. Stand. Coeff. t Sig.
Beta SD Error Beta
Constant
GDP
Import Dependency
Ratio
Food production index
57,015 4,997 11,411 ,000
,008 ,002 ,145 3,656 ,011
,103 ,035 ,203 2,921 ,027
-,321 ,027 -,877 -12,100 ,000
a. Response variable: Prevalence of undernourishment
R R2 Adjusted R2
,996 ,993 ,989
Anova
Sum of
squares
df Mean
Squares
F Sig.
Regression
Residual
Total
99,701 3 33,234 275,680 ,000
,723 6 ,121
100,424 9
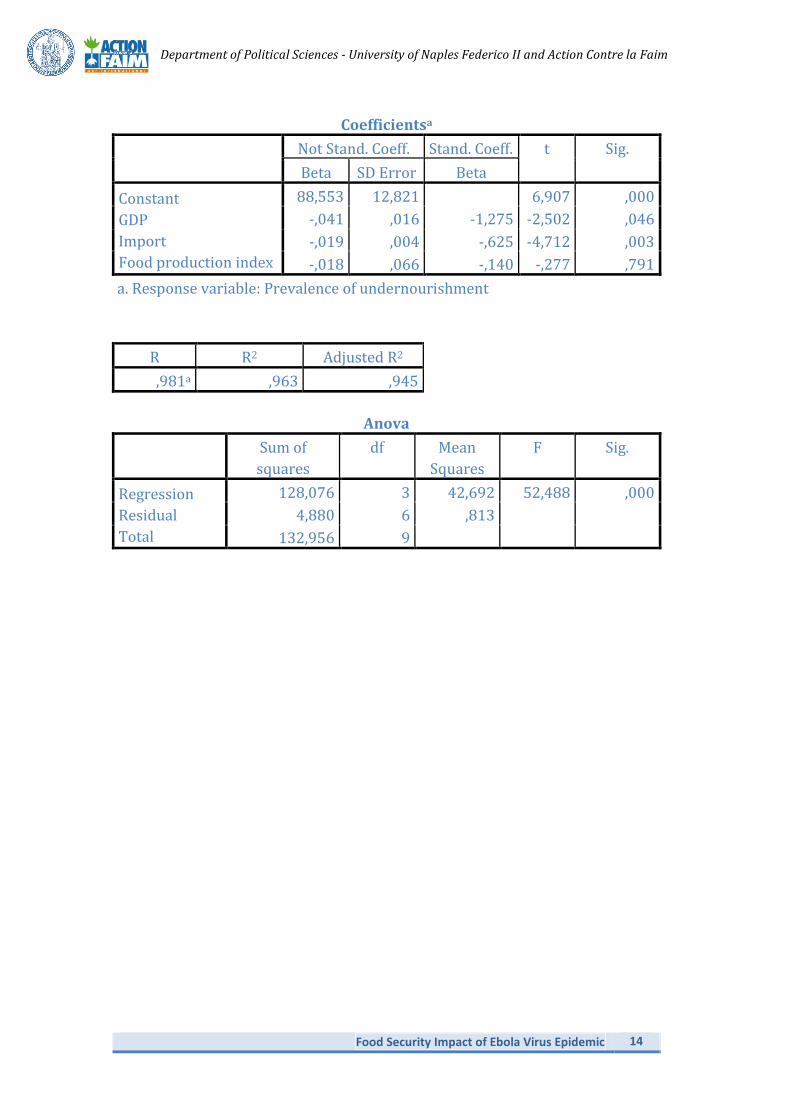
SIERRA LEONE For Sierra Leone, the income per capita in terms of purchasing power exerts the strongest effect. Both the food production index (reported) and the crop production index (not reported) have a not shown significant impact. However, their presence improves the quality of model and its forecast power. For this reason we decided to keep it in the final model. For this model the adjusted R2 is equal to 0.945.
Department of Political Sciences - University of Naples Federico II and Action Contre la Faim
Food Security Impact of Ebola Virus Epidemic 14
Coefficientsa
Not Stand. Coeff. Stand. Coeff. t Sig.
Beta SD Error Beta
Constant
GDP
Import
Food production index
88,553 12,821 6,907 ,000
-,041 ,016 -1,275 -2,502 ,046
-,019 ,004 -,625 -4,712 ,003
-,018 ,066 -,140 -,277 ,791
a. Response variable: Prevalence of undernourishment
R R2 Adjusted R2
,981a ,963 ,945
Anova
Sum of
squares
df Mean
Squares
F Sig.
Regression
Residual
Total
128,076 3 42,692 52,488 ,000
4,880 6 ,813
132,956 9
Department of Political Sciences - University of Naples Federico II and Action Contre la Faim
Food Security Impact of Ebola Virus Epidemic 15
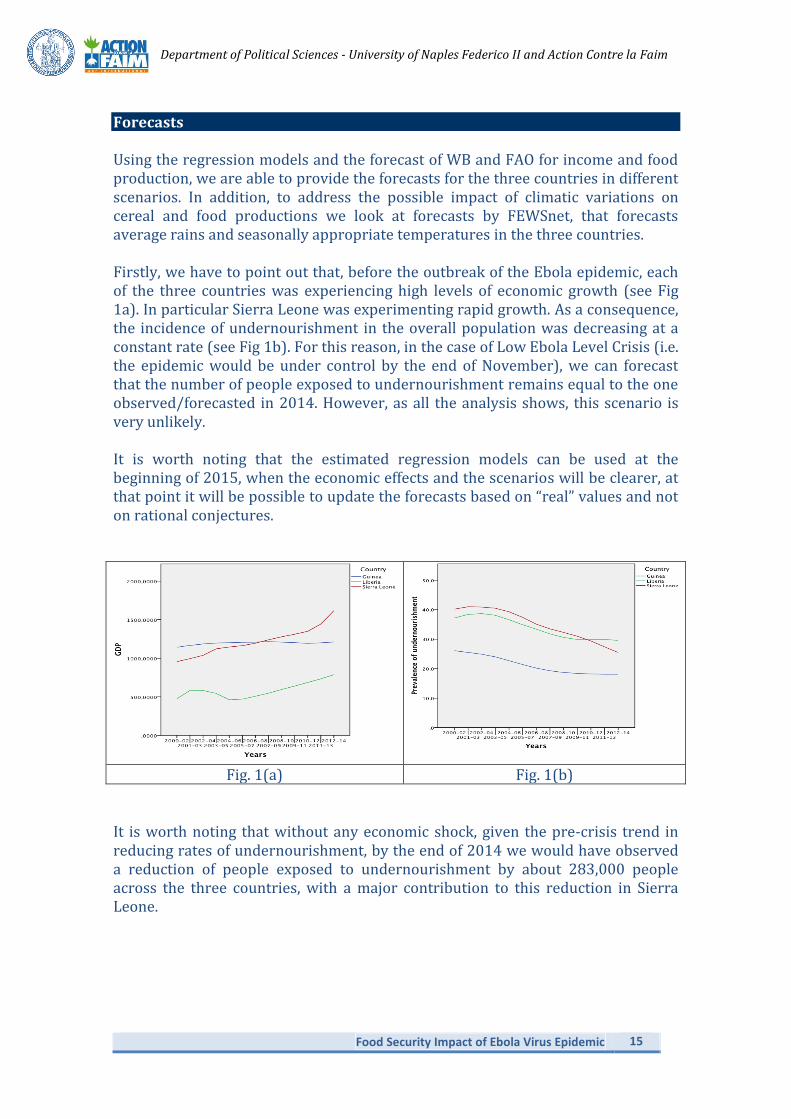
Forecasts Using the regression models and the forecast of WB and FAO for income and food production, we are able to provide the forecasts for the three countries in different scenarios. In addition, to address the possible impact of climatic variations on cereal and food productions we look at forecasts by FEWSnet, that forecasts average rains and seasonally appropriate temperatures in the three countries. Firstly, we have to point out that, before the outbreak of the Ebola epidemic, each of the three countries was experiencing high levels of economic growth (see Fig 1a). In particular Sierra Leone was experimenting rapid growth. As a consequence, the incidence of undernourishment in the overall population was decreasing at a constant rate (see Fig 1b). For this reason, in the case of Low Ebola Level Crisis (i.e. the epidemic would be under control by the end of November), we can forecast that the number of people exposed to undernourishment remains equal to the one observed/forecasted in 2014. However, as all the analysis shows, this scenario is very unlikely. It is worth noting that the estimated regression models can be used at the beginning of 2015, when the economic effects and the scenarios will be clearer, at that point it will be possible to update the forecasts based on “real” values and not on rational conjectures.
Fig. 1(a) Fig. 1(b) It is worth noting that without any economic shock, given the pre-crisis trend in reducing rates of undernourishment, by the end of 2014 we would have observed a reduction of people exposed to undernourishment by about 283,000 people across the three countries, with a major contribution to this reduction in Sierra Leone.
Department of Political Sciences - University of Naples Federico II and Action Contre la Faim
Food Security Impact of Ebola Virus Epidemic 16
GUINEA
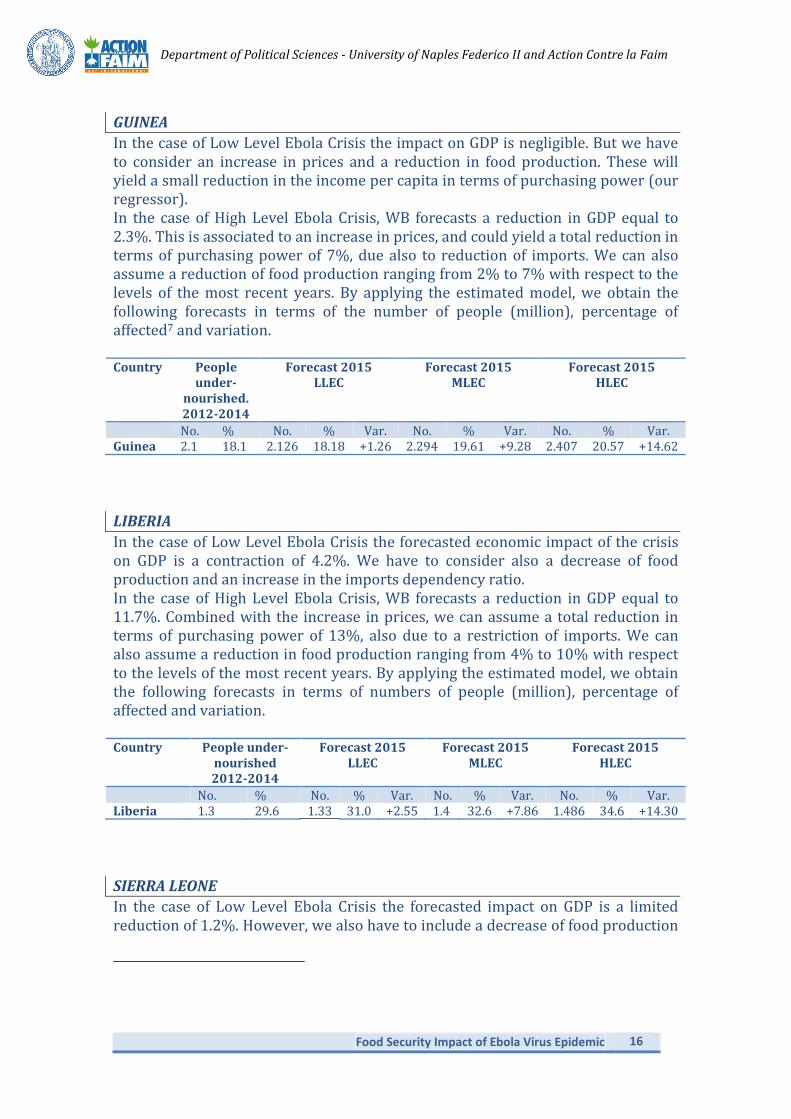
In the case of Low Level Ebola Crisis the impact on GDP is negligible. But we have to consider an increase in prices and a reduction in food production. These will yield a small reduction in the income per capita in terms of purchasing power (our regressor). In the case of High Level Ebola Crisis, WB forecasts a reduction in GDP equal to 2.3%. This is associated to an increase in prices, and could yield a total reduction in terms of purchasing power of 7%, due also to reduction of imports. We can also assume a reduction of food production ranging from 2% to 7% with respect to the levels of the most recent years. By applying the estimated model, we obtain the following forecasts in terms of the number of people (million), percentage of affected7 and variation. Country People
under-nourished. 2012-2014
Forecast 2015 LLEC
Forecast 2015 MLEC
Forecast 2015 HLEC
No. % No. % Var. No. % Var. No. % Var. Guinea 2.1 18.1 2.126 18.18 +1.26 2.294 19.61 +9.28 2.407 20.57 +14.62
LIBERIA
In the case of Low Level Ebola Crisis the forecasted economic impact of the crisis on GDP is a contraction of 4.2%. We have to consider also a decrease of food production and an increase in the imports dependency ratio. In the case of High Level Ebola Crisis, WB forecasts a reduction in GDP equal to 11.7%. Combined with the increase in prices, we can assume a total reduction in terms of purchasing power of 13%, also due to a restriction of imports. We can also assume a reduction in food production ranging from 4% to 10% with respect to the levels of the most recent years. By applying the estimated model, we obtain the following forecasts in terms of numbers of people (million), percentage of affected and variation. Country People under-
nourished 2012-2014
Forecast 2015 LLEC
Forecast 2015 MLEC
Forecast 2015 HLEC
No. % No. % Var. No. % Var. No. % Var. Liberia 1.3 29.6 1.33 31.0 +2.55 1.4 32.6 +7.86 1.486 34.6 +14.30
SIERRA LEONE
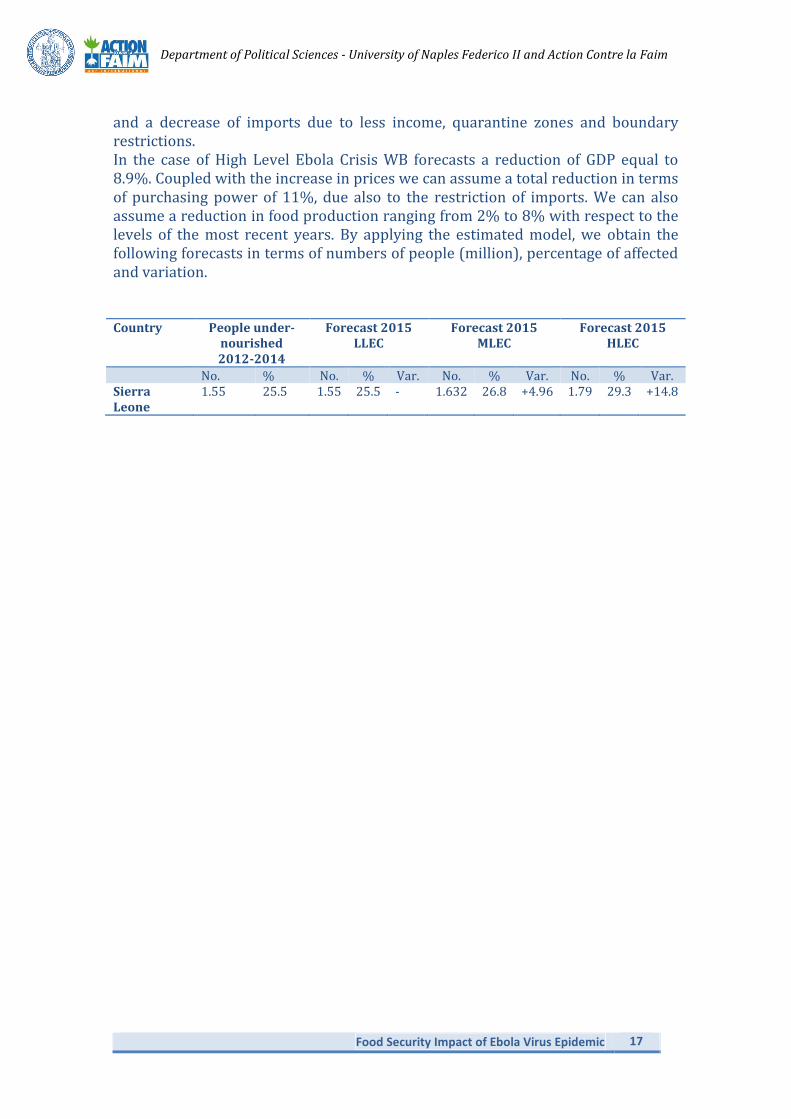
In the case of Low Level Ebola Crisis the forecasted impact on GDP is a limited reduction of 1.2%. However, we also have to include a decrease of food production
Department of Political Sciences - University of Naples Federico II and Action Contre la Faim
Food Security Impact of Ebola Virus Epidemic 17
and a decrease of imports due to less income, quarantine zones and boundary restrictions. In the case of High Level Ebola Crisis WB forecasts a reduction of GDP equal to 8.9%. Coupled with the increase in prices we can assume a total reduction in terms of purchasing power of 11%, due also to the restriction of imports. We can also assume a reduction in food production ranging from 2% to 8% with respect to the levels of the most recent years. By applying the estimated model, we obtain the following forecasts in terms of numbers of people (million), percentage of affected and variation. Country People under-
nourished 2012-2014
Forecast 2015 LLEC
Forecast 2015 MLEC
Forecast 2015 HLEC
No. % No. % Var. No. % Var. No. % Var. Sierra Leone
1.55 25.5 1.55 25.5 - 1.632 26.8 +4.96 1.79 29.3 +14.8