university of south florida national center for transit research · 2005-09-06 · university of...
TRANSCRIPT

UNIVERSITY OF SOUTH FLORIDA National Center for Transit Research
Case Studies in Environmental Justice and Public Transit Title VI Reporting
Final Report TCRP J-06, Task 47
FDOT BD 549-10

Technical Report Documentation Page 1. Report No.
2. Government Accession No.
3. Recipient's Catalog No.
5. Report Date August 2005
4. Title and Subtitle Case Studies in Environmental Justice and Public Transit Title VI Reporting
6. Performing Organization Code
7. Author(s) Beverly G. Ward, Ph.D.
8. Performing Organization Report No. 10. Work Unit No. (TRAIS)
9. Performing Organization Name and Address National Center for Transit Research University of South Florida 4202 East Fowler Ave., CUT 100 Tampa, FL 33620-5375
11. Contract or Grant No. BD 549-10
13. Type of Report and Period Covered Final Report
12. Sponsoring Agency Name and Address Florida Department of Transportation 605 Suwannee Street, MS 30 Tallahassee, FL 32399
14. Sponsoring Agency Code
15. Supplementary Notes Partially funded by the Transit Cooperative Research Program (TCRP), Project Number TCRP J-06, Task 47, Transportation Research Board
16. Abstract
The topic of environmental justice was identified as one of 11 prio rity areas for research by the Research and Technology Committee of the American Public Transportation Association (APTA). The objectives of the study were to identify state and national examples of environmental justice solutions and Title VI reporting and implementation that demonstrate commitment to equitable distribution of public transportation resources. Five case studies are provided. One focuses on a racial group, American Indian and Alaska Native, the other four on environmental justice issues related to different geographic areas in the U.S. Our findings suggest that ethnic and racial minorities and persons living in low-income households tend to be concentrated in central cities, away from jobs, and sometimes goods and services. Recommendations are provided based on the guidelines provided in the FTA Circular 4702.1, Title VI Program Guidelines for Urban Mass Transportation Administration Recipients. Public transportation agencies are encouraged to use these guidelines and subsequent reports as planning tools to identify potential impacts of proposed actions to low-income and minority communities. It is anticipated that a better understanding of impacts and the participation of minority and low-income communities in identifying impacts and solutions will lead to better service planning and delivery.
17. Key Word Environmental justice, nondiscrimination, Title VI of the Civil Rights Act of 1964, public participation, transportation investments, land use, social equity
18. Distribution Statement No restrictions.
19. Security Classif. (of this report) Unclassified.
20. Security Classif. (of this page) Unclassified.
21. No. of Pages 78
22. Price
Form DOT F 1700.7 (8-72) Reproduction of completed page authorized

U N I V E R S I T Y O F S O U T H F L O R I D A N A T I O N A L C E N T E R F O R T R A N S I T R E S E A R C H
Case Studies in Environmental Justice and Public Transit Title VI Reporting:
Final Report
September 2005

ii
Disclaimer
The opinions, findings, and conclusions expressed in this publication are those of the authors and not necessarily those of the State of Florida Department of Transportation.

iii
Executive Summary
In 1994, President Clinton signed an Executive Order that directed all federal agencies to examine and to avoid disproportionately high and adverse impacts on minority and low-income populations. The policy has prompted, in the past decade, renewed interest in Title VI of the Civil Rights Act of 1964, which prohibits discrimination in any federal program or federally-funded program, and applies to any agency that is the recipient of federal funds, including state and local agencies. The topic of environmental justice was identified as one of 11 priority areas for research by the Research and Technology Committee of the American Public Transportation Association (APTA). The Committee developed a recommendation to pursue funding through the Transit Cooperative Research Program (TCRP) and the National Center for Transit Research at the Center for Urban Transportation Research (CUTR).
The objectives of the study were to identify state and national examples of environmental justice solutions and Title VI reporting and implementation that demonstrate commitment to equitable distribution of public transportation resources.
Five case studies are provided. One focuses on a racial group, American Indian and Alaska Native, the other four on environmental justice issues related to different geographic areas in the U.S. Our findings suggest that ethnic and racial minorities and persons living in low-income households tend to be concentrated in central cities, away from jobs, and sometimes goods and services. Often, public transportation may be the only reliable source of transportation. In some areas, however, and for some households, the transit trip may be prohibitive—trip length, travel time, or no access at the end of the transit trip. Many of the issues raised, such as lack of regional transportation coordination, state funding for public transportation, and residential segregation are beyond the purview of transit agencies. Recommendations are provided, however, on areas that agencies can improve. These are based on the guidelines provided in the Federal Transit Administration (FTA) Circular 4702.1, Title VI Program Guidelines for Urban Mass Transportation Administration Recipients. Public transportation agencies are encouraged to use these guidelines and subsequent reports as planning tools to identify potential impacts of proposed actions to low-income and minority communities.
It is anticipated that a better understanding of impacts and the participation of minority and low-income communities in identifying impacts and solutions will lead to better service planning and delivery. These efforts also will help to ensure equitable distribution of public transportation resources. Public transportation providers and users will benefit from better planned services.

ii
Contents Introduction ……………………………………………………………………………………………………………1 Literature Review ...………………………………………………………………………………………………. 2 Legal Basis……………………………………………………………………………………………………………. 5 Environmental Justice and Title VI Issues in the Transit Industry……………………….......... 5
Case Study Methodology ……………………………………………………………………………………... 13 Case Studies……………………………………………………………………………………………………….. 15 American Indians and Alaska Natives……………………………………………………………………. 16
Atlanta, Georgia ………………………………………………………………………………………………….. 26
The Atlanta Study Area ………………………………………………………………………………………… 27
Chicago, Illinois.……………………………………………………………………………………………………34
Denver, Colorado……………………………………………………………………………………………………43
Miami-Dade, Florida……………………………………………………………………………………………….49
Suggested Guidance………………………………………………………………………………………………55 A Brief Environmental Justice Primer for Transit Agencies………………………………………..56
Summary………………………………………………………………………………………………………………59 Endnotes………………………………………………………………………………………………………………60 References…………………………………………………………………………………………………………...61
Historical Perspective ........................................................................................................... 6More Recent Environmental Justice and Title VI Issues..................................................... 8
American Indian and Alaska Native Areas and Demographic Profile................................ 17General Issues of Mobility and Access............................................................................... 21Transportation on Tribal Lands ........................................................................................... 22Examples, Lessons Learned, and Solutions ....................................................................... 23
Transit Development in Brief............................................................................................... 26
Residential Segregation and Public Transportation .......................................................... 29
The Greater Chicago Study Area......................................................................................... 35The Robert Taylor Homes, HOPE VI, PRWORA, Public Transportation and Title VI ......... 37
The RTD Study Area............................................................................................................. 43
Public Transportation in South Florida and a Description of the Study Area ................... 49Environmental Justice and Title VI Issues and Public Transportation in South Florida .. 52
Analyzing Service Standards and Policies.......................................................................... 57Assessments ........................................................................................................................ 58Other Environmental Justice or Title VI Considerations ................................................... 58

iii
Figures
Figure 1. American Indian and Alaska Native Population Distribution ............................. 19 Figure 2. Federal and Hawaiian (State) Boundaries........................................................... 20 Figure 3. Total Ethnic and Racial Minority Distribution of the Atlanta Study Area .......... 29 Figure 4. Total Ethnic and Racial Minority Distribution of the Chicago Study Area......... 40 Figure 5. Total Ethnic and Racial Minority Distribution of the Denver Study Area........... 45 Figure 6. Total Ethnic and Racial Minority Distribution of the Miami Study Area ............ 51

iv
Tables
Table 1. American Indian and Alaska Native Population/Racial Distribution Chart ......... 17 Table 2. Urban and Rural Residence of American Indians and Alaska Natives................ 21 Table 3. Selected Characteristics of the Atlanta Study Area Population ......................... 28 Table 4. Selected Socioeconomic Characteristics of the Atlanta Study Area ................. 31 Table 5. Selected Characteristics of the Chicago Study Area .......................................... 36 Table 6. Selected Socioeconomic Characteristics of Taylor Site Census Tracts ............ 38 Table 7. Selected Characteristics of the Denver Study Area ............................................ 44 Table 8. Selected Socioeconomic Characteristics of the Denver Study Area.................. 46 Table 9. Selected Characteristics of the Miami Study Area.............................................. 50 Table 10. Selected Socioeconomic Characteristics of the Miami-Dade Study Area ........ 52

C A S E S T U D I E S I N E N V I R O N M E N T A L J U S T I C E A N D P U B L I C T R A N S I T T I T L E V I R E P O R T I N G
1
Introduction
his study is the product of a jointly-funded project of the Transit Cooperative Research Program (TCRP) through the Transportation Research Board and the National Center for Transit Research (NCTR) at the Center for Urban Transportation Research (CUTR), University of South Florida. The objectives
of the study include identifying state and national examples of environmental justice solutions and Title VI of the Civil Rights Act of 1964 reporting and implementation that demonstrate commitment to equitable distribution of public transportation resources.
The topic of environmental justice was identified as one of 11 priority areas for research by the Research and Technology Committee of the American Public Transportation Association (APTA). At a meeting held at the Beckman Center at the University of California, Irvine, in 2003, the Committee began exploring ways of collecting and disseminating information on environmental justice and transit, particularly case examples of environmental justice concerns and problem-solving. (Case study is the research approach recommended by the International Association for Impact Assessment.) The Committee developed a recommendation to pursue funding through TCRP and NCTR.
In an earlier study funded by NCTR, the use of Title VI reporting was identified as a tool for assessing the impacts of transportation decisions, particularly as related to environmental justice. Title VI Reports provide baseline information on the community where an action may take place. This project identifies Florida and national examples of actions taken by transit agencies to respond to environmental justice and Title VI concerns. These case studies provide examples of practices and documents the techniques used to achieve community buy-in and support. The overall objective of this research is to provide examples of how the information available in Title VI Reports and other efforts may be used to aid in addressing environmental justice concerns, ensuring the equitable distribution of public transportation resources.
T

C A S E S T U D I E S I N E N V I R O N M E N T A L J U S T I C E A N D P U B L I C T R A N S I T T I T L E V I R E P O R T I N G
2
Literature Review
n 11 February 1994, then-President Clinton issued Executive Order (EO) 12898, Federal Actions to Address Environmental Justice in Minority Populations and Low-Income Populations. The Executive Order directed federal agencies to develop strategies to address disproportionately high and
adverse environmental effects resulting from agency actions. The Order reinforced existing environmental and civil rights legislation and, by including low-income populations [including subgroups, e.g., the elderly, children, etc.], extended their purview to another subgroup of the population. The Environmental Protection Agency’s (EPA) of Environmental Justice offers the following definition of “environmental justice”:
The fair treatment and meaningful involvement of all people regardless of race, color, national origin, or income with respect to the development, implementation, and enforcement of environmental laws, regulations, and policies. Fair treatment means that no group of people, including racial, ethnic, or socioeconomic group should bear a disproportionate share of the negative environmental consequences resulting from industrial, municipal, and commercial operations or the execution of federal, state, local, and tribal programs and policies (EPA Office of Enforcement and Compliance Assurance 2000).
EO 12898 builds on the Title VI, the National Environmental Policy Act (NEPA) of 1969, the Clean Air Act (CAA) as amended, and the Transportation Equity Act for the 21st Century (TEA-21). The United States Department of Transportation (USDOT) set an early goal to become a model agency for protecting and enhancing the environment and quality of life of its inhabitants. USDOT issued a departmental order on environmental justice in 1997. The Federal Highway Administration (FHWA) issued a related administrative order in 1998. While the Federal Transit Administration (FTA) did not issue an administrative order, FTA and FHWA developed in 2000 the USDOT Environmental Justice Internet website.
Beyond environmental justice, all the human and other environment assessment issues are based on legislation and regulations that direct evaluation in the transportation planning, project development process, and service delivery. These directives relate to economic, social, and environmental effects. The topics fall into several areas, including:
Aesthetics Community cohesion Displacement
O

C A S E S T U D I E S I N E N V I R O N M E N T A L J U S T I C E A N D P U B L I C T R A N S I T T I T L E V I R E P O R T I N G
3
Economic conditions Land use Mobility and access Parklands Physical aspects Provision of public services Safety Social and psychological aspects Visual environment.
Much of the early activity of the environmental justice movement focused on natural resource management and preservation, air and water pollution, and solid waste disposal (United Church of Christ Commission for Racial Justice 1987; Bullard 1990; Fisher 1994; Heiman 1996; Switzer 2004). Environmental justice concerns have grown over time as it appears that ethnic or racial minority and low-income population groups may experience differences in disease and death rates. The data explaining the environmental contributions to these differences, however, are limited. Information normally is not collected on environmental health effects by race and income. Nor is information collected on health risks posed by multiple industrial or transportation facilities. For diseases known to have environmental causes, data are not typically disaggregated by race and socioeconomic group. The literature suggests that racial minority and low-income populations experience higher rates.
This exposure does not always lead to serious health problems, but is cause for health concerns. Finally, consideration of these issues relates to the distribution of and access to resources—power differentials. Manheim states:
An essential characteristic of transportation is the differential incidence of its impacts. Some groups will gain from any transportation change; others may lose. Therefore, transportation choices are essentially sociopolitical choices: the interests of different groups must be balanced (1979:19).
As the movement developed, environmental concerns were expanded and also merged with the civil rights movement to include not just the products, such as waste disposal sites, but also the process of decisionmaking. Other products, and the decisionmaking processes of these products, also were including in the list of concerns. Grassroot organizations and affected communities added the transportation industry to the list of perpetrators. The sociopolitical choices of past transportation actions, particularly as related to the interstate highway system, have disproportionately affected low-income or minority ethnic communities. As early as 1970, Helen Leavitt documented the disruption of black communities by superhighway plans (1970). In Divided Highways,

C A S E S T U D I E S I N E N V I R O N M E N T A L J U S T I C E A N D P U B L I C T R A N S I T T I T L E V I R E P O R T I N G
4
Lewis also documents several African American communities displaced by the interstates (1997:186-89, 197, 199).
More recently, grassroots organizations have challenged transportation investments in roads versus pedestrian and bicycle facilities as African Americans, other people of color, and persons with low household incomes walk, bicycle, and use transit more than the general population, but are more likely to be victims of automobile-pedestrian or automobile-bicycle crashes than average (Corless and Arteaga 2000:8). Minorities and low-income groups also have challenged expenditures for “light” rail versus rubber tire transit in Atlanta and Los Angeles (Bullard, Johnson, and Torres 2000:4; Garcia 2000:10). As one of the leading researchers on transportation and environmental justice states, “Transportation is not just law. It is politics and community. It is morality” (Oedel 2000:10).
The environmental justice movement is not a monolith. The movement has to be understood within the context of environmental racism, environmental or social equity, and social and economic justice. Fisher writes:
Environmental racism occurs when people of color disproportionately bear the burdens and risks of environmental protection policies while the associated benefits are dispersed throughout society…The reality, however, is that people of color overwhelmingly are disproportionately denied this right and continue to live and work in polluted environments (1994).
Environmental racism is addressed in the EO 12898 by promulgation of strategies to address disproportionately high and adverse impacts to minority communities. Other legislation and policies, e.g., the Civil Rights Act of 1964, also prohibit environmental racism.
Environmental or social equity issues include balancing the rights and responsibilities of transfer payments, such as welfare; fair or livable wages; and ensuring that the benefits of policies are distributed in a fair manner (Gilbert 1995:154-155). While EO 12898 focuses on strategies to avoid disproportionately high and adverse impacts, other federal legislation and policies address social equity by prohibiting discrimination. Social equity issues may be raised by any community; however, there is concern that low income and minority communities may benefit less from public policies due to lack of access or political power.
If viewed along a continuum, social justice may be thought of as the moral extreme, which encompasses all of the issues raised above and all aspects of society. This includes:
Efficiency, where there are no preferences or less desirable goods, services, etc.;

C A S E S T U D I E S I N E N V I R O N M E N T A L J U S T I C E A N D P U B L I C T R A N S I T T I T L E V I R E P O R T I N G
5
Equity, where every situation, good, or service is as desirable as another; and Equality, where maybe not possible, but “…all members have the same
situation” (Kolm 1997:69-74). The EO 12898 alludes to a number of legislative, regulatory, and public policy guidelines. These have been developed in response to concerns raised by the civil rights movement and the environmental justice movement. The intersection of the two movements have raised concerns regarding transportation investments, access to the transportation decisionmaking process, distribution of transportation benefits, and the avoidance of disproportionately high and adverse impacts.
Legal Basis The more recent emphasis on environmental justice easily is traced to EO 12898. The legal protections, however, predate the Civil Rights Act of 1964 and the National Environmental Policy Act of 1969. Related legislation and regulations include:
The Americans with Disabilities Act (ADA)of 1990 (P. L. 101-336); EO 13166 Improving Access to Services for Persons with Limited English
Proficiency, 2000; EO 13330 Human Service Transportation Coordination, 2004; FTA Circular 4702.1, Title VI Program Guidelines for Federal Transit
Administration Recipients, 26 May 1988; Intermodal Surface Transportation Efficiency Act (ISTEA), 1991; Transportation Efficiency Act for the 21st Century (TEA-21) Public Law 105-
108, 1998; U.S. Code of Federal Regulations, Title 42 – The Public Health and Welfare:
Chapter 61. Uniform Relocation Assistance and Real Property Acquisition Policies for Federal and Federally Assisted Programs;
U.S. Constitution, Article XIV. Equal Protection and Due Process. States also have adopted legislation and issued guidance and policies to implement the federal legislation cited above. State legislation may be more detailed than federal policies, specifying how policies are implemented on the local level. Also, State statutes may be more stringent than federal authority.
Environmental Justice and Title VI Issues in the Transit Industry Although the literature review focused on current environmental justice issues, to understand these issues they must be placed in historical framework. For various

C A S E S T U D I E S I N E N V I R O N M E N T A L J U S T I C E A N D P U B L I C T R A N S I T T I T L E V I R E P O R T I N G
6
subgroups of the population, the issues arise from past experiences. These experiences may be the result of direct impacts of past decisions, such as:
Discrimination in public transportation accommodations.; Indirect or secondary impacts, such as mentioned by Davis et al.: “One of the
negative impacts of interstate highway building was to reduce the market for transit” (1998:11).
Or, they may be the result of cumulative impacts, for example, public housing relocations that provide less access to public transportation (Ward 2002).
Placing these experiences within a historical framework provides additional insights into the complexity of the issues.
Historical Perspective
Public transportation historically has had a special role in the African-American community. First, it has been the locus of dissent to racial discrimination, particularly in the modern civil rights movement. While the 1955-56 Montgomery bus boycott has been cited as one of the focusing events of the modern movement, other and earlier boycotts of mass transit also were contributors. These included:
1941 New York City bus companies agreed to hire African-American drivers and mechanics, ending four-week boycott.
1953 Baton Rouge (LA) bus boycott.
1956 Tallahassee bus boycott began. Later that year, Federal Judge Dozier Devane granted injunction restraining city officials from interfering with integration of buses, saying “every segregation act of every state or city is as dead as a doornail.”
1962 Macon (GA) Bus boycott (Bennett 1993: 451-520; Ward 2000:161-68).
There also has been contention over the provision of public transportation services. The National Advisory Commission on Civil Disorders (The Kerner Commission), in 1968, noted, “Most new employment opportunities do not occur in central cities, near all-Negro neighborhoods. They are being created in suburbs and outlying areas–and this trend is likely to continue indefinitely” (1968:392). The Commission went on to recommend expansion of aid to local public transportation service providers and subsidization of routes serving the inner cities in an effort to allay the “civil disorders” of the 1960s (1968:418).

C A S E S T U D I E S I N E N V I R O N M E N T A L J U S T I C E A N D P U B L I C T R A N S I T T I T L E V I R E P O R T I N G
7
The First National People of Color Environmental Leadership Summit was held in 1991 and was said to “… [advance] environmental justice beyond its anti-toxics focus to embrace global issues [including] transportation” (1991:9-10). Delegates adopted the Principles of Environmental Justice, which was to serve a guide to community organizers (1991).
Transit also has served as an important “dual role” in the African-American community, that of a favorable employer and provider of essential service. Philip W. Jeffress stated in The Negro in the Urban Transit Industry:
A number of factors make the urban mass transportation industry significant. . . It is, first of all, important because of its role as a primary source of employment in many cities throughout the country . . . In addition, the service of local and interurban transportation involves the broader problem of getting people to and from their jobs no matter what industry provides the employment….Because of segregation in the housing market and the suburbanization of many industrial plants, transportation is vital if Negroes are to compete for jobs (1970:2-4).
Since 1970, transit has continued to be a favorable employer for women, African Americans and other ethnic minorities. In a study conducted by Hill and Ward, the findings suggested that both the number and proportion of women and ethnic minorities grew in the interceding decades (Hill and Ward 1996; Ward and Hill 1996).
These and other factors are interconnected and are reproduced in the broader context of U.S. society in what Brodkin calls “’metaorganization,’ or organization of organizations, to refer to the ways that all these race, gender, and class dimensions of social organization form a mutually constituting system”…(1998:53). These social differences create a level of demand for public transit. These social differences, also however, often exclude users from the public transit decisionmaking process. That is, despite the gains of ethnic minorities and women in the industry, representatives of these groups, the core customer base, may not have access to public transportation policy, funding, and services decisionmaking (Bullard 1997; Ward 2000). This may be the central site of environmental justice conflict. In many areas, transit users do not have the resources, primarily political power, to lobby for more equitable public transportation policies and to compete for more funding. There also is little access to service delivery decisions. This is not unique to public transportation. The same social differences give rise to conflict in other arenas. Users’ reliance, particularly low-income and minority users, on public transit to access basic goods and services, however, makes the industry vital. But, as part of U.S. society, public transportation policy, funding, and service delivery also are subject to its vagaries of politics and economics. Bullard writes, “Transportation decisionmaking–whether at the federal , region, state or local level–

C A S E S T U D I E S I N E N V I R O N M E N T A L J U S T I C E A N D P U B L I C T R A N S I T T I T L E V I R E P O R T I N G
8
often mirrors the power arrangements of the dominant society and its institutions” (1997:173).
More Recent Environmental Justice and Title VI Issues
One of the focusing events of environmental justice in transportation was the November 1994 Transportation: Environmental Justice and Social Equity Conference held in Chicago. The conference was sponsored by the Federal Transit Administration (FTA) and the Surface Transportation Policy Project (STPP).
The intent [of the conference] was to begin a strategy for relieving some of the pain caused by past decisions and also to recreate the planning and decisionmaking process so that future investments are beneficial for all communities, including low-income communities, communities of color, and tribal communities (Surface Transportation Policy Project and Center for Neighborhood Technology 1994).
The conference was framed around five topics, which were supported by background papers. The topics were:
Justice in decisionmaking ; The siting of transportation facilities; Transportation and the provision of government services; Equity in transportation investments; and Transportation, land-use, economic development, the environment, and social
equity. These five topics encapsulate the many facets of civil rights and environmental justice transportation issues. A discussion of each as summarized in the background papers and other references follows. In consideration of the topics, it may be useful to relate the topics to resulting transportation plans, programs, and services. That is, the complexity of the issues may be better appreciated if consideration is given to their interconnectedness. For example, access to decisionmaking should be taken into consideration in the siting of transportation facilities, transportation investments, and the provision of government services. Likewise, social equity as related to the quality of life should be considered in land use, economic development, and the provision of transportation and other government services, and so forth.
Justice in Decisionmaking
Mizuno (1994) cites ISTEA as the basis for change in the transportation planning process by expanding the role of the public. This included the development of public involvement plans and programs by metropolitan planning organizations (MPOs), which would provide the public greater participation in the long range transportation

C A S E S T U D I E S I N E N V I R O N M E N T A L J U S T I C E A N D P U B L I C T R A N S I T T I T L E V I R E P O R T I N G
9
planning process and transportation improvement programs. The importance this change, according to Mizuno, is “…the opportunity for greater public involvement, particularly by those people of color, poor or disadvantaged offers hope that past patterns of unfavorable or unjust transportation systems will cease” (1994).
The authors of Just Transportation: Dismantling Race and Class Barriers to Mobility (1997) also note disparities in the decisionmaking process and question its fairness. Their case studies’ range includes the Metropolitan Atlanta Rapid Transit Authority (MARTA), the Washington (DC) Metropolitan Area Transit Authority (Metro or WMATA), the Chicago Transit Authority (CTA), and others.
One area of concern is language barriers. This includes many persons in minorities and low-income communities. Approximately 28 percent of Latinos and 22 percent of Asian Americans do not speak English “well or at all” (Census 2000). Language barriers also may exist due to the education level of the population. These barriers may limit the ability to get information, understand signs, use public transportation services, understand laws, regulations, plans and processes, and get employment (Sanchez 2003:30-31).
In Community Impact Assessment: A Quick Reference for Transportation public involvement is said to result in “better assessments and project decisions” and “enhance the credibility of the assessment process and its outcomes” (1996). Sanchez et al. also suggest that greater public involvement in the decisionmaking process may contribute to better assessments of the economic, environmental, and social impacts of transportation actions (2003:37-38).
The concern for access to the decisionmaking process had been recognized on an international level. In 1992, 178 countries, including the U.S., adopted Agenda 21, which included the Rio Declaration on Environment and Development. Principle 10 of the Declaration states:
Environmental issues are best handled with the participation of all concerned citizens, at the relevant level. At the national level, each individual shall have appropriate access to information concerning the environment that is held by public authorities, including information on hazardous materials and activities in their communities, and the opportunity to participate in decisionmaking processes. States shall facilitate and encourage public awareness and participation by making information widely available. Effective access to judicial and administrative proceedings, including redress and remedy, shall be provided.
The international effort to provide access to information to the public has been assessed by The Access Initiative, which was formed by the World Resources Institute (WRI). In

C A S E S T U D I E S I N E N V I R O N M E N T A L J U S T I C E A N D P U B L I C T R A N S I T T I T L E V I R E P O R T I N G
10
2002, WRI issued a report of the assessment findings from nine countries, including the U.S. The report, Closing the Gap: Information, Participation, and Justice in Decision-making for the Environment, highlights how the nine countries have integrated and implemented Principle 10 and makes recommendations on improvements. Another outcome of the assessment was a “how-to” guide for civic groups, Assessing Access to Information, Participation, and Justice for the Environment: A Guide.
The Siting of Transportation Facilities
Almanza and Alvarez, in their background paper, discuss the siting of freeways and fixed route systems and the facilities that support these systems. Problems include not only access to the decisionmaking process regarding the sites, but also “…trends in local land use and facility siting” (1994). Contributors include zoning policies, tax abatement zones, and enterprise zones. The authors suggest that these policies encourage the siting of facilities in low-income communities or communities of color which may be zoned industrial versus more pristine areas, suburban communities, or recreational areas. The authors also note that the decisions may be made with little regard to the cumulative impact of these sitings. Almanza and Alvarez provide an example on engaging communities in siting decisionmaking in Just Transportation (1997).
The grassroots organization West Harlem Environmental Action, Inc., (WE ACT) has sought to mitigate the concentration of bus depots (seven of the New York City’s eight) in the neighborhood. The neighbor also is bounded on three sides by freeways (Bullard 1997; Stolz 2003; Sanchez et al. 2003).
The issue of traffic safety also is of concern in the siting of transportation facilities (Almanza and Alvarez 1997:112). Sanchez et al. devote a comprehensive section on personal safety in Moving to Equity. Many persons with low incomes, including minorities, bicycle and walk more than the general public. Lack of infrastructure to support these modes is cited as a contributing factor in their overrepresentation in pedestrian and bicycle casualties. Lack of infrastructure also may be a factor in issues of personal security.
In addition to traffic safety, the location of transportation facilities may have other adverse health outcomes due to air and water pollution. Emissions from vehicle fuel contain carcinogens. Underground storage tanks, run-off from washing, and stormwater run-off from nonpermeable surfaces may contaminate water supplies.
Transportation and the Provision of Government Services
Grimshaw focused on the location of other public facilities and the ability of persons who rely on public transportation to access these facilities:

C A S E S T U D I E S I N E N V I R O N M E N T A L J U S T I C E A N D P U B L I C T R A N S I T T I T L E V I R E P O R T I N G
11
Those officials responsible for choosing the location of facilities typically use conventional marketplace criteria in making their decisions. Like their private market counterparts, they focus on the lowest immediate costs associated with sites for federal, state, county and municipal public service offices - the price of land, construction costs and build-out expense. Assessment of such costs is the criterion applied to decisions about a wide range of public facilities…The rationale is that the government must “get a good deal” for tax-payers. One key factor in the long-term success of a facility is often overlooked, however: is there a transportation system that can provide people efficient, affordable access to it (1994)?
Grimshaw also noted that the crux of the problem is that transportation planning focuses on mobility rather than location or access. Again, lack of access to the decisionmaking process is cited as a contributing factor, “…so public transportation access to public facilities is not a planning priority.” She added that location decisions may support community and economic development and community employment.
While Grimshaw said that low-income communities and communities of color should be involved in the decisionmaking processes of the provision of all government services, transportation’s role in providing access is outlined in ISTEA. “The ability to get needed services in a cost-effective and timely manner is certainly a quality of life issue.…”
Public participation in the decisionmaking process extends beyond the NEPA process as noted by Grimshaw and Mizuno (1994). It specifically is cited as a requirement in FTA Circurlar 4207.1.
Equity in Transportation Investments
In their discussion of transportation investments, Dittmar and Chen contrast roadway expenditures versus mass transportation investments (1994). The authors state that urban low-income communities and rural communities receive a smaller share of transportation funds than their suburban counterparts.1 In addition to the differences in investments, the background paper also highlights the impacts of the investments, such as less mobility and access for those dependent on transit. Oedel provides a case example of transportation investments in Just Transportation (1997). The actions described in example from Macon, Georgia, resulted in an administrative complaint with the U.S. Department Transportation on behalf of the city’s transit-dependent residents.
As noted earlier, roadway investments and other federal policies have been cited as promoting private automobile use, low-density developments, and suburbanization. Sanchez et al. state, “One of the central indirect effects [of roadway investments] is the reinforcement of residential segregation” (2003:17).

C A S E S T U D I E S I N E N V I R O N M E N T A L J U S T I C E A N D P U B L I C T R A N S I T T I T L E V I R E P O R T I N G
12
In addition to roadway investments, commuter rail and light rail investments also have been questioned. (Sanchez et al. 2003). The light rail expenditures of the Los Angeles County Metropolitan Transportation Authority (MTA) were an issue in the class action civil rights suit filed by the Labor/Community Strategy Center, the Bus Riders Union, and others in that county (Mann 1997). When the Washington Metropolitan Area Transit Authority (WMATA) presented its plan to implement the Green Line, the community strongly protested the proposed truncation of bus services to encourage use of the rail system (Crockett 1996).2
Disparate bus service investments also have been noted (Oedel 1997; Mann 1997; Sanchez et al. 2003). This includes:
Route design, e.g., layout, frequency, length, etc.; Capacity, e.g., number of vehicles, pass-ups, vehicle load, etc.; Fare structures, e.g., shorter trips generally made by central city riders versus
longer trips made by suburban riders, and Assignment of vehicles, e.g., newer equipment provided to suburban
communities.
Other impacts of transportation investments relate to limited access to goods and services, adverse health outcomes, and economic opportunities.
Transportation, Land-Use, Economic Development, the Environment, and Social Equity
In the background paper “Social Equity, Transportation, Environment, Land Use, and Economic Development: The Livable Community,” Chen links many of the above issues by discussing the contribution of land use patterns (1994). As noted by others, Chen finds opportunities for improvement through economic development, particularly through urban redevelopment, which would improve access for low-income communities and minority communities. Other in addition to physical access, Chen states that financial access and political access also are important.
Sanchez et al. extensively make the connection between land use policies and transportation outcomes as related to equity (2003:20). The authors suggest that U.S. policymakers should also address spatial equity issues through housing and land use policies. By integrating these policies with transportation, the authors pose that issues of social exclusion, which includes the types of access outlined by Chen, would be better understood and addressed.

C A S E S T U D I E S I N E N V I R O N M E N T A L J U S T I C E A N D P U B L I C T R A N S I T T I T L E V I R E P O R T I N G
13
Case Study Methodology
s mentioned above, the International Association for Impact Assessment recommends case study is a preferred research approach. The method provides a focused, in-depth description, analysis, and synthesis of a particular program or other set of circumstances. It examines the circumstances at
geographic, cultural, organizational, and historical contexts, and how it uses inputs and processes to produce outcomes.
The tools used to develop the following case studies include some combination, to the extent feasible, of what Yin (1994:79) outlines as six sources of evidence:
Documentation Archival records Interviews Direct observations Participant observation Physical artifacts
This method provides what is known as “thick description” of the set of circumstances surrounding the inquiry (Geertz 1993). Again, Yin says
Case studies are the preferred [research] strategy when “how” or “why” questions are being posed, when the investigator has little control over events, and when the focus is on a contemporary phenomenon within some real-life context.
The consideration of environmental justice and nondiscrimination issues do pose “how” are “why” questions. Given the context, there is no control for the investigator beyond observation and documentation. The circumstances, unfortunately, remain contemporary in the lives of many people.
Using a set of procedures adjusted to suit each case, we have examined environmental justice within the geographic, cultural, and historic contexts. Of particular relevance to this study, the sources of evidence were analyzed within the context of FTA Circular 4702.1 Circular Title VI Program Guidelines (1988) with emphasis on the program-specific data collection reporting requirements. For each case study, a relevant thematic map of the minority population was generated in a geographic information system. A related population/racial distribution chart also was generated. The issues raised were assessed as to how they related to service standards policies outlined in FTA Circular 4207.1. These included vehicle load, the number of seats on a vehicle; vehicle
A

C A S E S T U D I E S I N E N V I R O N M E N T A L J U S T I C E A N D P U B L I C T R A N S I T T I T L E V I R E P O R T I N G
14
assignment, e.g., type or size, amenities, types of service, timing, etc.; vehicle headway, the time interval between vehicles traveling in the same direction; distribution of amenities, e.g., kiosks, bicycle and pedestrian facilities, etc.; and access, the distance needed to travel to get to transit service. As part of its oversight reviews, FTA has incorporated environmental justice considerations and monitoring the implementation as part of its Civil Rights Reviews (2003).
In addition to census data, texts, articles, Title VI reports, and other archival data were used to document the historical and other conditions. Interviews, in-person, telephone, and group discussions provided agency and personal perspectives. Direct and participate observation and physical artifacts included visiting sites, where feasible, and using public transit systems in those areas, and review of system maps, schedules, and so on.

C A S E S T U D I E S I N E N V I R O N M E N T A L J U S T I C E A N D P U B L I C T R A N S I T T I T L E V I R E P O R T I N G
15
Case Studies
he case studies are drawn from four areas of the country, Atlanta, Chicago, Denver, and Miami, and include a fifth study, which focuses on the population distribution of American Indians and Alaska Natives. There are similarities and differences among the geographical areas and the distribution of the ethnic and
racial subgroups of the population. The four geographic areas each are considered from a regional perspective as there are transportation providers who provide services on a multi-county level. The distribution of minority and low-income population groups vary by area, but there is some suggestion that these households tend to be concentrated within limited geographic areas, specifically central cities, of the region.
In consideration of the environmental justice issues related to American Indian and Alaska Natives, we provide an overview of the “unique relationship” between the U.S. government and tribal governments. A discussion of the socioeconomic conditions for American Indians and Alaska Natives living on and off their lands is included. The public transportation environmental justice implications are outlined.
The Atlanta case study looks at the legacy of racial segregation, the population growth in the region, and the environmental justice implications. The case includes a discussion of the struggle for equitable transportation investments.
The Chicago case study provides a narrower focus, examining how multiple public policies may create unintended impacts. Consideration is given to changes in public housing and welfare reform and impacts on public transportation access for residents.
In the Denver area, the case study looks at public involvement activities used to assess impacts associated with a combined roadway and transit project. The project manager described the activities as “unprecedented” for the State.
Finally, the Miami case study serves rather as a summary, pulling together elements from the four earlier case studies and giving consideration to anticipated demographic changes for the U.S. population in the future.
T

C A S E S T U D I E S I N E N V I R O N M E N T A L J U S T I C E A N D P U B L I C T R A N S I T T I T L E V I R E P O R T I N G
16
American Indians and Alaska Natives This case study focuses on a racial minority group3 rather than a specific geographic area. There are several reasons for this approach including lack of knowledge regarding the unique relationship between American Indian and Alaska Native entities and the United States. The 562 American Indian and Alaska Native tribes acknowledged by the U.S. have sovereign status as “domestic dependent nations” and have certain immunities, privileges, responsibilities, powers, limitations, and obligations (Federal Register 2003: 68180). In addition to Title VI of the Civil Rights Act of 1964, Executive Order 12898, and related statutes, President Clinton issued a directive, the Executive Memorandum on Government-to-Government Relations between the United States and Indian Tribes, on 29 April 1994, which reaffirmed the “unique legal relationship…” As with Executive Order 12898, the directive requires all executive departments and agencies to:
Operate within a government-to-government relationship with federally recognized Indian tribes;
Consult, to the greatest extent practicable and permitted by law, with Indian tribal governments before taking actions that affect federally recognized Indian tribes;
Assess the impact of agency activities on tribal trust resources and assure that tribal interests are considered before the activities are undertaken;
Remove procedural impediments to working directly with tribal governments on activities that affect trust property or governmental rights of the tribes; and
Work cooperatively with other agencies to accomplish these goals established by the President. (U.S. Senate Committee on Indian Affairs 1999).
In addition, several states, within their sovereign powers, recognize tribes that are not included in the Federal list and operate within a government-to-government relationship. The purpose of this case study is to help transit agencies and American Indian and Alaska Native entities gain a better understanding of the Title VI implications of the U.S.-to-tribe relationship. The range of Title VI and environmental justice issues are beyond the scope of this case study. Rather, general mobility and access issues are addressed within the context of place of residence and socioeconomic conditions and tribal transportation. The purpose of this approach is to provide a framework for transit agencies to consider American Indian and Alaska Native transportation issues within the agencies’ service areas and both on and off tribal lands. Examples of initiatives and recommendations from tribal representatives, those who work with tribes, and others also are provided.

C A S E S T U D I E S I N E N V I R O N M E N T A L J U S T I C E A N D P U B L I C T R A N S I T T I T L E V I R E P O R T I N G
17
American Indian and Alaska Native Areas and Demographic Profile
As shown in Table 1 and Figure 1, the 2000 Census estimate of the American Indian population by state ranged from 0.48 percent to more than 11 percent and represent almost 1.5 percent of the total U.S. population.4 The Census also indicated that in each of the 50 states and the District of Columbia some percentage of the population identified as “American Indian.” The Alaska Native population is concentrated in fewer states, 16, and is estimated to be 0.25 percent of the total U.S. population.
Table 1. American Indian and Alaska Native Population/Racial Distribution Chart
TOTAL POPULATION
TOTAL AMERICAN
INDIAN
TOTAL ALASKA NATIVE
TOTAL AMERICAN
INDIAN AND ALASKA NATIVE
STATE # % # % # % # %
Alabama 4,447,100 100 48,857 1.10 - - 48,857 1.10 Alaska 626,932 100 28,341 4.52 107,682 17.18 136,023 21.70 Arizona 5,130,632 100 293,647 5.72 35,955 0.70 329,602 6.42 Arkansas 2,673,400 100 40,198 1.50 - - 40,198 1.50 California 33,871,648 100 630,105 1.86 191,432 0.57 821,537 2.43 Colorado 4,301,261 100 84,051 1.95 22,857 0.53 106,908 2.49 Connecticut 3,405,565 100 25,725 0.76 - - 25,725 0.76 Delaware 783,600 100 7,029 0.90 - - 7,029 0.90 District of Columbia 572,059 100 5,347 0.93 - - 5,347 0.93 Florida 15,982,378 100 131,361 0.82 40,091 0.25 171,452 1.07 Georgia 8,186,453 100 59,400 0.73 - - 59,400 0.73 Hawaii 1,211,537 100 25,280 2.09 - - 25,280 2.09 Idaho 1,293,953 100 27,696 2.14 5,451 0.42 33,147 2.56 Illinois 12,419,293 100 79,655 0.64 30,216 0.24 109,871 0.88 Indiana 6,080,485 100 47,343 0.78 - - 47,343 0.78 Iowa 2,926,324 100 19,117 0.65 - - 19,117 0.65 Kansas 2,688,418 100 50,723 1.89 - - 50,723 1.89 Kentucky 4,041,769 100 28,235 0.70 - - 28,235 0.70 Louisiana 4,468,976 100 47,136 1.05 - - 47,136 1.05 Maine 1,274,923 100 14,812 1.16 - - 14,812 1.16 Maryland 5,296,486 100 43,300 0.82 - - 43,300 0.82 Massachusetts 6,349,097 100 39,366 0.62 - - 39,366 0.62 Michigan 9,938,444 100 133,376 1.34 38,782 0.39 172,158 1.73 Minnesota 4,919,479 100 83,778 1.70 19,804 0.40 103,582 2.11 Mississippi 2,844,658 100 21,213 0.75 - - 21,213 0.75 Missouri 5,595,211 100 66,875 1.20 - - 66,875 1.20 Montana 902,195 100 66,085 7.32 6,829 0.76 72,914 8.08 Nebraska 1,711,263 100 23,669 1.38 - - 23,669 1.38 Nevada 1,998,257 100 43,756 2.19 10,804 0.54 54,560 2.73 New Hampshire 1,235,786 100 8,625 0.70 - - 8,625 0.70 New Jersey 8,414,350 100 50,073 0.60 - - 50,073 0.60 New Mexico 1,819,046 100 191,144 10.51 - - 191,144 10.51

C A S E S T U D I E S I N E N V I R O N M E N T A L J U S T I C E A N D P U B L I C T R A N S I T T I T L E V I R E P O R T I N G
18
TOTAL POPULATION
TOTAL AMERICAN
INDIAN
TOTAL ALASKA NATIVE
TOTAL AMERICAN
INDIAN AND ALASKA NATIVE
STATE # % # % # % # %
New York 18,976,457 100 175,680 0.93 - - 175,680 0.93 North Carolina 8,049,313 100 138,320 1.72 - - 138,320 1.72 North Dakota 642,200 100 35,268 5.49 - - 35,268 5.49 Ohio 11,353,140 100 88,960 0.78 - - 88,960 0.78 Oklahoma 3,450,654 100 395,108 11.45 33,919 0.98 429,027 12.43 Oregon 3,421,399 100 87,803 2.57 21,548 0.63 109,351 3.20 Pennsylvania 12,281,054 100 59,404 0.48 - - 59,404 0.48 Rhode Island 1,048,319 100 11,553 1.10 - - 11,553 1.10 South Carolina 4,012,012 100 30,248 0.75 - - 30,248 0.75 South Dakota 754,844 100 67,946 9.00 - - 67,946 9.00 Tennessee 5,689,283 100 43,553 0.77 - - 43,553 0.77 Texas 20,851,820 100 224,066 1.07 69,191 0.33 293,257 1.41 Utah 2,233,169 100 41,141 1.84 - - 41,141 1.84 Vermont 608,827 100 7,363 1.21 - - 7,363 1.21 Virginia 7,078,515 100 60,819 0.86 - - 60,819 0.86 Washington 5,894,121 100 156,854 2.66 44,492 0.75 201,346 3.42 West Virginia 1,808,344 100 12,263 0.68 - - 12,263 0.68 Wisconsin 5,363,675 100 74,798 1.39 14,764 0.28 89,562 1.67 Wyoming 493,782 100 15,834 3.21 - - 15,834 3.21 Population Totals: 281,421,906 4,192,299 693,817 4,886,116 Total Percentages: 100.00 1.49 0.25 1.74
(Source: Census 2000 American Indian and Alaska Native Summary File (AIANSF)- Sample Data)
As mentioned above, there are more than 560 federally-recognized American Indian and Alaska Native tribes. Figure 2 shows the distribution of American Indian tribal subdivisions and areas, Alaska Native statistical areas, Alaska Native areas, Alaska Native regional corporations, and Hawaiian homelands.5 The purpose of the two figures and the population chart is to illustrate two key items. First, there are access and mobility people issues related to American Indians and Alaska Natives who live both on and off tribal lands. We will consider these in relation to how transit services and benefits are provided to American Indians and Alaska Natives. Second, there are geographic issues regarding transportation on tribal lands. The geographic issues are critical in consideration of the “unique relationship” between the U.S. and the tribes. These issues are discussed separately.

C A S E S T U D I E S I N E N V I R O N M E N T A L J U S T I C E A N D P U B L I C T R A N S I T T I T L E V I R E P O R T I N G
19
Figure 1. American Indian and Alaska Native Population Distribution

C A S E S T U D I E S I N E N V I R O N M E N T A L J U S T I C E A N D P U B L I C T R A N S I T T I T L E V I R E P O R T I N G
20
Figure 2. Federal and Hawaiian (State) Boundaries

C A S E S T U D I E S I N E N V I R O N M E N T A L J U S T I C E A N D P U B L I C T R A N S I T T I T L E V I R E P O R T I N G
21
General Issues of Mobility and Access
Place of residence, particularly as related to population density, can contribute to mobility limitations. The Community Transportation Association of America (CTAA) has said that these limitations and consequent isolation can be most severe within tribal lands (n.d.a.).
More than 40 percent of American Indians were estimated to live in the western area of the U.S. and more than 30 percent live in the South in 2000 (Ogunwole 2002:4). Within these regions, more than 60 percent of the American Indian population is concentrated in 11 states, California, Oklahoma, Arizona, Texas, New Mexico, New York, Washington, North Carolina, Michigan, Alaska, and Florida. Nearly 20 percent of the Alaska Native population lived in two states, California and Alaska. As shown in Table 2, while the majority of the American Indian and Alaska Native populations lived within urban areas, a greater percentage of both groups lived in rural areas than the general population. Within urban areas, more American Indians and Alaska Natives lived within urban clusters—areas with a population of 2,500 to 49,999--than the general population. In rural areas, more American Indians and Alaska Natives lived on nonfarm land than the general population. These differences were greater for American Indians than Alaska Natives. Overall, nearly 45 percent of American Indians and more than 35 percent of Alaska Natives lived in areas with populations of less than 50,000.
Table 2. Urban and Rural Residence of American Indians and Alaska Natives
UNITED STATES
% TOTAL
U.S . AMERICAN
INDIAN
% AMERICAN
INDIAN ALASKA NATIVE
% ALASKA NATIVE
TOTAL 281,421,906 100.0 4,192,299 100.0 1,142,572 100.0 Urban 222,358,309 79.0 2,887,163 68.9 877,644 76.8 Inside urbanized Areas 192,338,121 68.3 2,293,263 54.7 738,881 64.7 Inside urban Clusters 30,020,188 10.7 593,900 14.2 138,763 12.1 Rural 59,063,597 21.0 1,305,136 31.1 264,928 23.2 Farm 2,987,531 1.1 33,450 0.8 6,219 0.5 Nonfarm 56,076,066 19.9 1,271,686 30.3 258,709 22.6
(Source: Census 2000 American Indian and Alaska Native Summary File (AIANSF)- Sample Data)
Mobility can be limited further by income, availability of private transportation, and employment. The median U.S. household income in 1999 was $41,994. However, the median American Indian household income was $32,225 and the Alaska Native household income was $32,068 for the same period. (This is slightly more than three-quarters of the U.S. average.) More than 45 percent of American Indian households and nearly 49 percent of Alaska Natives were renters compared to 34 percent of U.S. households, on average. Only 16 percent of U.S. families, on average, live below the federal poverty level in 1999. Nearly 27 percent of American Indian families and almost 27 percent of Alaska Native families, however, live below the poverty level. Slightly more than 10 percent of U.S. households did not own a vehicle in 2000. However,

C A S E S T U D I E S I N E N V I R O N M E N T A L J U S T I C E A N D P U B L I C T R A N S I T T I T L E V I R E P O R T I N G
22
nearly 14 percent of American Indian households did not own a vehicle and nearly 19 percent of Alaska Native households did not own a vehicle. And, slightly less than 4% of the U. S. population was unemployed in 2000; however, among the American Indian and Alaska Native populations, the unemployment rate was almost seven percent (Census 2000).
These statistics suggest that whether or not American Indians and Alaska Natives live on tribal lands, a substantial number of both population groups lived in areas with populations of less than 50,000. (For transit purposes, these areas may be described as rural and small urban areas.) The statistics on household income, employment rates, and automobile ownership combined with place of residence help to illustrate general mobility limitations. Again, CTAA:
American Indian transportation needs are similar to the needs of most people who live in rural areas, only more extreme…Conditions unique to the reservation exacerbate the mobility problems for many American Indians. Social barriers, often-tremendous geographic distances across tribal lands and challenging administrative conditions make tribal transportation services more difficult to initiate and maintain (n.d.b.).
In some instances, there is little access to goods and services on tribal lands. One person interviewed said, “We have a little store [on the reservation], but there is little there to buy. And it’s expensive.” There also are misconceptions regarding other resources available to American Indians and Alaska Natives with recent investments in gaming, e.g., casinos, or revenue from mineral rights. The consensus among persons interviewed was “some tribes are doing all right and some are not.” (In some instances where tribes are not “doing all right”, the tribes’ earnings from these investments are used for debt service with little of this income benefiting members of the tribe.)
Roughly, 55 percent of American Indians and 65 percent of Alaska Natives, however, live inside urbanized areas—areas with populations of 50,000 or more. Mobility and access issues in urbanized areas may be related to availability of public transportation and, if available, the level of service. The socioeconomic statistics shown above suggest that American Indians and Alaska Natives who live in urbanized areas may experience mobility and access challenges similar to other racial or ethnic minority groups. That is, where American Indians and Alaska Natives live in urbanized areas may not be accessible to goods, services, and employment.
Transportation on Tribal Lands
Federally-recognized tribes may apply for and receive funds for public transportation. These tribes also may receive federal funds from other human service programs, such as aging, Head Start, or Tribal Temporary Assistance to Needy Families (TANF) which may be used for transportation. Tribal transportation issues included:

C A S E S T U D I E S I N E N V I R O N M E N T A L J U S T I C E A N D P U B L I C T R A N S I T T I T L E V I R E P O R T I N G
23
Few public transportation providers on tribal lands; Long distances across areas; Lack of roadways, sidewalks, etc.; Knowledge of or lack of funding; Coordination of human service and public transportation funding.
One contributor to the lack of public transportation factors may be lack of human resources to provide transportation planning. “Although nearly one-quarter of our adults have some form of disability, we can’t find the time to include ADA access and public transportation in our long range transportation plan (LRTP)” (Galloway 2005:4).
Some tribal areas cover large portions of sparsely populated land. In some instances, this may be further complicated by county or state boundaries. Transportation services in these areas are expensive to provide and can involve long travel times for passengers. Lack of roadways or inadequate roads, i.e., unpaved, connections to houses, etc., on some tribal lands also was mentioned as problems for some tribal areas. These conditions not only were difficult for vehicle travel, but also affected access for persons with disabilities, older persons, pedestrians, etc.
Funding issues are some what related. First, there is a lack of knowledge or timely information regarding program funding for some tribal entities. This issue is multifaceted. In some areas, the question is when are tribal entities brought into the transportation planning and decisionmaking processes? If tribal entities are brought into the tribal planning process as late participants, there may be few resources available. In other areas, it is a question of whether tribal entities want to be involved in the processes. There has been some discussion of a separate transit program within FTA.
The second funding issue is related to commingling of funds. One person characterized it as “so many little pots.” (Transportation providers familiar with coordinated transportation systems have cited the various eligibility requirements of programs as a barrier. And, there have been repeated efforts by various federal agencies to promote leveraging funding, particularly using funds from other federal programs to match transportation dollars.) As discussed below, where these issues have been addressed has been the result of collaborative efforts between tribal entities and states and the Federal government.
Examples, Lessons Learned, and Solutions
There was consensus among contacts and other sources that the first step is to be aware. On the local level, this translates into awareness of the existence of American Indian and Alaska Native populations within the service area and, as applicable, state and federally-recognized tribal lands. For those areas subject to program-specific requirements as outlined in FTA Circular 4702.1, Title VI Program Guidelines for Urban Mass Transportation Administration Recipients, this includes ensuring that services are provided in compliance with this guidance.

C A S E S T U D I E S I N E N V I R O N M E N T A L J U S T I C E A N D P U B L I C T R A N S I T T I T L E V I R E P O R T I N G
24
The next step is outreach. One informant advised that engagement should occur early and in neutral settings, for example, participating in health fairs, academic bowls, and so forth. The aim is to build personal contact as a step towards public involvement and community participation of tribal entities in the planning and decisionmaking processes. On the regional and statewide levels, assistance also may be sought from resource persons, e.g., environmental or human service agency staff, mediators, etc., who have experience in working with tribal councils. Early information dissemination to tribal councils regarding funding cycles and technical assistance also were mentioned as important.
CTAA provides a number of examples of tribal transportation providers, many of which have operated for more than 15 years (n.d.c.) using FTA 5311, rural and small urban, program funds. A link to program descriptions is provided in the reference section.
North Central [New Mexico] Regional Transit District
A useful case example is the creation of the North Central Regional Transit District (NCRTD) of New Mexico. Through a partnership with the Alliance for Transportation Policy Institute, the New Mexico Regional Development Corporation, and the Surface Transportation Policy Project several counties, cities, and pueblos in north-central New Mexico came together to create the district. Regional transit districts are supported by a 2003 state statute, designed to improve the public transportation network in New Mexico. Any combination of two or more governmental units in the state may form a transit district, including the state, counties, municipalities, or pueblos, tribes, or nations.6 The NCRTD is used as an example because of the multi-jurisdictional nature of the organization.
The geographic service area includes three counties, Los Alamos, Rio Arriba County, and Santa Fe. The goals of the district include identification, coordination, and modification of existing and future public transportation services. By coordinating on a regional level, the NCRTD seeks to respond to regional transportation needs, promote public transportation, and increase systemwide efficiency. Bicycle and pedestrian amenities also are included in the district’s planning to promote safety and improve connections.
This example is useful because of its multiple levels. First, there is the state legislative support. Second, there are both public and private partnerships enabling the planning of the district. Finally, there are both tribal and nontribal entities comprising the district. These multiple layers provide opportunity for communication between and among partnering agencies. One important element is that the partners invested 18 months to

C A S E S T U D I E S I N E N V I R O N M E N T A L J U S T I C E A N D P U B L I C T R A N S I T T I T L E V I R E P O R T I N G
25
develop the entity. This period of planning allowed participating agencies time to develop relationships and to identify issues and concerns necessary for the partnership.
Other Resources
The Tribal Technical Assistance Program (TTAP) works with entities to manage transportation infrastructure as part of the Local Technical Assistance Program (LTAP), funded by FHWA. As mentioned earlier, roadway infrastructure, including bicycle facilities, sidewalks, curb cuts, etc., is a primary concern for many tribal areas. (It also is needed to support transit.) Although there is an emphasis on roadway infrastructure, the regional TTAP centers, FHWA Division staff, and state DOT environmental office staff generally have experience working with tribal councils and may be resource persons and points of contact to assist local transportation agencies.
Transportation Research Board (TRB) Committee ABE80, Native American Transportation Issues addresses research and practices related to tribal lands and communities. Although the committee is concerned with all modes of transportation and related public and private entities, road issues have tended to be a major focus (telephone interview, 22 March 2005).
Through funding from the U.S. Department of Agriculture, CTAA provides a Tribal Passenger Transportation Technical Assistance program. Assistance may include planning, service improvement and expansion, system start-up, marketing, coordination, etc.

C A S E S T U D I E S I N E N V I R O N M E N T A L J U S T I C E A N D P U B L I C T R A N S I T T I T L E V I R E P O R T I N G
26
Atlanta, Georgia This case study primarily focuses on the efforts of the Metropolitan Atlanta Rapid Transit Authority to meet the needs of a rapidly growing area. Between 1990 and 2000, Atlanta’s population was estimated to have grown by nearly 40 percent (Social Science Data Analysis Network (SSDAN)). (In addition to its rapid growth, this area has been selected because of the many facets to be considered.) This growth, however, has had social and environmental impacts. Although blacks comprised 35 percent of this study area, like the Chicago area discussed later, blacks (and other ethnic and racial minority population groups) experience residential segregation and isolation when compared to whites (Massey and Denton 1993:64-65; Frey).7 This study looks at transportation investments in the area and MARTA’s efforts to provide public transportation.
Many of the issues discussed in this case study are beyond the purview of MARTA to resolve. For example, to secure state funding, the constitution must be changed. To decrease travel time to outlying counties, a seamless or consolidated system is needed. Finally, residential segregation and isolation are multi-faceted phenomena that will have to be addressed through the dismantling of housing, employment, and other forms of structural discrimination.
Transit Development in Brief
Atlanta’s transit history is tied with the history of the State. Atlanta, formerly known as the town of Terminus and later Marthasville, began taking substantive shape in 1837 when the Western & Atlantic Railroad selected the site as the southern end of its tracks. In 1847, the city was incorporated and renamed Atlanta and became a major railroad hub, manufacturing center, and supply depot. During the Civil War, U.S. General William T. Sherman’s army burned Atlanta’s railroad facilities and many businesses and homes.
It was not until 1952 that the planning committee recognized the need for public transportation. (By comparison, other cities, particularly in the Northeast made public investments in transportation prior to World War II.) Even with recognition of the need, a public entity was not created until January 1966 with the passage of the Metropolitan Atlanta Rapid Transit Authority (MARTA) Act. The Act initially was approved by the citizens of two of the five proposed counties, DeKalb and Fulton counties, and the City of Atlanta. (Later, Cobb and Gwinnett counties each formed systems independent of MARTA.)8 In 1971, the Metropolitan Rapid Transit Plan was adopted by MARTA. In accordance with the transit plan of 1972, MARTA bought the Atlanta Transit System. In 1979, MARTA became a bus and rail service with the implementation of MARTA’s first train, the East Line, which began operating between Avondale and the Georgia State (University) Station.
MARTA is a municipal corporation governed by an 18-member board of directors. Its mission is to provide safe, clean, and affordable transit service. The major components

C A S E S T U D I E S I N E N V I R O N M E N T A L J U S T I C E A N D P U B L I C T R A N S I T T I T L E V I R E P O R T I N G
27
of MARTA are a fixed rail system and a bus system providing local and express bus services. According to the American Public Transportation Association, MARTA is the ninth largest transit operator in the U.S. MARTA provides accessible rail stations, bus routes, and paratransit. MARTA operates 350 rail cars on 4,7l6 miles of rail, 125 bus routes using 691 buses, and 110 paratransit vans. MARTA also provides paratransit service in Clayton County, the fifth county in the original proposal. Cobb (County) Community Transit has a reciprocal fare agreement with MARTA, which enables passengers to transfer from one system to the other at no charge. Gwinnett County Transit connects to MARTA at the downtown station and other locations.
The Atlanta Study Area The 2003 Census Bureau estimate for the five-county—Clayton, Cobb, DeKalb, Fulton, and Gwinnett—area was 3,076,764. The five counties comprise more than one-third of the State’s population. As shown in Table 3, Blacks were estimated to comprise 64 percent of the population of the City of Atlanta. The total estimate for blacks in the five-county area was 35 percent. Ethnic and racial minorities represent nearly 53 percent of the total population. Persons with disabilities over age five years of age comprised more than 20 percent of the population of Atlanta. (Nationally, blacks and Native Americans and Alaska Natives have the highest rates for persons age five years and older, estimated at 24.3 percent, each (Waldrop and Stern2003:5).) The percent of persons with incomes below the poverty level also was greater for Atlanta, twice the national estimate. Although Atlanta is densely populated, DeKalb County was estimated to be the most densely populated county in 2000. (The majority of the land area of the City of Atlanta is in Fulton County.)

C A S E S T U D I E S I N E N V I R O N M E N T A L J U S T I C E A N D P U B L I C T R A N S I T T I T L E V I R E P O R T I N G
28
Table 3. Selected Characteristics of the Atlanta Study Area Population
CHARACTERISTIC ATLANTA CLAYTON COUNTY
COBB COUNTY
DEKALB COUNTY
FULTON COUNTY
GWINNETT COUNTY GEORGIA U.S .
Population, 2003 estimate 416,474 259,736 651,027 674,334 818,322 673,345 8,684,715 290,809,777 % Persons under 5 years old, 2000 6.4 8.3 7.2 7.1 7 8 7.3 6.8 % Persons 65 years old and over, 2000 9.7 5.9 6.9 8 8.5 5.4 9.6 12.4 % Black or African American persons, 2000 61.4 51.6 18.8 54.2 44.6 13.7 28.7 12.3 % American Native and Alaska Native, 2000 0.2 0.3 0.3 0.7 0.5 0.7 0.6 1.5 % Asian, 2000 2.2 5.0 3.5 4.5 3.4 7.8 2.4 4.2 % Native Hawaiian and Other Pacific Islander, 2000 0.1 0.2 0.1 0.1 0.1 0.1 0.1 0.3 % Some other race, 2000 2.5 4.4 4.4 4.7 3.2 5.4 2.9 6.6 % Hispanic, 2000 4.5 7.5 7.7 7.9 5.9 10.9 5.3 12.5 % Persons with a disability, age 5+, 2000 22.2 18.3 14.8 17.3 18.3 14.3 19.7 19.3 % Persons below poverty, 1999 24.4 10.1 6.5 10.8 15.7 13.0 13.0 12.4 Land area, 2000 (square miles) 132 143 340 268 529 433 57906 3537438 Persons per square mile, 2000 3,161.2 1,658.4 1,786.7 2,482.7 1,543.5 1,359.9 141.4 79.6
(Source: U.S. Census Bureau, State and County QuickFacts)
Figure 3 shows the total minority population distribution by census tract. As can be seen, the majority of ethnic and racial minorities are concentrated in DeKalb and Fulton counties. It appears that as population density declines, the counties become more ethnically and racially homogeneous. Within the counties, however, minorities tend to be highly concentrated in contiguous census tracts. The map also supports Massey’s and Denton’s description of racial segregation and isolation.

C A S E S T U D I E S I N E N V I R O N M E N T A L J U S T I C E A N D P U B L I C T R A N S I T T I T L E V I R E P O R T I N G
29
Figure 3. Total Ethnic and Racial Minority Distribution of the Atlanta Study Area
Residential Segregation and Public Transportation
Atlanta’s civil rights history is well documented. The connection, however, between the impacts of residential segregation and transportation investments have only more recently been investigated, notably by Dr. Robert D. Bullard and his colleagues. In Just Transportation, Bullard notes:
As Atlanta grew, the freeway system displaced or disrupted whole communities. In the 1960s, [MARTA] was hailed as the solution to metro Atlanta’s growing traffic and pollution problems. However, some suburban areas resisted MARTA for fear it would bring blacks and the

C A S E S T U D I E S I N E N V I R O N M E N T A L J U S T I C E A N D P U B L I C T R A N S I T T I T L E V I R E P O R T I N G
30
poor from the city to outlying suburbs…Only Fulton and DeKalb County residents pay a one-cent MARTA sales tax…At least a third of the cars parked in [some of MARTA’s park-and-ride] lots are from counties outside Fulton and DeKalb…[A]ll suburban areas [are] experiencing growth in service jobs. Most of these jobs are in service, retail, restaurants, and fast food outlets. Few suburban teens and young adults want or need these jobs (1997:15).
Between the 1990 and 2000 censuses, the population of the state of Georgia grew by more than 25 percent. This growth, however, was uneven. Gwinnett County grew by almost two-thirds, the largest growth of the five counties. Only DeKalb and Fulton counties grew by less than 30 percent, 21.9 and 25.8 percent, respectively. Within the counties, the City of Atlanta grew only by 5.8 percent. In 2003 population estimates, these trends appear to be continuing. The population of Gwinnett County was estimated to have grown by 14.4 percent, while the State growth was estimated at 6.1 percent, nearly twice the growth of the U.S. population (3.3 percent) for the same period. These statistics suggest that population growth is occurring outside the service area supported by MARTA taxpaying counties. (Clayton, Cobb, and Gwinnett counties grew more rapidly than DeKalb and Fulton counties between 1990 and 2000 and 2000 and 2003 (Census 2000c).)
Whites were estimated to comprise almost two-thirds of the population of the five counties in 1990; however, between the two censuses, the percentage of whites decreased to about 55. Minorities were estimated to comprise 36 percent of the population in 1990. By 2000, the estimated total minority population was nearly 52 percent, with blacks and persons of Hispanic origin having the greatest growth—from 30.3 to 35.7 percent and 2.3 to 7.9 percent, respectively. The City of Atlanta and Fulton County experienced decreases in the percent of minority population.
A comparison of selected socioeconomic of characteristics between the five counties and the City of Atlanta illuminates some of the differences among various groups of the population. As shown in Table 4, whites are estimated to comprise nearly 55 percent of the population. (This estimate is lower than the State and U.S. averages, 65 and 75 percent, respectively.) The total minority population is estimated to exceed the white population in Clayton, DeKalb, and Fulton counties.
Cobb County was estimated to have a greater percentage of married households with children less than 18 years, 80 percent, while both DeKalb and Fulton Counties averaged 65 percent. Only 20 percent of families in Atlanta were married households with children in this age range. However, Atlanta has the largest percentage of female-headed households with children less than 18 years of age. Given women’s earnings, it follows that Atlanta was estimated to have the greatest percentage of persons living below the Federal poverty level and percent of households with public assistance households.9 The City of Atlanta also has a lower median household income in 1999

C A S E S T U D I E S I N E N V I R O N M E N T A L J U S T I C E A N D P U B L I C T R A N S I T T I T L E V I R E P O R T I N G
31
than the counties and the State ($42,433), although DeKalb and Fulton counties had a greater median household income. Renter occupancy also was estimated to be greater in Atlanta. Also, DeKalb and Fulton counties had the highest rates of zero-vehicle households, concentrated inside Atlanta.
Table 4. Selected Socioeconomic Characteristics of the Atlanta Study Area
SUBJECT ATLANTA CLAYTON COUNTY
COBB COUNTY
DEKALB COUNTY
FULTON COUNTY
GWINNETT COUNTY
Total Population, 2003 369,393 259,736 651,027 674,334 818,322 673,345 % White, 2000 33.2 37.9 72.4 35.8 48.1 72.7 % Black, 2000 61.4 51.6 18.8 54.2 44.6 13.7 % American Indian/Alaska Native,2000 0.2 0.3 0.3 0.7 0.5 0.7 % Asian, 2000 2.2 5 3.5 4.5 3.4 7.8 % Hawaiian or Other Pacific Islander, 2000 0.1 0.2 0.1 0.1 0.1 0.1 % Other, 2000 2.5 4.4 4.4 4.7 3.2 5.4 % Two or More Races, 2000 1.2 2.1 1.9 2.1 1.5 2.2 % Hispanic, 2000 4.5 7.5 7.7 7.9 5.9 10.9 Total Minority Population, 2000 295,280 179,218 226,557 486,195 472,172 259,911 Households, 2000 186,925 82,243 251,007 249,339 321,242 202,317 Families, 2000 84,449 49,478 157,937 158,167 187,627 153,531 Married Householders with Children, 2000 16,745 38,179 126,279 103,259 122,562 126,591 Female Householders with Children, 2000 20,040 10,901 14,124 24,428 31,077 11,666 % Persons Below Poverty Level, 2000 24.4 10.1 6.5 10.8 15.7 5.7 % Public Assistance Households, 2000 5.5 2.9 1.2 2.2 3.6 1.1 Median family income, 1999 $34,770 $42,697 $58,289 $49,117 $47,321 $60,537 Housing Units, 2000 186,998 86,461 237,522 261,231 348,632 209,682 Vacant, 2000 18,756 4,218 10,035 11,892 27,290 6,365 Owner Occupied, 2000 61,208 45,161 142,790 134,885 146,783 134,802 Renter Occupied, 2000 94,577 32,306 72,250 45,144 153,778 55,531 % Zero-vehicle households, 2000 23.6 5.5 3.8 9.1 15.2 3.1
(Sources: U.S. Census Bureau 2000 QuickFacts and SF 3)
The majority of the growth in the study area occurred between 1990 and 2000 and took place outside the City of Atlanta. Although Atlanta has become known in the popular press as the “Black Mecca”, it appears that not all blacks and other minorities have realized the benefits of its growth and prosperity. This is despite Georgia leading the nation in black domestic migration (Schachter 2003:8). What is suggested is that whites and more affluent blacks and minorities were able to move away from Atlanta and/or into the outlying areas, leaving less affluent blacks and other minorities concentrated in the city.

C A S E S T U D I E S I N E N V I R O N M E N T A L J U S T I C E A N D P U B L I C T R A N S I T T I T L E V I R E P O R T I N G
32
As mentioned above, not only did residential growth take place outside Atlanta, but also job growth. Households remaining in the central city area may experience isolation from employment opportunities and access to goods and services. Kaplan and Holloway found this to be particularly acute for youths (1998:78-79). Employment probability for black male teenagers was found to be negatively related to employment accessibility. Longer commute times appeared to indicate relatively greater employment accessibility. This condition also would be true for others living in central cities, e.g., black female teenagers, persons in welfare transition programs, etc., anyone unable to relocate to a residence closer to employment.
For residents of Atlanta who rely on public transportation, longer commute times to suburban employment sites and services are created by the separate public transportation systems. Both the Environmental Justice Resource Center (2004) and Rich (1997) and Coughlin have documented that only about one-third of jobs within the region are within a one-hour transit ride for low-income households.
Bicycle and pedestrian safety also is an issue for people who live in low-income households. On average, low-income people use bicycles and walk more than the general population. Atlanta ranked sixth among the 10 most dangerous metropolitan areas for walking in 2002-2003 (Ernst 2004:16). There also are racial and ethnic disparities in pedestrian deaths. According the Centers for Disease Control, blacks and Hispanics in Atlanta were two to six times more likely to be involved in a pedestrian fatality than non-Hispanic whites (1999:601-605)
In addition to the economic isolation for low-income residents in Atlanta, the region suffers from environmental and other impacts. First, the average one-way commute trip for the five counties was estimated as 30.8 minutes (Helling and Holbrook 2003:13.). (The national average is 25.5 minutes.) This average is both a measure of trip length and congestion, both contributing to adverse air quality and energy impacts. Since an average of 84 percent of these commuters drove alone, considerable roadway infrastructure is needed to accommodate the number of vehicles.
The region currently is a nonattainment area for ambient air quality standards. As a result of this status, traffic congestion, and “poorly planned development”, federal funds for new highway projects were restricted in the 13-county area shown in Figure 3. This lead to creation of the Greater Regional Transportation Authority (GRTA ) in 1999. GRTA is charged with working with local governments to finance mass transit and other transportation control measures to reduce air pollution. (It should be noted, however, that the State of Georgia (and 29 other states) restrict the use of gasoline tax revenue to highway infrastructure.)
Within these parameters, MARTA has struggled with budgetary constraints that often had to be offset with fare increases, creating additional hardships for low-income, elderly, and other users who depend on the service. This has, at times, pitted users against MARTA, including a discrimination complaint in 2000. What has evolved,

C A S E S T U D I E S I N E N V I R O N M E N T A L J U S T I C E A N D P U B L I C T R A N S I T T I T L E V I R E P O R T I N G
33
overtime, is rider and grassroot support also to advocate for equitable distribution of transportation funds to support public transportation on the state and national level.
Title VI Activities within MARTA
In addition to periodic reporting of the general and program-specific requirements, including the level and quality of service, MARTA uses extensive overlays to measure service standards. These and other measures are used to assure nondiscrimination in the delivery of service. Complaints are directed to the Office of Diversity and Equal Opportunity, which has a staff of approximately 20. There also is a Title VI liaison for each area of the agency, which comprises the Title VI Advisory Committee. The committee meets quarterly. Consideration may be given to levels of service in one area versus another, types of amenities provided, e.g., benches, shelters, types of vehicles, etc. The committee also seeks to promote transit-oriented development and economic development.
Fare increases were raised as an issue in the 2000 discrimination complaint. MARTA staff, riders, and grassroot organizations participated in community forums to resolve this issue. A fare increase was negotiated. Following this issue, MARTA continued to schedule quarterly meetings, providing opportunities for the community to ask further questions.
MARTA also worked with the Metropolitan Atlanta Transportation Equity Coalition (MATEC), a grassroots organization formed in 1999, to resolve issues around vehicle assignment. (MATEC is made up of transit riders, civil rights groups, environmental justice advocates, faith-based organizations, neighborhood organizations, academics, and labor representatives.) The issue for MARTA was the ability to dispatch vehicles in an efficient manner. The agency needed an additional facility in order to provide vehicles without experiencing large deadheads. From the perspective of some users and others, more diesel buses were seen to be dispatched to minority or low-income communities than the more environmentally-friendly compressed natural gas (CNG) vehicles. The solution included reconfiguring six routes and the purchase of clean diesel vehicles as replacements. MARTA also worked with MATEC and others to explain the vehicle assignments and the need for an additional facility to better manage operating costs.
The advice from MARTA staff to other agencies and the public is that everyone needs to be involved and to become educated—about transportation, the community, funding—and to communicate the challenges, issues, and concerns. Communication within the transit agency also is important. To resolve the vehicle allocation issue, MARTA’s Title VI Advisory Committee worked with their scheduling, budget, and legal offices. With the constraints detailed above, the agency also must work with several groups across the region.

C A S E S T U D I E S I N E N V I R O N M E N T A L J U S T I C E A N D P U B L I C T R A N S I T T I T L E V I R E P O R T I N G
34
Chicago, Illinois The focus of this study is on the impacts of public policies on public transportation and environmental justice. Two public policies, Homeownership and Opportunity for People Everywhere (HOPE VI) of 1993, and the Personal Responsibility and Work Opportunity Responsibility Act (PRWORA) of 1996. HOPE VI was designed to remove tenants from severely distressed public housing units and either demolish or revitalize the units and the surrounding communities. It is believed that exposure to mixed-income communities and incorporation into social networks in different neighborhood settings will nurture new social and cultural capital that can enhance low-income families’ capacities to gain self sufficiency (Henson 1999; Pettit & McLanahan 2001; Rosenbaum 2001; Rosenbaum 1995). PRWORA, also known as welfare reform, eliminated open-ended federal entitlement to cash assistance for families with dependent children (AFDC), set life-time limits on program participation, and required participants to become employed within two years, including mothers of pre-school aged children. Both policies included the goals of helping families to become self-sufficient.
Both policies, however, were enacted with little consideration of the multiple impacts on families. In 1995, the Department of Housing and Urban Development (HUD) estimated that public assistance was the primary source of income for about half of HUD families (1997). In a letter to the then chair of the U.S. House of Representatives Subcommittee on Housing and Community Opportunity, the Government Accounting Office (GAO) raised several issues on the impact of welfare reform on HUD’s programs. One consideration was that while families might realize independence from cash assistance through employment, independence from housing assistance might not be possible.
Two years after the enactment of PRWORA, the U.S. Congress addressed its implications on low income families by establishing the Jobs Access and Reverse Commute program in the Transportation Equity Act for the 21st Century (TEA-21). The U.S. Congress found 93 percent of welfare families did not own automobiles (Public Law 105-178). African Americans also represent more than 20 percent of the eight million households who do not own a vehicle (McGuckin and Srinivasan 2003).
Chicago is an important study area because of its public transportation history, the city’s role in the diaspora of African Americans from the South, and the development of public housing in Chicago. The six-county broader study area —Cook, DuPage, Kane, Lake, McHenry, and Will--is served by three public transportation providers. As with many other major metropolitan areas, the general assumption would be that those who need public transportation can be served. Numerous studies have shown that the unique characteristics of households subject to work-first requirements pose many challenges to improve access to employment, childcare, education, and training for these families (Leete 1995; Rich 1997; Leete 1998; Lacombe 1998; Blumenberg 2003; Sanchez

C A S E S T U D I E S I N E N V I R O N M E N T A L J U S T I C E A N D P U B L I C T R A N S I T T I T L E V I R E P O R T I N G
35
2003). These challenges may be intensified by relocation, if relocation results in dispersal to less dense areas or other conditions that result in decreases in transit levels of service.
While the broader study area begins with the six-county area, the case study provides more detailed information on some of the experiences of residents in one public housing complex, the Robert Taylor Homes. The housing complex is located near downtown, central city Chicago. Chicago is located in Cook County, the most populous of the six counties.
The purpose of this study is to explore how public policies may work at cross purposes, creating additional barriers for the intended beneficiaries. The intent is to provide a better understanding of one of the many networks, public transportation, relied on by low-income families.
The Greater Chicago Study Area
Over 40 percent of Illinois’s population lives in Cook County. Combined, the six counties—Cook, DuPage, Kane, Lake, McHenry, Will—comprise nearly two-thirds of the total population of the State. As shown in Table 5, Chicago is more densely populated than that of the rest of the State and more than one hundred and sixty times that of the U.S. Consequently, Cook County is the most densely populated, followed by DuPage, Lake, Kane, Will and McHenry. The age of the population of the six counties and Chicago, reflected by the number of persons fewer than 5 years old and 65 years and older, is younger than that of Illinois and U.S. Moreover, Cook County and Chicago have a higher proportion of blacks or African Americans than both Illinois and U.S. Chicago also has the highest concentration of persons age five years and older with disabilities. The other five counties are more homogenous. The number of persons below the poverty level is higher for both Cook County and Chicago and significantly lower for the other five counties than that of Illinois and U.S.

C A S E S T U D I E S I N E N V I R O N M E N T A L J U S T I C E A N D P U B L I C T R A N S I T T I T L E V I R E P O R T I N G
36
Table 5. Selected Characteristics of the Chicago Study Area
CHARACTERISTIC CHICAGOCOOK
COUNTYDUPAGE COUNTY
KANE COUNTY
LAKE COUNTY
MCHENRY COUNTY
WILL COUNTY ILLINOIS USA
Population, 2003 estimate 2,722,562 5,351,552 925,188 457,122 685,019 286,091 586,706 12,653,544 290,809,777 % Persons under 5 years old, 2000 7.5 7.2 7.3 8.7 8.2 8.1 8.4 7.1 6.8 % Persons 65 years old and over, 2000 10.3 11.7 9.8 8.4 8.5 8.0 8.3 12.1 12.4
% Black or African American persons, 2000 36.8 26.1 3.1 5.8 6.9 0.6 10.5 15.1 12.3 % American Native and Alaska Native 0.4 0.3 0.2 0.3 0.3 0.2 0.2 0.2 0.9 % Asian 4.3 4.8 7.9 1.8 3.9 1.5 2.2 3.4 3.6 % Native Hawaiian and Other Pacific Islander 1.0 0.5 0.2 0.2 0.4 0.5 0.3 0.4 0.1 % Some other race 13.6 9.9 3.1 10.6 6.7 2.8 3.6 5.8 0.1 % Hispanic 26.0 19.9 9.0 23.7 14.4 7.4 8.7 12.3 12.5 % Persons with a disability, age 5+, 2000 22.8 19.7 12.2 15.3 13.4 11.2 12.8 17.6 19.3 % Persons below poverty, 1999 19.6 13.5 3.6 6.7 5.7 3.7 4.9 10.7 12.4 Land area, 2000 (square miles) 227 946 334 520 448 604 837 55,584 3,537,438 Persons per square mile, 2000 12,750.3 5,685.6 2,710.3 776.5 1,439.7 430.9 600.1 223.4 79.6
(Source: U.S. Census Bureau, State and County QuickFacts)
African Americans, Chicago, and Public Housing
The concentration of African Americans in Cook County, particularly within Chicago, was the result of several social developments, chief among which according to Massey and Denton (1993) were the industrialization of the U.S. and the movement of African Americans from farms to cities. Moving from the rural areas in the South to the cities and from there to the urban centers of the North:
There, they found jobs in wartime industries . . . And they came, hundreds and hundreds of thousands, in the biggest migration in American history. The first wave (300,000) came between 1910 and 1920, followed by a second wave (1,300,000) between 1920 and 1930. The third and fourth waves, even larger, came in the thirties (1,500,000) and the forties (2,500,000) (Bennett 1993:344).
The U.S. Housing Act of 1949 authorized funding to local governments to plan and clear “slums”, and authorized funding for the construction of low-income public

C A S E S T U D I E S I N E N V I R O N M E N T A L J U S T I C E A N D P U B L I C T R A N S I T T I T L E V I R E P O R T I N G
37
housing units. The land area that came to contain the Robert Taylor Homes was set aside by the City of Chicago between 1949 and 1957 (Venkatesh 2002:18). This area was known as “the largest contiguous slum in the U.S. (Chicago Housing Authority (CHA) 1962). The construction of Robert Taylor Homes was to relieve the overcrowding and other problem living conditions for the black community. In 1962, Robert Taylor Homes comprised of more than 4,300 units contained in 28, 16-story high rises built along a two-mile stretch of State Street opened. It was known as the largest public housing development in the world (CHA 2003).
Public Transportation in Chicago
Chicago has a history of being a pioneer in transportation. Its transit systems, in tandem with the Illinois and Michigan Canal, played a vital role in the development of the city. Chicago’s transit history can be traced back to the horse car, cable car, and then the electric streetcar. Between 1892 and 1895, Chicago’s first elevated line and Loop “L” were initiated. With the onset of the Great Depression of the 1930s, followed by World War II, finances to operate private systems became strained. Consequently, in 1947 with the passage of the Metropolitan Transit Authority in 1945, which created CTA, the transit lines became a public enterprise.
By the early 1970s, CTA also began to experience financial problems. Its operating costs were funded solely from farebox revenue. In an effort to remedy this situation, a coordinated framework for managing and financing transit, the Regional Transportation Authority (RTA) was created in December of 1973 through the RTA Act. The RTA Act was approved in 1974 by the citizens of six northeastern counties of Cook, DuPage, Kane, Lake, McHenry, and Will.
Unfortunately, RTA did not solve the financial problems rather it experienced significant financial problems and by 1982 RTA collapsed. In 1983 to protect the system from further financial crisis, the RTA Act was amended and operating responsibilities were decentralized into three boards, the CTA, Metra commuter rail, and Pace Suburban bus.
The Robert Taylor Homes, HOPE VI, PRWORA, Public Transportation and Title VI
In 1996, CHA applied for and received HOPE VI funding, which began a 10-year plan to demolish and redevelop the Taylor site. The 4,300-odd units are to be replaced by 2,388 mixed-income rental units and homes, of which more than 850 are to be public housing replacement units (CHA 2003a). Approximately 250 new units will be added in nearby neighborhoods. Roughly, between 3,200 to 3,450 public housing units will be lost. The net loss of housing units is 1,662.
Under CHA’s relocation plan, families may move to a temporary home or a rehabilitated permanent home. Some families may be moved to privately-owned apartments or homes may be eligible for Section 8 (federal-subsidized housing assistance) vouchers. Others may be moved to another public housing unit. These moves may be temporary
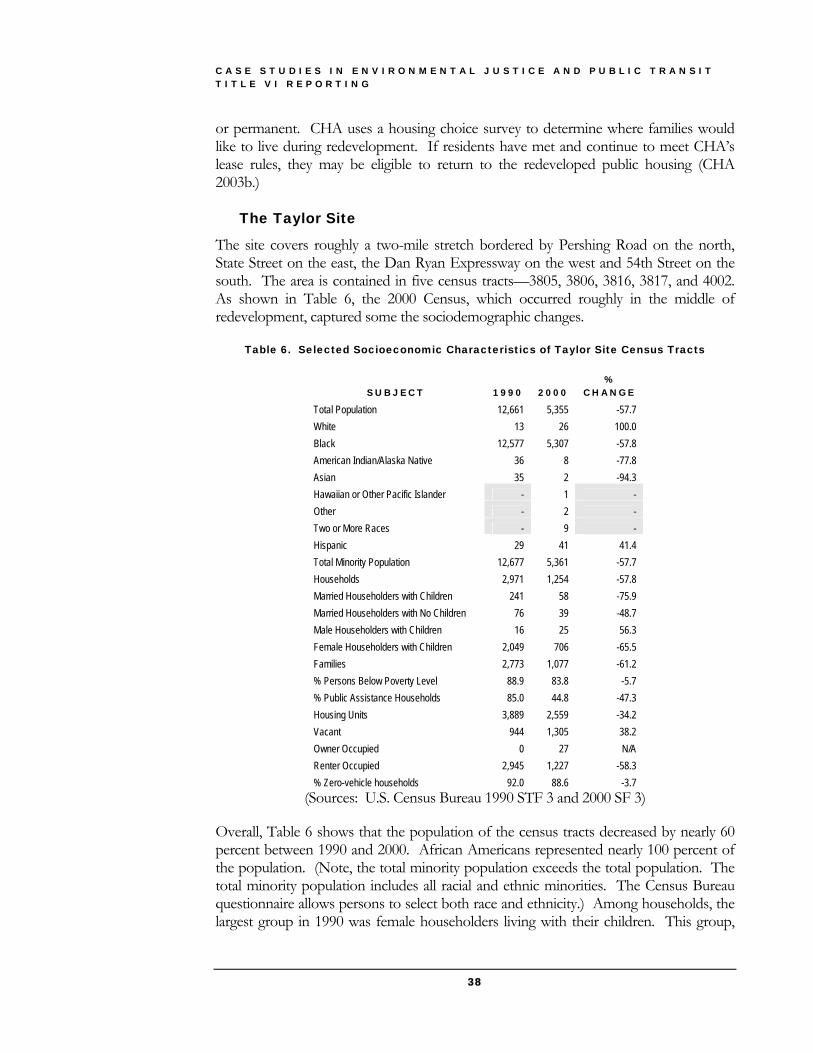
C A S E S T U D I E S I N E N V I R O N M E N T A L J U S T I C E A N D P U B L I C T R A N S I T T I T L E V I R E P O R T I N G
38
or permanent. CHA uses a housing choice survey to determine where families would like to live during redevelopment. If residents have met and continue to meet CHA’s lease rules, they may be eligible to return to the redeveloped public housing (CHA 2003b.)
The Taylor Site
The site covers roughly a two-mile stretch bordered by Pershing Road on the north, State Street on the east, the Dan Ryan Expressway on the west and 54th Street on the south. The area is contained in five census tracts—3805, 3806, 3816, 3817, and 4002. As shown in Table 6, the 2000 Census, which occurred roughly in the middle of redevelopment, captured some the sociodemographic changes.
Table 6. Selected Socioeconomic Characteristics of Taylor Site Census Tracts
SUBJECT 1990 2000 %
CHANGE
Total Population 12,661 5,355 -57.7 White 13 26 100.0 Black 12,577 5,307 -57.8 American Indian/Alaska Native 36 8 -77.8 Asian 35 2 -94.3 Hawaiian or Other Pacific Islander - 1 - Other - 2 - Two or More Races - 9 - Hispanic 29 41 41.4 Total Minority Population 12,677 5,361 -57.7 Households 2,971 1,254 -57.8 Married Householders with Children 241 58 -75.9 Married Householders with No Children 76 39 -48.7 Male Householders with Children 16 25 56.3 Female Householders with Children 2,049 706 -65.5 Families 2,773 1,077 -61.2 % Persons Below Poverty Level 88.9 83.8 -5.7 % Public Assistance Households 85.0 44.8 -47.3 Housing Units 3,889 2,559 -34.2 Vacant 944 1,305 38.2 Owner Occupied 0 27 N/A Renter Occupied 2,945 1,227 -58.3 % Zero-vehicle households 92.0 88.6 -3.7
(Sources: U.S. Census Bureau 1990 STF 3 and 2000 SF 3)
Overall, Table 6 shows that the population of the census tracts decreased by nearly 60 percent between 1990 and 2000. African Americans represented nearly 100 percent of the population. (Note, the total minority population exceeds the total population. The total minority population includes all racial and ethnic minorities. The Census Bureau questionnaire allows persons to select both race and ethnicity.) Among households, the largest group in 1990 was female householders living with their children. This group,

C A S E S T U D I E S I N E N V I R O N M E N T A L J U S T I C E A N D P U B L I C T R A N S I T T I T L E V I R E P O R T I N G
39
along with married householders living with their children experienced the greatest impact.
Although there was a slight decrease in the percent of persons living below the poverty level in the interim, more than 80 percent of persons living in the five tracts in 2000 were poor. (Not shown in Table 6, the average median household income for the five-tract area in 1989 was 21 percent of the median household for the City of Chicago. The number of available housing units decreased by more than one-third. While there were increases in the median household for the tracts by 1999, there was no change in the average difference between these tracts and the city’s median household income.) While the number of vacant units increased. Finally, although there was a slight decrease in the number of zero-vehicle households, nearly 90 percent of the remaining households in 2000 did not own a car.
Combined these statistics suggest that not only had more than 50 percent of the population moved, but also a substantial portion were subject to welfare reform. The 2000 Census showed that on average 44.8 percent of the households had public assistance income in 1999.
Figure 4 provides a thematic map of the total minority distribution in the six-county area. As discussed above, Cook County, particularly Chicago, minorities continue to be overrepresented as a percentage of the total population. Although there have been significant decreases in population, and subsequent concentration at the Taylor site, CHA is in the process of redeveloping 10, one-half of its 20 family sites. The loss of low-income housing during redevelopment not only disrupts residents who relocate, but also stresses on the receiving neighborhoods and other public services.

C A S E S T U D I E S I N E N V I R O N M E N T A L J U S T I C E A N D P U B L I C T R A N S I T T I T L E V I R E P O R T I N G
40
Figure 4. Total Ethnic and Racial Minority Distribution of the Chicago Study Area

C A S E S T U D I E S I N E N V I R O N M E N T A L J U S T I C E A N D P U B L I C T R A N S I T T I T L E V I R E P O R T I N G
41
Public Transportation, Environmental Justice, and Title VI
The percentage of households with public assistance income in the Taylor Homes and the number of female headed-households with children suggest that a significant number of the families were subject to welfare reform work-first requirements. Combined with the rate of zero-vehicle households, these families would need to rely on public transportation, friends, and families to meet the welfare requirements. While the Robert Taylor Homes concentrated African Americans in this and other areas, it also provided opportunities for residents to better meet their transportation needs with mass transit, few stops or densely populated origins serving many destinations. Barring relocation, however, the studies mentioned earlier have found that the travel needs of families in welfare transition programs have difficulty meeting their transportation needs. Spatial mismatch—the disconnect between where poor leave live and where job, training, or day care sites are located—can result in excessive travel time and other travel burdens. These constraints are compounded by relocation, which may result in what transportation planners call “many-to-many trips”—many origins to many locations.
These issues are given scrutiny under environmental justice and Title VI because public transportation providers’ need to deliver services in an equitable manner. Circular 4702.1, Title VI Program Guidelines for Urban Mass [Federal] Transportation Administration Recipients requires applicants, recipients, and subrecipients to consider, among other conditions, service standards, such as the number of seats on vehicles (the load factor); the types and amenities of vehicles assigned to routes; the interval of time between two vehicles traveling in the same direction (the headway); and the distance a person has to travel to get to the service (transit access). These standards may be tested by work-first requirements alone. And, do to numerous factors, including operating funding and policy constraints, public transportation agencies are not as flexible in reconfiguring routes as families may need.
In the Moving to Opportunity (MTO) demonstration program for public housing families, Rosenbaum (2001) found that an important drawback for these families related to isolation. The dependence of the families on public transportation to access goods, services, and jobs was difficult for those who relocated to suburbs. One resident said, of the Taylor site, “It’s deplorable living here, but what can you do if you’re working poor? If they would put new housing here, I would stay” (Rogal 1999).
The relocations also have impacts on children and schools. Transition has been problematic on both ends. In 1999, public schools provided busing and CTA gave bus passes to relocating students. Three children of one family who moved from the Robert Taylor Homes in 1999 were taking two buses to return to a familiar school (Rogal 2001).
The question is not whether public housing should be revitalized, but rather what are the impacts of revitalization on families? Without an understanding of the families’ social networks and the potential for cumulative or conflicting impacts brought on by other public policies, program goals may create additional hardships for already marginalized groups. As public transportation providers are required by guidance and policy to

C A S E S T U D I E S I N E N V I R O N M E N T A L J U S T I C E A N D P U B L I C T R A N S I T T I T L E V I R E P O R T I N G
42
consider service standards in relation to and the requirements of environmental justice and Title VI, the provider has to respond to the actions of other public agencies. In some instances, the other agencies do not coordinate with the transportation provider. An example is the enactment of the 1996 Public Responsibility and Work Opportunity Reconciliation Act and the effort expended by the U.S. Department of Health and Human Service, the U.S. Department of Labor, and the USDOT to encourage coordination and collaboration. A similar effort between the U.S. Department of Housing and Urban Development and USDOT may assist the relocation of public housing tenants and may be facilitated by Executive Order 13330 Human Service Transportation Coordination through the Interagency Transportation Coordinating Council on Access and Mobility.

C A S E S T U D I E S I N E N V I R O N M E N T A L J U S T I C E A N D P U B L I C T R A N S I T T I T L E V I R E P O R T I N G
43
Denver, Colorado
The history of public transportation in Denver goes back to 1867, with the Denver Horse Railroad Company. Between 1867 and 1896, the company evolved into the Denver City Railroad Company, other private rail providers also developed between this period and 1914. At that time, the Tramway and two of the other railways merged to form the Denver Tramway Company. The Denver Tramway Company provided transit operations until 1971 when it was sold to the city-county of Denver.
In 1969, the Colorado General Assembly enacted legislation which created the Regional Transportation District (RTD). RTD’s initial mission was to plan a regional transportation system. By 1973, citizens agreed to support a regional integrated public transportation system and RTD assumed operation of several systems including Denver Metro Transit. Throughout this period and into the future, emphasis has been placed on developing rapid transit alternatives to private automobile transportation. Implementation has included designated high occupancy vehicle (HOV) lanes and a light rail system in 1994. Studies continue to evaluate major transportation quarters in order to identify future rapid transit investments. This case study focuses on public involvement activities undertaken by RTD in the major investment study (MIS) process.
The RTD Study Area
RTD serves the seven-county area of Adam, Arapahoe, Boulder, Denver, Douglas, Jefferson, and Weld. The city-counties of Broomfield and Denver are included in this area. As shown in Table 7, nearly 33 percent of the estimated 2000 population belong to an ethnic or racial minority group. There is great variation between the counties and among and between racial and ethnic groups. Blacks are the largest racial group, followed by Asians. Hispanics are estimated to represent a greater percentage than the largest racial minority group. The percentage of persons age five years or older with disabilities is less than the national average except in Denver County. This is also true of the percentage of persons living below the federal poverty level. It should be noted that the seven-county area is less densely populated than the U.S. average of nearly 80 persons per square mile, with an average of about 65 persons per square mile. These statistics suggest that while the RTD service area may be less racially diverse, it is more ethnically diverse than the U. S. average. And, although there may be a smaller average of low-income individuals, these individuals may be concentrated within specific geographic areas. This is supported by the spatial distribution of minority households by census tracts shown in Figure 5. Minority households are clustered in the more densely populated Denver area. The overall lower population density of the study area, however, may present challenges for low-income and minority communities and others who rely on public transportation.

C A S E S T U D I E S I N E N V I R O N M E N T A L J U S T I C E A N D P U B L I C T R A N S I T T I T L E V I R E P O R T I N G
44
Table 7. Selected Characteristics of the Denver Study Area
SUBJECT ADAMS ARAPAHOE BOULDER DENVER DOUGLAS JEFFERSON WELD COLORADO U.S . Population, 2003 estimate 380,273 516,060 278,231 557,478 223,471 528,563 211,272 4,550,688 290,809,777 % Persons under 5 years old, 2000 8.4 6.9 6.0 6.8 9.6 6.3 7.8 6.9 6.8 % Persons 65 years old and over, 2000 7.8 8.6 7.8 11.3 4.2 9.6 9.0 9.7 12.4 % Black or African American persons, 2000 3.0 7.7 0.9 11.1 1.0 0.9 0.6 3.8 12.3 % American Native and Alaska Native, 2000 1.2 0.7 0.6 1.3 0.4 0.8 0.9 1.0 0.9 % Asian, 2000 3.2 3.9 3.1 2.8 2.5 2.3 0.8 2.2 3.6 % Native Hawaiian and Other Pacific Islander, 2000 0.1 0.1 0.1 0.1 0.1 0.1 0.1 0.1 0.1 % Some other race, 2000 11.7 4.5 4.7 15.6 1.4 3.2 13.3 7.2 5.5 % Hispanic, 2000 28.2 11.8 10.5 31.7 5.1 10.0 27.0 17.1 12.5 % Persons with a disability, age 5+, 2000 18.6 14.8 11.8 20.7 8.3 14.1 17.9 16.3 19.3 % Persons below poverty, 1999 8.9 5.8 9.5 14.3 2.1 5.2 12.5 9.3 12.4 Land area, 2000 (square miles) 1,192 803 742 153 840 772 3,992 103,718 3,537,438 Persons per square mile, 2000 305.3 607.6 392.3 3,616.80 209.2 682.6 45.3 41.5 79.6
(Sources: U.S. Census Bureau 2000 QuickFacts and SF 3)

C A S E S T U D I E S I N E N V I R O N M E N T A L J U S T I C E A N D P U B L I C T R A N S I T T I T L E V I R E P O R T I N G
45
Figure 5. Total Ethnic and Racial Minority Distribution of the Denver Study Area
As shown in Tables 7 and 8, Denver County is the most populous, with the largest black and Hispanic population subgroups. A greater percentage of persons living in families, however, lived in Jefferson County. Douglas County had a greater percentage of married households living with their children, however, more than 20 percent of the households were headed by female living with their children. Denver County also has the greatest percentage of persons living below the federal poverty level and households with public assistance income. Denver’s 1999 median household income was the lowest of the study area.

C A S E S T U D I E S I N E N V I R O N M E N T A L J U S T I C E A N D P U B L I C T R A N S I T T I T L E V I R E P O R T I N G
46
Overall, the study area had few vacant units, suggesting a “tight” housing market. Jefferson County had the largest percentage of owner-occupied housing units, while more than 45 percent of the Denver’s housing units were renter occupied. Nearly 14 percent of households in Denver did not own a vehicle, while the State and U.S. averages are 6.4 and 10.3 percent, respectively.
Table 8. Selected Socioeconomic Characteristics of the Denver Study Area
SUBJECT ADAMS ARAPAHOE BOULDER DENVER DOUGLAS JEFFERSON WELD
Total Population, 2003 380,273 516,060 278,231 557,478 223,471 528,563 211,272 % Black or African American persons, 2000 3 7.7 0.9 11.1 1 0.9 0.6 % American Native and Alaska Native, 2000 1.2 0.7 0.6 1.3 0.4 0.8 0.9 % Asian, 2000 3.2 3.9 3.1 2.8 2.5 2.3 0.8 % Native Hawaiian and Other Pacific Islander, 2000 0.1 0.1 0.1 0.1 0.1 0.1 0.1 % Some other race, 2000 11.7 4.5 4.7 15.6 1.4 3.2 13.3 % Hispanic, 2000 19.2 16.9 9.4 30.9 5.4 7.3 15.7 Families 92,691 126,468 69,546 120,305 50,061 141,601 45,535 Married Householders with Children 70,945 99,765 57,160 84,508 45,695 116,195 37,529 Female Householders with Children 14,669 19,131 8,622 25,716 3,083 17,921 5,529 % Persons Below Poverty Level 8.9 5.8 9.5 14.3 2.1 5.2 12.5 % Public Assistance Households 2.2 1.7 1.6 3.4 0.5 1.4 2.9 Median family income 52,517 63,875 70,572 48,195 88,482 67,310 49,569 Housing Units 132,594 196,835 119,900 251,435 63,333 212,488 66,194 Vacant 4,438 5,926 5,220 12,200 2,409 6,421 2,947 Owner Occupied 73,100 112,113 61,616 104,286 49,174 132,669 32,385 Renter Occupied 37,449 60,906 40,190 113,448 7,152 56,350 18,843 % Zero-vehicle households 5.9 5.6 5.4 13.9 1.4 4 5.6
(Sources: U.S. Census Bureau 2000 QuickFacts and SFs 1 and 3)
RTD’s Title VI Public Involvement Activities
One of the major studies currently underway at RTD is the Interstate 70 (I-70) Corridor, which is being conducted by FHWA, FTA, the Colorado Department of Transportation (CDOT), RTD, and the City and County of Denver. The proposed project includes improvements between I-70 and Pena Boulevard and a transit connection between downtown Denver and the Denver International Airport. The study currently is in the environmental impact assessment phase (PBS&J 2004a).
The public involvement activities in this study have been described as an “unprecedented” effort at community outreach. In addition to an extensive bilingual website, the process includes “…a variety of techniques that are being implemented for the first time in Colorado” (PBS&J 2004b). These techniques include:

C A S E S T U D I E S I N E N V I R O N M E N T A L J U S T I C E A N D P U B L I C T R A N S I T T I T L E V I R E P O R T I N G
47
Hiring outreach specialists from the neighborhoods; Conducting and requiring extensive training for anyone that will be interacting
with the public; Using flyers to notify residences and businesses of meetings; Disseminating information about community services in the neighborhoods; Conducting door-to-door outreach as a first contact in many neighborhoods; Holding block meetings for subsets of neighborhoods; Attending neighborhood association meetings and business meetings; Conducting neighborhood meetings and larger corridor-wide meetings; Providing translation at meetings; Providing child care at larger meetings; Catering meals for meetings; Developing issue working groups; Involving the media (small and large) in a proactive manner; Meeting frequently with local and state elected officials; Providing a variety of means to disseminate information, e.g., the Internet,
newsletters, meeting notices, minutes, etc. (Gonzalez-Estay 2004). RTD’s community outreach efforts are an example of how an agency can use information on the social characteristics of the potentially affected communities to develop a public involvement plan. The use of such information can encourage participation by the affected communities. Key elements of the outreach effort that may be unprecedented for other areas or studies include the use of specialists from the affected neighborhoods, required training, providing information about community services, providing child care and meals, and the development of issue working groups. The hiring of people from the neighborhood builds on trust that may exist between neighbors to disseminate information. Training on working with the public can be tailored to meet the needs of each neighborhood. Providing information about community services may help affected communities to identify resources that are beyond the scope of the transportation agencies to meet. These agencies also may become partners with the transportation agencies in the public involvement process. The provision of child care at meetings may help families to participate in the process. These activities are much more extensive than the public hearing required by the NEPA process, however, Gonzalez-Estay said, “Environmental justice may not be easy or pleasant for some, but the better the relationship at the beginning of the process the better the final process.” He also recommends that agencies take other steps to ensure better participation:

C A S E S T U D I E S I N E N V I R O N M E N T A L J U S T I C E A N D P U B L I C T R A N S I T T I T L E V I R E P O R T I N G
48
Include first-language Spanish speakers; Translate everything, i.e., documents, meetings, meeting notes, interviews, entire
web site(s), and Make them [the communities] feel part of the process.

C A S E S T U D I E S I N E N V I R O N M E N T A L J U S T I C E A N D P U B L I C T R A N S I T T I T L E V I R E P O R T I N G
49
Miami-Dade, Florida This case study brings in a number of issues discussed earlier and focuses on the three-county area of Broward, Miami-Dade, and Palm Beach. As with Atlanta, Denver, and Chicago, efforts have been in the Miami area to provide public transportation on a regional basis. Further, the State of Florida has been recognized as a bellwether state in terms of demographic changes (Louv 1999). Many of the demographic changes currently underway in Florida are concentrated in the South Florida study area and may be anticipated to occur in other urbanized areas. With this case study, we attempt to frame these changes and examine how public transportation agencies in the area are responding to the changes.
Public Transportation in South Florida and a Description of the Study Area
In 2003, the Florida Legislature created the South Florida Regional Transportation Authority (SFRTA), which subsumed the Tri-County Rail Authority. The new agency’s mission was to coordinate, develop, and implement a regional transportation system. SFRTA serves all three counties and coordinates with Broward County Transit (BCT), Miami-Dade Transit (MDT) , and Palm Tran. BCT serves approximately one-third of the county’s 1,200 square miles with 275 fixed route buses and 65 community buses. (A large part of Broward County is covered by the Everglades.) Express service also provided to the other two counties by one route (BCT n.d.). MDT is the largest public transportation provider in the State of Florida. The system was created as the Metropolitan Transit Authority in 1960 by the county commission. It currently has more than 100 bus routes, a 22-mile rail system, an automated rail system that provides transportation in the downtown area, paratransit services, and provides limited bus service to Broward and Monroe counties. Rail service to Broward and Palm Beach counties are provided by SFRTA (MDT 2005). Palm Tran began operating in 1971 and currently has more than 32 routes and provides paratransit service throughout Palm Beach County. The latter three providers are contacts for the State’s community transportation program in their respective counties.
The SFRTA Study Area
The 2000 Census estimate for the three-county area was more than 5 million persons. Table 9 shows that blacks were overrepresented as a percentage of the total population compared to the State average in Broward and Miami-Dade. (Please note, the Census Bureau uses “Z” to indicate that the estimate for the percentage of persons is greater than zero, but less than .05 percent.) Persons of Hispanic or Latino origin exceed the State and U.S. averages in all three counties. Combined, ethnic and racial minorities comprised the majority of the population in the three counties.
The percentage of persons with disabilities in the three counties and Florida slightly exceeds the national average, with the largest concentration in Miami-Dade. Broward

C A S E S T U D I E S I N E N V I R O N M E N T A L J U S T I C E A N D P U B L I C T R A N S I T T I T L E V I R E P O R T I N G
50
and Palm Beach counties appear to be slightly more affluent when measured by the percent of persons living below the poverty level. Both had lower percentages than the State and national averages. Miami-Dade had an average that was 44 percent greater than the State average.
The three counties are significantly more densely populated than the State, which is more densely populated than the U.S. As can be been in Figure 6, the population is concentrated along the east coast of the study area and in the three largest cities. It also should be noted that the study area contains American Indian areas.
Table 9. Selected Characteristics of the Miami Study Area
SUBJECT BROWARD COUNTY
MIAMI -DADE
PALM BEACH
COUNTY FLORIDA U.S.
Population, 2003 estimate 1,731,347 2,294,651 1,216,282 17,019,068 290,809,777% Persons under 5 years old, 2000 6.3 6.5 5.6 5.9 6.8 % Persons 65 years old and over, 2000 16.1 13.3 23.2 17.6 12.4 % Black or African American persons, 2000 20.5 20.3 13.8 14.6 12.3 % American Native and Alaska Native, 2000 0.2 0.2 0.2 0.3 0.9 % Asian, 2000 2.3 1.4 1.5 1.7 3.6 % Native Hawaiian and Other Pacific Islander, 2000 0.1 Z 0.1 0.1 0.1 % Some other race, 2000 3.0 4.6 3.0 3.0 5.5 % Hispanic, 2000 58.0 20.7 70.6 16.8 12.5 % Persons with a disability, age 5+, 2000 20.6 22.8 21.2 22.2 19.3 % Persons below poverty, 1999 11.5 18.0 9.9 12.5 12.4 Land area, 2000 (square miles) 1,205 1946 1,974 53,927 3,537,438 Persons per square mile, 2000 1,346.5 1157.9 573.0 296.40 79.6
(Sources: U.S. Census Bureau 2000 QuickFacts and SFs 1 and 3)

C A S E S T U D I E S I N E N V I R O N M E N T A L J U S T I C E A N D P U B L I C T R A N S I T T I T L E V I R E P O R T I N G
51
Figure 6. Total Ethnic and Racial Minority Distribution of the Miami Study Area
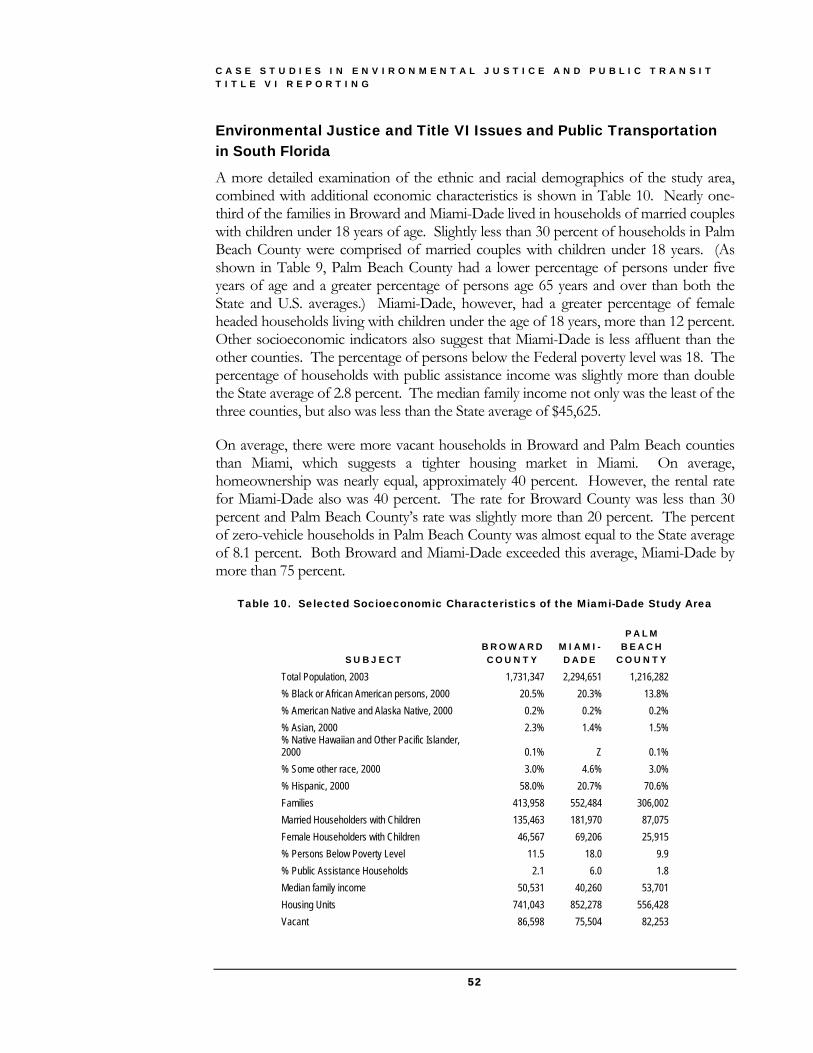
C A S E S T U D I E S I N E N V I R O N M E N T A L J U S T I C E A N D P U B L I C T R A N S I T T I T L E V I R E P O R T I N G
52
Environmental Justice and Title VI Issues and Public Transportation in South Florida
A more detailed examination of the ethnic and racial demographics of the study area, combined with additional economic characteristics is shown in Table 10. Nearly one-third of the families in Broward and Miami-Dade lived in households of married couples with children under 18 years of age. Slightly less than 30 percent of households in Palm Beach County were comprised of married couples with children under 18 years. (As shown in Table 9, Palm Beach County had a lower percentage of persons under five years of age and a greater percentage of persons age 65 years and over than both the State and U.S. averages.) Miami-Dade, however, had a greater percentage of female headed households living with children under the age of 18 years, more than 12 percent. Other socioeconomic indicators also suggest that Miami-Dade is less affluent than the other counties. The percentage of persons below the Federal poverty level was 18. The percentage of households with public assistance income was slightly more than double the State average of 2.8 percent. The median family income not only was the least of the three counties, but also was less than the State average of $45,625.
On average, there were more vacant households in Broward and Palm Beach counties than Miami, which suggests a tighter housing market in Miami. On average, homeownership was nearly equal, approximately 40 percent. However, the rental rate for Miami-Dade also was 40 percent. The rate for Broward County was less than 30 percent and Palm Beach County’s rate was slightly more than 20 percent. The percent of zero-vehicle households in Palm Beach County was almost equal to the State average of 8.1 percent. Both Broward and Miami-Dade exceeded this average, Miami-Dade by more than 75 percent.
Table 10. Selected Socioeconomic Characteristics of the Miami-Dade Study Area
SUBJECT BROWARD COUNTY
MIAMI -DADE
PALM BEACH
COUNTY
Total Population, 2003 1,731,347 2,294,651 1,216,282 % Black or African American persons, 2000 20.5% 20.3% 13.8% % American Native and Alaska Native, 2000 0.2% 0.2% 0.2% % Asian, 2000 2.3% 1.4% 1.5% % Native Hawaiian and Other Pacific Islander, 2000 0.1% Z 0.1% % Some other race, 2000 3.0% 4.6% 3.0% % Hispanic, 2000 58.0% 20.7% 70.6% Families 413,958 552,484 306,002 Married Householders with Children 135,463 181,970 87,075 Female Householders with Children 46,567 69,206 25,915 % Persons Below Poverty Level 11.5 18.0 9.9 % Public Assistance Households 2.1 6.0 1.8 Median family income 50,531 40,260 53,701 Housing Units 741,043 852,278 556,428 Vacant 86,598 75,504 82,253

C A S E S T U D I E S I N E N V I R O N M E N T A L J U S T I C E A N D P U B L I C T R A N S I T T I T L E V I R E P O R T I N G
53
SUBJECT BROWARD COUNTY
MIAMI -DADE
PALM BEACH
COUNTY
Owner Occupied 298,725 335,815 243,413 Renter Occupied 199,565 326,833 119,961 % Zero-vehicle households 9.4 14.3 7.9
Combined, this study area serves as a summary case. The presence of American Indian lands raises issues of government-to-government relations regarding public transportation access. In addition, federally-recognized tribes are eligible to participate in the formula grant program to provide public transportation on tribal lands.
Although the South Florida region generally is not considered part of the southern “Black Belt”, blacks are the largest racial minority group and are overrepresented when compared to State and national averages. Persons of Hispanic or Latino origin, which may include persons of any race comprised more than 70 percent of the population in Palm Beach County.
As in Chicago and other areas in the U.S., public housing residents in the region also are experiencing relocation due to revitalization and self-sufficiency programs. While some areas of the region have more vacant housing than others, the availability of affordable housing for low-income families has to be considered in light of increasing housing costs throughout the State (Umberger 2005).
There also are the general issues of residential segregation. Although racial and ethnic minorities comprise the majority of the population in two of the study area counties, there is some suggestion of concentration of ethnic and racial minorities. This may be a combined function of ethnicity or race and income.
Together these statistics suggest that the environmental justice and Title VI issues may be multifaceted. The region is experiencing rapid suburban growth away from central cities. Although a regional transportation agency has been developed, the agency is relatively new, and efforts to provide a seamless regional system beyond SFRTA are in the development stage.
Transportation Agency Activities to Address Environmental Justice and Title VI Concerns
One of the environmental justice/Title VI focusing events was the proposed improvements of the East-West corridor (State Road 836) in the late 1990s. The reaction to the proposal from the historically black Overtown community in Miami was one of distrust. Transportation planners learned from this experience and took several steps within the agencies to address concerns of low-income and minority communities in a more proactive manner.

C A S E S T U D I E S I N E N V I R O N M E N T A L J U S T I C E A N D P U B L I C T R A N S I T T I T L E V I R E P O R T I N G
54
An important element for Miami-Dade has been dedicated funding for transportation, including public transit. (Broward County residents recently approved dedicated transportation funding. This local option is available to other Florida areas.) Miami-Dade’s funding provides grantees for additional buses, in addition to rail projects. The funding strategy provides the opportunity to expand bus services without competition.
Dedicated funding is only part of the solution. The most critical area cited by agency representatives was the need to “involve the public as early as possible.” Communication with the public throughout the process also was mentioned as an important component. This communication is important in order for the agencies to understand the impacts. As one resource person said, the public can provide meaningful input at any stage of the project.
Although each county is served by a separate metropolitan planning organization (MPO), the three agencies also attempt to address public transportation issues on a regional level. This includes proactive public involvement in the planning phase and providing information and other resources to the public transportation providers. The Miami-Dade County MPO provides an online interactive, web-based geographic information system (GIS) that can be used by local agencies and the public. One application of the tool is the identification of affected populations in order to tailor public involvement strategies.
Many of the strategies underway in the region are relatively new and have yet to be tested by housing, economic, growth, and other challenges. As in the other case examples presented, the basic concern is to gain a better understanding of the demographic and economic conditions of affected populations.

C A S E S T U D I E S I N E N V I R O N M E N T A L J U S T I C E A N D P U B L I C T R A N S I T T I T L E V I R E P O R T I N G
55
Suggested Guidance
everal of the resources identified in the literature review provide recommendations, guidance, and policy suggestions that may be beneficial to transportation agencies when addressing civil rights issues, including environmental justice. Many of the recommendations may be easily
implemented, such as improving transportation agencies public involvement and outreach plans. Others require more extensive or long term efforts, such as changes in state constitutions to allow expenditures for public transit and changes in land use policies.
As discussed above, providing access to the decisionmaking processes appears to be critical. Access is suggested at all levels, from the MPO long range planning process through service delivery or maintenance. Public involvement is recommended as a key means of providing access; however, the literature suggests that low-income communities and minority communities may be underserved in the MPO process. Increased outreach to and representation of the communities is recommended.
Likewise, the impacts of the siting of transportation facilities may be better understood by increased public involvement of the affected communities. Many authors point out that because the siting of facilities include decisions about large capital investments, the importance of including low-income and minority communities is heightened. The goals include ensuring equitable distribution of benefits and identifying and avoiding decisions that may result in disproportionately high or adverse impacts.
While public transportation’s role in the provision of government services or access may extend beyond the scope of transportation agencies, these agencies may benefit from greater coordination with other government agencies. Grimshaw cited “fragmented governmental authority [as a] culprit” (1994). The transportation agency may, however, be a factor. In these instances, it is the decisions made by the transportation agency to provide access, such as extending the length of routes, capacity, frequency, amenities, etc.
Equity in transportation investments also is closely associated with access to decisionmaking. Like facility citing, the financial implications of these investments exaggerate the equity issues. Outreach early, e.g., in the planning process, and often throughout development and implementation to assess the impacts is recommended.
In addition to access to the decisionmaking process, another core area is land use and relationship to transportation. Again, the recommendations found in the literature suggest that influence on land use decisions may be beyond the scope of transportation agencies and may require more long-term strategies. The role of transportation agencies
S

C A S E S T U D I E S I N E N V I R O N M E N T A L J U S T I C E A N D P U B L I C T R A N S I T T I T L E V I R E P O R T I N G
56
may lie in coordination with local agencies where decisions are made and ensuring in the short term that transportation services provide access. Sanchez et al. suggest that equity principles be incorporated into smart growth initiatives (2003: 40).
An overarching consideration of these issues is found in “A Summary of the ‘Human Environment’ Requirements of the National Environmental Policy Act: Implications for Environmental Justice.” Calloway and Ferguson state, “Among other things, NEPA requires a consideration of the ‘human environment’—a concept which is critical to an evaluation of whether people of color are being disproportionately subjected to adverse public and private environmental decisionmaking” (1997: 51). Although many transportation actions are not major federal actions, they provide the opportunity to consider the impacts–social impacts on the human environment–where civil rights and environmental justice issues may be addressed. Community Impact Assessment: A Quick Reference for Transportation and the Transportation Research Board (TRB) Community Impact Assessment Subcommittee suggest that beyond the NEPA or the major federal action process, assessment of impacts on communities is “the right thing to do.”
A Brief Environmental Justice Primer for Transit Agencies As discussed above, the format for the case studies included the discussion of demographic characteristics of the study area, borrowing from the format of the FTA Circular 4702.1 Title VI Program Guidelines for Urban Mass Transportation Administration Recipients, Program-Specific Requirements. The data collection and reporting requirements contained in this section of the circular provide a resource to public transit providers to identify minority communities and analyze service standards and policies and any proposed changes in these areas. There have been several legislative and policy changes since this guidance was written, specifically the Americans with Disabilities Act, the Executive Orders related to environmental justice, which includes consideration of impacts on low-income communities; human service transportation coordination; and English language proficiency. Building on the program-specific requirements in the Circular, public transit agencies can incorporate these populations into their population/racial distribution charts. For example, the number and percent of persons with disabilities can be added as a column in the Population/Racial Distribution Chart by census tract or traffic analysis zone identifier. The population overlays or maps also may be created for individual subgroups of the population, such as language spoken at home, to identify concentrations of non-English speakers. These program-specific requirements form the basis of the demographic and service profiles of the area. The development and analysis of this profile is the first step in gaining a better understanding of potential environmental justice impacts.

C A S E S T U D I E S I N E N V I R O N M E N T A L J U S T I C E A N D P U B L I C T R A N S I T T I T L E V I R E P O R T I N G
57
Analyzing Service Standards and Policies
As outlined in FTA Circular 4702.1, FTA requires transit agencies to develop policies and standards for, at least, five indicators, vehicle load, vehicle assignment, vehicle headway, distribution of amenities, and access. In addition to the triennial review, transportation agencies should review the impacts of proposed actions or decisions in relation to these indicators. Proposed actions may include, but are not limited to:
Changes in the geographic service area; Changes in travel times and reliability; Changes in frequency or hours of service; Changes in patronage or demand; Changes in transit mode; Changes in access or circulation; or Increased traffic around bus stops or stations.
This analysis usually takes place on a scale smaller than the entire service area, providing information at the community level and can contribute to Title VI compliance monitoring efforts. The FTA Office of Civil Rights offered the following guidance (McCrea 2004).
When Planning New Systems, Try To Avoid Service Cuts Of Bus Routes, If Possible
The goal is to avoid the “image” of making cuts from one type of service to benefit another type of service. Image is everything: Because the majority of bus riders in urban areas tend to be ethnic or racial minorities or persons with low incomes, and although the cuts may be only for financial reasons, it could create unintentionally adverse impacts and burdens on that segment of the population.
Turning Bus Routes into “Feeders Service”
Consideration should be given to the effects to neighborhood bus service by turning routes into feeder service for rail systems. Questions to ask are, “ Will travel times for passengers increase?” “How many transfers will passengers need to make to reach their destination before feeder service is implemented and after?”
Location of Rail Rights of Way and Stations
On proposed rail projects, consideration should be given to the provision of service to ethnic or racial minority and low-income neighborhoods. Efforts should be made to ensure that route alignments are thoroughly investigated and justified. Other considerations include whether stations will be “at grade” or underground, the number of at grade stations in these areas versus the number in non-minority or more affluent areas, and ensuring that route alignments have “air tight” justifications. The goal is to avoid any appearance of impropriety.

C A S E S T U D I E S I N E N V I R O N M E N T A L J U S T I C E A N D P U B L I C T R A N S I T T I T L E V I R E P O R T I N G
58
Concerns for Rail Properties – Maintenance and Amenities of Facilities
Ensure the maintenance of all rail facilities are consistent throughout the system. Some examples of issues or allegations that have been made to FTA include:
Stations in minority or low-income neighborhoods are not cleaned on a consistent basis.
Stations in minority or low-income areas are poorly lit, do not have covered platforms and walkways, informational displays, and atmospheric comforts such as art, unlike other stations.
Assessments
FTA Circular 4702.1 requires transit providers to develop procedures and guidelines for monitoring compliance and to conduct periodic compliance assessments. As suggested above, proposed changes also may trigger assessments. FTA also advises that evaluation should be conducted at the planning and programming stage and at the system level to ensure that changes and improvements are distributed equitably. (In consideration of environmental justice issues concern is given not only to disproportionately high or adverse impacts, but also the distribution of benefits.)
Other Environmental Justice or Title VI Considerations
In addition to changes in service features, discussed above, the remaining considerations outlined in the Circular generally relate to public involvement activities. These include information dissemination, minority [and low-income persons] on decisionmaking committees, and the provision of multilingual facilities. Community outreach and public involvement provide opportunities for transportation providers to not only disseminate information, but also to collect information from the affected communities on potential impacts. Again, the FTA Office of Civil Rights has suggested the following practices to achieve effective public involvement. Begin at earliest possible stages--before any ideas are fixed in concrete. Consult and develop partnerships with neighborhood or Community Advisory Groups. Work with these groups to understand the cultural or language dynamics and communication styles of the affected communities. Develop publications, newsletters, flyers, or other appropriate media relative to the project. Have frequent information meetings throughout the entire process. Implement telephone hot lines. Set up storefront information centers in the affected communities. Attend and set up booths at community functions such as carnivals and festivals. As suggested in the Denver case study, human service agencies also may be good partners. These agencies provide services to minority and low-income communities in many areas. Work with these agencies to assist in information dissemination. The agencies also may have expertise in identifying cultural or language dynamics.

C A S E S T U D I E S I N E N V I R O N M E N T A L J U S T I C E A N D P U B L I C T R A N S I T T I T L E V I R E P O R T I N G
59
Summary The FTA Title VI Circular 4702.1 has been available since 1988. While we suggest the expansion of considerations to include subgroups of the population that have been recognized by statute or policy since its inception, the basic requirements and assessment process are incorporated in the Circular. What we are proposing are new or more extensive applications. Specifically, using the demographic and service profile maps and charts to identify communities that may be affected by a proposed action, using the information to partner with the community and others to understand the potential impacts, and working with the community to take corrective or remedial action to ensure equitable treatment.
C A S E S T U D I E S I N E N V I R O N M E N T A L J U S T I C E A N D P U B L I C T R A N S I T T I T L E V I R E P O R T I N G
60
Endnotes 1 There are other factors that affect the share of funds for low-income and rural communities. These include state prohibitions on the use of gas tax funds for projects other than roads and the structure of MPO boards, which in many areas provides greater power to suburban communities. It also should be noted that while persons with low household incomes use public transportation at a higher rate than others, these households make the majority of their trips by automobile (79%), thus contributing to the gas tax (Pucher and Renne 2003.)
2 The Census Bureau uses the racial classifications issued by the Office of Management and Budget (OMB) in 1997, which require five minimum categories (white, black or African American, American Indian or Alaska Native, Asian, and Native Hawaiian or Other Pacific Islander).
3 Native Hawaiians (and other Pacific Islanders) are considered by the Census as a separate racial group and are not included in the population totals. These homelands are shown for illustrative purposes only.
4 This includes persons who reported race as “American Indian” and persons who indicated “American Indian” in combination with some other race. This option was new to the 2000 Census.
5 Massey and Denton measure segregation as the percentage of blacks who would need to move to achieve integration or an even racial residential configuration, one that reflects the racial composition of the metropolitan area. Isolation is a “measure of the extent to which blacks live among…other blacks…”(1993:63,65)
6 According to the Environmental Justice Resource Center (EJRC) at Clark Atlanta University, “…race blocked MARTA from becoming a five-county regional system. For many suburban whites, MARTA stood for ‘Moving Africans Rapidly Through Atlanta.’ Several suburban Atlanta counties have set up their own ‘separate and unequal’ bus systems, some with the assistance [from] GRTA (2004).
7 On average, women earned approximately 80 percent of men’s earnings. Black and Hispanic or Latino women earn less than their white and Asian counter parts (Bureau of Labor Statistics 2004).
C A S E S T U D I E S I N E N V I R O N M E N T A L J U S T I C E A N D P U B L I C T R A N S I T T I T L E V I R E P O R T I N G
61
References Almanza, Susana and Raul Alvarez 1994 The Impacts of Siting Transportation Facilities in Low-Income
Communities & Communities of Color. Transportation: Environmental Justice and Social Equity Conference Proceedings, Chicago, 15-18 November. Electronic document, http://www.fta.dot.gov/library/policy/envir-just/backcf.htm#Impacts.
1997 Empowering Communities of Color: Lessons from Austin. In Just Transportation: Dismantling Race & Class Barriers to Mobility. Bullard, Robert D. and Glenn S. Johnson, eds. Pp. 110-121. Gabriola Island, BC: New Society Publishers.
Bennett, Lerone Jr. 1993 Before the Mayflower: A History of Black America. New York:
Penguin Books. Blumenberg, Evelyn and Margy Waller 2003 The Long Journey to Work: A Federal Transportation Policy for
Working Families. Series on Transportation Reform. Washington, DC: The Brookings Institution, Center on Urban and Metropolitan Policy.
Brodkin, Karen 1998 Race, Class, and Gender: The Metaorganization of American
Capitalism. Transforming Anthropology, 7(2), pp. 46-57. Broward County Transit n.d. General Information. Electronic document,
http://www.co.broward.fl.us/bct/bctinfo.htm. Bullard, Robert D. 1990 Dumping in Dixie: Race, Class, and Environmental Quality. Boulder: Westview Press. 1997 Epilogue. In Just Transportation: Dismantling Race & Class Barriers to
Mobility. Bullard, Robert D. and Glenn S. Johnson, eds. Pp. 173-177. Gabriola Island, BC: New Society Publishers.
Bullard, Robert D., and Glenn S. Johnson 1997 Introduction. In Just Transportation: Dismantling Race & Class
Barriers to Mobility. Bullard, Robert D. and Glenn S. Johnson, eds. Pp. 7-21. Gabriola Island, BC: New Society Publishers.

C A S E S T U D I E S I N E N V I R O N M E N T A L J U S T I C E A N D P U B L I C T R A N S I T T I T L E V I R E P O R T I N G
62
Bullard, Robert D., and Glenn S. Johnson, eds. 1997 Just Transportation: Dismantling Race & Class Barriers to Mobility.
Gabriola Island, BC: New Society Publishers. Bullard, Robert D., Glenn S. Johnson, and Angel O. Torres 2000 Dismantling Transportation Apartheid Through Environmental Justice.
Progress: Surface Transportation Policy Project X(1):4-5. Calloway, Cheryl A. and Karen L. Ferguson 1997 A Summary of the “Human Environment” Requirements of the National Environmental Policy Act: Implications for Environmental Justice. Paper presented at the Symposium IV on African-American Mobility Issues, Tampa, 30 April - 2 May. Electronic document, http://www.cutr.usf.edu/pubs/AAMS_IV_Proceedings.PDF. Chen, Don 1994 Social Equity, Transportation, Environment, Land Use, and Economic Development: The Livable Community. Transportation: Environmental Justice and Social Equity Conference Proceedings, Chicago, 15-18 November. Electronic document, http://www.fta.dot.gov/library/policy/envir-just/backcf.htm#Social. Chicago Housing Authority 1962 Chicago Housing Authority Times. April. 2003a Robert Taylor Homes. Electronic document,
http://www.thecha.org/housingdev/robert_taylor.html. 2003b Understanding Relocation. Electronic document, http://www.thecha.org/relocation/overview.html. Community Transportation Association of America n.d. a. Tribal Transportation. Electronic document,
http://www.ctaa.org/ntrc/is_nativeamerican.asp. n.d.b. American Indian Transportation: Issues and Successful Models.
Electronic document, http://www.ctaa.org/ntrc/rtap/pubs/ta/am-ind.asp. n.d.c. Tribal Transportation: Current Practices. Electronic document, http://www.ctaa.org/ntrc/tribaltransportationpractices.asp. Corless, James and Luis Arteaga 2000 Pedestrian Safety and Social Justice. In Progress: Surface Transportation Policy Project. X(1):8.

C A S E S T U D I E S I N E N V I R O N M E N T A L J U S T I C E A N D P U B L I C T R A N S I T T I T L E V I R E P O R T I N G
63
Crockett, Emmett J., Jr. 1996 If You Build It, Will They Come?: Extending Rail Service to Lower Income Communities. Paper presented at the Symposium III on African- American Mobility Issues, Tampa, 14-16 April. Davis, Judy, Ross Roberts, Samuel Seskin, and John Pucher 1998 Consequences of the Interstate Highway System for Transit: Summary
of Findings. Report 42. Washington, DC: Transportation Research Board, National Research Council. Electronic document, http://gulliver.trb.org/publications/tcrp/tcrp_rpt_42.pdf.
Dittmar, Hank and Don Chen 1994 Equity in Transportation Investments. Transportation: Environmental
Justice and Social Equity Conference Proceedings, Chicago, 15-18 November . Electronic document, http://www.fta.dot.gov/library/policy/envir-just/backcf.htm#Equity.
England-Joseph, Judy A. 1997 Welfare Reform: Issues and Possible Implications for HUD’s Programs
and Tenants. Electronic document, http://archive.gao.gov/papr2pdf/158908.pdf.
Ernst, Michelle 2004 Mean Streets 2004. How Far Have We Come? Surface Transportation
Policy Project, electronic document, http://www.transact.org/library/reports_html/ms2004/pdf/Final_Mean_Streets_2004_4.pdf.
Federal Register 2003 Part III. Department of the Interior, Bureau of Indian Affairs. Indian
Entities Recognized and Eligible to Receive Services from the United States Bureau of Indian Affairs. 68(234):68180-68184.
First National People of Color Environmental Leadership Summit Delegates 1991 Principles of Environmental Justice. Electronic document,
http://www.ejnet.org/ej/principles.html. Fisher, Maria Ramirez 1994 On the Road From Environmental Racism to Environmental Justice.
Villanova Environmental Law Journal. Electronic document, http://www.ejrc.cau.edu/artonroadertoej.htm.

C A S E S T U D I E S I N E N V I R O N M E N T A L J U S T I C E A N D P U B L I C T R A N S I T T I T L E V I R E P O R T I N G
64
Frey, William H. and Dowell Meyers and the Social Science Data Analysis Network (SSDAN) n.d. Atlanta, GA. SEGREGATION: DISSIMILARITY INDICES.
Electronic document, http://www.censusscope.org/us/m520/chart_dissimilarity.html.
Galloway, James W. (Rick) 2005 Transportation Planning by the “Average Tribe” in Washington State. Intertribal Transportation Association Newsletter. Spring. Garcia, Robert and Michael Replogle 2000 Transportation Equity and Environmental Justice. Progress: Surface
Transportation Policy Project X(1):10-11. Geertz, Clifford 1993 The Interpretation of Culture. New York: Basic Books. Gilbert, Neil 1995 Welfare Justice Restoring Social Equity. New Haven: Yale University
Press. Gonzalez-Estay, Manolo 2004 Environmental Justice (EJ) in Denver, CO.: A Summary. Presentation
at the APTA Bus & Paratransit Conference/Bus Rapid Transit Conference, Denver, 3 May.
Grimshaw, Jacky 1994 Transportation and the Provision of Government Services.
Transportation: Environmental Justice and Social Equity Conference Proceedings, Chicago, 15-18 November . Electronic document, http://www.fta.dot.gov/library/policy/envirjust/backcf.htm#Transportation.
Heiman, Michael 1996 Race, Waste, and Class. Antipode. 28(2):111-216. Helling, Amy and Robert Holbrook 2003 Census Report: The 2000 Journey to Work in the Atlanta Region.
Census Issue: 6. Electronic document, http://atlantacensus2000.gsu.edu/reports/report6/report6.pdf.
Henson, Daniel P., III 1999 Crafting a New Community. Places 12(3): 66-67.

C A S E S T U D I E S I N E N V I R O N M E N T A L J U S T I C E A N D P U B L I C T R A N S I T T I T L E V I R E P O R T I N G
65
Hill, Eric T. and Beverly G. Ward 1996 African-Americans, Other Minorities, and Women in the Transit
Industry. Tampa: National Urban Transit Institute; Department of Transportation, Washington, DC: Office of Research and Special Programs.
Jeffress, Philip W. 1970 The Negro in the Urban Transit Industry. The Racial Policies of
American Industry, Report No. 18. Philadelphia: Industrial Research Unit, Department of Industry, Wharton School of Finance, University of Pennsylvania.
Kaplan, David H. and Steven R. Holloway 1998 Segregation in Cities. Washington, DC: Association of American
Geographers. Kolm, Serge-Christophe 1997 Justice and Equity. Harold F. See, trans. Cambridge, MA: The MIT
Press. Lacombe, Anna 1998 Welfare Reform and Access to Jobs in Boston. Washington, DC: U.S.
Department of Transportation, Bureau of Transportation Statistics. Electronic document, http://www.bts.gov/programs/transtu/welfare.pdf.
Leavitt, Helen 1970 Superhighway--Superhoax. Garden City, NY: Doubleday and
Company, Inc. Leete, Laura and Neil Bania 1995 Assessment of the Geographic Distribution and Skill Requirements of
Jobs in the Cleveland-Akron Metropolitan Area. WP-95-04. Cleveland: Center on Urban Poverty and Social Change, Mandel School of Applied Social Sciences, Case Western Reserve. Electronic document, http://povertycenter.cwru.edu/Assess.exe.
Leete, Laura, Neil Bania, and Claudia Coulton 1998 Welfare Reform: Using Local Labor Market Data for Policy and
Analysis and Program Planning. BR-98-04. Cleveland: Center on Urban Poverty and Social Change, Mandel School of Applied Social Sciences, Case Western Reserve. Electronic document, http://povertycenter.cwru.edu/br9804welf.PDF.
Lewis, Tom 1997 Divided Highways: Building the Interstate Highways, Transforming
American Life. New York: Penguin Books.

C A S E S T U D I E S I N E N V I R O N M E N T A L J U S T I C E A N D P U B L I C T R A N S I T T I T L E V I R E P O R T I N G
66
Louv, Richard 1999 The Coming Teen Wave. Connect for Kids. Electronic document,
http://www.connectforkids.org/node/36. Manheim, Marvin L. 1979 Fundamentals of Transportation Systems Analysis, Volume 1 Basic
Concepts. Cambridge, MA: Massachusetts Institute of Technology. Mann, Eric 1997 Confronting Transit Racism in Los Angeles. In Just Transportation:
Dismantling Race & Class Barriers to Mobility. Bullard, Robert D. and Glenn S. Johnson, eds. Pp. 68-83. Gabriola Island, BC: New Society Publishers.
Massey, Douglas S. and Nancy A. Denton 1993 American Apartheid: Segregation and the Making of the Underclass.
Cambridge, MA: Harvard University Press. McCrea, Sandra 2004 Title VI and Environmental Justice. Presentation at APTA 2004 Rail
Transit Conference, June. McGuckin, Nancy, and Nanda Srinivasan 2003 Journey to Work Trends in the United States and its Major
Metropolitan Areas 1960 – 2000. Publication No. FHWA -EP-03-058. Electronic document, http://www.fhwa.dot.gov/ctpp/jtw/index.htm.
Miami-Dade Transit 2005 Transit. About Us. Electronic document,
http://www.miamidade.gov/transit/aboutus_transit.asp. Mizuno, Mutsumi 1994 Justice in Decision Making. Transportation: Environmental Justice and
Social Equity Conference Proceedings, Chicago, 15-18 November . Electronic document, http://www.fta.dot.gov/library/policy/envir-just/backcf.htm#Justice.
National Advisory Commission on Civil Disorders 1968 The Kerner Report: What Happened? Why Did It Happen? What Can
Be Done? New York: The New York Times.

C A S E S T U D I E S I N E N V I R O N M E N T A L J U S T I C E A N D P U B L I C T R A N S I T T I T L E V I R E P O R T I N G
67
Oedel, David G. 1997 The Legacy Jim Crow in Macon, Georgia. In Just Transportation:
Dismantling Race and Class Barriers in Mobility. Gabriola Island, BC : New Society Publishers.
2000 The Long March to Transportation. Transportation Policy Project X(1):6.
Ogunwole, Stella U. 2002 The American Indian and Alaska Native Population: 2000. Census
2000 Brief. C2KBR/01-15. Electronic document, http://www.census.gov/prod/2002pubs/c2kbr01-15.pdf.
Pettit, Becky and Sara McLanahan 2001 Social Dimensions of Moving to Opportunity. JCPR Newsletter 15(1):7-
12. Electronic document, http://www.jcpr.org/newsletters/vol5_no1/index.html, accessed 29 July 2004.
Post, Buckley, Schuh & Jernigan, Inc. 2004a I-70 East Corridor Environmental Impact Statement. FAQs Project
Overview. Electronic document, http://www.i-70eastcorridor.com/faqs.html.
2004b I-70 East Corridor Environmental Impact Statement. Community Outreach. Electronic document, http://www.i-70eastcorridor.com/communty_outr.html.
Pucher, John and John L. Renne 2003 Socioeconomics of Urban Travel: Evidence from the 2001 NHTS. Transportation Quarterly, 57(3):49–77. Rich, Michael 1997 The Reality of Welfare Reform Employment Prospects in Metropolitan
Atlanta. Georgia Academy Journal. Summer. Rogal, Brian J. 1999 Section 8 Questioned: Survey Casts Doubt on CHA Plans. The Chicago Reporter, April. Electronic document, http://chicagoreporter.com/1999/06-99/0699cha.htm. 2001 CHA Parents Seek Stability as Housing Falls. The Chicago Reporter.
April. Electronic document, http://www.chicagoreporter.com/2001/4-2001/school/school1.htm

C A S E S T U D I E S I N E N V I R O N M E N T A L J U S T I C E A N D P U B L I C T R A N S I T T I T L E V I R E P O R T I N G
68
Rosenbaum, Emily 2001 The Social Context of New Neighborhoods among MTO Chicago
Families. JCPR Newsletter 15(1):23-29. Electronic document, http://www.jcpr.org/newsletters/vol5_no1/articles.html, accessed 29 July
2004. Rosenbaum, Emily and Laura Harris 2001 Low-Income Families in Their New Neighborhoods: The Short-Term
Effects of Moving from Chicago’s Public Housing. Journal of Family Issues 22(2):183-210.
Rosenbaum, James 1995 Changing the Geography of Opportunity by Expanding Residential
Choice: Lessons from the Gautreaux Program. Housing Policy Debate 6(1):231-269.
Sanchez, Thomas W., Rich Stolz, and Jacinta S. Ma 2003 Moving to Equity: Addressing Inequitable Effects of Transportation
Policies on Minorities. A Joint Report of the Center for Community Change and the Civil Rights Project, Harvard University. Electronic document, http://www.civilrightsproject.harvard.edu/research/transportation/MovingtoEquity.pdf.
Schachter, Jason P. 2003 Migration by Race and Hispanic Origin: 1995 to 2000. Census 2000
Special Reports. CENSR-13. Electronic document, http://www.census.gov/prod/2003pubs/censr-13.pdf.
Social Science Data Analysis Network (SSDAN) n.d. Metros Ranked by Rate of Population Growth, 1990-2000. Electronic
document, www.CensusScope.org. Stolz, Rich 2002 Transportation Equity and Environmental Justice. Planners Network.
Electronic document, http://www.plannersnetwork.org/htm/pub/archives/154/stolz.htm.
Switzer, Jacqueline Vaughn 2004 Environmental Politics: Domestic and Global Dimensions, 4th ed..
Belmont, CA: Wadsworth/Thompson Learning.

C A S E S T U D I E S I N E N V I R O N M E N T A L J U S T I C E A N D P U B L I C T R A N S I T T I T L E V I R E P O R T I N G
69
Surface Transportation Policy Project and Center for Neighborhood Technology 1994 Transportation: Environmental Justice and Social Equity Conference
Proceedings, Chicago, 15-18 November . Electronic document, http://www.fta.dot.gov/library/policy/envir-just/indexcf.htm.
U.S. Bureau of Labor Statistics 2003 Highlights of Women’s Earnings in 2002: Report 972. U.S.
Department of Labor. Electronic document, http://www.bls.gov/cps/cpswom2002.pdf.
U.S. Census Bureau 2000a Table QT-P17. Ability to Speak English: 2000. Electronic document,
http://factfinder.census.gov/servlet/QTTable?_bm=y&-qr_name=DEC_2000_SF3_U_QTP17&-ds_name=DEC_2000_SF3_U&-CONTEXT=qt&-redoLog=false&-geo_id=01000US&-format=&-_lang=en&-SubjectID=8368000.
2000b Census 2000 American Indian and Alaska Native Summary File (AIANSF) - Sample Data generated by Beverly Ward; using 2000 American FactFinder; http://factfinder.census.gov/servlet/DTGeoSearchByListServlet?ds_name=DEC_2000_SFAIAN&_lang=en&_ts=136768381688. 2000c State & County QuickFacts. Electronic document,
http://quickfacts.census.gov/qfd/. U.S. Department of Health and Human Services, Centers for Disease Control and Prevention 1999 Morbidity and Mortality Weekly Report. 48(28):601-605. U.S. Department of Transportation, Federal Highway Administration et al. 1996 Community Impact Assessment: A Quick Reference for Transportation. FHWA-PD-96-036. Electronic document, http://www.ciatrans.net/CIA_Quick_Reference/Purpose.html. U.S. Department of Transportation, Federal Transit Administration 1988 Title VI Program Guidelines for Urban Mass Transportation [Federal
Transit] Administration Recipients, Circular 4702.1. Electronic document, http://www.fta.dot.gov/388_15991_ENG_HTML.htm.
2003 Civil Rights Reviews. Electronic document, http://www.fta.dot.gov/grant_programs/fta_oversight/4022_8477_ENG_HTML.htm.
U. S. Environmental Protection Agency 2000 Environmental Justice. Office of Enforcement and Compliance
Assurance. Electronic document, http://www.epa.gov/compliance/environmentaljustice/index.html.

C A S E S T U D I E S I N E N V I R O N M E N T A L J U S T I C E A N D P U B L I C T R A N S I T T I T L E V I R E P O R T I N G
70
U.S. Department of Labor, Bureau of Labor Statistics 2004 Highlights of Women’s Earnings in 2003. Report 978. Electronic
document, http://www.bls.gov/cps/cpswom2003.pdf. U.S. Senate, Committee on Indian Affairs 1999 Providing Technical and Legal Assistance to Tribal Justice Systems and
Members of Indian Tribes, and for Other Purposes. Electronic document, http://thomas.loc.gov/cgi-bin/cpquery/T?&report=sr219&dbname=cp106&, accessed 31 March.
Umberger, Mary 2005 Wild, Woolly Housing Rush. Chicago Tribune. 12 June. Electronic
document, http://www.chicagotribune.com/classified/realestate/chi-0506120264jun12,1,6271949.story?coll=chi-business-hed.
United Church of Christ Commission for Racial Justice 1987 Toxic Wastes and Race in the United States: A National Report on the
Racial and Socio-Economic Characteristics of Communities with Hazardous Waste Sites. New York: United Church of Christ Commission for Racial Justice
United Nations Conference on Environment and Development 1992 Agenda 21: Programme of Action for Sustainable Development; Rio
Declaration on Environment and Development; Statement of Forest Principle. United Nations Conference on Environment and Development, Rio de Janeiro, Brazil, 3-14 June. Electronic document, http://www.un.org/esa/sustdev/documents/agenda21/english/agenda21toc.htm.
Venkatesh, Sudhir Alladi 2002 American Project: The Rise and Fall of a Modern Ghetto. Cambridge,
MA: Harvard University Press. Waldrop, Judith and Sharon M. Stern 2003 Disability Status: 2000. Census 2000 Brief, C2KBR-17. Electronic
document, http://www.census.gov/prod/2003pubs/c2kbr-17.pdf. Ward, Beverly G. 2000 “You Can’t Get There on the Bus”: An Analysis of Ethnicity, Gender, Race and Work in Public Transportation. Ph.D. dissertation, Department of Anthropology, University of South Florida.

C A S E S T U D I E S I N E N V I R O N M E N T A L J U S T I C E A N D P U B L I C T R A N S I T T I T L E V I R E P O R T I N G
71
Ward, Beverly G. and Eric T. Hill 1996 Women in Transit: Findings from African-Americans, Other Minorities, and
Women in the Transit Industry. Paper presented at the Second National Conference on Women’s Travel Issues, Baltimore, 23-25 October. Electronic document, http://www.fhwa.dot.gov/ohim/womens/chap32.pdf.
Ward, Beverly G., Ashley Spalding, Martin Catalá, and Julio Torres 2002 Accessibility, Mobility, and Land Use: The Conflicts of Public Housing and Public Transportation Policies or Is Walking a Measure of Self- Sufficiency? Paper presented at the Society for the Anthropology of North America (SANA) of the American Anthropological Association Annual Meeting, Windsor, 2-5 May. Yin, Robert K. 1994 Case Study Research Design and Methods, 2nd ed. Applied Social
Research Methods Series, Volume 5. Thousand Oaks, CA: Sage Publications.
C A S E S T U D I E S I N E N V I R O N M E N T A L J U S T I C E A N D P U B L I C T R A N S I T T I T L E V I R E P O R T I N G
72
Photos Credits Beverly Ward – Front cover and Page 24 Manolo Gonzalez-Estay - Page 47 Project Team Beverly G. Ward Joel Volinski Kimberlee Gabourel Chrystal Smith National Center for Transit Research University of South Florida Amy Datz Florida Department of Transportation Gwen Chisholm Smith Transportation Research Board Special thanks to all the interview participants