strategic regional transit plan - welcome to the south florida
TRANSCRIPT

Strategic Regional Transit PlanDecember 2008
Chapter 11:
Transit Network Composition and Analysis
(Chapter 11 originally prepared July 2008)

South Florida Regional Transportation Authority Page i
Chapter 11: Transit Network Composition and Analysis December 2008
TRANSIT NETWORK COMPOSITION AND ANALYSIS TABLE OF CONTENTS
1.0 ALTERNATIVES DEVELOPMENT .................................................................................... 1
1.1 PRELIMINARY NETWORK COMPOSITION ....................................................................... 1 Weighted Scoring ............................................................................................ 2
Preliminary Productive Network ...................................................................... 2
Preliminary Connective Network ..................................................................... 2
Preliminary Value Network .............................................................................. 2
2.0 NETWORK ANALYSIS ...................................................................................................... 9
Travel Markets ................................................................................................ 9
Productive Network ......................................................................................... 9
Connective Network ........................................................................................ 9
Value Network ............................................................................................... 10
3.0 FINAL NETWORK COMPOSITION ................................................................................. 11
4.0 LAND USE ANALYSIS .................................................................................................... 17
Regional Activity Centers .............................................................................. 17
Community Redevelopment Areas ................................................................ 17
Transit Station Areas ..................................................................................... 17 4.1 LAND USE METHODOLOGY .........................................................................................18
Scenario 1 – Regional Activity Centers or Community Redevelopment Areas Scenario ........................................................................................................ 18
Scenario 2 – Regional Activity Centers and Community Redevelopment Areas Scenario .............................................................................................. 18
Scenario 3 – Transit Station Areas Scenario ................................................. 18
5.0 SUMMARY ....................................................................................................................... 18

South Florida Regional Transportation Authority Page ii
Chapter 11: Transit Network Composition and Analysis December 2008
FIGURES
FIGURE 1 – ALTERNATIVES DEVELOPMENT PROCESS ......................................................................... 1
FIGURE 2 – PRELIMINARY CONNECTIVE NETWORK ............................................................................... 6
FIGURE 3 – PRELIMINARY PRODUCTIVE NETWORK ............................................................................... 7
FIGURE 4 – PRELIMINARY VALUE NETWORK ............................................................................................ 8
FIGURE 5 – FINAL CONNECTIVE NETWORK ............................................................................................ 13
FIGURE 6 – FINAL PRODUCTIVE NETWORK ............................................................................................ 14
FIGURE 7 – FINAL VALUE NETWORK ......................................................................................................... 15
TABLES
TABLE 1 – RAW DATA ...................................................................................................................................... 3
TABLE 2 – WEIGHTED SCORES .................................................................................................................... 5
TABLE 3 – FINAL NETWORK COMPOSITION............................................................................................. 12
TABLE 4 – DAILY TRIPS PERCENTAGE CHANGE (NETWORK VS. INDEPENDENT) – TESTED ALTERNATIVES ............................................................................................................................................... 16
TABLE 5 – EVALUATION OF THREE NETWORKS: NO CHANGES IN 2030 LAND USE (PRELIMINARY NETWORKS) ........................................................................................................................ 19
TABLE 6 – EVALUATION OF PRELIMINARY CONNECTIVE NETWORK WITH LAND USE SCENARIOS ..................................................................................................................................................... 20
TABLE 7 – EVALUATION OF PRELIMINARY PRODUCTIVE NETWORK WITH LAND USE SCENARIOS ..................................................................................................................................................... 21
TABLE 8 – EVALUATION OF PRELIMINARY VALUE NETWORK WITH LAND USE SCENARIOS ..... 22

South Florida Regional Transportation Authority Page 1
Chapter 11: Transit Network Composition and Analysis December 2008
1.0 ALTERNATIVES DEVELOPMENT
The process of developing refined alternatives included in the networks is discussed in Chapter 4: High Opportunity Corridors (Screen One) dated June 2007 and Chapter 7: Screen Two (Detailed) Evaluation dated December 2007.
Figure 1 shows how alternatives advance through the screening process and ultimately into the three networks tested using four land use scenarios. A complete discussion of the land use scenario process is provided in Chapter 10: Land Use Scenarios dated January 2008.
Figure 1 – Alternatives Development Process
1.1 PRELIMINARY NETWORK COMPOSITION
Through the Screen Two Evaluation, each performance criterion was given equal weight during the scoring process, resulting in the alignments competing to perform best overall. Once Screen Two was complete, the resulting alternatives were identified and additional analysis was conducted to determine which alternatives that serve the same travel markets would be included in the Connective, Productive, and Value Networks.

South Florida Regional Transportation Authority Page 2
Chapter 11: Transit Network Composition and Analysis December 2008
Table 1 shows each corridor’s characteristics in quantitative values for each of the performance criteria categories.
Weighted Scoring
Contribution to the regional system for each alignment was weighed by emphasizing the specified criteria classification groups separately: Connective, Productive, and Value. This allowed a secondary check of the alignments and their comparative performance to one another by focusing on certain characteristics. Table 2 shows the alternatives’ weighted scores and the scores for each of the performance criteria.
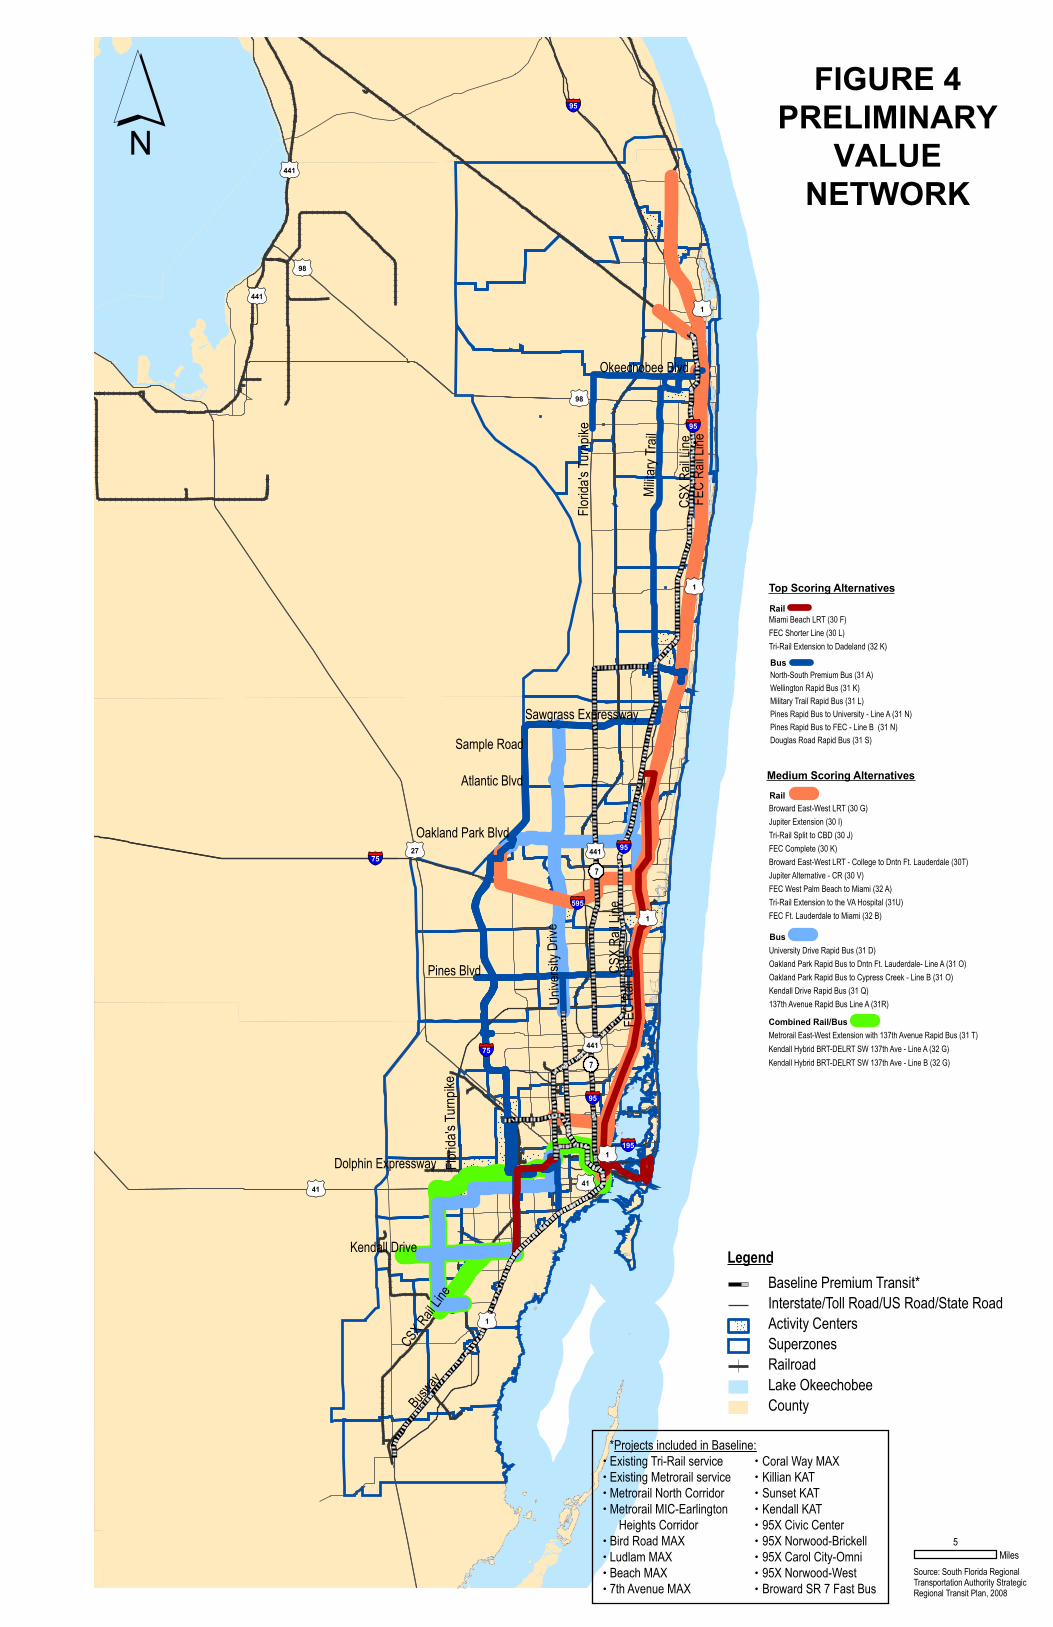
Each alignment’s score was classified as low, middle, or high regarding the percentile in which their weighted score fell for the three classification groups. Figures 2, 3, and 4 show the preliminary networks that were established using only the medium and high scoring alternatives from the three specified criteria classification groups.
Preliminary Connective Network (Figure 2)
The preliminary Connective Network alternatives scored well based on the number of county lines they cross (Interjurisdictional), the number of Regional Activity Centers (RACs) served by the transit alignment, and the number of other transportation modes the alignment connects (Intermodal Connection).
Preliminary Productive Network (Figure 3)
The preliminary Productive Network alternatives scored well based on the number of new riders generated by the alignment (Incremental Trips per Mile) and trip demand in the corridor (Trip Flows).
Preliminary Value Network (Figure 4)
Alternatives included in the preliminary value network scored well based on Capital Costs per Mile (including construction costs for route, stations, and maintenance facility; vehicle purchase; and right-of-way), Annual Cost per Trip (based on operating and maintenance costs, as well as annualized construction costs), and Subsidy per Trip.

South Florida Regional Transportation Authority Page 3
Chapter 11: Transit Network Composition and Analysis December 2008
Table 1 – Raw Data

South Florida Regional Transportation Authority Page 4
Chapter 11: Transit Network Composition and Analysis December 2008
Table 1 – Raw Data (Cont.)

South Florida Regional Transportation Authority Page 5
Chapter 11: Transit Network Composition and Analysis December 2008
Table 2 – Weighted Scores

T
Milita
ryTr
ail
Sawgrass Expressway
Dolphin Expressway
Florid
a'sTu
rnpik
e
FEC
Rail L
ineSample Road
Atlantic Blvd
Oakland Park Blvd
CSX
Rail L
ine
CSX
RailL
ineFE
CRa
ilLinePines Blvd
Kendall Drive
CSXRail
Line
Busway
Unive
rsity
Drive
Florid
a'sTu
rnpik
e
Okeechobee Blvd
7
7
Top Scoring Alternatives
North-South Premium Bus (31 A)
Metrorail East-West Extension with 137th Avenue Rapid Bus (31 T)Kendall Hybrid BRT-DELRT SW 137th Ave - Line A (32 G)Kendall Hybrid BRT-DELRT SW 137th Ave - Line B (32 G)
Rail
Bus
Rail
Medium Scoring Alternatives
Bus
Combined Rail/Bus
FEC Complete (30 K)FEC Shorter Line (30 L)
ri-Rail Extension to Dadeland (32 K)FEC West Palm Beach to Miami (32 A)
Douglas Road Rapid Bus (31 S)
East-West Metrorail Extension to FIU (30 C)East-West Metrorail Extension to Kendall (30 D)Miami Beach LRT (30 F)Broward East-West LRT (30 G)Jupiter Extension (30 I)Tri-Rail Split to CBD (30 J)Broward East-West LRT - College to Dntn Ft. Lauderdale (30T)Jupiter Alternative - CR (30 V)
University Drive Rapid Bus (31 D)Wellington Rapid Bus (31 K)Military Trail Rapid Bus (31 L)Pines Rapid Bus to University - Line A (31 N)Pines Rapid Bus to FEC - Line B (31 N)Oakland Park Rapid Bus to Dntn Ft. Lauderdale- Line A (31 O)Oakland Park Rapid Bus to Cypress Creek - Line B (31 O)Kendall Drive Rapid Bus (31 Q)137th Avenue Rapid Bus Line A (31R)
Tri-Rail Extension to the VA Hospital (31U)FEC Ft. Lauderdale to Miami (32 B)
§̈¦95
§̈¦595
§̈¦75
§̈¦195
§̈¦95
§̈¦95
§̈¦95
§̈¦75 0127
011
01441
0198
0141
01441
0198
01441
011
0141
011
011
01441
011
Tab le 6 – E va luation o f P re lim inary P rodu ctive N etw ork w ith Land U se S cenarios
O rig ina l S cenario 1 S cenario 2 S cenario 3
To ta l C ap ita l C ost ($B ) $8 .5
An nualized C ap ita l C ost ($M ) $654
An nual O & M C ost ($M ) $72
Tota l Annual C ost ($M ) $726
An nual P assenger T rips (M ) 37 .6 60 .7 59 .8 62 .1
O & M C ost P er T rip $1 .91 $1 .19 $1 .21 $1 .16
Tota l Annual C ost P er T rip $19 .30 $11 .96 $12 .14 $11 .96
An nual Fare R evenue ($M ) $20 .8 $34 .4 $33 .9 $34 .5
Farebox R ecovery 29% 48% 47% 48%
O perating S ubsid y P er T rip $1 .15 $0 .50 $0 .51 $0 .48
A C = A ctiv ity C en te r, C R A = C om m un ity R edeve lopm ent A rea, S A = S ta tion A rea Land U se S cenario 1 = 100% of em p loym ent in A C s, 100% of househo ld C R A s Land U se S cenario 2 = 67% of em p loym ent in A C s, 33% of em p loym ent in C R A s 33% of househo lds in A C s, 67% of em p loym ent in C R A s Land U se S cenario 3 = 100% of em p loym ent and househo lds in SA s
FIGURE 2PRELIMINARYCONNECTIVE
NETWORK
Legend
Source: South Florida RegionalTransportation Authority StrategicRegional Transit Plan, 2008
Activity Centers
Baseline Premium Transit*Interstate/Toll Road/US Road/State Road
SuperzonesRailroadLake OkeechobeeCounty
5Miles
*Projects included in Baseline:Existing Tri-Rail serviceExisting Metrorail serviceMetrorail North CorridorMetrorail MIC-Earlington Heights CorridorBird Road MAXLudlam MAXBeach MAX7th Avenue MAX
Coral Way MAXKillian KATSunset KATKendall KAT95X Civic Center95X Norwood-Brickell95X Carol City-Omni95X Norwood-WestBroward SR 7 Fast Bus
´

FIGURE 3PRELIMINARYPRODUCTIVE
NETWORK
Milita
ryTr
ail
Sawgrass Expressway
Florid
a'sTu
rnpik
e
FEC
Rail L
ineSample Road
Atlantic Blvd
Oakland Park Blvd
CSX
Rail L
ine
CSX
RailL
ineFE
CRa
ilLine
Kendall Drive
CSXRail
Line
Busway
Unive
rsity
Drive
Okeechobee Blvd
7
7
Top Scoring Alternatives
Miami Beach LRT (30 F)Tri-Rail Split to CBD (30 J)FEC Shorter Line (30 L)FEC-Tri-Rail A & FEC: Jupiter-MIC, Boca-Govt Center (32 J)Tri-Rail Extension to Dadeland (32 K)
North-South Premium Bus (31 A)
East-West Metrorail Extension to FIU (30 C)East-West Metrorail Extension to Kendall (30 D)Broward East-West LRT (30 G)Jupiter Extension (30 I)FEC Complete (30 K)Broward East-West LRT - College to Dntn Ft. Lauderdale (30T)Jupiter Alternative - CR (30 V)
Wellington Rapid Bus (31 K)Military Trail Rapid Bus (31 L)Pines Rapid Bus to University - Line A (31 N)Pines Rapid Bus to FEC - Line B (31 N)Oakland Park Rapid Bus to Dntn Ft. Lauderdale- Line A (31 O)Oakland Park Rapid Bus to Cypress Creek - Line B (31 O)Kendall Drive Rapid Bus (31 Q)137th Avenue Rapid Bus Line A (31R)Douglas Road Rapid Bus (31 S)
Metrorail East-West Extension with 137th Avenue Rapid Bus (31 T)
Tri-Rail Extension to the VA Hospital (31U)FEC West Palm Beach to Miami (32 A)FEC Ft. Lauderdale to Miami (32 B)
Kendall Hybrid BRT-DELRT SW 137th Ave - Line A (32 G)Kendall Hybrid BRT-DELRT SW 137th Ave - Line B (32 G)
FEC-Tri-Rail: Jupiter to Pompano to MIC (32 I)
Rail
Bus
Rail
Medium Scoring Alternatives
Bus
Combined Rail/Bus
Dolphin Expressway
Pines Blvd
Florid
a'sTu
rnpik
e
0127
011
01441
0198
0141
01441
0198
01441
011
0141
011
011
01441
011
§̈¦95
§̈¦595
§̈¦75
§̈¦195
§̈¦95
§̈¦95
§̈¦95
§̈¦75
Legend
Source: South Florida RegionalTransportation Authority StrategicRegional Transit Plan, 2008
Activity Centers
Baseline Premium Transit*Interstate/Toll Road/US Road/State Road
SuperzonesRailroadLake OkeechobeeCounty
5Miles
*Projects included in Baseline:Existing Tri-Rail serviceExisting Metrorail serviceMetrorail North CorridorMetrorail MIC-Earlington Heights CorridorBird Road MAXLudlam MAXBeach MAX7th Avenue MAX
Coral Way MAXKillian KATSunset KATKendall KAT95X Civic Center95X Norwood-Brickell95X Carol City-Omni95X Norwood-WestBroward SR 7 Fast Bus
´
Milit
ary T
rail
Sawgrass Expressway
Dolphin Expressway
Flor
ida's
Turn
pike
FEC
Rail L
ine
Sample Road
Atlantic Blvd
Oakland Park Blvd
CSX
Rail L
ine
CSX
RailL
ineFE
CRa
ilLinePines Blvd
Kendall Drive
CSXRail
Line
Busway
Unive
rsity
Drive
Flor
ida's
Turn
pike
Okeechobee Blvd
7
7
Top Scoring Alternatives
North-South Premium Bus (31 A)
Metrorail East-West Extension with 137th Avenue Rapid Bus (31 T)Kendall Hybrid BRT-DELRT SW 137th Ave - Line A (32 G)Kendall Hybrid BRT-DELRT SW 137th Ave - Line B (32 G)
Rail
Bus
Rail
Medium Scoring Alternatives
Bus
Combined Rail/Bus
Miami Beach LRT (30 F)FEC Shorter Line (30 L)Tri-Rail Extension to Dadeland (32 K)
Wellington Rapid Bus (31 K)Military Trail Rapid Bus (31 L)Pines Rapid Bus to University - Line A (31 N)Pines Rapid Bus to FEC - Line B (31 N)Douglas Road Rapid Bus (31 S)
Broward East-West LRT (30 G)Jupiter Extension (30 I)Tri-Rail Split to CBD (30 J)FEC Complete (30 K)Broward East-West LRT - College to Dntn Ft. Lauderdale (30T)Jupiter Alternative - CR (30 V)FEC West Palm Beach to Miami (32 A)Tri-Rail Extension to the VA Hospital (31U)FEC Ft. Lauderdale to Miami (32 B)
University Drive Rapid Bus (31 D)Oakland Park Rapid Bus to Dntn Ft. Lauderdale- Line A (31 O)Oakland Park Rapid Bus to Cypress Creek - Line B (31 O)Kendall Drive Rapid Bus (31 Q)137th Avenue Rapid Bus Line A (31R)
§̈¦95
§̈¦595
§̈¦75
§̈¦195
§̈¦95
§̈¦95
§̈¦95
§̈¦75 0127
011
01441
0198
0141
01441
0198
01441
011
0141
011
011
01441
011
FIGURE 4PRELIMINARY
VALUENETWORK
Legend
Source: South Florida RegionalTransportation Authority StrategicRegional Transit Plan, 2008
Activity Centers
Baseline Premium Transit*Interstate/Toll Road/US Road/State Road
SuperzonesRailroadLake OkeechobeeCounty
5Miles
*Projects included in Baseline:Existing Tri-Rail serviceExisting Metrorail serviceMetrorail North CorridorMetrorail MIC-Earlington Heights CorridorBird Road MAXLudlam MAXBeach MAX7th Avenue MAX
Coral Way MAXKillian KATSunset KATKendall KAT95X Civic Center95X Norwood-Brickell95X Carol City-Omni95X Norwood-WestBroward SR 7 Fast Bus
´

South Florida Regional Transportation Authority Page 9
Chapter 11: Transit Network Composition and Analysis December 2008
2.0 NETWORK ANALYSIS
The results of the preliminary network composition were separated into travel markets and analyzed to determine which alignment within each travel market best met the network characteristics.
Travel Markets
Duplication of service as well as failure to provide adequate service can be detrimental to the success of a transit system. Those travel markets served by a single surviving alignment were maintained; this most often occurred with rapid bus options. To identify areas containing service duplication, the following travel markets were identified across the South Florida region:
Miami East-West
Miami Beach
Broward East-West
Jupiter Tri-Rail Extensions
Miami Tri-Rail Extensions
FEC (Florida East Coast Railroad)
Kendall
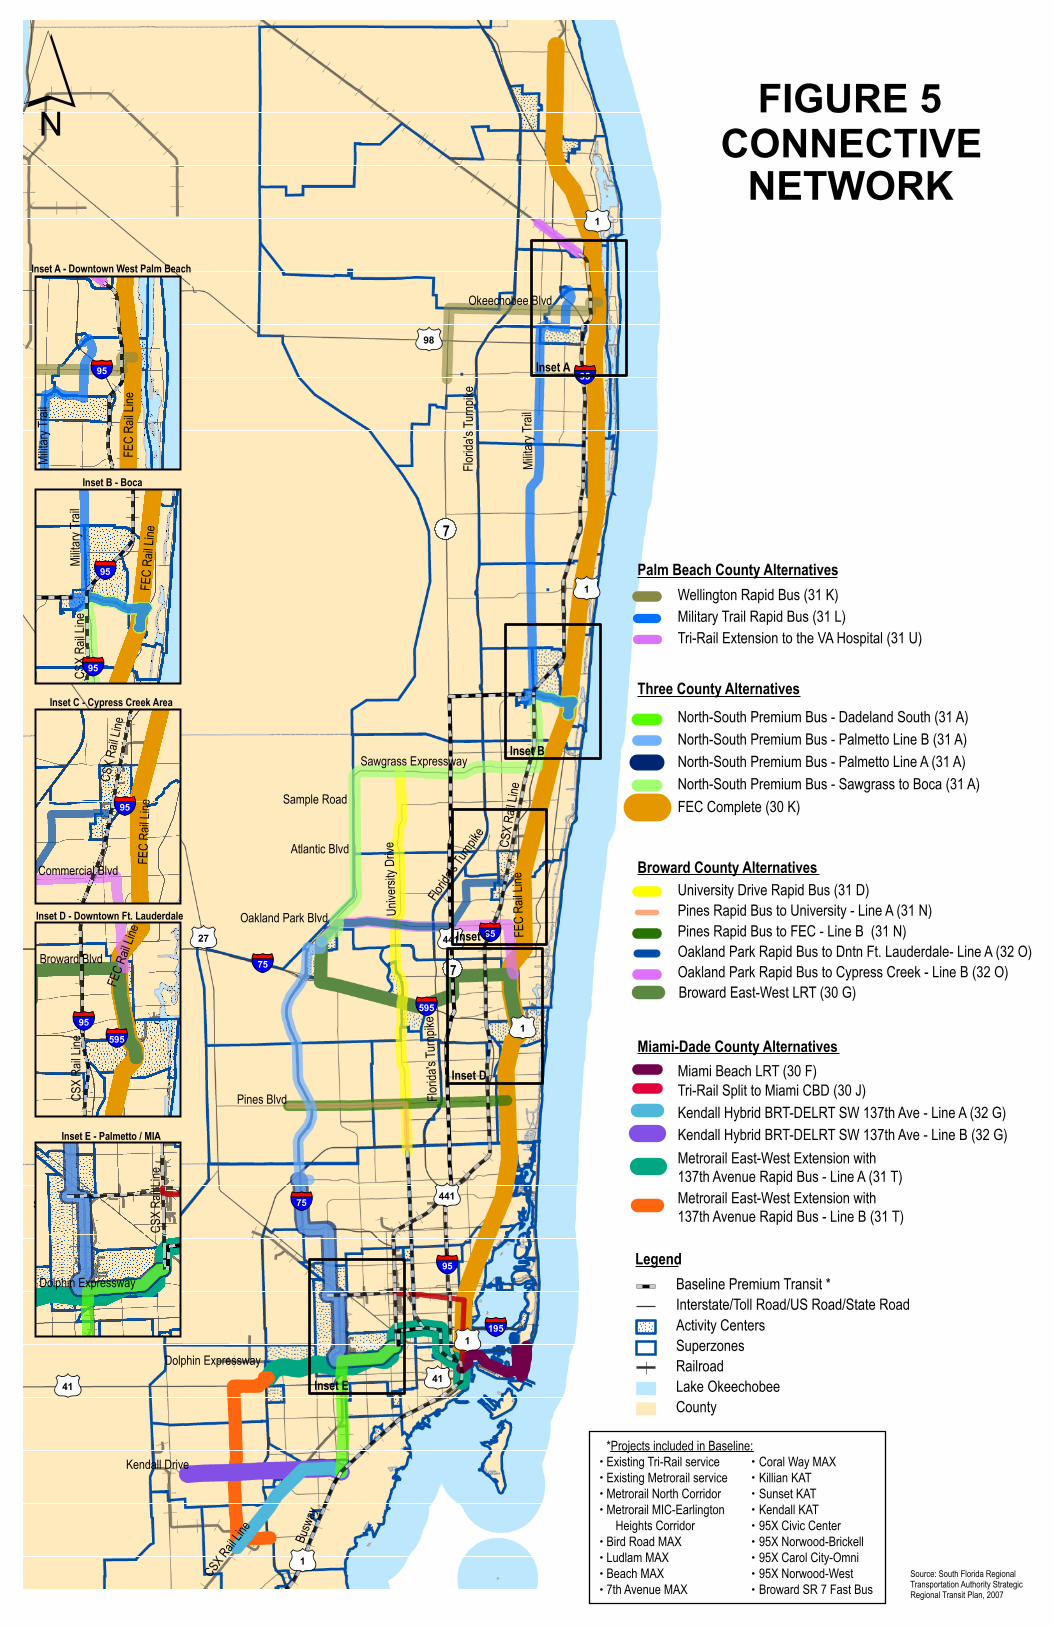
Connective Network
Alternatives’ ability to maximize existing regional community assets was taken into account when analyzing the Connective Network. Alignments within travel markets were compared based on the number of RACs served and the connections to other modes and modal facilities, in addition to the ability to connect multiple jurisdictions. The following alignments were included in the final Connective Network:
31T Metrorail Extension plus 137th Avenue Rapid Bus
30F Miami Beach LRT
30G Broward East-West LRT
31U Tri-Rail Extension to the VA Hospital
30K FEC Complete
32G Kendall Hybrid BRT-DELRT SW 137th Augmented
31A North-South Premium Bus
31D University Drive Rapid Bus
31K Wellington Rapid Bus

South Florida Regional Transportation Authority Page 10
Chapter 11: Transit Network Composition and Analysis December 2008
31L Military Trail Rapid Bus
31N Pines Rapid Bus
32O Oakland Park – Cypress Creek Rapid Bus
Productive Network
The productive network was analyzed for performance in terms of ridership. Alignments serving similar markets were compared and services attracting fewer riders to the system were eliminated. The following alignments were included in the ultimate Productive Network:
30D East-West Metrorail Extension South to Kendall
30F Miami Beach LRT
30G Broward East-West LRT
30V Jupiter Extension
32K Tri-Rail Extension to Dadeland
32A FEC West Palm Beach to Miami
32G Kendall Hybrid BRT-DELRT SW 137th Augmented
31S North-South Premium Bus with Douglas Road
31K Wellington Rapid Bus
31L Military Trail Rapid Bus
31N Pines Rapid Bus
32O Oakland Park – Cypress Creek Rapid Bus
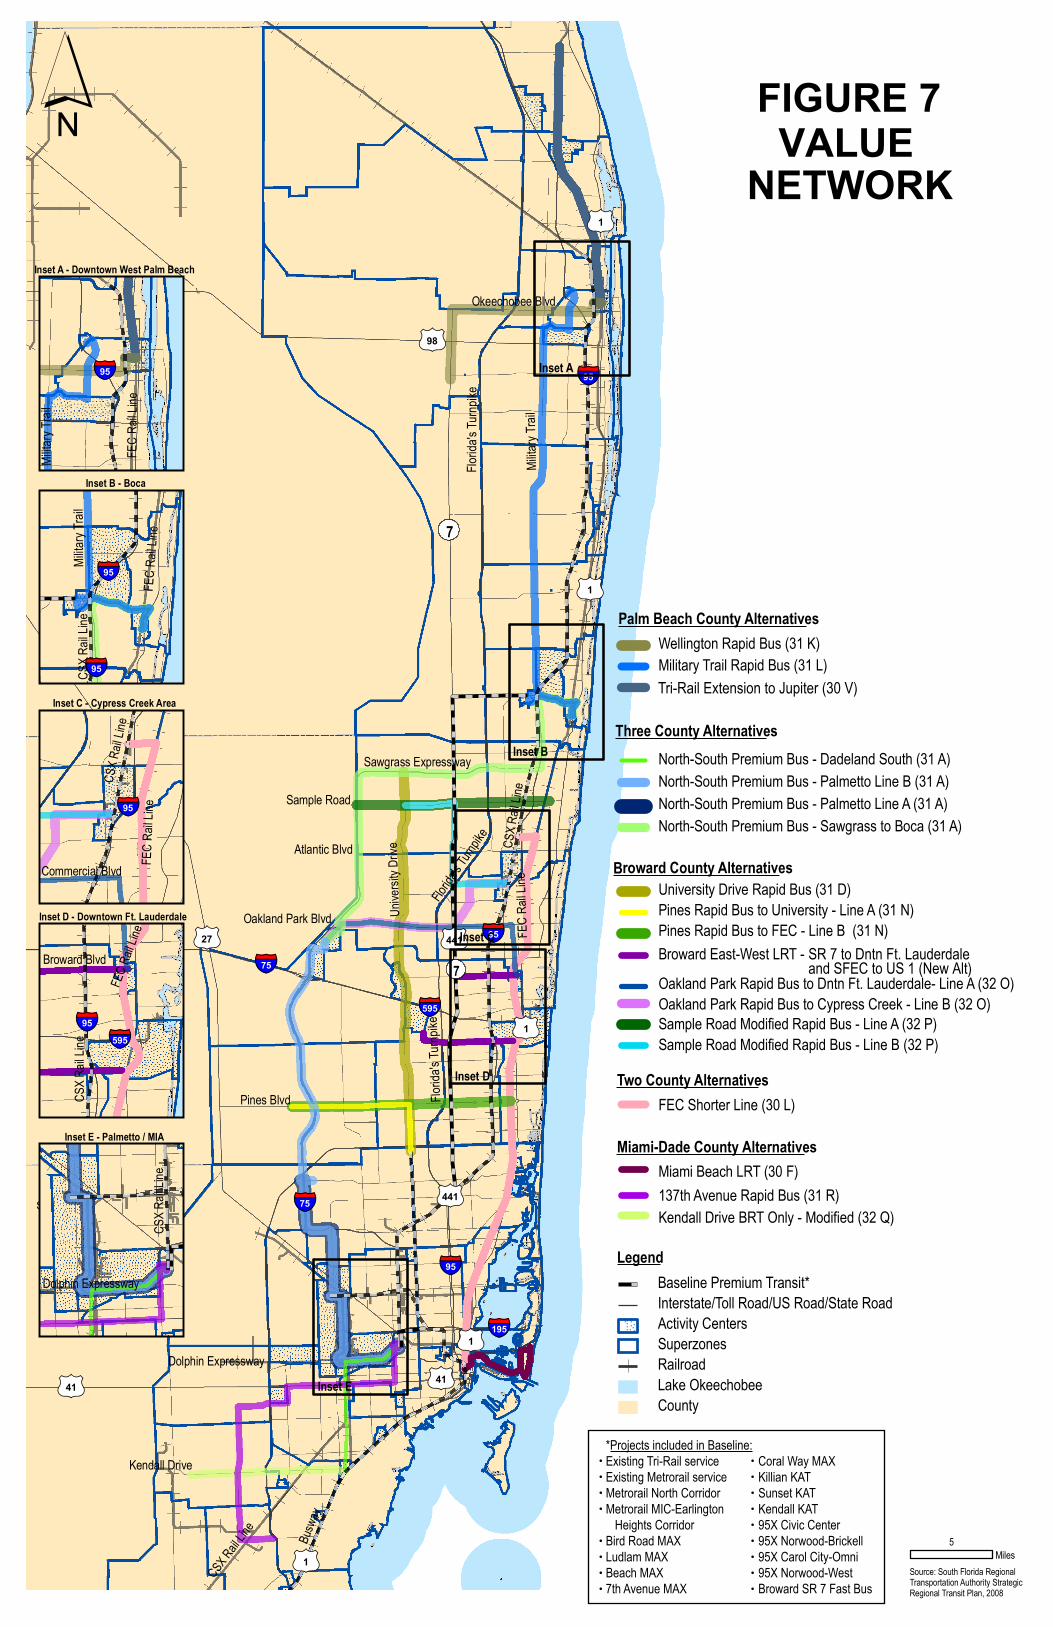
Value Network
Cost is a major factor when determining if a system can be built. Alignments within travel markets were evaluated to determine which alignments were most value in terms of capital costs per mile, per trip costs (including operations and annualized costs), and subsidy needed per trip (includes estimated farebox recovery). The final Value Network included the following alignments:
31R 137th Rapid Bus
30F Miami Beach LRT
32L Broward East-West LRT Sawgrass to CBD
30V Jupiter Extension
30L FEC Shorter Line

South Florida Regional Transportation Authority Page 11
Chapter 11: Transit Network Composition and Analysis December 2008
32Q Kendall Drive BRT Only Modified Service
31A North-South Premium Bus
31D University Drive Rapid Bus
31K Wellington Rapid Bus
31L Military Trail Rapid Bus
31N Pines Rapid Bus
32O Oakland Park – Cypress Creek Rapid Bus
32P Sample Road Modified Rapid Bus
The final networks were tested using the adopted 2030 Land Use Base; plus three alternative land use scenarios to determine how modified transit-oriented land use policies would benefit the proposed transit system. The network analysis also shows the alternatives’ performance in a comprehensive transit system versus performance as an individual alignment.
3.0 FINAL NETWORK COMPOSITION
Each alternative was tested individually and within a network using the adopted 2030 socio-economic data. The resulting ridership data was used to compare each alignment’s individual performance to performance in a network. If ridership showed a large increase when placed in the network, the alternative was a benefit to the complete transit system. Conversely, a large decrease in ridership demonstrated some riders were served by another project in the network.
Once the results from network testing were compared to the individual alignment results, each network was adjusted to ensure maximum performance and a comprehensive system. Additional changes to the networks resulted from outreach efforts conducted by SFRTA.
Table 3 lists the alternatives included in each network. Figures 5, 6, and 7 map the final three networks. Table 4 shows the percentage change between alternatives’ ridership performance individually and in a network.

South Florida Regional Transportation Authority Page 12
Chapter 11: Transit Network Composition and Analysis December 2008
Table 3 – Final Network Composition
27
1
441
41
98
1
41
1
1
441
1
95
595
75
195
95
95
75
Milita
ryTr
ail
Sawgrass Expressway
Dolphin Expressway
Florid
a'sTu
rnpik
e
Sample Road
Atlantic Blvd
Oakland Park Blvd
Florid
a'sTu
rnpike CS
XRa
il Line
FEC
RailL
ine
Pines Blvd
Kendall Drive
CSXRail
Line
Busw
ay
Unive
rsity
Drive
Florid
a'sTu
rnpik
e
Okeechobee Blvd
7
7
Source:
95
95
95
95
95
595
Inset A - Downtown West Palm Beach
Inset B - Boca
Inset C - Cypress Creek Area
Inset D - Downtown Ft. Lauderdale
Inset E - Palmetto / MIA
FEC
Rail L
ine
Milita
ryTr
ail
FEC
Rail L
ine
CSX
RailL
ineMi
litary
Trail
FEC
Rail L
ine
CSX
Rail L
ine
Commercial Blvd
FEC
Rail L
ine
CSX
RailL
ine
Broward Blvd
Dolphin Expressway
CSX
RailL
ine
Inset A
Inset B
Inset C
Inset D
Inset E
Legend
Source: South Florida RegionalTransportation Authority StrategicRegional Transit Plan, 2007
Activity Centers
Baseline Premium Transit *Interstate/Toll Road/US Road/State Road
SuperzonesRailroadLake OkeechobeeCounty
Palm Beach County Alternatives
Three County Alternatives
Broward County Alternatives
Miami-Dade County Alternatives
Wellington Rapid Bus (31 K)Military Trail Rapid Bus (31 L)Tri-Rail Extension to the VA Hospital (31 U)
North-South Premium Bus - Palmetto Line B (31 A)North-South Premium Bus - Palmetto Line A (31 A)North-South Premium Bus - Sawgrass to Boca (31 A)FEC Complete (30 K)
North-South Premium Bus - Dadeland South (31 A)
University Drive Rapid Bus (31 D)Pines Rapid Bus to University - Line A (31 N)Pines Rapid Bus to FEC - Line B (31 N)Oakland Park Rapid Bus to Dntn Ft. Lauderdale- Line A (32 O)Oakland Park Rapid Bus to Cypress Creek - Line B (32 O)Broward East-West LRT (30 G)
Miami Beach LRT (30 F)Tri-Rail Split to Miami CBD (30 J)Kendall Hybrid BRT-DELRT SW 137th Ave - Line A (32 G)Kendall Hybrid BRT-DELRT SW 137th Ave - Line B (32 G)Metrorail East-West Extension with 137th Avenue Rapid Bus - Line A (31 T)Metrorail East-West Extension with 137th Avenue Rapid Bus - Line B (31 T)
NETWCONNECTIVE
FIGURE 5
ORK
*Projects included in Baseline:Existing Tri-Rail serviceExisting Metrorail serviceMetrorail North CorridorMetrorail MIC-Earlington Heights CorridorBird Road MAXLudlam MAXBeach MAX7th Avenue MAX
Coral Way MAXKillian KATSunset KATKendall KAT95X Civic Center95X Norwood-Brickell95X Carol City-Omni95X Norwood-WestBroward SR 7 Fast Bus

27
1
441
41
98
1
41
1
1
441
1
95
595
75
195
95
95
75
Milita
ryTr
ail
Sawgrass Expressway
Dolphin Expressway
Florid
a'sTu
rnpik
e
Sample Road
Atlantic Blvd
Oakland Park Blvd
Florid
a'sTu
rnpike CS
XRa
il Line
FEC
RailL
ine
Pines Blvd
Kendall Drive
CSXRail
Line
Busw
ay
Unive
rsity
Drive
Florid
a'sTu
rnpik
e
Okeechobee Blvd
7
7
Source:
95
95
95
95
95
595
Inset A - Downtown West Palm Beach
Inset B - Boca
Inset C - Cypress Creek Area
Inset D - Downtown Ft. Lauderdale
Inset E - Palmetto / MIA
FEC
Rail L
ine
Milita
ryTr
ail
FEC
Rail L
ine
CSX
RailL
ineMi
litary
Trail
FEC
Rail L
ine
CSX
Rail L
ine
Commercial Blvd
FEC
Rail L
ine
CSX
RailL
ine
Broward Blvd
Dolphin Expressway
CSX
RailL
ine
Inset A
Inset B
Inset C
Inset D
Inset E
Legend
Palm Beach County Alternatives
Three County Alternatives
Broward County Alternatives
Miami-Dade County Alternatives
Source: South Florida RegionalTransportation Authority StrategicRegional Transit Plan, 2007
Activity Centers
Wellington Rapid Bus (31 K)Military Trail Rapid Bus (31 L)Tri-Rail Extension to Jupiter (30 V)
Douglas Road Rapid Bus (31 S)FEC West Palm Beach to Miami (32 A)
Pines Rapid Bus to University - Line A (31 N)Pines Rapid Bus to FEC - Line B (31 N)Oakland Park Rapid Bus to Dntn Ft. Lauderdale- Line A (32 O)Oakland Park Rapid Bus to Cypress Creek - Line B (32 O)Broward East-West LRT (30 G)
East-West Metrorail Extension to Kendall (30 D)Miami Beach LRT (30 F)
Kendall Hybrid BRT-DELRT SW 137th Ave - Line A (32 G)Kendall Hybrid BRT-DELRT SW 137th Ave - Line B (32 G)
Tri-Rail Extension to Dadeland (32 K)
Baseline Premium Transit *Interstate/Toll Road/US Road/State Road
SuperzonesRailroadLake OkeechobeeCounty
Tri-Rail Split to Miami CBD (30 J)
*Projects included in Baseline:Existing Tri-Rail serviceExisting Metrorail serviceMetrorail North CorridorMetrorail MIC-Earlington Heights CorridorBird Road MAXLudlam MAXBeach MAX7th Avenue MAX
Coral Way MAXKillian KATSunset KATKendall KAT95X Civic Center95X Norwood-Brickell95X Carol City-Omni95X Norwood-WestBroward SR 7 Fast Bus
NETWPRODUCTIVE
FIGURE 6
ORK
0127
011
01441
0141
0198
011
0141
011
011
01441
011
§̈¦95
§̈¦595
§̈¦75
§̈¦195
§̈¦95
§̈¦95
§̈¦75
Milita
ryTr
ail
Sawgrass Expressway
Dolphin Expressway
Florid
a'sTu
rnpik
e
Sample Road
Atlantic Blvd
Oakland Park Blvd
Florid
a'sTu
rnpike CS
XRa
il Line
FEC
RailL
ine
Pines Blvd
Kendall Drive
CSXRail
Line
Busw
ay
Unive
rsity
Drive
Florid
a'sTu
rnpik
e
Okeechobee Blvd
7
7
Source:
§̈¦95
§̈¦95
§̈¦95
§̈¦95
§̈¦95
§̈¦595
Inset A - Downtown West Palm Beach
Inset B - Boca
Inset C - Cypress Creek Area
Inset D - Downtown Ft. Lauderdale
Inset E - Palmetto / MIA
FEC
Rail L
ine
Milita
ryTr
ail
FEC
Rail L
ine
CSX
RailL
ineMi
litary
Trail
FEC
Rail L
ine
CSX
Rail L
ine
Commercial Blvd
FEC
Rail L
ine
CSX
RailL
ine
Broward Blvd
Dolphin Expressway
CSX
RailL
ine
Inset A
Inset B
Inset C
Inset D
Inset E
´
Legend
Palm Beach County Alternatives
hree County Alternatives
Miami-Dade County Alternatives
Two County Alternatives
Source: South Florida RegionalTransportation Authority StrategicRegional Transit Plan, 2008
Activity Centers
Wellington Rapid Bus (31 K)Military Trail Rapid Bus (31 L)
North-South Premium Bus - Palmetto Line B (31 A)North-South Premium Bus - Palmetto Line A (31 A)North-South Premium Bus - Sawgrass to Boca (31 A)
North-South Premium Bus - Dadeland South (31 A)
University Drive Rapid Bus (31 D)Pines Rapid Bus to University - Line A (31 N)Pines Rapid Bus to FEC - Line B (31 N)Broward East-West LRT - SR 7 to Dntn Ft. Lauderdale
and SFEC to US 1 (New Alt)
FEC Shorter Line (30 L)
137th Avenue Rapid Bus (31 R)Miami Beach LRT (30 F)
Kendall Drive BRT Only - Modified (32 Q)
Baseline Premium Transit*Interstate/Toll Road/US Road/State Road
SuperzonesRailroadLake OkeechobeeCounty
5Miles
Oakland Park Rapid Bus to Cypress Creek - Line B (32 O)Oakland Park Rapid Bus to Dntn Ft. Lauderdale- Line A (32 O)
Sample Road Modified Rapid Bus - Line B (32 P)Sample Road Modified Rapid Bus - Line A (32 P)
roward County AlternativesB
T
Tri-Rail Extension to Jupiter (30 V)
*Projects included in Baseline:Existing Tri-Rail serviceExisting Metrorail serviceMetrorail North CorridorMetrorail MIC-Earlington Heights CorridorBird Road MAXLudlam MAXBeach MAX7th Avenue MAX
Coral Way MAXKillian KATSunset KATKendall KAT95X Civic Center95X Norwood-Brickell95X Carol City-Omni95X Norwood-WestBroward SR 7 Fast Bus
NETWVALUE
FIGURE 7
ORK

South Florida Regional Transportation Authority Page 16
Chapter 11: Transit Network Composition and Analysis December 2008
Table 4 – Daily Trips Percentage Change (Network vs. Independent) – Tested Alternatives

South Florida Regional Transportation Authority Page 17
Chapter 11: Transit Network Composition and Analysis December 2008
4.0 LAND USE ANALYSIS
The forecast for growth in the South Florida Region through the year 2030 shows a fairly even distribution of employment and residential development. To determine if changing existing land use policies to better serve transit would create higher ridership, each of the resulting preliminary networks was tested using three alternative land use scenarios for the year 2030: Scenario 1, RACs or Community Redevelopment Areas (CRAs); Scenario 2, RACs and CRAs; and Scenario 3, Transit Station Areas (SAs).
The land use scenarios were designed using Donor Zones and Receiving Zones. A portion of the growth in population and employment in the South Florida region between the base year of 1999 and horizon year of 2030 is considered transferable from Donor Zones to Receiving Zones that relates to the proposed land use policies. Three types of planning areas are considered to be desirable for an increase in population and/or employment: RACs, CRAs, and SAs.
While the construction of the Alternative Land Use Scenarios are exaggerated realities, the results show concentrating growth, through any of the scenarios, produced a higher propensity for transit use.
Regional Activity Centers
Demographic data for the Year 2030 was used to identify major destinations with potential as transit hubs. Traffic Analysis Zones (TAZs) representing geographic areas that exhibited multi-use trip generation characteristics were grouped together to form Regional Activity Centers (RACs). Areas with a high concentration of jobs in 2000, and those that were projected to experience significant employment growth between the years 2000 and 2030 were designated as major employment centers. Furthermore, Developments of Regional Impact were also mapped to assist in identifying multi-use trip generators.
Eighteen RACs and 22 employment centers were initially identified in the South Florida region. Because approximately 90 percent of the initial RACs overlapped employment centers, they were subsequently merged and their boundaries restructured. Twelve additional RACs were added to the initial list based on preliminary model outputs from Southeast Regional Planning Model, Version 5 (SERPM V). In conclusion, the study identified 34 RACs in the region. Nine of the 34 RACs are found in Palm Beach County, seven in Broward County, and 18 in Miami-Dade County.
Community Redevelopment Areas
A CRA is designated by the state as an instrument for local governments to initiate the process of redevelopment. Areas designated as CRAs within the South Florida region were identified as areas subject to redevelopment in the future.
Transit Station Areas
SAs consist of those stations attributed to fixed guideway transit with dedicated rights-of-way, including some bus rapid transit, commuter rail, light rail, and Metrorail.

South Florida Regional Transportation Authority Page 18
Chapter 11: Transit Network Composition and Analysis December 2008
4.1 LAND USE METHODOLOGY
Varying distributions of population and employment demonstrate the effect of concentrating growth as well as the effect of mixed use development on transit ridership. Areas that are not designated as RACs, CRAs, or SAs are designated as potential Donor Zones. Of these potential Donor Zones, only zones that demonstrate growth between the base year 1999 and horizon year 2030 contribute a portion (25%) of their growth, aggregated into a Donor Pool, then allocated as specified in each of the three scenarios. Allocation to the Receiving Zones is proportionate in all CRAs, all RACs, or all SAs relative to their respective employment and household characteristics in 1999. To ensure a realistic analysis, employment and households allocations remained within the county from which they were donated.
Scenario 1 – Regional Activity Centers or Community Redevelopment Areas Scenario
In this scenario, all zones designated as CRAs receive 100% of the Donor Pool’s household contributions, while those designated as RACs receive 100% of the employment contributions. Other Receiving Zones (SAs) do not receive anything from the Donor Pool.
Scenario 2 – Regional Activity Centers and Community Redevelopment Areas Scenario
In this scenario, zones designated as CRAs receive 67% of household contributions and 33% of employment contributions, while RACs receive 33% of household contributions and 67% of employment contributions.
Scenario 3 – Transit Station Areas Scenario
In this scenario, 100% of the household and employment contributions are allocated to SAs throughout the region.
Tables 5, 6, 7, and 8 show the cost performance of each network using the 2030 Base Land Use Scenario and three additional Scenarios.
5.0 SUMMARY
Based on the network analysis using the 2030 Base Land Use Scenario, the Value Network is recommended as a starting point for a Preferred Network. The Value Network demonstrated ridership similar to other networks, while maintaining lower capital costs. While portions of each network could be modified to perform better or accommodate locally recommended changes, the Value Network will be presented to the SFRTA PTAC and Board for discussion.

South Florida Regional Transportation Authority Page 19
Chapter 11: Transit Network Composition and Analysis December 2008
Table 5 – Evaluation of Three Networks: No Changes in 2030 Land Use (Preliminary Networks)
Connective Productive Value
Total Capital Cost ($B) $10.8 $10.9 $8.5
Annualized Capital Cost ($M) $809 $809 $654
Annual O&M Cost ($M) $97 $99 $72
Total Annual Cost ($M) $907 $907 $726
Annual Passenger Trips (M) 41.2 40.3 37.6
O&M Cost Per Trip $2.36 $2.46 $1.91
Total Annual Cost Per Trip $22.00 $22.52 $19.30
Annual Fare Revenue ($M) $22.9 $22.3 $20.8
Farebox Recovery 23% 23% 29%
Operating Subsidy Per Trip $1.53 $1.60 $1.15

South Florida Regional Transportation Authority Page 20
Chapter 11: Transit Network Composition and Analysis December 2008
Table 6 – Evaluation of Preliminary Connective Network with Land Use Scenarios
Original Scenario 1 Scenario 2 Scenario 3
Total Capital Cost ($B) $10.8
Annualized Capital Cost ($M) $809
Annual O&M Cost ($M) $97
Total Annual Cost ($M) $907
Annual Passenger Trips (M) 41.2 66.0 64.9 67.4
O&M Cost Per Trip $2.36 $1.48 $1.51 $1.45
Total Annual Cost Per Trip $22.00 $13.74 $13.98 $13.46
Annual Fare Revenue ($M) $22.9 $36.0 $35.6 $36.3
Farebox Recovery 23% 37% 36% 37%
Operating Subsidy Per Trip $1.53 $0.76 $0.78 $0.74
AC = Activity Center, CRA = Community Redevelopment Area, SA = Station Area Land Use Scenario 1 = 100% of employment in ACs, 100% of household CRAs Land Use Scenario 2 = 67% of employment in ACs, 33% of employment in CRAs 33% of households in ACs, 67% of employment in CRAs Land Use Scenario 3 = 100% of employment and households in SAs

South Florida Regional Transportation Authority Page 21
Chapter 11: Transit Network Composition and Analysis December 2008
Table 7 – Evaluation of Preliminary Productive Network with Land Use Scenarios
Original Scenario 1 Scenario 2 Scenario 3
Total Capital Cost ($B) $8.5
Annualized Capital Cost ($M) $654
Annual O&M Cost ($M) $72
Total Annual Cost ($M) $726
Annual Passenger Trips (M) 37.6 60.7 59.8 62.1
O&M Cost Per Trip $1.91 $1.19 $1.21 $1.16
Total Annual Cost Per Trip $19.30 $11.96 $12.14 $11.96
Annual Fare Revenue ($M) $20.8 $34.4 $33.9 $34.5
Farebox Recovery 29% 48% 47% 48%
Operating Subsidy Per Trip $1.15 $0.50 $0.51 $0.48
AC = Activity Center, CRA = Community Redevelopment Area, SA = Station Area Land Use Scenario 1 = 100% of employment in ACs, 100% of household CRAs Land Use Scenario 2 = 67% of employment in ACs, 33% of employment in CRAs 33% of households in ACs, 67% of employment in CRAs Land Use Scenario 3 = 100% of employment and households in SAs

South Florida Regional Transportation Authority Page 22
Chapter 11: Transit Network Composition and Analysis December 2008
Table 8 – Evaluation of Preliminary Value Network with Land Use Scenarios
Original Scenario 1 Scenario 2 Scenario 3
Total Capital Cost ($B) $10.9
Annualized Capital Cost ($M) $809
Annual O&M Cost ($M) $99
Total Annual Cost ($M) $907
Annual Passenger Trips (M) 40.3 63.7 62.5 65.1
O&M Cost Per Trip $2.46 $1.56 $1.59 $1.53
Total Annual Cost Per Trip $22.52 $14.26 $14.52 $13.94
Annual Fare Revenue ($M) $22.3 $35.5 $34.9 $35.8
Farebox Recovery 23% 36% 35% 36%
Operating Subsidy Per Trip $1.60 $0.82 $0.84 $0.79
AC = Activity Center, CRA = Community Redevelopment Area, SA = Station Area Land Use Scenario 1 = 100% of employment in ACs, 100% of household CRAs Land Use Scenario 2 = 67% of employment in ACs, 33% of employment in CRAs 33% of households in ACs, 67% of employment in CRAs Land Use Scenario 3 = 100% of employment and households in SAs