university of redlands solar feasibility...
TRANSCRIPT

M
ich
ael R
eill
y
20
12
Un
ive
rsit
y o
f R
ed
lan
ds
So
lar
Fe
asi
bil
ity
Stu
dy
This study assesses the technical and financial feasibility of a solar photovoltaic installation on the University of Redlands campus. Detailed plans and specifications for optimal installation sites were reviewed including capacity loads, installation and operating expenditures. Financial models were constructed in order to compare multiple financial products commonly offered by solar companies
University of Redlands 1231 East Colton Ave.
Redlands, CA 92374

2
TABLE OF CONTENTS PAGE
Project Summary..……………………………………………………………………………….3
Context………………….…………………………………………………………………...…...4
Historical Overview of the Electric Utility Industry………………………………….....…….5
Market Opportunity…………………………………………….…...………………………..…6
Baseline Assumptions...………………………………………………………………………….8
Historical View on Commercial Electricity
Increased Infrastructure Costs
Increased Fuel Costs
Climate Change and Energy Independence Measures
Forecast of Commercial Electricity Prices
Forecast of Solar Production Prices…………………………………………………………...13
Solar Feasibility at the University of Redlands.…………….………………………………...15
Spatial Layout…………………………………………………………………………………..17
Rooftop
Parking Structure
Fixed-Axis Ground-Mount
Financing Options…………………………….………………………………………………..27
Parking Structure
• Construction Costs
• Purchase
• Power purchase agreement (PPA)
Fixed-Axis Ground-Mount
• Construction Costs
• Purchase
• Power purchase agreement (PPA)
Conclusion…………………………………………..…………………………………………..34
Appendix
References
Acknowledgements

3
PROJECT SUMMARY
The purpose of this study is to assess the viability of solar production on the University of
Redlands campus. In consideration of the University’s financial information, alongside other
significant environmental and policy factors, the study will aid decision-makers in assessing and
comparing solar array models on campus.
To find the most compelling arguments, three permutations of spatial layouts of the solar arrays
and three financing options for a solar array on the University of Redlands campus. The spatial
layouts involve three installation options utilizing parking structures, the university’s roofs, and
open space in which panels may be ground-mounted. The rooftops have been assessed with GIS
technologies in order to fully utilize all potential scenarios with the intent of maximizing
electricity output and remain consistent with building codes.
The two financing options involve a purchase option and a power purchase agreement (PPA)
which is a leasing of the solar panels. The analysis incorporates historical rates of return on the
University endowment fund as well as projections for the life of the proposed solar array.
Significant policy and macroeconomic variables will be discussed in detail along with
assumptions used to forecast the performance of potential solar installations.

4
CONTEXT
The University of Redlands is a private liberal arts and sciences university located in Redlands,
California located on the urban fringe of Los Angeles. The university hosts 42 undergraduate
programs, the Johnston Center where students can create their own major, and 3 graduate
programs contributing toward the University’s academic prowess and diversity. The University’s
main campus sits on 160 acres near downtown Redlands.
In order to better understand the economic dynamics of solar power as an electrical generation
facility, a detailed financial model was developed. The model can predict how the solar array
would perform during its life cycle. In the financial portion of the study, the financial dynamics
and assumptions will be explained in detail and key variables will be isolated for future analysis.

5
HISTORICAL OVERVIEW OF THE ELECTRIC UTILITY INDUSTRY
Historically, electricity has been produced by a variety sources, mostly deriving from fossil fuels.
As of 2010, fossil fuels account for approximately 70 percent of the energy used in the US and
non-renewable account for 90 percent.1 Most commercial power comes from turbine engines
powered by steam produced by burning fossil fuels, mainly coal and natural gas. Other power
sources include steam from nuclear reactors; conventional hydroelectric conversion; and
renewable sources such as solar, wind, and geothermal. Coal produces about 45 percent of
electricity used in the US; natural gas, 23 percent; nuclear, 20 percent; and hydroelectric, 7
percent.
The energy harnessed from these sources has enabled huge advances to society by means of
technology, quality of life, economic growth, etc.. However, non-renewables also cause a variety
of significant problems ranging from environmental degradation, climate disruption, and
pollution of air and water supplies to health problems such as asthma. Solutions such as natural
gas are cleaner but still have major detriments such as producing massive amounts of carbon
dioxide.
Many of these factors are considered externalities because of their inability to fit squarely into
regular economic models. The comparison and debate over what should be done about such
matters cannot be resolved with apples-to-apples comparisons but in the political arena. The
reality is that although erratic, policy on such matters is becoming more highly prioritized - and
energy markets are in changing because of them. Luckily, trends in energy prices and
consumption are more predictable than government policy. Rising electricity rates have been a
major contributing factor opening renewable energy markets such as hydroelectric, biomass,
geothermal, solar, and wind.
1 “Consumption for Electricity Generation by Energy Source: Total (All Sectors), Selected Years, 1949-2010.”US Energy Information Administration, Annual Energy Review 2010, p.234, Figure 8.4a
6
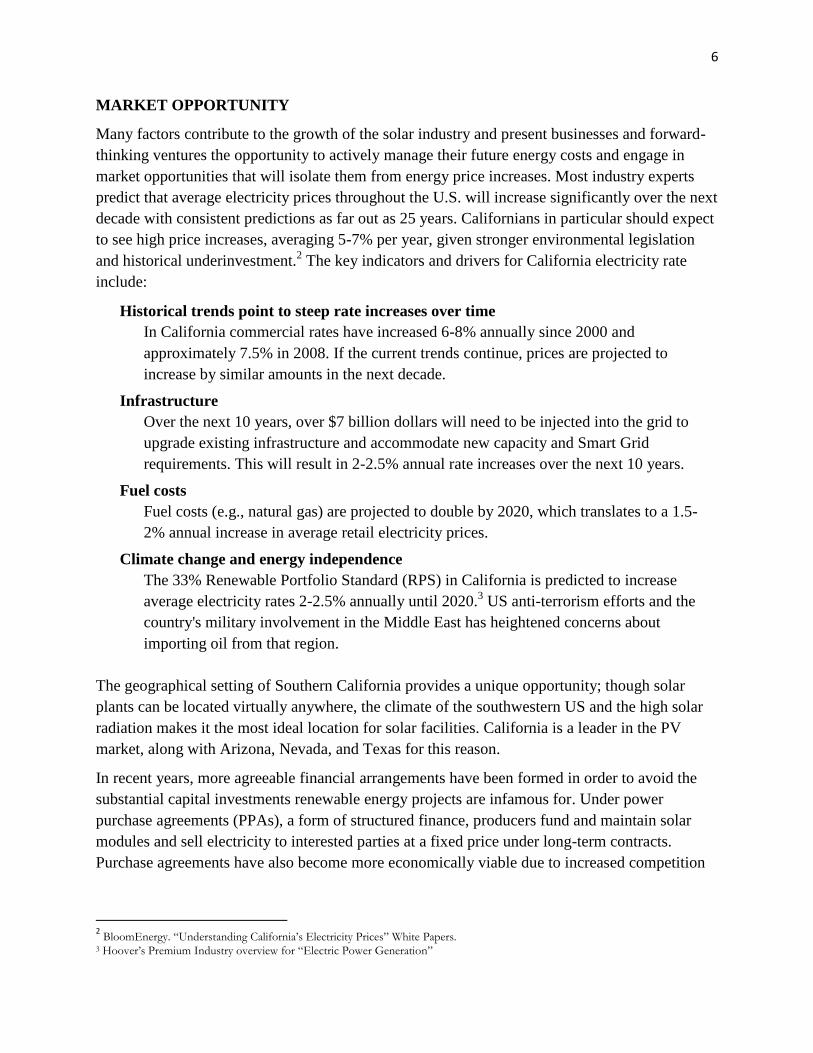
MARKET OPPORTUNITY
Many factors contribute to the growth of the solar industry and present businesses and forward-
thinking ventures the opportunity to actively manage their future energy costs and engage in
market opportunities that will isolate them from energy price increases. Most industry experts
predict that average electricity prices throughout the U.S. will increase significantly over the next
decade with consistent predictions as far out as 25 years. Californians in particular should expect
to see high price increases, averaging 5-7% per year, given stronger environmental legislation
and historical underinvestment.2 The key indicators and drivers for California electricity rate
include:
Historical trends point to steep rate increases over time
In California commercial rates have increased 6-8% annually since 2000 and
approximately 7.5% in 2008. If the current trends continue, prices are projected to
increase by similar amounts in the next decade.
Infrastructure
Over the next 10 years, over $7 billion dollars will need to be injected into the grid to
upgrade existing infrastructure and accommodate new capacity and Smart Grid
requirements. This will result in 2-2.5% annual rate increases over the next 10 years.
Fuel costs
Fuel costs (e.g., natural gas) are projected to double by 2020, which translates to a 1.5-
2% annual increase in average retail electricity prices.
Climate change and energy independence
The 33% Renewable Portfolio Standard (RPS) in California is predicted to increase
average electricity rates 2-2.5% annually until 2020.3 US anti-terrorism efforts and the
country's military involvement in the Middle East has heightened concerns about
importing oil from that region.
The geographical setting of Southern California provides a unique opportunity; though solar
plants can be located virtually anywhere, the climate of the southwestern US and the high solar
radiation makes it the most ideal location for solar facilities. California is a leader in the PV
market, along with Arizona, Nevada, and Texas for this reason.
In recent years, more agreeable financial arrangements have been formed in order to avoid the
substantial capital investments renewable energy projects are infamous for. Under power
purchase agreements (PPAs), a form of structured finance, producers fund and maintain solar
modules and sell electricity to interested parties at a fixed price under long-term contracts.
Purchase agreements have also become more economically viable due to increased competition
2 BloomEnergy. “Understanding California’s Electricity Prices” White Papers.
3 Hoover’s Premium Industry overview for “Electric Power Generation”

7
of financiers. Appeal comes from increased technology standards, increased lifetime guarantees
on solar modules from the manufacturer, and incentives programs.
Aimed toward the University, there is evidence of growing demand for desired commitment to
renewable energy in higher education. A snapshot of recent surveys and reports might include
the following:
The Princeton Review's 2008 and 2009 “College Hopes & Worries” Surveys indicate a growing
and deepening interest among incoming freshmen in sustainability and environmental issues. In
answer to the question “If you (your child) had a way to compare colleges based on their
commitment to environmental issues (from academic offerings to practices concerning energy
use, recycling, etc.), how much would this contribute to your (your child’s) decision to apply to
or attend a school?”, 24% said it would "Strongly" or "Very Much" contribute to their
assessment of a school.
A survey of over 1700 students across nine diverse campuses by researchers at the College of
William and Mary found that “current freshmen are two times more likely to choose their school
based on sustainability concerns than the entering freshman class just 3 years ago (13.5% vs.
6.5%, respectively).” Results of a 2008 survey of 240,580 first-year, full-time students at 340
four-year institutions conducted by UCLA's Higher Education Research Institute, found that
almost half (45.3 percent) said "adopting 'green' practices to protect the environment" is
"essential" or "very important" to them.
The 2009 editions of Princeton Review's college guides included a new “Green Rating” for 534
colleges and universities. The Kaplan College Guide 2009 included a special “Green Section”
featuring 25 green campuses and 10 green careers. Peterson's college guide has or is about to
release a guide to green campuses, and the US News & World Report has expressed interest in
developing green rankings of its own.
In sum, the University has the opportunity to become more independent from the volatile
markets of fossil fuels, unpredictable legislation and incentives, and lock-in an energy price. The
geographical setting of Southern California is optimal and the financial climate for solar is the
best it has ever been. Larger portions of prospective students are making decisions about where
to apply and attend based on campus commitment to sustainability and environmental
stewardship. Redlands is currently posed to actively engage this interest and has the ability to
distinguish our commitment to sustainable practices from peer institutions.

8
BASELINE ASSUMPTIONS: HISTORICAL VIEW ON COMMERCIAL
ELECTRICITY
It is no longer prudent to assume that electricity will be consistently cheap or reliable. The
drivers of infrastructure investment, heightened fuel costs, and climate related legislation listed
in the above section have increased California electricity prices more than 45 percent since
20004.
Average retail electricity prices across the nation have increased significantly since the 1970s
and particularly since 1999 (see chart on next page5). According to the U.S. Energy Information
Administration (EIA), the average U.S. retail price of electricity increased more than 85 percent
over the past 25 years and over 8 percent during the first quarter of 2009 compared to the first
quarter of 2008. Moreover, large states such as New York and California saw prices increase at
an even faster rate, causing concern for residential and business customers alike.
In California, power prices rose sharply after the electricity crisis in 2001 and have been rising
steadily ever since. According to the California Public Utility Commission (CPUC), average
prices for Pacific Gas & Electric (PG&E) and
Southern California Edison’s (SCE) customers
have increased 44 to 65 percent since 2000.
This translates to average rate increases of
nearly 6 percent annually.6 Since the 1970s,
California customers have also experienced
two energy crises: the 1970s fuel crisis and the
California electricity crisis of 2001. As a result
of these crises, rates jumped up to 30% at
certain points, while price decreases have
never totaled more than 7%.
Based on historical trends and current market
forces, most industry experts predict that
average electricity prices throughout the U.S.
will continue to increase rapidly. Californians
in particular should expect to see even higher price increases during the same timeframe given
stricter environmental regulations. In both cases, electricity prices will certainly outpace inflation
and may reach 7 percent annually.7
4 EIA. “Annual Energy Outlook 2009.” April 2009 5 “Utilities Seek Round of Rate Increases.” Wall Street Journal November 27, 2009. 6 CPUC, Electricity Rate Charts and Tables 2000-2009, 7 BloomEnergy. “Understanding California’s Electricity Prices” White Papers.

9
BASELINE ASSUMPTIONS: INCREASED INFRASTRUCTURE COSTS
During the 1970s, 80s and 90s, national investment in transmission and distribution
infrastructure dropped substantially. The Department of Energy (DOE) reported that as
electricity demand increased 50 percent from the 1970s to the 1990s, annual investment in new
transmission capacity fell from $5.5 billion to less than $3 billion.8 Because of this
underinvestment, the North American Electricity Reliability Corporation (NERC) states that
demand for transmission capacity will exceed supply starting in 2013.9
To compensate for decades of underinvestment, utilities have started reinvesting in core
infrastructure. The Edison Electric Institute (EEI) estimates that over the next 20 years, the U.S.
electric utility industry will need to spend “between $1.5 trillion and $2 trillion dollars” on these
types of capital projects. Experts at the California Independent Service Operator (CA ISO) and
the California Energy Commission (CEC) project that California utilities will need to spend
close to $5 billion to update the current system and another $2.6 billion to accommodate
additional capacity being built to meet current demand for electricity.10
Furthermore, California
utilities predict that upwards of a quarter trillion dollars are needed to make the current system
“smart” by incorporating smart grid technology to achieve current environmental standards.
Moreover, construction and land costs have risen over the past five years, making infrastructure
investments more costly. According to Edison Electric Group, utility construction costs have
increased from 25 to 100 percent since 2000.10 Utilities will continue to face pressure to fund
capital improvements, and these investments will be recovered through higher rates. Capital
improvements are expected to raise retail electricity rates 2 to 2.5 percent annually for the next
10 years.
BASELINE ASSUMPTIONS: INCREASED FUEL COSTS
The electric utility industry is the largest consumer of coal and natural gas in the U.S and the cost
of these fuels help drive retail electricity prices across the United States. Nearly 50 percent of the
nation’s energy is produced using coal, and when coal prices increased over 25% in 2008,
utilities saw their generation costs soar11
. Both the financial markets and the EIA estimate that
natural gas prices will double over the next decade as a result of 30 percent higher demand.12
In
addition, natural gas prices might even surpass current projected levels if climate change
legislation forces domestic generators to switch from coal to cleaner substitutes such as natural
gas.13
8 BloomEnergy. “Understanding California’s Electricity Prices” White Papers.
9 “NERC 2007 Long-Term Reliability Assessment,” NERC, October 2007. 10 “CAL ISO Report on Preliminary Renewable Transmission Plans,” CAL ISO, August 2008.; “Transforming America's Power Industry,” The Brattle Group, November 2008. 11 “Coal prices surge to record high,” BBC News, February 4, 2008 12 “Natural Gas Price Forecast and Uncertainty,” Working paper presented by Ruben Tavares at the Joint IEPR and Electricity & Natural Gas Committee Workshop, June 2009. 13 Interviews with National Renewable Energy Lab researchers, LBNL, June 2009.

10
In California, natural gas-powered generation dominates, but only 13 percent of natural gas is
supplied in state and that number is falling.14
Consequently, California utilities are openly
exposed to market price volatility. For example, gas prices more than quadrupled in 2001
causing California utilities to spend nearly $19 billion on natural gas - twice as much as in
normal years. Six months later electricity rates skyrocketed 29 percent and never returned to pre-
2001 levels.
As a result, the California Energy Commission estimates that “doubling of natural gas prices
increases average electricity rates by about 3.5 cents/kWh [over 2008 prices].”15
Given future
price levels and inflation estimates, this equates to rate increases of 1.5 to 2 percent annually
from rising fuel prices alone.
BASELINE ASSUMPTIONS: CLIMATE CHANGE AND ENERGY INDEPENDENCE
MEASURES
Oil and natural gas prices can be very volatile and are affected by severe weather and global
political events. While coal prices have been relatively stable and have large domestic reserves,
operational costs can increase substantially as a result of regulatory changes on gas emissions as
well as the severe costs associated with opening new coal-fired power plants. To insulate
production costs and minimize the effect of fluctuating fuel prices as much as possible, utilities
have been diversify the types of fuel required by their plant and negotiating long-term contracts.
California passed its own climate emissions bill, AB 32, in August 2006. The law calls for a 10%
reduction of greenhouse gases and places strict regulations on power plant emissions. To comply
with these regulations, generators must make expensive improvements or pay penalties, which in
turn make power more costly.16
Furthermore, Governor Schwarzenegger issued an executive
order to revise the current Renewable Portfolio Standard (RPS) and require Californian utilities
to source 33 percent of their power from renewable sources by 2020. Like AB 32, this law is
expected to cause retail electricity rates to increase significantly. According to a California
CPUC report published in June 2009, inflation-adjusted electricity rates will increase 5.0 to 6.5
percent above current baseline projections to meet California’s clean energy requirements.17
BASELINE ASSUMPTIONS: FORECAST OF COMMERCIAL ELECTRCICITY
PRICES
According to the Energy Information Agency’s (EIA) 2012 Annual Energy Report, based on
current policies the rate of demand growth for energy rises at an average rate of .8 percent
through to 2035. Total US manufacturers' shipments, an indicator of demand for energy used in
manufacturing operations, rose 9.8 percent year-to-date in February 2012 compared to the same
14 Natural Gas Price Forecast and Uncertainty,” Working paper presented by Ruben Tavares at the Joint IEPR and Electricity & Natural Gas Committee Workshop, June 2009. 15 CEC Natural Gas Assessment, California Energy Commission, November 2008. 16 Interview with Catherin Wolfram, PhD., UC Energy Institute, July 2009. 17 “RPS Implementation Report”, CPUC, June 2009.

11
period in 2011. Fossil fuel energies are predicted to become more expensive as reserves become
harder to find, extraction becomes more costly, and preventative legislation is passed. The spot
price of crude oil, a key component for electric energy profitability, rose 6.2 percent in the week
ending April 13, 2012, compared to the same week in 2011. This indicates the rising price of
conventional fossil fuels such as crude oil and coal will lead to the eventual adoption of cheaper
methods, some of which will come from renewable energy sectors.
Total electricity consumption, including both purchases from electric power producers and on-
site generation, grows from 3,879 billion kWh in 2010 to 4,775 billion kWh in 2035 in the
AEO2012 Reference case, increasing at an average annual rate of 0.8 percent. Domestic coal
prices are expected to jump from $35.61 per short ton to 49.24 and natural gas from $4.16 per
thousand cubic feet to $6.52 in 2010 dollars. The combination of slow growth in electricity
demand, competitively priced natural gas, programs encouraging renewable fuel use, and the
implementation of new environmental rules dampens the prospect of coal use in the future. Even
so, coal remains the dominant energy source for electricity generation, but its share of total
generation declines from 45 percent in 2010 to 39 percent in 2035.
Increased generation from renewable energy in the electric power sector, excluding hydropower,
accounts for 33 percent of the overall growth of electricity generation from 2010 to 2035.
Generation from renewable resources grows in response to Federal tax credits, State-level
policies, and Federal requirements.
Electricity rates vary greatly throughout the US, depending on the availability of natural
resources and the stringency of environmental controls. The cost of environmental pollution
controls are a major consideration in
selecting a power source. The EPA and
its state equivalents oversee the control of
emissions produced by power plants.
Petroleum and natural gas emissions can
be controlled at reasonable costs, but
prices for these fuels are often volatile
(see chart). Coal prices are the most
stable of potential fuels, but emission
controls can be expensive and some of
the control technology is untested.
Carbon dioxide, which is classified as a
greenhouse gas and considered harmful,
is not regulated, but is considered in approving new and expanded plants.
Issues concerning safety (nuclear); long-term cost (natural gas); and greenhouse gases (coal) are
complicating and making the approval process for new power plants more expensive. Federal
and state legislatures are actively encouraging development of electric power from wind, solar,
geothermal, and hydro sources. A number of states have set capacity targets for utilities called

12
Renewable Portfolio Standards (RPS) requiring a certain amount of renewable power to be
produced. A number of state initiatives, including California, are aimed at increasing the
proportion of commercial electric power generated from renewable sources to more than 30
percent.
Possible climate change legislation has become a deciding factor in the type of fuel that new
power plants will use. Coal and natural gas will continue to be the fuels of choice in the short
term mostly, but other fuels are predicted to gain popularity as they become more economically
viable. More than half of the capacity at generation facilities pending application in mid-2011
was scheduled to come from sources other than coal or natural gas, such as wind energy and
solar, according to the American Public Power Association. New environmental legislation may
lead to costly plant updates, new plants for alternative fuels, and plant closures. In many states,
including California, regulators won't consider applications for new coal and nuclear plants.

13
FORECAST OF SOLAR PRODUCTION PRICES
Renewable fuels will gain a larger share of the US electricity generation market over the next
two decades, according to a recent government report. The Annual Energy Outlook, released by
the US Energy Information Administration (EIA) in February 2012, projects that energy
generated from renewable sources, including solar, is expected to increase 33 percent between
2010 and 2035 and to go from 10 percent of total US net electricity generation to 16 percent. The
share of U.S. electricity generation coming from renewable fuels (including conventional
hydropower) grows from 10 percent in 2010 to 16 percent in 2035 contributing to a projected
drop in average electricity prices 9.8 to 9.5 cents per kWh. In these cases of projected growth,
Federal subsidies for renewable generation are assumed to expire as enacted. Extensions of such
subsidies could have a pose a larger growth trajectory on renewable generation.18
As with other forms of alternative energy, the health of the solar industry depends on
government subsidies. Currently, the investment tax credit (ITC), and the state equivalents of
renewable portfolio standards (RPS), and a combination of residential and commercial tax
incentives have a large part in making solar energy affordable and drive the industry. These
credits and standards set capacity targets for utilities and regulate the amount of power produced
using renewable sources. In 2008, Congress extended the ITC for eight more years and allowed
utilities and alternate minimum tax filers to take the credit.
The Obama administration's fiscal 2013 budget includes an extension of a crucial program that
has encouraged more than $24 billion in private sector investment in clean energy projects.
Released in February 2012, the proposed budget would revive the Section 1603 Treasury
Program, which provides federal grants in lieu of tax credits to reimburse some of the costs of
commercial installation of solar and other renewable energy projects. Before expiring at the end
of 2011, the 1603 Program awarded more than 4,000 solar-related grants totaling $1.75 billion
and prompted private solar investments exceeding $4 billion.19
Extending the 1603 program
would help US solar power producers; however, the president's budget proposal will likely see
significant revision in Congress. Growing emphasis in Washington on reducing the federal
deficit threatens support for stimulus programs of any kind.
Though installations on individual customer sites have traditionally accounted for the majority of the
solar electricity generated in the U.S., centralized solar projects are growing rapidly. Utility ownership of
solar increased more than 300 percent in 2010, according to the Solar Electric Power Association. The
projections for industry growth slow based on current subsidy packages (see chart below20
)
which expire in 2016.
18 Hoover’s Premium Industry overview for “Solar Power Generation” 19 Solar Energy Industries Association (SEIA) 20 First Research forecasts are based on INFORUM forecasts that are licensed from the Interindustry Economic Research Fund, Inc. (IERF) in College Park, MD. INFORUM's "interindustry-macro" approach to modeling the economy captures the links between industries and the aggregate economy.

14
More than 80 percent of utility-scale solar projects under development at the beginning of 2012
were PV solar.
The competitive environment for solar power generation is complex, as the independent power
producers and utilities that offer solar power often do so as part of a larger power portfolio; fossil
fuels (coal, natural gas, and petroleum) continue to dominate the energy market. As a
technology, solar competes with other forms of renewable energy, such as wind, for investment
dollars. U.S. solar electric capacity in 2011 exceeded 3,650 MW, enough to power more than
730,000 homes.

15
SOLAR FEASIBILITY AT THE UNIVERSITY OF REDLANDS
The UoR has a unique opportunity to proactively invest in solar energy for purposes of earning a
high monetary yield, energy independence, prospective student appeal, and environmental
stewardship.
Concentrated solar power (CSP) and photovoltaic (PV) power are the primary technologies
behind solar electricity generation. While CSP is more established for utility-scale projects (over
10 MW), large PV deployments have increased in recent years as the technology has become
more affordable. For the size of the projects that could be achieved at the UoR as well as general
versatility, PV panels were chosen.
With PV panels determined as the appropriate source of solar power, the study was conducted to
find the appropriate area for the panels to be installed, the type of installation, the size of the
system, and the financing mechanism employed. The following proposals involve two distinct
parts: spatial layouts and financing options. The permutations and methodologies of all sought
after solutions have been exhausted in these following pages. The final section will compile the
results, analyze the data, and conclude with suggestions for the University.

16
SPATIAL LAYOUTS
Three permutations of spatial layouts were considered in the study: rooftops, parking structures,
and ground-mount. These differentiated layouts utilized different spaces available on campus.
The feasibility of these layouts were determined taking many political, economic, and practical
factors into account which will be examined in the study below.
ROOFTOPS
The rooftops were the most obvious space on campus to use as they were the least traversed and
utilized. Using ArcGIS and other tools, the solar radiation for all the rooftops of University
buildings and potential sites were found. As seen in Figure 1, maps were constructed to simulate
the University campus very closely. The 3-dimensional environment was determined in order to
show the aspect and slope of each site, giving precise and accurate measures of solar potential
for each rooftop and potential site on campus.
Figure 1: This ArcScene document encompasses campus and UoR Buildings datasets. Image is similar to what one would see on Google Earth,
however using ArcGIS technology it can be used to run solar analysis.
Using data obtained from the City of Redlands A square foot scale was used to assess the solar
potential of each building which was important in selecting optimal installation sites. As seen in
Figure 2, each pixel represents the solar potential for every given square foot of a given rooftop.

17
Figure 2: The image above shows the LiDAR points in blue and the Digital Surface Model it created on the bottom in grey. The DSM is a result
of the original LiDAR data points.
The data was processed to create a Solar Radiation layer, showing shades between red and green.
As displayed in Figure 3, the green sites with low potential were generally attributed to trees, tree
shading, or sides of buildings indicating they were less eligible candidates for solar production.
Red coloring measured highly concentrated solar radiation. These were primarily the southern
facing rooftops or unused land plots surrounding the University Campus. The green coloring is
from the solar radiation measuring from 0-1500 Kilowatts/meter2. The orange layer measures
from 4000-4999 kw/m2. The red layer measures from 5000 and above kw/m
2. From this spatial
data, candidate locations for maximized solar production can be easily sought out.
Figure 3: The Area Solar Radiation tool produced another raster dataset precisely the same as the DSM. Red coloring indicates high density of
solar radiation, while green indicates low levels. For reference, Administration building is circled in black, Armacost Library in white.

18
The spatial data shows that some buildings are not appropriate for solar production. For example,
The California dorm as seen in Figure 4 has been obstructed by an overhanging tree and has
limited South-facing roof.
Figure 4: The California Dorm building is shown above with analysis of solar radiation.
Overall, the solar potential for the University campus was outstanding. For political reasons,
some of the buildings were removed from consideration leaving five buildings with excellent
potential including North Hall, Merriam Hall, Ann Peppers Art, Frederick Loewe and Theater
Arts, and Armacost Library which can be seen circled in Figure 5
Figure 5: Circled in black are the buildings which can harness the most solar potential. From top to bottom: North and Merriam Halls, Armacost
Library, Ann Peppers Art Gallery on the left, and Frederick Loewe Theater on the right.
The total area of the buildings resulted in approximately 2.4 acres with the breakdown displayed
in Table 1. This acreage was cut down to 1.75 acres in order to take into account obstructions on

19
the roofs and allotting an 8 foot gap between the edge of the building and the panels for
maintenance. It should be noted that this is a very conservative figure considering the few
obstructions on the rooftops.
University Building Acreage
North Hall .3358
Merriam Hall .3575
Ann Peppers ~.70
Fred Loewe ~.70
Library .35
Total Roof Area 2.4433
Conservative Total 1.75
Table 1: A compiled dataset of acreages from the candidate buildings with excellent rooftop solar potential.
A solar array covering 1.75 acres would produce approximately 370 kW AC (440 kW DC at a
.77 DC to AC derate efficiency factor). The array would supply the school with 4 to 5 percent of
its annual consumption.21
Based on the electricity rates the University pays to Southern
California Edison (SCE), the array would supply the university with $85,491 of energy value
independently.22,23
Through professional opinions from Jared Quient of AMSolar, a solar company primarily
associated with installations at universities, the most economical choice for the university would
not involve utilizing the roofs due to the high cost of multiple inverters used to convert the
energy obtained from the panels in DC current to AC current. With five different location sites
for the panels there must be 5 separate inverters to convert the DC to AC electrical currents. The
relatively high price (ranging from $15,000 for 50 kW to $25,000 for 100 kW inverters) and
typical supplier guarantees of only 10 years on inverters raises risk levels significantly and does
not take advantage of economies of scale. Other considerations of the viability were the
reluctance of facilities management to take on the additional risk and responsibility of installed
capacity on the roofs. Installation would impede the ability to renovate or demolish old buildings
such as North and Merriam Hall. It would also require drilling into the roofs which increases the
due diligence of an already stretched thin facilities management team.
21 Total university consumption 14 to 15 million kW per annum; conversations with Rick Quinbar of Facilities management 22 SCE charges 13.22 cents per kWh; conversations with Rick Quinbar of Facilities management 23 Figures found through PV Watts version 1. The full table of savings can be found in Appendix 1.

20
The payback period, or more simply put, the number of years it would take for the savings from
avoided utility bills to pay for the cost of the solar array, were not fully considered or modeled
due to strong opposition. A rough approximation results in a payback period ranging from 20 to
30 years which would result in a return on investment far lower than that which the long-term
return on the endowment fund of the university would reap.24
Based on this study, further assessment should be considered in future building operations at the
university. All buildings to the south of Sylvan Blvd. have no building code restrictions on the
roofs by the University or the City thus the Spanish tiles employed on the North Side of campus
need not be used.25
Instead, flat roofs or roofs with large south-facing sides should be considered
for solar production. Constant improvement of technology should result in a consistent
monitoring of micro-inverter prices as well as conversion efficiencies (DC to AC derate factor)
by the University as a determining factor for action.
PARKING STRUCTURES
The basic idea behind a solar parking structure is simply to incorporate solar panels into a carport
or parking lot. The main benefit is to generate renewable energy that can be used to lower utility
costs of the University. Additional benefits include reduced carbon emissions from using less
plant-generated electricity, vehicle shading, and the public display of sustainable practices.
The structures take no additional space but simply use the parking lots for multiple uses. A solar
carport can help reduce the “heat island” effect of parking lots and contribute to a cooler
community, and by providing protection from the elements it can help enhance vehicle lifespan.
Overall, the return on investment for property owners can be in the range of 10 to 15 percent,
according to Ryan Park, director of business development for REC Solar, a California-based
solar installation firm that has designed parking-lot projects.
In parking lots, solar projects are usually constructed in one of two ways: the traditional row
after row of raised rectangular strips; or column after column of single pole-mounted panels,
resembling a grove of trees. The suggested approach is the installation of raised rectangular
strips, as seen in Figure 6 below, because of the wide open spaces available with the University’s
large parking lots in order to maximize production.
24 The 20-year annualized rate of return on the University of Redlands endowment fund, net of fees, is 8.8%. Information obtained via email dialogues with Dr. Phil Doolittle. 25 Conversations with Dennis Christensen, Director of Real Estate at the University of Redlands

21
Figure 6: The wide-open parking lots of the University can be utilized most effectively with rowed parking structure.
26
There were seven parking lots found of substantial size, excellent solar potential, and within 100
feet of the electrical tie-in points (to reduce transmission costs) which can be viewed in Figure 7.
Figure 7: Candidate parking lots (red rectangles) for solar parking structures with 100 foot proximity to electrical tie-in points (blue circles).
Moving from top to bottom, the parking lot behind the Chapel has three rows (1 x (90 ft. x 40
ft.), 2 x (200 ft. x 40 ft.)). The smaller row would support 162 panels (6 x 27) while the larger
two rows can support 360 each (6 x 60) totaling 882 panels behind the Chapel.
The Armacost Library in the center of campus (240 ft. x 65 ft.) can support 720 panels (10 x 72).
26 Solar power transforms parking lots into green job generators. CleanTehcnica.com. publ. August 3, 2010.

22
The Appleton parking lots located on the Western border of campus are the largest proposed
parking structures (2 x (390 ft. x 40 ft.), 2 x (190 ft. x 40 ft.)). The two larger rows can support
702 panels each ((6 x 117) x 2) while the two smaller rows would support 342 each ((6 x 57) x 2)
totaling 2088 panels in the Appleton parking lot.
The Admissions parking lot is the Southern-most plot as well as the smallest (40 ft. x 160 ft.)
The area can support 252 panels (6 x 42).
The converted acreages of each proposed parking structure can be viewed in Table 2 below.
Parking Lot
Location
Acreage Watts Cost
Chapel 0.45 246.7 kW $864,360
Armacost
Library
0.36 201.6 kW $705,600
Appleton 1.07 584.6 kW $2,046,240
Admissions 0.15 70.5 kW $246,960
Total 2.03 1.103 MW $3,863,160
Table 2: A compiled dataset of acreages from the candidate parking lots with excellent solar potential and a proximity of less than 100 feet from
a tie-in point. The cost was determined on the industry standard of $3.50 per wall for parking structures.
The parking structures are the most expensive on a per watt basis of the three spatial options due
to the higher cost of materials and installation. Yet the appeal of the structures comes from their
dual use of space as well as the appeal to incoming students. Figure 8 shows the current route
given to potential students on campus tours. As evidenced, without diversion from the current
route, the proposed structures in the Chapel and Armacost Library parking lots would be
traversed displaying the active environmental stewardship of the University. The two other plots
in the Appleton and Admissions parking lots are within easily accessible range of tours for
minimal diversion from current routes as well.

23
Figure 8: The following map displays the proximity of the current prospective student tour (black and yellow line) to the proposed parking
structures.
The same issues of high costs for multiple inverters presented in the rooftop section would be
shared by the parking structures. The structures do not take advantage of economies of scale the
way a ground-mount array would due to multiple inverters used and the cost of constructing the
structures upon which the panels would rest incurs additional costs. Yet unlike the rooftop
proposal, there would be little to no additional risk and responsibility (depending on the
financing method employed) of installed capacity in parking lots for facilities management to
take on.27
The proposed structures are all on lots that have no construction projects in the
pipeline so the dual usage would only add value to the land.
The avoided costs of having a solar array in parking lots would be politically feasible as well as
financially. Approximations can only be given at this time because the profitability of the project
would be determined by the incentive rates in place through the California Public Utility
Commission (CPUC) as will be discussed in further detail in the Financing section below.
Recent projects have been completed with projected return rates from 8 to 10 percent which rival
the University’s 20-year average (8.8%).
27 Conversation with Tim Webb, Head Electrician

24
FIXED AXIS GROUND-MOUNT
The fixed-axis project has the most potential to be economically feasible in terms of creating a
return greater than the historical rate of return on the endowment is a ground-mount system. The
fixed axis ground-mount system was chosen over the single and double-axis trackers because the
up-front costs of the fixed-axis trackers are much lower ($150,000 less per string of panels28
)
which outweighs the benefit of the higher yield attributed to the tracking systems.
The study surveyed all the property owned by the university, including property owned or leased
by the University adjacent to the campus. Figure 9 displays undeveloped plots over one acre in
size.
Figure 9: The plots outlined in red met the criteria of being over 1 acre and currently undeveloped.
Table 3 below displays the acreages and locations of the candidate plots. The plots at the North
end of campus are ineligible for installation due to construction plans of Fitness Centers. Other
plots also have undisclosed building plans. Yet, the largest plot located in the South West corner
of the campus was appealing due to its ability to hold a larger capacity of solar panels, avoid the
proposed railway station’s construction area, and several other alluring factors.
28 Conversations with Jared Quient, AMsolar

25
On / Off Main Campus Ground-Mount Candidate
Locations
Acreage
On Behind Theta House 6.9
On West of Football Field 3.3
On South of Beta Lambda House 1.8
Off West of Football Field 3.45
Off East of Theta House Plot 3.15
Off Cumulative plots south of
Theater Arts Complex
3.55
Table 3: Displays acreages and location of plots outlined in Figure 9.
The entire area South of the Zanje River is a 100-year flood plain. This complicates the
construction of buildings but not solar installations. The solar modules will be installed on poles
approximately 2 feet off the ground rendering them impervious to low-flood measures. Figure 10
displays the feed-in meter, the 800 foot run to the two inverers, and the proposed construction
configuration. To aviod interfereing with the proposed train station, the propsed area is only 5
out of the possible 6.9 acres and shifted North, away from the tracks. The installation would be a
fixed ground mount system with 4320 modules with a 6’ fence surrounding the area.

26
Figure 10: Outlined in red is the parcel of land behind the Theta sorority house. Cross streets are Cook and Sylvan, Grove and Sylvan. The land
plot is 6.9 acres.
There will be twelve panels side by side on one axis. They would be two panels high, totaling to
24 modules per group. Each string would total 6’ 8” in height which has been modeled in Figure
11 for approximate accuracy. The modules would be spaced 13’ apart for maintenance access.
Figure 11: Approximate size reference of panels.

27
FINANCING OPTIONS
The two financing options involve purchasing the array and a power purchase agreement (PPA)
which is a leasing of the solar panels. The analysis employs the University’s historical rates of
return as a major metric to judge the investment quality of the proposals. The 20-year average
has been targeted to avoid short-term comparisons to more volatile securities markets and to
match the industry standard for module guarantees. Various qualitative factors that have the
potential to affect the dynamics of the price structure will be discussed in the following section.
Significant assumptions used to forecast the array’s performance will be explained in detail.
The assessment on costs of the solar systems will be divided into two portions: parking structure
and ground-mount. The costs of the rooftop option were not fully assessed due to prohibitive
costs and political will against the operation.
PARKING STRUCTURE
Construction Costs
Through professional opinions from Jared Quient of AMSolar, a solar company primarily
associated with installations at universities, the pricing of the parking structures would stand at
$3.50 per watt in the following breakdown.
Parking Structure cost breakdown: Total $3.50/watt
1.00 Panels
.50 Parking structure
.25 Inverters
.30 Racking
.90 Electrical installation
.30 Balance of system parts
.15 Interconnection costs (includes run from pt of interconnect to meter typically)
.10 Engineering and permitting.
The explanation of all the costs is explained in detail below:
Starting with the panels, the main cost of the operation from the modules, but due to
technological advances, expanded market availability, and increased efficiency of distribution,
the price of panels continue to drop dramatically. For reasons already mentioned, there is no
telling how quickly they will drop but direct subsidies to the industry have a large influence on
the development of the market and progress toward grid parity.
Most modules have a 10 year performance guarantees and some, like those in the Yingli
Multicrystaline 72 Cell Series, have 25 year performance guarantees. As a national standard for
solar panel companies, the panel modules themselves have a guarantee of no less than 90%
efficiency for 10 years, and no less than 80% by year 25. The YL 280P-35b model produced by

28
Yingli Solar has a very competitive limited power warranty which guarantees 91.2% efficiency
at 10 years and 80.7% at 25 years. If such decrease in power below said thresholds is due to
defects in materials or workmanship under normal application, use and service conditions, Yingli
Solar will remedy such decrease in power by, at its reasonable option, either (a) replacing or
repairing the defective PV Module at no charge to the Customer for replacement modules or
parts, (b) providing the customer with additional PV Modules to make up for such decrease in
power so that the power output equals or exceeds the 91.2% or 80.7% threshold, provided, it is
possible for the customer to mount such additional PV Modules or (c) refunding the difference
between the actual power output of the PV Module and said threshold, based on the current
market price of a comparable PV Module at the time of the Customer’s claim.29
Inverter costs are the next most substantial investment on a technology. The largest capacities for
inverter stations are 500 kW thus two inverters would be needed for a 1000 kW AC system.
Approximate cost of a 500 kW inverter is $125,000 thus the full cost incurred would be
$250,000.
The racking involves the physical installation of the ground-mount array and the provision of
such materials to support the panels. I considered that although undisclosed by the University,
there would most likely be future plans for the land and possibly the roofs. Anticipating the
plans, I found a solution in which the solar array would remain “temporary”: ground screws.
Ground screws eliminate the need for concrete and allow foundations to be set within minutes,
not hours. The accelerated foundation method has greatly reduced installation times on ground
mount projects to unprecedented levels- and can be undone at the same rate. Ground screws
allow solar arrays to be viewed as temporary as need be as a 1MW field can be installed or
uninstalled in a matter of 5 days.30
The solar panels can be relocated to another vacant field for
reinstallation as a ground-mount array or placement on a rooftop.
Electrical installation includes the following purchase and/or install at the Site the following
materials and Equipment without limitation:
1. Applicable Foundation Materials
2. All Photovoltaic mechanical and structural support hardware, commodities, and
3. Misc. Steel, supports, hardware
4. Components (Nuts, Bolts, Clamps, etc.)
5. Installation of Photovoltaic modules, (Customer procured and provided)
6. DC Cabling and Conduit
7. DC Junction Boxes, Combiner Box Level Monitoring, DECK Monitoring or customer
approved equivalent.
8. AC Cabling and Conduit
9. All code compliant disconnecting means and over-current protection devices
29 All information was taken from Yingli Solar website. Performance Data and Warranty data 30 “Ground Screws”, TerraSmart.

29
10. Electric Switchgear interconnection materials, as required
11. Installation of Inverters and Combiner Boxes (Customer procured and provided)
12. Equipment Enclosures
13. All cable management, UV rated supports
14. Meteorological Station , 2 sites only across 7 locations
15. Remotely accessible Data Acquisition Systems including Revenue Grade Metering to be
DECK Monitoring or customer approved equivalent.
16. All materials related to drainage required by the civil engineering plan
17. All under canopy and equipment room lighting as required by Title 24, and NEC at minimum
2-ft candle in parking lots, with applicable DSA requirements at equipment
The Balance of System Parts shall provide comprehensive on site construction management
services for the construction of the Generating Facility in accordance with policies and health
and safety plans of Customer and the Site Host.
1. Pre-Construction Obligations. Prior to start of construction:
(a) Safety Plans. EPC Provider shall also provide Customer for review and acceptance
with (i) a copy of EPC Provider’s Minimum Safety Performance Plan Requirements and
(ii) an evaluation and appropriate documentation of the safety record of any subcontractor
that will be performing the Work.
(b) Building Permits. EPC Provider shall also provide Customer written documentation
with (i) copies of complete permit applications including any electrical structural, and
architectural drawings and calculations submitted to the building department; (ii) copies
of any structural, electrical, and general building permits.
i. As-build drawings and permit closure by IOR, or local inspector
ii. Engineering and plan check fees; for building permit
(c) Project Schedule. EPC Provider shall provide Customer written critical path schedule
for entire Project including design, construction, and commissioning.
2. Construction Obligations. EPC Provider will assemble, design, engineer, construct, install, and
commission with its own employees and/or with Subcontractors the following Work:
(a) Prepare the site, including but not limited to drainage required by the civil engineering
plan, and remove excess debris, and repair roof as needed resulting from damage caused
by the photovoltaic construction.
(b) Site work shall included, tree removal, fencing (with fence to match existing),
(c) Applicable Foundations for equipment
(d) Complete structural racking for ground mount and elevated shade canopy installations
i. All elevated canopy shade structures will require DSA permit and inspection by
IOR; re-imbursement for IOR obligation of others
ii. All ground mount structures will be enclosed by protective fence, with #8

30
gauge mesh, and slats. 2 gates will be required per fenced area per NEC. Ground
mount structures will be permitted through local building department, not DSA.
(e) DC Cabling, raceways, and Junction Boxes
(f) AC Trenching / Boring and cabling
(g) Inverters, switchgear and transformers and accompanying supports and/or concrete
pads
(h) All electrical, mechanical, and structural testing and inspections
(i) Install power, data connection (LAN), enclosure, and wiring from all required
devices for data monitoring systems (DAS)(j) General Conditions
iii. Parking lot demo and repair to original condition, unless otherwise noted on
the drawings
iv. Demolition of all Trees in the work area, as approved by the Customer
v. Relocated and Repair existing irrigation and water line to original function
vi. New Chain Link Fencing & Gates at the inverters to match fencing
specification include in Section E
vii. Blue Staking, utility locating to be included in As-built Survey
viii. Repair Landscaping to match original condition, unless otherwise specified in
drawings or approved by Customer
ix. Pour back Concrete sidewalks and curbs to original condition, unless
otherwise specified in the drawings
x. Patch asphalt at columns
xi. Special Inspections & Testing as required by local building department
xii. Seal coat and striping at parking lots, to match drawings
xiii. Repair Asphalt from trenching to match existing conditions
xiv. Removal of footing spoils with receipt for proper disposal
xv. Demo Light Poles and Base to be returned to the Customer
xvi. Bollards for electrical equipment to be placed protectively, only as required;
No protective bollards around steel canopy supports required. Owner responsible
for padding at locations of “play”.
xvii. Canopy lighting, at parking lot locations only with minimum foot candles
required for parking lot lighting
xviii. Construction fence for protection of equipment and materials during
installation
xix. Project management on-site
xx. Temporary water, toilets, and security;
xxi. Re-routing and/or replacing existing underground conduits;
xxii. Work required for bringing existing conditions into current code compliance;
xxiii. Utility company charges for related shutdown.
31
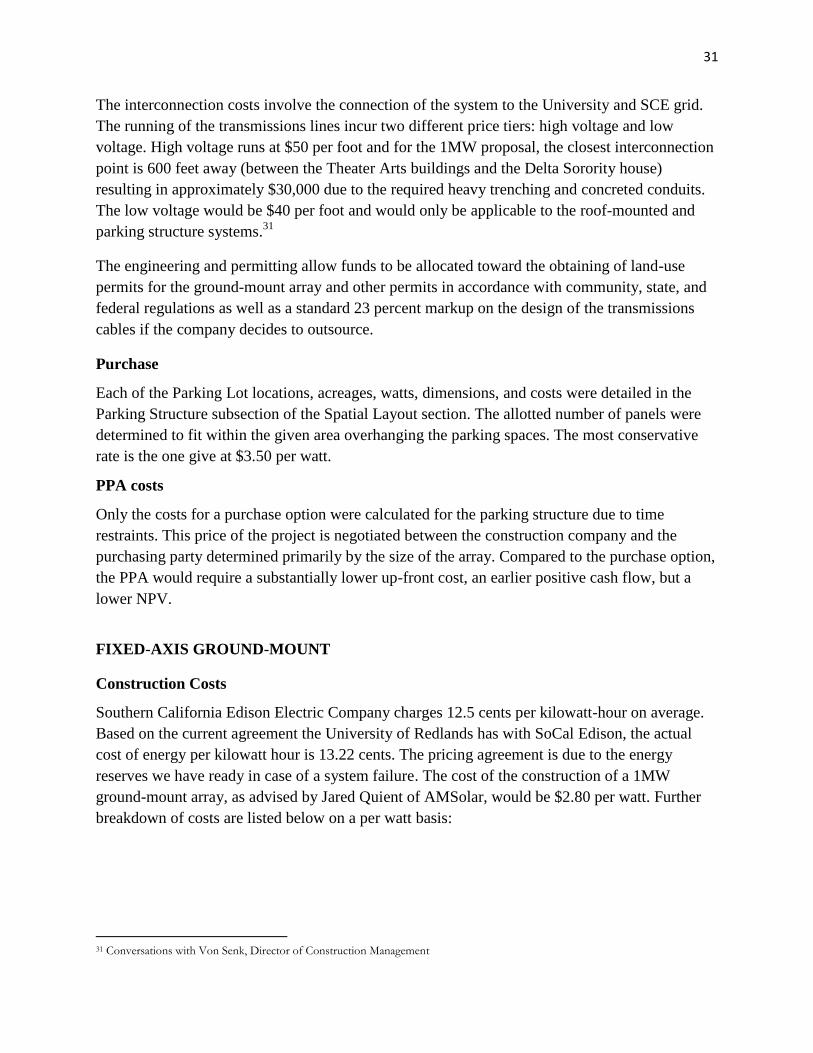
The interconnection costs involve the connection of the system to the University and SCE grid.
The running of the transmissions lines incur two different price tiers: high voltage and low
voltage. High voltage runs at $50 per foot and for the 1MW proposal, the closest interconnection
point is 600 feet away (between the Theater Arts buildings and the Delta Sorority house)
resulting in approximately $30,000 due to the required heavy trenching and concreted conduits.
The low voltage would be $40 per foot and would only be applicable to the roof-mounted and
parking structure systems.31
The engineering and permitting allow funds to be allocated toward the obtaining of land-use
permits for the ground-mount array and other permits in accordance with community, state, and
federal regulations as well as a standard 23 percent markup on the design of the transmissions
cables if the company decides to outsource.
Purchase
Each of the Parking Lot locations, acreages, watts, dimensions, and costs were detailed in the
Parking Structure subsection of the Spatial Layout section. The allotted number of panels were
determined to fit within the given area overhanging the parking spaces. The most conservative
rate is the one give at $3.50 per watt.
PPA costs
Only the costs for a purchase option were calculated for the parking structure due to time
restraints. This price of the project is negotiated between the construction company and the
purchasing party determined primarily by the size of the array. Compared to the purchase option,
the PPA would require a substantially lower up-front cost, an earlier positive cash flow, but a
lower NPV.
FIXED-AXIS GROUND-MOUNT
Construction Costs
Southern California Edison Electric Company charges 12.5 cents per kilowatt-hour on average.
Based on the current agreement the University of Redlands has with SoCal Edison, the actual
cost of energy per kilowatt hour is 13.22 cents. The pricing agreement is due to the energy
reserves we have ready in case of a system failure. The cost of the construction of a 1MW
ground-mount array, as advised by Jared Quient of AMSolar, would be $2.80 per watt. Further
breakdown of costs are listed below on a per watt basis:
31 Conversations with Von Senk, Director of Construction Management

32
Fixed-Axis Ground Mount cost breakdown: Total $2.80/watt
1.00 Panels
.25 Inverters
.30 Racking
.70 Electrical installation
.30 Balance of system parts
.15 Interconnection costs (includes run from pt of interconnect to meter typically)
.10 Engineering and permitting.
Purchase
The size of the proposed fixed-axis ground-mount solar array is 1.21 MW DC which after
conversion rates from DC electricity to AC is equal to 1 MW. The average output yield of the
system over the course of 20 years would be 1,654 kWh/kW. Based on the current SCE utility
rate which stands at 13.2 cents per kWh, the cost of solar would raise the utility rate to 13.9 cents
per kWh.32
Yet this should not deter the construction from going forward; based on a
conservative estimate of SCE’s utility rate escalating at 4 percent annually, the levelized cost of
energy from the utility would be 19 cents per kWh compared to a 16.8 cent per kWh LCOE for
the proposed solar array. The nominal payback of the project will break even at Year 8 while the
discounted payback will level out at Year 11. At Year 15 the cumulative discounted payback will
soar above the Redlands endowment ROI with and IRR of 9.0%. At year 20, the IRR continues
to climb making the handsome return of 11.0% beating the University’s 20-year average
endowment ROI by 2.2%.
As stated before in the breakdown of costs in the construction section of the Parking Structure
section above, the solar modules used guarantee 91.2% efficiency at 10 years and 80.7% at 25
years. The life of the panel is thus guaranteed for 25 years with a module replacement guarantee
and can be expected to increase the IRR to 11.9%.
Other significant inputs include the initial investment which is $3,388,000 which comes from the
build cost at $2.80 per watt. The annual operating expenses are estimated to be $30 per kW.
Well maintained solar panels (regular washing and upkeep) often have efficiency conversion
factors closer to .85% as opposed to the modeled .77% resulting in significantly higher output
thus regular maintenance should be considered as a priority. Annual operating expenses are
expected to escalate at an average rate of $2.50 per year.
32 The solar utility rate of 13.9 cents is established by the California Solar Initiative (CSI), a subsidy program for the solar industry. The program work in a tier-system in which the amount of incentives lowers at each tier. As of September 1, 2012 the solar utility rate stands at 13.9 cents per watt rebate for non-profit institutions. It is highly suggested, for the financial fidelity of the project, that the university moves forward with the plan before the incentive tier is reduced further. For further details visit http://www.csi-trigger.com/.

33
PPA costs
A power purchase agreement (PPA), is a contract between two parties, one who generates
electricity for the purpose of sale (the seller) and one who is looking to purchase electricity (the
buyer). The PPA defines all of the commercial terms for the sale of electricity between the two
parties, including when the project will begin commercial operation, schedule for delivery of
electricity, penalties for under delivery, payment terms, and termination. A PPA is the principal
agreement that defines the revenue and credit quality of a generating project and is thus a key
instrument of project finance. There are many forms of PPA in use today and they vary
according to the needs of buyer, seller, and financing counterparties.33
In the solar industry, the solar financing entity effectively becomes the utility by installing,
maintaining, and being held fully liable for the solar panels on the university campus. The
portion of electricity generated from the panels will power the university. The appeal of such an
agreement is such that the projected rates of utilities increasing more rapidly than the price of
installing and operating a solar array resulting in the University paying a lower electricity rate.
The functionality of the power purchase agreement, is by its nature, to remove the University
from risk and responsibility for the production capacity. The solar financier owns the panels,
maintains them, and sells the electricity produced to the university making a profit out of the
difference between the LCOE’s of the utility (19 cents per kWh) and the solar array (15.1 cents
per kWh). The system size, the output yield, the projected annual utility rate escalator, output
degradation, and discount rate are all the same as in the purchase agreement. The additional
factors include the annual PPA rate escalator which is set at 3%. This rate is one percent lower
than their conservatively projected utility rate escalator (4%) but still above the 2.5% annual
operating expense escalator rate. This allows the solar financing entity to both lower the utility
rates of the University while reaping a profit.
There are no up-front costs thus the cash flow is positive from the first day of operation. The
total estimated savings at Year 5, 10, 15, and 20 are $188930, $408957, $651700, and $910195
respectively. The inflation adjusted returns rise incrementally, annually gaining momentum from
1.16 to 1.21 to 1.28 to 1.38 percent at the benchmark years of 5, 10, 15, and 20.
This agreement certainly exposes the University to less risk essentially guaranteeing payment for
the leasing of land yet the University is locked into a 15 to 20 year contract with the solar
financier to purchase the energy created by the modules.
33 Power purchase agreement, Wikipedia

34
CONCLUSIONS
The solar feasibility study for the University of Redlands has proven that there are certainly
viable reasons to install solar on the University campus; this study focusing on financial viability
as the central determinant.
Out of the three spatial options, two were found to be viable candidates based on political will
within the administration as well as alumni support: parking structures and the fixed-axis
ground-mount array. The highlighted benefits of the parking structures are the dual-use of space
(not to mention the vehicle shading) and the positive exposure to prospective students. The
highlighted benefits of the array are mostly financial.
The two financing models present very different options for the University while both maintain
compelling financial arguments. The power purchase agreement allows the University to have a
“hands-off” policy in which the solar financier owns and maintains the modules. There is no
initial investment required and the University assumes little to no risk. The University is locked
in to an electricity rate which is less than the rate which utility rates are expected reach. There is
also usually some option to buy in the contract. The purchase model involves incurring the full
initial investment but also reaps a profit that is paramount to the 20-year return on the
University’s endowment fund making it legitimate investment proposition. Instead of investing
in an uncertain securities market, the University could invest in a structured finance package
with minimal risk.
Considerations that deserve future attention and research include the interaction between the Co-
generation plant and the proposed solar array, the interconnection agreement between the
university and SCE, and the SCI incentive structure. In my experience with facilities
management, they host a large concern with how a solar array would interact with the co-
generation plant and whether one would “out-compete” the other. The concern melded in with
the agreement the University currently has with Southern California Edison (SCE). The current
agreement has the University paying higher rates to the utility company because they have
standing reserves equal to those which the co-generation plant produced in the case the co-
generation fails. SCE also does not currently support feed-in tariffs which would essentially
allow the University to export excess energy. If this were to become policy the University should
consider adopting a more aggressive policy with renewable energies on campus. As a final point,
the time sensitivity of the California Solar Initiative (CSI) should be kept in mind as he incentive
structure is limited in capacity and funds. More information on rates and current projects in the
pipeline can be found at http://www.csi-trigger.com/.

35
Appendix 1
REFERENCES
BBC News, February 4, 2008 “Coal prices surge to record high,”
BloomEnergy. “Understanding California’s Electricity Prices” White Papers.
http://c0688662.cdn.cloudfiles.rackspacecloud.com/downloads_pdf_White_Paper_Calif_
Elec_Prices.pdf
The Brattle Group. “Transforming America's Power Industry”, November 2008.
http://www.caiso.com/2007/2007d75567610.pdf ;
“CAL ISO Report on Preliminary Renewable Transmission Plans,” CAL ISO, August
2008.
CEC Natural Gas Assessment, California Energy Commission, November 2008.
CleanTechnica. “Solar power transforms parking lots into green job generators.”. publ. August 3,
2010. http://cleantechnica.com/2010/08/03/solar-power-transforms-parking-lots-into-
green-job-generators/. Accessed May, 22, 2012.
CPUC, Electricity Rate Charts and Tables 2000-2009,
http://www.cpuc.ca.gov/PUC/energy/Electric+Rates/ENGRD/ratesNCharts_elect.htm
CPUC, “RPS Implementation Report”, June 2009.

36
Hoover’s Premium Industry overview for “Electric Power Generation”
Info Green Global (2012). The Efficiency of Solar Panels and the Coverage Grade of
Warranties. Retrieved from http://infogreenglobal.com/the-efficiency-of-solar-panels-
and-the-coverage-grade-of-warranties/ on 26 March 2012.
Mielke, Phil (2011). Personal Communication. 28 July 2011.
NERC. “NERC 2007 Long-Term Reliability Assessment,”, October 2007.
NREL. (2012) . Pvwatts, A Performance Calculator for Grid-Connected PV Systems.
Retrieved from http://rredc.nrel.gov/solar/calculators/PVWATTS/version1/
Redlands Institute (2012). About the Institute.
Retrieved from http://www.spatial.redlands.edu/redlandsinstitute/about/ on 1 May 2012.
Solar Plaza (2012). Top 10 Crystalline Module Efficiency (mono-crystalline)
Retrieved from http://www.solarplaza.com/article/top-10-crystalline-module-efficiency-
mono-crystal on 26 March 2012.
Spivak, Jeffrey. Solar Parking lots Arriving in greater Numbers.. October 19, 2011. UrbanLand.
http://urbanland.uli.org/Articles/2011/October/SpivakParking. Accessed May 22, 2012.
Tavares, Ruben. “Natural Gas Price Forecast and Uncertainty,” Working paper presented at the
Joint IEPR and Electricity & Natural Gas Committee Workshop, June 2009.
TerraSmart. “Ground Screws”, http://www.terrasmart.com/products/groundscrews
U.S. Energy Information Administration (EIA).The Annual Energy Outlook 2012 (AEO2012).
Released January 23, 2012.
US Energy Information Administration, Annual Energy Review 2010, p.234, Figure 8.4a
“Consumption for Electricity Generation by Energy Source: Total (All Sectors), Selected
Years, 1949-2010.”
U.S. Energy Information Administration (2012). Monthly Energy Review November 2011. 10.
Renewable Energy Retrieved from
http://www.eia.gov/totalenergy/data/monthly/pdf/sec10.pdf on 8 December 2011
US EIA. “Annual Energy Outlook 2009.” April 2009, http://www.eia.doe.gov/oiaf/aeo/
Wall Street Journal “Utilities Seek Round of Rate Increases.” November 27, 2009.
Wikipedia. “Power purchase agreement”,
http://en.wikipedia.org/wiki/Power_Purchase_Agreement
Yingli Solar website. Performance Data
(http://www.yinglisolar.com/frontend/downloads/datasheets/2012_YGE_72.pdf) and
Warranty data
(http://www.yinglisolar.com/frontend/uploads/downloads/Multi_standard_110922.pdf).

37
PHOTOGRAPHS
Cover photo (solar module close up). http://solarpowerguidebook.com/solar-panel-information/.
Solar power transforms parking lots into green job generators. CleanTehcnica.com. publ. August
3, 2010. http://cleantechnica.com/2010/08/03/solar-power-transforms-parking-lots-into-
green-job-generators/. Accessed May, 22, 2012.
Google SketchUp (2012). Download Google SketchUp 8.
Retrieved from http://sketchup.google.com/download/gsu.html on 12 June 2011.
INDUSTRY REFERENCES
American Solar Energy Society (ASES)
National Renewable Energy Laboratory
Solar Electric Power Association (SEPA)
Solar Energy Industries Association (SEIA)
US Department of Energy, Solar Energy Technologies Program
US Energy Information Administration - Renewable & Alternative Fuels
All up to date information on incentives and regulations can be found at DSIREusa.org
ACKNOWLEDGEMENTS
Pat Morgan
Rick Quinbar
Daniel Snowden-Ifft
Roger Cellini
Von Senk
Tim Webb
Monty Hempel
Hamid Etesamnia
Dr. Phil Doolittle
Charmaine Compton
Dina Guthrie
Jared, Quient, VP AMsolar
Jennifer Payne, Business Coordinator AmSolar