solar panel feasibility study
TRANSCRIPT

March 5, 2009
Brian Bates [email protected] Dillon Buchanan [email protected] Stephen Mueller [email protected] Thomas Parenteau [email protected] Total Pages: 126 Worcester Polytechnic Institute 100 Institute Road Worcester, MA 01609 +1-508-831-5000
Wes
ley
Un
ited
Met
ho
dis
t C
hu
rch
20
08
So
lar
Pa
ne
l F
ea
sib
ilit
y S
tud
y
2
Solar Panel Feasibility Study
At Wesley United Methodist Church, Worcester
An Interactive Qualifying Project Report
submitted to the Faculty of
WORCESTER POLYTECHNIC INSTITUTE
in partial fulfillment of the requirements for the
Degree of Bachelor of Science
by
Brian Bates
Dillon Buchanan
Stephen Mueller
Thomas Parenteau
Date: March 5, 2009
Report submitted to:
Faculty Project Advisors:
Prof. Peter H. Hansen
Prof. Alex Emanuel
Wesley United Methodist Church Project Liaison:
Lorna Mattus-Merrill
This report represents the work of one or more WPI undergraduate students
submitted to the faculty as evidence of completion of a degree requirement.
WPI routinely publishes these reports on its web site without editorial or peer review.

3
Abstract
This project evaluated the feasibility of installing a photovoltaic system on the roof of the Wesley United
Methodist Church in Worcester, MA. Analysis of the site, weather data, and economic incentives
available to church facilitated the creation of a model that could predict the value of a photovoltaic
system as an economic investment. This analysis resulted in a long payback period, but projections
using this model indicate significant changes as the price of photovoltaic panels continue to fall.

4
Executive Summary
The Wesley United Methodist Church, located in Worcester, Massachusetts, was interested in
the feasibility of installing a photovoltaic panel system on its roof. The church incurs a costly electric bill,
which, coupled with a gas heating bill, imposes a significant financial burden. Concerned that the costs
of electricity would only rise in the future, the church’s business administrator began looking into
alternative energy options. The church has a prominent, south-facing roof space, and its leadership was
particularly interested in determining if a solar power system could be installed to utilize this space.
The overall goal of this project was to create an economic model that could predict the
feasibility of installing a photovoltaic system on the roof of the Wesley United Methodist Church.
Creating a model tailored to the church was important because of the church’s status as a non-taxable
institution. This meant that traditional models for estimating the feasibility of such a system, which
included numerous tax benefits and deductions, would not be applicable.
The secondary goal of this project was to assess the social implications of installing a
photovoltaic system on the church. We wanted to determine how much the church’s congregation
knew about solar panels, as well as how they felt about installing such a system on their church. If
installed, the panels may be visible from the ground, which could have a negative aesthetic impact for
some congregation members. Besides this, we also wanted to determine how non-economic factors,
such as green stewardship and carbon footprint, would affect the overall feasibility of a solar panel
installation.
The task of determining the overall feasibility of installing a photovoltaic system was divided
into five sections. The first section, site analysis, was concerned with obtaining the physical layout of
the roof space suitable for panel placement, as well as determining relevant meteorological data that
was needed for energy calculations. The goal of this section was to create an accurate map of where
panels could be placed on the roof, as well as how much energy could be gathered given Worcester’s

5
climate. The second section, possible solar panels and placements, dealt with determining the criteria
and system that would be used to select the best panel equipment for the church. The third section
investigated what effect different orientations and configurations of the panels would have on the
amount of energy that could be produced. The goal of this section was to determine the best tilt angle
for the solar panels as well as the most effective inter-panel spacing. Economic feasibility of the
systems, the fourth section, investigated what economic factors and assumptions should be used in
order to create an accurate economic model of the solar panel system as an investment vehicle. In the
final section, social implications, our objective was to determine what social factors might come into
play that could help or hinder the support for the installation of a photovoltaic system.
From our analysis of Worcester weather data and the roof of the church, we determined that
the maximum installation size possible on the roof of the church was approximately 25kW. From the
420 m2 of flat space on the roof, we found that 200 m2 was suitable for installing solar panels. This was
because shadows from surrounding portions of the roof would make placing panels in these areas
impractical. Determining shadowed areas was done by taking measurements early and late in the day,
when shadows were most prevalent.
Our solar panel selection process suggested that the most suitable panel for an installation on
the church would be the Kyocera KC200GT. This panel had an efficiency rating of 15% and an overall
cost per watt of $4.35, making it the most cost effective panel of those investigated. The power inverter
chosen, which was needed to convert the DC electricity from the panels into AC electricity that the
church could use, was the Sunny Boy SB7000US. This inverter was chosen because of its 95% efficiency
coupled with its ability to be scaled to different system sizes. Using this inverter, we estimated a total
DC to AC conversion factor of 79.49%. This factor was a result of the inverter efficiency as well as the
efficiency of the AC and DC wiring and connections to the system. Combining the efficiency of the solar

6
panels and the efficiency of the DC to AC conversion, we calculated an overall system efficiency of
11.92%.
Tilting the solar panels at an angle of 42 degrees allowed them to capture the most sunlight.
The yearly average of daily irradiation per square meter at this angle was 4.69 kWh/m2/day. With an
overall system efficiency of 11.92%, this led to an average monthly electrical generation of 2838 kWh for
a 25kW system. Given that the church consumes an average of 9500 kWh, a system of maximum size
would cover only 30% of the church’s electricity needs.
Through a combination of the equipment chosen, estimates on installation costs gathered from
installers, and state averages for similar installations, we found that installing a photovoltaic system on
the church would cost approximately $8.00 per watt. Using the maximum size of 25kW would produce
a raw system cost of $200,000. However, a number of different system sizes were evaluated, ranging
from 10kW to 25kW.
Given an overall price of a photovoltaic system, it was important to determine if this price would
translate into an effective investment. The important factors in calculating the investment potential of
such a system included: the savings in electricity costs, other income such as renewable energy credits,
the rebates and incentives available, how the investment will be financed, and expected trends in
inflation and energy costs. The electricity savings produced by a photovoltaic system are directly
proportional to the system’s size because of the church’s contract with the electric utility. Renewable
energy credits could generate additional revenues of $0.03 per kWh, but from correspondences with the
Mass Energy Consumers Alliance we found that these contracts may not be available in the future.
Because the church is a non-taxable institution, the only significant incentive for installing a
solar panel system is the rebate offered by Commonwealth Solar. For installations under 25kW, the
rebate offers a price reduction of $3.25 per watt. In order for to receive the rebate, however, the
installation must be done by an approved solar panel installation company.

7
Because the church does not want to incur any debt in order to finance an installation, instead
preferring to use money from gifts or a trust fund, we performed our calculations with a 100% down
payment. By analyzing the historical values of the Consumer Price Index we felt that an inflation rate of
3.29% was a good long term estimation, especially considering the estimated 25 year lifespan of a
photovoltaic system. The Energy Information Administration predicts that the cost of energy will
increase at a rate of 0.6% over inflation.
Evaluating various sized installations using the information above yielded similar economic
results across system sizes. Without the additional income provided by renewable energy credits, the
investment turns positive after 22 years. With renewable energy credit income, this figure drops to 19
years.
The investment potential of a photovoltaic system was found to be largely tied to the overall
cost per watt figure cited by installers. If this figure were to drop, the nature of the investment could
change significantly. For example, if the overall price per watt were to drop to $6.50, even without
renewable energy credit income, the investment would become economical in 15 years. The cost of
electricity and how fast this cost is expected to rise also impacts the investment. For each additional
0.6% of estimated increase in electricity, one year is deducted from the investment breakeven point.
Our recommendation to the church was to delay the purchase of a photovoltaic system.
Although the investment would become economical after a period of time shorter than the lifespan of
the system, its economic benefit would not be substantial. In addition to this, the costs of photovoltaic
panels are expected to drop significantly in the near future, causing an investment taken in a few years
to be substantially more beneficial.

8
Table of Contents Abstract ......................................................................................................................................................... 3
Executive Summary ....................................................................................................................................... 4
Table of Contents .......................................................................................................................................... 8
Table of Figures ........................................................................................................................................... 11
Table of Tables ............................................................................................................................................ 11
1. Introduction ............................................................................................................................................ 12
2. Background ............................................................................................................................................. 14
2.1 History of the Church ........................................................................................................................ 14
2.2 Solar Technology ............................................................................................................................... 15
2.2.1 The History of Solar Power ........................................................................................................ 15
2.2.2 How Solar Power Works ............................................................................................................ 16
2.2.3 Different Types of Photovoltaic Panels ...................................................................................... 20
2.3 Regulations and Installation .............................................................................................................. 25
2.3.1 How Solar Panels are Installed ................................................................................................... 25
2.3.2 Regulations on a Solar Power System ........................................................................................ 26
2.4 Economics ......................................................................................................................................... 27
2.4.1 Incentives Available to System Buyers ...................................................................................... 27
2.4.2 Factors in Determining Economic Feasibility ............................................................................. 31
2.5 Similar Case Studies .......................................................................................................................... 33
2.5.1 Holy Name Wind Power Feasibility Study .................................................................................. 33
2.5.2 Solar Feasibility Study of a Learning Center at WPI ................................................................... 34
2.5.3 Janssen Ortho LLC Solar Power Feasibility Study ....................................................................... 35
3. Methodology ........................................................................................................................................... 37
3.1 Site Analysis ...................................................................................................................................... 37
3.1.1 Meteorological Analysis ............................................................................................................. 38
3.1.2 Layout of Roof Space ................................................................................................................. 39
3.1.3 Energy Usage ............................................................................................................................. 40
3.1.4 The Installation Process ............................................................................................................. 40
3.2 Analysis of Solar Panels and Systems ................................................................................................ 40
3.3 Solar Panel Placement ...................................................................................................................... 43
3.4 Economic Feasibility of the Systems ................................................................................................. 46
3.5 Social Implications ............................................................................................................................. 49

9
4. Site Analysis ............................................................................................................................................ 52
4.1 Location of the Church ...................................................................................................................... 52
4.2 Meteorological Analysis .................................................................................................................... 52
4.3 Layout of Roof Space ........................................................................................................................ 56
4.4 Energy Usage ..................................................................................................................................... 58
4.5 The Installation Process .................................................................................................................... 60
5. Possible Solar Panels and Inverters ........................................................................................................ 63
5.1 Solar panels ....................................................................................................................................... 63
5.2 Inverter Choice .................................................................................................................................. 65
6. Economic Context ................................................................................................................................... 67
7. Scenarios ................................................................................................................................................. 75
7.1 Assumptions and Selection of Solar Panels ...................................................................................... 75
7.2 Scenario 1: Small System Size: .......................................................................................................... 76
Characteristics: ................................................................................................................................... 77
Impact: ................................................................................................................................................ 77
7. 3 Scenario 2: Moderate System Size: .................................................................................................. 78
Characteristics: ................................................................................................................................... 78
Impact: ................................................................................................................................................ 79
7.4 Scenario 3: Maximum System Size: .................................................................................................. 80
Characteristics: ................................................................................................................................... 80
Impact: ................................................................................................................................................ 81
7.5 Scenario 4: Maximum System Size with Volunteer installation: ...................................................... 82
Characteristics: ................................................................................................................................... 82
Impact: ................................................................................................................................................ 83
7.6 Assessment: ...................................................................................................................................... 84
7.7 Sensitivity Analysis ............................................................................................................................ 85
8. Social and Environmental Impact ........................................................................................................... 88
8.1 Effects on Carbon Footprint .............................................................................................................. 88
8.2 Environmental Stewardship .............................................................................................................. 89
8.3 Informational Brochure ..................................................................................................................... 90
8.4 Survey ................................................................................................................................................ 90
9. Conclusions and Recommendations ....................................................................................................... 93

10
Appendix A: Solar Panel Tilt Analysis ...................................................................................................... 95
Appendix B: Recommended Bidding Process ......................................................................................... 98
Appendix C: Site Dimensions ................................................................................................................ 100
Appendix D: Morning Shade ................................................................................................................. 101
Appendix E: Afternoon Shade ............................................................................................................... 102
Appendix F: Shading with Raised Panels ............................................................................................... 103
Appendix G: Meetings and Correspondences ...................................................................................... 104
Meeting with Tom Sikina on December 5, 2008: ............................................................................. 104
Meeting with York-Ogunquit United Methodist Church .................................................................. 106
Correspondences with the Massachusetts Technology Collaborative: ............................................ 107
Correspondences with solar panel installers: ................................................................................... 107
Appendix H: Solar panel installers ........................................................................................................ 109
Appendix I: Future Solar Panel Costs .................................................................................................... 110
Appendix J: Scale Model ....................................................................................................................... 112
Appendix K: Site Pictures ...................................................................................................................... 115
Appendix L: Simplified Economic Spreadsheet ..................................................................................... 118
Appendix M: Informational Brochure ................................................................................................... 120
Appendix N: Survey ............................................................................................................................... 123
Works Cited ............................................................................................................................................... 124

11
Table of Figures Figure 1: P-N Junction ................................................................................................................................. 18
Figure 2: Solar Panel Construction and Implementation ............................................................................ 19
Figure 3: Solar Cell Composition ................................................................................................................. 20
Figure 4: Mono-Crystalline Solar Cells ........................................................................................................ 21
Figure 5: Poly-Crystalline Solar Cells ........................................................................................................... 21
Figure 6: String Ribbon Manufacturing Process.......................................................................................... 23
Figure 7: Thin-film Composition.................................................................................................................. 24
Figure 8: Depiction of the Sun Rays vs the Tilt of the Solar Panels............................................................. 44
Figure 9: Mean Daily Irradiation for Worcester .......................................................................................... 55
Figure 10: Weasly United Methodist Church’s Electricity Consumption .................................................... 59
Figure 11: Power Consumption vs Energy Production of a 20 kW System ................................................. 60
Figure 12: A screenshot of the economics spreadsheet. ............................................................................ 68
Figure 13: Solar panel efficiency over time................................................................................................. 70
Figure 14: Historical prices of the national average cost per kWh. ............................................................ 71
Figure 15: The year to year percent change in the Consumer Price Index. ................................................ 73
Figure 16: The amount of money required to have the same value as $10 in 1914. ................................. 74
Figure 17: 10kW System Energy Production ............................................................................................... 77
Figure 18: 10kW System Cash Flow ............................................................................................................ 78
Figure 19: 15kW System Energy Production ............................................................................................... 79
Figure 20: 15kW System Cash Flow ............................................................................................................ 80
Figure 21: 25kW System Energy Production ............................................................................................... 81
Figure 22: 25kW System Cash Flow ............................................................................................................ 82
Figure 23: 25kW System Energy Production ............................................................................................... 83
Figure 24: 25kW System Cash Flow with Volunteer Installation ................................................................ 84
Figure 25: Futuristic 25kW System Cash Flow ............................................................................................ 86
Figure 26: The Effect of Waiting 5 Years ..................................................................................................... 87
Figure 27: Graph showing the falling cost of PV intallations in Japan. ..................................................... 111
Table of Tables Table 1: MTC Rebates ................................................................................................................................. 28
Table 2: Solar Panel Criteria ........................................................................................................................ 42
Table 3: Potential Solar Panels .................................................................................................................... 64
Table 4: Potential Inverters ......................................................................................................................... 66

12
1. Introduction
The need for energy from renewable sources has become a pressing issue in recent years. Many
individuals and organizations have become concerned about the future energy needs of our society and
have begun searching for ways to meet these needs. With the finite and rapidly depleting reserves of
oil, coal, and natural gas, it has become a chief issue to discover sources of renewable energy and
implement systems that harness them. An energy infrastructure based on renewable sources would be
better able to sustain the needs of a society with continually increasing energy demands due to its
growth in size and its increased standard of living. The adoption of such systems would also have a
positive impact on our environment. Renewable forms of energy, such as solar, wind, or geothermal
power produce virtually no pollution. The implementation of renewable energy systems may even be a
wise investment; energy produced by such systems would no longer have to be purchased, and over a
period of time, these savings in energy costs may exceed the price of the system.
The Wesley United Methodist Church, located in Worcester, Massachusetts, is interested in the
feasibility of implementing such a system. The church incurs a costly electric bill, which, coupled with a
gas heating bill, imposes a significant financial burden. Concerned that the costs of electricity would
only rise in the future, the church’s business administrator began looking into alternative energy
options. The church has a prominent, south-facing roof space, and its leadership is particularly
interested in determining if a solar power system could be installed to utilize this space.
The goal of this project was to determine the economic feasibility of installing a solar power
system on the roof of the Wesley United Methodist Church. New incentives and agencies, such as
Commonwealth Solar, are making it more affordable to install renewable energy systems. Also, as the
demand grows for renewable energy, more cost effective technologies and production processes are
being developed to meet the growing demand. It is the infancy and volatility of this market that
warrants an up to date investigation of the current options and their costs.

13
The feasibility of installing a solar array on the Wesley United Methodist Church was determined
by gathering pertinent weather data, conducting a site analysis, investigating possible solar panels and
mounting solutions, and finally, creating an economic model. These attributes combined to form a final
solution through which we determined the investment potential as well as the social and environmental
impacts of implementing such a system. Our results indicated that both a system of small size and a
larger size would both have a payback period of roughly 19 years.

14
2. Background
Humans have always been fascinated with the power of the sun. Egyptian pharaohs claimed to
be direct descendents of Re, the sun god, and creator of light and all other things. Greek mythology tells
the story of Icarus, who flew too close to the sun while using wax wings and plunged to his death. For
years, cultures worshipped the sun for the power it gave to life. Many cultures still respect the sun for
its central role in sustaining life on earth.
Since the 1800s, scientists have made progress towards harnessing the sun’s power in the form
of electrical energy. Throughout the last two centuries, significant progress has been made in
developing the solar technologies we have today. Many photovoltaic installations are connected to the
power grid, and thus each installation is accompanied by many regulations. This chapter provides a
broad overview of how photovoltaic panels work, the economics involved in determining the feasibility
of a photovoltaic system, and a summary of similar case studies.
2.1 History of the Church
The vision of building Wesley United Methodist Church began in two smaller congregations in
1923. After months of planning, the members of Grace Church (formerly on Walnut Street) and Trinity
Church (on Main and Chandler Streets) came together with their pastors (Dr. James Wagner and Dr.
Berton Jennings) to join their two churches and establish one Methodist Church in the city of Worcester.
The present location was chosen as the future site of this joint effort. It was decided that a new name
would be chosen for this new church. Wesley United Methodist Church is named after the founder of
Methodism, John Wesley. In addition to a new name, both pastors felt a new minister should be
appointed to pastor this newly joined congregation.
According to the official histories of Wesley United Methodist Church, the first construction loan
of $350,000 was made possible by the trustees who put themselves and their families on the line,

15
signing the bank notes personally. The women of the church had taken on the responsibility of paying
for the marble altar in the sanctuary. This was done by donations of gold and silver jewelry as well as
other items which were sold to make this gift possible. A construction firm from Boston was hired and
on May 8, 1927 the first Sunday worship was held in the present building. The first Easter services
included 2552 people in two services!
The church’s foundational statement is etched in stone over the entrance on 114 Main Street. It
reads, “To the glory of God and the service of man.” Wesley Church continues to exist as a place where
all may come to worship God and be nourished by God’s love.
2.2 Solar Technology
Solar technology has evolved drastically since humans first became interested in the sun. In the
1800s the photoelectric effect was discovered, and since then, scientific progress has been made
towards harnessing the sun’s power. Today, there are many types of solar technology, including
crystalline silicon (the traditional method) and newer alternatives such as string ribbon and thin film
technologies.
2.2.1 The History of Solar Power
The word “photovoltaic” comes from the Greek word “photo” meaning light and after Count
Volta, the Italian physicist (1745-1827) whom the electrical unit Volt is named after. Photovoltaic
technology began in 1839 with the French physicist Alexandre Becqueral’s discovery of the photo effect.
In 1877 the first photovoltaic cell was constructed from Selenium. The photovoltaic effect was further
explained by Albert Einstein and Robert Millikan in the early 1900’s. Finally, in the 1950’s, Shockley

16
provided a model for the p-n junction, which enabled the beginning of modern photovoltaic technology
development.1
In 1954 Bell Labs produced the first modern photovoltaic cell with an efficiency of only four
percent.2 Early solar panels carried high price tags, usually costing a couple of thousand dollars per
Watt. Energy generated at this cost was only feasible for space projects. Research in this arena
progressively drove the costs lower and the efficiencies higher. In the last half century, photovoltaic
technology has continued to improve, as has the economics of photovoltaic power generation.
2.2.2 How Solar Power Works
Solar cells, also called photovoltaic cells, are used to convert the electromagnetic radiation from
the sun into electricity that can be used to power today’s electronic gadgets, as well as residential and
commercial dwellings. The simplest photovoltaic cells are comprised primarily of three materials, silicon,
and two doping agents.3 Silicon, which comprises a majority of the photovoltaic cell, has several
chemical properties that make it well suited for the use in solar cells. It is the second most abundant
element on Earth and has four valence electrons.4 Valence electrons, in layman’s terms, can be thought
of as "free" electrons. These "free" electrons are capable of bonding atoms together, as well as doing
electro-magnetic work. In pure silicon, atoms bond together via their valence electrons to form a
crystalline structure. However, because these valence electrons are tied up bonding atoms together,
they cannot be used to produce electricity. This is the primary reason two doping agents are applied to
the silicon material. Silicon, on its own, cannot produce electricity. Instead, atoms with greater than or
1 Quaschning, Volkerr. Understanding Renewable Energy Sources. London : Earthscan, 2005. 2 Lund, H., Nilson, R., Solamatova, D. & Skare, E. The History Highlight of Solar Cells. Retrieved October, 2008, from http://org.ntnu.no/solarcells/pages/history.php 3 Aldous, S. How Solar Cells Work. Retrieved October, 2008, from http://www.howstuffworks.com/solar-cell.htm 4 Radiochemistry Society. Periodic Table of Elements: Silicon. Retrieved October, 2008, from
http://www.radiochemistry.org/periodictable/elements/14.html

17
less than four valence electrons are added to the silicon structure to produce an impurity. Adding this
impurity to the silicon structure is what allows the flow of electricity.5
If a Phosphorous doping agent, which has five valence electrons, is added to a group of silicon
atoms, it produces a crystalline structure with a "free" valence electron. This "free" valence electron can
be used to generate electricity. This type of material is given the name "n-type material". The only thing
needed is a place for this "free" electron to flow. No electrical work can be done if there is no potential
between two points. The solution to this problem lies within our second doping agent.
The second doping agent, unlike the first, has fewer than four valence electrons. As a result,
when a structure of Silicon and Boron, an element with only three valence electrons, is formed, "holes"
begin to develop within the material structure. These "holes" are the absence of an electron and are
capable of being filled by other electrons within the structure. This material is given the name "p-type"
material.
Now we have two parts to this puzzle. One puzzle piece is Silicon doped with a material that
produces "free" electrons. The second is Silicon doped with an element that produces "holes" within the
structure that is capable of being filled by "free" electrons. A solar panel is comprised of both n-type
material and p-type material. Both materials are sandwiched together to produce what is referred to as
a "p-n junction".
5 Cooler Planet. (2008). How Photovoltaic Cells Work. Retrieved October, 2008, from
http://solar.coolerplanet.com/Content/Photovoltaic.aspx

18
Figure 1: P-N Junction6
The only remaining piece of the puzzle is the catalyst that starts this transfer of "free" electrons
to the "holes" on the other side. This process is called the photovoltaic effect. The photovoltaic effect
describes the interaction between a photon, a particle of light, and specific metal materials. When a
photon interacts with a metal material it may be reflected or absorbed. If absorbed, the photon
transfers its energy to a local atom, which in turn, lends its energy to an orbiting valence electron. This
process causes a free electron which is capable of moving to a "hole" creating an electrical current. The
more photons that interact with the material, the more valence electrons are freed and allowed to flow
to an electron-hole. Once light is absorbed by the two materials, electricity begins to flow through the
connected load. The more light that interacts with the solar cell, the more electricity is generated.7
6 REUK. Renewable energy UK. Retrieved October, 2008, from http://www.reuk.co.uk/OtherImages/pnjunction.jpg 7 Aldous, S. How solar cells work. Retrieved October, 2008, from http://www.howstuffworks.com/solar-cell.htm

19
Figure 2: Solar Panel Construction and Implementation8
On a bright, sunny day, the sun shines with approximately 1 kilowatt of energy per square meter
on the Earth's surface. To gather this energy solar panels are generally coated with a non-reflective
surface texture. This texture increases the probability that a photon will be absorbed rather than
reflected. A cross section of composition can be seen below.
8 The Seitch Blog. Retrieved October, 2008, from www.blog.thesietch.org/wp-content/uploads/2007/06/solarcell.jpg

20
2.2.3 Different Types of Photovoltaic Panels
Crystalline Silicon (Traditional Method)
The largest and most popular solar panel technology on the market today is commonly referred
to as crystalline silicon solar cells. Being one of the original solar panel technologies it is not surprising
that this type of solar panel currently holds an unprecedented 93% of the market to date. Because of its
relatively simple construction and manufacturing process, crystalline solar cells gained large popularity
during the infancy of the alternative energy boom.
Today, there are two major types of crystalline silicon used in manufacturing and production:
mono-crystalline and poly-crystalline. The first, mono-crystalline, requires absolutely pure semi-
conduction material. Melted silicon is first poured in the shape of rods. After a solid has formed, the
rods are then sawed into thin small wafers which are up to 150 mm in diameter and 350 microns thick.
This type of production results in an approximately 24% lab efficiency, and 15% efficiency in
production.9
9 The Solarserver. (2008). Photovoltaics. Retrieved October, 2008, from http://www.solarserver.de/wissen/photovoltaik-e.html
Figure 3: Solar Cell Composition

21
Figure 4: Mono-Crystalline Solar Cells
The second type of crystalline silicon chiefly used today is referred to as poly-crystalline. Poly-
crystalline production is similar to mono-crystalline in the way that both result in silicon wafers,
however, the method by which the final product is created differs. First, liquid silicon is poured into
blocks that are then cut into bars, and then finally cut into wafers. Because the silicon hardens in large
blocks, many large crystalline structures begin to form, hence “poly-crystalline”. Poly-crystalline cells are
more cost effective to produce due to the fact that many cells can be created from a single block, but
because every time silicon is cut, the edges become deformed, which results in a lower operating
efficiency. The efficiency for a poly-crystalline cell in the laboratory is approximately 18% and in
production reaches only 14%.10
Figure 5: Poly-Crystalline Solar Cells
10 The Solarserver. (2008). Photovoltaics. Retrieved October, 2008, from http://www.solarserver.de/wissen/photovoltaik-e.html

22
The benefits of a crystalline solar cell come from the fact that the cells that comprise the overall
solar panel are very cheap to produce. Because crystalline cells were one of the first technologies on the
scene, much of the production and manufacturing techniques have been refined to their maximum
potential. Despite effective production processes, one of the largest problems that plague crystalline
silicon cells is the limits of their efficiency. When any crystalline structure is split it undergoes
deformation. The technique by which mono-crystalline and poly-crystalline cells are created intensely
relies on severing of silicon into smaller pieces. This leaves much of the area deformed which decreases
operating efficiency for that cell. This is one of the reasons that String Ribbon technology (which is
covered in the next section) is so efficient, because it manufactures silicon in a method that produces no
deformities.
String Ribbon Panels
With the ever increasing demand of cheap solar panel production techniques, it has become
critical for companies to devise new alternatives for producing silicon. One of the most promising of
these techniques is String Ribbon manufacturing. Unlike the generic silicon wafers used in the bulk of
solar panel production today, string ribbon provides a healthy alternative which decreases production
costs as well as the carbon footprint used to produce a solar cell. The technique behind String Ribbon
silicon is the manipulation of surface tension. Two parallel strings are pulled vertically through a silicon
melt. As the strings rise, silicon begins to span the distance between the two strings, much like a bubble
spans the ring on which it is blown. As the silicon rises it begins to cool and form a hardened structure
between the strings. This process continues uninterrupted until the silicon ribbon is of desired length.11
11 SolarHome.org. (2008). String-Ribbon. Retrieved October, 2008, from http://www.solarhome.org/string-ribbon.html

23
Figure 6: String Ribbon Manufacturing Process12
The result of this process is a thin, silicon ribbon, which is twice the yield of the conventional
construction per pound of silicon. Due to this fact, String Ribbon panels use significantly less material
than crystalline panels. The process of creating String Ribbon panels achieves a much greater reliability
and potency than its silicon wafer counterpart and manufacturing it is one of the most environmentally
friendly methods in the business.13
Thin-film Panels
With advent of micro-manufacturing, many large scale photovoltaic panels are becoming
smaller and smaller with each progressive decade. The ability to spread a material over a large scale
area that averages 1 to 10 micrometers thick has enabled several manufactures to produce an ultra thin
variety of solar panels. This newly emerging technology is aptly named: thin-film technology. Thin-film
12 Evergreen Solar, Inc. (2008). String Ribbon. Retrieved October, 2008, from
http://evergreensolar.com/images/techology/stringribbon/diagram_string_ribbon_en.jpg 13 Evergreen Solar, Inc. (2008). Our String Ribbon Wafers - Genius in its Simplicity. Retrieved October, 2008, from
http://www.evergreensolar.com/app/en/technology/item/48

24
technology refers to the act of spreading several consecutive layers of silicon and other material to form
a working photovoltaic. Thin-film material is 100 times thinner than traditional solar panels, which range
from 100 to 300 micrometers thick, and only contains 1% of the silicon to produce an equivalently
sized panel.14 The greatest advantages of thin-film technology are that it is flexible, light weight, and
incredibly thin. Unlike silicon wafers and String Ribbon panels, many thin-film panels are created as
an amorphous material. Instead of being manufactured in chunks and assembled into a panel like String
Ribbon panels and silicon wafer panels, thin-film panels are created by combining consecutive thin
layers of material together. The result is a single film that is capable of being distributed in rolls or
sheets. 15
Figure 7: Thin-film Composition
Today, many thin-film manufacturers have begun producing what is referred to as monolithic
integration. Monolithic integration describes the process of integrating the connection junctions
between the silicon substrates, which create paths for the electricity to flow from cell to cell, within the
amorphous material. This process is can be referred to as the "All-in-one" technique. Because of
the character of thin-film material, manufacturers have been able to integrate these connection
junctions with such success that many are capable of tolerating a bullet hole without failing. Some are
also capable of performing better than traditional silicon wafer panels under low light or shaded
14
PowerFilm, Inc. (2008). Thin Film. Retrieved October, 2008, from http://www.powerfilmsolar.com/technology/index.html 15 Quaschning, Volkerr. Understanding Renewable Energy Sources. London : Earthscan, 2005.

25
conditions. Monolithic integration reduces manufacturing costs and increases durability of the overall
product.
While thin-film technology receives much praise, it does have several drawbacks. Because of its
thin nature, thin-film material generally has a lower efficiency compared to its silicon wafer competitor.
In consequence, more area must be dedicated to a thin-film panel to produce the same result as a
silicon wafer panel of equal power rating. Another disadvantage of a thin material is that durability
begins to suffer over time. Thin film solar panels degrade more quickly than other types of technologies
which make them candidates for a more frequent replacement.16
2.3 Regulations and Installation
There are several rules and regulations in effect that apply to solar array purchasers.
Knowing them can not only protect your well being but also save you money. The Massachusetts
Technology Collaborative (MTC) provides a wealth of information about the type of funds and rebates
available to those interested in installing solar panel arrays on their business or residence. MTC also
provides a list of tasks that must be fulfilled before a solar array may be deemed operational and hazard
free.
2.3.1 How Solar Panels are Installed
The installation of most roof based solar arrays is a relatively simple process. The primary
method involves attaching bolts to the roof support beams, through the roof surface and building a
simple framework on top of these bolts to allow a gap between the panels and the roof surface. This gap
permits the panels to be installed on roof surfaces ranging from rubber membranes, standard asphalt
16 U.S. Department of Energy. (2006). Polycrystalline Thin Film. Retrieved October, 2008, from http://www1.eere.energy.gov/solar/tf_polycrystalline.html

26
shingles, tiles, and slate, even if the roof is somewhat uneven. The gap also allows for airflow to keep
the panels cool.
The most common way to install panels on a flat roof, like the Wesley Church’s, is to purchase
separate frames that assemble into some sort of “A” frame. The panels can be mounted vertically or
horizontally with approximately four panels per frame. This frame is then either bolted through the roof
into the rafters below, or weighted down with sandbags or something similar. These mounting frames
can either be situated at a fixed angle or one that can be adjusted to two or three pre-set angles and
locked with removable pins. The adjustment process can be done with two people and increases the
efficiency of the cells, while only slightly complicating the mounting frames. On the church roof, several
lines of these frames could be assembled with enough space in between to prevent shading from the
row in front. Based on the sun’s effect at various times of the day, different groups would be connected
in series and then in parallel to the DC/AC converter. These rows should also be spaced in such a way
that the roof is still accessible for regular maintenance.
While it is possible for homeowners to install several systems themselves, such as the Schott
Sunroof PV system, it is generally recommended that one work with a professional contractor. Not only
are contractors experienced in installation procedures, they are also familiar with the available rebates
and other incentives. Most importantly, the contractor will coordinate with a licensed electrician to
make the connections to the breaker panel and request an electrical inspection from the town to ensure
that all procedures are up to code.
2.3.2 Regulations on a Solar Power System
In order to ensure the safety of a solar power system, the system must conform to a number of
federal, state, and local regulations. In particular, Commonwealth Solar, an organization that offers
rebates to individuals or groups wishing to install a solar panel system, outlines a number of criteria that

27
a solar panel system must meet in order to receive a rebate. These criteria go beyond simple safety
measures to include requirements on the life and overall quality of the system.17
Many of the safety regulations for solar panel installations regard the electrical safety of the
system. A system installed in Massachusetts must be installed by a licensed electrician, and conform to
all federal, state, and local electric and building codes. Wiring must be properly insulated and
weatherproofed. Devices that can be disconnected from the rest of the electrical system for service
and inspection must also be installed. Although it is not required, the MTC recommends that surge
protectors are installed to protect the system components from any electrical surges.
2.4 Economics
2.4.1 Incentives Available to System Buyers
Because of the increasing demand for renewable energies, a number of organizations have been
created to foster the growth of systems that utilize renewable sources. Both public and private
institutions can benefit from the incentives that such organizations provide. When determining the
feasibility of a solar power system, it is important to consider the economic incentives that may apply,
because they may account for a considerable portion of the system cost.
Commonwealth Solar is an initiative from the Massachusetts Technology Collaborative (MTC) to
provide rebates to residential, commercial, industrial, and public facilities. Commonwealth Solar
provides rebates on photovoltaic systems on a non-competitive, first-come, first-serve basis. Starting in
2008, the initiative has $68 million available over the next four years.18 The amount of reimbursement
that an installation may receive depends on the size of the installation (in kW), whether the components
17 Commonwealth Solar. (2008). Solar Photovoltaic Rebates: Program Manual. Retrieved September, 2008, from
http://www.masstech.org/SOLAR/Commonwealth%20Solar%20Program%20Handbook_v2_070108.pdf 18 Commonwealth Solar. Overview. Retrieved September, 2008, from http://www.masstech.org/SOLAR/

28
of the system were manufactured in Massachusetts, and whether the installation is on a public or
private building. The rebates are calculated in dollars per DC watt of energy produced by the system.
The base rebate per Watt, based on system size, is shown below:19
Size of system (kW) 1 to 25 kW >25 to 100 kW >100 to 200 kW >200 to 500 kW
Rebate in dollars per watt $3.25 $3.00 $2.00 $1.50
Table 1: MTC Rebates
An additional $0.25 per watt will be added if the components of the system were manufactured
in Massachusetts
An additional $1.00 per watt will be added if the system is installed on a public building.
In order to receive a grant from Commonwealth Solar, the system that is to be installed must have a
projected efficiency of at least 80% compared to a system under optimal conditions. Commonwealth
solar derives these optimal efficiencies from the PVWATTS calculations made by the National Renewable
Energy Laboratory.
The parameters for optimal installation in Worcester, MA are as follows:
77% DC to AC conversion rate
A 42 degree array tilt
A due South orientation of the panels
19 Commonwealth Solar. (2008). Solar Photovoltaic Rebates: Program Manual. Retrieved September, 2008, from
http://www.masstech.org/SOLAR/Commonwealth%20Solar%20Program%20Handbook_v2_070108.pdf

29
Applying these parameters to the Worcester area produces a kilowatt per hour price of 11.8
cents with a price of 14.8 cents per kilowatt hour if the system is at 80% for the efficiency of the optimal
system. Systems with a projected efficiency less than 80% may still be considered for a rebate, but the
amount of the rebate is reduced on a sliding scale with reduced efficiency. Using this scale, systems with
efficiencies as low as 65% of optimal may still receive a rebate (70% of the normal rebate with a 65%
optimal system). The price per kilowatt hour for a system with 65% of optimal efficiency is 19.7 cents.20
In order to be eligible, the installation must be approved by a Massachusetts licensed
electrician. The installation must meet all local, state, and federal building and electrical codes. An
Interconnection Agreement must also be filed with the utility company to which the system will
interface.
The components of the solar system to be installed must have certain minimum warranties in
order to qualify, including:
A five year warranty provided by the installer of the system for defective workmanship.
A two years product and 20 years performance warranty on the system modules.
A five year warranty on the system mounting.
A ten year warranty on the power inverters.
Other Requirements:
The equipment installed must be new.
The equipment installed must meet the Underwriters Laboratory standard 1703
20 Commonwealth Solar. (2008). Solar Photovoltaic Rebates: Program Manual. Retrieved September, 2008, from
http://www.masstech.org/SOLAR/Commonwealth%20Solar%20Program%20Handbook_v2_070108.pdf

30
All modules, inverters, and production meters must be on the California Energy
Commission’s list of eligible renewable energy equipment.
All photovoltaic projects must have a dedicated production meter
Systems over 10kw must have a production tracking system (PTS).
A solar-energy system purchased for the principal residence of an individual is fully exempt from
Massachusetts sales tax. In addition, solar-energy systems purchased for commercial, industrial, or
residential use are exempt from property tax over their first twenty years. A 15% tax credit up to $1000
against personal state income tax is available to any owner or tenant for the purchase and installation of
a solar-energy system in their primary residence. The system installed must be new, in compliance with
all performance and safety standards, and be expected to last at least five years.
Renewable energy credits (RECs) are based on the environmental attributes associated with the
generation of electricity. They do not have to do with the electricity itself, but the means by which the
electricity was generated. Renewable Energy credits exist for two primary reasons. For one, the state
government sets Renewable Portfolio Standards on utility companies. These require a certain amount of
electricity produced by these companies to be from renewable sources. Utilities that do not produce
enough electricity from renewable sources may buy RECs from those who produce energy from
renewable sources. RECs may also be sold to consumers who want to be sure that the electricity that
they are consuming comes from renewable source. RECs may be sold to various state and nationwide
organizations. Current prices for these credits range from .5 cents a kilowatt hour to 5.5 cents a kilowatt
hour.
Net metering is an electricity agreement between a consumer and their electricity provider
which allows the consumer to offset some, or all, of their energy cost by running the electric meter

31
backward via producing a surplus amount of energy. Running the electricity meter backward occurs
when a consumer is producing more energy than he or she is currently utilizing.21 As a result, in any
month with a positive net difference, the customer may choose to receive a credit equal to the average
monthly market price of generation per kilowatt hour. The utility company cannot impose special fees
on net metering customers.22 The state of Massachusetts currently enforces all investor-owned utilities
to offer net metering but does not require municipal utilities to abide by the same standard.
The current standard for net metering was enacted on July 2, 2008, and is applicable to
residential, commercial, nonprofit, industrial, school, institutional, agricultural and governmental
sectors.23 Net metering customers are grouped into three classes (I, II and III) which are determined by
system size. The most common size class for residential and a small commercial is Class 1. Class 1
describes any system which is less than or equal to 60kW. The second and third class apply to systems
which are 1MW and 2MW, respectively. For Class 1 solar installations, credits may be carried forward
from month to month indefinitely. These customers may also choose to transfer the credits earned to
another customer on the same utility.
2.4.2 Factors in Determining Economic Feasibility
The final result of this project will be the determination of whether or not the installation of a
solar panel system is economically feasible on Wesley United Methodist Church. Before we proceed
with economic analysis of the solar panel system at Wesley United Methodist Church, we must outline
what factors determine economic feasibility. The startup costs, operating costs, revenue projections,
and financing options will all need to be considered.
21 CalFinder. What is net metering? Retrieved September, 2008, from http://solar.calfinder.com/blog/solar-information/what-
is-net-metering/ 22 DSIRE. Massachusetts Incentives for Renewable Energy. Retrieved November, 2008, from
http://www.dsireusa.org/documents/Incentives/MA01R.htm 23 DSIRE. Massachusetts Incentives for Renewable Energy: Net Metering. Retrieved November, 2008, from
http://www.dsireusa.org/library/includes/incentive2.cfm?Incentive_Code=MA01R&State=MA&CurrentPageID=1

32
In this solar panel installation, the start up costs will include product cost, installation cost, and
the cost of inspection and certification. The product cost will include all of the various hardware
components of a solar power system, including the actual solar panels, the frames to mount them on,
the inverter to convert the DC power to AC, and the grid tie system which will allow it to connect to the
power grid. There will also be the cost of a professional installation, as this is a requirement for the MTC
grant. Finally, there is the cost of inspection and certification, which is also required to receive the
aforementioned grant. All of these costs will be reduced by the grants and incentives outlined in the
previous section to determine the overall startup cost.
After the solar panels are installed and generating electricity, there is an operational cost that
goes along with maintaining them. Solar retailers often give information about the maintenance cost of
solar panels, which includes any maintenance or repairs or replacement of damaged solar panels. Even
smaller costs, such as the cost of shoveling snow off of the solar panels during the winter would fall
under this category.
The money generated from the solar panels would ideally offset the costs mentioned above.
Money generated from solar panels can be broken into three main categories: energy saved, energy
sold-back, and renewable energy credits. The primary category, energy saved, will be the difference in
cost between the electric bill with the solar panels installed and what the electric bill would have been
without them installed. In the simplest scenario, this would be the number of kWh generated that does
not exceed the amount used multiplied by the cost per kWh. The next category, energy sold back to the
electric company, would be any amount of electricity generated by the solar system that exceeded
energy usage and could be sold back to the electric company. The final way to profit from solar panels is
through the sale of renewable energy credits to other corporations. Corporations are regulated by the
government to meet a certain quota for the use of renewable energy. Some generate their own

33
renewable energy; however, others buy credits in lieu of generating it themselves. These credits have
their own market, and the proceeds from of the sale of credits may be in addition to the money received
from the previous two categories.
The final consideration when analyzing the feasibility of such a project is the available financing.
Solar panel systems generally require a large capital investment. Much of this cost is typically paid by
borrowing from banks or investors. Important considerations when looking for financing are the
interest rate, the duration of the loan, the monthly payment, and the required down payment.
2.5 Similar Case Studies
There are many factors to consider when analyzing the feasibility of different solar systems for Wesley
United Methodist Church. We investigated a number of case studies to evaluate the factors in a
feasibility study in the domain of renewable energy.
2.5.1 Holy Name Wind Power Feasibility Study
The Holy Name wind power feasibility study investigated the feasibility of installing a wind
turbine at Holy Name high school.24 The main task of the project was broken into various parts. First,
site data was gathered, including wind speeds, current energy usage and property characteristics. Using
this data, a number of sites were proposed and compared against a set of heuristics to determine the
best possible location. Then, based on the size of the installation that would be required to provide an
adequate amount of electricity, a list of possible turbines was made. These turbines were then
compared against each other to find the best possibility. Also, a mathematical model was created to
determine the economic feasibility and break-even points using different financing options. Five, seven,
ten, and twenty year loans were simulated and return on investment figures were calculated for each
simulation. Grants, net metering, energy certificates, tax incentives, and different loan options were all
24 Foley, B., Forbes, T., Jensen, H., & Young, A. (2006). Holy Name High School Wind Turbine Feasibility Study. WPI Library:
http://www.wpi.edu/Pubs/E-project/Available/E-project-121306-104131/

34
explored. The report concluded that 60 to 70% of the school's electric bill could be saved through the
installation of a turbine.
Although this project did not focus on solar panels, there are many aspects of it that are
applicable to any renewable energy feasibility study. The process of determining feasibility itself, from
site analysis to comparing different technologies to creating an economic model, is similar regardless of
which renewable source is considered. Also, many of the incentives for renewable energy are similar for
both wind and solar systems.
2.5.2 Solar Feasibility Study of a Learning Center at WPI
The Feasibility Study of a Solar Learning Lab at WPI was an incredibly insightful case study due to
its similar location to our target and the use of photovoltaic panels.25 The goal of this Interactive
Qualifying Project was to determine the feasibility of acquiring a Solar Learning Lab somewhere on the
WPI campus. A Solar Learning Lab would give the students of WPI the ability to study the effects of solar
energy without leaving campus. While the objective of this project was not to generate power for the
school, the similarities between this project and ours gave us a good idea of the steps we would have to
take to determine if the meteorological conditions were acceptable for using photovoltaics.
A Solar Learning Lab is the term used to describe a photovoltaic system integrated with a
Heliotronics educational monitoring system. 26 The entire system is used to bring current solar
information to a computer display where students are then capable of manipulating the data to
generate graphs and plot trend lines. A Solar Learning Lab is designed to provide students with a hands-
on understanding of how photovoltaics work without purchasing a large system.
25 Wailgum, J., Ledue, J., Chapman, J., & Al-Beik, H. (2003). Feasibility study of a solar learning lab at WPI. WPI Library: http://library.wpi.edu/cgi-bin/Pwebrecon.cgi?BBID=251492 26 Heliotronics. Heliotronics Data Acquisition Systems. http://www.heliotronics.com

35
One of the first tasks that the IQP group undertook was to determine an acceptable location for
their solar panels. This meant that each possible location must agree to a set of criteria and is ranked on
how well it matched. Several considerations were safety, space and availability, accessibility, security,
connectivity, sunlight exposure, and grid tying considerations.
The final location chosen was "Daniels Hall". This building fit each of the criteria and gave the best
possible outcome for the project. The decision process of choosing a location was very enlightening and
paralleled our own process.
The next step of the group was to establish their projected results. The installation process was
reviewed many times to determine what spot on the roof of Daniels Hall provided the easiest
installation. Several experts from various contracting companies were brought in to provide their
detailed analysis on the location and installation situation. This process established the cost of the Solar
Learning Lab as well as the installation and maintenance, which enabled the group to generate a cost
analysis of their project.
The last remaining step was to establish an acceptable marketing campaign that would sell WPI
on their idea. The group presented their project's financial aspects, academic benefits, and
environmental friendly appearance. Each subject was presented in a fair and unbiased manner that
depicted the strengths and weaknesses of the project.
2.5.3 Janssen Ortho LLC Solar Power Feasibility Study
Janssen Ortho LLC is a subsidiary of Johnson and Johnson based in Puerto Rico and had an IQP
team evaluate the feasibility of a solar panel installation27. This project discussed the history of Janssen
Ortho LLC and the importance of being environmentally friendly to the company (17). Johnson and
27 Sands, E., Moussa, O., Meagher, G., & Lemaire, J. (2004). Solar Energy at Janssen Ortho LLC. WPI Library: http://library.wpi.edu/cgi-bin/Pwebrecon.cgi?BBID=253817

36
Johnson follow a credo, part of which states that it will be a leader in helping the environment. Janssen
Ortho LLC consumes 33 million kWh yearly, certainly too much to be generated entirely from solar
power. The project group consulted with Powerlight Corporation, a world leader in solar installations,
and eventually recommended a pilot installation. The pilot system would product 101kWp (kilowatts
peak), less than 1% of Janssen Ortho’s power consumption; however it would demonstrate to the
community that they were interested in alternative energy. This group also proposed a possible larger
scale solution that would involve the construction of a solar panel mounting structure over the parking
lots. Due to the high expense of building on top of the parking lots, the group only recommended
pursuing this if they were able to get 70% government aid. The group also created brochures for
employees and for the community to spread information regarding the benefits of solar projects.

37
3. Methodology
In order to determine the overall feasibility of installing a photovoltaic system on the roof of the
Wesley United Methodist Church, we divided this task into five sections. The first section, site analysis,
was concerned with obtaining the physical layout of the roof space suitable for panel placement, as well
as determining relevant meteorological data that was needed for energy calculations. The second
section, possible solar panels and placements, dealt with determining the criteria and system that would
be used to select the best panel style for the church. The third section investigated what the effect of
different orientations and configurations of the panels would have on the amount of energy that could
be produced. Economic feasibility of the systems, the fourth section, investigated what economic
factors and assumptions should be used in order to create an accurate economic model of the solar
panel system as an investment vehicle. In the final section, social implications, our objective was to
determine what social factors might come into play that could help or hinder the support for the
installation of a photovoltaic system.
3.1 Site Analysis
Given the relationship between the sunlight available in a region and a solar cell’s energy
output, site analysis was one of the greatest influences on the feasibility of a photovoltaic project. Given
the church’s geographical location in Worcester, Massachusetts, several factors were considered. Each
factor dealt primarily with the sunlight available or the geographical layout of the designated site.
Factors such as location, average sunlight, daily shadows, obtrusive objects, and structural positioning
combined to form the project’s site analysis. To obtain the data needed to form our site analysis, the
project was divided into a number of domains. The first dealt primarily with the meteorological
conditions of Worcester. This domain sought to answer the question of how much sunlight is available,
as well gather any information that would ease the calculation of how much energy can potentially be

38
produced by an array of solar cells. The second domain dealt with the structural layout of the roof space
at the Wesley United Methodist Church. This domain was responsible for determining where solar
panels could be placed by taking shadows, obtrusive objects, and structural support into consideration.
The third domain consisted of gathering and summarizing the current energy usage of the church. This
data could be used to form estimates about how much money could be saved through the energy
generated by the installation of a solar panel system. The last domain, concerning the installation of
solar panels, dealt with determining what factors would come into play when installing the panels onto
the roof, as well as integrating the system into the electrical grid.
3.1.1 Meteorological Analysis
Gathering and summarizing meteorological data was a vital aspect for creating the site analysis.
Obtaining meteorological data is done with relative ease these days. One of the greatest resources of
weather data is provided by GAISMA28. It includes information such as monthly atmospheric clearness
as well as sunrise and sunset durations. Most importantly, GAISMA offers a monthly insolation
calculation. Insolation is a composite measurement that summarizes the amount of solar radiation that
an area receives. The insolation value is a numerical value that represents the average kWh/m2/day in a
given month. These values are exceptional tools that encapsulate various meteorological events; for
example, this calculation encompasses the change in sunlight due to cloudy or partially cloudy days. The
result is a value that describes the amount of solar radiation (sunlight) available in a given area per day.
This average was used in the calculation of how much energy would be produced by a given solar panel.
This allowed for relatively accurate calculations of future energy production which was essential for
determining when a return on investment could be realized.
28 GIASMA [Online] www.giasma.com

39
3.1.2 Layout of Roof Space
To determine the layout of the roof space, we took preliminary measurements of the roof. With
these basic dimensions, we were able to calculate a best-case scenario for mounting solar panels. This
best-case scenario acted as an upper bound on the size of the system that could be installed. With the
preliminary measurements, we were also able to obtain a set of plans for the roof, with detailed
dimensions. From this, a simpler and smaller-sized CAD drawing was created using the set of plans and
the measurements taken on the roof. However, the primary problem with taking our measurements at
only one time of day was that they didn’t include all possible shadowed areas. Another problem
encountered was that we didn’t initially record the locations of any other possible shadows, such as
trees or the chimney, which could cast a shadow over several panels at different times of day.
Our research on different panels showed that panels should not be partially shaded. It was
therefore decided that we would visit the site at different times of day to take detailed measurements
of where shadows fell. This allowed us to create a printed plan of the roof space, including areas
representing the shaded portions of the roof, using a software modeling program. With this
information, a more accurate calculation of the possible area suitable for a photovoltaic system was
made.
We also determined the necessary spacing of an array using different panels, to figure out how
many panels could effectively fit onto the roof’s surface. Inter-panel spacing was important because
tilting the panels for the optimum angle of the sun could potentially cause them to cast shadows onto
each other. Using trigonometric calculations, we found the spacing necessary between panels to avoid
these types of shadows, as well as determined the maximum number of panels as a result of this
spacing. This maximum number of panels allowed us to determine how much power could be
harnessed in each of our panel configurations.

40
3.1.3 Energy Usage
We found it necessary to gather previous energy data from the church in order to gain a better
understanding of how a solar panel system would affect the overall amount of energy that the church
could save. Previous electric bills contained the number of kilowatt hours consumed by the church, as
well as the price paid for these hours. Using this data, we were able to summarize the trends in energy
usage over the course of the year, and more importantly, compare this energy data to the estimated
energy that could be produced by a solar panel installation. The electrical purchasing history of the
church also gave us an initial cost of electricity, which was very useful in our economic analysis.
3.1.4 The Installation Process
Researching the installation process was another important aspect of the site analysis. This
involved contacting local installers and analyzing the Worcester Code Enforcement to better understand
the electric codes relevant to the installation of a photovoltaic system. In addition to this, we contacted
National Grid, the power supplier for the church, to find any other regulations pertaining to connecting
the church’s solar panel system to the electrical grid. It was also important to determine the nature of
the materials that the roof was composed of, and what methods of mounting the panels would work
best on these surfaces. Research was done to create a contact list of local installers who would be able
to install a system if it were found to be feasible.
3.2 Analysis of Solar Panels and Systems
In our pursuit of the most economical solar panel solution for Wesley United Methodist Church,
we came across many possible options for panels, inverters, and other equipment, each with their own
costs and benefits. In order to determine which solution was optimal, we enumerated a list of criteria
that was used to evaluate each solution.

41
We decided that the best metric for evaluating a solar system was the cost per Watt produced
by the panel. Naturally, the lower this number, the greater energy production that can be purchased for
the same dollar amount. This criterion will lead to a better return on investment and fewer years until
the church recovers their initial capital.
We determined that the second most important criterion for determining the feasibility of a
solar panel system was its durability. Less durable systems would incur higher maintenance costs and
exhibit a shorter lifetime of operation. The longer the solar system lasts the more energy the church will
be able to obtain from it.
We decided that the efficiency rating of the photovoltaic panel was important because it is
directly related to the maximum power a system using the panel could produce. The church had a set
amount of space available for a solar installation. The higher the efficiency of the solar system, the
higher the amount of power we could get from a system covering the same amount of space.
The availability of a certain solar technology also factored into our analysis of feasibility. There
are long waiting lists for some of the newer solar panel technologies, such as thin film solar panels. For
this criterion, there was a trade-off between only looking at what is readily available and waiting for a
better technology to become available.
The weight of the solar panel system was important. The roof at Wesley United Methodist
Church is able to support 35lb per square foot, so any system heavier than that was disregarded.
Finally, we considered the carbon footprint of the manufacturing process as we analyzed solar
panel feasibility. Some manufacturing processes place a larger burden on the environment than others.
Because one of the greatest benefits to using renewable technologies is the positive effects they have
on the environment, this was something to consider. It was not, however, as important as some of the
previous criteria because the most important part of this study was to find a solar solution that would be
economically feasible. We would not recommend proceeding with a solar panel solution that caused a

42
negative cash flow, so it was more important that we found a solution that is economically feasible than
that we found the most environmentally friendly solution. Certainly, any renewable energy source that
gets implemented is significantly better for the environment than continuing to use nonrenewable
resources for energy production.
In order to determine which solar panels were best suited for this project, we first discarded any
that were too heavy for the roof to support. Next, we performed a competitive analysis on the
remaining panels. Competitive analysis is a process that can aid in making decisions when there are
many factors to consider. First, we created a list of criteria and weights, which can be seen in the table
below. Weights were assigned to each of the criteria, based on the decided importance of each. The
different solar solutions were then rated in each of these categories. Finally, each weight was multiplied
by its respective rating and then all of these results were tallied for each solution. At the end of this
process, each solution was given a number representing its overall score.
Criteria Weight
$/Watt 10
Durability 8
Efficiency 7
Availability 4
Manufacturing Carbon Footprint 2
Table 2: Solar Panel Criteria
We found cost per Watt to be the most important criterion because it is most directly related to
the economic feasibility of the system. For this reason, we assigned cost per Watt a weight of ten. A
system’s durability is also very important to its overall performance, as a greater system lifespan will

43
increase the amount of energy that it can produce. However, we decided that durability was less
important than cost per Watt, giving it a weight of eight. Efficiency was not as important as the previous
two criteria. In spite of this, it was still important that we meet a certain level of efficiency in order to
generate enough power given the limited roof space. Therefore, we gave efficiency a weight of seven.
The availability of a system was not very important due to the numerous solar panel options available,
so it was given a weight of four. Finally, the carbon footprint was important from an environmental
point of view, but weighting this category too heavily could lead us to selecting a solar power system
that wasn't economically feasible, and therefore would not be implemented at all. For this reason, we
gave the manufacturing carbon footprint a weight of only two. After performing this analysis on many
different solar panels, we were left with a single number for each, representing how well each panel
style met our criteria. We selected the top five as finalists for our recommended solar panel
implementation.
3.3 Solar Panel Placement
Determining where to physically place the panels on the roof, as well as how to orient them,
was important. This is because a panel’s orientation can have a large effect on the amount of solar
energy it can gather and power it can generate. In order to decide how to optimally place the solar
panels that were chosen, we created a number of placement scenarios. For each of our proposed
scenarios, we determined a corresponding solar panel placement. Each placement has been carefully
laid out attempting to meet the following criteria: maximum amount of power generation while still
leaving room on the roof to walk. If at any point throughout the analysis, we felt that the given layout
would not allow enough room to walk, we would remove the offending panels.
In order to generate the maximum amount of power, we wanted to place as many panels as
possible at the optimal angle, without any of them being shaded between 9:00am and 3:00pm, the time
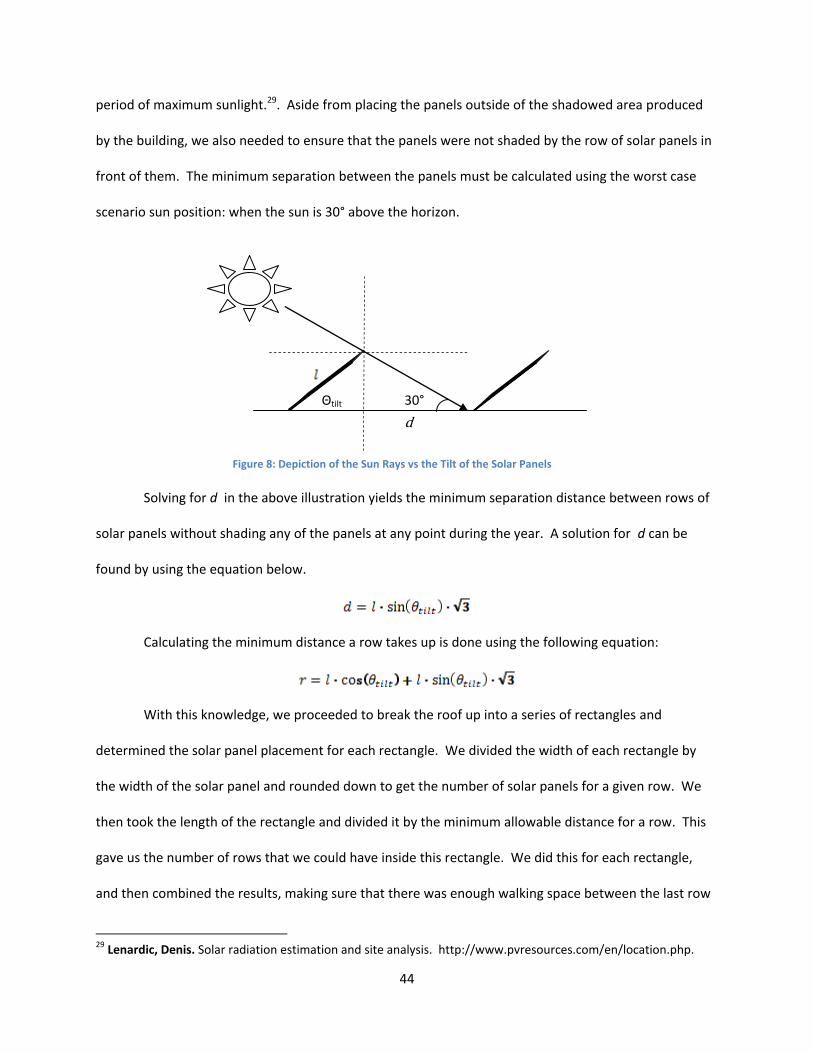
44
period of maximum sunlight.29. Aside from placing the panels outside of the shadowed area produced
by the building, we also needed to ensure that the panels were not shaded by the row of solar panels in
front of them. The minimum separation between the panels must be calculated using the worst case
scenario sun position: when the sun is 30° above the horizon.
Solving for d in the above illustration yields the minimum separation distance between rows of
solar panels without shading any of the panels at any point during the year. A solution for d can be
found by using the equation below.
Calculating the minimum distance a row takes up is done using the following equation:
With this knowledge, we proceeded to break the roof up into a series of rectangles and
determined the solar panel placement for each rectangle. We divided the width of each rectangle by
the width of the solar panel and rounded down to get the number of solar panels for a given row. We
then took the length of the rectangle and divided it by the minimum allowable distance for a row. This
gave us the number of rows that we could have inside this rectangle. We did this for each rectangle,
and then combined the results, making sure that there was enough walking space between the last row
29 Lenardic, Denis. Solar radiation estimation and site analysis. http://www.pvresources.com/en/location.php.
30°
Θtilt
d
Figure 8: Depiction of the Sun Rays vs the Tilt of the Solar Panels

45
of one rectangle and the first row of an adjacent rectangle. This process generated our optimal panel
placement.
To determine how we would wire the solar panels together, we followed the concept that we
would wire solar panels in series that could potentially be shaded at the same time, and putting those
rows in parallel with other rows.
We calculated the maximum number of solar panels that could be placed in parallel by dividing
the maximum current rating for the inverter by the peak current generated by the solar panels under
ideal conditions. Rounding this number down gave us the maximum number of parallel rows.
Dividing the maximum voltage rating for the inverter by the peak voltage of the panels under
ideal conditions and rounding down gave us the maximum number of solar panels that could be wired in
series.
Based on the maximum number of panels that could be wired in series, we created rows of
maximum length, going from north to south. This guaranteed that if there was shade, all of the panels
in series would be shaded at the same time. We then placed as many adjacent rows in parallel as was
allowed by the MAXparallel calculation, and wired them all to one inverter. We repeated this process until
all solar panels were wired to an inverter.
It is important to note that if shading occurs on a given solar panel, then current is unable to
flow through it or any panels that are in series with this panel. This is important to consider when wiring
up the panels, so that they are done in a way such that a small patch of shade won’t prevent multiple
rows of panels from producing electricity.

46
3.4 Economic Feasibility of the Systems
The crux of this project was the determination of economic feasibility. In order to determine
economic feasibility, one must do a thorough job of both understanding the mathematical analysis
behind it and estimating the various parameters that are taken into account. This section will describe
the mathematical analysis that we employed during our project as well as explain our methodology for
the analysis. Later, during the economics section, we will present our choice of various parameters that
go into the economic calculations along with our reasoning for their selection.
Initially, we gathered information about similar projects that have been done to determine
economic feasibility. The Massachusetts Technology Collaborative (MTC) offers a Microsoft Excel
spreadsheet that helps users determine the feasibility of solar panel installations.30 This spreadsheet
was helpful because it accurately calculated the total rebates available in Massachusetts. It had a
detailed depiction of cash flow analysis, and overall, cleanly presented the data. While being an
excellent tool, we believed that there were many drawbacks to directly applying this economic analysis
to Wesley United Methodist Church. The largest concern was that MTC’s analysis was specific to either
a taxable commercial entity or a personal residence, while the Wesley United Methodist Church is
neither, being a non-profit organization exempt from taxes. Rather than trying to modify what MTC had
done, we decided to assume the relevant portions from their spreadsheet and use them as a basis for
our own calculations. This allowed us to make a spreadsheet tailored specifically to the Wesley United
Methodist Church.
The spreadsheet that we made contained the following sections:
Section 1: System Size and Cost
Section 2: Installation and Fees
Section 3: System Life Expectancy
30 Non-Residential Rebate Calculator. Commonwealth Solar. http://www.masstech.org/SOLAR/Attachment%20A2-Non%20Residential%20Solar%20Rebate%20Calculator%20Only-070208.xls.

47
Section 4: Incentives and Rebates
Section 5: Financing
Section 6: Energy Generation and Usage
Section 7: Worldwide Economic Factors
Section 8: Results and Analysis
The first section dealt with the scale of the system, the cost of the solar panels per Watt, and
the cost of the inverter and other components. We chose to have the data entered in this way because
by using cost per Watt as a primary variable, the economic analysis is more readily scalable to systems of
various sizes. Until a company makes a final estimate, we feel it is best to analyze the data on a per
Watt basis because other parameters can be changed to see how they affect the cost of the overall
system. The end of Section 1 displays the total cost of the photovoltaic system components.
The next section dealt with the cost of the installation and other associated fees. The largest
contributor to this category was the installation cost per Watt. The most accurate way to determine an
installation cost would be to get multiple estimates from different contractors. In the meantime, we
have chosen to look at the installation cost on a per Watt basis because we can estimate it with a
reasonable amount of certainty and because it is scalable to different system sizes. After taking into
account electrical inspection costs and other fees, section two calculates the total cost of installation
and fees.
Section three dealt with the system’s lifespan and maintenance costs. The system life
expectancy is an important factor because it determines the amount of time the solar panel will be
producing energy. A longer life expectancy generates a better net present value (the sum of future cash
flows discounted to the present value) and a better return on investment. This section also deals with
system degradation, as each year solar systems put out slightly less energy than they did before. This is

48
due to the system slowly breaking down. Maintenance costs, as well as a maintenance cost adjustor
were also included in this section. The maintenance cost adjustor allowed us to predict how much
maintenance costs will increase over the lifetime of the system.
The next section, incentives and rebates, came primarily from MTC’s spreadsheets for
determining economic feasibility. Its parameters are the system size, whether or not the building is a
public building, and whether or not the components are manufactured in Massachusetts. It uses these
factors to determine the total system rebate. This section also takes the Renewable Energy Credit (REC)
price per Watt and an accompanying adjustor for this price and estimates the revenue that will be
generated each year from renewable energy credits. At the end of this section, we were able to
calculate the total cost of the solar panel system, by taking into account the cost of the components, the
cost of installation and fees, and the total rebate received.
The section on financing allows the user to input the down payment percentage, which is useful
to help the church determine how the size of the down payment affects the system’s overall economic
feasibility. The interest rate and loan period are also inputs in this section. With this data, we were able
to calculate the size of the down payment and the monthly payment.
The next section, energy generation and usage, allows us to calculate how much energy will be
produced from the solar panels. There are fields to input the average daily insolation per m2 for each
month. Using this data, along with the system efficiency, we can determine the total amount of energy
expected to be generated in the system’s first year. Using the degradation factor from Section 3, we can
then determine the expected energy generation for each year of the system’s life expectancy.
The last section, analysis, takes information from the previous sections to compute typical
economic values such as net present value, the breakeven point, and cash flow. The yearly cash flow (a
value which changes from year to year) is calculated by taking the amount of money saved in the year,
from both RECs and saved energy costs, and subtracting the cost of the loan. Net present value is

49
determined by taking these future cash earnings and discounting them by the present value interest
factor and then subtracting the initial down payment, as outlined in “ISD Module: Quantitative Methods
in Economics.”31 We can determine the break-even point by figuring out when the discounted value of
future earnings is equal to the initial investment, in this case the down payment.
In many cases throughout this analysis, we used adjustor percentages for different factors. This
was so that we could have a more accurate economic model for the dynamic future. Taking these
factors into account and having them accurate is important for the overall accuracy of our model as we
look forward.
The economic values determined in Section 8, Analysis, will essentially determine the economic
feasibility of the project. We would not be able to recommend beginning a project that had a negative
net present value, a negative cash flow, or an internal rate of return lower than that of a typical savings
account.
A printout of the economic spreadsheet described in this section can be found in Appendix X.
3.5 Social Implications
Uncovering the possible social impacts of installing a photovoltaic system on the Wesley United
Methodist Church was important, not only for determining the feasibility of the project, but for
determining how this project might affect the growth in the number and scope of such systems in the
surrounding community. Current viewpoints on the acceptance of solar panel systems, especially the
viewpoints of the Wesley Church congregation, were important to consider. The congregation's support
of such a system may even lead to donations specifically for its construction, a key factor for a non-profit
organization.
The first step in this process was discovering what possible social and cultural effects would be
witnessed from the installation of a photovoltaic system, as well as the extent of each effect. We
31 Woods, Douglas W. ISD Module: Quantitative Method in Economics.

50
determined that the notion of environmental stewardship would be a key factor. Besides this, we
investigated the educational opportunities such a system would provide, as well as the broader effects
that photovoltaic panels can have on society.
A brochure was created in order to inform the congregation about the benefits of solar panels
as well as address some of the questions that may arise in regards to an installation on the roof of their
church. It was important for this brochure to be informative as well as succinct. Outlining key financial,
environmental and social benefits was the most important feature of the brochure.
It was also important to judge the congregation’s receptiveness to a photovoltaic system. In
order to measure their views, we created a survey that was oriented towards the leadership group of
the Wesley United Methodist Church that attended our final presentation (Appendix N). The survey
focused on how members of the congregation felt about having solar panels installed on their church. It
was important to measure how the congregation felt about the installation of solar panels in general.
This was used to determine if it was the receptiveness of solar panels in general that caused the
congregation to react in a particular way, or rather the installation of solar panels on their church in
particular. We also wanted to access from this survey if members of the congregation felt that the
social benefits of installing such a system could outweigh the economic benefits. That is, we wanted to
know if the church would still install a solar panel system if there were limited or no economic incentive
to do so.
The survey was designed to maximize the the opportunities for qualitative responses to open-
ended questions. The goal was to make the survey so that it could be completed in a few minutes.
In addition to determining the overall feasibility of installing solar panels on the Wesley United
Methodist church, a secondary goal of this project was to promote the awareness of solar panel systems
the greater Worcester community. To achieve this, it was important to create a set of information that
could be presented and distributed to the community. This final presentation included information

51
about solar panels in general, the steps required to determine their economic impact and get them
installed, and reasons why solar panel systems are beneficial both economically and to the environment.

52
4. Site Analysis
This chapter is concerned with the physical conditions of the church and area around it that
would affect the installation of a solar panel system. The nature of a solar array requires that the site
analysis take into account the physical structure and layout of the roof space, as well as the weather.
The weather plays an important role with such a system, determining the amount of sunlight that can be
gathered by the panels and converted into energy. After a brief introduction to the location of the
church, this chapter begins by discussing the meteorological findings for the area in which the church is
located. The next section describes the physical layout of the roof space. This is followed by an analysis
of the Church’s energy usage, and a look into the installation process.
4.1 Location of the Church
The Wesley United Methodist Church is located near the heart of Worcester Massachusetts.
When traveling down Main Street the United Methodist Church becomes apparent as you approach the
Johnson Tunnel, between State Street and Gertrude Ave. The church is located on 114 Main Street and
resides at approximately 42.3 degrees latitude and -71.8 longitude. The building is four stories tall and
formed primarily out of grey brickwork.
4.2 Meteorological Analysis
One of the greatest challenges in determining the feasibility of a solar project is determining the
amount of energy that is provided by the sun. For solar panels, the primary factor of whether or not a
project is feasible is the amount of sunlight a chosen area receives. To calculate this, many factors must
be considered: average sunny days, clearness of the weather, precipitation, average sun duration, and
latitude. To find how each of these factors effects the overall conclusion, tedious calculations must be
done. Weather data from previous years need to be consolidated and then averages can be calculated

53
from this data. Fortunately, much of this information is readily available. The United States Renewable
Resource Energy Data Center (RREDC) contains all the information needed to address these factors.32
One of the most useful ratings provided by the U.S Renewable Resource Data Center is the
insolation graph. This graph displays the average solar energy per square meter per day in any given
month. This value is calculated from thirty years of data gathering and is extremely useful when
calculating the energy that can potentially be generated if solar panels are installed. From RREDC's
website many different insolation graphs can be calculated. The website provides the user with three
options. The first is what type of data to be displayed. This value can either be: average, minimum, or
maximum. The second option is which month’s data to view. The user is given an option of choosing a
specific month out of the twelve, or the annual reading, which provides an average. Finally, the third
option specifies how the solar panels are to be orientated. Because Worcester is located at
approximately 42 degrees latitude, the choice of orientation could drastically change the insolation
values. For this project, the solar panels can be oriented southward at latitude. On the following page is
a graph of the United States generated from RREDC's website which encompasses the average annual
solar radiation for south facing panels. Each region on the map relates to a specific insolation value,
where higher is better. In the case of Worcester, this area falls within the average of 3 to 5 kWh/m2/day.
32 RReDC. U.S. Solar Radiation Resource Maps. Renewable Resource Data Center. [Online] National Renewable Energy
Laboratory. http://rredc.nrel.gov/solar/old_data/nsrdb/redbook/atlas/
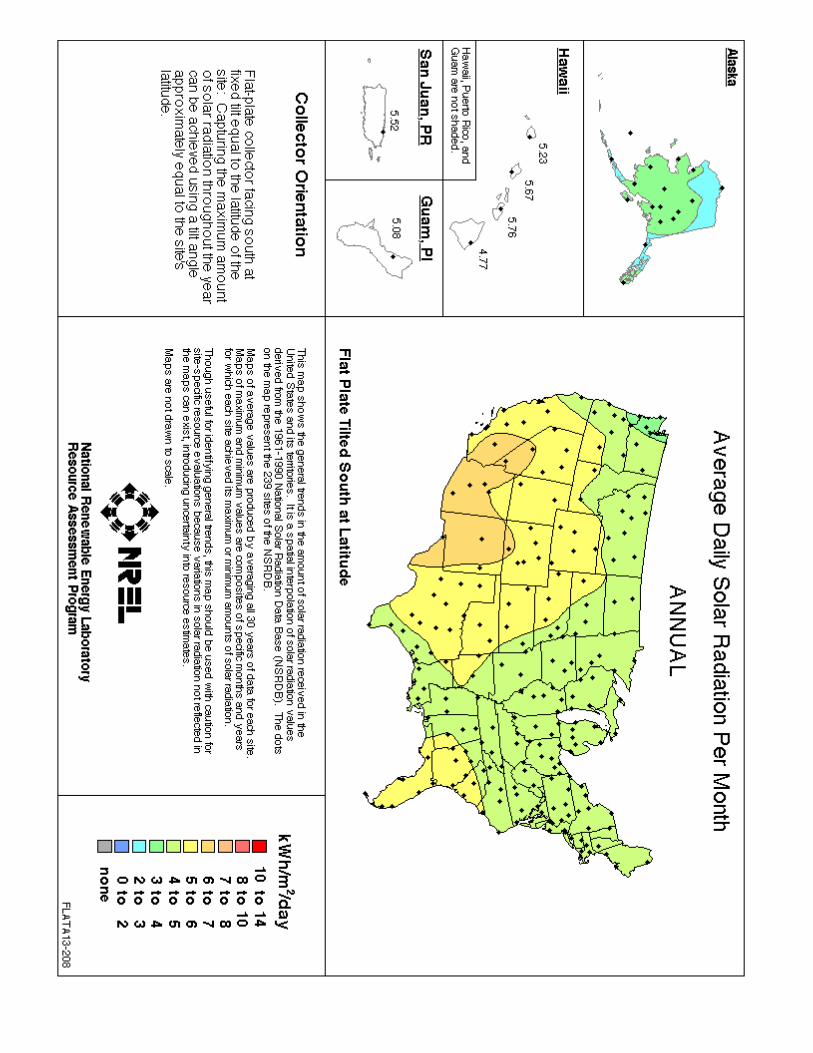
54

55
Expanding on the information above, the GAISMA organization also provides in-depth analysis
of monthly insolation values. 33 By selecting the Worcester area, GAISMA provides a plethora of solar
information from sunrise and sunset times, sun path diagrams, and solar energy and surface
meteorology. While much of the information is enlightening, the most valuable statistic is the
"insolation, kWh/m2/day" value found in the solar energy section. The GAISMA organization provides a
very simple breakdown of insolation values for each month during the year. The difference between
GAISMA's data and RREDC's is the fact that GAISMA provides a precise numerical value where RREDC
only provides a range between two integers.
Figure 9: Mean Daily Irradiation for Worcester
33 GAISMA. [Online] www.gaisma.com

56
Using the data we have collected concerning insolation values, we are now capable of
determining an approximate output of the panels. For example, when the project was in its infant
stages, we estimated we had 270 square meters to work with. We then wanted to determine what the
average energy was available to that given area. To calculate this we multiplied an insolation value of a
specific month by the area available. The result is in kWh per day. Currently, the average efficiency of a
solar panel is approximately 10%, so we multiplied our result by 10%. The result is an average amount of
energy we could hope to acquire in a day if we covered the entire area with solar panels of an
appropriate power rating. To determine what the average energy would be in a month we multiply this
value by the number of days in the month. The result is a value that we can use to directly compare with
electricity bill's consumption value sent monthly by the local energy provider. The benefit of
determining this is that we can determine if the energy produced by that area is enough to meet, or
exceed the church’s current consumption.
4.3 Layout of Roof Space
The primary roof space that would potentially be used for the solar panel array is a mostly flat
area that is about 55 feet wide and 80 feet long. The area has an open southern exposure that makes it
ideal for solar power collection. The flat part of the roof is situated in such a way that it is sunny with
few shadows throughout the day, and anything mounted to the roof would not affect the aesthetics of
the building from most angles, particularly Main Street in front of the building.

57
58
The flat roof area is covered with a white rubberized roofing material. In the center of the main
open area are two large skylights (shaded black in the drawing), which take up space and cannot be
removed or covered with panels. There is a third skylight mounted to the side of the north sloped roof.
To the west side of the large open area is another section of sloped roof that rises above the flat roof
about 20 feet. This creates a separate flat section that is primarily shaded by the sloped roof and the
large chimney. On the east side is the sloped roof that runs parallel to Main street in front of the church
and will completely block anything on the flat roof from view. The southern exposure is open to the side
street next to the church building, but the height of the building blocks anything not on the edge of the
roof from view.
In the northwest corner is an elevated flat portion about 40 feet taller than the rest. This 20
foot by 40 foot section is almost entirely in the sun throughout the day and is covered in the same white
rubberized material. It’s accessible by a ladder mounted to the wall, and is somewhat isolated from the
rest of the roof area. This makes it somewhat less convenient to use. There is internal access to the
main portion of the roof, making inspections, repairs and snow removal easier. This would also facilitate
in monitoring the solar panels.
4.4 Energy Usage
Due to the church’s size and daily activities it is no surprise that the Wesley United Methodist
church uses a significant amount of electricity. Currently the church uses an average amount of 9500
kWh of energy a month; which totals to $1300 dollars a month in electricity costs. It is apparent why
the church has sought cheaper, renewable energy to offset electricity cost.
To correctly assess the impact of renewable energy sources, such as solar panels, we
determined the church’s past and present electricity usage. The easiest method for determining the
consumption trends from month to month is using past electricity bills. After consolidating electricity
usage bills for one year in 2007 we created the graph below to help visualize the months of greatest
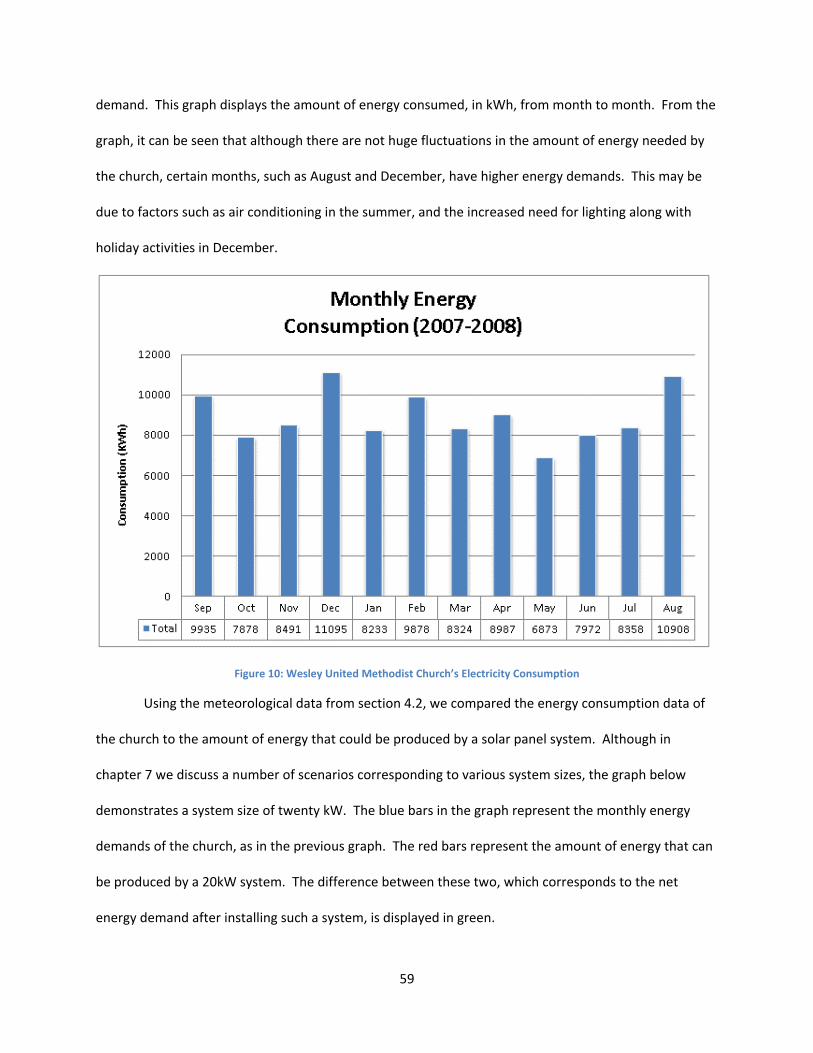
59
demand. This graph displays the amount of energy consumed, in kWh, from month to month. From the
graph, it can be seen that although there are not huge fluctuations in the amount of energy needed by
the church, certain months, such as August and December, have higher energy demands. This may be
due to factors such as air conditioning in the summer, and the increased need for lighting along with
holiday activities in December.
Figure 10: Wesley United Methodist Church’s Electricity Consumption
Using the meteorological data from section 4.2, we compared the energy consumption data of
the church to the amount of energy that could be produced by a solar panel system. Although in
chapter 7 we discuss a number of scenarios corresponding to various system sizes, the graph below
demonstrates a system size of twenty kW. The blue bars in the graph represent the monthly energy
demands of the church, as in the previous graph. The red bars represent the amount of energy that can
be produced by a 20kW system. The difference between these two, which corresponds to the net
energy demand after installing such a system, is displayed in green.

60
Figure 11: Power Consumption vs. Energy Production of a 20 kW System
From this graph, it can be seen that the system displayed does not produce enough electricity to
fully offset the demands of the church. Because of the very large energy demand required by the
church, coupled with the amount of irradiation in the Worcester area, it would take system that is larger
than could be supported by the available roof space. So although it is unlikely that the church will be
able to sell any excess energy back to the utility company, the amount produced could defer a
considerable fraction of their overall energy demands.
4.5 The Installation Process
Because the church has a newly installed membrane roof on its flat areas, installation on this
portion of the roof should be relatively simple. The mounting structure for the panels can be directly
connected to the roof and sealed to maintain insulation. These portions of the roof are rated for 35 lbs
per square foot, which should not be exceeded.
0
2000
4000
6000
8000
10000
12000kW
h
Month
Energy Usage and Production - 20 kW System
Energy Used
Energy Produced
Net Usage

61
The slanted portions of the roof, however, are covered in slate. If any solar panels were to be
put on this area of the roof, we would recommend removing the slate tiles on these portions. This is
because the fragility of slate requires that it be given higher level of maintenance. For example, cracked
tile may need to be replaced. If solar panels were mounted on a slate portion of the roof that needed to
be repaired, significant work would need to be done in order to fix the underlying slate. Also, the
installation procedure for mounting panels on a slate roof is more complex, and the tilt angle of the
panels is restricted to the slope of the roof.
It is important that during the installation process all necessary electrical and building codes are
adhered to. Certain requirements are also stated by Commonwealth Solar in their minimum technical
requirements.34 These include the use of a Massachusetts licensed electrician to do all of the electrical
work, making sure all wiring modifications are properly insulated, and that the system can be
disconnected for maintenance.
Another aspect of the installation process is tying the solar panel system into the electric grid.
This allows the excess electricity produced by the system to flow into the local electrical grid to be used
by other members of the grid. This process begins by completing an interconnection agreement with
the local utility company. The utility company reviews the project to make sure that it will have no
negative impacts on the grid. The utility company, town and local inspectors, and the contractor
installing the system are all involved in this process. It is best to begin the interconnection process
during the final design stages of the system, but before construction, due to the level of technical detail
needed by the utility company in order to assess the installation’s possible effects.
In order to give the church the information necessary to pursue an installation if they found it to
be feasible, we created a list of installers who would be able to install such a system. This list can be
seen in Appendix <Solar Panel Installer Appendix>. The list was compiled using information in a
34 Massachusetts Technology Collaborative. Commonwealth Solar Rebate Program. Retrieved 1/15, 2009, from
http://www.masstech.org/SOLAR/CS_AttachmentDMinimumTechnicalRequirements_v3_010109.pdf

62
spreadsheet of Massachusetts solar panel installers provided by Commonwealth Solar.35 Installers were
then selected based on the costs of their installations, the size and scope of previous installations, and
reviews and recommendations gathered from our various correspondences.
35 Massachusetts Technology Collaborative. Information on Installers and Costs. Retrieved 1/15, 2009, from
http://www.masstech.org/SOLAR/CS%20Installer-Cost-Location%20Data%20for%20Website%20as%20of%2001-31-09.xls

63
5. Possible Solar Panels and Inverters
One of the most important factors in devising a photovoltaic array is determining which solar
panels to purchase and what type of inverter to utilize for the situation at hand. To correctly assess
which panels and which inverters would make greatest impact on our feasibility solution for the Wesley
United Methodist Church a component matrix was conceived. The component matrix contains pertinent
information about potential photovoltaic/inverter candidates that have a high chance of success in our
solution. The matrix incorporates many of the highest quality products made by various manufactures in
the field of solar technology. By consolidating these potential products we are capable of determining
which panels or which inverters have benefits over their competitors and how those benefits will affect
our goal of feasibility.
This chapter is separated in two distinct sections: solar panel choices, and inverter choices. Each
section will discuss the criteria used to filter out unwanted components as well as which devices hold
the greatest chance of success.
5.1 Solar panels
At first glance, the amount of solar panels available is overwhelming. To overcome this, a set of
benchmarks was established and each panel was ranked against the set of criteria. If a given panel
ranked poorly it was discarded. Any panel that was moderate or exceptional was added to the matrix of
possible panels to be later scrutinized when all variables had been considered. The criteria were
comprised of these important attributes: power output, efficiency, size, and weight.
Many selection criteria were initially established out of back of the envelope calculations and
later altered when additional variables were realized. Judging by the electrical consumption of the
Wesley United Methodist Church as well as the limited amount of space available for solar cells, we
concluded that our solar panels must have a power output of at least 175 Watts. Panels that are equal

64
to or greater than 175 Watts are ideal for a project of this magnitude. Last year alone the church
consumed 102,000 kWh of electricity. To even begin to offset a fraction of the electricity used a solar
system must be powerful enough to produce enough electricity to be viable. In conjunction with this, a
minimum allowed solar cell efficiency was established at 10%. A higher efficiency also allows the solar
cells to produce its maximum power output more than a lower efficiency counter-part in the same
amount of sunlight.
The size limitations arise from the desire to keep the panels as small as possible. Because space
is a limited commodity the panels that occupy the space must be kept small to allow for more panels in
the limited space. Smaller panels also provide a bonus when discussing shadow effects. Shadows that
are cast on a given solar panel render that entire panel obsolete. A small shadow may render a large
array useless. Having a larger number of smaller panels decreases the chance that a small shadow will
create such detrimental effects as compared to the larger panel. In addition to size, weight was
considered to ensure that the panel could be structurally supported by the rooftop without any
unforeseen consequences. The weight limit was determined by questioning the building inspector on all
possible points on the rooftop.
Model Power Price $/Watt L (in) W (in) H (in) W/in^2 Weight Efficiency
Kyocera’s KD200GT 200W $870 $4.35 56.2 39 1.4 0.09 40.7 15.00%
Sun power Corp.’s SPR-315
315W $1510 $4.80 61.39 41.18 1.81 0.12 53 19.30%
Sharp’s ND-V230A1 230 $1,150 $5.00 64.6 39.1 1.8 0.09 44.1 14.00%
Table 3: Potential Solar Panels
The table above displays three of the most promising photovolatics for utilization in no
particular order.

65
5.2 Inverter Choice
Unlike the photovoltaic selection choice, inverters had a much smaller pool to choose from.
Many inverters were found to either in the midrange, 3000W-7000W output, or in a commercial range,
100000W or above. Because the list of possible choices was so small, all types of inverters were added
to the component matrix. This gave us the opportunity to contrast having one large inverter compared
to several smaller inverters.
Knowing that the maximum energy that could be utilized by filling the Church’s roof entirely
with panels was approximately 25000W it became apparent that the much larger inverters were
overkill. Inverters such as Satcon’s AE30, was capable of connecting up to 37500W to the grid. This
meant that even if we were capable of covering the roof with panels we would only be utilizing 66% of
the inverters capacity.
On the other hand, smaller inverters such as Sunny Boy’s SB7000US would require three
inverters to handle the electrical output of the solar array. While this may seem unfavorable, it actually
carries many advantages. First, smaller inverters can be used to precisely match the power output of the
photovoltaic array. This means that there is approximately 100% utilization of the inverters compared to
only 66% when using Satcon’s AE30. In addition, one AE30 would cost $33,780.00 to handle 25000W of
electricity, while three SB7000US would cost only $12,057.00, more than half the price. Another benefit
to having smaller inverters is the ability to region the array. This means the array, in its entirety, can be
broken into several smaller, independent parts. This method avoids a total shutdown of the array
system if a single inverter fails. Finally, a smaller inverter increases maintainability when compared to a
large commercial inverter. If a large inverter requires replacement it may take days or even weeks to
swap out, not to mention the assistance of a professional. A smaller inverter is generally much simpler

66
to operate and maintain. The SB7000US is actually capable of being carried to the site and is simple
enough to be installed by someone with elementary electrical knowledge. The table below shows a list
of possible inverters.
Model Efficiency Power (W) Current (A) Cost $/Watt
Sunny Boy’s SB7000US
95.00% 7000 34 $4,019.00 $0.57
Sunny Boy’s SB6000US
95.00% 6000 29 $3,725.00 $0.62
Fronius IG 4500-LV
94.40% 4500 21.6 $2,899.99 $0.64
Table 4: Potential Inverters
Once it became apparent that smaller inverters were more beneficial in this situation than their
larger, commercial counter-parts, it was only a matter of reducing cost to arrive at the chosen inverter.
Above is a table which represents the top three chosen inverters for Wesley United Methodist Church.

67
6. Economic Context
We developed an economic feasibility spreadsheet in Microsoft Excel as described in the
Methodology section to aid us in feasibility calculations for various scenarios. In the Methodology
section we explained how the spreadsheet worked. An accurate economic model depends not only on
accurate formulas, but on various parameters that can be estimated with a high degree of certainty,
backed by historical figures or measurements. This section explains our justification for the parameters
that we entered into the spreadsheet. A screenshot of the spreadsheet can be seen below.

68
Figure 12: A screenshot of the economics spreadsheet.
In the first section of the spreadsheet, “System Size and Cost” we are required to determine the
cost per Watt of the solar panels and the cost of the inverter and other equipment. This data comes
directly from our list of solar panels and our inverters and is explained in depth in the section titled
“Possible Solar Panels and Placements”.
The second section, “Installation and Fees”, describes an estimated cost for installation on a per
Watt basis, an estimation of electrical inspection costs, and several other fees. The installation cost per
Watt is the largest factor in determining system cost, so it must be estimated with high precision. We
used the average cost for a solar system, installation and component costs combined, of $8.03 provided
by the MTC36 and subtracted out the component cost to leave us with our installation cost alone.
36 Massachusetts Technology Collaborative. Information on installers and costs. Retrieved 1/15, 2009, from
http://www.masstech.org/SOLAR/CS%20Installer-Cost-Location%20Data%20for%20Website%20as%20of%2001-31-09.xls

69
Unfortunately, without getting an actual bid from contractors, this is the most accurate estimate we
cost estimate we can get. We also came in correspondence with some installers, who confirmed the
rate of $8.00 per watt and gave us a further cost breakdown. A summary of these correspondences can
be found in “Appendix X: Correspondence”.
Section three titled “System Life and Maintenance” provides an estimation of the system life
expectancy, the yearly degradation factor, and the yearly maintenance cost. To use a safe estimate of
system life expectancy, we chose twenty-five years, as that is the typical warranty on solar panels. It
could be the case that the system continued to work after twenty-five years; however we would rather
use a conservative estimate and analyze the feasibility over the next twenty-five years.
The yearly degradation factor is the percentage that the electricity production is decreased each
year, due to several factors such as: packaging material disintegration, adhesional degradation,
interconnect loss of integrity, moisture intrusion, and semiconductor device degradation.
Unfortunately, an effort to collect data regarding photovoltaic degradation has not been well
coordinated. There are, however, two studies that look at degradation on single and multicrystalline
photovoltaics. The Sandia study, which was on multicrystalline photovoltaics, reported 0.5%
degradation per year. The National Renewable Energy Laboratory reported 0.7% degradation per year
on a study they did looking at single and multicrystalline photovoltaic. The graph below shows what the
overall efficiency of a solar panel would be over the course of twenty five years, assuming it started at
13% efficiency37.
37 “Commonly Observed Degradation in Field-Aged Photovoltaic Modules.” Quitana, M.A.; King, D.L..; McMahon, T.J. and Osterwald, C.R.

70
Based on these two studies, we have decided to use the average of their results, and estimate
0.6% annual degradation.
Because solar panels contain no moving parts maintenance costs are found to be extremely
minimal. Due to the fact that the lifetime warranties of solar panels are generally found to be twenty
years or more, it is unlikely that any maintenance costs will be realized within this time span. The cost of
maintaining an array will generally reside in labor, not replacement parts. Thus, maintenance costs for
solar systems are estimated at costing 4% of the initial system cost.38
The “Incentives and Rebates” section is straightforward and its content is taken directly from
MTC’s economic spreadsheet. It describes the total MTC rebate based on the system size, whether or
not the building is public (churches are not considered public in this case), and whether or not the
components are manufactured in Massachusetts. This rebate will most likely be $3.25 per Watt for
Wesley United Methodist Church. Unfortunately, the MTC rebate is the only incentive applicable to the
church, because all other aid is in the form of tax incentives.
38A Rural Electric Co-op’s Experience with Photovoltaic Systems for Livestock Water Pumping, Skinner, Rolland http://www.usda.gov/rus/electric/engineering/sem2002/skinner.htm
Figure 13: Solar panel efficiency over time

71
Section five, “Financing” allows the option for testing how the feasibility of a system changes by
using a loan. This section requires the percentage of the entire loan that the down payment makes up,
the interest rate, and the loan term. It assumes that a fixed rate mortgage will be used, and calculates
the monthly payment. If you wish to not use any financing, simply put down that the down payment
makes up 100% of the loan.
Section six deals with energy cost. The current cost of electricity was based on recent electricity
bills from Wesley United Methodist Church. Current electric rates are $0.16 per kWh. The energy cost
adjustor, or the amount that electricity costs will increase each year was determined based on historical
data from the Energy Information Administration39. Data for the national average cost per kWh from
1973 to 2007 was taken and plotted to show the trend over time.
Figure 14: Historical prices of the national average cost per kWh.
39 Average Retail Prices of Electricity, Energy Information Administration http://www.eia.doe.gov/emeu/mer/prices.html

72
We initially expected an exponential increase in energy cost, or a certain percentage per year,
however, the data clearly shows a linear increase of about $0.0018 per year. It is possible, and in fact
likely, that energy costs will increase more rapidly in the future, though, as we begin to run out of fossil
fuels. However, we will use the historical data as a way to predict future increases.
The data above is taken at a national level and the costs of electricity can vary at a local level,
based on the competition between companies, demand, and distribution fees, however, energy price
trends happen at a national level. We have addressed this by taking the starting value for our predicted
energy costs to be the present cost of electricity from one of Wesley United Methodist Church’s recent
bills. We then estimated that this current cost of $0.16 per kWh would increase at a rate of $0.0018
kWh per year as the national data predicts.
The last section in the economic spreadsheet requiring input is the “Economic Factors” section,
which calls for an estimation of the average inflation. This was determined by looking at historical data
for the Consumer Price Index (CPI)40. The CPI was at 10 in 1914, and ended up at 217 in 2008. The
percent change in the CPI from year to year was dramatically different, as shown below.
40 U.S. Department Of Labor, Bureau of Labor Statistics.

73
Figure 15: The year to year percent change in the Consumer Price Index.
Solving the traditional compound interest formula for the interest rate, we found that typical
inflation is 3.29% per year. A graph comparing the value of $10 by 1914 standards can be seen below,
comparing the actual inflation with this estimate of 3.29% per year.

74
Figure 16: The amount of money required to have the same value as $10 in 1914.
By comparing the two graphs, we see that although it is very difficult to predict what the CPI will
be in a given year, over long periods of time, such as the length of this solar panel investment, the
average rate of 3.29% is a good estimation.
By obtaining these parameters from historical data, measurements, or by professionals in the
business, we have given ourselves the tools necessary to analyze the feasibility of different solar panel
systems. The next section in this report, “Scenarios”, will use what we have outlined here to expand
upon the feasibility details of certain photovoltaic systems.

75
7. Scenarios
To correctly assess the feasibility and impact this project would have on the church a number of
practical scenarios were generated. These scenarios are analyzed using the economic spreadsheet in
the economic context presented in chapter six. In each scenario, the system size is varied. In order to
accommodate a larger system size, different installation procedures are necessary.
7.1 Assumptions and Selection of Solar Panels
The first objective in creating a list of practical scenarios was to determine the base
assumptions. The summation of these assumptions is then factored into each scenario to build a base by
which all scenarios can be assembled on. By taking this approach we limit the number of changing
variables to more correctly display the affect that each scenario has on the outcome of the entire
project. The assumptions listed below are values that extend those found in the Economic Context
section.
100% Down Payment:
After discussing with the financial representative at Wesley United Methodist Church we
discovered the church holds no debt. Thus, there is no reason to take out a loan to pay for the system.
The church representative assured us that if a system was purchased, it could be paid either through
gifts or through a trust fund.
Using Kyocera’s KC200GT Solar Panel:
One of the most critical choices in constructing a solar panel array is the choice of which solar
panel to use. To choose the most practical panel available a list of potential solar panels was constructed
and from that list the panel with the best credentials was taken. This list compounded several important
factors, the most important of which were: energy production, cost-per-watt, and panel size. Based on

76
these factors, the recommended panel was Kyocera’s KC200GT. This panel embodied high energy
production, 200 Watts, low cost-per-watt at $4.35, and relatively small footprint.
42 degree solar panel array tilt:
Another critical factor in determining how much energy is realized by the solar panel array is the
tilt of the panel relative to the sun. Throughout the year the sun’s position changes every month. For
solar panels, the optimum tilt is the one that is perpendicular to the incident angle of the sunlight.
However, for this system, the panels would not be mechanically tracking the sun, instead they are
manually set. The conclusion to this problem was to tilt the panels at 42 degrees, the exact latitude of
the Worcester area. This provides the best energy production for non moving arrays.
Sunny Boy Inverters:
For system sizes 25kW and less, the Sunny Boy line provides a very inexpensive inverter to
match the output of a chosen array size. As discussed in Chapter 5, the Sunny Boy products are effective
in price, efficiency, and reliability and fits quite nicely in the following scenario sizes. Using these
inverters, we estimated a total DC to AC conversion factor of 79.49%. This factor was a result of the
inverter efficiency as well as the efficiency of the AC and DC wiring and connections to the system.
Combining the efficiency of the solar panels and the efficiency of the DC to AC conversion, we calculated
an overall system efficiency of 11.92%.
7.2 Scenario 1: Small System Size:
First we investigated the smallest system available. This system, while humble in size, must still
be capable of providing a moderate percentage (10%-15%) of power to the church. However, due to the
church’s large energy usage, a small system might actually be considered large in other applications. For
the “Small System” scenario we chose to implement a 10kW system.

77
Characteristics:
One of the most notable advantages to constructing a small solar panel system is the fact that it
comes with a small capital cost. The initial system cost was calculated to be $49,000.00 after the
appropriate rebates are applied. This system consisted of forty seven solar panels ($40,898.00) and two
SB4000US DC-to-AC inverters ($5,370.00) with the installation accounting for the remaining cost. The
entire system spanned 126.42 square meters and required very few, if any, elevated platforms.
The greatest disadvantage of small solar array is the fact it provides such a small percentage of
the total power consumed by the church. This solar array will produce less than one-sixth of the energy
that the church is currently consuming and will take nineteen years to payback its initial cost. A system
with such a long payback period is also susceptible to being quickly outdated by new and improved
technology.
Impact:
Figure 17: 10kW System Energy Production

78
The chart above depicts the energy consumed by The Wesley United Methodist Church, seen in
blue, and the electricity produced by the 10kW solar array, seen in red. The total “net” usage is seen in
green which is the difference between the energy consumed and the energy produced.
Figure 18: 10kW System Cash Flow
Figure 2 depicts the total cash flow of the 10kW array. The figure describes the trend of savings
from the initial purchase in year one to the life expectency of a solar array, year 25.
7. 3 Scenario 2: Moderate System Size:
The second system we chose to investigate was a moderately-sized solar array. The goal of this
system was to provide more electricity than the smaller apparatus while not drastically increasing cost.
This system must be capable of providing approximately 20% of the churches electricity consumption.
For the “Moderate System” scenario we chose to implement a 15kW system.
Characteristics:
The advantages to a 15kW system are that it produces much more electricity than its smaller
system counter-part. In addition, the cost of constructing such a system is relatively inexpensive when

79
compared to the larger systems. To carry out such a system would require a total initial payment of
$72,750.00 after rebates, consist of 70 solar panels ($60,900.00), two SB6000US inverters ($7,450.00)
and installation costs. The system would be capable of producing slightly less than one quarter of the
energy consumption of the church.
With an increase in the number of solar panels on the roof of Wesley United Methodist Church,
it becomes apparent that space is limited. A majority of the seventy solar panels, occupying 188.28
square meters, will need to be raised on an elevated platform to avoid shadowing affects. In addition to
being space-limited, the “Moderate system” scenario will take nineteen years to pay off.
Impact:
Figure 19: 15kW System Energy Production
The chart above depicts the energy consumed by The Wesley United Methodist Church, seen in
blue, and the electricity produced by the 15kW solar array, seen in red. The total “net” usage is seen in
green which is the difference between the energy consumed and the energy produced.

80
Figure 20: 15kW System Cash Flow
Figure 4 depicts the total cash flow of the 15kW array. The figure describes the trend of savings
from the initial purchase in year one to the life expectency of a solar array, year 25.
7.4 Scenario 3: Maximum System Size:
The third scenario maximized the number of solar panels that could be placed on roof. The
energy produced by smaller systems is almost trivial compared to the total power consumption by the
church. Thus, the goal of this system is to provide the most electricity possible using the maximum roof
space available. For the “Maximum System” scenario we chose to implement a 25kW system.
Characteristics:
The greatest advantage of a large system is the large power output. A 25kW system is capable of
producing more than one-fourth the church’s electricity, and, at various times, almost one third the
total power consumption. Based on current costs, the maximum system size also has a payback period
of nineteen years, the same as the modernly sized system found in the previous section: nineteen years.
Although the system payback period is equivalent to the last three scenarios, this example produces a

81
much higher cash flow: averaging around $6,800 per year compared to $4,000 for the moderate system
and $2,800 for the smallest system.
The greatest disadvantage to this system is the cost to implement. Constructing a system of this
size takes an initial $120,250.00 of capital investment, consisting of 117 solar panels ($101,790.00),
three SB7000US inverters ($12,057.00) and installation costs. To fit 117 panels on the roof of the church
requires elevating almost all of the panels and placing several of them on the slated section of the roof.
Impact:
Figure 21: 25kW System Energy Production
The chart above depicts the energy consumed by The Wesley United Methodist Church, seen in
blue, and the electricity produced by the 25kW solar array, seen in red. The total “net” usage is seen in
green which is the difference between the energy consumed and the energy produced.

82
Figure 22: 25kW System Cash Flow
Figure 6 depicts the total cash flow of the 25kW array. The figure describes the trend of savings
from the initial purchase in year one to the life expectency of a solar array, year 25.
7.5 Scenario 4: Maximum System Size with Volunteer installation:
The final scenario produced assumed that the installation cost could be reduced by using
volunteers to provide most of the necessary labor. Labor is the most significant cost involved in installing
a solar panel array besides the cost of the system itself. The only requirement is that a licensed
electrician supervises the electrical work.
Characteristics:
As stated in the section above, a solar system of this magnitude is capable of producing more
than one fourth the energy consumption of the church. With volunteer work the system initial cost
drops drastically from $120,250.00 to $41,057.00. The return on investment drops from nineteen years
to only six! The disadvantage to implementing such a large system is the need for elevated platforms for

83
each panel. One hundred and seventeen solar panels require all the flat space on the roof including the
slated area.
Impact:
Figure 23: 25kW System Energy Production
The chart above depicts the energy consumed by The Wesley United Methodist Church, seen in
blue, and the electricity produced by the 25kW solar array, seen in red. The total “net” usage is seen in
green which is the difference between the energy consumed and the energy produced.

84
Figure 24: 25kW System Cash Flow with Volunteer Installation
Figure 8 depicts the total cash flow of the 25kW array with volunteer installation. The figure
describes the trend of savings from the initial purchase in year one to the life expectency of a solar
array, year 25.
7.6 Assessment:
Revisiting the scenarios above, cost of installation is the single most important factor in whether
a system will be feasible. Currently, the cost-per-watt of solar panels is generally fixed at $4-$5. This
allows minor room to reduce the cost. However, because installation is not necessarily a fixed cost and
most of the work can be done by knowledgeable volunteers it is possible to keep this cost much lower.
Another noticeable result of analyzing these scenarios is that the systems of varying sizes all
have a break-even point of approximately nineteen years. The main reason for this phenomenon is the
fact that larger arrays, despite their greater initial investment, recover savings much quicker because of
their greater electricity production. The 25kW array may generate $164,997.40 in the course of 25 years
compared to a smaller, 10kW array which may only produce $65,998.96 of revenue. This observation

85
displays the fact that a larger solar array is much more beneficial in the long term; however a small one
is financially easier in the short term.
7.7 Sensitivity Analysis
Although we have determined that a largest array is the optimal scenario for the production of
electricity the nine-teen year break-even point is near the system life expectancy of 20-25 years.
However the cost of solar cells is constantly decreasing. Based on discussions with solar manufacturers
and installers, it is expected that costs for solar panels will fall quickly in the next three to five years and
the payback period will thus decrease rapidly. To illustrate the effect influence lower costs on the solar
market we decided to create a sensitivity analysis. This analysis below offers a fifth scenario that
projects possible costs and efficiencies of solar panels in five years.
The following is a scenario assumes that in the future, technology will reduce the cost-per-watt
of a solar panel from $4.30 to $2.00 and increase the solar cell efficiency from 15% to 20%. The result is
a dramatic drop in the amount of time it takes to break-even. The period of time necessary to break-
even drops from nineteen years to only nine and the number of panels required to generate the same
amount of electricity is reduced from 117 panels to 88. The reduction in the number of panels also
reduces the need to install solar panels in sub-optimal locations.

86
Figure 25: Futuristic 25kW System Cash Flow
Figure 9 depicts the total cash flow of a 25kW array purchased in five years. The figure describes
the trend of savings from the initial purchase in year one to the life expectency of a solar array, year 25.
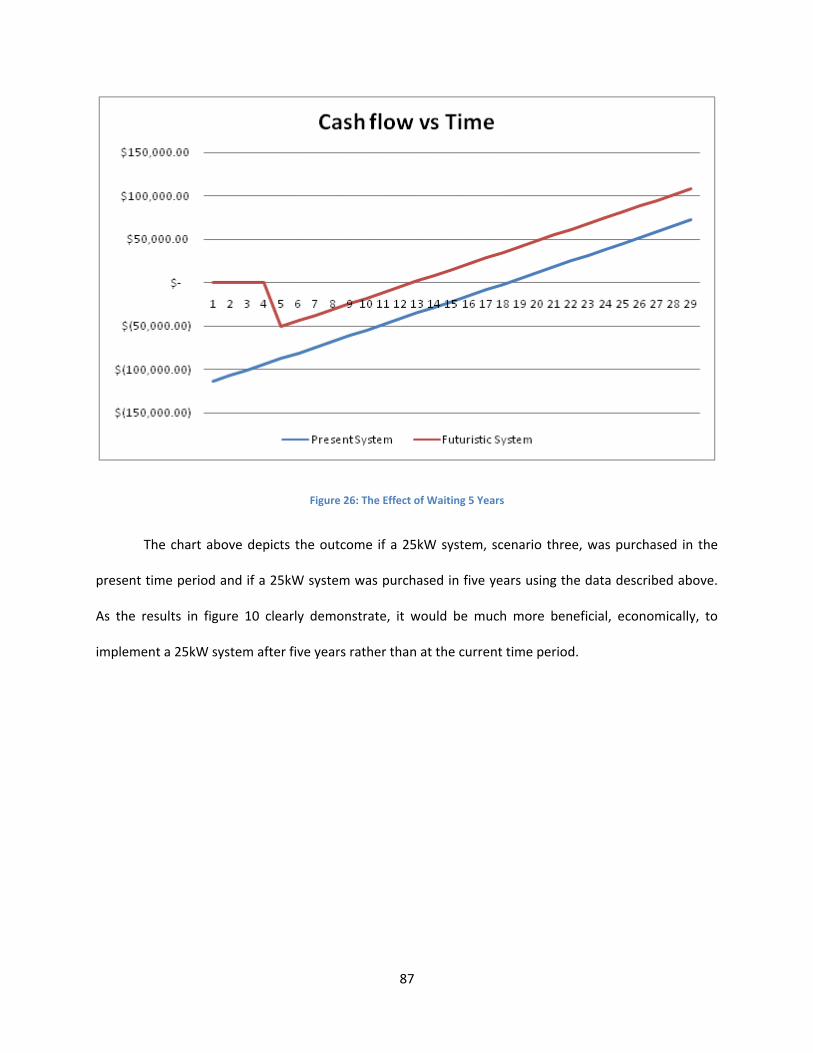
87
Figure 26: The Effect of Waiting 5 Years
The chart above depicts the outcome if a 25kW system, scenario three, was purchased in the
present time period and if a 25kW system was purchased in five years using the data described above.
As the results in figure 10 clearly demonstrate, it would be much more beneficial, economically, to
implement a 25kW system after five years rather than at the current time period.

88
8. Social and Environmental Impact
The significance of solar panel systems go far beyond financial factors. Alternative forms of
energy are important to the sustainability of our planet. This section identifies the social and
environmental impacts that a solar panel installation would have on the church and what we have done
to disseminate information about solar panel installations.
8.1 Effects on Carbon Footprint
A Carbon footprint is a measurement of the impact a person or a building has on the
environment. It is usually represented as the number of tons of carbon dioxide released into the
atmosphere by things such as power plants, cars, or burning heating oil. Based on information available
from the Global Footprint Network, current levels of emissions exceed the capacity that the earth is able
to absorb. This rate has been sharply increasing since the 1960s.41 Finding solutions to the problem of
increased emissions is critical to environmental sustainability. However, offsetting the world’s carbon
emissions by planting trees isn’t an efficient solution to the problem of increased emissions. A better
solution is reducing the emissions themselves.
Reduction of emissions requires cutting back the use of fossil fuels. This means driving less,
using cars that are more efficient, and meeting high standards for emissions testing. It also means using
less electricity, and when possible looking for ‘green’ alternatives. Sources of environmentally friendly
electricity include solar PV, wind energy, and hydroelectric; although hydroelectric plants significantly
disrupt the river upon which they are built.
The church’s carbon footprint is primarily made up of the electricity it consumes, and the
natural gas used for heating. Based on the formulas used by the Global Footprint Network the annual
41 Global Footprint Network. Globalfootprintnetwork.com. [Online] [Cited: December 2, 2008.] http://www.footprintnetwork.org/en/index.php/GFN/page/carbon_footprint/.

89
electricity consumption creates 59 tons of carbon dioxide.42 The total amount of carbon dioxide created
by or on behalf of the church is at least 67 tons of CO2 emissions per year.2 If the church were to install
a 25kW solar array, they would significantly reduce the their annual emissions to 39 tons of CO2, a thirty
three percent reduction.
8.2 Environmental Stewardship
Wesley United Methodist Church commissioned this study of green technology as an expression
of its commitment towards “environmental stewardship.” Many of the individuals who participate in the
church feel that it is their responsibility to the community to contribute to the adoption of clean energy.
For that reason, the implementation of a solar array would not only reduce green house emissions, but
also spread awareness to the wider community and inspire other community members to follow suit. As
stewards of the Earth, a church could send a powerful message to the community by acting on these
values in their place of worship.
Green stewardship is rapidly becoming a popular topic in the Christian community. There is a
new bible that has been printed called the “Green Bible”. It highlights eco-friendly passages in green
and has an index in the back where one can look up “green” passages. It is said that the “Green Bible
sets out an urgent agenda for the Christian community.”43 One particularly relevant passage from
Leviticus is as follows, “You shall not strip your vineyard bare, or gather the fallen grapes of your
vineyard; you shall leave them for the poor and the alien: I am the Lord your God”. Another moving
passage in support of green stewardship is from Psalm 24, “The earth is the Lord’s and everything in it,
the world, and all who live in it.”
42 Global Footprint Network. Globalfootprintnetwork.com. [Online] http://www.carbonfootprint.com/carbonfootprint.html 43 Harper Collins Publishers. (2009). The Green Bible. Retrieved 3/1, 2009 from http://greenletterbible.com/

90
Green stewardship is a movement within the church that is rapidly gaining momentum as more
and more Christians become aware of the threat humans pose to the planet. As the earth’s destruction
continues, many are starting to feel it is part of their calling as followers of God to help.
The city of Worcester has many churches of many faiths each concerned about the cost of rising
electricity as well as the benefits of helping the environment. If the Wesley United Methodist Church
were to decide to implement a solar system, it would be recognized as one of the first churches in the
area to do so and demonstrate its leadership as an environmental steward in the community. If the
implementation of green energy proves to be beneficial the Wesley United Methodist Church will
become an example to those in Worcester and New England.
8.3 Informational Brochure
An informational brochure has been created to spread information to the church about the
benefits of solar panel installations. Our correspondence with a Methodist Church from Maine showed
us that the spread of information about a solar panel project can greatly reduce opposition and build
support for this costly expenditure. The brochure captures the essence of our results. It has financial
information, including a graph about the amount of energy produced with a large scale system and a
graph showing how the payback period is directly related to the system cost per watt. The brochure
also includes a couple of passages from the bible that support the concept of green stewardship and
accompanying pictures of God’s magnificent creation. The brochure can be found in Appendix M:
Informational Brochure.
8.4 Survey
After our final presentation, given on March 1, 2009, we handed out a brief survey to those who
were in attendance (Appendix N). The audience consisted primarily but not exclusively of members of
the Board of Trustees and Finance Committee at Wesley. There were only fourteen people in

91
attendance, so the survey is of little statistical value; however it has helped us to realize some of the
general perceptions held by the congregation.
All fourteen people responded they felt that investment in alternative energy is important,
however their reasons for this answer varied. Some cited green stewardship as their primary reason,
while others pointed to the fact that there is a finite supply of fossil fuels. Still others felt that
alternative energy was important so that the country could become independent of foreign oil. Most
mentioned that it was important to be environmentally conscious and many responses included a
combination of these reasons.
In response to the second question, which asked about what the public’s perception of a solar
panel installation on Wesley United Methodist Church would be, the answers were again unanimous.
All responses stated that the public’s view of such an installation would be positive. One responder felt
that it would have limited affect, and only be slightly positive, while many responded that this would be
“very positive”, “forward thinking”, and “green.”
The last two questions had a wider range of responses than the first two. When asked whether
or not a solar panel installation should be pursued even if there was no economic gain, most said that it
should be pursued for environmental reasons, however, there were a few responses that said that the
only factor that was important to them was the financial savings.
Finally, on the last question, which asked whether or not Wesley United Methodist Church
should pursue a solar installation now, in the future, or not at all, there was the widest disparity of
answers. A number of people felt that the church should wait for five years and then reevaluate the
situation, while others felt that church should do more research about it now. Some people felt that the
church should absolutely pursue it now, while there was one response that said it should not be pursued
at all.

92
While everyone in attendance of our final presentation felt that alternative energy was
important, it can be seen by looking at the remainder of the questions that this belief was weighted
differently by each person. Looking into the future, the congregation will have a lot to debate as they
try to decide what to do with the results of this project.
93
9. Conclusions and Recommendations
The benefits of solar panel installations are numerous, ranging from green stewardship to
reducing the church’s carbon footprint, and from building a strong public image for the church to
reducing the church’s monthly electricity bills.
The feasibility of such a system is not determined by a financial analysis alone. Based on current prices,
a solar panel system installed at Wesley United Methodist church would have a nine-teen year payback
period.
We recommend that the church strongly weigh the positive impacts of solar panels alongside
the economic feasibility of installation. With the present conditions, it is unlikely that a solar panel
installation will lose money over the lifetime of the system; however, it requires a large capital
investment and has a slow payback. The church should monitor future the economic conditions using
the “Simplified Economics Spreadsheet for Wesley United Methodist Church” that we have provided to
get an estimate of economic feasibility of a solar power system.
When it is determined that the benefits from a solar panel installation outweigh its drawbacks,
such as when the cost per watt drops below a threshold price, the church should follow the procedure
outlined below:
1. Form a committee of people who are interested in seeing this project carried forward.
2. Have the committee hold meetings/focus groups with interested members of the congregation
to educate the congregation about solar panels and answer any concerns. The committee can
use our presentation, brochure, and any of the other materials in this report.
3. Have the committee members contact three to five installers and go through the bidding
process as we have outlined.

94
4. Use the graph “Simplified Economics Spreadsheet for Wesley United Methodist Church” with
current data to determine the financial feasibility of this system.
After estimates have been received, the selection process can begin. After choosing an installer, the
rest of the process, such as acquiring the Commonwealth Solar rebate and fulfilling permit obligations
will be handed by the chosen installer. Hopefully, as solar panel technology continues to drop in price,
the church will be able to reap the benefits of clean, renewable energy.

95
Appendix A: Solar Panel Tilt Analysis Analysis of the installation orientation of solar panels is crucial to getting the highest power
output from the solar panels. Solar panels receive the most energy from the sun when the surface of
the solar panel is perpendicular to the sun’s rays.
Some solar panels track the position of the sun. The surface of these panels is always
perpendicular to the sun, giving tracking panels the highest output of any mounting system. However,
the increase in efficiency does not come without a cost. Tracking mounting systems are significantly
more expensive than other mounting options and are also a lot more likely to break.
In some cases, solar panels are mounted directly on the roof. However, this is also a sub-
optimal solution because the sun will never be perpendicular to the solar panel. In Worcester, MA, the
sun is at an angle of 80° above the horizon at noon during the summer and only 30° above the horizon at
noon during the winter. 44 It is typically recommended to mount solar panels with a tilt angle that is
equal to the latitude for the site location.45 Another approach is to use a solar panel mounting structure
that can be changed twice a year, realigning the panel during the winter and the summer.
It is essential to predict how much energy will be generated from different panel orientations in
order to compare these different solutions and predict the overall energy output from the system. To
do this, one must be able to accurately predict the power from the solar panel at any time.
44 GAISMA. [Online] www.gaisma.com. 45 Lenardic, Denis. Solar radiation estimation and site analysis. Atomstromfreie Website. [Online] Greenpeace Energy, September 13, 2008. http://www.pvresources.com/en/location.php.

96
The tilt angle is represented above by Θtilt, which is the angle between the solar panel and the
ground. This angle is also the angle between the vertical y-axis and a vector normal to the surface of the
solar panel. It is shown in both places in the diagram above. The angle between the y-axis and a vector
representing the sun’s rays coming onto the surface of the solar panel is represented by Θsun.
Subtracting these two values yields the value for
Looking at this as a two dimensional problem the amount of energy from the sun that hits the
solar panel at any given moment is related to the size of the solar panel times the cosine of the incident
angle between the solar panel and the sun’s rays. The incidental power, or actual power, can be
determined based on the amount of power that would land on the surface of the solar panel using the
equation below.
Since the sun moves not only vertically in the sky but also across the sky from east to west, this
concept must be extended to three dimensions in order to get the instantaneous power throughout the
day.
To determine what the optimal tilt angle for solar panel installation is, a group from Taiwan
created a simulation that used a Genetic Algorithm (23). They simulated the amount of power
Θtilt
Θtilt Θinc
Θsun

97
generated by the solar panel at five minute intervals using historic weather data for five years. They
could then estimate the amount of energy that would have been generated by the solar panels over that
time period at a given tilt angle.
To find the optimal tilt angle, they created a pool of genes (binary strings) that represented the
tilt angle. With each iteration of the program, a selection process is applied, selecting only the best
performing solution. The genes then reproduce. Some are direct copies of the previous generation,
other experience a mutation, where one bit changes between 0 and 1. Still others experience crossing
over, where a substring from one gene is switched with a substring of another. With each generation,
the program gets closer to finding an optimal solution.
A similar experiment could be done for Worcester, MA, however the difference in power output
between this new solution and the usual recommendation of using the Latitude as your angle is likely to
be insignificant, as was the case in this experiment.

98
Appendix B: Recommended Bidding Process The first step in the bidding process is defining the system the church wants. This needs to
include all the specific details including the amount of power the church hopes to generate, the
preferred brands of panels, and the DC/AC inverter. This is also the time to determine the areas on the
roof which are suitable for mounting panels. Much of the decision should be made by this point as to
what the church is willing to install and pay for in order to make providing information to potential
contractors simpler.
The second step is to gather a list of local contractors that are known to install similar systems in
the area. This is as simple as contacting the MTC for a list of installers in the Worcester area or using a
phonebook’s yellow pages. It is important to get a list of installers and to determine which of them are
interested in putting in a bid for an installation of this size. After a simple phone conversation with each
of them, the church should have a list of contractors that are interested in bidding on their project.
These first two steps are mostly covered by this report. The report has a recommended system
and location on the roof already selected to meet the needs of the church. The report also includes a list
of potential installers in the Worcester area. To complete these two steps, the church only needs to
agree to the recommended system and call the installers to make a list of those that are interested.
The third step in the process is to draft formal letters requesting bids. These letters need to
include very detailed information to simplify the process. First of all, there need to be timetables
involved. They should include a deadline for the church to receive the quotes from installers, as well as
preferred beginning and ending dates for the installation. It’s also important to give all the details
determined in step one of the process. It is best to give as much information as possible so that the
church does not need to field calls from contractors seeking more information.

99
Along with this letter, the church should request a cost breakdown. This should detail what
portion of the cost is for labor, panels, mounting equipment, etc. Having costs broken down in this way
will help determine which installer is the best choice and it helps clarify their overall cost.
Step four is to receive the quotes from the contractors. Generally speaking, any quotes received
after the given deadline should be disregarded. If the contractor doesn’t meet the requested deadline
for the quote, then they probably can’t be counted on to be reliable when it comes to the installation.
Simply put, a company that can’t meet the deadline for a quote is probably not professional enough for
a system of this size.
The fifth step is to begin the down selecting process. In this part, the church needs to generate
several factors that are the most important to them. Generally, cost is one of these. Other important
factors to consider are the type and quality of the panels and mounting hardware, expected completion
date, or use of local labor. Once the church establishes their important criteria, they can begin to rank
the different installers. It is important to keep in mind the two factors of cost and quality of materials
and find the best compromise between the two.
The sixth and final step is to send letters to all the contractors who submitted quotes. Inform
the one the church chose and clarify a payment schedule. It’s also important to inform the contractors
that didn’t win and inform them as to why they were not selected.
These are the steps involved in requesting a bit from a contractor and are designed to
streamline the process for both the contractor and the customer. Following these steps should put the
church in the best position to select the installer that they determine to have the greatest value.

100
Appendix C: Site Dimensions

101
Appendix D: Morning Shade

102
Appendix E: Afternoon Shade

103
Appendix F: Shading with Raised Panels

104
Appendix G: Meetings and Correspondence
Meeting with Tom Sikina on December 5, 2008:
After introducing ourselves and our project, the first topic of discussion was regarding
irradiation data. Mr. Sikina made the point that different sites and organizations that offer irradiation
data may not take the same factors into account. For example, some sources do not consider cloud
cover. The inclusion or exclusion of such factors in a model could have substantial impacts on a final
result.
Next, we discussed third party financing. Mr. Sikina told us to think of having a third party
finance a solar panel system analogous buying a bond. The third party would own the system for a given
period of time (25 years, for example) and the buyer would get electricity at a discounted rate. After the
contract is over, the buyer usually has the option to buy the solar panel system from the third party for a
small price.
Another issue that was brought up was the level of confidence in our model. This level of
confidence refers to how sure we are that our model would be an accurate predictor of feasibility. Mr.
Sikina urged us to compare our model to similar projects that have been found to be feasible, and run
them through our model.
After showing Mr. Sikina our economic model, he had a number of comments. One was that we
pay particular consideration to the percentage increase in electricity costs per year. Overall, he said that
our current estimates were fairly conservative.
The next topic of discussion concerned the accuracy of the ratings that solar panel companies
give their panels. On Mr. Sikina’s installation, the solar panels only operate at 85% of the rating on their
data sheet. However, Mr. Sinkina knows of another installation using a different brand of panels that
operate at 5% over their specifications. It was suggested that the accuracy of solar panel production

105
data should verified before making a final choice. Furthermore, Mr. Sikina suggested that WPI may be
able to act as a third party that rates solar panels against their factory specifications.
On the topic of installing solar panels, we discussed the feasibility of changing the angle of solar
panels throughout the year to produce more energy. One of the simplest and most effective methods
would be a two-pin system, where the panels can be locked into one of two different tilts. At different
time during the year, the tilts could be manually adjusted. Mr. Sikina encouraged that we calculate the
net energy change from employing such a system.
Expanding on the topic of installation and optimum panel placement, we discussed the idea of
creating a small scale model to test different panel placements and orientations. A model may give
insight to how spacing the panels affect net energy production as well as how shadows are cast in a
more complex system.
The final topic of the discussion was about the bid process for finding an installer. Mr. Sikina
outlined the following steps:
1. Find the system you want to buy
2. Select the bidders
3. Write a bid proposal (RFQ letter) and send to bidders
4. Receive quotes
5. Prepare a justification of the bid (known as a down select) based on your lists of criteria
6. Award the winning bidder
Mr. Sikina suggested that since we may not be involved in the church’s actual installation process
that we give the church a recommended bidding process to follow if they decide to go forward with
installing a solar panel system.
106
Meeting with York-Ogunquit United Methodist Church
Research for similar case studies discovered that the York-Ogunquit United Methodist Church in
York, Maine, installed a system of solar panels approximately 6 months before our project began. A
meeting was set up with this church to find specific information, since both churches are in a similar
region, less than 2 hours apart. The meeting began with explaining the project and the specific situation
of the Wesley United Methodist Church to Rev. Shook. After detailing the project goals and the needs of
the church, Rev. Shook began to share all the information he had available on the solar installation for
the his church. On this particular day, it was snowing so taking pictures of the system was difficult.
The system the church decided on is rated for 7,700 W, however the maximum output that has
been achieved to date has peaked at 6000 W. The system consists of 42 panels that are mounted
directly to the raised seams of the steel roof. The installation was completed by Solar Market of
Arundel, Maine, in two days for a total system cost of $58,000. Of this overall cost, $11,220 was the
cost of 2 days of installation. In this case, the installation cost is about 20% of the total, which led us to
reevaluate our previous information stating that installation accounted for nearly half of the total cost.
This system produces enough extra electricity in the summer months to provide the church with
renewable energy credits with Central Maine Power. These credits cover about half of the winter
electricity use. This means that the church only needs to pay for using electricity for about 4 months a
year. The other bills are only to cover various other charges, and are usually around 25 dollars. In this
way, the church is not only reducing its environmental impact, but it is saving a considerable amount of
money in its monthly operating expenses.
The money for the system came from a trust fund set up by the church after selling one of their
two buildings several years ago. In addition, the proponents of the system held information sessions for
about a year to help the congregation understand the options and benefits of the investment. By
holding these sessions, most of the questions people had were answered; leaving very little opposition

107
by the time a decision was made. Rev. Shook said that the members of the church are glad to be better
environmental stewards that set the example for their community just as much as they enjoy the
economic benefits.
Correspondence with the Massachusetts Technology Collaborative:
In order to understand the nature and stipulations of the rebate offered through
Commonwealth Solar, we contacted a member of the Massachusetts Technology Collaborative (MTC),
the parent organization of Commonwealth solar. Through email conversations, we learned two
important factors in regards to the rebate:
1. The church was not considered a public building for the sake of the rebate. This meant it did not
qualify for the extra $1.00 per watt entitled to public buildings.
2. Installation had to be done though an installer certified through Commonwealth Solar. This
meant that a volunteer installation could not be done without a special agreement through the
installer chosen to do the installation.
Correspondence with solar panel installers:
In order to get an estimate of cost breakdowns for the overall price per watt figure given by
solar panel installers, we sent an email to seven major installers in the area asking them for estimates.
Of the seven companies asked, three responded, and the results can be seen below:
Company 1: Solar Panel Components: 75% Mounting Materials 10% Installation Labor Costs 15% Company 2: Solar panels: 55% Inverter, electrical wiring, disconnects: 15% Mounting hardware: 15%

108
Installation: 13% Permits: 2% Company 3: Solar Modules: 60% Racking and Inverters: 20% Labor: 20%
109
Appendix H: Solar panel installers Below is a list of recommended solar panel installers. These installers have been chosen on their overall
system cost per watt, the size of the systems they have previously installed, and recommendations from
our sources.
New England Breeze, LLC President: Mark Durrenberger Phone: 978-212-2665 Email: [email protected] Web: www.newenglandbreeze.com Solar Works, Inc. Regional Project Director: Terry Dupuis, P.E. Phone: 508-360-4907 Email: [email protected] Web: www.solarwaorksinc.com Berkshire Photovoltaic Services Phone: 413-743-0152 Email: [email protected] Web: http://www.bpvs.com/ Borrego Solar Systems, Inc. Phone: 978-513-2600 Web: www.borregosolar.com/ Nexamp, Inc. Phone: 978-688-2700 Email: [email protected] Web: www.nexamp.com SolarFlair, Inc. Phone: 508-293-4293 Email: [email protected] Web: www.solarflair.com SolarWrights, Inc. Phone: 401-396-9901 Email: [email protected] Web: www.solarwrights.com/

110
Appendix I: Future Solar Panel Costs It is the widely held expectation that solar panel costs will continue to fall over the coming
years, naturally increasing the likelihood that solar panel projects will become feasible. Many cite
economics of scale and the experience of other industries: as the demand rises and the supply increases
to meet it, larger, more efficient factories are set up. It is difficult to predict with much accuracy what
the cost of solar panels will be in the future, but many companies and researchers in field of solar panel
pricing expect that the price of solar panels will come down.
Nanosolar, a startup company that has opened a manufacturing facility in Silicon Valley, is
claiming that they have found a way to reduce the cost of solar panel production by 80% by “printing”
thin film solar panels onto Aluminum and saving significant amounts of silicon. Martin Roscheisen, CEO
of Nanosolar, says that they will be the first company to profitably sell solar panels for under $1.00 per
watt, and that “with a $1-per-watt panel, it is possible to build $2-per-watt systems.”46 These are
certainly bold, and if they prove to be true, would make solar panel systems instantly feasible. The
company has orders for their first 18 months of production.
Another small company, 1366 Technologies from Massachusetts, says they have found a
breakthrough technology that makes there solar panels 27% more efficient. This will allow them to start
selling solar panels soon for $1.30 per watt, and they expect that by 2012 they will also be selling solar
panels for $1.00 per watt.47
In a study done by Travis Bradford, president of the Prometheus Institute for Sustainable
Development in Cambridge, MA, even with the traditional production methods, solar panel costs could
fall by as much as 1/3rd over the next couple years. His research shows that solar panel demand is
46 http://www.nytimes.com/2007/12/18/technology/18solar.html?ex=1355634000&en=091b06819623f9d0&ei=5088&partner=rssnyt&emc=rss 47 http://dvice.com/archives/2008/03/solar_cell_effi.php

111
increasing by 50% per annum, but that the supply will outpace it at 80% growth per year. “This should
be putting some downward pressure on prices,” he says.48
There are many companies working hard to bring down the cost of solar energy, and continue a
trend that has gone on for a long time. Some of the first solar panels cost nearly $1800 per watt, while
today people are striving to break the barrier of $1.00 per watt. Below is a graph showing the cost of
solar panel installations in Japan since 1993.
Figure 27: Graph showing the falling cost of PV installations in Japan. 49
Though the graph is in Yen per Watt, the trend is a worldwide trend. The cost of solar panel
systems is falling. Though it is difficult to predict exactly when solar panels will reach these predicted
levels, one would expect that it will not be a long wait.
48 http://features.csmonitor.com/innovation/2008/06/05/brighter-future-for-solar-panels-silicon-shortage-eases/ 49 http://www.solarbuzz.com/statsCosts.htm

112
Appendix J: Scale Model
In order to create a better visual representation of the roof space and the shading throughout
the day, a model was constructed. Along with this model was an arced piece of thin copper tubing with
a light socket mounted to it. The base of the copper was hinged so that a combination of moving the arc
up and down along with sliding the light from side to side approximated the sun at different times of day
and the different times of the year.
In a dark room, the 67-watt bulb provided enough light to get a good imitation of the shade. To
further the experiment, a small solar cell was connected to a small LED and could be moved around to
demonstrate how well light was absorbed at different locations on the roof.
An added benefit of the model was its use in presentation to the church. By using the model as
a presentation aid, potential panel locations the members of the church had a better idea of what would
happen if they were to have the panels installed. See pictures of the model on the next page.

113

114
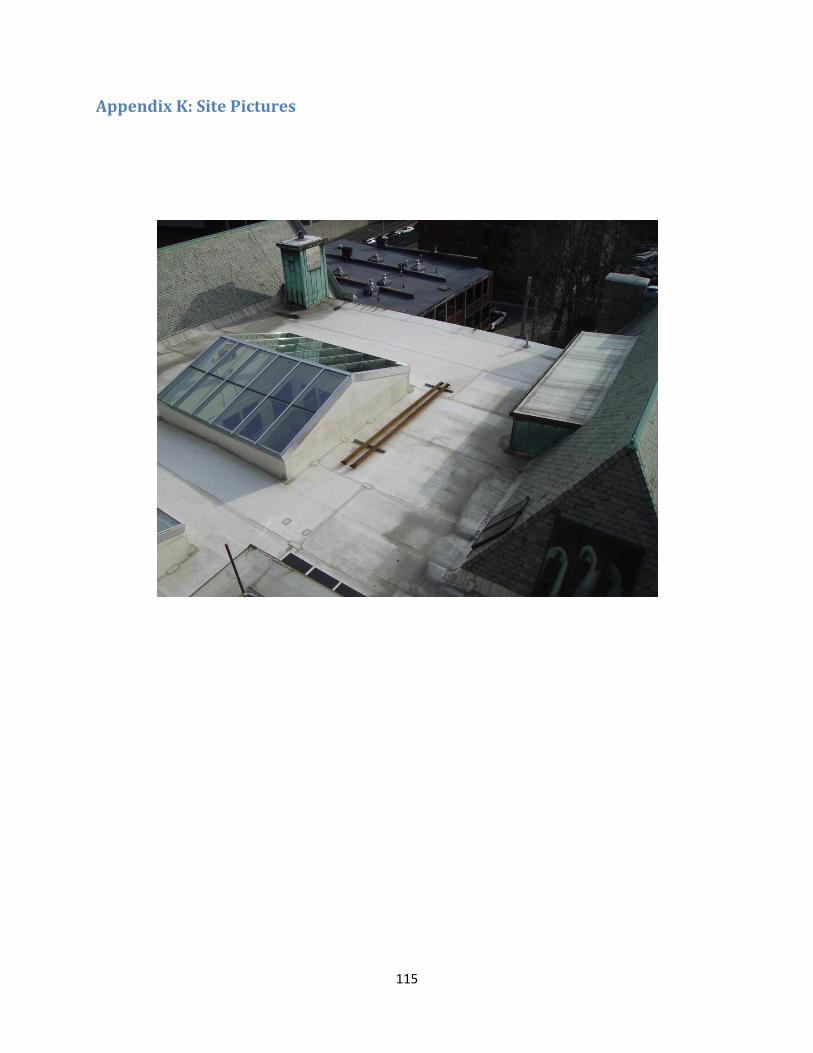
115
Appendix K: Site Pictures

116

117

118
Appendix L: Simplified Economic Spreadsheet In order for the church to re-evaluate investing in a photovoltaic system in the future, we
created a simplified version of our economic spreadsheet using assumptions from our project. The
three primary variables in this spreadsheet have been reduced to the overall cost per watt of the
system, the proposed system size, and whether or not the solar panel components are manufactured in
Massachusetts. The overall cost per watt would be given as a quote from an installer. If the solar panels
are manufactured in Massachusetts, the rebate offered by Commonwealth Solar increases.
The assumptions portion of the spreadsheet lists the various systems, economic, and rebate
assumptions that were made in order to calculate the overall feasibility of the system. These
assumptions can also be changed to see what different assumptions have on the overall feasibility. One
factor of particular interest is the income generated by renewable energy credits. Because at the time
of the report the future of such credits was uncertain, this number may change.
The calculations section of the spreadsheet lists the raw system cost, the amount realized from
the Commonwealth Solar rebate, the system cost after rebates are applied, the amount of energy the
system would produce in a given year, how much savings this energy generation would translate to, and
the number of years before this investment breaks even.
The other pages of the spreadsheet are used as tools to help calculate the energy that the
system would generate, and the value of the system as an investment. Below is a sample of the
spreadsheet with $8.00 per watt and a system size of 20kW.

119
Solar Feasibility Analysis for the Wesley United Methodist Church
Entry Section:
Overall System Cost Per Watt: $8.00 dollars / Watt
System Size: 20000 Watts
Solar Panels Manufactured in Massachusetts: NO YES / NO
Assumptions:
System Assumptions:
System Life Expectancy: 25 years
Yearly Performance Degradation: 0.50% %
Efficiency of Solar Panels: 15.00% %
DC to AC derating factor: 79.49% %
Economic Assumptions:
REC Revenue per Watt: $0.00 dollars
REC Annual Cost Adjuster: 4.00% %
Yearly Energy Consumption: 102000 kWh
Cost of Electricity: $0.16 dollars
Electricity Cost Inflation: 0.60% %
Overall Inflation: 3.29% %
MTC Assumptions:
System Size: 0 to 25 kW 25 to 100 kW
Base Incentive: $3.25 $3.00
MA Component Adder: $0.25 $0.25
Incremental Capacity: 20000 0
Calculations:
Raw System Cost: $160,000.00 dollars
Rebate Amount: $65,000.00 dollars
System Cost: $95,000.00 dollars
Yearly Energy Generation: 27248 kWh
First Year Energy Production Value: $4,359.68 dollars
Break Even Year: 22 years

120
Appendix M: Informational Brochure To create a simple way to showcase the work we have done and our results, we created a
brochure, which can be seen below:

121

122

123
Appendix N: Survey Below is a listing of the questions that made up the survey given to our presentation audience:
Do you believe that investing in renewable energy is important? If so, Why?
What kind of image do you think a solar panel installation would give Wesley United Methodist Church?
Would you install a solar panel system if there was no economic incentive to do so? In other words, if
installing a solar panel system would have only have environmental benefits, would you still consider
installing one?
Do you know of any specific solar panel installations in the area, either residential or commercial?
Do you think that a solar panel installation on the Wesley United Methodist Church is something that
should be perused now, sometime in the future, or not at all?
What do you feel was the overall quality of this presentation?

124
Works Cited
Aldous, S. How Solar Cells Work. Retrieved October, 2008, from http://www.howstuffworks.com/solar-
cell.htm
Ben Arnoldy. (2008). Brighter Future for Solar Panels: Silicon Shortage Eases. Retrieved 1/22, 2009, from
http://features.csmonitor.com/innovation/2008/06/05/brighter-future-for-solar-panels-silicon-
shortage-eases/
CalFinder. What is net metering? Retrieved September, 2008, from
http://solar.calfinder.com/blog/solar-information/what-is-net-metering/
Charlie White. (2008). Solar Cell Efficiency Reaches Breakthrough Cost per Watt. Retrieved 1/14, 2009,
from http://dvice.com/archives/2008/03/solar_cell_effi.php
Code of Massachusetts Regulations. Massachusetts Net Metering Laws.
http://www.dsireusa.org/documents/Incentives/MA01R.htm
Commonwealth Solar. Non-residential Rebate Calculator.
http://www.masstech.org/SOLAR/Attachment%20A2-
Non%20Residential%20Solar%20Rebate%20Calculator%20Only-070208.xls.
Commonwealth Solar. Overview. Retrieved September, 2008, from http://www.masstech.org/SOLAR/
Commonwealth Solar. (2008). Solar Photovoltaic Rebates: Program Manual. Retrieved September, 2008,
from
http://www.masstech.org/SOLAR/Commonwealth%20Solar%20Program%20Handbook_v2_070108.
Cooler Planet. (2008). How Photovoltaic Cells Work. Retrieved October, 2008, from
http://solar.coolerplanet.com/Content/Photovoltaic.aspx
Denis Lenardic. (2009). Photovoltaic Applications and Technologies. Retrieved 10/20, 2008, from
www.pvresources.com
DSIRE. Massachusetts Incentives for Renewable Energy: Net Metering. Retrieved November, 2008, from
http://www.dsireusa.org/library/includes/incentive2.cfm?Incentive_Code=MA01R&State=MA&Curr
entPageID=1
DSIRE. Massachusetts Incentives for Renewable Energy. Retrieved November, 2008, from
http://www.dsireusa.org/documents/Incentives/MA01R.htm
Energy Information Administration. (2009). Average Retail Prices of Electricity.
http://www.eia.doe.gov/emeu/mer/prices.html

125
Evergreen Solar, Inc. (2008). Our String Ribbon Wafers - Genius in its Simplicity. Retrieved October, 2008,
from http://www.evergreensolar.com/app/en/technology/item/48
Evergreen Solar, Inc. (2008). String Ribbon. Retrieved October, 2008, from
http://evergreensolar.com/images/techology/stringribbon/diagram_string_ribbon_en.jpg
Foley, B., Forbes, T., Jensen, H., & Young, A. (2006). Holy Name High School Wind Turbine Feasibility
Study. WPI Interlibrary Database: Worcester Polytechnic Institute.
Global Footprint Network. (2008). Carbon Footprint. Retrieved 1/20, 2009, from
http://www.footprintnetwork.org/en/index.php/GFN/page/carbon_footprint/
Harper Collins Publishers. (2009). The Green Bible. Retrieved 3/1, 2009 from
http://greenletterbible.com/
Heliotronics. Heliotronics Data Acquisition Systems. http://www.heliotronics.com
John Markoff. (2007). The New York Times. Retrieved 1/23, 2008, from
http://www.nytimes.com/2007/12/18/technology/18solar.html?ex=1355634000&en=091b0681962
3f9d0&ei=5088&partner=rssnyt&emc=rss
Lenardic, D. Solar Radiation Estimation and Site Analysis. Retrieved October 15, 2008, from
http://www.pvresources.com/en/location.php
Lund, H., Nilson, R., Solamatova, D. & Skare, E. The History Highlight of Solar Cells. Retrieved October,
2008, from http://org.ntnu.no/solarcells/pages/history.php
Massachusetts Technology Collaborative. Commonwealth Solar Rebate Program. Retrieved 1/15, 2009,
from
http://www.masstech.org/SOLAR/CS_AttachmentDMinimumTechnicalRequirements_v3_010109.pd
f
Massachusetts Technology Collaborative. Information on Installers and Costs. Retrieved 1/15, 2009,
from http://www.masstech.org/SOLAR/CS%20Installer-Cost-
Location%20Data%20for%20Website%20as%20of%2001-31-09.xls
Matti Tukiainen. GAISMA. Retrieved 10/5, 2008, from www.gaisma.com
National Renewable Energy Laboratory. U.S. Solar Radiation Resource Maps. Retrieved 9/25, 2008, from
http://rredc.nrel.gov/solar/old_data/nsrdb/redbook/atlas/
PowerFilm, Inc. (2008). Thin Film. Retrieved October, 2008, from
http://www.powerfilmsolar.com/technology/index.html
Quitana, M. A., King, D. L., & McMahon, T.J. and Osterwald, C.R. Commonly Observed Degradation in
Field-Aged Photovoltaic Modules No. 2008)

126
Radiochemistry Society. Periodic table of Elements: Silicon. Retrieved October, 2008, from
http://www.radiochemistry.org/periodictable/elements/14.html
REUK. Renewable Energy UK. Retrieved October, 2008, from
http://www.reuk.co.uk/OtherImages/pnjunction.jpg
Sands, E., Moussa, O., Meagher, G., & Lemaire, J. (2004). Solar Energy at Janssen Ortho LLC. WPI
Interlibrary Database: Worcester Polytechnic Institute.
The Sietch Blog. Retrieved October, 2008, from www.blog.thesietch.org/wp-
content/uploads/2007/06/solarcell.jpg
Skinner, R., Moore, L., & Malczynski, L. (2002). A Rural Electric Co-op’s Experience with Photovoltaic
Systems for Livestock Water Pumping
Solarbuzz. Photovoltaic industry statistics: Costs. Retrieved 1/10, 2009, from
http://www.solarbuzz.com/statsCosts.htm
SolarHome.org. (2008). String-ribbon. Retrieved October, 2008, from http://www.solarhome.org/string-
ribbon.html
The Solarserver. (2008). Photovoltaics. Retrieved October, 2008, from
http://www.solarserver.de/wissen/photovoltaik-e.html
Tukiainen, M. (2009). Gaisma Retrieved October 15, 2008, from
http://www.gaisma.com/en/location/worcester-massachusetts.html
U.S. Department of Energy. (2006). Polycrystalline Thin Film. Retrieved October, 2008, from
http://www1.eere.energy.gov/solar/tf_polycrystalline.html
Wailgum, J., Ledue, J., Chapman, J., & Al-Beik, H. (2003). Feasibility Study of a Solar Learning Lab at
WPI. WPI Interlibrary Database: Worcester Polytechnic Institute.
Woods, D. W. ISD Module: Quantitative Method in Economics.
Wuashning, V. (2005). Understanding Renewable Energy Sources. London: Earthscan.