large scale solar feasibility study - naga · large scale solar feasibility study issue date 16th...
TRANSCRIPT

1. Victorian Greenhouse Alliances (2017) Discussion Paper: Electricity Procurement in the Victorian Local Government Sector.
FG Advisory i
www.fgadvisory.com
Large Scale Solar Feasibility Study Victorian Greenhouse Alliances
FG Advisory
16th August 2017
Large Scale Renewables Feasibility Study
FG Advisory ii
Document Control
Revision Number 4
Prepared by Rowan Gaze
Jake Hinton
Verified by Randy Gadient
Luke Zha
Reviewed By Fran MacDonald (WAGA), David Meiklejohn (NAGA),
Scott McKenry (EAGA), Robert Law (CVGA), Heather
Phillips (WMSA)
Project Partners Central Victorian Greenhouse Alliance (CVGA)
Eastern Alliance for Greenhouse Action (EAGA)
Goulbourn Broken Greenhouse Alliance (GBGA)
Northern Alliance for Greenhouse Action (NAGA)
Western Alliance for Greenhouse Action (WAGA)
Wimmera Mallee Sustainability Alliance (WMSA)
Municipal Association of Victoria (MAV)
Large Scale Solar Feasibility Study
Issue Date 16th August 2017

Large Scale Renewables Feasibility Study
FG Advisory iii
Disclaimer
All financial figures presented herein are based on cost opinions and are in conjunction with general estimation methods. Actual costs may vary.
Confidentiality
This document contains confidential information. All reasonable precautions should be taken to maintain confidentiality; to prevent unauthorised access to this document; and the disclosure of the material contained in this document. Copyright
Copyright © 2017, FG Advisory Pty Ltd. All rights reserved. No part of this document may be reproduced or transmitted in any form or by any means without express written permission from FG Advisory Pty Ltd.

Large Scale Renewables Feasibility Study
FG Advisory iv
Key Terms
Term Description
Business as Usual Current energy procurement model. The baseline case.
kW Kilowatt. A unit of power. 1,000W
LGC Largescale generation certificates. One large-scale generation certificate is equal to one megawatt hour of eligible renewable electricity. Once created and validated, these certificates act as a form of currency and can be sold and transferred to other individuals and businesses at a negotiated price.
Mismatch Proportion of energy that is consumed by Council/s at a different time to the solar array production.
MW Megawatt. A unit of power equal to 1,000,000W
Net Present Value The value in the present of a sum of money, in contrast to some future value it will have when it has been invested at compound interest.
Off-peak Between 11:00pm – 7:00am Mon-Fri and Weekends.
Peak Between 7:00am and 11:00pm Mon – Fri
Percent net renewable
The proportion of total consumption that can be met by renewable generation at any time.
Representative Council
Supplier of electricity consumption interval data used in modelling scenarios
Simple Payback The length of time required to recover the cost of an investment
Solar Insolation A measure of solar radiation energy received on a given surface area in a given time
100% Matched Refers to a solar array sized such that all solar generation to be used at the Council’s facilities within the same time period (i.e. No export).
100% Renewable Refers to a solar array sized such that total yearly solar generation matches the Council’s total annual consumption.

Large Scale Renewables Feasibility Study
FG Advisory v
Table of Contents
1 Project Background ......................................................................................................................................... 1 1.1 Policy Context ............................................................................................................................................... 1 1.2 Project Objectives ........................................................................................................................................ 1
2 Summary Recommendations .......................................................................................................................... 2 2.1 Key Findings.................................................................................................................................................. 2 2.2 Financial Summary....................................................................................................................................... 2 2.3 Recommended Scenario .............................................................................................................................. 2
3 Methodology .................................................................................................................................................. 3 3.1 Project Development and Scope Identification........................................................................................... 3 3.2 Scenario Modelling ...................................................................................................................................... 3
4 Preliminary Technical Feasibility Assessment .................................................................................................. 4 4.1 Scenario Modelling Results .......................................................................................................................... 4 4.2 Scenario 1: Single Council (Battery Storage) .............................................................................................. 5 4.3 Scenario 2: Eight Councils (Site Location) ................................................................................................... 6 4.4 Scenario 3: Eight Councils (Treatment of Large Scale Generation Certificates – LGC’s) .......................... 7 4.5 Scenario 4: Seventeen Councils (Investment Model) .................................................................................. 8 4.6 Scenario 5: Seventeen Councils (Renewables Contribution) ...................................................................... 9
5 Key Considerations ....................................................................................................................................... 10 5.1 Grid Connection Requirements.................................................................................................................. 10 5.2 Energy Fee Model ...................................................................................................................................... 10 5.3 Procurement Model ................................................................................................................................... 10 5.4 Site Selection .............................................................................................................................................. 11 5.5 Market Responsiveness ............................................................................................................................. 11 5.6 Economies of Scale .................................................................................................................................... 11
6 Appendix....................................................................................................................................................... 13 6.1 Assumptions ............................................................................................................................................... 13 6.2 Historical Development Costs – Array & Network Connection ................................................................ 14 6.3 Business as Usual Consumption Profiles and Scenario Consumption Scaling ......................................... 15 6.4 Battery Storage Size Optimisation ............................................................................................................ 17 6.5 Loan Period Sensitivity ............................................................................................................................... 18 6.6 Utility Rate Sensitivity ................................................................................................................................ 18
1. Victorian Greenhouse Alliances (2017) Discussion Paper: Electricity Procurement in the Victorian Local Government Sector. 2. Location moved to Echuca because of likelihood of network capacity constraints in Mildura
FG Advisory 1
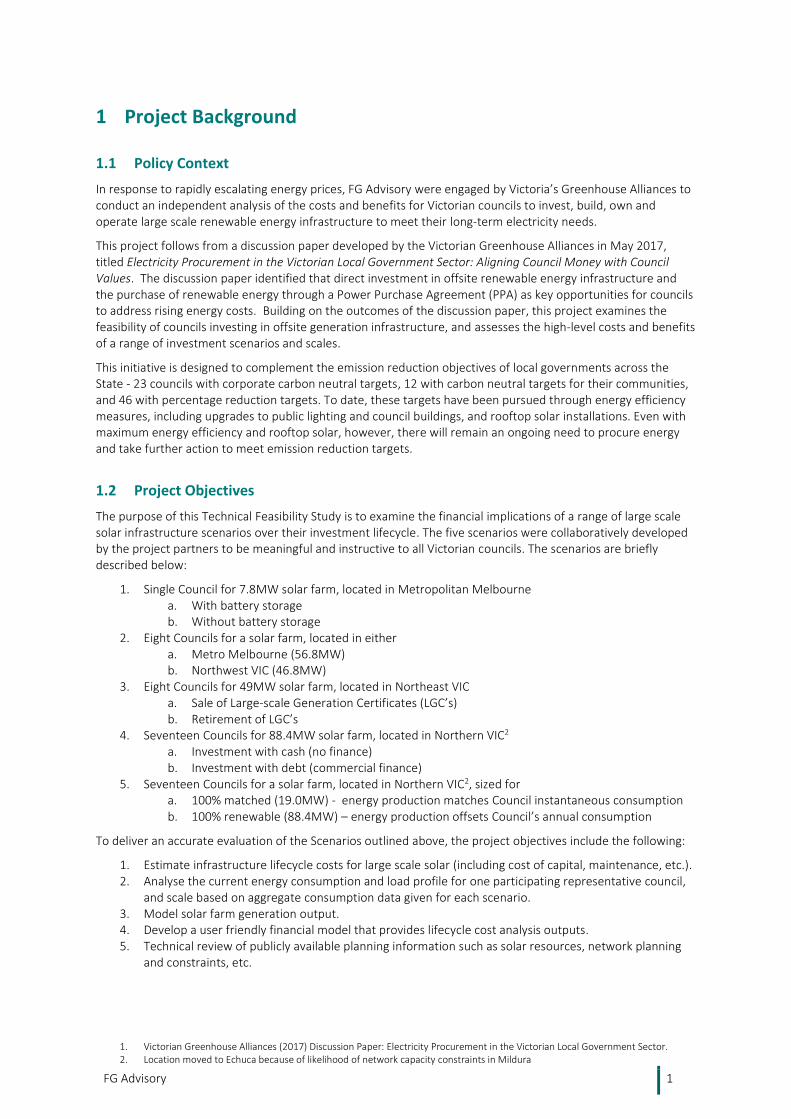
1 Project Background
1.1 Policy Context
In response to rapidly escalating energy prices, FG Advisory were engaged by Victoria’s Greenhouse Alliances to conduct an independent analysis of the costs and benefits for Victorian councils to invest, build, own and operate large scale renewable energy infrastructure to meet their long-term electricity needs.
This project follows from a discussion paper developed by the Victorian Greenhouse Alliances in May 2017, titled Electricity Procurement in the Victorian Local Government Sector: Aligning Council Money with Council Values. The discussion paper identified that direct investment in offsite renewable energy infrastructure and the purchase of renewable energy through a Power Purchase Agreement (PPA) as key opportunities for councils to address rising energy costs. Building on the outcomes of the discussion paper, this project examines the feasibility of councils investing in offsite generation infrastructure, and assesses the high-level costs and benefits of a range of investment scenarios and scales.
This initiative is designed to complement the emission reduction objectives of local governments across the State - 23 councils with corporate carbon neutral targets, 12 with carbon neutral targets for their communities, and 46 with percentage reduction targets. To date, these targets have been pursued through energy efficiency measures, including upgrades to public lighting and council buildings, and rooftop solar installations. Even with maximum energy efficiency and rooftop solar, however, there will remain an ongoing need to procure energy and take further action to meet emission reduction targets.
1.2 Project Objectives
The purpose of this Technical Feasibility Study is to examine the financial implications of a range of large scale solar infrastructure scenarios over their investment lifecycle. The five scenarios were collaboratively developed by the project partners to be meaningful and instructive to all Victorian councils. The scenarios are briefly described below:
1. Single Council for 7.8MW solar farm, located in Metropolitan Melbourne a. With battery storage b. Without battery storage
2. Eight Councils for a solar farm, located in either a. Metro Melbourne (56.8MW) b. Northwest VIC (46.8MW)
3. Eight Councils for 49MW solar farm, located in Northeast VIC a. Sale of Large-scale Generation Certificates (LGC’s) b. Retirement of LGC’s
4. Seventeen Councils for 88.4MW solar farm, located in Northern VIC2 a. Investment with cash (no finance) b. Investment with debt (commercial finance)
5. Seventeen Councils for a solar farm, located in Northern VIC2, sized for a. 100% matched (19.0MW) - energy production matches Council instantaneous consumption b. 100% renewable (88.4MW) – energy production offsets Council’s annual consumption
To deliver an accurate evaluation of the Scenarios outlined above, the project objectives include the following:
1. Estimate infrastructure lifecycle costs for large scale solar (including cost of capital, maintenance, etc.). 2. Analyse the current energy consumption and load profile for one participating representative council,
and scale based on aggregate consumption data given for each scenario. 3. Model solar farm generation output. 4. Develop a user friendly financial model that provides lifecycle cost analysis outputs. 5. Technical review of publicly available planning information such as solar resources, network planning
and constraints, etc.

FG Advisory 2
2 Summary Recommendations
2.1 Key Findings
The feasibility study investigated a range of scenarios for councils to invest in, own and operate large scale solar infrastructure. The most feasible option for councils is a 100% renewable-sized solar farm located in the Northern VIC region, using low interest finance and selling all LGCs, providing an NPV of $1.7M per council.
2.1.1 Scenario Modelling Outcomes
In developing the most financially attractive option, the following scenario model outputs should be incorporated as guidance for any future project development:
1. Battery Storage: The exclusion of batteries provides a higher financial return than including batteries 2. Location: The NW VIC location provides a higher financial return than installation in Metro Melbourne 3. LGC Treatment: The sale of LGCs provides a higher financial return than retiring LGCs 4. Investment: Low interest finance provides a higher financial return than direct investment 5. Contribution: 100% Renewables provides a higher financial return than 100% Matched Energy
Net Present Value (NPV) was adopted as a standardised measure to evaluate the financial return of each scenario. NPV represents the total financial return of the project over a 25-year investment period.
2.2 Financial Summary
The solar array size, capital cost, simple payback, and Net Present Value are presented below for each scenario, demonstrating the overall financial attractiveness of each scenario over a 25-year period. Scenario 4B provides the most attractive Net Present Value.
Scenario Scenario Description # of
Councils Array Size
(MW) Capital Cost
($M)
Simple Payback
Period (Years)
Net Present
Value (25Y)
Net Present Value (Per Council)
1A Battery Storage: None 1 7.8 $19.5 M 28.6 -$2.1 M -$2.1 M
1B Battery Storage: 13 MWh
1 7.8 $45.5 M 87.9 -$29.9 M -$29.9 M
2A Location: Melbourne 8 56.8 $141.9 M 28.6 -$15.6 M -$1.9 M
2B Location: NW VIC 8 46.8 $117.0 M 21.1 $13.7 M $1.7 M
3A LGC Treatment: Sell 8 49.0 $122.5 M 22.8 $7.0 M $0.9 M
3B LGC Treatment: Retire 8 49.0 $122.5 M 29.6 -$18.0 M -$2.3 M
4A Investment: Direct Invest
17 88.4 $221.0 M 22.2 $17.0 M $1.0 M
4B Investment: Finance 17 88.4 $221.0 M N/A $28.9 M $1.7 M
5A Contribution: 100% Matching
17 19.0 $47.5 M 27.5 -$3.9 M -$0.2 M
5B Contribution: 100% Renewables
17 88.4 $221.0 M 22.2 $17.0 M $1.0 M
Table 1: Financial Summary for all scenarios modelled.
2.3 Recommended Scenario
Scenario 4B: Low Interest Finance presented the most financially attractive scenario, resulting in a Net Present Value of $28.9 M. Scenario 4B incorporates the following input variables:
• Number of Councils: 17
• Battery Storage: None
• Location: Northern Victoria
• LGC Treatment: Sell LGCs
• Investment: Low Interest Finance (3.97%)
• Contribution: 100% Net Renewables

FG Advisory 3
• Does not include costs of land procurement or network improvements.
3 Methodology FGA employed the following methodology to meet the intended project outcomes.
3.1 Project Development and Scope Identification At project inception, FGA facilitated a workshop with key project working group stakeholders to understand the project requirements, including:
Project Briefing and Ongoing Consultations
• Briefing on the project background and context
• Discussion on the Scenarios to be modelled, and any identified risks and issues and their mitigation measures
• Key financial assumptions required for material cost components that underpin the lifecycle Finance Model
3.2 Scenario Modelling
Based on the defined Scenarios, FGA conducted data review and technical analyses for the identified large scale solar investments.
Energy Data and Scaling
Each Scenario uses a different scaling of the Representative Council’s energy consumption interval data at hourly intervals.
• Scenario 1 is a single Council, and is therefore not scaled.
• Scenarios 2 and 3 comprise 8 separate Councils, and scales the Representative Council interval data to match actual consumption data of the metro alliance.
• Scenarios 4 and 5 are a composition of 17 Councils, and scale the Representative Council data to match total annual consumption for all 17 Councils based on data from the MAV procurement group.
The interval energy database provides the foundation to create energy profiles showing variations in electricity consumption (measured in kWh) over time.
See Section 6.2 for further details on energy consumption data used, and relative scaling for each Scenario.
Solar Data Sources
Solar modelling is based on hourly average insolation data (solar energy received per square meter per month) for each month from the Bureau of Meteorology over the last 15 years for locations dependent upon the Scenario:
• Scenarios 1 & 2A utilise Melbourne insolation data
• Scenario 2B utilises Swan Hill insolation data
• Scenario 3 utilises Shepperton insolation data (Hume)
• Scenarios 4 and 5 utilise Echuca insolation data
Energy and Solar Feasibility Modelling
• Using energy engineering techniques, a model to visually illustrate the combined electricity consumption profile for each Scenario was constructed. This baseline model represents the business-as-usual (BAU) condition, and provides a basis for comparison to modelled Scenarios
• A technical solar farm feasibility model for each Scenario was developed, providing overlay of power generation profiles for comparison with existing energy consumption data.
Large Scale Solar Financial Model
• FGA provided a user-friendly Solar Farm Financial Model, providing lifecycle cost analysis outputs based on various user-adjustable inputs.

FG Advisory 4
4 Preliminary Technical Feasibility Assessment FGA presents the following detailed energy modelling results for each scenario. Note that Mismatch* refers to the proportion of solar energy generated at times when it does not match the aggregated electricity consumption profile. A low value of mismatch implies a large proportion of the Council’s energy consumption occurs at times when solar arrays are producing energy. A high mismatch implies the majority of the Council’s energy consumption occurs at times when the solar arrays are not producing energy. All assumptions utilised in modelling are summarised in Section 6.1.
4.1 Scenario Modelling Results
Scenario Scenario Description # of
Councils
Array Size
(MW)
Land Area Required
(ha)
Generation (GWh)
Mismatch* (%)
% Net Renewable
Annual Savings
($M)
Total LGC Revenue
($M)
Capital Cost ($M)
Simple Payback Period (Years)
NPV ($M)
NPV (per Council)
($M)
1A Battery Storage: None
1 7.8 23.7 11.4 67% 100 % $0.70 $3.4 $19.5 28.6 -$2.1 -$2.1
1B Battery Storage: 13 MWh
1 7.8 23.7 11.4 30% 100 % $0.62 $3.9 $45.5 87.9 -$29.9 -$29.9
2A Location: Melbourne
8 56.8 172.4 82.6 67% 100 % $5.11 $28.4 $141.9 28.6 -$15.6 -$1.9
2B Location: NW VIC 8 46.8 142.0 82.6 67% 100 % $5.13 $28.4 $117.0 21.1 $13.7 $1.7
3A LGC Treatment: Sell 8 49.0 148.7 82.6 67% 100 % $5.12 $28.4 $122.5 22.8 $7.0 $0.9
3B LGC Treatment: Retire
8 49.0 148.7 82.6 67% 100 % $5.12 $0 $122.5 29.6 -$18.0 -$2.3
4A Investment: Direct Invest
17 88.4 268.2 151.2 67% 100 % $9.39 $51.9 $221.0 22.2 $17.0 $1.0
4B Investment: Finance 17 88.4 268.2 151.2 67% 100 % $9.39 $51.9 $221.0 N/A $28.9 $1.7
5A Contribution: 100% Matching
17 19.0 57.6 32.5 2.3% 22 % $1.70 $11.2 $47.5 27.5 -$3.9 -$0.2
5B Contribution: 100% Renewables
17 88.4 268.2 151.2 67% 100 % $9.39 $51.9 $221.0 22.2 $17.0 $1.0
Table 2: Detailed Scenario Modelling results for Large Scale Solar

FG Advisory 5
4.2 Scenario 1: Single Council (Battery Storage)
4.2.1 Scenario Overview
Scenario 1 considers the financial implications of large scale battery storage incorporated into the solar array. In general, battery storage allows for excess solar energy generated during the day to be stored and used during the night, when solar generation is unavailable. The battery storage system is sized for 13,000kWh to optimise the balance between percentage mismatch and simple payback period (see Section 6.4 for additional details regarding battery size optimisation).
4.2.2 Technical Analysis
The graphs below outline the existing load (grey), proposed solar PV generation (orange) and the net remaining grid load required after the addition of solar (green) and battery storage (yellow). The net grid load is shown to outline the level of mismatch occurring in each scenario.
Figure 1: Average daily electricity consumption for single Council with solar and batteries included
4.2.3 Commentary
• The addition of battery storage is not recommended
• The addition of battery storage reduces project net present value.
• The 13,000 kWh battery reduces mismatch from 67% to 30%
• High export rates (approximately 0.05 $/kWh) and low off-peak rates (approximately 0.04 $/kWh) in energy modelling result in a reduction in savings from batteries, as compared to exporting excess solar energy
• The financial benefits of batteries are modelled assuming energy savings and maximum demand reductions only. Financial benefits of batteries due to network support, and other network benefits are not considered.

FG Advisory 6
4.3 Scenario 2: Eight Councils (Site Location)
4.3.1 Scenario Overview
Scenario 2 considers the financial implications of solar farm location, by comparing large scale solar in Swan Hill and Melbourne. Scenario 2 also considers eight Councils involved in the project. In general, areas with greater solar insolation are more favourable locations for solar arrays. Factors such as grid connection capability, environmental degradation, and sourcing spare parts and labour to remote areas also should be considered. Indeed, development of large scale solar in a location such as Mildura would require extensive network upgrades and hence costs, due to zero current capacity. Solar insolation data used in energy modelling was sourced from the Bureau of Meteorology.
4.3.2 Technical Analysis
Figure 2 below compares the solar insolation received, in kilowatt hours per square meter, for the Swan Hill (orange) and Melbourne (teal) locations. As consequence of the higher insolation in Swan Hill, a 46.8 MW solar array in Swan Hill will produce the equivalent solar energy output as a 56.8 MW solar array in Melbourne. The budget capital cost for each system is outlined in Figure 3.
Figure 2: Comparison of monthly solar irradiation levels between Melbourne and Swan Hill
Figure 3: Size/cost comparison of solar array in Melbourne and Swan Hill
4.3.3 Commentary
• The location of solar in Swan Hill is recommended over the location of solar in Melbourne
• A solar array located in Swan Hill produces more electricity than the equivalent array in Melbourne
• On average, Swan Hill receives 23% more solar radiation per month compared to Melbourne
• For large scale solar farms, Councils are advised to seek development locations in areas that experience more sun hours, particularly NE and NW regions of Victoria

FG Advisory 7
4.4 Scenario 3: Eight Councils (Treatment of Large Scale Generation Certificates – LGC’s)
4.4.1 Scenario Overview
Scenario 3 considers the financial implications of LGC treatment, comparing the benefits of selling LGCs against retiring LGCs. The sale of LGC’s provides an annual revenue stream for Council. In this case, LGC revenues are calculated assuming an initial price of $80/LGC, and a lifetime of only five years, due to uncertainty in the future of the Renewable Energy Target. The Scenario 3 modelled a solar array located in the Hume region. The output from this array is designed to match annual energy consumption of the eight representative Councils.
4.4.2 Technical Analysis
The Figure below outlines the lifecycle cash flow of LGC revenue for both Scenario 3A & 3B. Both payback and final net cash position are more positive in the sale of LGC scenario.
Figure 4: Effect of LGC sale and retirement on discounted net cash position
4.4.3 Commentary
• The sale of LGC’s is recommended over retiring LGCs based on substantial financial benefits
• The sale of LGC’s represents approximately $25M in additional NPV over the retire LGC scenario.
• The sale of LGCs reduces Simple Payback period by over five years
• LGCs have been modelled with a 5-year lifetime, a starting price of $80 per LGC and a 5% annual degradation in value over 5 years. For the remaining 20 years, LGC revenue is assumed to be $0.
• If a Council chose to sell its LGCs, it cannot claim the associated emission reduction, however it can still claim that it is supporting renewable energy
-$140
-$120
-$100
-$80
-$60
-$40
-$20
$-
$20
0 5 10 15 20 25 30
NP
V (
$m
)
Year
Scenario 3 - Discounted Cash Position
Retiring of LGCs Sale of LGCs

FG Advisory 8
4.5 Scenario 4: Seventeen Councils (Investment Model)
4.5.1 Scenario Overview
Scenario 4 considers the implications of various investment options for the initial capital required. The two Scenarios in consideration are a direct cash investment and a low interest, 25-year loan. The loan was modelled as having a fixed interest rate of 3.97% for 25 years. Note that the location for this modelled scenario has been changed from Mildura to Echuca. This is based on feedback from the WMSA, citing preliminary advice from the Network Authority (Powercor) that there will likely be capacity constraints for new renewable energy projects in the Wimmera Mallee region without further network augmentation. FGA advises that region selections are for modelling and budget purposes only. Further consultation and detailed assessments for Authority Approvals are required during the detailed design stage.
4.5.2 Technical Analysis
The Figure below outlines the discounted cash position over the 25-year lifetime of the project. The loan term is assumed to be 25 years with an interest rate change of 3.97%. The loan repayments include interest and principal. The Direct cash investment scenario presents a negative cash flow for the majority of the project. Financing the project with low interest debt ensures that the financial energy savings (including sale of LGCs) outweighs the principle and interest payments on the low interest loan, resulting in a net positive cash flow investment.
Figure 5: Aggregate discounted cash flow comparison between cash investment and low interest loan
4.5.3 Commentary
• The use of low interest finance is recommended over a direct cash investment
• The NPV of the Debt Scenario is higher than the direct investment Scenario over the project’s lifecycle
• The NPV for the Debt Scenario is $28.9 M, compared to $17.0 M for the direct investment model
• Loan repayments and interest details o Constant loan repayments of $14.1 M (principal + interest) per annum for a loan term of 25-years o Total interest of $131.5 M over 25-year loan term
• Direct Investment details o Upfront capital investment is $221.0M for an 88.4 MW array.
• The NPV increase in the first 5 years for both models is due to LGC revenues
-$250
-$200
-$150
-$100
-$50
$-
$50
$100
0 5 10 15 20 25 30
NP
V (
$m
)
Year
Scenario 4 - Discounted Cash Flows
Direct Cash Investment Low Interest Loan

FG Advisory 9
4.6 Scenario 5: Seventeen Councils (Renewables Contribution)
4.6.1 Scenario Overview
Scenario 5 considers the financial implications of sizing the solar array for 100% Net Renewable or 100% matched consumption and production. This scenario is evaluated over seventeen Councils. Mismatched energy represents the proportion of solar energy generated at times when it does not match the combined Council electricity consumption profile. Scenario 5 considers an 19MW solar array located in north Victoria (Echuca) designed for all solar generation to be used at the Council’s facilities within the same period, termed ‘100% Matched’. It is compared with an 88.4 MW array located in Echuca that is designed to match total annual consumption, termed ‘100% Net Renewable’.
4.6.2 Technical Analysis
The graphs below outline the modelled solar PV production output for Scenarios 5A & 5B. The 100% Net Renewable scenario requires greater solar generation during the day to offset off-peak loads at night. The 100% Matched Scenario requires that all solar energy generation is consumed by Council. These scenarios are presented graphically below.
Figure 6: Daily load profiles of 17 Councils with solar arrays sized to ‘100% Net Renewable’ (left) and ‘100% Matched’ (right)
4.6.3 Commentary
• The provision of 100% renewable energy is recommended over 100% matched
• The 100% Renewable energy scenario presents a more positive NPV than the 100% Matched Scenario
• The financial model assumption that export rate (spot market price for export) is higher than the off-peak rate results in solar production during the day being more financially beneficial than off peak consumption of energy.
• Management fees for the Retailer to firm and shape the output of the solar array have not been included. Should Council wish to pay a fee for the Operation and Management of the Array and the energy production, the cost of the 100% Renewable Scenario will increase.
• Modelling is based on historical pricing, which may not be an accurate reflection of future prices.

1. https://www.powercor.com.au/our-services/electricity-connections/solar-and-other-generation/connecting-larger-embedded-generator-systems/ 2. https://www.cleanenergycouncil.org.au/policy-advocacy/reports/clean-energy-australia-report.html
FG Advisory 10
5 Key Considerations The following considerations are out of scope for this Feasibility Study, but are noted as requirements for further detailed design development:
5.1 Grid Connection Requirements
All grid connected (i.e. not off-grid) renewable energy installations require Authority approval prior to connection. Typically, solar farms with capacities over 1MW are connected to the electricity network at high voltage (22kV) within the distribution network, sub-transmission lines (66kV), or transmission lines (>66kV). Connections at this size present potential risks to network stability, safety, power quality and reliability of supply to customers. During the detailed design phase, the relevant Distribution Network Service Provider (DNSP) should be consulted and presented with technical design information sufficient to commence the formal review and approval process. The first step in the approval process for most DNSPs is to submit a Preliminary Enquiry application with supporting technical design documentation. The connection process is expected to require extensive technical/engineering support, and commercial and legal advisory, and may incur additional costs for the completion of network studies and/or augmentation works by the DNSP. The processes for network connection varies depending on the DNSP. The connection process for large scale generation (over 5MW) can vary substantially depending on the DNSP, location of the site, and the relevant network constraints to that site. The Australian Energy Market Operator will also require consultation and engineering services fees for any site over 5 MW in capacity. A high-level overview of the network capacity in each region can be found on the Distributed Annual Planning Reports for each Distributor. Ausnet Services can be found here: https://www.ausnetservices.com.au/Misc-Pages/Links/About-Us/Publications Should sufficient network capacity be available, the proximity to transmission & distribution infrastructure will impact the cost of the network connection. Costs are outlined from Powercor as follows:
Item Location Cost
22 kV Overhead (OH) extension Rural/Regional $0.2 M per km
22 kV Underground (UG) extension Rural/Regional $0.9 M per km
66 kV OH extension Rural/Regional $0.3 M per km
66 kV UG extension Rural/Regional $1.2 M per km
66 kV Switching Station Rural/Regional $5.0 M each
Table 3: Network extension costs in Powercor network (Powercor, 2017) 1
5.2 Energy Fee Model
A grid connected solar array will require a new financial agreement between investor councils and the retailer. Current modelling assumes energy rates as per assumptions provided in Section 6.
5.3 Procurement Model
A comparison of a direct investment to a power purchase agreement is highly recommended (See Victorian Greenhouse Alliance’s Electricity Procurement in the Victorian Local Government Sector: Aligning Council Money with Council Values).

FG Advisory 11
5.4 Site Selection
Value and capital costs associated with land are not contained within the scope of this report. Future detailed site selection should consider the follow factors:
• Local solar irradiance levels - as described previously.
• Land availability/area - see Table 2 for a summary of land size required for all arrays. Land costs are significantly more expensive closer to Melbourne’s CBD than in regional areas. Land value and land acquisition has not been included in modelling to this point. All sites are assumed to be on Council owned land. Should Council’s require further land then these costs will be additional to modelling undertaken in this report. Median values for land prices in Victoria are outlined below:
o NW Victoria - $1,700 / ha o SW Victoria - $5,000 / ha o Northern Victoria - $5,000 / ha o Gippsland - $9,100 / ha o Values are median farmland sales published in May 20161
• Land value – where councils hold existing land, comparing the value in other investment areas, i.e. housing, is necessary.
• Proximity to electricity transmission network
• Proximity to local township – due to local employment benefits and electricity demand requirements.
5.5 Market Responsiveness
The market for small scale solar arrays below 5 MW and above 50 MW is currently more attractive to developers and installers. Below 5 MW, regulatory requirements are lower and connections completed quicker. Above 50 MW the regulatory burden becomes a lower proportion of total project cost and time and is an acceptable risk for developers and installers to commit to.
5.6 Economies of Scale
Solar arrays are typically grouped by size category into residential (1-10 kW), commercial (10-200 kW) and utility or large scale above 200 kW. As noted in the graph below, the cost of large scale solar is not predictably follow an economies of scale curve. It is more instructive to provide a range of expected prices for large scale solar, ranging from $1.34/W to $4.00/W. The large variance in cost is due to numerous factors; namely integration to the electricity network. The cost of panels, inverters, and mounting hardware is relatively stable for large scale solar, and great cost efficiencies are not guaranteed by exploring larger scale projects. As such, the NPV per council is equal whether an array is sized to match the generation of 8 councils or 17 councils, given all other variables equate. The green horizontal line in the Figure below outlines the $2.50/W value assumed in FGA’s modelling across all Scenarios.
5.6.1 Total Project Costs (excluding land acquisition)
Figure 7: Summary of project costs per watt of installed capacity (Data adapted from CEC, 2017 2 see Appendix for raw data)
$0.00
$1.00
$2.00
$3.00
$4.00
$5.00
0 50 100 150 200 250 300 350
$/W
Solar Array Size, MW
Total Australian Solar Array Development Costs

FG Advisory 12
5.6.2 Technology Costs
The declining cost of solar PV modules have significantly reduced capital costs for equipment in recent years. Government programs and market competitiveness have also placed downward pressure on prices. The cost of solar PV equipment and developments are currently favourable for large scale installations. Financial viability is to be revised should the following occur: Government subsidies cease or be reduced, land availability decreases and/or favourable grid connection locations are developed. The cost of battery storage currently does not offer a viable amount of savings in energy for further development at this stage. In the future, installed costs of large scale batteries are expected to decrease. Alternative funding arrangements are also expected to be available with DNSP’s and State Government contributions. Battery storage financial viability should be reassessed in line with expected network changes to incorporate large-scale battery installations.
5.6.3 Additional Indirect Costs
Further cost considerations include planning, soil testing and legal fees. Planning requirements can create costs due to the engagement for an independent planner and the scrutiny received for any developments in the planning system. Soil testing has been included in overall project costs by kW. Extensive soil testing for large arrays can increase indirect costs outside the contract as tenderers require more information prior to submitting their proposals. Legal fees can be incurred when creating new solar PV design and construct contracts for large arrays, and to create the agreement between Retailer and Corporate offtake to sell the energy from the solar PV array.

FG Advisory 13
6 Appendix
6.1 Assumptions
Scenario Assumptions
• Interval data at 15 minute intervals for a single ‘representative Council’, located in Metropolitan Melbourne
• Three types of site profiles were included: public lighting, large market sites, and small market sites
• Scenario 1 utilises only representative Council interval data
• Scenario 2 & 3 consists of representative Council profile scaled to yearly consumption of 8 Councils
• Scenario 4 & 5 consist of representative Council profile scaled to yearly consumption of 17 Councils. Solar PV Array Physical Assumptions
• Solar PV array production assumes: o 260 Wp modules of 17.75% efficiency o Standard efficiency (98%) inverters with no tracking or string DC optimisation o Total system efficiency of 82%. Loss factors include manufacturer’s testing tolerance, temperature
losses, voltage drop, yearly degradation and transformer losses. o Modules arranged in double rows of tilt framing to 30o with 3.5 m row spacing. o Solar insolation data gathered from Bureau of Meteorology for Melbourne, Swan Hill, Shepparton
(Hume Region) and Echuca (North-west region). Note the location change from Mildura to Echuca due to the likelihood of network capacity constraints.
Financial Assumptions
• All scenarios assume the following: o Year 0 energy tariff blended across large, small and public lighting markets rates.
▪ Peak: $0.0583 /kWh ▪ Off-Peak $0.0379 / kWh
o An annual electricity tariff escalation based on Jacob’s/AEMO Victoria Index forecasted over 25 years o Network tariffs not considered, as all energy requires distribution through network regardless of
location of new renewable facility. o Total capital cost of solar PV array assumes $2,500 per kWp of installed capacity (kWp of modules
installed (DC)). o Battery cost assumed at $2,000 per kWh o Cost of land is not considered o After the installation of the large scale renewable facility, there are three flows of energy.
1. Renewable energy produced from solar PV and consumed by Council sites at the same time (“matched”). This energy is assumed to be obtained from the renewable energy plant, and therefore will be obtained at no cost.
2. Energy consumed by Council sites at times when there is no renewable energy production (“mismatch”). This energy is assumed to be purchased at the existing wholesale tariff blended from large, small and public lighting accounts.
3. Renewable energy produced by solar PV and consumed elsewhere in the grid. This energy is assumed to be sold at the spot market price.
o Value of large scale generation certificates (LGC’s) is $80/LGC at Year 1, and is modelled to decline over the next five years at 5% per annum. LGC’s assume to have no value after five years due to uncertainty in the Renewable Energy Target (RET).
o Annual operation and maintenance (O & M) costs assumed at $20/kW installed. o NPV Assumptions
▪ 25-year investment timeframe ▪ Discount rate of 4.5% ▪ 25-year asset life

FG Advisory 14
6.2 Historical Development Costs – Array & Network Connection
6.2.1 Large Scale Solar Farms (CEC,2017) 1
The following Table presents a list of recently installed large scale solar farms in Australia. Costs are total project costs including network connections.
State Developer Project MW Investment $/W
QLD Sunshine Coast Council
Sunshine Coast Solar Farm 15 $50m $3.33
QLD Lakeland Solar & Storage
Lakeland Solar & Storage 10.8 $42.5m $3.94
NSW New Gullen Range Wind Farm
Gullen Range Solar Farm 10 $26m $2.60
QLD Fotowatio Renewable Ventures
Lilyvale Solar Farm 100 $400m $4.00
NSW Neoen Dubbo, Parkes, Griffith 110 $230m $2.09
QLD ESCO Pacific Ross River Solar Farm 148 $225m $1.52
SA Snowy Hydro Tailem Bend 100 $200m $2.00
QLD Fotowatio Renewable Ventures
Clare Solar Farm 100 $190m $1.90
QLD Sun Metal P/L Sun Metals Solar Farm 116 $155m $1.34
QLD Genex Kidston Solar Farm 50 $126m $2.52
WA APA Emu Downs 20 $50m $2.50
VIC Overland Sun Farming Yatpool, Iraak, Wemen 320 $500m $1.56
SA Lyon Group Riverland Solar Farm 330 $700m $2.12
Table 4: Summary of Large Scale Solar Installations, adapted from CEC Clean Energy Australia Report (2017)

FG Advisory 15
6.3 Business as Usual Consumption Profiles and Scenario Consumption Scaling
The graphs below show the existing monthly consumption profiles for the representative single Council (Figure 8) Eight Councils (Figure 9), and the 17 Councils (Figure 10). A monthly profile is adopted to demonstrate the monthly variance in energy consumption.
Scenario 1
Figure 8: Annual load profile for representative Council.
Scenario 2 & 3
Figure 9: Annual load profile for 8 Councils (scaled from Single Council).
Scenario 4 & 5
Figure 10: Annual load profile for 17 Councils (scaled from Single Council).
0
200,000
400,000
600,000
800,000
1,000,000
1,200,000
Jul Aug Sep Oct Nov Dec Jan Feb Mar Apr May Jun
Co
nsu
mp
tio
n, k
Wh
Monthly Consumption - Single Council
Representative Council
0
2,000,000
4,000,000
6,000,000
8,000,000
10,000,000
12,000,000
14,000,000
16,000,000
Jul Aug Sep Oct Nov Dec Jan Feb Mar Apr May Jun
Co
nsu
mp
tio
n, k
Wh
Monthly Consumption for 17 Councils

FG Advisory 16
Some key observations associated with the current single Council electricity consumption profile are summarised below:
Commentary
• In aggregate, the representative Council exhibits moderate seasonal variation, ranging from approximately 800 MWh in November, to as high as 1,100 MWh in March.
• The moderate seasonal variance can be attributed to the large market sites, which tend to have higher electricity consumption profiles in winter months
• The high baseline and moderation of variability can be attributed to the large contribution of public lighting to overall consumption, which is a constant throughout the year.
6.3.1 Business as Usual Daily Electricity Consumption Profiles
Figure 11: Daily summer load profile for Representative Council
Figure 12: Daily winter load profile for Representative Council
Commentary
• Seasonal effects are representative of the small market winter peak at 7pm, typical of increased after-hours use
• Public lighting accounts for large off-peak electricity usage throughout the year, which results in a large mismatch compared to solar generation
• Summer daily load is, on average, higher than in winter
0.00
200.00
400.00
600.00
800.00
1,000.00
1,200.00
1 2 3 4 5 6 7 8 9 10 11 12 13 14 15 16 17 18 19 20 21 22 23 24
Elec
tric
ity
Co
nsu
mp
tio
n, k
Wh
Hour
Summer Average Daily Load
Public Lighting Small Market Large Market
0.00
200.00
400.00
600.00
800.00
1,000.00
1 2 3 4 5 6 7 8 9 10 11 12 13 14 15 16 17 18 19 20 21 22 23 24
Elec
tric
ity
Co
nsu
mp
tio
n, k
Wh
Hour
Winter Average Daily Load
Public Lighting Small Market Large Market
FG Advisory 17
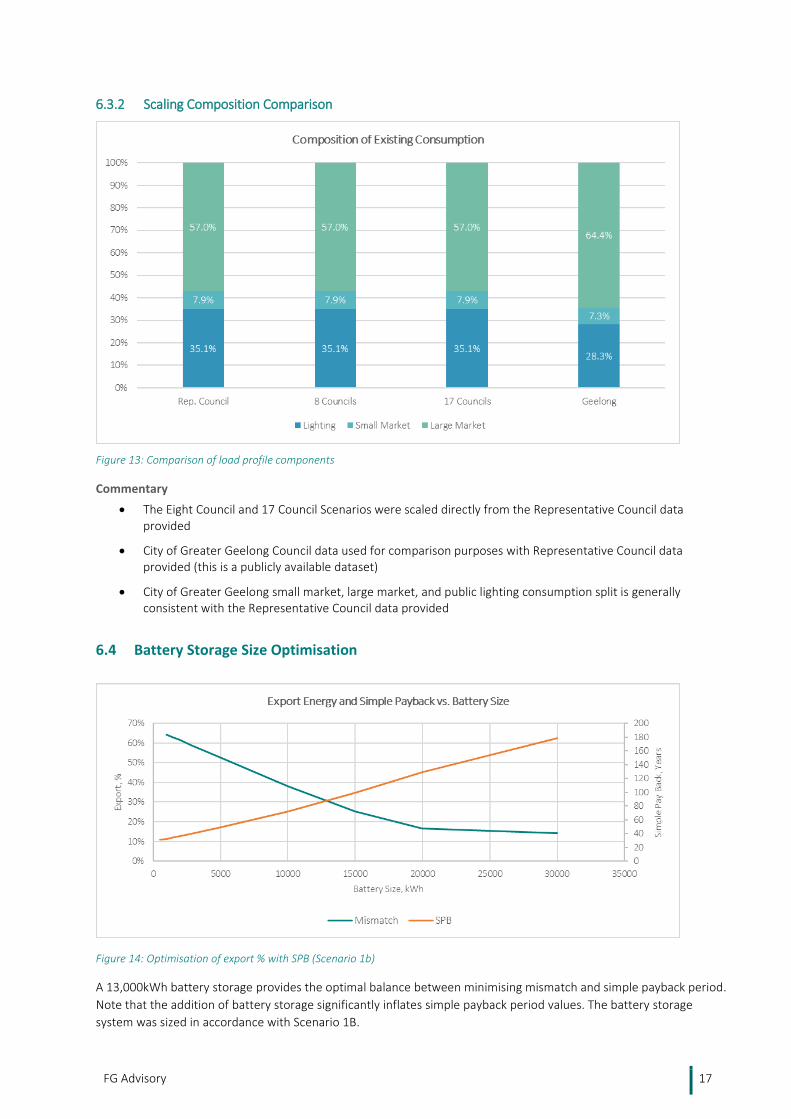
6.3.2 Scaling Composition Comparison
Figure 13: Comparison of load profile components
Commentary
• The Eight Council and 17 Council Scenarios were scaled directly from the Representative Council data provided
• City of Greater Geelong Council data used for comparison purposes with Representative Council data provided (this is a publicly available dataset)
• City of Greater Geelong small market, large market, and public lighting consumption split is generally consistent with the Representative Council data provided
6.4 Battery Storage Size Optimisation
Figure 14: Optimisation of export % with SPB (Scenario 1b)
A 13,000kWh battery storage provides the optimal balance between minimising mismatch and simple payback period.
Note that the addition of battery storage significantly inflates simple payback period values. The battery storage
system was sized in accordance with Scenario 1B.

1. https://www.aemo.com.au/-/media/Files/Electricity/NEM/Planning_and_Forecasting/EFI/Jacobs-Retail-electricity-price-history-and-projections_Final-Public-Report-June-2017.pdf
FG Advisory 18
6.5 Loan Period Sensitivity
Figure 15: Effects of loan term on NPV (Scenario 4b)
Modelled NPV increases with loan term length. Loan conditions were:
• 0% down payment
• Initial interest rate of 3.97% for 25 years
• No residual amount owing at the end of the loan term
6.6 Utility Rate Sensitivity
Figure 16: Effect of utility rate on NPV (Scenario 4b)
$-
$5.00
$10.00
$15.00
$20.00
$25.00
$30.00
$35.00
0 5 10 15 20 25 30
NP
V (
$M
)
Loan Term (yrs)
Loan Term Sensitivity Analysis
-$60.00
-$50.00
-$40.00
-$30.00
-$20.00
-$10.00
$0.00
$10.00
$20.00
$30.00
$40.00
1% 1.80% 2.50% 3% 3.40% 4.50% JacobsWholesale VIC
NP
V (
$M
)
Annual Rate Escalation
Utility Rate Sensitivity Analysis
Modelled Scenario NPV is highly sensitive to utility rate escalation. The value of the project depends on the energy consumption, and hence cost of consumption, that the solar offsets. All Scenarios have been modelled using Jacob’s index for utility escalation rate. The Jacobs AEMO Wholesale VIC Low Index is derived from the Jacobs modelling report: Retail electricity price history and projections prepared for AEMO1.

1. https://www.aemo.com.au/-/media/Files/Electricity/NEM/Planning_and_Forecasting/EFI/Jacobs-Retail-electricity-price-history-and-projections_Final-Public-Report-June-2017.pdf
FG Advisory 19
FG Advisory Melbourne Level 17, 31 Queen Street Melbourne, Victoria, 3000 Adelaide Level 30, 91 King William Street Adelaide, South Australia, 5000 ABN: 69 165 911 571
© 2017 FG Advisory