feasibility study final report on fy2014 jcm large …...feasibility study final report on fy2014...
TRANSCRIPT

Feasibility Study Final Report on FY2014 JCM Large-scale
Project for Achievement of a Low-carbon society in Asia
Feasibility Study on financing scheme development project for promoting energy efficiency equipment installation in Indonesia
March, 6th, 2015
International Project Center
Environment and Energy Research Division

Table of Contents
1. Outline of the Study ........................................................................................................................ 1
1.1 Purpose of the Project .................................................................................................... 1
1.2 Subject of Project ........................................................................................................... 1
1.2.1 Study on an ESCO project in Indonesia ........................................................................... 1
1.2.2 Domestic progress briefing session ................................................................................. 3
1.2.3 Local workshops ........................................................................................................... 4
1.2.4 Presentations at a meeting designated by the Ministry of the Environment .......................... 4
1.3 Study system ................................................................................................................. 4
1.4 Implementation period ................................................................................................... 5
1.5 Deliverables .................................................................................................................. 6
2. Collection and review of existing energy-saving diagnostic results ......................................... 7
2.1 Outline of APKENINDO activities .................................................................................. 7
2.1.1 APKENINDO system .................................................................................................... 7
2.1.2 APKENINDO activities to date....................................................................................... 8
2.1.3 Cooperation with overseas organizations ......................................................................... 8
2.2 Collected information on candidate properties .................................................................. 9
2.3 List of this properties under the Study ........................................................................... 20
2.3.1 Complex commercial facilities ...................................................................................... 20
2.3.2 Hotels ......................................................................................................................... 20
2.3.3 Industrial facilities (e.g. factories) ................................................................................. 20
2.3.4 Office buildings ........................................................................................................... 21
3. Energy-saving technologies and methodologies introduced ...................................................... 22
3.1 Complex commercial facilities ...................................................................................... 22
3.2 Hotels ......................................................................................................................... 33
3.3 Production facility (Factory) ......................................................................................... 37
3.4 Office Building ............................................................................................................ 40
3.4.1 Office Building A ........................................................................................................ 40
3.4.2 Office buildings B ....................................................................................................... 43
4. Development of JCM methodologies and estimation of GHG reduction potential ................. 49
4.1 JCM methodologies ..................................................................................................... 49
4.1.1 Concept ...................................................................................................................... 49
4.1.2 Calculation method for emission reduction and approaches to the calculation of reference
emissions .................................................................................................................... 54
4.1.3 Introduction of solar power generation system into office buildings and commercial facilities
54
4.1.4 Introduction of an exhaust heat recovery system into office buildings and commercial
facilities for cold water generation ................................................................................ 56

4.1.5 Replacement and introduction of a package air-conditioning system in office buildings ..... 59
4.1.6 Introduction of LED lighting into offices and parking lots ............................................... 61
4.2 PDD proposal .............................................................................................................. 63
4.3 GHG emission reduction .............................................................................................. 63
4.4 Estimating GHG reduction potential .............................................................................. 63
5. Policy recommendations on ESCO projects ............................................................................... 65
5.1 Issues related to the promotion of ESCO projects in Indonesia ........................................ 65
5.1.1 Long payback period.................................................................................................... 65
5.1.2 High market interest rates ............................................................................................. 65
5.1.3 Difficulty financing to companies targeted for investment ............................................... 65
5.2 Policy recommendations on establishment of an ESCO finance scheme ........................... 65
5.2.1 Electricity subsidies Indonesia ...................................................................................... 66
5.2.2 Finance incentives for energy-saving programs .............................................................. 66
5.2.3 Obstacles to development of ESCO projects in Indonesia ................................................ 67
5.3 Proposal of a finance scheme promoting energy-saving apparatuses ................................ 68
5.3.1 Use of the Japanese government’s existing assistance programs ....................................... 68
5.3.2 Finance scheme for promoting energy-saving projects in the private sector ....................... 70
6. Project execution plan .................................................................................................................. 71
6.1 Commercial complex ................................................................................................... 71
6.1.1 The installation of solar PV system ............................................................................... 71
6.1.2 Installing heating source technology .............................................................................. 76
6.2 Hotel ........................................................................................................................... 86
6.3 Industry(factory) .......................................................................................................... 88
6.3.1 Energy analysis ........................................................................................................... 88
6.3.2 Measures to mitigate CO2 emissions (energy conservation) ............................................ 90
6.4 Office building .......................................................................................................... 103
6.4.1 Office building A ....................................................................................................... 103
6.4.2 Office building B ....................................................................................................... 107
7. Workshop “Financing Options for Energy Efficiency Projects for Buildings and Industries in
Indonesia”.................................................................................................................................... 117

List of Figures
Figure 1-1 Work flow of the Study project ................................................................................ 3
Figure 1-2 Study system ............................................................................................................ 4
Figure 3-1 Share of apparatuses in the total amount of electricity used ..................................... 22
Figure 3-2 Monthly amount of electricity purchased, amount of electricity generated, and LNG
consumption (2011-2013) ................................................................................................... 23
Figure 3-3 Monthly energy cost (2011-2013) ............................................................................. 24
Figure 3-4 Monthly power consumption by apparatus (2011-2013)........................................... 24
Figure 3-5 West Mall (metal-sheet roof) .................................................................................. 28
Figure 3-6 West Mall (top-light) .............................................................................................. 28
Figure 3-7 Skybridge (landscape) ............................................................................................ 28
Figure 3-8 Skybridge (top-light) .............................................................................................. 28
Figure 3-9 East Mall (top-light) ............................................................................................... 28
Figure 3-10 East Mall (inclined-roof) ...................................................................................... 28
Figure 3-11 Installation image onto metal-sheet roof .............................................................. 29
Figure 3-12 Installation image onto top-light .......................................................................... 29
Figure 3-13 Installation image onto inclined-roof ................................................................... 29
Figure 3-14 Turbo chiller ......................................................................................................... 30
Figure 3-15 Cooling tower ....................................................................................................... 30
Figure 3-16 Electric generator ................................................................................................. 30
Figure 3-17 Central monitoring ............................................................................................... 31
Figure 3-18 Processed drain water ........................................................................................... 31
Figure 3-19 RO membrane equipment ..................................................................................... 31
Figure 3-20 Electricity intake equipment ................................................................................. 32
Figure 3-21 Oil tank ................................................................................................................. 32
Figure 3-22 Air-cooling chiller ................................................................................................ 32
Figure 3-23 Monthly electricity consumption (from 2012 to 2014) ........................................ 33
Figure 3-24 Chandelier of Bali Room ...................................................................................... 34
Figure 3-25 Indirect lighting of ceiling (Slit part) ................................................................... 34
Figure 3-26 Indirect lighting of ceiling (Slit part) ................................................................... 34
Figure 3-27 Lighting of guest room corridor ........................................................................... 34
Figure 3-28 Bedside stand lighting (outside view) .................................................................. 35
Figure 3-29 Bedside stand lighting (LED, inside view)........................................................... 35
Figure 3-30 Stand lighting (outside view) ............................................................................... 35
Figure 3-31 Stand lighting (LED, inside view) ........................................................................ 35
Figure 3-32 Bedside stand lighting (Bulb, inside view)........................................................... 35
Figure 3-33 Bathroom lighting (outside view) ......................................................................... 36
Figure 3-34 Bathroom lighting (indirect) (Fluorescent lamp, inside view) ............................. 36
Figure 3-35 Exterior lighting of guest room (from interior) .................................................... 36
Figure 3-36 Exterior lighting of guest room (from roof top) ................................................... 36
Figure 3-37 Float Lamp (zoom) ............................................................................................... 36
Figure 3-38 Float Lamp (from roof top) .................................................................................. 36
Figure 3-39 Chiller ................................................................................................................... 37
Figure 3-40 Cooling tower ....................................................................................................... 37
Figure 3-41 Electricity intake equipment panel ....................................................................... 37
Figure 3-42 Gas boiler ............................................................................................................. 38

Figure 3-43 Compressor .......................................................................................................... 38
Figure 3-44 Raw water storage tank ........................................................................................ 38
Figure 3-45 Drain treatment tank ............................................................................................. 39
Figure 3-46 Settlement tank ..................................................................................................... 39
Figure 3-47 Centrifugal chiller ................................................................................................... 40
Figure 3-48 Cooling tower .......................................................................................................... 40
Figure 3-49 System renewal plan................................................................................................ 41
Figure 3-50 Renewal plan ........................................................................................................... 42
Figure 3-51 Benefit of A/C system renewal ................................................................................ 42
Figure 3-52 Annual power consumption by transformer (by intended use) .......................... 43
Figure 3-53 Layout of lighting at standard floor (before renewal) ............................................. 45
Figure 3-54 Layout of lighting at standard floor (after renewal) ................................................ 45
Figure 3-55 Monthly data of lighting load every year ................................................................ 46
Figure 3-56 Monthly data of air-conditioning power load every year ........................................ 46
Figure 3-57 Monthly data of electricity consumption every year ............................................... 46
Figure 3-58 Monthly data of lighting load trend with the passage of time ................................. 47
Figure 3-59 Monthly data of air-conditioning power load with passage of time ........................ 47
Figure 3-60 Monthly data of electricity consumption with passage of time ............................... 47
Figure 3-61 Air conditioner layout diagram................................................................................ 48
Figure 5-1 Scheme of the Energy Efficiency Reinforcement Fund (EERF) ............................. 67
Figure 5-2 A fund for disseminating low-carbon technologies ................................................ 69
Figure 5-3 Financial assistance in “single-step” development (ADB contribution) ................ 69
Figure 6-1 Solar PV panel capacity in GI ................................................................................ 71
Figure 6-2 Layout plan in West Mall ....................................................................................... 72
Figure 6-3 Layout plan in Skybrige ......................................................................................... 72
Figure 6-4 Layout plan in East Mall ........................................................................................ 73
Figure 6-5 Power generation simulation result ........................................................................ 73
Figure 6-6 Power consumption reduction of air conditioning systems .................................... 74
Figure 6-7 Proposed Project Scheme ....................................................................................... 75
Figure 6-8 Proposed Project Schedule ..................................................................................... 75
Figure 6-9 Organizational flow chart: Distribution of work and funds among the participants . 84
Figure 6-10 Representative means of procuring funds ............................................................... 84
Figure 6-11 Annual usage ratio for electricity by equipment (July 2013-June 2014) ................. 88
Figure 6-12 Monthly electricity consumption by equipment (July 2013-June 2014) ................. 88
Figure 6-13 Percentage of annual gas usage by category, July 2013 to June 2014 ..................... 89
Figure 6-14 Monthly gas usage by category, July 2013 to June 2014 ........................................ 89
Figure 6-15 Organizational flow chart: Distribution of work and funds among the participants
.......................................................................................................................................... 101
Figure 6-16 Representative means of procuring funds ............................................................. 101
Figure 6-17 Cut in electricity charge ........................................................................................ 103
Figure 6-18 CO2 reduction ....................................................................................................... 103
Figure 6-19 Project scheme ...................................................................................................... 104
Figure 6-20: Renewal plan ........................................................................................................ 105
Figure 6-21 : proposed renewal schedule.................................................................................. 106
Figure 6-22 Layout of air-conditioning unit ............................................................................. 107
Figure 6-23 Image of renewal of air-conditioning unit ............................................................. 108
Figure 6-24 Layout of lighting equipment ................................................................................ 112

Figure 6-25 Procedure of lighting renewal ............................................................................... 113
Figure 6-26 Spec of LED lamp ................................................................................................. 114
Figure6-27 Proposed Project Scheme ....................................................................................... 116
Figure 6-28 Proposed Project Schedule .................................................................................... 116

List of Tables
Table 1-1 Outline of domestic progress briefing session ........................................................... 3
Table 1-2 Companies responsible for Study tasks ..................................................................... 5
Table 1-3 Study schedule ........................................................................................................... 5
Table 1-4 Deliverables .................................................................................................................. 6
Table 2-1 APKENINDO member companies (as of July 2014) ................................................ 7
Table 2-2 APKENINDO cooperation with overseas organizations ........................................... 8
Table 2-3 List of Apkenindo-selected properties ..................................................................... 9
Table 2-4 List office buildings Jakarta ................................................................................... 10
Table 2-5 List of mauls in Jakarta ............................................................................................ 11
Table 2-6 List of hotels in Jakarta .......................................................................................... 13
Table 2-7 List of apartments in Jakarta .................................................................................. 16
Table 2-8 List of hotels in Jakarta .......................................................................................... 18
Table 2-9 Outline complex commercial facilities .................................................................. 20
Table 2-10 Outline of hotel buildings ...................................................................................... 20
Table 2-11 Outline of industrial facilities (factories) ............................................................... 21
Table 2-12 Outline of office building A ................................................................................... 21
Table 2-13 Outline of office building B ................................................................................... 21
Table 3-1 Specifications for air-conditioning refrigerators in West Mall .................................... 25
Table 3-2 Specifications for air-conditioning refrigerators in East Mall .................................... 26
Table 3-3 Annual power consumption by transformer (by intended use) ................................... 43
Table 3-4 Types of air-conditioning systems and a list of lighting devices after replacement .... 44
Table 4-1 JCM methodology development approaches to be discussed ................................... 49
Table 4-2 JCM methodologies approved or proposed for Indonesia (as of February 6, 2015) ..... 50
Table 4-3 Review of proposed technologies for the four facilities ................................................ 51
Table 4-4 Methodologies for emission reduction calculation for the proposed technologies.... 52
Table 4-5 Qualification standards for introduction of the solar power generation system under
discussion ............................................................................................................................. 54
Table 4-6 Pre-fixed parameters in methodologies related to the solar power generation system
under discussion .................................................................................................................. 56
Table 4-7 Qualification standards for the introduction of an exhaust heat recovery system for cold
water generation under discussion ....................................................................................... 56
Table 4-8 Parameters pre-fixed under methodologies related to the solar power generation system
under discussion ................................................................................................................... 58
Table 4-9 Qualification standards for replacement/introduction of a package air-conditioning
system in office buildings under discussion ........................................................................ 59
Table 4-10 Parameters for pre-fixed methodologies related to the introduction of package air
conditioning system under discussion .................................................................................. 60
Table 4-11 Qualification standards for the introduction of the LED lighting under discussion ..... 61
Table 4-12 Parameters pre-fixed under methodologies related to the introduction of the LED
lighting under discussion ...................................................................................................... 62
Table 4-13 Emission reduction calculated with the proposed methodologies and emission
reduction with existing apparatuses .................................................................................... 63
Table 4-14GHG reduction potential ............................................................................................. 64
Table 5-1 ESDM plan to raise electricity rates (as of February 2014) ........................................ 66
Table 5-2 Incentives under the 2009 Energy-saving Law (No.70) ............................................ 66

Table 5-3 Obstacles to development of ESCO projects in Indonesia ........................................ 68
Table 6-1 Investment and effect of replacement of lighting devices ......................................... 87

1
1. Outline of the Study
1.1 Purpose of the Project
At the 36th session of the Intergovernmental Panel on Climate Change (IPCC) on September 26,
2015 in Stockholm, Sweden, the Summary for Policy Makers of Fifth Assessment Report (Natural
Science Basis) by Working Group I was submitted and approved. The summary reassured the
ongoing global warming trend and stated that human activities are most likely the main cause of the
global warming, which was first observed in the mid-20th century.
Japan has shared with all other countries their commitment to at least halve global greenhouse gas
emissions by 2050, while setting up a long-term 80% GHG reduction target (according to the Basic
Environment Plan determined by the Cabinet on April 27, 2016).
In order to reduce greenhouse gas emissions by half by 2050 on a global basis, it is essential to
formulate and carry out GHG reduction projects on a large scale in Asia-Pacific regions, which are
undergoing fast economic growth, while accelerating moves toward establishment of sustainable
low-carbon societies in Asia.
For that purpose, Japan is urged to establish a new mechanism (Joint Crediting Mechanism or
JCM) for appropriately evaluating the contribution to energy-derived CO2 emission reduction.
We have implemented a feasibility study on large-scale JCM projects that are aimed at building
low-carbon societies in Asia. These projects are expected to streamline and provide Japan's
technologies and systems in a geographical package to include local cities and regions to match the
local situations, as well as establishing an appropriate operation and maintenance system in order to
obtain JCM credits.
1.2 Subject of Project
1.2.1 Study on an ESCO project in Indonesia
(1) Collection and review of existing energy-saving diagnostic results
Energy-saving diagnosis has been carried out extensively under financial assistance of Indonesia's
Ministry of Energy and Mineral Resources (MEMR) on factories, commercial facilities, housing,
and other facilities. In cooperation with the Indonesia ESCO Association (APKENINDO), we have
collected and reviewed energy-saving diagnostic results and other relevant information on
commercial facilities, private factories, and other buildings.
In addition, as another approach to identify properties to be discussed, we reviewed statistical
materials on dilapidated buildings obtained from a public agency (Indonesia Central Statistics
Bureau: Badan Pusat Statistik) and an industry group (Indonesia Builders Association: Asosiasi
Kontraktor Indonesia). As we were unable to obtain information on individual properties, we further
sought and collected property information with the help of Kanematsu Corporation, who have local
offices in Indonesia.

2
(2) Review of energy-saving technologies and methodologies to be introduced
In this Study project, we focused on commercial buildings and factories. Air-conditioning systems,
LED/CFL lighting, and energy management systems (EMS) were studied for hotels and office
buildings. Meanwhile, for private factories, we conducted energy-saving diagnosis and presented an
energy-saving proposal upon consultation with APKENINDO.
In future projects, Indonesia would see effective energy-saving effects by introducing Japan's
proprietary technologies through ESCO.
(3) Review of MRV methodologies and estimation of GHG reduction potential
We reviewed MRV methodologies necessary for the Project. In addition, applicable MRV
methodologies and PDD (proposal) were prepared for representative energy-saving proposals,
through review of the existing energy-saving diagnostic results and the energy-saving apparatus
verification results. Discussions were held with local operators on issues to be solved and actions to
be taken in order to implement a JCM project. Further, we estimated GHG reduction potential that
can be achieved when this Project is applied widely to cities under study.
(4) Policy recommendations on ESCO projects
For the purpose of building a JCM large-scale project, we will identify issues involving the
promotion of ESCO projects in Indonesia and make policy recommendations in the ESCO projects.
1)Issues related to the promotion of ESCO projects in Indonesia
We identified issues involving the promotion ESCO project in Indonesia. Specifically, our study
was carried out through cooperation with local law firms and lease companies, with a focus on the
development of a legal system and an ESCO finance scheme and the establishment of an ESCO
company.
2)Policy recommendations on the development of an ESCO finance scheme
Based on the current status of ESCO project activities and issues involved therein, policy
recommendations were presented with respect to the development and organization of an ESCO
company and an ESCO finance scheme.
3)Workshops
Workshops were held in Jakarta in order to communicate the concept of ESCO projects, and inform
ESCO project stakeholders of the Study results, and present our proposal to them.
(5) Development of a project plan
Based on the above results, a project plan was formulated to be implemented in FY2015 and
successive years.
Figure 1-1 shows the work flow of the Study project.

3
Figure 1-1 Work flow of the Study project
Source: Study Team
1.2.2 Domestic progress briefing session
As shown in Table 1-1, domestic progress briefing sessions were held to answer questions.
Table 1-1 Outline of domestic progress briefing session
Category Date and time Place Subjects of the report and Q&A session
1st
session
September 19, 2014
10: 00 - 12: 00
Ministry of the
Environment
Conference
Room
◆Background and purpose of Study
◆Subjects of the Study
◆Study implementation system
◆Progress of the Study and the future Study
schedule
◆Introduction of technologies
◆Outline of the ESCO project
◆Implementation system and schedule for
commercialization
◆Financial assistance scheme for
commercialization
2nd
session
January 19 and 26,
2015
Ministry of the
Environment
Conference
Room
◆Introduced technologies
◆Summary of MRV methodologies
◆Progress of the Study and the future Study
schedule
◆Amount of capital investments and schedule
◆An implementation system and a schedule for
commercialization
(1) Reviewing the existing
energy saving diagnosis
results
(3) Estimating GHG
reduction potential
(2) Reviewing energy-saving technologies and
methodologies
Reviewing energy-saving technologies
Presenting an energy-saving proposal
(4) Making policy recommendations on ESCO
projects
Identifying issues on the promotion of
ESCO projects
Making recommendations for developing
an ESCO finance scheme
Holding workshop s (5) Formulating a project
plan

4
◆A financial assistance scheme for
commercialization
Source: Study Team
1.2.3 Local workshops
A local workshop was held on January 29, 2015. Refer to: 7.Workshop “Financing Options for
Energy Efficiency Projects for Buildings and Industries in Indonesia”
1.2.4 Presentations at a meeting designated by the Ministry of the Environment
A presentation was made at a seminar sponsored by the Ministry of the Environment on February
11, 2015.
1.3 Study system
Figure 1-2 shows the Study system. The Study is represented by Mitsubishi Research Institute,
Inc., who works jointly with Mitsubishi UFJ Morgan Stanley Securities Co., Ltd. (MUMSS), NTT
Facilities, Inc. (NTT-F), and Kyudenko Corporation. In addition, PT. Takasago Thermal Engineering
(a local subsidiary of Takasago Thermal Engineering Co., Ltd.), Kanematsu Corporation,
APKENINDO (Indonesian ESCO Association), and local consulting firm PT. PAMULA CIPTA
MAHAKARYA participated in this Study as subcontractors. The progress of the JCM project will be
reported to the Indonesia JCM Office.
Figure 1-2 Study system
Source: Study Team
FS project for ESCO
Indonesia ESDM Ministry
Apkenindo
MUMSS / MRIJCM Secretariat / DNPI
Advise
Implementation of
the FS
JCM
Support /
Advisory
KyudenkoTakasago
Indonesian Side
Japanese side
Technical
Assistance
Advise &
Support
NTT-F
FS Progress
Report
JCM Participants
Japan Ministry
of EnvironmentA
ss
ign
men
t
FS
Re
po
rt
Kanematsu

5
Table 1-2 shows the companies responsible for Study tasks.
Table 1-2 Companies responsible for Study tasks
Task Company in charge
1. Reviewing the existing energy-saving diagnostic results MRI
2. Reviewing energy-saving
technologies and
methodologies to be
introduced
Reviewing energy-saving
technologies
NTT-F, Kyudenko, PT. Takasago
Thermal Engineering
3. Developing an MRV methodology and estimating GHG
reduction potential
MUMSS
4. Making policy
recommendations
Identifying issues involving
the promotion of an ESCO
project
MRI
Making policy
recommendations on the
development of an ESCO
finance scheme
MRI, MUMSS
Holding a workshop to
provide relevant information
MUMSS, MRI
5. Developing a project plan MRI, MUMSS, NTT-F, Kyudenko, PT.
Takasago Thermal Engineering,
Kanematsu
Source: Study Team
1.4 Implementation period
The Study project will be implemented from April 2014 to March 2015 (Table 1-3).
Table 1-3 Study schedule
Category 2014 2015
4 5 6 7 8 9 10 11 12 1 2 3
Local study
Energy-saving
diagnosis and
proposal
Development of
MRV methodology
Preparation of PDD
(proposal)
Policy
recommendation
Workshop
Preparation of
reports
Source: Study Team
Review Survey/review/
Proposal
Deliberation on
commercialization
Delivery

6
1.5 Deliverables
Table 1-4 shows our deliverables.
Table 1-4 Deliverables
Category Number
of
copies
Number of pages
Paper
medium
Japanese report 7 About 100 pages in A4 size
English report 7 About 100 pages in A4 size
Indonesian report 7 About 40 pages in A4 size
Electronic medium (DVD-R) 1 unit Report data recorded digitally
Source. Study Team

7
2. Collection and review of existing energy-saving diagnostic results
In order to identify properties appropriate for a JCM project, we collected and reviewed
energy-saving diagnostic results and other necessary information in cooperation with Indonesia
ESCO Association (APKENINDO), with a main focus on commercial buildings and private
factories.
In addition, as another approach to specify relevant property, we previously considered examining
statistical materials on dilapidated buildings obtained from a public agency (Indonesia Central
Statistics Bureau: Badan Pusat Statistik) and an industry group (Indonesia Constructors Association:
Asosiasi Kontraktor Indonesia). However, we instead collected information on individual properties
with the help of Kanematsu Corporation, who has local offices in Indonesia.
2.1 Outline of APKENINDO activities
The Indonesia ESCO Association (APKENINDO) is a group of Indonesian ESCO operators
organized on April 21, 2011 to perform the following roles1:
Mediating among agencies, companies, and groups engaged in ESCO project activities:
Specifically involving ESCO operators and their potential customers (end energy users),
financial agencies, energy-saving apparatus manufacturers and distributors, and public
agencies.
Encouraging ESCO operators to make project proposals:
Establishing a special fund for clean energy financing; and helping establish a finance
mechanism to enable ESCO to combine multiple projects in a single deal to cut transactions
costs.
Member operators assisting in the development of energy-saving projects assistance:
Technical assistance, assistance in negotiations and in forming connections, using project
experience, developing capacities, and implementing training and seminars.
Assisting in the development of laws and regulations and in framework decisions:
Contributing to framework decisions on laws and regulations for the purpose of developing
energy-saving projects.
2.1.1 APKENINDO system
As of July 2014, this system consists of 14 members--four state-owned companies and 14 private
businesses.
Table 2-1 APKENINDO member companies (as of July 2014)
APKENINDO Chairman:Mr. Judianto Hasan
Executive Director:Mr. Banu Anang Priyanto
State-owned enterprise Private enterprise
PT Energy Management Indonesia
(Persero)
PT Sucofindo (Persero)
PT Indra Karya (Persero)
PT Surveyor Indonesia (Persero)
PT Asia Paragon Energy
PT Enercon Equipment Company
PT Inresh Consulting Indonesia
PT Kaltimex Energy
PT Metropolitan Bayutama
1 APKENINDO Presentation "ESCO in Indonesia Opportunities and Constrains on Energy Efficiency Investment
Potential", 2013

8
PT Miura Indonesia (Miura Boiler)
PT Pura Mayungan (PM electric)
PT RBB Alpha Energy
PT Schneider Indonesia
PT Trakond Indonesia
PT Fuji Electric Indonesia
PT Indo Prima Solusi (Indosolution)
PT Rekayasa Industri
PT Takasago Thermal Engineering
Source: Study Team
2.1.2 APKENINDO activities to date
The official number of projects is yet to be released. APKENINDO has been promoting ESCO
projects in Indonesia in cooperation with governments, regulatory authorities, international agencies,
and other stakeholders. APKENINDO has participated in several energy-saving projects for
buildings, including an EMS installation project on buildings for the Department of New Renewable
Energy and Conservation of Energy (EBTKE) of the Ministry of Mineral Resources and a project for
installation HVAC units in Jakarta supermarkets. In addition, APKENINDO has been aggressively
carrying out seminar workshops on technical assistance and capacity building for energy-saving.
2.1.3 Cooperation with overseas organizations
As shown in Table 2-2, APKENINDO maintains collaborative relationships with international
agencies and public organizations in foreign countries.
Table 2-2 APKENINDO cooperation with overseas organizations
Organization Cooperation activities
Japanese Business Alliance
for Smart Energy Worldwide
(JASE-World)
Conducting a fact-finding study for the feasibility of ESCO
projects in Indonesia (EECJ joined the study in August 2013)
Japan Association of Energy
Service Companies
(JAESCO, Japan)
An exchange agreement was executed on March 24, 2014.2
Replacing technical information with market information;
Developing training programs;
Distributing ESCO information to Indonesia's industries;
Establishing a joint team for launching ESCO projects in
Indonesia;
Exchange and dispatching technical and management experts;
Issuing titles to projects to show that they are joint projects;
Discussing the allocation of expenses and gains generated under
the agreement.
Energy Efficiency Center of
Japan (EECJ)
The center cooperates in the above JASE-World projects. In
addition, acting on behalf of Ministry of Economy, Trade and
Industry of Japan, it is engaged in the development of human
resources for ASEAN countries under a Japan-ASEAN cooperation
framework. Further, the organization is implementing a project
“Promotion on Energy Efficiency and Conservation” in ASEAN
countries, as also commissioned by the ministry.3
2 JAESCO website, http://www.jaesco.or.jp/news/news/; obtained October 14, 2014. 3 ECCJ website,
http://www.aseanenergy.org/index.php/projects/2009/11/01/asean-japan-promotion-on-energy-efficiency-and-conserv
ation-promeec, obtained October 15, 2014

9
British Embassy and IESR British Embassy in Jakarta provides assistance, including
energy-saving seminar activities, through the Institute for Essential
Services Reform (IESR). For example, British Embassy in Jakarta
organized a workshop “Unlocking the Investment Potentials for
Energy Efficiency in Indonesia”4.in January 2012 jointly with
IESR and Indonesia Directorate General of New, Renewable
Energy Conservation (DGNREE) and sponsored a conference
“Opening the Energy Efficiency Investment Clog” in March 2013,
jointly with IESR.
The National Association of
Energy Service Companies
(NAESCO)
NAESCO is promoting ESPC (Energy Service Performance
Contract / Energy Performance Contract, or EP contracts) in
accordance with an order of the Obama administration to improve
the performance of federal buildings in environmental, energy,
economic aspects, (Executive Order 13514). The organization
answers inquiries from the Indonesian Ministry of Industry and
APKENINDO5.
Denmark Promoting energy-saving in factories and commercial buildings
and in the public sector (Energy Efficiency in Industrial,
Commercial and Public Sector: EINCOPS)
Netherlands Identifying energy potential
Japan Conducting JICA and NEDO demand-side management
UNIDO Developing energy management standards
ASEAN Forming energy-saving subsector networks
Source: Reorganized by the Study Team from websites of groups and local study findings
In addition to the above, APKENINDO cooperates with Korea's Ecosian Co., Ltd., Korea Energy
Management Corporation, and Thailand's Excellent Energy International Co., Ltd.
2.2 Collected information on candidate properties
Properties selected by Apkenindo are shown below.
Table 2-3 List of Apkenindo-selected properties
Property Name Type Year Overview
Senayan City Integrated
Complex
2006 48,000 m2, Shopping Mall, Offices (SCTV
Tower; 21 storeys), Apartment (25 storeys)
Mediterania Garden
Residences
Apartment 2004 4 towers, 30+ storeys
Mediterania Gajah
Mada Residence
Apartment 2005 2 towers, 32 storeys
Mediterania Boulevard
Residence
Apartment 2006 9,300 m2,74,612 m2 (building), 2 towers, 32
storeys, 2,232 units
Pakubuwono
Residence
Luxury
Apartment
2006 5 towers, 24 storeys
Mangga Dua Square Shopping
Center
2005 4000 units, 11 floors, 2 basement, and 1
lowerground
4 IESR website,
http://www.iesr.or.id/english/2013/03/seminar-opening-the-energy-efficiency-investment-clog-in-indonesia/, obtained
October 14, 2014. 5 NAESCO website, Key Accomplishments, http://www.naesco.org/accomplishments, obtained October 14, 2014.

10
CBD Pluit Integrated
Complex
2008 90,000 m2, Shopping mall, offices, apartment (5
towers, 20-25 storeys)
Lindeteves Trade
Center
Shopping
Center
2005 26,000 m2, 47,600 m2 (building), 2,302
units(Shophouses: 128 units)
Property data collected by Kanematsu Corporation were classified into four types of
properties—office buildings, hotels, hospitals, high-rise apartments.
Table 2-4 List office buildings Jakarta
Property Name Height[m] Year Floor
APL Tower 175 2011 38
Artha Graha Building 183 2000 30
Aston Hotel Jakarta 151 37
AXA Tower[19] 195 2012 45
Bakrie Tower[9][2] 215 2009 48
Central Park Residences[22] 188 2011 56
Citicon 150 2003 39
Equity Tower SCBD[5][6] 220 2008 44
First Capital Center 152 2003 39
Gedung utama Bank Indonesia 180 2005 45
Gedung utama Universitas Tarumanegara 197.5 2011 48
Graha Energi[8][2] 217 2008 40
Grand Hyatt Residence[13] 210 2009 46
Grand Slipi Tower 186 2000 48
H Tower 182 2000 30
Intercontinental Hotel Midplaza, Jakarta 167 2001 41
Jakarta Central Twin Tower 1 dan 2 190 2003 38
Kemang Tower 193 2000 50
Kempinski Residence[10][2] 215 2008 57
Keraton Residence 210 2009 48
Kuningan City[16] 203.2 2012 58
Mandiri Plaza 174 2011 40
Menara BCA[4][2] 230 2007 56
Menara Central Park Residences 1, 2, 3 199 2011 56
Menara Kadin 169 2009 37
Menara Taman Anggrek (1, 2, 3, 4, 5, 6, 7, 8) 152 1996 40
Menara Taman Thamrin 197 2011 50
Oakwood Premier Cozmo 170 2007 45
One Pacific Place[21] 193 2007 37
Ouran Tower 155 1996 39
Plaza BII 160 1987 39
Plaza Indonesia Extension[2] 210 2009 48
Residence 8 @Senopati Tower A dan B[15] 205 2012 50
Ritz-Carlton Twin Towers[2][12] 212 2005 48
Sampoerna Strategic 173 2010 37
Thamrin Center 185 2005 46
Thamrin One 187 2002 48
The Capital tower 207 2010 50

11
The City Center @Batavia City[14] 208 2012 47
The Icon Residences Tower 1 dan 2[2][17] 200 2008 47
The Peak Twin Towers[7][2] 218.5 2006 55
The Pinnacle[11] 213.1 2006 52
The Plaza 205 2009 47
The Sudirman Place 212.5 2006 52
UOB Plaza[20] 194.3 2007 45
Wisma 46[1][2][3] 262 1996 51
Wisma Mulia[2][18] 195.1 2003 54
Table 2-5 List of mauls in Jakarta
Property Name Location
CityWalk Sudirman Central Jakarta
Gajah Mada Plaza Central Jakarta
ITC Cempaka Mas Central Jakarta
Menteng Plaza Central Jakarta
Plaza Indonesia Central Jakarta
EX Plaza Indonesia Central Jakarta
Sarinah Plaza Central Jakarta
Grand Indonesia Shopping Town Central Jakarta
Plaza Atrium Central Jakarta
Lifestyle X'nter Central Jakarta
Senayan City Central Jakarta
Plaza Senayan Central Jakarta
Mangga Dua Pasar Pagi Central Jakarta
Mall Mangga Dua Central Jakarta
Harco Mas Mangga Dua Central Jakarta
Mangga Dua Square Central Jakarta
ITC Roxy Mas Central Jakarta
MGK Kemayoran Central Jakarta
Thamrin City Central Jakarta
Atrium Senen Central Jakarta
Pasar Tanah Abang Central Jakarta
Menteng Huis Central Jakarta
Bintaro Xchange Mall Central Jakarta
ITC Mangga Dua North Jakarta
Mall Kelapa Gading I - III & V North Jakarta
Mall Sunter North Jakarta
Pluit Village North Jakarta
Baywalk Pluit North Jakarta
Pasar Pagi Mangga Dua North Jakarta
WTC Mangga Dua North Jakarta
Pluit Junction North Jakarta
Mall Artha Gading North Jakarta
Sports Mall Kelapa Gading North Jakarta
Kelapa Gading Trade Center North Jakarta
Mall of Indonesia North Jakarta
Emporium Pluit North Jakarta

12
La Piazza North Jakarta
Mangga Dua Square North Jakarta
Koja Trade Mall North Jakarta
Cipinang Indah Mall East Jakarta
Kramat Jati Indah Plaza East Jakarta
Ramayana Kramat Jati Indah East Jakarta
Cibubur Junction East Jakarta
Cibubur Square East Jakarta
Pusat Grosir Cililitan East Jakarta
Pusat Grosir Jatinegara East Jakarta
Tamini Square East Jakarta
MT Haryono Square East Jakarta
Pulogadung Trade Center East Jakarta
Mal Graha Cijantung East Jakarta
Arion Mall East Jakarta
Buaran Plaza East Jakarta
Rawamangun Square East Jakarta
Arion Plaza East Jakarta
Ramayana Perumnas Klender (Dibuka Tahun 2013) East Jakarta
Mall CitraGran East Jakarta
Lindeteves Trade Center West Jakarta
Glodok Plaza West Jakarta
Harco Glodok West Jakarta
Lokasari Plaza West Jakarta
Mall Ciputra (d/h Citraland Mall) West Jakarta
Mall Daan Mogot West Jakarta
Mall Puri Indah West Jakarta
Mall Taman Anggrek West Jakarta
Slipi Jaya Plaza West Jakarta
Mall Taman Palem West Jakarta
Lippo Mall Puri West Jakarta
Central Park Jakarta West Jakarta
Seasons City West Jakarta
PX Pavillion @ St. Moritz West Jakarta
Mal Kalibata South Jakarta
Kalibata City Square South Jakarta
Cilandak Town Square South Jakarta
Mal Cilandak South Jakarta
Bintaro Plaza South Jakarta
Blok M Plaza South Jakarta
Blok M Square South Jakarta
Ciputra World Jakarta South Jakarta
Pasaraya Grande South Jakarta
ITC Fatmawati South Jakarta
ITC Kuningan South Jakarta
Mal Ambassador South Jakarta
Mall Blok M South Jakarta
Pondok Indah Mall I & II South Jakarta

13
Melawai Plaza South Jakarta
Pasaraya Manggarai South Jakarta
Pacific Place South Jakarta
Plaza Semanggi South Jakarta
Setiabudi One South Jakarta
ITC Permata Hijau South Jakarta
Pejaten Village South Jakarta
Gandaria City South Jakarta
Epicentrum Walk Rasuna South Jakarta
Ciputra World Jakarta South Jakarta
Kota Kasablanka South Jakarta
Kuningan City South Jakarta
Poins Square South Jakarta
Lotte Shopping Avenue South Jakarta
Table 2-6 List of hotels in Jakarta NO HOTEL NAME ADDRESS
1 The Sultan Hotel Jl. Jend. Gatot Subroto
2 The Ritz-Carlton Jakarta Jl. Lingkar Mega Kuningan Kav. E1 No. 1
3 The Park Lane Jl. Casablanca Kav. 18,
4 The Dharmawangsa Jl. Brawijaya Raya No. 26,
5 The Aryaduta Suite Hotel Semanggi Jl. Garnisun Dalam 8,
6 Sheraton Media Jl. Gunung Sahari Raya No. 3,
7 Shangri-La Jakarta Kota BNI, Jl. Jend Sudirman Kav. 1,
8 Sari Pan Pacific Jl. MH. Thamrin,
9 Santika Jakarta Jl KS. Tubun No. 7 – Slipi,
10 Sahid Jaya Jakarta Jl. Jend. Sudirman No. 86,
11 Nikko Jakarta Jl. MH. Thamrin No. 59,
12 Mulia Jl. Asia Afrika,
13 Millennium Sirih Jl. KH. Fakhrudin No. 3,
14 Mercure Slipi Jl. Letjend. S. Parman,
15 Manhattan Hotel Jl. Prof. Dr. Satrio Kav. 19
16 Le Meridien Jl. Jend. Sudirman Kav. 18 – 20,
17 JW Marriott Hotel Jl. Lingkar Mega Kuningan Kav. E 1.2, No. 1 & 2,
18 Inter-Continental MidPlaza Jl. Jend. Sudirman Kav. 10 – 11,
19 Hotel Indonesia Kempinski Jakarta Jl. MH. Thamrin No. 1,
20 Grand Hyatt Jl. MH. Thamrin Kav. 28 – 30,
21 Gran Melia Jakarta Jl. HR. Rasuna Said Kav. X-O,
22 Four Seasons Jl. HR. Rasuna Said,
23 Crowne Plaza Jl. Gatot Subroto Kav. 2 – 3,
24 Borobudur Hotel Jl. Lapangan Banteng Selatan,
25 Alila Jakarta Jl. Pecenongan Kav. 7 – 17,
26 Alila Jakarta Jl. Prapatan 44 – 48,
27 Puri Denpasar Hotel – Jakarta Jl. Denpasar Selatan No.1, Kuningan – Jakarta Selatan
28 Mercure Rekso Jl. Hayam Wuruk No. 123,
29 Mercure Convention Center Taman Impian – Ancol,
30 Menara Peninsula Jl. Letjend. S. Parman Kav. 78,
31 Le Grandeur Jl. Mangga Dua Raya,

14
32 Kartika Chandra Jl. Gatot Subroto Kav. 18 – 20,
33 Kaisar Jl. PLN – Duren Tiga Raya,
34 Jayakarta Hotel Jl Hayam Wuruk No. 126,
35 Gran Mahakam Jl. Mahakam I No. 6,
36 Golden Jl. Gunung Sahari No. 46,
37 Ciputra Jl. Letjend. S. Parman,
38 Cempaka Jl. Letjend. Suprapto,
39 Batavia Hotel Jl. Kalibesar Barat No. 44 – 46,
40 Atlet Century Park Jl. Pintu Satu Senayan,
41 Aston Rasuna Residence Taman Rasuna - Jl. HR. Rasuna Said,
42 Aston Atrium Hotel Jl. Senen Raya No. 135,
43 Ambhara Jl. Iskandarsyah Raya,
44 Acacia Jl. Kramat Raya No. 73 – 81,
45 Wisata International Jl. MH. Thamrin,
46 Willtop Jl. P. Jayakarta No. 44,
47 Twin Plaza Jl. Letjend. S. Parman,
48 Treva International Jl. Menteng Raya No. 33,
49 Sentral Jl. Pramuka Raya Kav. 63 – 64,
50 Patra jasa Jl. Jend. A. Yani No. 2,
51 Pardede Jl. Raden Saleh I No. 9,
52 Paragon Jl. KH. Wahid Hasyim No. 29,
53 Marcopolo Jl. Teuku Cik Ditiro No. 19,
54 Maharani Jl. Mampang Prapatan – Buncit Raya.,
55 Sabang Metropolitan Jl. H. Agus Salim No. 11,
56 Quality Hotel Jakarta Jl. P. Jayakarta No. 70,
57 Putri Duyung Taman Impian – Ancol,Jl. Lodan Timur No. 7,
58 Ibis Slipi Jl. Letjend. S. Parman Kav. 59,
59 Ibis Mangga Dua Jl. P. Jayakarta No. 73,
60 Ibis Kemayoran Jl. Bungur Besar Raya 79 – 81,
61 Grand Ancol Jl. RE. Martadinata No. 1,
62 Graha Menteng Jl. Matraman Raya 21,
63 Gading Indah Jl. Pegangsaan Dua No. 10 - K,
64 Emeralda Jl. Kebon Jeruk XVIII/6,
65 Danau Sunter Jl. D. Permai Raya Blok C-1,
66 Classic Jl. H. Samanhudi 43 - 45,
67 Maharadja Jl. Kapten P. Tendean No. 1,
68 Kemang Hotel Jl. Kemang Raya No. 2 – H,
69 Kebayoran Hotel Jl. Senayan 87 – Kebayoran Baru,
70 Ibis Tamarin Jl. KH. Wahid Hasyim No. 77,
71 Cipta 2 Jl. Mampang Prapatan 1 A,
72 Cikini Sofyan Jl. Cikini Raya,
73 Cemara Jl. Cemara No. 1, Menteng,
74 Bumi Karsa Bidakara Jl. Gatot Subroto Kav. 71 - 73,
75 Bintang Griyawisata Jl. Raden Saleh No. 16,
76 Betawi Sofyan Jl. Cut Mutiah,
77 Alpine Jl. Gunung Sahari Raya 35,
78 Arcadia Jl. KH. Wahid Hasyim 114,
79 Surya Baru Jl. Batu Ceper No. 11A,

15
80 Surya Jl. Batu Ceper No. 44 – 46,
81 Sriwijaya Jl. Veteran Raya No. 1,
82 Setiabudi Hotel Jl. Setiabudi Raya No. 24,
83 Sanno Jl. Pluit Raya Selatan,
84 Royal Regal Jl. Mangga Besar VII / 25 – 27,
85 Royal Jl. Ir. H. Juanda,
86 Prinsen Park Jl. Mangga Besar IX/ 83 – 85,
87 Pecenongan City Jl. H. Samanhudi No. 2,
88 Nirwana Jl. Otto Iskandardinata,
89 Metropole Jl. Pintu Besar Selatan No. 38,
90 Menteng II Jl. CIkini Raya 103,
91 Menteng I Jl. RP. Suroso No. 28,
92 Melawai Hotel Jl. Melawai Raya No. 18 – 20, Tel: 62-21 270 0408
93 Luxe Hotel Jl. KH Wahid Hasyim No. 85 Jakarta Pusat 10350
94 Jatra Hotel Jl. Bandengan Raya, Jakarta Utara.
95 Indra International Jl. KH. Wahid Hasyim No. 63, Tel: 62-21 315 2858
96 Imperium Hotel Jl. Pecenongan Raya, Jakarta Pusat, Tel: 62-21 344 8601
97 Gren Alia Cikini Jl. Cikini Raya No. 46,
98 Djakarta Jl. Hayam Wuruk No. 35,
99 Dias Hotel Jl. Kran V / 20 Jakarta Pusat,
100 Bumi Johar Jl. Johar No. 17 – 19,
101 Atlantik Jl. Salemba Raya No. 26,
102 Astika Jl. Mangga Besar Raya 76,
103 Alia Pasar Baru Jl. Pasar Baru Selatan No. 13,
104 Alia Matraman Jl. Matraman Raya No. 224,
105 Alia Cikini Jl, Cikini Raya No. 32,
106 Yusenny Jl. Senayan Kebayoran Baru,
107 Tugu Asri Jl. Jatibaru No. 7 – 8,
108 Travel Jl. Mangga Besar VIII / 21,
109 Titanius (Taurus) Jl. Kebon Sirih Barat Dalam I / 11,
110 Tiga Enam (36) Jl. Jaksa No. 36,
111 Tebet Sofyan Jl. Prof. DR. Supomo No. 23,
112 Tator Jl. Jaksa No. 37,
113 Senen Indah Jl. Bungur Besar No. 157,
114 Salemba Indah Jl. Paseban No. 20 A – B,
115 Rose Marla Jl. Kb. Sirih Barat Dalam IX / 8,
116 Rifa Jl. Kebon Sirih Barat Dalam, Jakarta Pusat.
117 Rico Jl. Kebon Sirih Dalam 51,
118 Rensa Sofyan Jl. Duren Sawit Raya No. 108,
119 Prapanca Indah Jl. Prapanca Raya No. 30 – 31,
120 Pondok Wisata 16 Jl. Kebon Sirih Barat Dalam 16,
121 Petamburan II Jl. KS Tubun No. 10A,
122 Petamburan Hotel Jl. KS Tubun No. 15 – 17,
123 Peninsula Jl. Mangga Besar Raya 60,
124 Pendawa Jl. Kebon Sirih Dalam X / 16,
125 Pasar Baru Hotel Jl. Pasar Baru Selatan No. 6,
126 Nusantara Jl. KH. Mas Mansyur No. 36,
127 Norbek Jl. Jaksa No. 14,

16
128 Nick Corner Jl. Jaksa No. 16,
129 New Melati Harmoni Jl. Hayam Wuruk No. 1,
130 Mirah Jl. Gunung Sahari XII / 18,
131 Megah International Jl. Bungur Besar Raya 31,
132 Mega Matra Jl. Matraman Raya No. 115,
133 Margot Jl. Jaksa No. 15 C,
134 Lia Jl. Kebon Sirih Barat VIII / 47,
135 Kresna Jl. Kebon Sirih Timur No. 175,
136 Kebon Sirih Jl. Kebon Sirih Barat I / 10,
137 Karya Bahana Jl. Jaksa No. 32 – 34,
138 Grand Paripurna Jl. Hayam Wuruk No. 25,
139 GRAHA WISATA TMII, Komp. TMII Komp. Taman Mini Indonesia Indah
140 GRAHA WISATA RAGUNAN Komp. Olahraga Jaya Raya Ragunan
141 GRAHA WISATA KUNINGAN Jl. HR. Rasuna Said Kuningan
142 Esha Jl. Kebon Sirih Barat X / 4,
143 Djody Jl. Jaksa No. 27 – 29,
144 Destania Jl. Kebon Sirih Barat IX / 19,
145 Delima Jl. Jaksa No. 5,
146 Borneo Jl. Kebon Sirih Barat Dalam 37,
147 Bloom Steen Jl. Kebon Sirih Timur Dalam 174,
148 Bintang Kejora Jl. Kebon Sirih Barat No 52,
149 Bintang Baru Jl. Dr. Sutomo No. 9,
150 Banyuwangi Sintera Jl. H. Samanhudi No. 30 – 40,
Table 2-7 List of apartments in Jakarta
NO Property Name Address
1 Sahid Sudirman Residence Sahid Jaya Hotel Complex Jl. Jend. Sudirman 86
Jakarta
2 The Summit Apartment Jl. Boulevard Sentra Kelapa Gading, Jakarta Utara
3 The residence at Sultan hotel Jl. Jend. Gatot Soebroto Jakarta
4 The Plaza Residences Hotel Intercontinental Midplaza Lower Ground fl Jl.
Jend Sudirman kav. 10-11 Jakarta
5 The Peak residence Jl. Setiabudi Raya No. 9 Jakarta
6 The Pakubuwono View Jl. Pakubuwono VI. No. 70 Kebayoran Baru, Jakarta
7 The Pakubuwono Residence Jl. Pakubuwono VI No. 68 Kebayoran Baru, Jakarta
Selatan
8 The Mayflower jakarta Marriot Executive Apartment Jl. Jend Sudirman Kav.
76-78 Jakarta
9 The Kuningan Suites Jl. Setiabudi utara Jakarta Selatan
10 The Capital Residence SCBD lot 24 Jl. Jend. Sudirman Kav.52-53 Jakarta
11 The Belleza Permata Hijau Arteri Permata Hijau Jl. Letjend Soepono No. 34
Jakarta
12 The Bellagio Parkway residence Kawasan Mega Kuningan Kav. E4 no.3 Kuningan
Timur Jl. Prof. Dr. Satrio Jakarta Selatan
13 The Ascott jakarta The Golden Triangle Jl. Kebon Kacang Raya No. 2
Jakarta Pusat
14 Taman Puri Permata Hijau Town House Jl. Biduri No. 1 Blok P Komp. Permata Hijau, Jakarta
Selatan
15 Taman Anggrek Condominium Mall Taman Anggrek Lt. 6 Jl. Letjend S. Parman
Kav.21 Jakarta Barat
16 Sommerset Berlian Jakarta Jl. Permata Belian V, Permata hijau Jakarta

17
17 Spring Hill Golf Redidence Jl. Benyamin Suaeb Blok D7 Kemayoran, Jakarta
18 Slipi Apartment Jl . Letjend S. Parman Kav. 22-24 Jakarta
19 Simprug Indah Jl. Teuku Nyak Arif, Arteri Simprug, Jakarta
20 Shangri-La Residence Jl. Jend. Sudirman Kav.1 Jakarta
21 Setiabudi Residence Jl. HR. Rasuna Said Kav. 62 Jakarta
22 Setiabudi Apartment Jl. RS. Aini Karet Setiabudi Jakarta
23 Puri Casablanca Apartment Jl. Puri Casablanca No. 1 Kuningan, Jakarta
24 Puri Botanical Residence Jl. Raya joglo no. 48 Jakarta
25 Pondok club Villa Jl. TB. Simatupang Cilandak, Lebak Bulus, Jakarta
26 Plaza Senayan Apartment Jl. Tinju No. 1 Pintu I, Gelora Bung Karno, jakarta
27 Permata Gandaria Apartment Jl. Taman Gandaria No. 88 Jakarta
28 Pavilion Executive Residence
Apartment
Jl. KH Mas Mansyur Kav. 24 Karet Tengsin, Jakarta
29 Park Royal Executive Suites Jl. Jend. Gatot Soebroto Kav. 35-39 Jakarta
30 Park Avenue Suites Setiabudi Apartment Jl. RS. Aini karet Setiabudi Jakarta
31 Pasadenia Apartment Jl. Pacuan Kuda Raya No. 27 Pulomas, Jakarta
32 Palm Court Apartment Jl. Jend. Gatot Soebroto Kav. 26-27 Jakarta
33 Oakwood Premier Cozmo Apartment Jl. Lingkar Mega Kuningan Blok E4.2 no.1 Jakarta
Selatan
34 Menteng Regency Apartment Jl. RP. Soeroso No. 10-12 Gondangdia Lama, Jakarta
Pusat
35 Menteng Prada Apartment Jl. Pegangsaan Timur 15A Jakarta
36 Hampton's Park Jl. Terogong Raya Jakarta Selatan
37 Marbela Kemang Residence Kemang Apartement Jl. Bangka Raya No. 7 Jakarta
Selatan
38 Mampang Arcadia Jl. Loka Indah Kav.1 Warung Buncit Raya
39 Kintamani Kondominium Jl. Prapanca Raya No.1 Jakarta
40 Kempinski Apartment Jl. MH. Thamrin No. 1 Jakarta
41 Kemang jaya Apartment Jl. Kemang Selatan VIII Jakarta
42 Kemang Club Villas Jl. Kemang Selatan I, Jakarta
43 Istana Sahid Apartment Jl. Jend. Sudirman No. 86 Mezzaine fl
44 Golfhill Terrace Apartment Jl. Metro Kencana IV No. 7 Pondok Indah, Jakarta
Selatan
45 Garden Wing Service Apartment (Hotel Borobudur, Jakarta) Jl. Lapangan Banteng
Selatan No. 1
46 Four Seasons Residences Jl. Setiabudi Tengah Jakarta
47 Eksekutif Menteng Apartment Jl. Pegangsaan Barat Kav. 6-12 Menteng, Jakarta
48 Executive Paradise Jl. Pangeran Antasari Cilandak, Jakarta
49 Essence of Dharmawangsa Residence Jl. Dharmawangsa X No. 86 Kebayoran Baru, Jakarta
50 Emerald Apartment Jl. TB Simatupang Kav. 20 Cilandak, Jakarta
51 Cilandak Apartment Jl. TB Simatupang Cilandak Barat, Jakarta
52 Casablanca Apartment Jl. Casablanca kav. 12 Jakarta
53 Casa Royal Town House Jl. Asem II, Cipete Selatan Jakarta
54 Bumimas Jakarta Apartment Jl. Terogong Raya No. 18 Jakarta
55 Brawijaya Apartment Jl. Brawijaya XII/1 Blok P Jakarta
56 Batavia Apartment Jl.KH. Mas Mansyur Kav. 126 Jakarta
57 Aston International Wisma Staco Lt. 3 Suite 100 Jl. Casablanca Kav. 18
Jakarta
58 Aston Rasuna Residence Tower A, Lower Ground Komp. Apartment Taman
Rasuna Jl. HR. Rasuna Said

18
59 Ampera Town houses Jl. Kemang Raya no. 2A Jakarta
60 Allson residences at Mitra Oasis Jl. Senen Raya no. 135 - 137 Jakarta Pusat
61 Aditya mansions Jl. Adityawarman Raya no. 38A Kebayoran Baru
Jakarta Selatan
Table 2-8 List of hotels in Jakarta
Property Name Address
1 RS Royal Taruma Jl. Daan Mogot No.34 Grogol
2 RS. Siloam Graha Medika Jl. Raya Perjuangan Kav. 8 Kebon Jeruk Jakarta Barat
11530
3 RS. Pelni Petamburan Jl. K. S. Tubun No. 92 - 94
4 RSIA. Hermina Daan Mogot Jl. Kintamani Raya No. 2 Perumahan Daan Mogot
Baru Jakarta Barat
5 RS. MH. Thamrin Cengkareng Jl. Daan Mogot Km. 17 Cengkareng
6 RS. Medika Permata Hijau Jl. Raya Kebayoran Lama No. 64 Jakarta
7 RS. Sumber Waras Jl. Kyai Tapa No. 1 Grogol Jakarta Barat 11440
8 RS. Kanker "DHARMAIS" * Jl. Let. Jend. S. Parman Kav. 84 - 86, Jakarta Barat
11420
9 RS Puri Mandiri Kedoya Jl. Kedoya Raya No.2 Kebun Jeruk
10 MH Thamrin UPK SERDANG Jl. H. Ung E 71 No. 2, Kemayoran
11 RS Bunda Menteng Jl. Teuku Cik Ditiro No.28 Menteng
12 RS Islam Jakarta Jl. Cempaka Putih Tengah I/II
13 RS. Abdi Waluyo Jl. HOS. Tjokroaminoto No. 31-33 Menteng
14 RS. Husada Jl. Raya Mangga Besar No. 137 - 139
15 RS. Khusus THT - Bedah
PROKLAMASI
Jl. Proklamasi No. 43 Jakarta Pusat 10320
16 RS. Kramat 128 Jl. Kramat Raya No. 128
17 RS. Menteng Mitra Afia Jl. Kalipasir No. 9 Cikini
18 RS. MH. Thamrin Internasional
Salemba
Jl. Salemba Tengah No. 26 -28
19 RS. Pertamina Jaya Jl. A. Yani No. 2
20 RS. PGI Cikini Jl. Raden Saleh No. 40
21 RS. Saint Carolus Jl. Salemba Raya No. 41
22 RSB. Budi Kemuliaan Jl. Budi Kemuliaan No. 25 Jakarta 10110
23 RSIA. "TAMBAK" Jl. Tambak No. 18
24 RSPAD Gatot Soebroto "Pav Anak" Jl. Abdul Rachman Saleh No 24
25 RSPAD Gatot Soebroto "Pav
Darmawan"
Jl. Abdul Rachman Saleh No.24
26 RSPAD Gatot Soebroto "Pav Iman
Sudjudi"
Jl. Abdul Rachman Saleh No 24
27 RSPAD Gatot Soebroto "Pav Kartika" Jl. Abdul Rachman Saleh No 24
28 RS. Medistra Jl. Jen. Gatot Soebroto Kav. 49 Jakarta Selatan
29 RS Tebet Jl. MT Haryono No.8 Tebet
30 RS Budhi Jaya Jl. Dr Saharjo No 120 Jakarta Selatan
31 RS Jakarta Jl. Jend. Sudirman Kav 49 Jakarta
32 RS. Tria Dipa Jl. Raya Pasar Minggu No. 3 A Pancoran
33 RS. Pusat Pertamina Jl. Kyai Maja No. 43, Kebayoran Baru
34 Sudirman Medical Center Jl. Jend. Sudirman Kav. 25 Jak - Sel
35 Pertamina Medical Center Jl. Kyai Maja No. 43, Gedung H Lantai I, Kebayoran
Baru

19
36 RS. Siaga Raya Pejaten Barat Kav. 4 - 8, Pasar Minggu
37 RS. Pondok Indah Jl. Metro Duta Kav. UE Pondok Indah
38 RS. "AGUNG" Manggarai Jl. Sultan Agung No. 67, Pasar Rumput, Manggarai,
Jakarta Selatan
39 RSB. "ASIH" Jl. Panglima Polim No. 34 Jakarta Selatan
40 RS. MMC Jl. H. R. Rasuna Said, Kav. C-21, Jakarta
41 RS. "ZAHIRAH" Jl. Sirsak No. 21, Jagakarsa, Jakarta Selatan
42 RS. MATA Prof. DR. Isak Salim "AINI" Jl. H. R. Rasuna Said, Kuningan, Jakarta Selatan
43 RSIA. "YADIKA" Kebayoran Lama Jl. Ciputat Raya No. 5, Kebayoran Lama, Jakarta
Selatan 12240
44 RS. PRIKASIH Jl. Raya RS. Fastmawati No. 74, Pondok Labu,
Cilandak
45 RS. Hospital Cinere Jl. Maribaya No. 1 Puri Cinere
46 RS. Gandaria Jl. Gandaria Tengah II, No 12 - 14 Kebayoran Baru
47 RS. Setia Mitra Jl. RS. Fatmawati No. 80-82
48 RS. Marinir Cilandak Jl. Cilandak KKO
49 RS Khusus THT Ciranjang Jl. Ciranjang No 22-22 Kebayoran Baru
50 Brawijaya Women and Children
Hospital
Jl. Taman Brawijaya No. 1 Cipete Utara
51 RS Muhammadiyah Taman Puring Jl. Gandaria 1/20 Kebayoran Baru
52 RSPAD Gatot Soebroto Askes dan Non
Pav
Jl. Abdul Rachman Saleh 24
53 RSIA. Hermina Jatinegara Jl. Jatinegara Barat No. 126 Jakarta Timur
54 RS. Omni Medical Center Jl. Pulomas Barat VI No. 20 Jakarta 13210
55 RS. Islam Pondok Kopi Jl. Raya Pondok Kopi
56 RS. F. K. UKI Cawang Jl. May. Jen Soetoyo Cawang Jakarta Timur
57 RS. Mediros Jl. Perintis Kemerdekaan Kav. 149, Jakarta Timur
58 RS. Harapan Jayakarta Jl. Bekasi Timur Raya Km. 18 No. 6, Pulogadung
Jakarta Timur
59 RS. Kartika Pulo Mas Jl. Pulomas Timur K No. 2, Jakarta Timur 13210
60 RS. Dharma Nugraha Jl. Balai Pustaka Baru No. 19, Rawamangun, Jakarta
Timur 13220
61 RS. MH. Thamrin Pondok Gede Jl. Raya Pondok Gede No. 23 - 25, Kramat Jati
62 RS. Mitra Internasional Jatinegara Jl. Raya Jatinegara Timur No. 87, Jakarta Timur
63 RS. Harapan Bunda Jl. Raya Bogor Km. 22 No. 44, Jakarta Timur
64 RS. "HARUM" Jl. Tarum barat, Kalimalang, Jakarta Timur
65 RS. "YADIKA" Pondok Bambu Jl. Pahlawan Revolusi No. 47, Pondok Bambu, Jakarta
Timur
66 RS. Haji Jakarta Jl. Raya Pondok Gede. Jakarta Timur
67 RSIA. Evasari Jl. Rawamangun No. 47
68 RS Harapan Bunda Jl. Balai Pustaka Baru No. 29-31 Rawamangun
69 RS Bina Waluya Jl. TB Simatupang No. 71 Jakarta Timur
70 RS Bunda Aliyah Jl. Pahlawan Revolusi No.100 Pondok Bambu, Jakarta
Timur
71 RS Polri dr. Sukamto Jl. Raya Bogor Kramat Jati Jakarta Timur
72 RUSPAU Antariksa Jl. Merpati No.2 Lanud Halim Perdana Kusuma
73 RSIA. Hermina Podomoro Jl. Danau Agung 2 Blok E3
74 RS. Pluit Jl. Raya Pluit Selatan No. 2
75 RS. Satya Negara Sunter Jl. Sunter Agung Utara Raya Blok A No. 1
76 RS. Mitra Keluarga Kemayoran Jl. Landas Pacu Timur Kemayoran Jakarta 10630
77 RS. Medika Griya Sunter Podomoro Jl. Danau Sunter Utara, Perumahan Nirwana Sunter

20
Asri
78 RS. Gading Pluit Jl. Boulevard Timur Raya, Kelapa Gading
79 RS. Pantai Indah Kapuk Jl. Pantai Indah Utara No. 3, Pantai Indah Kapuk,
14460
80 RS. Mitra Keluarga Kelapa Gading Jl. Bukit Gading Raya Kav. 2, Kelapa Gading Permai
81 RS. Sukmul Jl. Tawes No. 18-20 Tanjung Priok
82 RS Port Medical Center Jl. Enggano No.10 Tanjung Priok
83 RS Family Jl. Pluit Mas I No. 2A - 5A
2.3 List of this properties under the Study
This Study focused on four types of buildings—complex commercial facilities, hotels, office
buildings, and industrial facilities (factories).
2.3.1 Complex commercial facilities
The buildings under study are outlined as follows:
Table 2-9 Outline complex commercial facilities
Total floor area 263,226 m2 (rentable area: 141,930 m
2)
Intended use / number of
stories
Commercial facilities / 3 stories below ground and 8 stories
above ground
Year of completion West Mall: April 2007; East Mall & Skybridge: August 2007
Power demand 14,874kW (monthly average for 2013)
Annual power consumption 55,579,200 kWh / year (2013)
2.3.2 Hotels
Hotel buildings are outlined as follows:
Table 2-10 Outline of hotel buildings
Total floor area Not known
Intended use / number of
stories
Hotels
Ramayana Wing: 8 stories above ground; Ganesha Wing: 15
stories above ground
Deluxe Room & Grand Deluxe Room: 159 rooms ,
Presidential Suite: 1 room, Diplomatic Suite: 4 rooms ,
Salon Suite: 6 rooms, Executive Grand Deluxe: 90 rooms ,
Grand Deluxe: 68 rooms, Deluxe Room: 120 rooms
Year of completion Completed in 1962; Kempinski Hotel SA started operation upon
re-development in 2004.
Power demand -
Annual power consumption -
2.3.3 Industrial facilities (e.g. factories)
Industrial facilities are outlined as follows:

21
Table 2-11 Outline of industrial facilities (factories)
Total floor area 600,000 m2
Intended use / number of
stories
Spinning mills with an integrated process for raw cotton to
dyeing to final products processing
Year of completion -
Power demand -
Annual power consumption -
2.3.4 Office buildings
(1) Office building A
The office building is outlined as follows:
Table 2-12 Outline of office building A
Total floor area
Total floor area: 50,000 m2
Air-conditioned area: 30,000 m2 (tenant section: 25,000 m
2,
public section: 5,000 m2)
Intended use / number of
stories 25 stories
Year of completion 1994
Electricity dem -
Annual power consumption 10,282,896 kWh
(2) Office buildings B
The buildings is outlines as follows:
Table 2-13 Outline of office building B
Total floor area 32,159 m2 (parking lots: 19,898 m
2)
Intended use / number of
stories Offices: 19 stories above ground
Year of completion January 1992
Electricity dem 2,633 kW (monthly average for 2013)
Annual power consumption 9,678,100 kWh / year (2013)

22
3. Energy-saving technologies and methodologies introduced
3.1 Complex commercial facilities
These facilities are located at Monumen Selamat Datang on Jakarta's main street Thamrin Street,
facing a rotary. The premises are shared by offices, hotels, and apartments.
Commercial buildings are composed of three sections--West Mall, East Mall, and Skybridge. West
Mall, East Mall, and Skybridge have 9-story, 8-story, and 5-story buildings, respectively.
The facilities are operated under the following time schedule:
・ Operation Hours: 8: 00 - 22: 00
・ Service Hours-: 10: 00 - 22: 00/0: 00/2: 00
For this Report, our on-site survey was targeted on the following points:
(1) Introduction of an LED system as parking-lot lighting; and
(2) Introduction of a solar power generation system.
(1) Outline of apparatuses
Figure 3-1 shows the share of apparatuses in total energy consumption. Tenants' equipment
accounts for 43.7% of the total consumption, followed by chillers (31.9% ). With tenants'
equipment excluded, chillers represent about 57% . When VAC is included, air-conditioning
apparatuses have a larger share in electricity consumption.
Figure 3-1 Share of apparatuses in the total amount of electricity used
Figure 3-2 shows provides monthly data on the amount of electricity purchased and generated
during the 2011-2013 period. Power consumption decreased throughout this period. Since February
2011, cost reduction efforts have been made by running LNG-based electric generators during
high-rate hours. On the whole, LNG consumption changes in line with power generation.

23
Figure 3-2 Monthly amount of electricity purchased, amount of electricity generated, and LNG
consumption (2011-2013)
Figure 3-3 provides monthly data on energy cost during the 2011-2013 periods. Expenditures were
relatively small in 2012 although they fluctuated from month to month. Expenditures were greater in
2013 than in 2011, probably due uto raised electricity rates.
Figure 3-4 monthly data on power consumption by apparatus during the 2011-2013 period. The
figure shows a continuous decrease in power consumption during the period despite monthly
fluctuations. This indicates that the energy-saving policy has been and will be effective unless lease
contracts with tenants are terminated on a large scale in the future and that, specifically; tenants have
contributed substantially to the reduction in electricity consumption. In addition, Figure 3-3 and
Figure 3-4 show that energy cost rose during the 2011-2013 period despite a decrease in electricity
consumption, indicating that users had to pay more due to a higher unit energy price. Under such
situation, benefits of energy-saving efforts would be canceled by higher energy unit prices, which
would be a real headache to property owners.

24
Figure 3-3 Monthly energy cost (2011-2013)
Figure 3-4 Monthly power consumption by apparatus (2011-2013)

25
Table 3-1 shows the composition of air-conditioning refrigerators (West Mall).
Both West Mall and East Mall are furnished with 2,000 refrigerator ton class apparatuses. The
refrigerator efficiency is 0.589 kW/TR, sufficiently low compared to the latest models. The
efficiency may be further decreasing as they degrade with age. Because air-conditioning refrigerators
represent a substantial portion of power consumption by a building, the replacement with the lest
models will significantly contribute to reduction in power consumption.
Table 3-1 Specifications for air-conditioning refrigerators in West Mall DATA UNIT CHILLER 1 CHILLER 2 CHILLER3
SYSTEM
INFORMATION
Refrigerant R-134a R-134a R-134a
Capacity TR 2090 2090 2090
Gear Code EG EG EG
Liquid Type Water Water Water
Starter Type Auto Transformer
Starter 65%
Auto Transformer
Starter 65%
Auto Transformer
Starter 65%
Kilowatts Input kW 1231 1231 1231
NAME PLATE
INFORMATION
Motor Code 5DG 5DG 5DG
Voltage V 3300 3300 3300
Phases 3 3 3
Frequency Hz 50 50 50
LRA A 1415 1415 1415
FLA A 245 245 245
Inrush Ampere A 599 599 599
DESIGN LOAD EVAP. COND. EVAP. COND. EVAP. COND.
Passes 2 2 2
Design Working
Press.
Fouling Factor 0.0176 0.0440 0.0176 0.0440 0.0176 0.0440
Pressure Drop 98.2 103.0 98.2 103.0 98.2 103.0
Nozzle
Arrangement In B R B R B R
Nozzle
Arrangement Out C S C S C S
Leaving
Temperature ℃ 6.7 35.2 6.7 35.2 6.7 35.2
Return
Temperature ℃ 12.2 30.0 12.2 30.0 12.2 30.0
Flow Rate GPM 5016.0 6270.0 5016.0 6270.0 5016.0 6270.0
Number of Tube 1275.0 1544.0 1275.0 1544.0 1275.0 1544.0

26
Table 3-2 shows the composition of air-conditioning refrigerators (East Mall).
Table 3-2 Specifications for air-conditioning refrigerators in East Mall DATA UNIT CHILLER 1 CHILLER 2 CHILLER 3
SYSTEM
INFORMATION
Refrigerant R134a/1481kg R134a/1481kg R134a/1481kg
Capacity TR 2000 2000 2000
Gear Code EG EG EG
Liquid Type Water Water Water
Starter Type Auto Transformer
Starter 65%
Auto Transformer
Starter 65%
Auto Transformer
Starter 65%
Kilowatts Input kW 1178 1178 1178
NAME PLATE
INFORMATION
Motor Code
Voltage V 3300 3300 3300
Phases 3 3 3
Frequency Hz 50 50 50
LRA A 1415 1415 1415
FLA A 245 245 245
Inrush Ampere A 599 599 599
DESIGN LOAD EVAP. COND. EVAP. COND. EVAP. COND.
Passes 2 2 2 2 2 2
Design Working
Press. 2MPa 2MPa 2MPa 2MPa 2MPa 2MPa
Fouling Factor 0.0176 0.0440 0.0176 0.0440 0.0176 0.0440
Pressure Drop 98.2 103.0 98.2 103.0 98.2 103.0
Nozzle
Arrangement In B R B R B R
Nozzle
Arrangement Out C S C S C S
Leaving
Temperature ℃ 6.7 35.2 6.7 35.2 6.7 35.2
Return
Temperature ℃ 12.2 30.0 12.2 30.0 12.2 30.0
Flow Rate GPM 4800.0 6000.0 4800.0 6000.0 4800.0 6000.0
Number of Tube 181.0 260.0 181.0 260.0 181.0 260.0
As part of their efforts to reduce cost against rising unit electricity prices, these facilities operate
emergency electric generators during peak consumption hours. In the future, they plan to introduce a
co-generation system for emergency electric generators (by operating during regular hours and
introducing refrigerator based on exhaust heat) in an effort to improve total efficiency and lower
power peaks by using exhaust heat from electric generators (more details to be released in a
separately report).

27
(2) Local situation
A walk-through survey highlighted the following points:
1)Introduction of a solar power generation system
An on-site survey was conducted to determine the feasibility of installation of a solar power
generation system on the rooftop of each building (West Mall, East Mall, and Skybridge). The
findings of the survey are provided below.
Figure 3-5 through Figure 3-10 show candidate installation area of each facility. West Mall and
Skybridge have common folded-plate roofs, which provide will be technically more compatible with
the instruction of solar batteries. For Skybridge, however, the installation site must be selected with
care in order to counter the effect of the shade of heliports, piping, and other structures and the
effects of exhaust air released from air ducts. In addition, building owners asked us whether a solar
battery can be installed on a top light to prevent increasing loads on the indoor air-conditioning
system caused solar heat coming through the top light. Some top lights were found to be wrapped
with a cover as shown in Photo 2-x. Solar batteries provide light insulation and heat insulation. We
will consider including this area among our candidate sites. Meanwhile, to install a solar battery on
the top light, we need to develop a method that takes load resistance and construction safety into
consideration. This issue will be discussed in more detail will owners, subcontractors, and other
stakeholders. The candidate installation area in East Mall consists of top lights and inclined roofs.
We need to also discuss the installation of a solar battery on top light as with West Mall and
Skybridge. On the other hand, no technical issues were identified for the inclined roofs. Figure 3-11
through Figure 3-13 show solar batteries installed on each roof.
As discusses above, it is possible to efficiently use roofs left alone as dead spaces in order to save
energy by installing a renewable energy unit, while at the same time generating heat insulation
effects as needed by the owners. For this reason, these facilities under discussion are appropriate to
introduction of a solar power generation system.

28
Figure 3-5 West Mall (metal-sheet roof) Figure 3-6 West Mall (top-light)
Figure 3-7 Skybridge (landscape) Figure 3-8 Skybridge (top-light)
Figure 3-9 East Mall (top-light) Figure 3-10 East Mall (inclined-roof)
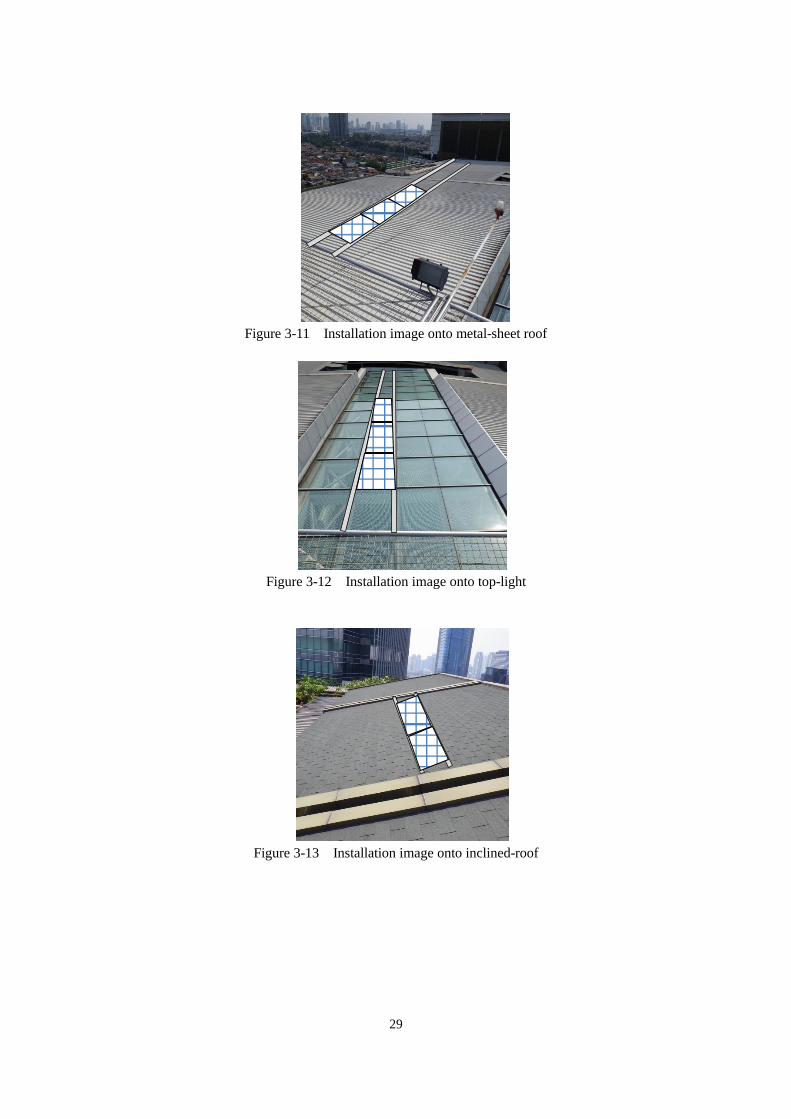
29
Figure 3-11 Installation image onto metal-sheet roof
Figure 3-12 Installation image onto top-light
Figure 3-13 Installation image onto inclined-roof

30
2)Assessing the feasibility of installing new heating source technology
The following points were confirmed in the on-site survey:
Figure 3-14 Turbo chiller
Figure 3-15 Cooling tower
Figure 3-16 Electric generator

31
Figure 3-17 Central monitoring
Figure 3-18 Processed drain water
Figure 3-19 RO membrane equipment

32
Figure 3-20 Electricity intake equipment
Figure 3-21 Oil tank
Figure 3-22 Air-cooling chiller

33
3.2 Hotels
Facing the rotary at Monumen Selamat Datang on Jakarta’s main street Thamrin, the facilities
constitute a five-star hotel. The premises are shared with complex facilities of offices, apartments,
and commercial buildings.
The buildings consist of Ramayana Wing and Ganesha Wing. They accommodate Kempinski
Grand Ballroom, with the total floor area of 3,000 m2, and Bali Room, with a total floor area of
1,000 m2, in addition to restaurants, pools, spas, and other facilities. Our on-site survey focused on
the feasibility of introduction of LED lighting into guestrooms, guestroom passages, and Bali Room.
(1) Outline of apparatuses
The hotel uses electricity as follows:
Figure 3-23 Monthly electricity consumption (from 2012 to 2014)
Electricity consumption is very low in some months probably due to the temporary closure of the
hotel and some other factors. Overall, power consumption largely remained flat at about 1,300,000
kWh a month, from 2012 to 2014. On the other hand, electricity rates were raised by the government
during the same period.
The figures below show flat electricity rates for April during the 2012-2014 periods:
April 2012: 898.1 IDR / kWh
April 2013: 1,175.1 IDR / kWh (up 30.8% year on year)
April 2014: 1,434.8 IDR / kWh (up 22.1% year on year and up 59.8% from 2 years before)

34
(2) Local situation
Our walk-through survey focused on the following sites:
1)Bali Room
Bali Room, with a ceiling 8 meters high and a total floor area of about 1,000 m2, is a ballroom
that can accommodate a large number of guests. The chandelier overhead in the center has 1,000
candle lamps that attract eyes of viewers. In addition, the ceiling is furnished with an LED lighting
unit to demonstrate high production performance. In the Study, we plan to install LED lighting in the
candle lamps.
Figure 3-24 Chandelier of
Bali Room
Figure 3-25 Indirect lighting
of ceiling (Slit part)
Figure 3-26 Indirect lighting
of ceiling (Slit part)
2)Rooms corridor
Since the guest room corridor have intermediate platforms, which need artificial lighting all
through the day. Currently, candle lamps are installed on the walls, and fluorescent lights are
furnished on the ceiling as indirect lighting. In the Study, we plan to introduce LED lighting into the
wall candle lamps in the guestroom passages.
Figure 3-27 Lighting of guest room corridor

35
3)Guest room
The guest room serves as production of lighting which dropped illumination on the whole. The
bedside by the mini halogen lamp and Softone which are arranged at a ceiling and stand lighting, and
the indirect illumination of the ceiling side by a fluorescent light are adopted. This time, we are
planning replacement with LED with the mini halogen lamp arranged in a guest room at a ceiling,
and the bedside and stand lighting by Softone.
Figure 3-28 Bedside stand lighting
(outside view)
Figure 3-29 Bedside stand lighting (LED,
inside view)
Figure 3-30 Stand lighting (outside view) Figure 3-31 Stand lighting (LED, inside view)
Figure 3-32 Bedside stand lighting (Bulb,
inside view)

36
Figure 3-33 Bathroom lighting (outside view) Figure 3-34 Bathroom lighting (indirect)
(Fluorescent lamp, inside view)
4)External lighting
As exterior lighting, the floodlight for illuminate the side wall called Float Lamp to a roof portion is
installed. This time, we are planning replacement Float Lamp with LED in exterior lighting.
Figure 3-35 Exterior lighting of guest room
(from interior)
Figure 3-36 Exterior lighting of guest room
(from roof top)
Figure 3-37 Float Lamp (zoom) Figure 3-38 Float Lamp (from roof top)

37
3.3 Production facility (Factory)
In our field survey, we checked the following:
Figure 3-39 Chiller
Figure 3-40 Cooling tower
Figure 3-41 Electricity intake equipment panel

38
Figure 3-42 Gas boiler
Figure 3-43 Compressor
Figure 3-44 Raw water storage tank

39
Figure 3-45 Drain treatment tank
Figure 3-46 Settlement tank

40
3.4 Office Building
3.4.1 Office Building A
(1) Target Building outline
We discussed the possible capacity expansion of the existing turbo refrigerators and the
replacement of these refrigerators with more efficient models.
Building centrifugal chiller renewal
Figure 3-47 and Figure 3-48 are show the existing air conditioning equipment. For this
building,central air-conditioning system is adopted. In machine room in the basement,there are four
turbo chillers with a total capacity of 1400RT, three with a capacity of 400RT and one with a
capacity of 200RT. On the rooftop, coolong towers are installed. We focused on the renewal chillers,
which are now 21 years old.
Figure 3-47 Centrifugal chiller Figure 3-48 Cooling tower
Floors : 25
Bacement Office and equipment area
1st Floor Bank and Retailarea
2nd to 25th Floors Offices
Office Building A
Construction complession : 1994
Total floor area : 30,000m2
Centifugul chiller
Change in capacity
(400RT 2 units 500RT 2 units)
Cooling tower
Change in operation temp
difference (Δt=5C 7C)

41
(2) Building A/C system renewal plan.
Figure 3-49 System renewal plan
Figure3-49 shows building A/C system renewal plan. The diagram on the left shows the existing
syastem, and diagram on the right shows the system we are planning.
Currentrly there are three 400RT units, and one 200RT unit, making a total of 1400RT. With tihis
plan, the system would be renewed by replacing two of the latest 500RT units.
The remaining one 400RT and one 200RT units would be left in place and used as standby units.
Also, by increasing the cooling water temparature difference from 5 to 7 degrees centigrade
between the new chillers and cooling towers, the amount of cooling water could be reduced, and
therefore, the power consumed by the pumps could be also reduced. Not only could system COP be
improved from the current 4.1 to 5.9, but with connection to a central contoroller,power consumed
for air-conditioning could be monitored. It would also be possible to sort electricity charges
according to area of indoor space.

42
Figure 3-50 Renewal plan
According to information we received from the staff, this building’s weekday cooling peak load is
about 1,000RT. So, we made a renewal plan to combine high-efficiency equipment along with peak
load. The system would be renewal by replacing two of three existing 400RT units by two of the
latest 500RT units. The remaining one 400RT and one 200RT units would be left in place and used
as standby units.
Benefits of A/C system renewal
Figure 3-51 Benefit of A/C system renewal
The figure 3-51 shows of the benefits obtained by renewing the existing air-conditioning.
① By increasing the cooling water temperature difference, power use for the cooling water pump
could be obtained.
② Weekday cooling peak load is 1000RT .so, by installing two chillers, each with a
capacity of 500RT, construction cost would be minimized.
③ BEMS cold be introduced. This would allow monitoring of the operational state of chillers, and
management of energy in real time, from the control room. This means, many tasks now done
manually by operators could be automated.

43
3.4.2 Office buildings B
The building has an electric power capacity of 3,465 kVA under a B3-category contract. PLN’s
electricity meters are monitored on a daily basis. Every transformer is checked for kW and A by the
hour. The electricity meters for tenants are recorded and billed to them on a monthly basis. The
figure below shows annual energy consumption by the building. The two transformers take care of
separate lines. TR1 is dedicated to air-conditioning systems and fire-extinguishing units, which
consume electricity at all times, while TR2 is used for lighting systems, electrical outlets, and other
power systems. When TR1 and TR2 are compared, the air-conditioning systems account for xx% of
the total amount of electricity used by the whole buildings, suggesting that the improved efficiency
of updated air-conditioning systems would effectively reduce CO2 emissions.
Table 3-3 Annual power consumption by transformer (by intended use)
MONTH
kWh MAX.LOAD(kW)
TR1(AC) TR2(LIGHTING)
January 331,300 430,700 2,440
February 342,900 407,100 2,580
March 360,600 428,300 2,650
April 398,500 447,300 2,640
May 395,300 453,100 2,700
June 358,500 432,300 2,600
July 360,800 455,200 2,600
August 342,000 415,800 2,620
September 392,000 441,800 2,650
October 410,700 437,700 2,680
November 371,300 440,600 2,680
December 369,400 454,900 2,750
Total 4,433,300 5,244,800
Figure 3-52 Annual power consumption by transformer (by intended use)

44
This office building is a high-rise structure constructed after the completion of its adjacent office
building. The former was built basically on the same specifications as those used for the latter. For
the existing office building, air-conditioning systems were replaced due to aged deterioration. In
addition, lighting devices were switched from the existing fluorescent lights to Hf lighting devices in
2011 and 2012. A significant reduction in power consumption was achieved because of the reduction
of the number of lighting devices and the replacement for more efficient lighting devices.
For this office building, as well as for the existing office building, we consider replacing the
existing air-conditioning system for a high-efficiency type, introducing LEDs for office lighting, and
reducing the number of lighting devices, in order to achieve more energy-efficient offices.
Table 3-4 Types of air-conditioning systems and a list of lighting devices after replacement
Fl 1985-2011 2012-NOW 1985-2010 2011-NOW
AC TYPE LIGHTING TYPE
PW-30
(30HP)
PW-15
(15HP)
City Multi
(10HP)
TLD2
X 36W
TLD2
X 20W
TLD2
X 32W
TLD2
X 18W
1 2 unit 1 unit 10 unit 132 - 132 -
2 2 unit - 8 unit 288 22 160 10
3 2 unit - 8 unit 288 22 160 10
4 2 unit - 8 unit 288 22 160 10
5 2 unit - 8 unit 288 22 160 10
6 2 unit - 8 unit 288 22 160 10
7 2 unit - 8 unit 288 22 160 10
8 2 unit - 8 unit 288 22 160 10
9 2 unit - 8 unit 288 22 160 10
10 2 unit - 8 unit 288 22 160 10
11 2 unit - 8 unit 288 22 160 10
12 2 unit - 8 unit 288 22 160 10
13 2 unit - 8 unit 288 22 160 10
14 2 unit - 8 unit 288 22 160 10
15 2 unit - 8 unit 288 22 160 10
16 2 unit - 8 unit 288 22 160 10
17 2 unit - 8 unit 288 22 160 10
18 2 unit - 8 unit 288 22 160 10
19 2 unit - 8 unit 288 22 160 10
20 2 unit - 8 unit 288 22 160 10
21 2 unit - 8 unit 288 22 160 10
42 unit 1 unit 170 unit 5,892 440 3,332 200

45
Figure 3-53 Layout of lighting at standard floor (before renewal)
Figure 3-54 Layout of lighting at standard floor (after renewal)

46
Figure 3-55 Monthly data of lighting load every year
Figure 3-56 Monthly data of air-conditioning power load every year
Figure 3-57 Monthly data of electricity consumption every year

47
Figure 3-58 Monthly data of lighting load trend with the passage of time
Figure 3-59 Monthly data of air-conditioning power load with passage of time
Figure 3-60 Monthly data of electricity consumption with passage of time

48
Figure 3-61 Air conditioner layout diagram
This building uses a multi-purpose air-conditioning system for stores, with indoor units embedded
in the ceiling. One indoor unit is connected to one outdoor unit. A total of 16 sets of the units are
installed on each floor. In addition, a similar air-conditioning system is furnished in the elevator hall.
These air-conditioning systems are about 22 years old. The air-conditioning systems are generally
operated as follows:
For Office use : Mon- Fri. AM7:30-PM5:30, Sat AM 7:30-PM 1:30
For Elevator Hall use : Mon-Fri. AM7:00-PM7:00
In addition, air-conditioning systems are automatically turned on/off by a building automation
system (BAS). The room temperatures for each air-conditioning system are preset by the tenant,
usually at between 24ºC and 30ºC. Tenants are recommended to set their room temperature at 25ºC.
The air-conditioning system is maintained appropriately as the filter is cleaned every month and the
outdoor units every three months. The air supply and exhaust fans are operated cyclically as they are
run for 2 hours before they are suspended for 15 minutes.
For lighting, the offices use two TL36W units embedded in the ceiling. The lighting is turned
on/off by each tenant. Usually, the lighting is turned on between 6:45 and 7:00 am and turned off
around 7:00 pm. An energy-saving campaign is carried out regularly to encourage tenants, in a poster
on each room entrance, to turn off lighting when no person is present in the room. Electricity is
billed in accordance with the amount of electricity used. Tenant can thus reduce electricity
expenditure by following this practice.
The parking lot lighting is kept on for 24 hours on the passages and between 5:30 pm and 5:00,
am on the parking spaces. The lighting devices originally had a reflective cover for two lamps. Three
to five years ago, when PLN was in the midst of a power supply shortage, one of the two lamps was
removed to counter the shortage. Currently, one lamp is sufficient to meet the lighting requirements.
The BAS was introduced in 1992 and updated five years ago. The system monitors temperatures
at four zones of each floor.
For emergency power generation, four 1,500-kVA generators and one 625-kVA unit are used.

49
4. Development of JCM methodologies and estimation of GHG reduction
potential
4.1 JCM methodologies
4.1.1 Concept
This Study presents an energy-saving proposal for office buildings, commercial facilities, and
factories. According to past energy-saving diagnoses carried out by EMI, the following major
apparatuses can be introduced as an effective energy-saving measure for office buildings and
commercial facilities:
・ Heat source equipment;
・ Air-conditioning system;
・ Isolated power unit based on waste heat;
・ Renewable energy;
・ Lighting;
・ Motors (including elevators and escalators)
・ Light insulation glass
・ BEMS and other energy management systems
For factories, applicable energy-saving measures vary according to the business field. This Study mainly
addresses the replacement of air-conditioning systems, cogeneration systems, and other heat sources
equipment.
In developing a JCM methodology, we focused on the following three approaches:
(a) Formulating a methodology separately from technologies (methodology by technology);
(b) Integrating major technologies into one methodology (hole-in-one methodology); and
(c) Integrating major technologies into one methodology but permitting the use of existing approved
methodologies (a hybrid methodology combining (a) and (b) above)
In this Study, we discuss energy-saving methodologies for office buildings and commercial
facilities separately from those for factories. The methodology selection will be reviewed after we
examine energy-saving proposals for the facilities under discussion in more detail. Table 4-1
provides advantages and disadantages of each applicable methodology.
Table 4-1 JCM methodology development approaches to be discussed
Methodology
development
approaches
Advantage Disadvantage
(a) Methodology by
technology ・Detailed methodologies can be
developed
・Depending on the project, it is necessary
to use more than one methodology
・Development of methodologies requires a
great deal of work
(b) Hole-in-one
methodology ・A single methodology can handle
all requirements (more than one
energy-saving technology can be
・It is difficult to set qualification
requirements.

50
introduced into a single facility)
・New technologies can be added to a
positive list.
(c)Hybrid
methodology ・Same advantages as with the
hole-in-one methodology
・Existing methodologies can be used
if they are approved.
・Same disadvantages as with the
hole-in-one methodology
Source: Study Team
Our energy-saving proposal, based on an energy-saving diagnosis, will cover points and technologies
that can be improved for energy efficiency. A decision on the acceptability of a proposed technology will
be finally made by the facility owners by taking into consideration the initial necessary investment, the
payback period, expected energy-saving effects, introduction timing, business strategy, and other factors.
In the past, more than 1,000 energy-saving diagnoses have been carried out under assistance of the
Indonesian government. Nevertheless, only a few improvement proposals have been put into practice
because the payback periods under approved proposals are not favorable to the investors due to low
energy prices in the country.
Table 4-2 JCM methodologies approved or proposed for Indonesia (as of February 6, 2015)
Approval /
proposal
Methodology
No. Name of methodology
Approved ID_AM001 Power Generation by Waste Heat Recovery in Cement Industry
Approved ID_AM002 Energy Saving by Introduction of High Efficiency Centrifugal Chiller
Approved ID_AM003 Installation of Energy-efficient Refrigerators Using Natural Refrigerant
at Food Industry Cold Storage and Frozen Food Processing Plant
Approved ID_AM004 Installation of Inverter-Type Air Conditioning System for Cooling for
Grocery Store
Proposed ID_PM004 Installation of LED Lighting for Grocery Store
Proposed ID_PM006 GHG emission reduction through optimization of refinery plant
operation in Indonesia
Proposed ID_PM007 GHG emission reduction through optimization of boiler operation in
Indonesia
Source: New Mechanism Information Platform
As shown in Table 4-2, Indonesia has adopted seven methodologies—more than any other
member countries. Initially, the hybrid methodology (c) was considered the most appropriate for
office buildings and commercial facilities. Specifically, we should develop those similar to the
current JCM methodologies (proposal) originally developed for Vietnam. As shown in Table 4-3, on
the other hand, this Study proposes 15 technologies for the four facilities on the basis of an energy-saving
diagnosis. These technologies are now the subject of discussion with the facility owners. This Study
focused on the hole-in-one methodology (b) and the hybrid methodology (c) as it is highly advantageous
to introduce multiple energy-saving technologies into a single office building or commercial facility. In
Table 4-1, the difference between approaches (b) and (c) is whether there is already any JCM approval
methodology applied.

51
Table 4-3 Review of proposed technologies for the four facilities
Facility
Technology
No.
Proposed technology Progress of review
Availability of materials for methodology
development
Commercial facility
1 2
High-efficiency refrigerator heat pumps (HP)
Reviewing proposed technologies in detail
Not available
3 Measures against boiler heat loss Implementation being discussed
outside JCM Not applicable
4 Solar power generation A finance method being discussed.
Proposed technologies basically approved by the facility owners.
Available
5 Cold water generation using
waste heat
Reviewing candidate technologies in detail
Partly available
6 CO2 control of OA supply
systems Not available
7 Introducing a BEMS system Not available
Spinning factory
8 Closing high-efficiency heat
source piping and introducing a secondary pump
A finance method being discussed. Proposed technologies basically approved by the facility owners.
Not available
9 Introducing cogeneration
875kVA Not available
10 Updating the compressor cooling
tower Not available
11 Introducing a BEMS system Not available
12 Improving efficiency of production machinery
Reviewing details Not available
Office building (a)
13 Replacing for high-efficiency
individual package air-conditioning system
The details of the business proposal discussed. Proposed technologies basically approved by the facility
owners.
Partly available
14 Introducing LED lighting Partly available
Office building (b)
15 Replacing for the latest formula
turbo refrigerator
A finance method being discussed. Proposed technologies basically approved by the facility owners.
Not applicable (JCM_ID_AM002
applied)
Source: Study Team
Following the processes above, we briefed the JCM Office in Indonesia in November 2014 on the
proposed application of the hole-in-one methodology and the hybrid methodology. Rather, the Office
seemed more interested in developing methodologies for each technology. In addition, the Office
recommended us to apply the National Standard of Indonesia (SNI) to methodology. In consideration
of their suggestion, this Study develops and proposes JCM methodologies targeted at four of the 15
technologies that are being proposed for each facility and are currently in the negotiation process.
Emission reduction will be calculated using the four methodologies. For the turbo chiller proposed
for introduction into the office building under discussion, the existing methodology ID_AM001 will
be applied to the calculation of emission reduction.

52
(a) Introduction of a solar power generation system into the office buildings and
commercial facilities;
(b) Introduction of a cold water generation system using waste heat from the office
buildings and commercial facilities;
(c) Updating or introduction of a package air-conditioning system into the office
buildings; and
(d) Introduction of an LED lighting into the offices and parking lots.
Table 4-4 provides methodologies for emission reduction calculation for the proposed
technologies.
Table 4-4 Methodologies for emission reduction calculation for the proposed technologies
Technology Reference methodology
Basic concept of calculating reduction
Conservativeness assurance
Complex commercial facilities & Hotel
Hotel ・High-efficiency refrigerator ・heat pump (HP)
Refrigerator:JCM_ID_Am002_ver 01.1HP: VN_PM004
Reference emissions are calculated from project electricity consumption by using the efficiency of new and existing apparatuses
SNI is applied with reference apparatus efficiency set for default. However, Green Building certified buildings like GI, existing specifications are adopted because these buildings have higher efficiency than SNI.
Heat loss prevention for boiler
(Default: CDM) The piping heat loss ratio of post-project to post-project electricity consumption is multiplied by the thermal output of boiler and the emission factor for gas
A conservative value is set for the efficiency of existing gas boilers
Complex commercial facilities & Hotel
Mall
Solar power generation
・CDM・Solar generation methodology currently under development for Mongol
・The amount of electricity consumed or sold by the facilities is multiplied by the emission factor of the private power generator of the grid
・The amount of electricity consumed by an auxiliary unit, excluding the portion of electricity generated by a solar power generation system, is used as project emissions
A higher value is set for the loss rate of inverter
Absorbing-type refrigerator using waste heat
・JCM_ID_Am001_ver 01.1
・JCM_ID_Am002_ver 01.1
・The quantity of heat that could have been generated by existing refrigerators is estimated based on the quantity of heat generated by an absorption-type refrigerators
The COP of SNI is applied to existing refrigerators. However, the COP of existing apparatuses is applicable if they are proved to be operable throughout the credit period (15 years-elapsed years since introduction>credit period)
CO2 control of OA supply system
- ・The energy-saving effect of an air blower is calculated by multiplying the rated value of the existing air conditioning systems by the amount of electricity consumed before and after the project ・The COP of existing refrigerators is used to determine cold heat from an enthalpy difference between internal and external air as measured in the project

53
Technology Reference methodology
Basic concept of calculating reduction
Conservativeness assurance
Complex commercial facilities & Hotel
Overall Introduction of a BEMS system
――
・BEMS will be limited to water temperature adjustment refrigerators, water pressure adjustment secondary pumps, and setting for the number of units under control・Reduction effects will be calculated by using the COP ratio of refrigerators and secondary pumps before and after introduction of BEMS
・For refrigerators, the prior COP is set conservatively with a JCM-approved methodology, and a temperature difference is calculated using the same methodology ・For pumps, the pressure before and after BEMS introduction is set conservatively to the pressure of existing pumps + 0.1MPa
Industry (Factory)
Spinning factory
・Replacement with high-efficiency heat source apparatus ・Closing piping, introduction secondary pumps
Heat source apparatusJCM_ID_Am002_ver 01.1
・Methodologies are developed for air conditioning systems
・Heat source unit: JCM-approved methodologies are applied.
・Piping and pumps: A project electricity consumption difference is subtracted from reference value calculated on pump rated value and operation value
・Conservative values are ensured by applying JCM methodologies to the heat source units
Introducing co-generation system 875 kVA
JCM_ID_Am001_ver 01.1
A gas boiler is adopted for steam generated by reference, and the grid is adopted for electricity
Boiler efficiency: Gas boiler default in CDM is adopted
Updating compressor cooling tower
--
Reference emissions are calculated based on project electricity consumption by using the efficiency of new and old apparatuses
Refrigerator catalogs are being collected in Indonesia. If appropriate catalogs are not available, conservative values may be set for project emissions.
Industry (Factory)
Overall Introducing a BEMS
-- See the BEMS column in GI
Production machinery
Improving production machinery for higher efficiency
--
・Calculated based on the rated capacity ratio of new and old apparatuses by using operating hours ・Emissions reduction is calculated by calculating a difference in the amount of air used between new and old apparatuses by using the capacity of existing compressors.
Conservative values are ensured by setting the rated capacity of new compressor adopted for reference above the existing rated capacity.
Office building
Office Building A
Replacement with high-efficiency individual package
VN_PM004
The amount of electricity consumed by the project is multiplied by the efficiency difference
SNI is applied to the default
Introduction of LED lighting
ID_PM004The calculation method in ID_PM004 is applied
For the default, see the setting method in ID_PM004. However, the color temperature zone is taken into consideration for offices and parking lots
Office Building B
Replacement with the latest turbo refrigerator
JCM _ID_Am002_ver01.1
Refrigerator: the approval methodology is applied Addition of the energy-saving effect of the cooling tower is currently under consideration .
Refrigerator: the default of the methodology is adopted

54
4.1.2 Calculation method for emission reduction and approaches to the calculation of
reference emissions
Emission reduction is determined by the following formula:
ppp PEREER
ERp Emission reduction for period p [tCO2 / p]
REp Reference emissions during period p [tCO2 / p]
PEp Project emissions during period p [tCO2 / p]
JCM methodologies require calculation methods for net emission reduction. Those calculation
methods take either of the following approaches:
(a) The reference emissions are set below the Business-as-Usual (BaU) emissions; or
(b) The project emissions are set above the actual measurements.
Both methods require the collection and validation of appropriate data, that is, it is essential to
collect high-reliability information. In a project involving energy-saving technologies, the emission
reduction is a difference in efficiency between the reference apparatus and the project apparatus. In
approach (b), however, it is possible that project emissions will increase beyond expectation, and if
the wrong method is applied, there could be no energy-saving effect of inverters or any other
control technology. For this reason, this methodology will adopt approache (a).
4.1.3 Introduction of solar power generation system into office buildings and commercial
facilities
(1) Qualification requirements
Table 4-5 shows the qualification requirements.
Table 4-5 Qualification standards for introduction of the solar power generation system under discussion
Requirement 1 A solar power generation system shall be introduced into commercial and factory
facilities. Power generated by the system shall be consumed by the facilities or
supplied to the linked grid.
Requirement 2 The power conditioner system (including the inverters) mounted on the solar
power generation system shall have an energy conversion rate of at least 94% .
Requirement 3 The solar power generation system shall be compatible with (i) and/or (ii) below:
(i) The design standard and safety standard set forth by International
Electrotechnical Commission (IEC); and
(ii) National standard equivalent to the IEC standards.
Standard and standard certificate types: IEC 61215 (Silicon), IEC 61646 (Thin
film), and IEC 62108 (CPV)
- Safety standard: IEC 61730-1 (Construction) and IEC 61730-2 (Inspection)
Source: Study Team

55
(2) Calculating reference emissions
In the Clean Development Mechanism (CDM), it is assumed that electricity generated by solar
power substitute electricity from the grid, and thus baseline emissions are calculated by using the
emission factor of the grid. On the other hand, with the methodologies proposed in this Study,
reference emissions are calculated based on the “net amount of electricity generated,” which
excludes electricity lost between the generator and the consumer. Electricity loss occurs in processes
before electricity is supplied to the consumer. The greatest loss takes place in the solar panel and
next during DC-AC conversion in power conditioners or inverters. In this Study, Net emission
reduction is determined by applying conservative values of loss ratio to power conditioners and
inverters.
The reference emissions are calculated by using the following formula:
𝑅𝐸𝑝 = 𝐸𝐺𝑃𝐸,𝑝 × (1 + 𝐼𝑛𝑣𝐿𝑜𝑠𝑠𝑃𝐽 − 𝐼𝑛𝑣𝐿𝑜𝑠𝑠𝑅𝐸) × 𝐸𝐹𝑒𝑙𝑒𝑐
REp : Reference emissions during period p [tCO2 / p]
EGPE,p : Net amount of electricity for period p supplied to project apparatuses and/or
connected grid [MWh/p]
InvLossPJ : Maximum energy loss in the project power conditioner system [-]
InvLossRE : Maximum energy loss in the reference power conditioner system [-]
EFelec : CO2 emission factor of electricity consumed in the project [tCO2 / MWh]
(3) Calculation method for project emissions
Project emissions are calculated based on the amount of fossil fuel-derived electricity consumed in
the project, in accordance with the following formula:
𝑃𝐸𝑝 = 𝐸𝐺𝐴𝑈𝑋,𝑝 × 𝐸𝐹𝑒𝑙𝑒𝑐
PEp : Project emissions during period p [tCO2 / p]
ECAUX,p : Amount of electricity from an isolated power unit or the grid consumed by the
project apparatus during period p [MWh/p]
EFelec : CO2 emission factor of electricity consumed by the solar power generation
system [tCO2 / MWh]
(4) Pre-fixed parameters
The following parameters are pre-fixed:

56
Table 4-6 Pre-fixed parameters in methodologies related to the solar power generation system under
discussion
Parameter Content of data Source
InvLossPJ Maximum energy loss in the project power
conditioner system
Manufacturers' specifications
InvLossRE Maximum energy loss in the reference power
conditioner system
Default: 6%
Additional information
EFelec CO2 emission factor for electricity consumed in
the project
If an isolated power unit is not available at the
project site, the currently available emission
factor for Indonesia's grids is applied and fixed
for use during the successive monitoring period.
If an isolated power unit is available at the
project site, then EFelec is selected as described
below:
Option 1: A conservative value is set for EFelec
and is fixed for use during the succeeding
monitoring period;
EFelec = min (EFgrid, EFcaptive)
EFcaptive = 0.8 tCO2 / MWh*
*The currently available emission factor is
selected from CDM-approved small-scale
methodology AMS-I.A and applied.
[EFgrid]
Unless otherwise specified by
the Joint Committee, data are
taken from "Emission Factors of
Electricity Interconnection
Systems" from National
Committee on Clean Energy
Development Mechanism
(Designated National Authorities
(DNA) of Indonesian CDM).
[EFcaptive]
CDM-approved small-scale
methodology: AMS-I.A
4.1.4 Introduction of an exhaust heat recovery system into office buildings and
commercial facilities for cold water generation
(1) Qualification requirements
Table 4-7 shows the qualification requirements.
Table 4-7 Qualification standards for the introduction of an exhaust heat recovery system for cold
water generation under discussion
Requirement 1 An exhaust heat recovery (WHR) system for cold water generation shall be
installed in the existing office buildings or commercial facilities.
Requirements If refrigerants used for cold water generation in the project contain CFC, HFC, or
HCFC, then a plan shall be in place to prevent the release of such refrigerants into
air.

57
(2) Calculating reference emissions
Reference emissions are calculated by multiplying the volume of cold water generated through the
use of heat and/or gas recovered to WHR by the COP of existing chillers and the CO2 emission
factor of the power source used for the project.
According to Indonesian air-conditioning experts, existing facilities usually do not undergo chiller
calibration, and therefore the efficiency of such chillers fall short of specification values.
Considering these circumstances, this methodology sets conservative values by adopting the
following approach:
When the product lifetime of existing chillers comes expires during the credit period: the
Indonesian national standard (SNI) 03-6390 is applied because the standard is, according to
local experts, sufficiently strict for existing chillers; or
When the product lifetime of existing chillers survive the credit period: the rated COP set forth
in manufacturers’ specifications for existing chillers is adopted without taking aged
deterioration into consideration.
The product lifetime of chillers shall be 15 years in compliance with CDM’s “Tool to determine the
remaining lifetime of equipment” (version 01).
The reference emissions are calculated by using the following formula:
REcpCTREpauxREREpPJp EFECECQRE ])6.3//[( ,_,_,
i
piauxCAPpauxRE OECEC ,_,_
i
pjCTCAPpCTRE OECEC ,_,_
REp Reference emissions during period p [tCO2 / p]
QPJ,p Amount of cooling energy generated in the project during period p [GJ / p]
ηRE Efficiency of the reference cooling energy generation apparatus [-]
ECaux,p Power consumption by electrical auxiliary machine for existing chiller removed
for the project for period p [MWh / p]
ECCT,p Power consumption by the cooling tower for the existing chiller removed for the
project for period p [MWh / p]
EFRec CO2 emission factor of electricity consumed the existing chiller [tCO2 / MWh]
ECCAP_aux,i Total rated output of auxiliary machine i removed for the project [MW]
ECCAP_CT,j Total rated output of cooling tower j removed for the project [MW]
Op WHR operating hours during period p [hour / p]
(3) Calculation method for project emissions
Project emissions are determined on the basis of total electricity consumption by the WHR system
and all other apparatuses introduced for the project, including cold water generation equipment,
pumps, and cooling towers. The following formula is used in the calculation:
𝑃𝐸𝑝 = (𝐸𝐺𝑐ℎ𝑖𝑙𝑙𝑒𝑟,𝑝 + 𝐸𝐺𝐴𝑈𝑋,𝑝+𝐸𝐺𝐶𝑇,𝑝) × 𝐸𝐹𝑒𝑙𝑒𝑐

58
PEp : Project emissions during period p [tCO2 / p]
ECchiller,p : Power consumption by the cold water generation apparatus during period p
[MWh/p]
ECAUX,p : Power consumption by electric auxiliary machines introduced for the project,
during period p [MW/p]
ECCT,p : Power consumption by the cooling tower introduced for the project, during
period p [MWh / p]
EFelec : CO2 emission factor of electricity consumed by apparatuses introduced for the
project [tCO2 / MWh]
(4) Pre-fixed parameters
The following parameters are pre-fixed:
Table 4-8 Parameters pre-fixed under methodologies related to the solar power generation system
under discussion
Parameter Content of data Source
ηRec Efficiency of the reference cooling energy
generation system
If the replaced chiller is a centrifugal type,
defaults under JCM-approved methodology
JCM_ID_AM001 may be applied.
The following defaults may be applied to
water-cooling and air-cooling chillers:
Chiller defaults
A/C types COP*
Air-cooling chiller < 150 TR
(reciprocal) 2.8
Air-cooling chiller < 150 TR (screw) 2.9
Air-cooling chiller > 150 TR
(reciprocal) 2.8
Air-cooling chiller >150 TR (screw) 3
Water-cooling chiller < 150 TR
(reciprocal) 4
Water-cooling chiller < 150 TR
(screw) 4.1
Water-cooling chiller > 150 TR
(reciprocal) 4.26
Water-cooling chiller > 150 TR
(screw) 4.4
*Energy efficiency shall be measured at an external temperature of 33ºC for the air-cooling type and at an external temperature of 30ºC for the water-cooling type. For water-cooling type capacitors, energy efficiency shall be measured at 30ºC on the cooling water inlet.
Defaults under the
methodologies (for validation,
the latest Indonesia national
standards SNI-03-6390 are
applicable)
EFelec Same as in Table 4-5

59
EGaux_cap,i Total rated output of auxiliary machine i
removed for the project
Manufacturers' specifications
EGCT_cap,i Total rated output of cooling tower i removed for
the project
Manufacturers' specifications
4.1.5 Replacement and introduction of a package air-conditioning system in office
buildings
(1) Qualification requirements
Table 4-9 shows the qualification requirements.
Table 4-9 Qualification standards for replacement/introduction of a package air-conditioning system
in office buildings under discussion
Requirement 1 New package air conditioning system (project package air conditioning system)
introduced into the buildings shall account for at least 70% of the entire
air-conditioning system. The performance of project package air conditioning
system shall comply with the latest SNI03-6390.
Requirement 2 If refrigerants used in package A/C contain CFC, HFC, or HCFC, then a plan shall
be in place to prevent the release of such refrigerants into air. Where existing
package air conditioning system are to be replaced with project package air
conditioning system, refrigerants in the existing package air conditioning system
shall be processed in compliance with the national or shall be recovered to avoid
the release of fluorocarbon gas.
(2) Calculating reference emissions
Reference emissions are determined by using power consumption package air conditioning system
introduced for the project, the COP ratio of the reference package air conditioning system to the
project package air conditioning system, and the CO2 emission factor of power consumed by
isolated power units or connected grids. The reference net emission reduction is determined by the
product lifetime of existing apparatuses, as with the methodology for exhaust heat recovery systems
for cold water generation. However, the default under the methodology is applied where new
package air conditioning system are introduced without replacing existing apparatuses.
Reference emissions are calculated with the following formula:
REpCTREpauxREREPJpPJp EFECECECRE ])6.3//[( ,_,_,
i
piauxCAPpauxRE OECEC ,_,_
j
pjCTCAPpCTRE OECEC ,_,_
REp Reference emissions during period p [tCO2 / p]
ECPJ,p Power consumption by project package air conditioning system during period p

60
[MWh / p]
ηRE Efficiency E of the reference package air conditioning system [-]
ηPE Efficiency of the project package air conditioning system [-]
ECRE_aux,p Power consumption by auxiliary machines under the existing package air
conditioning system removed for the project, during period p [MWh / p]
ECRE_CT,p Power consumption by cooling towers under the existing package air
conditioning system removed for the project, during period p [MWh / p]
EFRE CO2 emission factor electricity consumed by the reference package air
conditioning system [tCO2 / MWh]
ECCAP_aux,i Rated output of auxiliary machine i removed for the project [MW]
ECCAP_CT,j Rated output of cooling towers j under existing package air conditioning system
removed for the project [MW]
Op Operating hours project package air conditioning system during period p [hour /
p]
(3) Calculating project emissions
Project emissions are determined on the basis of the amount of electricity consumed by the project
package air conditioning system and all other apparatuses introduced under the project. The
following formula is used for calculation:
𝑃𝐸𝑝 = (𝐸𝐶𝑝𝑎𝑐𝑘𝑎𝑔𝑒𝑑,𝑝 + 𝐸𝐶𝐴𝑈𝑋,𝑝) × 𝐸𝐹𝑒𝑙𝑒𝑐
PEp Project emissions during period p [tCO2 / p]
ECpackaged,p Power consumption by project package air conditioning system during period p
[MWh / p]
ECAUX,p Power consumption by electrical auxiliary machine introduced under the project,
during period p [MWh / p]
EFelec CO2 emission factor of electricity consumed by apparatuses introduced under the
project [tCO2 / MWh]
(4) Pre-fixed parameters
The following shows pre-fixed parameters:
Table 4-10 Parameters for pre-fixed methodologies related to the introduction of package air
conditioning system under discussion
Parameter Content of data Source
ηRE Efficiency of reference package A/C
Defaults for package air conditioning system
A/C types COP
Split duct 2.60
Variable refrigerant flow
(VRF)
3.70
Defaults under the
methodologies (at time of
validation, the latest Indonesian
national standards SNI-03-6390
are applicable)

61
ηPJ Efficiency of project package air conditioning
system
Manufacturers’ specifications
EFelec Same as in Table 4-5
ECaux_cap,i Total rated output of auxiliary machine i
removed under the project
Manufacturers’ specifications
ECCT_cap,i Total rated output of cooling tower i removed
under the project
Manufacturers’ specifications
4.1.6 Introduction of LED lighting into offices and parking lots
(1) Qualification requirements
Table 4-11 shows the qualification requirements.
Table 4-11 Qualification standards for the introduction of the LED lighting under discussion
Requirement 1 G13-type LED lighting shall be installed in offices or parking lots as an addition to
the existing fluorescent lights or to replace them.
Requirement 2 The LED lighting to be installed shall be a straight type having a color temperature
of 4,000K to 5,000K and a luminous efficiency of at least 70 lm/W. In addition, the
illuminance (unit: lux) shall comply with the Indonesian national standards
(Indonesia National Standard: SNI) (offices: 350lux; parking lots: 100lux).
Requirement 3 If existing fluorescent lights are replaced with project LED lighting, mercury
contained in the existing fluorescent lights shall be disposed of in compliance with
Indonesian national or local standards.
(2) Calculating reference emissions
Reference emissions are determined on the basis of power consumption by the project lighting,
the luminous efficiency ratio of project lighting to reference lighting, and CO2 emission factor of
electricity consumed by the project. The Japanese government has a target of introducing LED
lighting into 50% of office buildings nationwide by 2020, while Indonesia has no such target in place.
In addition, given the fact that the majority of office buildings completed after 2010 in Japan still use
fluorescent lights, it would be difficult to encourage developing countries to introduce LED lighting.
Considering these circumstances, we have set conservative values for luminous efficiency of
reference lighting, as follows:
・ In Indonesia, fluorescent lights are commonly used in offices and parking lots.
・ The luminous efficiency of the reference lighting is set so that a conservative luminous
efficiency value is set for LED lighting.
・ As explained in Section I, the highest efficiency value for locally available LED lighting is
defined as η RE.
Reference emissions are calculated with the following formula:

62
𝑅𝐸𝑝 = 𝐸𝐶𝑃𝐽,𝑝 × (η𝑃𝐽/𝜂𝑅𝐸) × 𝐸𝐹𝑒𝑙𝑒𝑐
REp Reference emissions during period p: [tCO2 / p]
ECPJ,p Amount of electricity consumed by the project lighting during period p: [MWh / p]
𝜂PJ Luminous efficiency of the project lighting: [lm / W]
𝜂RE Luminous efficiency of the reference lighting: [lm / W]
EFelec CO2 emission factor of electricity consumed by the project: [tCO2 / MWh]
(3) Calculating project emissions
𝑃𝐸𝑝 = 𝐸𝐶𝑃𝐽,𝑝 × 𝐸𝐹𝑒𝑙𝑒𝑐
PEp Project emissions during period p: [tCO2 / p]
ECPJ,p Amount of electricity consumed by the project during period p: [MWh / p]
EFelec CO2 emission factor of electricity consumed by the project: [tCO2 / MWh]
(1) Pre-fixed parameters
The following shows the pre-fixed parameters:
Table 4-12 Parameters pre-fixed under methodologies related to the introduction of the LED lighting
under discussion
Parameter Content of data Source
ηPJ Luminous efficiency projects lighting. Values
under manufacturers' specifications shall be
adopted. If the number of types of lighting
devices to be installed is more than one, then the
lowest efficiency among installed devices shall
be adopted.
Manufacturers' specifications
ηRE Luminous efficiency of reference lighting
Luminous efficiency default: 84.2 lm / W
Additional information
EFelec Same as Table 4-5

63
4.2 PDD proposal
A PDD has been developed for proposal for a solar power generation system as this is the most
feasible of the four proposed JCM methodologies. In addition, sufficient amounts of information are
available concerning solar power generation. More details are provided in the Appendix 2.
4.3 GHG emission reduction
Table 4-13 provides emission reductions calculated in accordance with the JCM methodologies
(proposal). Project and existing apparatuses are compared in emission reduction.
Table 4-13 Emission reduction calculated with the proposed methodologies and emission
reduction with existing apparatuses
Facilities
Tec
hnol
ogy
No.
Technology
Where JCM methodologies are applied Comparison
with existing
apparatuses in
emission
reduction
(tCO2 / yr)
Reference
emissions (tCO2 /
yr)
Project emissions
(tCO2 / yr)
Emission
reduction (tCO2 /
yr)
Commercial facilities
4 Solar power generation
2,019 0 2,019 2,100
5
Cold water generation using waste heat
3,217 568 2,649 2,649
Office building (a)
13
Replacement for high efficiency individual package air-conditioning
2,929 2,585 344 781
14 Replacement for LED lighting
257 244 13 800
Office building (b)
15
Replacement for latest-type turbo refrigerators
1,646 1,402 243 737
Emission reductions substantially decrease when JCM methodologies, including the introduction
of LED lighting, are employed, compared with existing apparatuses. In order to determine
appropriate reference emissions, we should collect more information from local experts and
machinery manufacturers and through consultation with the Indonesian government.
4.4 Estimating GHG reduction potential
Our energy-saving proposals are compiled on the basis of the specific conditions of each facility.
For this reason, it is impossible to apply the results of this Study to GHG reduction potentials
nationwide in Indonesia. The project under this Study is intended to establish a finance approach to
promoting energy-saving projects in Indonesia. GHG reduction potential relates to all energy-saving
projects to which the finance approaches proposed in Chapter 5 are applicable. In this Study, several
assumptions are made to estimate reduction potential in each field under the Study.
・ Office buildings and commercial facilities
・ Industry (see the example of a spinning factory)

64
A recent two-year survey indicates that electricity accounts for the major part of total energy
consumption at office buildings and commercial facilities. Thus, it is clear that measures targeted at
reducing electricity consumption will be the most effective in GHG reduction. In estimating GHG
reduction potentials, we will determine average energy-saving effects based on statistics released
PLN in 2014 and the results of this Study. This Report assumes an average energy-saving effect of
20%. Table 4-14 shows the calculation results.
Table 4-14GHG reduction potential
(Java, Sumatra , Kalimantan)
Java Sumatra Kalimantan Total for
3 islands
Jakarta
& Tangerang
Power
consumption
in 2013
(GWh)
Industry 57,562 2,935 431 60,929 11,409
Business 23,504 1,585 1,488 26,577 12,087
Total 81,066 4,521 1,919 87,506 23,497
Energy-saving
effect of 20%
(GWh)
Industry 11,512 587 86 12,186 2,282
Business 4,701 317 298 5,315 2,417
Total 16,213 904 384 17,501 4,699
GHG
reduction
effects at
energy-saving
effect of 20%
(tCO2)*
Industry 9,316,715 475,120 69,712 9,861,547 1,846,637
Business 3,804,207 256,578 240,831 4,301,617 1,956,389
Total 13,120,922 731,698 310,544 14,163,164 3,803,026
Note:*The weighted average emission factor of the grids updated by DNPI in 2013 for the three islands (0.809tCO2 /
MWh) is adopted as the mission factor of the grid.
Source: Compiled by the Study Team based on the PLN Statistics 2013 and the DNPI grid emission factors
According to PLN data, power consumption by commercial facilities in Jakarta (including
Tangerang) during 2013 was approximately 12,087GWh. If a 20% energy-saving project is
implemented in commercial facilities alone, 1.95 million t-CO2 could be cut annually, as shown in
Table 4-14. An equivalent project would reduce 457 million t-CO2 annually in three islands of Java,
Sumatra, and Kalimantan combined, which include major economic cities in Indonesia.
In 2013, industrial facilities in Jakarta (including Tangerang) consumed approximately 11,409
GWh. If the same energy-saving approach is taken as for the commercial facilities, we could expect
an annual emission reduction of 1.84 million t-CO2. In addition, the three islands combined would
see a reduction of about 10 million t-CO2.
However, to achieve expected reduction effects under energy-saving initiatives, we should take a
number of factors into consideration, including the size, age, and electricity consumption pattern of
the facility and calculate emission reduction effects for each project.

65
5. Policy recommendations on ESCO projects
5.1 Issues related to the promotion of ESCO projects in Indonesia
To promote ESCO projects in Indonesia, we need to identify issues specific to the country and
formulate measures to deal with them. In the following paragraphs, three points are discussed for
this purpose—payback period, market interest rates, and corporate finance.
5.1.1 Long payback period
Generally, housing investments in Indonesia are recovered in two or three years. In ESCO projects,
investments in energy-saving apparatuses for commercial buildings are recovered for a longer period.
On the other hand, investments in energy-saving apparatuses for factories are recovered in a shorter
period.
As, the payback period for investments in buildings widely varies ESCO projects, depending on
the sector, we need to discuss payback periods with facility owners before making investments. In
this respect, Japan’s financial assistance is important in promoting ESCO projects.
5.1.2 High market interest rates
In Indonesia, a resource-rich country, energy prices are kept relatively low, whereas market
interest rates remain at over 10% amid rapid economic growth.
For this reason, funds tend to be directed to projects with high investment efficiency rather than to
energy-saving investments. To prompt energy-saving investments in Indonesia, it is necessary to
provide interest subsidies for energy-saving projects to make them more attractive.
5.1.3 Difficulty financing to companies targeted for investment
In making an energy-saving investment in a company, it is generally necessary to finance the
company in order to evaluate the company for managerial soundness and determine the feasibility of
investment, as well as determining a payback period.
Different from Japanese companies operating in Indonesia, the majority of local companies do not
ensure the transparency of corporate management or provide documentation or data necessary for
investment decisions, thus making investment almost impossible.
In order to encourage energy-saving projects in Indonesia, we need to establish a financing system
for local enterprises through cooperation with Japanese local subsidiaries.
5.2 Policy recommendations on establishment of an ESCO finance scheme
This section reviews existing financing schemes in Indonesia necessary for Japan to contribute to
dissemination of apparatuses and products designed for energy-saving and renewable energy.

66
5.2.1 Electricity subsidies Indonesia
In Indonesia, a country rich in energy resources, the government has maintained retail electricity
prices low by providing subsidies for fuel and electricity prices, and thus there is no incentive for
citizens to make energy-saving efforts. The former administration of President Yudhoyono took
radical action to cut subsidies for electricity in 2008 and 2013. In 2013, the government introduced
an electricity subsidy system under which electricity rates were to be raised by 6% every quarter
during the year. In 2014 as well, ESDM planned to raise electricity rates as shown in Table 5-1
Table 5-1 ESDM plan to raise electricity rates (as of February 2014)
Class Standards Increase in electricity rate
I3 Medium-sized manufacturer
consuming 200 kVa or more
38.9%
I4 Large manufacturers consuming less
than 30,000 kVa
64.7%
B2 Commercial facility consuming
6,600Va to 200 kVa
The fuel cost adjustment system applicable. A
4.3%targeted for investment. A quarterly 4.3% price
increase to be enforced in October 2014. B3
Commercial facility consuming more
than 200kVa
Government buildings consuming
6,600Va to 200kVa
Source: Jakarta Post, January 22, 2014(electronic version) and Study Team Study
As shown above, the government plans to raise electricity rates by 64.7% for manufacturers who
consume 30,000 kVa and by 38.9% for medium-sized listed companies consuming more than 200
kVa. Electricity rates were increased in May 2014 and will be further raised incrementally every two
months by about 8% for consumers of more than 200 kVa. These increases will provide incentives
for investing in energy-saving projects and constitute an important element of finance scheme.
5.2.2 Finance incentives for energy-saving programs
The Energy-saving Law (2009 Government Regulation No.70) was established in 2009 as a
requirement under the National Energy Law. Under the Energy-saving Law, the incentives as shown
in Table 5-2 are granted to projects only if they achieve their energy-saving target established in an
energy-saving diagnosis and comply with the success standards provided in a ministerial order. As
the incentives are granted only after the energy-saving effects are confirmed, they are not suitable for
energy-saving projects that require large amounts of initial investment.
Table 5-2 Incentives under the 2009 Energy-saving Law (No.70)
Target Incentive
Energy user of
more than 6,000
tons
・Favorable tax treatment of energy-saving products
・Tax credit/tax cut/tax exempt relating to local tax on energy-saving products
・Preferential import duties
・Below-market-rate government loans for energy-saving investments
・Compensation for energy-saving diagnosis expenses
Domestic
manufacturer of
energy-saving
products
・Favorable tax treatment for parts / spare parts and raw materials of energy-saving products
・Local tax credit / tax cut / tax exempt for parts / spare parts and raw materials of
energy-saving products
・Preferential import duties on parts / spare parts and raw materials of energy-saving products
・Below-market-rate government loans for investments in the manufacture of energy-saving
products
Source: Peer Review on Energy Efficiency in Indonesia, APEC 2012

67
ESCO projects are faced with difficulty financing due to a lack of understanding of energy-saving
projects on the part of financial institutions and a lack of credit of emerging ESCO enterprises. In
order to alleviate this problem, it is important to have financial institutions deepen their
understanding of energy-saving projects through workshops and other training events and thus
facilitate their decisions for loans to such projects.
A revolving fund (EE Fund Facility) is part of the government's framework on financial assistance
to energy-saving projects. The Indonesian Investment Agency (PIP) is reportedly planning to
contribute 500 billion rupiah to the facility as part of its budget. The EE Fund Facility is part of the
activities in the energy-saving section of the national action plan for GHG reduction. The facility is
designed to encourage the financial sector to support the government in promoting the use of
energy-saving technologies by all energy consumers, in cutting government energy subsidies, and in
reinforcing the government’s energy-saving efforts. Under this facility, projects are implemented and
regularly evaluated and, as energy manager, the technical support team of the committee implements
projects that can be evaluated for energy performance, prepares an energy management report, and
formulates plans for achieving energy-efficiency targets. The operation of this facility program has
been slowing since the change in administration in 2014.
Source: Indonesian Ministry of Finance
Figure 5-1 Scheme of the Energy Efficiency Reinforcement Fund (EERF)
5.2.3 Obstacles to development of ESCO projects in Indonesia
In order to develop successful ESCO projects in Indonesia, where consumption of coal and other
fossil fuels for power generation is expected to expand in line with economic growth, it is necessary
for the government to develop and reinforce financial and institutional support initiatives as shown
in Table 5-3.

68
Table 5-3 Obstacles to development of ESCO projects in Indonesia
Issue Description
Institutional and political
issues
A lack of financial assistance from government to ESCO
Continued fuel subsidies
Social issues Poor recognition among citizens and companies of the importance of energy-saving
efforts (exacerbated by fuel subsidies)
Business issues
Issues caused by a lack of understanding of new businesses among financial
institutions (a lack of understanding of energy-saving projects and energy reduction
contracts, a lack of experience in projects and finance programs)
A lack of funds at ESCO companies
Source: Study Team
ESCO grants two types of contracts: (i) a guaranteed savings contract, under which the building
owner, as the customer, makes an initial improvement investment at its own expense, and (ii) a
shared saving contract, under which the ESCO operator makes such investment at its own expense.
In the shared saving contract, the first-year capital investment is made by the ESCO operator, not by
the customer, and the investment is recovered from the reduced portion of energy cost. Shared
saving contracts are not used in Indonesia, while guaranteed savings contracts have been granted to
customers who purchase certain energy-efficient apparatuses.
5.3 Proposal of a finance scheme promoting energy-saving apparatuses
In formulating a finance scheme for dissemination of energy-saving and renewable-energy
apparatuses and products in Indonesia, here are discussed financing programs by the Ministry of the
Environment, including a single-step development fund, an eco-friendly interest subsidy fund, and
an interest subsidy fund for green finance promotion.
A number of energy audits have been conducted in Indonesia. However, these audits are yet to be
effective enough in encouraging the introduction of more energy-saving apparatuses, partly because
electricity rates have been maintained low with subsidies, and also because cash-rick Indonesian
project managers are making capital investments to increase procurement capacities, not to save
energy. In fact, project operators have been more sensitive to prices and expenses since the
government enforced electricity rate increases. For companies keen to expand their production
capacity, the problem is how to reduce initial expenses in introducing energy-saving apparatuses.
This will create greater demand for ESCO funds.
Manufacturers seek to shorten the payback period to three to four years and use collected funds as
working capital. Meanwhile, financial institutions in Indonesia, where the inflation rate is high and
its currency and markets are unstable, have no interest in long-term lending to local companies. Thus,
the ESCO finance scheme, which mainly use shared savings contracts, is not common due to two
factors—high interest rates in Indonesia and the poor financing capability of ESCO operators.
5.3.1 Use of the Japanese government’s existing assistance programs
To overcome high interest rates in Indonesia and the poor financing capability of ESCO operators
and promote energy-saving initiatives, this Study discusses Japan’s support for a bilateral credit
(JCM) project and Japan’s domestic finance policy on ESCO and on dissemination of energy-saving
apparatuses.

69
(1) Financial assistance (fund) for “single-step” development
To assist developing countries in shifting to an advanced low-carbon society in a single step,
Japan has a new scheme for building cooperation among the Ministry of the Environment, JICA, and
Asian Development Bank.
In mutual cooperation, the Ministry of the Environment and JICA aim to establish a fund for
supporting high energy-efficiency projects overseas and, through the fund, to promote Japan’s
advanced low-carbon technologies having high emission reduction effects even if high initial costs
are involved. (See Figure 5-2.)
Source: Ministry of the Environment6
Figure 5-2 A fund for disseminating low-carbon technologies
Under another scheme, the Ministry of the Environment makes contribution to a trust fund at Asian
Development Bank (ADB) to jointly finance advanced low-carbon technologies that are rarely
adopted due to high initial costs. Specifically, the added contribution is used to cut such initiative
costs to accelerate the adoption of advanced technologies in ADB projects. (See Figure 5-3)
Source: Ministry of the Environment
Figure 5-3 Financial assistance in “single-step” development (ADB contribution)
6 http://www.env.go.jp/guide/budget/h26/h26-gaiyo.html
JICA, etc.
Financial assistance, including
overseas investment and financing
Fund for dissemination
of technology MOE
Subsidy
Cooperation
Financial Assistance
Water and sewerage/ projects related to water environment
Incinerator/ co-benefit project Geothermal and other
renewable energy source
Transport (including BRT)
Assistance projects by
JICA, etc.
JCM projects
GHG reductions
(Image)
Advanced technologies are
rarely adopted by projects due to
high introduction expenses. The
trust fund is used to reduce such
costs to encourage the
introduction of such
technologies.
GHG reductions
(Image)
Chosen from the pipeline
ADB project
Reduced by standard technology
Additional cost to introduce advanced technology
ADB Fund
Trust Fund

70
(2) ESCO proposal for buildings of government agencies and state-owned companies
According to our Study last year, energy expenses for government buildings are determined in
advance and included in the national budget, and the unused budget is returned to the government,
that is, building owners are not authorized to appropriate saved expenses for energy-saving or any
other purposes. Giving a top priority to energy savings at state-owned facilities, the Indonesian
government is considering a pilot project to communicate the importance of energy saving and a
program to encourage energy-saving activities.
Currently, JICA is implementing “Project of Capacity Development for Climate Change Strategies
in Indonesia” for Indonesia’s BAPPENAS and Ministry of Finance (BMKG). The Indonesian
government has established Centre for Climate Change Financing Policy, which is tasked with
problems related to climate-change financing for Monetary Policy Bureau (FPA) of the Ministry of
Finance. JICA provides technical assistance to this center during the 2013 to 2015 period. Its
activities involve four tasks as follows:
Capacity building for FPA to establish and implement the finance mechanism for the Action
Plan on GHG Reduction (RAN-GRK);
Capacity building for FPA to establish a financial incentive for promoting Green City
initiatives;
Capacity building for FPA to introduce agricultural insurance;
Capacity building for FPA to evaluate the scope of economic approaches for assistance in the
implementation of environmental and climate policies.
The abovementioned JICA project “Financing Mechanism for Construction of a Green City” aims
at identifying and developing specific properties (including state-owned buildings) that utilize
Japanese apparatuses and systems. For those properties, we suggest implementing a pilot project by
using a fund for promotion of low-carbon societies, through cooperation among the Ministry of the
Environment, ADB, and JICA.
For example, an incentive for individual energy-saving projects might be developed among
state-owned companies through ESCO or other financial assistance programs, which could further
help disseminate Japan’s technologies.
5.3.2 Finance scheme for promoting energy-saving projects in the private sector
An interest subsidy will be a highly effective in promoting ESCO projects for private buildings
and factories. As in the interest subsidy program for green finance promotion implemented by the
Japanese Ministry of the Environment, an interest subsidy should be provided to local financial
institutions in Indonesia, which should in turn extend low-interest-rate loans to ESCO projects.
Under this subsidy program, the interest subsidy is targeted at investments in energy-saving ESCO
projects, while local banks, with Japan’s assistance funds, finance projects using advanced
energy-saving technologies that comply with certain standards. Local financial institutions make
credit decisions on individual energy-saving projects. The effectiveness of an ESCO project is
assessed by ESCO operators to determine the applicability of a guaranteed savings contract.
This Study will further review this interest subsidy program in the future to make clear how the
program should be operated.

71
6. Project execution plan
6.1 Commercial complex
6.1.1 The installation of solar PV system
We make a proposal for the CO2 emission reductions by installing solar PV panels onto the
rooftop are in this building. The plan for the installation of solar PV system is shown below.
Layout plan of solar PV panels in each building (West Mall, Skybridge and East Mall) was
considered based on the site survey. The results are shown in Figure6-4, Figure6-5 and Figure6-6
using poly-crystalline solar PV panels that has been used most commonly in Japan. The installation
capacity is 790kW in West Mall, 160kW in Skybridge and 56kW in East Mall. Totally, the
installation capacity is 1,006kW, which is one of the largest rooftop solar PV systems in Indonesia.
Annual power generation is simulated using the climate data in Jakarta. The result is shown in
Figure6-5. Annual power generation is approximately 1,423MWh and capacity factor is around 16%.
Compared to the capacity factor in Japan, about 12%, more power generation is expected due to a
large amount of sunshine in Jakarta. Additionally, we calculated the power consumption reduction of
air conditioning systems through the insulation by solar PV panels. According to the experimental
result conducted by University of California, San Diego, the insulation rate by solar PV panels is
assumed 30%. As a result, the power consumption of air conditioning systems can be saved by
1,168MWh annually (Figure6-6). Therefore, total CO2 emission reduction is approximately
2,110ton-CO2 per year based on the grid emission coefficient.
Payback period is about 12 years using the feasibility simulation in consideration of energy-saving
benefit, maintenance cost and degradation of solar PV panels (Table 6-1).
Figure 6-1 Solar PV panel capacity in GI

72
Figure 6-2 Layout plan in West Mall
Figure 6-3 Layout plan in Skybrige

73
Figure 6-4 Layout plan in East Mall
Figure 6-5 Power generation simulation result

74
Figure 6-6 Power consumption reduction of air conditioning systems
Table 6-1 Feasibility simulation result
Benefit Cost Balance
MIDR MIDR MIDR
0 32,570 -32,570
1 2,988 83 -29,6642 2,980 83 -26,7663 2,972 83 -23,8774 2,964 83 -20,9955 2,956 83 -18,1226 2,948 83 -15,2577 2,940 83 -12,3998 2,932 83 -9,5509 2,924 83 -6,708
10 2,916 83 -3,87511 2,908 83 -1,04912 2,900 83 1,76913 2,893 83 4,57914 2,885 83 7,38115 2,877 83 10,17616 2,870 83 12,96317 2,862 83 15,74318 2,854 83 18,51419 2,847 83 21,27920 2,839 83 24,03621 2,832 83 26,78522 2,824 83 29,52723 2,817 83 32,26224 2,810 83 34,98925 2,802 83 37,709

75
With regard to project scheme, as basic a "financing programme for JCM model projects", to
establish an international consortium, such as shown in Figure 6-7.
Facility Installation, implementation of MRV and PDD, we are considering that it execute
collaboration with local partners and Japanese companies basically.
In addition, shown as the schedule in Figure 6-8, we are considering that to be adopted JCM.
According to This action, it is believed to be carried out facility installation and inspection in 2015
fiscal year.
Figure 6-7 Proposed Project Scheme
Figure 6-8 Proposed Project Schedule

76
6.1.2 Installing heating source technology
(1) Introduction technology and effect
Based on energy analysis, we deduced that the following 5 measures could be taken to mitigate
CO2 emissions (save energy).
① Effective use of waste gas :Recovering generator waste heat
→Currently, 4 generators (2,807kW output) are running on weekdays from 18:00 to 21:00
hours during the high BWP electricity tariff period. On weekends, 6 generators (same output)
run during that same period. Waste heat from the generators is not being made use of. By
recovering the waste heat to use in the secondary facilities to generate chilled water, the turbo
chillers that are currently in use can be turned off, thereby greatly reducing CO2 emissions.
② Install high-efficiency heating source equipment
→The hotel’s air-cooled chiller was installed about 12 years ago.
Due to the nature of its business, the hotel’s chiller is often run for long periods of time. As
such, it has experienced much wear and tear.
Revamping the heating system to a high-efficiency one will greatly contribute to a reduction
in CO2 emissions.
③ Anti-heat loss measures
→Currently, steam is produced by the gas-steam boiler and supplied to the secondary side
via steam pipes. However, as the joints are not insulated, there is heat loss at the joints.
Providing better insulation to the joints will reduce the heat lost as well as reduce the volume
of gas consumed by the boiler.
④ Improve the efficiency of the air supply system
→Currently, the AHU (outdoor air handling unit) is operating on fixed air volume. As a
result, even if the number of occupants in the building is small, an excessive amount of
conditioned air is being supplied. By installing a CO2 sensor on the AHU and installing
inverter controls for the fan, we can save energy by ensuring that only the necessary volume
of conditioned air is supplied.
⑤ Install Takasago Thermal Engineering’s BEMS system
→Data on energy is recorded on paper by the operator who is stationed on-site. As such, it is
not clear how energy usage is categorized. With the introduction of BEMS, the categories of
energy usage will be made clear, so that areas where energy is being wasted will be made
obvious, and energy can be saved by improving those areas.

77
Oparation Weekday 4.5h、Saturday and Sunday 5.5h
Monday Tuesday Wednesday Thursday Friday Saturday Sunday
〇 〇 〇 〇 〇 〇 〇
〇 〇 〇 〇 〇 〇 〇
〇 〇 〇 〇 〇 〇 〇
〇 〇 〇 〇 〇 〇 〇
〇 〇
〇 〇GE-6
Operation pattern
GE-1
GE-2
GE-3
GE-4
GE-5
① Effective use of waste gas・・・Recovering generator waste heat
【Current system】See below:
Currently, 4 generators (2,807kW output) are running on weekdays from 18:00 to 21:00 hours
during the high BWP electricity tariff period. On weekends, 6 generators (same output) run during
that same period. Waste heat from the generators is not being made use of. By recovering the waste
heat to use in the secondary facilities to generate chilled water, the turbo chillers that are currently in
use can be turned off, thereby greatly reducing CO2 emissions.
【Proposed system】See below:
Waste heat (hot water) will be extracted from waste gas produced by the generators and will be
used in the steam boiler. Energy can be saved by using the steam to produce chilled water.
【Reductions】
Waste gas from generatorsreleased from chimney
(Before upgrading)
Existing generators2,807kW×6 units
Chimney
~ ~ ~
(After upgrading)
Chimney
~ ~ ~
Waste heat-supplied steam boiler Steam
absorption chiller
Chilledwater
Hot water
Steam
Cooling tower
Cooling water
To building interior
New installation
Existing generators 2,807kW×6 units
1200RT5,160kg/h
2Unit
Electricity Gas
[kWh/year] [m3/year]
1 Effective use of unused waste gas 3,254,690
No Energy-saving measure
Survey results
Reduction in energy
consumption

78
PB-2nd FLOOR LAYOUT
Results of the details study from waste gas analysis
Recoverable amount of steam from 1 unit gas diesel generator 2,807kW(0.8Mpa) = 1,834 kg/h is gained
1 unit Absorption Chiller (1,200 RT) required 5,130 kg/h steam
3 units Gas Diesel Generator becomes 1 set
The maximum number of installed is 2 sets → It becomes 2 sets Absorption Chiller 1,200RT
By using of the exhaust gas of gas diesel generator, there is no impact of the draft ventilation1.Additional chimney short distance 2.Exhaust gas temperature after recovery(520℃→135℃)
No impact for generator efficiency
10111212.6131415
C
B
A
9
G1 G2 G3 G4
G5 G6
1 Set 1 Set
Waste heat supplied to steam boiler
5500kg/h
Steam Absorption Chiller 1200Rt
Cooling water pump Chilled water primary pump
Hot water tank5m3
Steam Absorption Chiller 1200Rt
Steam headerー
Chemical treatment
Waste heat supplied to steam boiler 5500kg/h
Cooling Water PumpChilled water primary pump
Hot water tank5m3
Steam header
Chemical treatment
Additional Chimney
Mezzanin Slab
10111212.6131415 9
RADIATOR 1
RADIATOR 3RADIATOR 2
RADIATOR 4
RADIATOR 6RADIATOR
5
PB-2nd FLOOR LAYOUT
Study result of GL floor installation space
2 sets Cooling Tower for 2 sets Steam Absorption Chiller 1200RT is maximum
1 set Cooling Tower 1200RT
1 set Cooling Tower 1200RT
Radiator for Generator relocation
Radiator for Generator relocation
Maintenance passage
Existing radiator No.5 must be relocated to higher level to avoid space for electrical room entrance
Other possibility by detail design
Waste hot water from Radiator can be use for boiler feed water heating, and make some extra energy saving. There is a possibility to eliminate some portion of radiator.

79
② Install high-efficiency heating source equipment
【Current system】See below:
Dismantle the existing air-cooled chiller (1 unit) and install a higher-efficiency air-cooled chiller
to make effective use of waste heat.
【Proposed system】See below:
By installing the EcoCute system which can supply chilled and hot water at the same time, the
electricity usage will be reduced. By making effective use of waste heat (chilled water) produced by
the EcoCute system, the number of chilled water heating source equipment in operation will be
reduced.
【Reductions】
Existing air-cooled chiller375Rt×2 units250Rt×2 units(2003 make)
Chilled water
To building interior
Air-cooled chiller
Upgrade 375Rt×1 unit
Air-cooled chiller (new installation)
150Rt×1 unit
Existing air-cooled chiller375Rt×1 unit250Rt×2 units
Ecocute heat source(new installation)
25Rt×6 units
Chilled water
Chilled water
Chilled water
Hot water (65℃)
※Chilled and hot water can be supplied at the same time
Upgraded and new system
Electricity Gas
[kWh/year] [m3/year]
2Installation of high-efficiency heating
source equipment675,880 133,270
No Energy-saving measure
Survey results
Reduction in energy
consumption

80
③ Anti-heat los s measures
【Current system】See below:
The steam valve and joints are not insulated, leading to heat loss after 1 year.
【Proposed system】See below:
Heat loss can be mitigated by providing the steam valve and joints with better insulation.
【Reductions】
強化部分
Electricity Gas
[kWh/year] [m3/year]
3 Countermeasures for boiler heat loss 5,030
No Energy-saving measure
Survey results
Reduction in energy
consumption

81
④ Improve the efficiency of the air supply system
【Current system】See below:
Currently, the AHU (outdoor air handling unit) is operating on fixed air volume. As a result, even
if the number of occupants in the building is small, an excessive amount of conditioned air is being
supplied. By installing a CO2 sensor on the AHU and installing inverter controls for the fan, we can
save energy by ensuring that only the necessary volume of conditioned air is supplied.
【Proposed system】See below:
By reducing the fan’s supply motor and the energy used by the heating source, energy usage can
be greatly reduced.
【Reductions】
Central monitoring equipment
OA
EA
SA
RA
Start/stop
AHUFor fans with capacity above 11kW
East Mall50 unitsWest Mall11 units
Inverter installation
Central monitoring equipment OA
EA
SA
RA
Start/stop & inverter controls
Start/stop & inverter controls
CO2 sensor
② CO2 concentration controlled by inverter
① Wind volume switch controls
① AHU air volume switch controls
② AHU CO2 controls
Electricity Gas
[kWh/year] [m3/year]
4Upgrading air supply system to high-
efficiency system2,048,870
No Energy-saving measure
Survey results
Reduction in energy
consumption
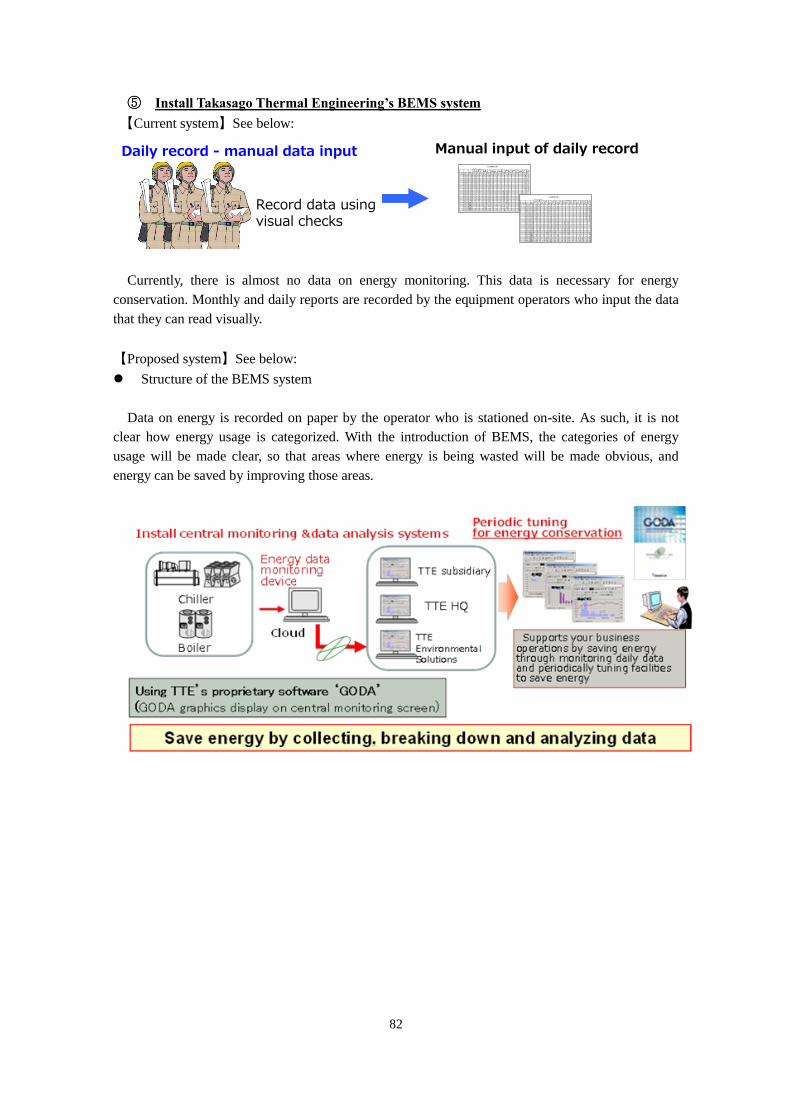
82
⑤ Install Takasago Thermal Engineering’s BEMS system
【Current system】See below:
Currently, there is almost no data on energy monitoring. This data is necessary for energy
conservation. Monthly and daily reports are recorded by the equipment operators who input the data
that they can read visually.
【Proposed system】See below:
Structure of the BEMS system
Data on energy is recorded on paper by the operator who is stationed on-site. As such, it is not
clear how energy usage is categorized. With the introduction of BEMS, the categories of energy
usage will be made clear, so that areas where energy is being wasted will be made obvious, and
energy can be saved by improving those areas.
冷水熱源運転日報(1)
2011年01月02日(日)システム 往水温度
システム 還水温度
システム 流量
システム 流量積算
システム 熱量
システム 熱量積算
R|1|3熱量
R|1|3熱量積
R|4熱量
R|4熱量積算
R|5熱量
R|5熱量積算
HEX|1 熱量
HEX|1 熱量積算
HEX|2 熱量
HEX|2 熱量積算
ページNo 日付 時刻 ℃ ℃ m3/h m3 GJ/h GJ MJ/h GJ MJ/h GJ MJ/h GJ MJ/h GJ MJ/h GJ1 2011/1/2 1:00 10.3 11.3 35 40 0.14 0.2 -84 0 0 0 0 0 0 0 236 0.21 2011/1/2 2:00 10.8 11.5 37 38 0.14 0.2 -3 0 0 0 0 0 0 0 198 0.21 2011/1/2 3:00 10.8 11.7 35 36 0.15 0.1 -33 0 0 0 0 0 0 0 236 0.221 2011/1/2 4:00 10.4 11.6 38 36 0.16 0.2 -107 0 0 0 0 0 0 0 266 0.221 2011/1/2 5:00 10.6 11.6 36 40 0.2 0.3 28 0 0 0 0 0 0 0 172 0.341 2011/1/2 6:00 10.7 11.6 34 38 0.17 0.2 67 0 0 0 0 0 0 0 108 0.231 2011/1/2 7:00 10.3 11.6 39 39 0.22 0.2 -68 0 0 0 0 0 0 0 267 0.231 2011/1/2 8:00 10.7 11.6 40 38 0.17 0.2 8 0 0 0 0 0 0 0 162 0.21 2011/1/2 9:00 10.6 11.4 47 49 0.19 0.2 -20 0 0 0 0 0 0 0 205 0.241 2011/1/2 10:00 10.3 11.8 64 52 0.3 0.2 -96 0 0 0 0 0 0 0 392 0.251 2011/1/2 11:00 10.3 11 57 64 0.18 0.3 -83 0 0 0 0 0 0 0 257 0.261 2011/1/2 12:00 10.5 11.6 55 55 0.25 0.2 -23 0 0 0 0 0 0 0 278 0.261 2011/1/2 13:00 10.5 11.5 52 51 0.25 0.2 -43 0 0 0 0 0 0 0 288 0.281 2011/1/2 14:00 10.4 11.9 41 51 0.24 0.3 -81 0 0 0 0 0 0 0 330 0.341 2011/1/2 15:00 9 11.5 39 44 0.39 0.3 -570 0 947 0.28 0 0 0 0 0 0.211 2011/1/2 16:00 6.9 9.2 44 42 0.44 0.5 -208 0 601 0.82 0 0 0 0 0 01 2011/1/2 17:00 7.1 9.1 41 41 0.32 0.3 -157 0 470 0.46 0 0 0 0 0 01 2011/1/2 18:00 7.2 9 38 41 0.3 0.3 -175 0 432 0.41 0 0 0 0 0 01 2011/1/2 19:00 7.3 9.3 52 46 0.42 0.4 -216 0 628 0.48 0 0 0 0 0 01 2011/1/2 20:00 7.1 8.9 49 43 0.32 0.3 -29 0 352 0.45 0 0 0 0 0 01 2011/1/2 21:00 7.2 8.8 38 40 0.26 0.3 -95 0 326 0.36 0 0 0 0 0 01 2011/1/2 22:00 7.2 8.8 37 36 0.25 0.3 -30 0 293 0.32 0 0 0 0 0 01 2011/1/2 23:00 7.2 8.7 39 38 0.23 0.2 -137 0 370 0.36 0 0 0 0 0 01 2011/1/2 0:00 7.2 8.7 35 34 0.24 0.2 17 0 243 0.31 0 0 0 0 0 01 2011/1/2 日合計 1032 6.1 0 4.25 0 0 3.681 2011/1/2 日最大 10.8 11.9 64 64 0.44 0.5 67 0 947 0.82 0 0 0 0 392 0.341 2011/1/2 日最小 6.9 8.7 34 34 0.14 0.1 -570 0 0 0 0 0 0 0 0 01 2011/1/2 日平均 9.2 10.6 43 43 0.25 0.3 -89 0 194 0.18 0 0 0 0 141 0.151 2011/1/2 月合計 2121 10.6 0 4.25 0 4.06 5.041 2011/1/2 月最大 10.8 11.9 64 1089 0.44 6.1 100 0 947 4.25 0 0 297 4.06 392 3.681 2011/1/2 月最小 6.9 8.7 33 1032 0.1 4.5 -570 0 0 0 0 0 0 0 0 1.361 2011/1/2 月平均 9.8 11 44 1061 0.22 5.3 -48 0 97 2.13 0 0 72 2.03 96 2.52
Record data using visual checks
Manual input of daily record Daily record - manual data input

83
Structure of performance improvement mechanism
Structure of operating plan and energy saving meetings
【Reductions】
【Cost-effectiveness】
The table below shows the number of years until break-even on investment, calculated using
approximate figures for cost savings due to energy-saving measures and installation expenses for
energy-saving equipment.
Taking into consideration factors that are not eligible for subsidy, the subsidy amount is calculated
as 1/3 of the project funds, rather than 1/2 (maximum ratio). Furthermore, design fees, on-site SV,
post-installation validation and reporting fees have also been added to the calculations for
installation expenses.
Therefore, given installation expenses of approximately 86,000,000,000 rupiah, the annual
savings on utilities expenses is 8,600,000,000 rupiah. Supposing that there is zero subsidy
contribution, it will take 10 years for the savings to break even. If there is contribution from subsidy,
break-even will occur in 6.7 years.
Electricity Gas
[kWh/year] [m3/year]
5Installation of Takasago Thermal
Engineering’s BEMS system124,640
No Energy-saving measure
Survey results
Reduction in energy
consumption

84
(2) Implementation Plan (Proposal)
An international consortium will be formed, composed of a Japanese project management company
and Indonesian companies that have facilities eligible for the installation of the equipment described
in this report. Japanese leasing companies may also be included in the consortium, if the situation
calls for it. Work on the equipment to be installed, as well as the provision of after-sales service will
be carried out the local subsidiary of the project management company, and if there is a need for it,
the local subsidiary will also contract with local companies for materials, installation, construction
work, etc. The table below shows the distribution of work by company, as well as the cash flow
between companies.
Figure 6-9 Organizational flow chart: Distribution of work and funds among the participants
1)Funds procurement and repayment
a. Procuring funds
In addition to funds derived from subsidies, self-financing and taking a loan from a leasing
company are also options for raising funds for the project. The diagram below shows the percentage
of the total funds that each option makes up.
Figure 6-10 Representative means of procuring funds
International consortium Project management company
(Japanese company (in Japan))• Paperwork for contract• Design & procure equipment• Validation, submit report
Facilities to be
retrofitted
(Indonesian
company)
・Install facilities
Ministry of the Environment/GEC
Indonesian subsidiary of Japanese construction
company
(Indonesian subsidiary of project management
company, etc.)・On-site installation, construction work
・After-sales service (maintenance)
【Subcontractor】●●
【Subcontractor】●●
【Subcontractor】●●
Cash flow
Indonesian subsidiary of Japanese leasing
company /
・Procurement of funds
・Repayment
【Subcontractor】●●
【Subcontractor】●●
【Supplier】●●
Subsidy
Private funds
Financing
Subsidy
Financing
40%
20%
40%
40%60% 40%60%
Subsidy
Financing
Private funds
Case1 Case2 Case3
With subsidyWith private funds
With subsidyWithout private funds
With subsidyWith private funds
Subsidy
FinancingSubsidy
Private funds

85
b. Repayment scheme for borrowed funds
If a portion of the funds procured for the project are borrowed from a leasing company, as
shown below, there are 3 ways in which the funds can be repaid after factoring in after-sales service
expenses: 1) full payout, 2) refinancing the loan, 3) purchasing.
2)Schedule
Our future schedule is as shown below. This year, we conducted feasibility studies on a
multi-purpose commercial building and a production facility (factory). Next year, we will install new
systems in a multi-purpose commercial facility that is highly interested in installing new equipment
and reducing their CO2 emissions. Next year, we plan to audit and review the proposed installations,
after which, we plan to install the equipment in the following year.
① Full payout → Repay full amount during service period② Refinancing → Re-contract with residual value* at end of service period③ Buyback → Buyback with residual value* at end of service period
* Residual value will be determined according to rate of lending and service period
6 9 12 3 6 9 12 3 6 9 12 3 6 9 12 3 6 9 12 3 9 3 9 3 9 3
Description □Large-scale ESCO f ie ld studies
1.Multi-purpose commercial building□Design, apply for subsidy
□ Install facilities, validation, submit report ① Installed within 1 yearHotel: →Purchase CO2 credits(High-efficiency chiller, HP, boiler heat loss countermeasures)Overall: (BEMS)
② Installed over several yearsShopping centre:(Chiller run on waste heat, CO2 controls for OA supply) →Purchase CO2 credits
→Purchase CO2 credits
2014 2015 2016 2016 2017 2018
Multi-purpose commercial building, production facility(factory), etc.
2019 2020
Design, quotation,
subsidy application, contract
Work done in
1st year→Audit
Work done in 2nd year→Audit
Validation,submit report
Validation, submit report
Work done in
1st
year→Audit
Validation, submit report
Targeted items→field studies
→Proposal to customer→Submit report

86
6.2 Hotel
The table below shows lamps commonly used in the hotel building. A total of 2,600 incandescent
lamps are used in passages and guestrooms. Specifically, lighting devices are used on the passages
all through the day because the intermediate platforms on the passages prevent the entry of external
light. In addition, a substantial amount of power is consumed by guestrooms used by hotel guests.
The ballroom is furnished with about 1,000 lighting devices, all of which are turned on while the
room is being used.
The table below discusses reductions in power consumption achieved by the new lighting devices
to determine the payback period for the investment.

87
Table 6-1 Investment and effect of replacement of lighting devices
[Existing apparatus]
Site Lamp type Lamp shape Quantity
(unit)
Electricity
consumption
(W)
Lighting
hours
(h / day)
Lighting
days
(day / year)
Operating
ratio
(-)
Annual electricity
consumption
(kWh / year)
Passage Incandescent lamp Candle (E14) 284 15 24 365 1.00 37,318
Guestroom Incandescent lamp Candle (E14) 988 15 8 365 0.75 32,456
Guestroom Incandescent lamp Softone (E27) 1,328 25 8 365 0.75 72,708
Guestroom
Minimum-halogen
lamp Halogen (Mr16) 1,208 35 8 365 0.75 92,593
Ballroom Incandescent lamp
Candle (E14) 1,000 15 12 150 1.00 27,000
Total 262,075
[After replacement]
Site Lamp type Lamp shape Quantity
(unit)
Electricity
consumption
(W)
Lighting
hours
(h / day)
Lighting
days
(day / year)
Operating
ratio
(-)
Annual electricity
consumption
(kWh / year)
Passage LED Candle (E14) 284 3 24 365 1.00 7,464
Guestroom LED Candle (E14) 988 3 8 365 0.75 6,491
Guestroom LED Globe (E27) 1,328 7 8 365 0.75 20,358
Guestroom LED Beam (Mr16) 1,208 7 8 365 0.75 18,519
Ballroom LED Candle (E14) 1,000 3 12 150 1.00 5,400
Total 58,232
Electricity reduction
(kWh / year) 203,843
CO2 emission reduction
(t-CO2 / year) 148.8
Reduction (IDR) 224,227,344
[Investment vs. effects]
Site Lamp Quantity (unit)
Unit price
of apparatus
(IDR)
Total price of
apparatus
(IDR)
Unit
construction
price (IDR)
To price of construction
(IDR) Grand total (IDR)
Passage Candle (E14) 284 150,000 42,600,000 10,000 2,840,000 45,440,000
Guestroom Candle (E14) 988 150,000 148,200,000 10,000 9,880,000 158,080,000
Guestroom Globe(E27) 1,328 125,000 166,000,000 10,000 13,280,000 179,280,000
Guestroom Beam (Mr16) 1,208 200,000 241,600,000 10,000 12,080,000 253,680,000
Ballroom Candle (E14) 1,000 150,000 150,000,000 150,000 150,000,000 300,000,000
Investment (IDR) 936,480,000
Reduction (IDR) 224,227,344
Payback period 4.18 years

88
6.3 Industry(factory)
6.3.1 Energy analysis
Figure 6-11 shows the annual usage ratio of electricity by equipment. Spinning machines in the
spinning factory account for 68% of the factory’s total electricity consumption. By replacing the
existing production equipment with high-efficiency units, it is possible to enhance production
efficiency, save energy, and significantly reduce CO2 emissions.
This Study was focused on utility apparatuses at a spinning factory, rather than on production
equipment. Chillers, pumps, and cooling towers used in air-conditioning systems represent 7% of the
factory’s total electricity consumption, while air compressors, cooling towers, and pumps necessary
for the factory account for 25%. Updating or replacing these apparatuses will contribute to CO2
reductions.
Figure 6-11 Annual usage ratio for electricity by equipment (July 2013-June 2014)
Figure 6-12 Monthly electricity consumption by equipment (July 2013-June 2014)
Figure 6-12 shows the monthly breakdown of electrical usage by category. In each month,
electricity consumption for equipment not used for production (equipment not including the SPIN

89
machine, etc.) is stable at 1,000,000kWh/month. As the electricity consumed by the production
equipment depends on production demands, maximum consumption was in February
(2,238,544kWh/month), about 1.5 times the electricity consumed in November
(1,434,632kWh/month), the month of lowest electricity consumption.
Figure 6-13 shows the annual percentage of gas usage by category. Gas used for production makes
up 19% of total gas used, while the boiler uses 81% of the total gas usage. By implementing
energy-saving measures for the gas boiler, CO2 emissions can be greatly reduced.
Figure 6-13 Percentage of annual gas usage by category, July 2013 to June 2014
Figure 6-14 shows the figures for monthly gas usage. The volume of gas used in a month is
dependent mainly on the volume of production and the figures vary by each month.
Figure 6-14 Monthly gas usage by category, July 2013 to June 2014

90
6.3.2 Measures to mitigate CO2 emissions (energy conservation)
(1) Introduction technology and effect
Based on energy analysis, we deduced that the following 5 measures could be taken to mitigate
CO2 emissions (save energy).
① Revamp the heating source system
→Replace the existing turbo chillers with new ones
→Install secondary chilled water pump and variable flow controls
→Replace cooling water pump with new one and install variable flow controls
→Close the cooling water pipe system
→Close the chilled water pipe system
② Install co-generation system
→Currently, steam is produced by the boiler which uses gas. Indonesia has a particularly bad
situation with electricity supply. As such, by installing a co-generation system, energy can be
saved by generating electricity and supplying steam at the same time.
③ Replace cooling tower for the compressor with new one
→The existing cooling tower used for the compressor is considered to have become worn out
due to poor water quality at the factory, as well as through long use. This has caused the
cooling tower’s rate of heat exchange to have dropped. By changing the cooling tower, and
thereby improving the compressor’s efficiency, energy can be saved.
④ Install Takasago Thermal Engineering’s BEMS system
→Data on energy is recorded on paper by the operator who is stationed on-site. As such, it is
not clear how energy usage is categorized. With the introduction of BEMS, the categories of
energy usage will be made clear, so that areas where energy is being wasted will be made
obvious, and energy can be saved by improving those areas.
⑤ Replace production machinery with new ones
→By replacing the machines used at the spinning factory with higher-efficiency models,
pressurized air energy used for production and the electricity used to run the production
machinery can be reduced.

91
① Revamp the heating source system-1
【Current system】See below:
A Cooling tower installation
Existing cooling tower is facing wear and tear.
B Cooling water tank installation
The cooling water tank uses an open system that requires a lot of power to supply water and is a
source of corrosion. This has caused scale to build up in the chiller, which in turn results in the
chiller’s efficiency going down.
C Chilled water tank installation
The chilled water tank uses an open system that requires a lot of power to supply water and is a
source of corrosion. This has caused scale to build up in the chiller, which in turn results in the
chiller’s efficiency going down.

92
D Chiller
The chillers were installed 15 years ago. There are 2 turbo chillers but as only one is used to carry
out basic operations over a long period of 24 hours, it can be assumed that its efficiency has gone
down by a fair bit.
Return chilled water
Chilled Water tankCondenser Water tank
Evaporator2
Evaporator1
Condenser2
Condenser1
Cooling tower
Inefficient open chilled water &cooling water tank
Aging cooling tower
Chiller’s performance has decreased due to aging
Back condenserWater

93
【Proposed system】See below:
・Replace existing turbo chillers with new ones
・Install secondary chilled water pump and variable flow controls
・Replace cooling water pump with new one and install variable flow controls
・Close the cooling water pipe system
・Close the chilled water pipe system
【Reductions】
Returnchilled water
Evaporator2
Evaporator1
Condenser2
Condenser1
Cooling tower
BackcondenserWater
Upgrade turbo chiller
Upgrade cooling tower
Closing of pipes
Upgrade
Capacity:550RT
Electricity Gas
[kWh/year] [m3/year]
1Upgrading the heating source
system-11,294,760 #VALUE!
Reduction in energy
consumptionNo Energy-saving measure
Survey results

94
① Revamp the heating source system-2
【Existing system】See below:
The primary pump is used for the heating source system which supplies more than the required
load for the secondary pump, resulting in a lot of need for the pump’s supplying action.
【Proposed system】See below:
【Reductions】
Chiller
Chiller
Primary pump system⇒ Requirement: uniform water supply from
different linesIf flow rate is insufficient, need to useunnecessary heating source equipment
Using secondary pump and inverter controls
・ Install inverter
・ Install secondary pump system
Primary pump variable flow controls(install inverter + energy-saving controls)
Secondary pump variable lift / variable flow controls
(install inverter + energy-saving controls)
Heating source controller
・ Use heating source controller forhigh-efficiency control
Chiller
Chiller
Installed inverterz
Electricity Gas
[kWh/year] [m3/year]
1Upgrading the heating source
system-245,140 #VALUE!
Reduction in energy
consumptionNo Energy-saving measure
Survey results

95
② Install co-generation system
【Current system】See below:
Waste heat is not used effectively as gas is injected into the machine and steam is supplied to the
production machinery.
【Proposed system】See below:
By installing a co-generation system, energy can be saved by generating electricity and supplying
steam at the same time.
【Reductions】
GAS Steam header
SPIN machine
Steam supply
Steam boiler
GAS
Steam supply (0.8Mpa)2700kg/h
Steam header
SPIN machine
Steam supply
Electricity supply
Co-generation system875kVA
Electricity generated: 700kW
Exhaust gas boiler
Electricity Gas
[kWh/year] [m3/year]
2 Installing co-generation system 3,631,490 -802.820
Reduction in energy
consumptionNo Energy-saving measure
Survey results

96
③ Replacing the cooling towers for the compressor with new ones
【Current system】See below:
【Proposed system】See below:
The existing cooling tower used for the compressor is considered to have become worn out due to
poor water quality at the factory, as well as through long use. This has caused the cooling tower’s
rate of heat exchange to have dropped. By changing the cooling tower, and thereby improving the
compressor’s efficiency, energy can be saved.
【Reductions】
Cooling tower ×2 units
Aging cooling tower
277RT, 260RT
Improve compressor’s cooling capacity by upgrading cooling tower
Upgrading
Cooling tower
Electricity Gas
[kWh/year] [m3/year]
3Upgrading compressor cooling
tower330,800
Reduction in energy
consumptionNo Energy-saving measure
Survey results

97
④ Install Takasago Thermal Engineering’s BEMS system
【Current system】See below
Currently, there is almost no data on energy monitoring. This data is necessary for energy
conservation. Monthly and daily reports are recorded by the equipment operators who input the data
that they can read visually.
【Proposed system】See below:
Structure of the BEMS system
Data on energy is recorded on paper by the operator who is stationed on-site. As such, it is not
clear how energy usage is categorized. With the introduction of BEMS, the categories of energy
usage will be made clear, so that areas where energy is being wasted will be made obvious, and
energy can be saved by improving those areas.

98
Structure of performance improvement mechanism
Structure of operating plan and energy saving meetings
【Reductions】
Electricity Gas
[kWh/year] [m3/year]
4Energy data device (BEMS) and
tuning for energy conservation334,490
Reduction in energy
consumptionNo Energy-saving measure
Survey results

99
25%
5%2%
0%68%
COMPRESSOR, COOLING TOWER, PUMPCHILLERPOMPA EVA & CONDCOOLING TOWER CHILLERSPIN machine and other
⑤ Replacing production machinery (spinning machinery) with new ones
By replacing the spinning machinery with new ones, the volume of pressurized air used for
production can be reduced, and the electricity consumed by the production machinery can be
reduced as well.
The compressor used in production will reduce its electricity consumption from 25% of total
electricity consumption to 17%, and the production machinery will reduce their electricity
consumption from 68% of the total to 58%.
【Reductions】
Electricity Gas
[kWh/year] [m3/year]
5 Production Equipment Renewal 20,549,140
Reduction in energy
consumptionNo Energy-saving measure
Survey results
Compressor25%→17%Production Equipment
68%→58%

100
【Cost-effectiveness】
The table below shows the number of years until break-even on investment, calculated using
approximate figures for cost savings due to energy-saving measures and installation expenses for
energy-saving equipment.
Taking into consideration factors that are not eligible for subsidy, the subsidy amount is calculated
as 1/3 of the project funds, rather than 1/2 (maximum ratio). Furthermore, design fees, on-site SV,
post-installation validation and reporting fees have also been added to the calculations for
installation expenses.
Therefore, given installation expenses of approximately 101,000,000,000 rupiah, the annual
savings on utilities expenses is 23,000,000,000 rupiah. Supposing that there is zero subsidy
contribution, it will take 4.4 years for the savings to break even. If there is contribution from subsidy,
break-even will occur in 2.9 years. As the effectiveness of replacing the production machinery is
considerably promising, there is a need to carry out detailed audits to get more concrete details.
① ② ②/① ③ (②-③)/①
Electricity Gas
Reduction in
spending on
utilities
Installation cost
No. of years to
investment
payout
Subsidy received
After Subsidy
received
No. of years to
[kWh/year] [m3/year] [Rp/year] [Rp] [year] [Rp] [year]
1Upgrading the heating
source system1,339,900 1,182,900,000 15,068,400,000 12.7
2Installing co-generation
system3,631,490 -803 3,190,400,000 25,500,400,000 8.0 MAX
3Upgrading compressor
cooling tower330,800 290,400,000 2,362,600,000 8.1 33,680,900,000
4Energy data device (BEMS)
and tuning for energy
conservation
334,490 271,600,000 1,724,100,000 6.3
5 Production Equipment Renewal 20,549,140 18,042,100,000 56,387,700,000 3.1
26,185,820 -803 22,977,400,000 101,043,200,000 4.4
Reduction in energy
consumption
Total
2.9
No Energy-saving measure
Survey results
Reduction in utilities spending
22,977,400,000 Rp/year
Installation cost
101,043,200,000 Rp

101
(2) Implementation Plan (Proposal)
An international consortium will be formed, composed of a Japanese project management company
and Indonesian companies that have facilities eligible for the installation of the equipment described
in this report. Japanese leasing companies may also be included in the consortium, if the situation
calls for it. Work on the equipment to be installed, as well as the provision of after-sales service will
be carried out the local subsidiary of the project management company, and if there is a need for it,
the local subsidiary will also contract with local companies for materials, installation, construction
work, etc. The table below shows the distribution of work by company, as well as the cash flow
between companies.
Figure 6-15 Organizational flow chart: Distribution of work and funds among the participants
1)Funds procurement and repayment
a. Procuring funds
In addition to funds derived from subsidies, self-financing and taking a loan from a leasing
company are also options for raising funds for the project. The diagram below shows the percentage
of the total funds that each option makes up.
Figure 6-16 Representative means of procuring funds
International consortium Project management company
(Japanese company (in Japan))• Paperwork for contract• Design & procure equipment• Validation, submit report
Facilities to be
retrofitted
(Indonesian
company)
・Install facilities
Ministry of the Environment/GEC
Indonesian subsidiary of Japanese construction
company
(Indonesian subsidiary of project management
company, etc.)・On-site installation, construction work
・After-sales service (maintenance)
【Subcontractor】●●
【Subcontractor】●●
【Subcontractor】●●
Cash flow
Indonesian subsidiary of Japanese leasing
company /
・Procurement of funds
・Repayment
【Subcontractor】●●
【Subcontractor】●●
【Supplier】●●
Subsidy
Private funds
Financing
Subsidy
Financing
40%
20%
40%
40%60% 40%60%
Subsidy
Financing
Private funds
Case1 Case2 Case3
With subsidyWith private funds
With subsidyWithout private funds
With subsidyWith private funds
Subsidy
FinancingSubsidy
Private funds

102
b. Repayment scheme for borrowed funds
If a portion of the funds procured for the project are borrowed from a leasing company, as
shown below, there are 3 ways in which the funds can be repaid after factoring in after-sales service
expenses: 1) full payout, 2) refinancing the loan, 3) purchasing.
2)Schedule
Our future schedule is as shown below. This year, we conducted feasibility studies on a
multi-purpose commercial building and a production facility (factory). Next year, we will install new
systems in a multi-purpose commercial facility that is highly interested in installing new equipment
and reducing their CO2 emissions. Next year, we plan to audit and review the proposed installations,
after which, we plan to install the equipment in the following year.
① Full payout → Repay full amount during service period② Refinancing → Re-contract with residual value* at end of service period③ Buyback → Buyback with residual value* at end of service period
* Residual value will be determined according to rate of lending and service period
6 9 12 3 6 9 12 3 6 9 12 3 6 9 12 3 6 9 12 3 9 3 9 3 9 3
Description □Large-scale ESCO f ie ld studies
2.Production facility (factory)□Design , apply for subsidy
① Installed within 1 year(High-efficiency heating source, co-generation system, compressor, BEMS)
→Purchase CO2 credits② Installed over several years(Manufacturing equipment)
→Purchase CO2 credits
→Purchase CO2 credits
2014 2015 2016 2016 2017 2018
Multi-purpose commercial building, production facility(factory), etc.
2019 2020
Targeted items→field studies
→Proposal to customer→Submit report
Work done in 1st
year→AuditValidation, submit report
Work done in 1st year→Audit Validation, submit report
Work done in 2nd year→Audit Validation, submit report
Subsidy application, contractDesign,
quotation

103
6.4 Office building
6.4.1 Office building A
(1) Cut in electricity charge for the building
Figure 6-17 Cut in electricity charge
The Figure 6-17 shows the current electricity charge could be cut, by replacing the existing system
with our proposed high-performance air conditioning system. According to information we received
from the staff, the building currently uses 10,300MWh per year.
By renewing system, this could be cut by 1,000MWh. A reduction to 9,300MWh per year. This
would mean a 36% cut in power use for air conditioning, equivalent to a 10% cut in power use for
the whole building. This means, 1,200,000,000 Rp per year could be saved.
(2) CO2 reduction by the building A/C system renewal.
Figure 6-18 CO2 reduction
The Figure 6-18 shows the cut in Carbon dioxide emission that could be achieved by renewing the
air conditioning system. By the graph, a very significant cut of 730 tons of CO2 per year could be
achieved with installation of high-performance type.

104
(3) Cost recovery period for renewal work
Table 6-2 Cost recovery period for renewal work
The table summarizes reductions in power-use that could be made through our proposed renewal
work.A construction cost to achieve the reduction in electricity charge is 21billion 600 million Rp.
The cost recovery period is 18 years.
(4) Proposed renewal project scheme
Figure 6-19 Project scheme

105
The Figure 6-19 shows a renewal project scheme which we studied as part of the energy audit.
Although Kyudenko has not yet received final comments from the building’s business operator
regarding its intentions, we propose to implement this project; Mitsubishi Research Institute and
Mitsubishi UFJ Morgan Stanley Securities construct its scheme.
Indonesia’s target building’s business operator and Japan’s Kanematsu take joint charge of this
renewal project.
And that renewal work be jointly implemented by Kyudenko and PT Denki Engineering
Installation of chillers and BEMS would be done by Japanese manufactures.
(5) Renewal plan
Figure 6-20: Renewal plan
The Figure 6-20 shows the four major processes of our renewal plan. We would plan to adopt the
concurrent building method. This means that while we discussed the design with you, work would
be executed at the same time. Various checks on renewal time and guidelines would be carried out,
to guarantee renewal quality. After completion, we would regulate all renewal equipment, carry out
a test run, and train your operators to control energy use using BEMS.

106
(6) Proposed renewal schedule
Figure 6-21 : proposed renewal schedule
The Figure 6-21 shows our proposed renewal schedule for the target building’s air conditioning
system. It is assumed that we would receive the building’s business operator approval on
specifications for air conditioning units and ancillary equipment about 8 months after contract
signing. And after the work started, about 2.5 months would be needed to finish. Renewal for two
floors would take about one mouth.
(7) Joint Crediting Mechanism Approved Methodology of the renewal plan.
About this building A/C system renewal plan, already apply the methodology JCM_ ID_AM002
_Ver01.0 that has been approved by the Indonesian government, were carried out to calculate the
effect size. The table 6-2 and 6-3 show a reduction due to the methodology. The difference between
RE:the reference emissions and PE: the project emissions is 243 t-CO2/year. The difference between
EE:the existing emissions and PE: the project emissions is 737 t-CO2/year.

107
6.4.2 Office building B
(1) The CO2 reduction proposal by renewal of air conditioning in the office
Air-conditioning of this building is a multi-type air-conditioning unit (an interior unit is a ceiling
hide type), and the interior unit and the exterior unit are connected by 1 to 1. 16 sets are installed in
each story. Moreover, one set of air-conditioning unit for elevator halls are installed (Figure 6-22).
The case study at the time of renewing these air-conditioning units in the newest model is shown in
Table 6-3.
Figure 6-22 Layout of air-conditioning unit
Table 6-3 Comparison of before/after specification of air-conditioning unit
ITEM Existing Equipment Renewal Equipment
Cooling Capacity 14.0kW 13.5kW
Total Input 5.64kW 4.41kW
EER 2.48 3.06
:indoor unit (for office) :indoor unit (for common
area)
:outdoor unit
space

108
【Existing image】
【Renewal image】
Renewal of indoor/outdoor unit
Figure 6-23 Image of renewal of air-conditioning unit

109
Table 6-4 Case study of CO2 reduction by renewal
FLOOR 1F Current System(kW) Recommended
System(kW)
Equip. Name Indoor
Unit
Outdoor
Unit
Comp.
INPUT
Cond.
Fan
Input
Evap.
Fan
Input
Sub
total
Grand
Total
Sub
total
Grand
Total
QTY QTY kW kW kW kW kW kW kW
PAC-1/CU-1-1 1 1 4.8 0.24 0.6 5.64 5.64 4.41 4.41
PAC-1/CU-1-2 1 1 4.8 0.24 0.6 5.64 5.64 4.41 4.41
PAC-2/CU-2-3 1 1 15.4 0.6 2.0 18.0 18.0 13.16 13.16
PAC-2/CU-2-4 1
PAC-2/CU-2-11 1 1 15.4 0.6 2.0 18.0 18.0 13.16 13.16
PAC-2/CU-2-12 1
PAC-1/CU-1-5 1 1 4.8 0.24 0.6 5.64 5.64 4.41 4.41
PAC-1/CU-1-6 1 1 4.8 0.24 0.6 5.64 5.64 4.41 4.41
PAC-1/CU-1-7 1 1 4.8 0.24 0.6 5.64 5.64 4.41 4.41
PAC-1/CU-1-8 1 1 4.8 0.24 0.6 5.64 5.64 4.41 4.41
PAC-1/CU-1-9 1 1 4.8 0.24 0.6 5.64 5.64 4.41 4.41
PAC-1/CU-1-10 1 1 4.8 0.24 0.6 5.64 5.64 4.41 4.41
PAC-1/CU-1-13 1 1 4.8 0.24 0.6 5.64 5.64 4.41 4.41
PAC-1/CU-1-14 1 1 4.8 0.24 0.6 5.64 5.64 4.41 4.41
PAC-1/CU-1-15 1 1 4.8 0.24 0.6 5.64 5.64 4.41 4.41
PAC-1/CU-1-16 1 1 4.8 0.24 0.6 5.64 5.64 4.41 4.41
PAC-1/CU-1-17 1 1 4.8 0.24 0.6 5.64 5.64 4.41 4.41
PAC-6/CU-6-18 1 1 1.4 0.15 0.05 1.6 1.6 5.00 5.00
PAC-6/CU-6-19 1 1 1.4 0.15 0.05 1.6 1.6 5.00 5.00
Total 112.52 93.65

110
Table 6-5 Case study of CO2 reduction by renewal
FLOOR 2F-19F Current System(kW) Recommended
System(kW)
Equip. Name Indoor
Unit
Outdoor
Unit
Comp.
INPUT
Cond.
Fan
Input
Evap.
Fan
Input
Sub
total
Grand
Total
Sub
total
Grand
Total
QTY QTY kW kW kW kW kW kW kW
PAC-1/CU-1-1 17 17 4.8 0.24 0.6 5.64 95.88 4.41 74.97
PAC-1/CU-1-2 17 17 4.8 0.24 0.6 5.64 95.88 4.41 74.97
PAC-1/CU-1-3 17 17 4.8 0.24 0.6 5.6 95.9 4.41 74.97
PAC-1/CU-1-4 17 17 4.8 0.24 0.6 5.64 95.88 4.41 74.97
PAC-1/CU-1-5 17 17 4.8 0.24 0.6 5.6 95.9 4.41 74.97
PAC-1/CU-1-6 17 17 4.8 0.24 0.6 5.64 95.88 4.41 74.97
PAC-1/CU-1-7 17 17 4.8 0.24 0.6 5.64 95.88 4.41 74.97
PAC-1/CU-1-8 17 17 4.8 0.24 0.6 5.64 95.88 4.41 74.97
PAC-1/CU-1-9 17 17 4.8 0.24 0.6 5.64 95.88 4.41 74.97
PAC-1/CU-1-10 17 17 4.8 0.24 0.6 5.64 95.88 4.41 74.97
PAC-1/CU-1-11 17 17 4.8 0.24 0.6 5.64 95.88 4.41 74.97
PAC-1/CU-1-12 17 17 4.8 0.24 0.6 5.64 95.88 4.41 74.97
PAC-1/CU-1-13 17 17 4.8 0.24 0.6 5.64 95.88 4.41 74.97
PAC-1/CU-1-14 17 17 4.8 0.24 0.6 5.64 95.88 4.41 74.97
PAC-1/CU-1-15 17 17 4.8 0.24 0.6 5.64 95.88 4.41 74.97
PAC-1/CU-1-16 17 17 4.8 0.24 0.6 5.64 95.88 4.41 74.97
PAC-1/CU-1-17 17 17 4.8 0.24 0.6 5.64 95.88 4.41 74.97
Total 1,629.96 1,274.49

111
Table 6-6 Case study of CO2 reduction by renewal
On the following conditions, we make the trial calculation of the annual amount of electric power
reduction.
- Operation time per day: 12 hours
- Annual operation days: 250 days
- Annual average load factor: 0.8
FLOOR 20F Current System Recommended System
Equip. Name Indoor
Unit
Outdoor
Unit
Comp.
INPUT
Cond.
Fan
Input
Evap.
Fan
Input
Sub
total
Grand
Total
Sub
total
Grand
Total
QTY QTY kW kW kW kW kW kW kW
PAC-1/CU-1-1 1 1 4.8 0.24 0.6 5.64 5.64 4.41 4.41
PAC-1/CU-1-2 1 1 4.8 0.24 0.6 5.64 5.64 4.41 4.41
PAC-2/CU-2-3 1 1 15.4 0.6 2.0 18.0 18 13.16 13.16
PAC-2/CU-2-4 1
PAC-2/CU-2-13 1 1 15.4 0.6 2.0 18.0 18 13.16 13.16
PAC-2/CU-2-14 1
PAC-1/CU-1-5 1 1 4.8 0.24 0.6 5.64 5.64 4.41 4.41
PAC-1/CU-1-6 1 1 4.8 0.24 0.6 5.64 5.64 4.41 4.41
PAC-1/CU-1-7 1 1 4.8 0.24 0.6 5.64 5.64 4.41 4.41
PAC-1/CU-1-8 1 1 4.8 0.24 0.6 5.64 5.64 4.41 4.41
PAC-1/CU-1-9 1 1 4.8 0.24 0.6 5.64 5.64 4.41 4.41
PAC-1/CU-1-10 1 1 4.8 0.24 0.6 5.64 5.64 4.41 4.41
PAC-1/CU-1-11 1 1 4.8 0.24 0.6 5.64 5.64 4.41 4.41
PAC-1/CU-1-12 1 1 4.8 0.24 0.6 5.64 5.64 4.41 4.41
PAC-1/CU-1-15 1 1 4.8 0.24 0.6 5.64 5.64 4.41 4.41
PAC-1/CU-1-16 1 1 4.8 0.24 0.6 5.64 5.64 4.41 4.41
PAC-1/CU-1-17 1 1 4.8 0.24 0.6 5.64 5.64 4.41 4.41
Total 109.32 83.65
Grand Total 1,851.8 1,451.79

112
Table 6-7 Cost simulation of renewal
Item Unit Value
Electricity consumption of existing
equipment kWh/year 4,444,320
Electricity consumption of renewal
equipment kWh/year 3,484,320
Annual electricity consumption kWh/year 960,000
Annual cost reduction of electricity*1
IDR/year 1,056,000,000
Annual CO2 emission reduction *2
t-CO2/year 781
Investment (Rough estimation) IDR 30,000,000,000
Payback period year 28.4
*1: 1,100IDR/kWh *2: 0.814t-CO2/MWh
(2) The CO2 reduction proposal by renewal of lighting in the office
The layout of the lighting of this building is shown in figure 6-24. Existing equipment is an object
for FL36Wx2 lighting, are 380 per one floor, and sets 17 floors as the object of case study.
Figure 6-24 Layout of lighting equipment

113
The renewal procedure for replacement the existing fluorescent lamp with LED lamp is shown in
figure 6-25.
First, remove the existing ballast as Step 1.
As Step 2, the socket of one side removes wiring and changes it into the state where it is not
connecting with electricity. Moreover, wiring substitute among the wiring which became open, and
change into the state where only one side connect with electricity.
It will be in the state which can be turned on by finally connecting the socket side which can be
turned on electricity the power supply input side of an LED lamp.
Figure 6-25 Procedure of lighting renewal
<Renewal step 1>
・Remove the existing ballast
fluorescent lamp
・Wiring substitute with
removing the existing
ballast
・Installation of LED lamp
<Renewal step 2>
<Renewal step 3>

114
The spec. of the equipment which is due to be renewed is shown below.
Figure 6-26 Spec of LED lamp
Existing fluorescent lighting equipment consumes 72W per unit, since an LED lamp consumes
18.5W, it can expect reduction of about 70% of power consumption. The projection of annual power
consumption and the amount of CO2 reduction is shown in table 6-8.

115
Table 6-8 Impact of replacement with LED
項目 単位 値
Electricity consumption of existing
equipment kWh/year 1,294,894
Electricity consumption of renewal
equipment kWh/year 307,537
Annual electricity reduction kWh/year 987,357
Annual cost reduction of electricity *1
IDR/year 1,086,092,410
Annual CO2 emission reduction *2
t-CO2/year 803.7
Investment (Rough estimation) IDR 1,692,520,000
Payback period year 1.56

116
With regard to project scheme, as basic a "financing programme for JCM model projects", to
establish an international consortium, such as shown in Figure 6-27.
Facility Installation, implementation of MRV and PDD, we are considering that it execute
collaboration with local partners and Japanese companies basically.
In addition, shown as the schedule in Figure 6-8, we are considering that to be adopted JCM.
According to This action, it is believed to be carried out facility installation and inspection in 2015
fiscal year.
Figure6-27 Proposed Project Scheme
Figure 6-28 Proposed Project Schedule

117
7. Workshop “Financing Options for Energy Efficiency Projects for Buildings
and Industries in Indonesia”
Q&A Summary
Panel Session 1
Mrs. Liana Bratasida, Executive Director, APKI (Indonesia Paper & Pulp Association)
1) To MOI : Mrs. Liana appreciated the efforts of MOI to bring Sustainability issue into the center stage of MOI activities. There are already existing criteria and standards for sustainability that are recognized by Indonesia government, such as PROPER (http://www.menlh.go.id/proper/) and Sustainability Business award, so it is hoped that the standards to be developed by MOI can be synchronized with the existing standards, awards, and criteria.
(Mrs. Shinta) : MOI appreciated the inputs from Mrs. Liana and in fact, they also already do synchronization with existing standards and criteria. In fact, since 2014, MOI has included PROPER as the mandatory criteria for Green Industry award, so each industry considered must first meet PROPER criteria. Mrs. Shinta also urged the financial institutions to utilize PROPER as the criteria for financing accessibility for companies / industries.
2) To JCM Secretariat : How is the progress of International recognition towards JCM, because Indonesia has put a lot of efforts towards this mechanism, and certainly would like it to be recognized by international such as UNFCCC ?
How is the price of Emission Reduction Unit (Carbon Unit) of JCM ? Is it comparable with existing one such as CER of CDM ? Also, how is the allocation towards the project owner and Japanese counterpart.
(Mr. Dicky) : Currently JCM is a bilateral cooperation between Japan and Indonesia (and also with other developing countries). There are 12/13 counterparts of Japan for this JCM, and Japan is continuously participating in international meetings in UNFCCC to gain recognition of JCM and to be included in one of alternate market mechanism, hopefully by Paris Summit 2015. While Indonesia is not the first country which signed JCM, but it is definitely the most advanced country in implementation of the scheme to become the role model by having many FS and demonstration projects. While international recognition is slow, this emission reduction can still be counted in INDCs (Intended Nationally Determined Contributions; http://www.wri.org/indc-definition) towards the reduction of the relevant parties.
About the allocation, it depends on the share of each party in the project. But there is Net Emission Reductions (difference between BAU and average emissions), which automatically belong to Indonesia and can be reported.
About the price, so far the emission reductions achieved between the two countries
are not tradable in international market, so the price is 0. The reason for not being
tradable is because the basis / scheme has been modified such that there is a
grant / upfront payment from Japanese government to compensate for the ER.
(Question from the floor) : Is the technology to be used here must come from Japan ?
(Mr. Dicky) : Yes, it is part of the leapfrog initiative using advanced technologies. In

118
Indonesia it has been done in 2 cities currently, i.e. Surabaya (for waste management, transportation, EE, etc) and Bandung (smart street lighting, waste management) through JCM.
Panel Session 2
Mr. Widodo Santoso, Indonesia Cement Association (Asosiasi Semen Indonesia – ASI)
1) To Kyudenko : How much investment is needed to achieve efficiency/savings as stated ? From the savings, then cost recovery period can be calculated. In Indonesia, if the cost recovery period is more than 5 years, then it is useless to propose. If JCM can somehow reduce the cost recovery period to make it more attractive, then this scheme would be welcomed, bearing in mind hat 5 years in the typical expected payback period.
2) To NTT-F : For solar panel technology, what is the cost / kWh for the electricity generation from solar panel ?
(Ms. Shimura) : The Japanese companies understood that 8 years is too long for the payback return expected by typical Indonesian companies. JCM scheme can maybe reduce the payback period to the expected one, and there will be further negotiation between the companies and the client about this. For the solar panel, the cost is not able to be disclosed, and it is up to the parties’ negotiation.
Mrs. Shinta Sirait, Ministry of Industry
Suggestion : The relevant parties involved should move the project towards implementation / commercialization stage, and not only until end of FS. So, it is important to have several rounds of negotiation with prospective client(s), taking into consideration the local price (as the contractors building the system will be local) to bring the price to a feasible level.
1) To NTT-F : How much space / area is needed to produce electricity from solar panel ? Also, what is the feasible size of the solar project ?
(Mr. Hakuta) : For 1 kW, the space required for the panel is around 10 – 15 m2. The feasible size for a solar project, based on previous experience, is around 100 kW.
Panel Session 3
Mr. Ari Rahmadi, BPPT (Ministry of Research and Technology)
To Apkenindo : What is the most significant barrier in implementing Energy Efficiency project, and what can Apkenindo do to mitigate / reduce the barriers ?
(Mr. Judianto Hasan) : Some of the significant barriers in Indonesia context are high interest rate and availability of ESCO / Energy Efficiency fund (which is available in some other countries). How Apkenindo do to mitigate the barriers is to represent the companies and members to bring up the issues to regulators (e.g. Ministry of Finance) and also to share the issues in national forum / events.
2nd
thing is about the regulation on ESCO contract. Most of the ESCO project currently is still in small-scale and mostly are guaranteed savings based. ESCO regulation is still under development right now, and it is hoped that once the regulation is in place, it can reduce the barrier, especially for State-Owned companies constraint of a single year budgeting, and to improve the number of ESCO projects with synergy of government and private sector using ESCO shared savings contract.

119
Mr. Slamet Ristono, PT Grand Indonesia
To OJK : So far the pressing issue for further advancement of EE project is incentives. And currently each ministry relevant in EE is not involved in finance (except for MoF). Thus, it is suggested, especially in building sector, that EE and environmentally friendly building (green building) can be developed if there is a demand for it. One way to create the demand is for example, for BKPM (Investment Coordinating Board) to mandate that companies that are going to invest in Indonesia must have their office located in a certified green building.
In the matter of incentives, for non-technical professionals like Executive officers, getting an incentive (be it tax breaks or subsidy) is perceived to be more prestige rather than just that the facility is saving energy by xx %. So, it is a matter of prestige to get the incentive.
(Mrs. Marlina Efrida, OJK) : As mentioned in the presentation, the incentive scheme is stated in the roadmap of sustainable financing of OJK from 2016 – 2018. So it has to go through step by step process to get approval from relevant stakeholders.
(Mr. Edi Setijawan, OJK) : OJK has just discussed with BKF (Fiscal Policy Agency) of MoF, and talking about incentives, there is still a lag in policy from the government as BKF direction is still not going there yet. Rather, they are now considering balancing of incentives and disincentives, such as those environment-friendly projects will have lower VAT compared to those that are not and OJK is also now preparing the related regulations.
Secondly, the problem with financial sector right now is “mismatch”, as the market structure of funding source is mostly for shorter-term projects, especially for banking. Government is also starting to channel the infrastructure funds to the banking to achieve greater multiplier effect. By going into that direction, it is hoped that the funds (including revolving fund) create more leverage rather than channeling to government department.
For the suggestion on using BKPM, OJK can also coordinate the efforts together and communicate them among the departments and government institutions.
Mr. Feri Lasman, PT Tracon Industri
To OJK : Why it takes quite long time to come up with regulations on incentives (targeted 2017) ? In other countries such as Japan, those doing EE project is given 0% interest and possibly some subsidy. In Thailand, the interest rate for EE project is lower at 4%. However in Indonesia the interest rate follows the commercial bank rate, thus EE project cannot be developed in Indonesia and this situation has been ongoing for a long time.
(Mrs. Marlina Efrida, OJK) : OJK will raise the potential issues during the discussion with relevant ministries and institutions, hopefully to accelerate the roadmap implementation.
(Mr. Edi Setijawan, OJK) : The schedule is targeting in 2017 because OJK needs to lay foundation for control and monitoring of the incentives to prevent potential misuse and loopholes in the future. One of the efforts that OJK is currently initiating is “Global Public Funds” to gather the funds from investors domestically and overseas. Overseas investment / loan must also be carefully considered such as not to burden the overall balance of payment.
(Mr. Banu Anang Priyanto, Apkenindo) : Apkenindo has also make efforts in Business-to-Business sector to create a feasible financial structure while waiting for the incentives and change of regulations. Apkenindo also makes use of private fund from capital markets as part of the efforts to promote EE on greater scale.

120
Mr. Widodo Santoso, Indonesia Cement Association (Asosiasi Semen Indonesia – ASI)
To OJK : How about the existing incentives that has been given to cement industry ? Will it be ongoing given the possibility that new incentive scheme is coming in 2017 ? Also, now the free trade agreement has covered whole ASEAN and Indonesia companies need to compete globally for market share (given that electricity and gas prices are increasing rapidly now), so the incentives are getting more urgent.
Dr. Idris F. Sulaiman, Indonesia Energy Efficiency & Conservation Society (MASKEEI)
To OJK : Regarding financing of Renewable energy / EE projects, what are the barriers in terms of regulation for funding from Offshore financing ?
(Mr. Edi Setijawan, OJK) : As mentioned before, OJK is now looking to solve issues related to Global Public Funds, including offshore financing, considerating other strategic issues in the government. Once the analysis is finished, the result will be presented to the relevant government and Central Bank of Indonesia.
Mr. Arief Heru Kuncoro, EBTKE, Ministry of Energy and Mineral Resources
It is suggested that Ministry of Finance / OJK can coordinate the efforts to issue regulations regarding the incentives of RE & EE projects, as it is also mentioned in the Energy Law No 30 / 2007 and Government Decree on Energy Efficiency. The regulation may be similar in the form of Ministry of Finance decree (PMK) No 21 Year 2010 regarding Fiscal incentives.
On the topic of revolving fund, the term is now refreshed and called “Energy Efficiency financing facility” and the discussion is also raised with regards to Government guarantee for companies using this facility.
There is also a proposal in cooperation between EBTKE with Fiscal Policy Agency of Ministry of Finance to give “discount” scheme for energy efficient equipment in household such as Air Conditioning and refrigerator.
Mr. Totok Brawijayantoko, PT Asahi Indofood Beverage Makmur
It seems there is no materials focusing to industries in the workshop apart from presentation from Takasago. Industry is especially interested in the use of ESCO and financing to invest on new equipments and to achieve PROPER certification. Who should the industry approach / contact if interested in the program ?
(Mr. Judianto Hasan, Apkenindo) : For B-to-B program, Apkenindo welcomes to have initial discussion and help to coordinate the available proposals and solutions, taking into consideration the success of ESCO in other countries such as Japan, US, Korea, China, and Thailand. As such, ESCO can be considered as an alternative way of financing, taking into consideration the risks and barriers involved such as long term ESCO contract (mostly for Gov’t and State Owned Companies) and high interest rate.
Ms. Dwi Utari, Fiscal Policy Agency, Ministry of Finance
It should be noted that there are many departments / centers within Fiscal Policy Agency. The one doing the research and analysis relevant to energy efficiency is the Centre for Climate Finance and Multilateral Policy (PKPPIM). However, the topics of incentives and subsidy are the domain of budgeting policy center (PKAPBN). Whether it can be approved or not needs a further analysis which is the domain and responsibility of Fiscal Risk Management Center (PPRF).

121
Panel Discussion
Ms. Grace Yurianne, PT Enercon Indonesia
To OJK : For formulation of EE policy from financing point of view, what are the hurdles / difficulties to realize the policy ? It may be worthwhile to discuss with private sector, represented by Apkenindo. It has been several years since the conception, unfortunately it seems that the realization is still far away.
(Mr. Edi Setijawan, OJK) : I think the development of the policy for ESCO need to be shared across the government institutions (MEMR, MoF, OJK included etc). With the Green movement programs and introduction of ESCO scheme, this concept will be officially introduced into OJK, so it is hoped that the program can go smoothly such that OJK can understand the roles of each stakeholders in the scheme.
Ms. Ade Rafida, IBJ Verena Finance
From the financing models presented so far, is there any scheme that involves having the guarantees (such as buyback guarantee), because ESCO equipment is not easy to be traded (low liquidity), in case of default by the client ?
(Ms. Mari Yoshitaka, MUMSS) : So far there is no guarantee scheme for EE equipment in Latin America. In Japan itself, the team has been discussing with Japan government to provide guarantee program to developing countries, but 100% guarantee may not be good for this kind of business. So there needs to be some arrangement / modification towards the guarantee program for ESCO scheme, e.g. interest rate guarantee.
For the case of Japan, the way to mitigate this risk of default is similar with other countries in general, which depends on credit worthiness of the client.
(Mr. Yoshiyuki Inoue, PT Takasago (TTE)) : In Japan, TTE does joint contract with the leasing companies to offer the complete package to the customer, sometimes with addition of government subsidy / incentives. TTE wants to do the same thing and try to find potential local leasing company as partner. TTE will take care of the engineering and performance aspect while Leasing company takes care of the financing portion including analysis of credit worthiness of the client.
Mr. Slamet Ristono, PT Grand Indonesia
It is recommended to apply leading by example, thus the companies involved in the Energy Efficiency initiatives need to show that the office that they are working in is already having EE measures and has got certification as green building, and not just NATO (no action talk only). E.g. the building of Ministry of Public Works already got platinum award for Green Building. Once the demand is created for more EE measures, the incentives will follow (can be from government or exposure / publicity by media).
Mr. Arief Udhiarto, University of Indonesia
It seems that the import tax for EE equipment is still not attractive (such as solar panel, as it is still considered as luxury item). If the EE equipment can be given tax breaks and subsidy / incentives, it will be helpful to accelerate the diffusion of Energy Efficiency initiatives.
About options of financing schemes from the case of Latin America which were presented by MUMSS, it is suggested to add the description of benefits of each scheme such that it can become a comparative study for MoF / OJK / building owners for consideration.

122
Feasibility Study Final Report on FY2006 a JCM Large-scale
Project for Achievement of a Low-carbon society in Asia
-Feasibility Study on the Establishment of an Energy-saving
Promotion Finance Scheme in Indonesia-
March, 6th, 2015
Mitsubishi Research Institute, Inc.
International Project Center
TEL +81-03-6705-5280
E-mail [email protected]