university of california los angeles flattened …
TRANSCRIPT

UNIVERSITY OF CALIFORNIA
Los Angeles
FLATTENED RESOURCE ALLOCATION, HIERARCHY DESIGN AND THE
BOUNDARIES OF THE FIRM
A dissertation submitted in partial satisfaction of the
requirements for the degree Doctor of Philosophy
in Economics
by
Szu-Wen Chou
2002
The dissertation of Szu-Wen Chou is approved.
Alberto Bennardo
John G. Riley
Steven Lippman
David K. Levine, Committee Chair
University of California, Los Angeles
2002
ii

Dedicated with love to my parents, wife, and children.
iii

Table of Contents
1 Flattened Resource Allocations, Separation of Ownership andControl, and Diversification of the Firm 1
1.1 Introduction . . . . . . . . . . . . . . . . . . . . . . . . . . . . . . . . . . . . . . . . . . . . . . . . . . . . . . . . . . . . 1
1.2 The Model . . . . . . . . . . . . . . . . . . . . . . . . . . . . . . . . . . . . . . . . . . . . . . . . . . . . . . . . . . . . 10
1.2.1 Assumptions and Definitions . . . . . . . . . . . . . . . . . . . . . . . . . . . . . . . . . . . . 10
1.2.2 Exogenous Management Ownership . . . . . . . . . . . . . . . . . . . . . . . . . . . . . 15
1.2.3 Endogenous Management Ownership . . . . . . . . . . . . . . . . . . . . . . . . . . . . 27
1.3 Discussion and Concluding Remarks . . . . . . . . . . . . . . . . . . . . . . . . . . . . . . . . . . . 34
2 Hierarchy Design with Flattened Resource Allocations 38
2.1 Introduction . . . . . . . . . . . . . . . . . . . . . . . . . . . . . . . . . . . . . . . . . . . . . . . . . . . . . . . . . . . 38
2.2 Model Setup . . . . . . . . . . . . . . . . . . . . . . . . . . . . . . . . . . . . . . . . . . . . . . . . . . . . . . . . . . 48
2.2.1 Assumptions and Definitions: . . . . . . . . . . . . . . . . . . . . . . . . . . . . . . . . . . . 48
2.2.2 The Flat Hierarchy (F) . . . . . . . . . . . . . . . . . . . . . . . . . . . . . . . . . . . . . . . . . 53
2.2.3 The Tall Hierarchy (Tl) . . . . . . . . . . . . . . . . . . . . . . . . . . . . . . . . . . . . . . . . . 54
2.3 The Analysis . . . . . . . . . . . . . . . . . . . . . . . . . . . . . . . . . . . . . . . . . . . . . . . . . . . . . . . . . . 55
2.4 Conclusion . . . . . . . . . . . . . . . . . . . . . . . . . . . . . . . . . . . . . . . . . . . . . . . . . . . . . . . . . . . . 59
3 The Boundaries of the Firms in the Absence of Property Rights 60
3.1 Introduction . . . . . . . . . . . . . . . . . . . . . . . . . . . . . . . . . . . . . . . . . . . . . . . . . . . . . . . . . . . 60
3.2 Model . . . . . . . . . . . . . . . . . . . . . . . . . . . . . . . . . . . . . . . . . . . . . . . . . . . . . . . . . . . . . . . . 64
3.2.1 Separation . . . . . . . . . . . . . . . . . . . . . . . . . . . . . . . . . . . . . . . . . . . . . . . . . . . . . 67
3.2.2 Integration . . . . . . . . . . . . . . . . . . . . . . . . . . . . . . . . . . . . . . . . . . . . . . . . . . . . . 67
3.3 Discussion . . . . . . . . . . . . . . . . . . . . . . . . . . . . . . . . . . . . . . . . . . . . . . . . . . . . . . . . . . . . 70
4 Appendix A 72
5 Appendix B 87
6 References 95
iv
List of Figures
1 Separation and Integration . . . . . . . . . . . . . . . . . . . . . . . . . . . . . . . . . . . . . . . 11
2 Flattened Resource Allocations (kM1 < k∗1 and kM2 > k∗2.) . . . . . . . . . . . . . . 23
3 Four Hierarchies . . . . . . . . . . . . . . . . . . . . . . . . . . . . . . . . . . . . . . . . . . . . . . 44
v

ACKNOWLEDGEMENTS
I gatefully acknowledge the invaluable discussions with David Levine. I also thank
Alberto Bennardo, Hongbin Cai, Walter Cont, Steven Lippman, Joseph Ostroy, John
Riley, William Zame, participants of the Theory Proseminar at UCLA, participants of
the 11th Jerusalem Summer School in Economic Theory at The Hebrew University of
Jerusalem, for helpful commands. All errors are mine.
vi

VITA
August 24, 1969 Born, Kaoshiung, Taiwan
1991- 1993 Research AssistantGraduate School of Business,National Cheng-Kung University, Tainan, Taiwan
1993-1995 Lieutenant (Logistic Officer)Tainan Airport, ROC Air Force, Tainan, Taiwan
1995-1997 Programmer/System AnalystORIGIN, Kaohsiung, Taiwan
vii

ABSTRACT OF THE DISSERTATION
Flattened Resource Allocation, Hierarchy Design and the Boundaries of the Firm
by
Szu-Wen Chou
Doctor of Philosophy in Economics
University of California, Los Angeles, 2002
Professor David K. Levine, Chair
The general theme of my dissertation is to understand why and how institutions
matter in the efficiency of organizations. Empirical results suggest that multi-segment
firms underperform stand-alone firms in resource allocations by underinvesting in
high-profit segments and overinvesting in low-profit segments - a phenomenon I called
flattened resource allocations (henceforth FRA). In the first two chapters I provide a
theoretical rationale for FRA and examine its relationship to hierarchy design. The
third chapter changes focus to explore the role of the boundaries of the firm in the
absence of property rights.
In the first chapter - “Flattened Resource Allocations, Separation of Ownership and
Control, and Diversification of the Firm”, I present a model of FRA. This model is
viii

more robust than existing FRA models because it abstracts from rent-seeking behavior
- a critical but problematic assumption in the existing literature. I show that FRA is a
negative externality existing in multi-segment firms but not in stand-alone firms. Also,
consistent with the facts from empirical studies, the inefficiency of FRA increases in
both the agency cost and diversification of the multi-segment firm. There can be both
underinvestment and overinvestment in the total resource available to the firm. These
results hold when management ownership is either exogenous or endogenous. In the
latter case, the pattern of FRA becomes less clear-cut. More interestingly, the CEO
can obtain more than he would receive in a stand-alone firm, explaining why CEOs
might prefer managing multi-segment firms. Finally, the total resource available to the
firm is lower when management ownership is endogenous than when it is exogenous.
In the second chapter - “Hierarchy Design with Flattened Resource Allocations
”, I compare the efficiency of flat and tall hierarchies from the perspective of FRA.
I allow the possibility of divisionalization - grouping elementary business segments
into a fewer number of divisions and transforming flat hierarchies to tall hierarchies.
I characterize the equilibrium of this model and the inefficiency of FRA is shown
to be decreasing in management ownership. Most importantly, FRA is aggravated
by divisionalization, implying tall hierarchies are necessarily less efficient than flat
hierarchies. This result suggests that U-form (undivisionalized) organizations, rep-
resented by flat hierarchies, can actually outperform M-form (divisionalized) organi-
zations, represented by tall hierarchies, in resource allocations – a result opposite to
ix

Williamson’s ”M-form hypothesis.”
In the third chapter - “The Boundaries of the Firms in the Absence of Property
Rights” it is shown that the boundaries of the firm can continue to matter in an en-
vironment where there is no physical asset and hence property rights do not play a
role. I assume that the boundaries of the firm work as a form of information barrier:
once parties enter the boundaries of the firm they work together behind ’frosted-glass
windows’ and hence their outside options get averaged out. I show that mergers can
induce first-best investment. This new view provides a rationale for the large ob-
served investment in adjusting firm boundaries in industries where physical assets are
of minimal importance.
x

1 Flattened Resource Allocations, Separation of Own-ership and Control, and Diversification of the Firm
1.1 Introduction
In most market economies, productive resources such as labor and capital are allo-
cated to the firm through the external (meaning outside of the boundaries of the firm)
resource market by some price mechanism; the firm in turn allocate the resources it
obtains to each elementary business segment inside the firm through the internal re-
source market by its central office or CEO. The common goal of these markets is to
assign resources to high-yield uses. While the external resource market is free of hu-
man discretion but prone to failure when there is asymmetric information, the internal
resource market has a lower information cost but is subject to agency problems. The
relative efficiency of these two different markets is one of the major factor in deciding
the optimal boundaries of the firm – whether to organize a given group of business seg-
ments as several stand-alone firms or as one multi-segment firm. For a multi-segment
firm to operate as a internal resource market, it is necessary that the segments inside
the firm are somewhat different from each other, i.e. there must be some degree of
diversification, so that it matters when the firm’s CEO redirect resources from one
segment to another segment.
In the past, possibly due to the less sophisticated technologies used in the exter-
nal resource market, it was believed that the information problem is the major issue
1

and hence resource allocation would be better done inside the boundaries of the firm.
One of the most representative arguments is proposed by Williamson [33], who ar-
gues that the internal capital market should be more efficient than the external capital
market because the internal market has lower information cost, better ability to fine-
tune allocations, and lower intervention cost. This point of view is so influential that
it still inspires some of the most recent studies. For example, Stein [29] suggests
that the internal capital market should be more efficient because the CEO of multi-
segment firms can have the necessary information and incentive in picking winners
among segments inside the firm, resulting better capital allocations, compared to the
external capital market where all segments are treated equally for lack of informa-
tion. Similarly, Inderst and Müller [17] suppose that liquidity spillovers from high- to
low-return segments can help in financing low-return but positive NPV segments and
hence enhance firm value.
However, as information technologies advance, the internal resource market has
been losing its advantage. Consequently, some of the potential problems of the inter-
nal resource market, especially the internal capital market, start to surface. One recent
important observation is that many diversified conglomerates – firms with many unre-
lated segments and hence major candidates for the internal resource market – perform
poorly relative to specialized firms with less unrelated segments. For example, Lang
and Stulz [20] and Berger and Ofek [3] find that diversified firms are valued at a
discount relative to specialized firms in the U.S. stock market, suggesting that the in-
2

ternal capital market can be more costly than the external capital market. Additionally,
Scharfstein [26] reports that 68% of his sample of diversified conglomerates existing
in 1979 either sold off unrelated segments or got acquired or liquidated by 1994. As
for what might have gone wrong in these multi-segment firms, he finds that, com-
pared to their stand-alone industrial peers, segments in high-profit industries tend to
be underinvested in, whereas segments in low-profit industries tend to be overinvested
in – a peculiar pattern of misallocation that we called flattened resource allocations
(henceforth FRA). In addition, the degree of FRA decreases in CEO ownership and
increases in the diversify (Rajan, Servaes and Zingales [24]) of the firm. While these
empirical results are still under debate1, they do shift the theoretical attention from
the better studied, bright side of the internal resource market to the less explored, dark
side of it.
The theoretical underpinning of FRA turns out to be quite challenging. While it is
just the standard Jensen-Merkling type of result that managers tend to be extravagant
with investment because they enjoy the full benefit of the perks that come with invest-
ment but only bear a portion of the cost, it is hard to rationalize why managers want
to flatten resource allocations that is to be simultaneously extravagant towards some
segments but stingy towards other segments. Another related, interesting question is
that if diversification really destroys value, why does it happen to begin with? Morck,
Shleifer and Vishny [23] suggest that managerial objectives might be the driving force.
1 For example, Whited [32] argues that these results can be subject to measurementerrors in the proxy for profitability – Tobin’s q.
3

In this paper, we are interested in finding out whether managing a diversified multi-
segment firm allows the CEO to gain more rent than managing a stand-alone firm
does.
The followings are our research questions: 1.) Why and how do FRA happen in
multi-segment firms but not in stand-alone firms? 2.) Why and how do FRA depend
on managerial ownership and diversity of the firm? 3.) How does the total resource
available to a certain group of business segments change with the boundaries of the
firm? 4.) What are the effects of allowing stock-based compensation on FRA, and
what new effects will it generate in the relationship between the owner and the CEO
of a firm? and 5.) What in the internal resource market, if anything, gives CEOs the
incentive to create multi-segment firms by acquiring unrelated segments?
In this paper, we consider two segments, different in profitability, that can be sepa-
rated as two stand-alone firms or integrated as one multi-segment firm. In both cases,
a firm constitutes a two-tier principal-agent problem with its owner as the principal
and its CEO as the agent at the upper tier and the CEO in turn as the principal and one
or two segment manager(s) (depending on whether the firm is multi-segment or stand-
alone) as the agent(s) at the lower tier. With the cash and production resource provided
by the owner, the CEO decides (a) how to distribute the cash among himself and his
segment manager(s) to satisfy her(their) participation constraint(s) and (b) how to dis-
tribute the resource to his segment manager(s) so that the resource can be converted
into revenue. The owners and CEOs only care about their wealth, whereas the seg-
4

ment managers care about wealth and a private benefit of empire building, modeled
as an additive part of each segment manager’s utility function that is increasing and
concave in the resource allocated to the segment. In each of the stand-alone firm, the
CEO will simply pass on all of the resource that he received from the owner to his
segment manager because he controls only one segment and cannot use the resource
in any other ways. As a result, the resource allocations will be first-best, and by con-
struction the high-profit segment will be allocated more resource. This implies that
the manager of the high-profit segment will have a lower marginal utility of resource
than manager of the low-profit segment.
On the other hand, in the multi-segment firm the CEO can distribute the resource
to the two segments in any way he wants. If the CEO wants to reduce cash pay-
ment, he can do so by the following deviation from the first best: redirecting some
of the resource from the segment manager who has low marginal utility of resource
(the high-profit segment) to the segment manager who has high marginal utility of
resource (the low-profit segment) while still keeping the segment managers receiving
their reservation utilities. It tuns out that this inefficient deviation – FRA – is actually
preferred by the CEO because he can enjoy the full benefit of cash saving but, as a
agent of the owner, does not bear the full cost of resource misallocation.
Concentrating on the multi-segment firm, we also show that there could be both
underinvestment and overinvestment in the total resource available to the firm as the
owner’s optimal responses to the CEO’s resource misallocation. The possibility of
5

investors’ overinvestment in equilibrium is one of the important feature that distin-
guishes this paper from most of the corporate finance literature, where it is always
some variety of resource (especially capital) underinvestment (for example debt con-
tracts) derived as investors’ optimal response to managers’ abuse of the investors’
resource. Furthermore, we show that the efficiency loss of FRA is increasing in the
degree of separation of ownership from control and diversity of the firm. All these
results hold quantitatively the same irrespective of whether CEO ownership is exoge-
nous or endogenous. However, when CEO ownership is endogenous, two additional
effects obtain: First, the total resource available to the multi-segment firm becomes
lower. This reduced provision of resource by the owner makes the pattern of FRA
more subtle because underinvestment in both segments becomes possible. Second,
the CEO of the multi-segment firm can receive utility higher than what he would re-
ceive in the stand-alone firms. This provides a rationale for why CEOs want to acquire
unrelated segments and create a diversified multi-segment firm to begin with.
Most of the existing theoretical literature on FRA follows the rent-seeking ap-
proach broadly defined as models assuming there exist certain socially wasteful tech-
nologies that allow managers to seek personal rent. For example, Rajan, Servaes and
Zingales [24] (henceforth RSZ) assume that the managers of two different segments
can use the resource provided by the CEO to make wasteful “defensive investment” in-
stead of efficient investment so that their surplus can be protected from being poached
by another segment manager. In their model, the CEO, who is also assumed to be
6

the owner, will efficiently tilt resource allocations towards the low-profit segment be-
cause that will discourage the manager of the high-profit segment to make defensive
investment which in turn induces the manager of the low-profit segment also to make
efficient investment.
In another rent-seeking model, Scharfstein and Stein [27] (henceforth SS) assume
that the managers of two different segments, instead of spending all of their effort in
production in this period, can choose to spend some of their effort in unproductive
rent-seeking activities such as “resume polishing” that will improve their outside op-
tions in the next period. On one hand, the manager of the low-profit segment has a
lower opportunity cost to spend her effort in rent seeking because her effort is assumed
to be less productive. On the other hand, the payoff of the manager of the low-profit
segment in the next period will be lower than the manager of the high-profit segment
because the return on the newly invested capital in the low-profit segment is also as-
sumed to be lower. This implies the manager of the low-profit segment should care
more about her outside option and hence has not only a lower cost but also a higher
benefit in rent seeking. To discourage the manager of the low-profit segment from rent
seeking the CEO need to raise her payoff inside the firm by paying her a positive wage
or tilting resource allocations towards her segment. Resource allocations are then flat-
tened because the CEO actually rather “pays” the manager of the low-profit segment
partially by tilting the resource allocations than completely by a positive wage be-
cause the CEO enjoys the full benefit of wage saving but does not bear the full cost
7

of resource misallocation. It is important to note that the two papers discussed above
employ opposite assumptions about which segment manager has stronger tendency to
rent seek: RSZ assume the manager of the high-profit segment is more likely to rent
seek, whereas SS assume the manager of the low-profit segment is more likely to rent
seek. While both settings seem plausible, this modeling discretion turns out to have a
substantial impact on the results, as discussed in the next paragraph.
The rent-seeking models share two major defects. First, and most importantly,
their results are very sensitive to the discretional designs of the rent-seeking games
used in the models. In other words, a slight and reasonable change of the model can
overturn the results. For example, in SS if one adds the assumption that segment
managers’ outside options are positively related to the segment’s productivity, so that
it is the manager of the high-profit segment whose outside option is more likely to
bind, completely opposite results obtain.2 The assumption added above is by no means
implausible. In fact, as we point out above, it is consistent with model of RSZ where
the manager of the high-profit segment is more likely to rent seek. In the current
paper, we avoid this problem by simply abstracting from any rent-seeking behavior
which, as it turns out, is totally unnecessary for modeling FRA.
The second important common flaw of the rent-seeking models is that the total
resource available to the firm is exogenous. This leads to the following two difficul-
ties. First, these models cannot explain how the total resource available to the firm
2 Similar problems exist in RSZ.
8

change as a response to the CEO’s resource misallocation. Probably due to the liter-
ature’s predominant results on investors’ underinvestment as a response to manager’s
exploitation, SS allege, without formal analysis, that FRA will simply lead to un-
derinvestment in total resource available to the firm. We clarify this myth by formally
showing that not only underinvestment but also overinvestment in the total resource
available to the firm can be an equilibrium outcome under the problem of FRA. Sec-
ond, these existing models cannot explain why the ultimate resource provider (the
owner), if allowed by the modeler, will not decide to substantially underinvest or
overinvest in the firm to the point that all segments are underinvested or overinvested.
These two scenarios are anomalies that need to be ruled out for any model to fully
explain FRA. We overcome these two difficulties by endogenizing the total resource
available to the firm.3
In addition to fixing the two major defects discussed above, we improve upon
the existing literature by endogenizing managerial ownership. This not only allows
us to examine the effects of stock-based compensation on FRA but also to provide
conditions under which a CEO will prefer managing a multi-segment firm to a stand-
alone firm.
The current paper has a different focus from the related capital budgeting literature
(see for example Harris and Raviv [15][16] and Bernardo, Cai and Luo[4]). While3 To ensure finite benchmark allocations and private increasing in resource, we alsodeviate from some technical formulations of SS (where segment profit functions are increasing andprivate benefit is modeled as utility derived from profit) and adopt the formulations of Harrisand Raviv [15][16] (where segment profit functions are single-peak and private benefit is modeledas utility derived from resource). These two formulations are, in our opinion, equally plausible.
9

it also deals with the internal financing of the firm in general, the capital budgeting
literature focuses on understanding the design of setting a budgeting limit that can be
lifted under some conditions. The goal of this paper is to understand why resource
allocations change with firm boundaries, which do not play a role in capital budgeting
literature.
The rest of the paper is organized as follows: We first restrict our attention in sec-
tion 2.2. to the case of exogenous manager ownership. In section 2.3., we endogenize
the ownership of the managers. Discussion and conclusion are presented in section 3.
1.2 The Model
1.2.1 Assumptions and Definitions
There are two different business segments, indexed by i where i ∈ {1, 2}. The rev-
enue function of each segment is Vi(ki), a function of resource input ki. Let segment
1 be the high-profit segment in the sense that it is in the industry with relatively good
investment opportunity4, compared to segment 2. Technically, we assume the follow-
ing:
Assumption 1: Vi : R → R, i ∈ {1, 2}, is a continuously differentiable strictly
concave function which satisfies
Vi(0) = 0, V2(k) < V1(k), and Vi (k) > −∞. (1)
As shown in Figure 1., the two segments can be organized as either two separated
stand-alone firms or one multi-segment firm. In the former case, we refer the firm4 One of the measures of profitability of an industry used in empirical works is Tobin’s Q.
10

Figure 1: Separation and Integration
One Integrated Multi-segment Firm
Owner
CEO
Segment 1 Segment 2
(1− φ)
φ
(SC ,K)
(S1, k1) (S2, k2)
Two Separated Stand-alone Firms
Owner 2
CEO 2
Owner 1
CEO 1
Segment 1 Segment 2
(1− φ)
φ
(SC2 , k2)
(1− φ)
φ
(SC1 , k1)
(S1, k1) (S2, k2)
that segment i belongs to as firm i. Each firm i consists one owner, one CEO, and
one segment manager. In the latter case, the firm consists one owner, one CEO, and
two segment managers. The profit of firm i is Vi(ki) − ki, denoted as Φi(ki). The
profit of the multi-segment firm is the sum of the profit of the two segments, which is
V1(k1) + V2(k2)− k1 − k2, denoted as Φ(k1, k2).
Each firm (stand-alone or multi-segment) constitutes a two-tier principal-agent
problem with its owner as the principal and its CEO as the agent at the upper tier
and the CEO as the principal and one or two segment manager(s) as the agent(s) at
the lower tier. For simplicity, we assume that any other way of organization will be
very costly. For example, a firm cannot operate without a CEO because it takes the
unique expertise of the CEO to supervise the segment manager(s).
11
All agents need to be paid a non-negative amount of cash to satisfy their partici-
pation constraints. The “cash” is broadly defined to include all means of rewarding a
employee, for example salary, employee benefit, and even perks. Cash cannot be used
as resource to be converted into revenue. Each owner has a unlimited endowment of
resource and cash, whereas no CEO or segment manager has any endowment. This
implies that the resource and cash a CEO provides to his segment manager(s) neces-
sarily come from what is provided to him by his owner.
Since part of our goal is to replicate the results of SS, without invoking rent-seeking
behaviors, we follow SS in the following three assumptions (Assumptions 2, 3, and
4). While SS use them to model the multi-segment firm only, we apply them to both
the stand-alone firms and the multi-segment firm so that the results in both types of
firms are comparable.
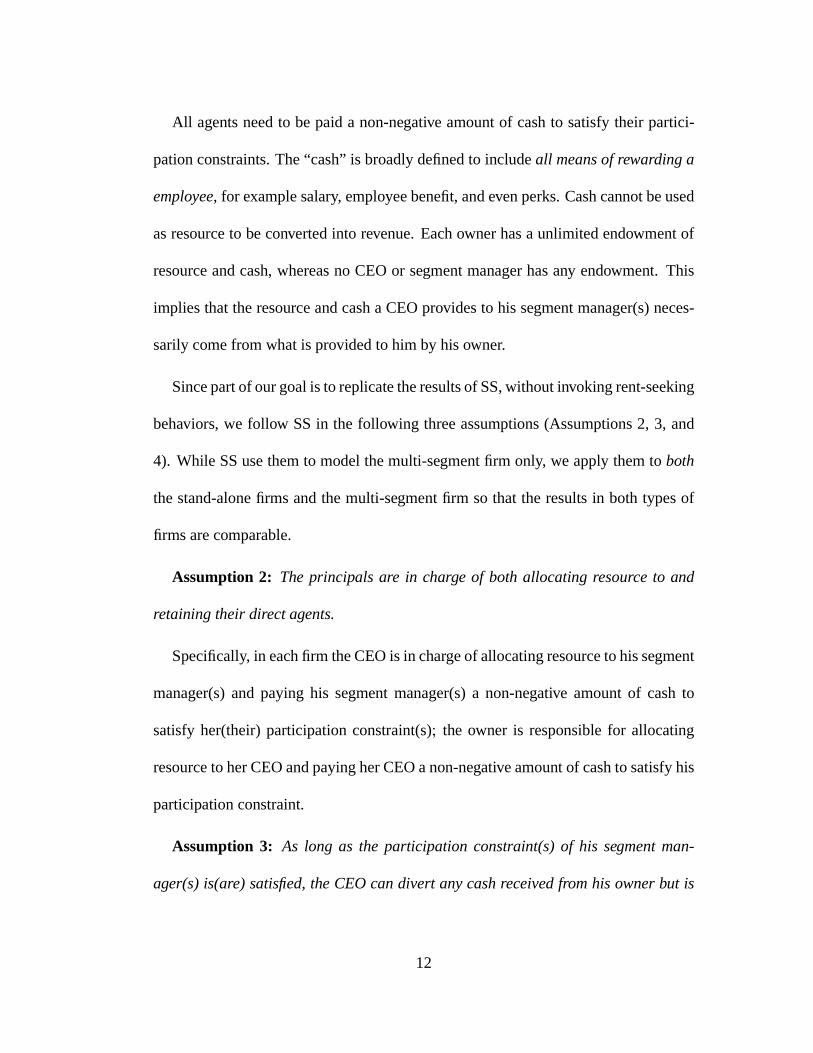
Assumption 2: The principals are in charge of both allocating resource to and
retaining their direct agents.
Specifically, in each firm the CEO is in charge of allocating resource to his segment
manager(s) and paying his segment manager(s) a non-negative amount of cash to
satisfy her(their) participation constraint(s); the owner is responsible for allocating
resource to her CEO and paying her CEO a non-negative amount of cash to satisfy his
participation constraint.
Assumption 3: As long as the participation constraint(s) of his segment man-
ager(s) is(are) satisfied, the CEO can divert any cash received from his owner but is
12

not paid out to his segment managers.
Denote the cash that the manager of segment i gets paid as Si. Denote also the
the gross amount of cash that the CEO gets paid as S if he is the CEO of the multi-
segment firm or as SCi if he is the CEO of the stand-alone firm i. Under Assumption 3,
S or SCi really should be viewed as a ”personnel budget”5 for the firm which consists
of two parts: the salary of the manager, Si, and the salary of the CEO, SCi − Si or
S − i Si.
Assumption 4: In each firm, the resource and cash provided to each segment
manager by its CEOs are not contractible to its owner.
Under this assumption, the only things the owner can control are the total resource
and cash provided to the firm as a whole. Once the owner parts with her resource
and cash, she has no effective control over how they get distributed to each segment
of the firm. This assumption reflects the well-known difficulty in attributing a firm’s
resource usage to individual segments in accurate accounting terms especially when
the resource is shared among several segments.
While Assumptions 2, 3, and 4 are important in creating the scope for agency
problems in general, they are not sufficient to entail FRA. In order to equip the CEO
with the special incentive to fatten the resource allocations, SS assume that segment
managers can rent-seek and derive private benefit from resource. We find that only
5 This is also called ”operating budget” in Scharfstein and Stein [27]. The assumptionthat the CEOs can divert the personnel budget that is not spend on their subordinatesreflects the prevalent channels of side payment in practice between managers and theirsubordinates such as personal favor.
13

the latter ingredient is necessary. Specifically, we assume that while the owner and
the CEO care only about their wealth (the total value of cash and shares they own),
the utility functions of the manager of each segment i is the sum of her wealth and a
private benefit of empire building b(ki) that satisfies the following assumption:
Assumption 5: b : R → R, is a increasing, strictly concave, and continuously
differentiable function which satisfies b (k) > −∞, limki→0+ b (ki) =∞.
To rule out non-instructive corner solutions where the agents receiving zero net
cash, we also make the following simplifying assumption:
Assumption 6: The reservation values the agents (the CEO(s) and the segment
managers) are high enough (in particular strictly greater then zero) so that their par-
ticipation constraints cannot be satisfied without receiving a positive amount of net
cash or stock-based compensation.
There are two potential benchmarks for segment resource allocations. Which of
them is revelant depends on the choise of the stand-alone firms. We assume that both
of them are unique and defined as follows:
Definition 1 The first-best resource allocation for segment i is k∗i such that
k∗i = argmaxki[Vi(ki) + b(ki)− ki]. (2)
Definition 2 The production profit maximizing resource allocation for segment i isk−i such that
k−i = argmaxki[Vi(ki)− ki].
Given that both k∗i and k−i are unique, inequality (1) combined with the monotonic-
ity and concavity of the private benefit function b(.) implies that in both benchmark
14

cases the resource allocated to the high-profit segment (segment 1) should be higher
than the resource allocated to the low-profit segment (segment 2) i.e.
k∗1 > k∗2 and k−1 > k
−2 .
Also it is obvious that k∗i > k−i .
The following two definitions help characterize inefficiency.
Definition 3 There exists diversification discount if the value of the multi-segmentfirm is lower than the sum of the values of the two stand-alone firms.
Definition 4 There is overinvestment in the total resource available to the firm if andonly if k1 + k2 > k∗1 + k
∗2; there is underinvestment in the total resource available to
the firm if and only if k1 + k2 < k∗1 + k∗2.
Finally, the owner, the CEO, and the segment managers of each firm are all po-
tential shareholders of the firm. The residual income of the firm is distributed to its
shareholders according to their fraction of shares.
1.2.2 Exogenous Management Ownership
In this section, we assume that the shares of each firm owned by its CEO is exoge-
nously given. This assumption reflects many real-life cases where there exist some
difficulties in using stock-based compensation. For example, some shareholder might
be concerned about maintaining their status as majority shareholders, or some CEOs
might have liquidity needs which cannot be satisfied by getting shares. Without loss
of generosity, we can assume that the segment managers does not own any shares
since as it turns out what matters is the total shares owned by each firm’s CEO and
segment manager(s). Therefore, we can interpret the shares owned by the CEO as
15

employee (excluding the owner) or managerial ownership.
Optimal Resource Allocations in the Stand-alone Firm In this sub-section we
analyze resource allocations in a representative stand-alone firm – firm i. Denote the
portion of the shares owned by the CEO as φCi . According to our setup above, the
utility function of the owner should be
(1− φCi)Φi(ki)− SCi ,
and utility function of the CEO should be
φCiΦi(ki) + SCi − Si.
Therefore, the two-tier principal-agent problem can be written as finding (SCi, ki)
such that
(SCi , ki) = arg max(SCi ,ki)
−SCi + (1− φCi)Φi(ki) (3)
subject to
φCiΦi(ki) + SCi − Si ≥ uC (4)
Si = argmaxSi
φCiΦi(ki) + SCi − Si
subject to
Si ≤ SCi
Si + b(ki) ≥ uMi, (5)
with uC and uMirepresenting the reservation values of the CEO and the manager of
segment i respectively and all decision variables nonnegative.
16

Since both equation (5) and equation (4) will hold as equality in equilibrium by
Assumption 6, substituting them into equation (3) gives us
maxki
[Vi(ki) + b(ki)− ki − uCi − uMi]. (6)
Also since the first-order condition for equation (6) is the same as for equation (2),
the first-best resource allocations is achieved in this case. Define variables with su-
perscript ”SX” as their respective solutions in the stand-alone firm when the CEO’s
ownership is exogenous. Then the solution to this case is
(SSXC1 , SSXC2, SSX1 , SSX2 , kSX1 , kSX2 )
= (uC1 + SSX1 , uC2 + S
SX2 , uM1 − b(k1), uM2 − b(k2), k∗1, k∗2).
To conclude this sub-section, even though we assume that the segmental resource
allocations are not contractible, the potential FRA problem will not happen in the
stand-alone firms simply because in each stand-alone firms there is only one segment
to which the CEO can allocate resource, and hence the CEO has no way to misallocate
it.
Optimal Resource Allocations in the Multi-segment Firm In this sub-section
we will analyze resource allocations in the multi-segment firm. Denote the portion
of the shares owned by the CEO as φC . According to our setup, the utility function
of the owner is
(1− φC)Φ(k1, k2)− S,
17

while utility function of the CEO is
φCΦ(k1, k2) + S − (S1 + S2) .
Therefore, the two-tier principal-agent problem is to find (S,K) such that
(S,K) = argmax(S,K)
−S + (1− φ)Φ(k1, k2)
subject to
S + φΦ(k1, k2)− (S1 + S2) ≥ uC (7)
(S1, S2, k1, k2) = arg max(S1,S2,k1,k2)
{S + φΦ(k1, k2)− (S1 + S2)} (8)
subject to
k1 + k2 ≤ K
S1 + S2 ≤ S (9)
Si + b(ki) ≥ uMifor i ∈ {1, 2}, (10)
with uC and uMirepresenting the reservation values of the CEO and the manager of
segment i respectively and all decision variables nonnegative.
Define variables with superscript “MX” as their respective solutions in the multi-
segment firm when the CEO’s ownership is exogenous. The following result charac-
terizes a partial solution that highlights the source of inefficiency.
18

Proposition 1 (Externality in Internal Resource Market) Given the owner’s decisionis (S,K), which satisfies equations (7) and (9), the solution to the CEO’s problem is
(SMX1 , SMX2 , kMX1 , kMX2 ) = [uM1 − b(k1), uM2 − b(k2), k1, K − k1] , (11)
where k1 satisfies
φ[V1(k1)− V2(K − k1)] + b (k1)− b (K − k1) = 0. (12)
Proof. All proofs of this chapter are in Appendix A.
Equation (12) is a instructive representation of the working of an internal resource
market. Imagine there are three “commodities” in this “market”: resource for segment
1, resource for segment 2, and cash. The CEO “produces” the resource for segments
1 and 2 using the total resource available to the firm as input. The segment managers
can “buy” (“sell”) resource from (to) the CEO by reducing (increasing) their cash
received from the CEO. This market differs from ordinary markets in that it is a sub-
market in the sense that it excludes one of the members of the “society” – the owner
– from trading in it. As a result, this sub-market operates and reaches a sub-social
optimal allocation by equating the social marginal benefit, b (K − k1) − b (k1), with
the sub-social marginal cost, φ[V1(k1)−V2(K − k1)], which is strictly lower than the
social marginal cost, V1(k1) − V2(K − k1). It is exactly this externality that causes
inefficiency in the multi-segment firm.
One might notice that equation (12) looks similar to the central first-order condition
of SS. However, it is important to note that the purpose of this paper is not to challenge
SS’s results. In fact, a portion of our goal is to replicate SS’s results in a more robust
setting free of rent seeking modeling. This is accomplished by deriving equation (12)
19

that plays a important role in the following part of the analysis that is absent in SS. In
addition, there are some problems in simply relabeling the central first-order condition
of SS into equation (12). For example, SS’s analogous parameter for our φ represents
a private benefit parameter which is supposed to be very small so that private benefits
can be neglected in the definition of benchmark allocations. Otherwise, their bench-
mark allocations cannot represent the first-best allocations. Therefore, their model
cannot be used to address the effect of managerial ownership by simply reinterpret-
ing the private benefit parameter as ownership because managerial ownership can be
substantial.
Since the segment managers are always getting their reservation values in either a
stand-alone or multi-segment firm, any change on the segment’s resource allocation
should come with an offsetting change in the segment-manager’s salary. The follow-
ing corollary characterizes this observation.
Corollary 2 If the segment managers have the same reservation value in either thestand-alone or multi-segment firm, then in the multi-segment firm the resource allo-cations are flattened if and only if the wages of the segment managers are flattened,i.e.
SMX1 > SSX1 and SMX2 < SSX2 .
The next result is a comparative-static analysis on the behavior of the CEO, equa-
tion (12).
Proposition 3 (a) The resource allocations to the two segments will move apart fromeach other as managerial ownership increases, i.e.
∂kMX1
∂φ> 0,
∂kMX2
∂φ< 0.
20

(b) The resource allocation to one of the segment will increases in the resourceallocation to the other, i.e.
0 <∂kMX2
∂kMX1
<∞.
In the next result, we examine how changes in total resource available to the firm
provided by the owner get distributed to each segment.
Proposition 4 (Socialism in the Internal Resource Market)
0 <∂kMX1
∂KMX< 1 and 0 <
∂kMX2
∂KMX< 1. (13)
Proposition 4 shows that whenever the owner increases or decreases the total re-
source available to the firm, the allocations to both segments will move in the same
direction. This is referred as “socialism” in the language of Bolton and Scharfstein [7]
because whenever the owner wants to increase (decrease) her investment in the firm
because, for example, she wants to increase (decrease) the investment in a certain
segment, this segment is not going to obtain 100% of the increase (decrease) since
this increase will be shared by the other segment. This result is consistent with the
empirical finding of Shin and Stulz [28] that one segment’s investment depends on the
cash flow of the firm’s other segments.
In the following result, we present the equilibrium solution to the whole two-tier
principal-agent problem.
Proposition 5 The equilibrium solution of the two-tier principal-agent problem is
(SMX , KMX , SMX1 , SMX2 , kMX1 , kMX2 ) =
{uC − φΦ [k1, f(φ, k1)] + SMX1 + SMX2 , k1 + f(φ, k1),
uM1 − b(k1), uM2 − b [f(φ, k1)] , k1, f(φ, k1)} ,
21

where k1 satisfies
V1(k1) + b (k1)− 1 + {V2 [f(φ, k1)] + b [f(φ, k1)]− 1}∂f(φ, k1)
∂k1= 0. (14)
In this case, the CEO is receiving exactly his reservation utility.
The first-order condition for the owner’s problem, equation (14), consists of two
components,
V1(k1) + b (k1)− 1
and
{V2 [f(φ, k1)] + b [f(φ, k1)]− 1} ∂f(φ, k1)/∂k1,
representing the marginal benefit and cost of increasing kM1 , respectively. The term
∂f(φ, k1)/∂k1 can be viewed as a weighting factor depending on how the CEO dis-
tributes the change in the total resource available to the firm between the two seg-
ments.
The next result follows directly from the fact that the CEO is always receiving
exactly his reservation utility either in the stand-alone firm or the multi-segment firm.
We list it here to facilitate comparison with Corollary 5 in the case of endogenous
managerial ownership.
Corollary 6 When managerial ownership is exogenous, the CEO is indifferent be-tween being the CEO of the stand-alone firm and the multi-segment firm.
The next proposition is one of our main results – flattened resource allocations exist
in the multi-segment firm as long as there is separation of ownership and control.
22

v+b-k
k
Figure 2: Flattened Resource Allocations (kM1 < k∗1 and kM2 > k∗2.)
Proposition 7 (FRA and Diversification Discount) As long as the CEO is not thesole owner (φ < 1) of the firm, then we have
(a) the resource allocations in the multi-segment firm will be flattened, i.e.
kMX1 < k∗1 and kMX2 > k∗2.
(b) There exists diversification discount.
The result is also presented in Figure 2. where one can see that the multi-segment
firm (as indicated by the dashed lines) does not discriminate the two segments as
adequately as the stand-alone firms do (as indicated by the dotted lines), in terms of
resource allocations.
Since the resource allocations are first-best in the stand-alone firms but flattened in
the multi-segment firm, the following result obtains directly.
Corollary 8 It is more efficient for the two segment to be separated as two stand-alone firms than integrated as one multi-segment firm.
23

This result explains why the majority of those diversified conglomerates in Scharf-
stein’s [26] sample are broken up and also why acquiring firms will experience nega-
tive returns when they announce unrelated acquisitions (Morck, Shleifer, and Vishny
[23] ). Note that in this paper we do not intend to incorporate any benefit of integra-
tion because it has been well-studied and generally can be considered independent of
the current paper.
To set a benchmark for the analysis of overinvestment or underinvestment in the
total resource available to the firm, we make the following definition:
Definition 5 Define k1 as the resource that segment 1 gets allocated when the in-vestment in the total resource available to the multi-segment firm is first-best, i.e.k1 + f(φ, k1) = k
∗1 + k
∗2.
The next result provides conditions of overinvestment or underinvestment in the
total resource available to the firm.
Proposition 9 (The total resource available to the multi-segment firm) There will beoverinvestment in the total resource available to the multi-segment firm if
V1(k1) + b (k1)− 1 + V2 f(φ, k1) + b f(φ, k1) − 1 ∂f(φ, k1)
∂k1> 0; (15)
and there will be underinvestment in the total resource available to the multi-segmentfirm if
V1(k1) + b (k1)− 1 + V2 f(φ, k1) + b f(φ, k1) − 1 ∂f(φ, k1)
∂k1< 0. (16)
One interesting aspect of Proposition 9 is to discover the role of overinvestment, in
the total resource available to the firm, in alleviating managers’ agency problem6. Pi-6 Note that we are restricting our attention to capital misallocation caused by moral hazard. In thecase of adverse selection, there are some results where overinvestment and underinvestmentco-exist to induce truth-telling, for example, Antel and Eppen [2] and Harris and Raviv [15].
24

oneered by Jensen and Mercklin [19], a vast literature on corporate finance has gener-
ally found that the optimal defence of investors against managers’ abuse of investors’
resource is always some forms of underinvestment (investment less than the first-best
level). For example, Hart and Moore [14] maintain that debt contracts can refrain
managers from diverting investors’ resource, and underinvestment optimally arises in
the form of setting repayments too high that can lead to inefficient liquidation. The
disproportional emphasis on underinvestment are due to the common driving force
underlying most agency problems that have been studied – managers are always ex-
travagant with investors’ resource. In fact, it is hard to imagine why investors would
ever want overinvest if managers simply want to spend as much of the investors’
resource as possible. However, investors’ overinvestment happens naturally in our
setting because the problem at hand is really two-fold: the CEO is simultaneously
(a) extravagant towards the low-profit segment and (b) stingy towards the high-profit
segment. Therefore, when (a) is more costly than (b), it could be optimal for the
owner (investor) to underinvest and try to keep some resource out of the reach of the
CEO; when (b) is more of a problem than (a), it could be optimal for the owner to
overinvest and give the CEO some additional resource to play with. What distinguish
this paper from the standard Jensen-Mercklin type of results is exactly this two-fold
feature. It is important to note that the two-fold feature of our model does not come
directly from any non-standard property of the CEO’s utility function.7 In fact, the
7 For example, we do not assume that the CEO somehow prefer “fair” allocationsbetween the two segments that could directly lead to FRA.
25

CEO himself does not enjoy any private benefit from investment. It is the combination
of (i) the CEO’s simultaneous control over multiple activity – retaining the segment
managers and allocating resource (Assumption 2) – and (ii) the principal-agent re-
lationship between the CEO and the segment managers that translates the segment
managers’ private benefits into the CEO’s consideration.
After examining the total resource available to the firm, we will analyze the rela-
tionship between FRA and the CEO’s ownership of the firm. Denote the equilibrium
value of the multi-segment firm as WMX . We know that
WMX = Φ kMX1 (φ) , f φ, kMX1 (φ) + b kMX1 (φ) + b f φ, kMX1 (φ) .
The next proposition shows that social welfare, which equals the multi-segment firm’s
value, is increasing in the CEO’s ownership.
Proposition 10 (Inefficiency Increases in Separation of Ownership and Control)
dWMX
dφ> 0.
Proposition 10 highlights one of the sources of inefficiency – separation of owner-
ship and control. In general, this is not a surprising result, but we include it to show
that our model is consistent with the empirical results of Scharfstein [26].
After understanding the role played by separation of ownership and control in FRA,
we will turn to the next important source of the problem – diversification.
Diversification Destroys Value Since it is difficult to examine the welfare
impact of diversification using the general functional form assumed above for Vi and
26

b, we will consider a special case of the model. Assume everything remains the same
as before except that
V1(k1) = −ak21 + bk1 + αk1, V2(k2) = −ak22 + bk2 − αk2 and (17)
b(ki) = −ck2i + dki, (18)
whereb+ α
a<d
cand α > 0.
The parameter α serves as a measure of the degree of diversification for the multi-
segment firm.
Denote the optimal value of the multi-segment firm as W , and as a result W =
Φ (k∗1, k∗2) + b (k
∗1) + b (k
∗2). We believe what “diversification destroys values” means
is that the welfare loss,W −WMX , is increasing in the degree of diversification, α in
our context. This is shown in the next proposition:
Proposition 11 (Diversification Destroys Value) If Vi (ki) and b (ki) satisfy equation(17) and (18), then the welfare loss of resource allocation is an increasing function ofthe degree of diversification of the firm, i.e.
dW −WMX
dα> 0,
1.2.3 Endogenous Management Ownership
In the following part of the analysis we will examine the effect of allowing stock-
based compensation. It turns out that all the results developed in the previous section
will hold qualitatively the same as long as the CEO does not end up capturing the
ownership of the whole firm.
27

Optimal Resource Allocations in the Stand-alone Firm Suppose everything is
the same as in section 2.2.1 except that the owner has one additional decision variable
– the ownership of the CEO, φCi . As a result, the two-tier principal-agent problem for
each separately-owned firm i becomes finding (SCi,ki,φCi) such that
(SCi, ki,φCi) = arg max(SCi ,ki,φCi)
−SCi + (1− φCi)Φi(ki)
subject to
(φCi − φMi)Φi(ki) + SCi − Si ≥ uCi (19)
(Si,φMi) = arg max
(Si,φMi)
(φCi − φMi)Φi(ki) + SCi − Si
subject to
Si ≤ SCi
Si + φMiΦi(ki) + b(ki) ≥ uMi
,
with all decision variables nonnegative. Define variables with superscript “SN” as
their respective solutions in the stand-alone firm when the CEO’s ownership is en-
dogenous. Then the solution to this case is
(SSNC1 , SSNC2,φSNC1 ,φ
SNC2, SSN1 , SSN2 ,φSNM1
,φSNM2, kSN1 , kSN2 ),
where
kSNi = k∗i , SSNi +φSNMi
Φi(k∗i )+b(k
∗i ) = uMi
, and (φSNCi −φSNMi)Φi(k
∗i )+S
SNCi−SSNi ≥ uCi ,
(20)
28

for i ∈ {1, 2}. Since the resource allocations are still the first best, allowing profit
sharing does not matter for the stand-alone firm. In the next sub-section, we will turn
to the case of the multi-segment firm.
Optimal Resource Allocations in the Multi-segment Firm Suppose everything
is the same as in section 2.2.2 except that the principals, O and C, now have one
additional decision variable – the ownership of the agents , φC for C and φMifor Mi.
As a result, the two-tier principal-agent problem for the multi-segment firm becomes
finding (S,K,φC) such that
(S,K,φC) = arg max(S,K,φC)
−S + (1− φC)Φ(k1, k2) (21)
subject to
φC ≤ 1, (22)
(φC − φM1− φM2
)Φ(k1, k2) + S − S1 − S2 ≥ uC (23)
(S1,φM1, k1, S2,φM2
, k2) (24)
= arg max(S1,φM1
,k1,S2,φM2,k2)
(φC − φM1− φM2
)Φ(k1, k2) + S − S1 − S2 (25)
subject to
S1 + S2 ≤ S, φM1+ φM2
≤ φC , k1 + k2 ≤ K, and
Si + φMiΦ(k1, k2) + b(ki) ≥ uMi
for i ∈ {1, 2}, (26)
29

with all decision variables nonnegative. Define variables with superscript “MN” as
their respective solutions in the multi-segment firm when the CEO’s ownership is
endogenous. The following is the solution of this case.
Proposition 12 If Condition 1: the CEO’s participation constraint (equation (23))is not binding and Condition 2: [V2(k
MN2 )− 1]V1(kMN1 )−Φb (kMN2 ) < 0 hold, then
0 < φMNC < 1 and the solution satisfies that
SMN = SMN1 = SMN2 = 0, (27)
φMNMi=uMi− b(kMNi )
Φ(kMN1 , kMN2 )> 0 for i ∈ {1, 2}, and (28)
φMNC =[V2(k
MN2 )− 1]V1(kMN1 )− Φb (kMN2 )
[V2(kMN2 )− 1]V1(kMN1 ) + ΦV2 (k
MN2 )
, (29)
where kMN2 := g φMNC , kMN1 is determined by
φMNC V1(k1)− V2 g φMNC , k1 + b (k1)− b g φMNC , k1 = 0 (30)
and kMN1 is determined by
V1 kMN1 − 1 + V2 g φMNC , kMN1 − 1 ∂g φMNC , kMN1
∂k1= 0. (31)
Otherwise, φMNC = 1 and hence the resource allocations for both segments will befirst best.
Since the main interest of this paper is resource misallocation caused by separation
of ownership and control, we will focus our following discussion on the cases when
0 < φMNC < 1, i.e. when Condition 1 and 2 hold.
The implication of equations (27) and (28) is that rewarding the CEO with shares
is always preferred to cash. The reason is while both paying cash and paying shares
help in retaining the CEO, the latter “currency” has an additional benefit – to reduce
the separation of ownership and control. We summarize this implication with the next
corollary.
30

Corollary 13 When the owner can choose to reward the CEO with the firm’s shares,paying cash will be replaced by paying shares.
Note that in section 2.2 where managerial ownership is exogenous, if in equilib-
rium SMX1 = SMX2 = 0 the resource allocations will be first-best. The reason is
because cash was the only currency that the segment managers can used to “trade” for
an allocation different from the first best and the segment managers do not have any
cash to do so when SMX1 = SMX2 = 0. However, in this section, SMN1 = SMN2 = 0
can be a equilibrium outcome when FRA arise because there are now two potential
currencies – cash and shares – and the segment managers are given positive amount
of shares (as in equation (28)) so that they still can trade for FRA even though they do
not have any cash.
Some comparative-static results with respect to the equilibrium shares awarded to
the CEO can be explored with equation (29) as shown in the next corollary.
Corollary 14 The amount of shares the CEO receives, φC decreases in Φ and in-creases in b (k2).
The intuition behind Corollary 14 is the following: First, when Φ increases, given
the same amount of shares, the value of the share rewarded to the CEO increases, and
hence the owner can lower the amount of the award a bit without making the CEO’s
participation constraint bind. Second, when b (k2) increases, it means it will require
a bigger change in resource allocations to change a given amount of marginal utility
on empire building. As a result, the misallocation problem becomes more severe
31

because the CEO will need to flatten the resource allocations more in order to reduce
the difference between the segment managers’ marginal benefits from empire building
(i.e. to achieve equation (30)). So it is conceivable that the CEO can appropriate more
shares from the owner.
Another interesting result of Proposition 12 lies in Condition 1 – if we rule out the
first-best case when the CEO capture the whole firm, the CEO is necessarily getting
some positive “profit” (the part of utility that is over his reservation value) as his con-
trol rent independent of any possible competition in the CEO’s labor market. This
differs from the standard argument that a agent’s participation constrains will bind
when there is severe competition in the agent’s labor market. There are some empir-
ical results that are consistent with this result. For example, Bliss and Rosen [5] find
that, in the banking industry, CEO compensation generally increases after mergers
even if those mergers destroy value.
Furthermore, since managing the multi-segment firm gives the CEO more than
what he can receive in the stand-alone firm, the next corollary follows directly:
Corollary 15 When managerial ownership is endogenous (stock-based compensa-tion is possible), the CEO will strictly prefer to manage the multi-segment firm.
Finally and most importantly, equation (30) implies one of the central first-order
conditions for FRA will still hold when the managerial ownership is endogenous as
long as φMNC < 1. However, the pattern of “flattened” resource allocations become
less clear-cut:
32

Proposition 16 (FRA and Diversification Discount) When managerial ownershipis endogenous, as long as the CEO does not capture the whole firm ( φMNC < 1), thenwe have
(a) the resource allocations are “flattened” in the following sense: Compared tothe stand-alone firms, there exist either (I) underinvestment in the more profitablesegment and overinvestment in the less profitable segment or (II) underinvestment inboth segment. Specifically, the allocations satisfy one of the following three cases: (i)k−2 < k
∗2 < k
MN2 and kMN1 < k−1 < k
∗1, (ii) k−2 < k
MN2 < k∗2 and kMN1 < k−1 < k
∗1, or
(iii)kMN2 < k−2 < k∗2 and k−1 < k
MN1 < k∗1.
(b) There exists diversification discount.
Regarding the total resource available to the firm, since the CEO is getting more
than his reservation value, the owner’s decision rule for the total resource available to
the firm become equation (31), compared to equation (14) when the CEO’s participa-
tion constraint binds. As a result, the condition for over- or underinvestment in the
total resource available to the firm become the following:
Proposition 17 There will be overinvestment in the total resource available to thefirm if
V1 k1 − 1 + V2 g φMNC , k1 − 1∂g φMNC , k1
∂k1> 0,
and there will be underinvestment in the total resource available to the firm if
V1 k1 − 1 + V2 g φMNC , k1 − 1∂g φMNC , k1
∂k1< 0.
Note that one part of the owner’s marginal benefit of resource that appears in Propo-
sition 9, b (k1) + b (k2) ∂∂k1k2, disappears in Proposition 17. This is because here the
private benefit of the segment managers cannot get transmitted to the owner through
the channel of compensation to the CEO, which is open only when the CEO’s partic-
ipation constraint is binding. Since b (k1) + b (k2) ∂∂k1k2 > 0, the owner’s marginal
33

revenue of resource is always greater when the owner cannot use stock-based com-
pensation than when she can. The next result follows directly from this observation.
Corollary 18 The owner will provide strictly less resource to the multi-segment firmwhen the owner can use stock-based compensation when she cannot.
In the following sub-section, we will complete the analysis of the case of endoge-
nous managerial ownership by reexamining the effect of diversification.
Diversification Destroys Value Denote the equilibrium value of the multi-
segment firm asWMN . Note that nowW = Φ k−1 , k−2 and
WMN = Φ kMN1 (φ) , g φMN , kMN1 (φ) .
By using the quadratic functional form for Vi (ki) and b (ki) specified in equations
(17) and (18), we can show that diversification still destroys value under endogenous
manager ownership.
Proposition 19 (Diversification Destroys Value) If Vi (ki) and b (ki) satisfies equa-tions (17) and (18), then the welfare loss of FRA is an increasing function of the degreeof diversification of the firm, i.e.
dW −WMN
dα> 0.
1.3 Discussion and Concluding Remarks
We can use the current static model to shed light on dynamic situations by interpret-
ing the two different segments of a multi-segment firm producing in one period as one
segment of a stand-alone firm producing in two different periods. With this interpreta-
tion, our results imply that the difficulty of the owner in controlling investment in one
34

period from spilling over into another period, for example, through retained earnings,
allows the CEO to flatten resource allocations between high- and low-productivity
periods.
Two other related real-life phenomena deserve some discussion. First, even though
many acquisitions destroy value, we often observe them taking place in the real world.
Our explanation is that it is usually the CEO who dominates acquisition decisions. For
instance, it is usually the CEO who has the best information on how much synergy
can be generated by a certain merger. As long as, there is no strong consensus among
the shareholders against the merger, the CEO will generally be able to get his way.
According to Corollary 15, the CEO always prefers managing firms with more unre-
lated segments. So, they will proceed with acquisitions even though doing so might
destroy the firm’s value. Second, while conglomerates in general are the major vic-
tims of FRA, some conglomerates, for example General Electric, seem to perform
very well even though the CEO has a small stake in the firm. As we understand, the
long life of General Electric is primarily due to the excellent job of its legendary CEO,
Jack Welch, in creating synergy by establishing a strong corporate culture in sharing
valuable knowledge among segments8. When the synergy outweighs the cost of FRA,
conglomerates could be efficient. While synergy is not modeled in the current model,
it can generally be considered independently with the cost of FRA.
There seems to be a new kind of agency problem that has been identified – moral
8 For detailed information on this, see “The house that Jack built”, Economist, Sep 16th 1999.
35

hazard in hierarchy. There are several distinct characteristics of this kind of agency
problem. First, it only exists in multiple-tier principal-agent relationships with mul-
tiple agents at the bottom tier. Second, allocating resource is one but not the only
important activity that need to be carried out in the hierarchy. For instance, the CEO
in our model is not only in charge of allocating resource but also retaining the segment
managers. This creates the scope of inefficiently sacrificing one activity for the other.
Third, hierarchical structure matters. For example, the stand-alone structure is pre-
ferred to the multi-segment structure in our setting. Finally, an agent whose objective
is misaligned with the principal does not need to have direct access to the action that
can be used to exploit the principal. While in most of the agency literature, problems
occur because the objective of the principal and the agent misalign and the very same
agent can use his action to pursuit personal interest at the expense of the principal.
But in our model, the segment managers have the empire-building tendency but can-
not alter their allocations. The CEO has the right to alter the allocations but does not
care about empire building at all. In fact, before the CEO is assigned the job of re-
taining the segment managers, the objective of the owner and the CEO are the same –
to maximize firm value, because they each own a portion of the firm. However, once
the CEO is assigned as the principal of the segment managers, he starts to care about
empire building because his goal becomes now to maximize the sub-social welfare
instead of the total-social welfare.
To highlight the problem of FRA, we employed some rather extreme assumptions.
36

In practice, there are many observed bureaucratic restrictions which can alleviate the
FRA problem, such as enhanced accounting and auditing practices which increase the
contractibility of resource allocations and managers wages or limit the CEO’s ability
to divert personnel budget, or better separated authority in resource allocations and
personnel retaining. However, as long as the contracting environment is not perfect,
the problem of FRA will still exist.
This paper is one of the elementary steps in understanding the workings of the in-
ternal resource market. Obviously, a real-life internal resource market involves much
more sophisticated features than we have presented in this paper. For example, there
may well be multiple allocators in different layers of the hierarchy. Adding more al-
locators might enable us to analyze the cost and benefit of decentralizing the resource
allocation decision. The next chapter presents an extension alone this line
37

2 Hierarchy Design with Flattened Resource Allocations
2.1 Introduction
One of the important agendas in organization theory is to understand why and how
organization forms matter. While most organizations are hierarchical to some ex-
tent, they differ in many other respects. The primary focus of this paper is hierarchy
heights, which is usually negatively correlated with another organizational variable –
average control span. On this particular dimension, organizations can be categorized
into the following two types: (1) flat hierarchies, the ones that have less layers and
hence larger average control span, and (2) tall hierarchies, the ones that have more
layers and hence smaller average control span. Flat hierarchies can be transformed
into tall hierarchies through divisionalization – grouping elementary segments into
smaller numbers of divisions and delegating some of the control of the divisions to
division managers. In general, the heights of a hierarchy can represent the degree
of delegation or decentralization and affects the efficiency of many activities such as
information processing9, intra-firm bargaining10, capital budgeting11, utilizing skilled
worker12, coordination and specialization13, and protection of the source of organiza-
tional rent14 in the organization.
The novel angle employed in this paper to examine the efficiency of different hi-
9 There is a vast literature on this. See for example Bolton and Dewatripont[6].10 See Stole and Zwiebel [30].11 See Harris and Raviv [16].12 See Beggs[1].13 See Hart and Moore [13].14 See Rajan and Zingales[25].
38

erarchies is through resource allocation, one of the most important functions in most
organizations, especially the firm. From perspectives slightly different from hierar-
chy heights, organization theorists have long been concerned about how organization
forms affect the efficiency of resource allocations, especially the comparison between
the multi-division or M-form firm and the unitary form or U-form firm. Known as the
seminal M-form Hypothesis, Williamson [33, p150] argues that:
The organization and operation of the large enterprise along the line of theM-form favors goal pursuit and least-cost behavior more nearly associated withthe neoclassical profit maximization hypothesis than does the U-form organiza-tional alternative.
According to Williamson, the M-form structure is more efficient than the U-form
structure because by dividing the firm into divisions and delegating each division’s
functional decisions (such as manufacturing, sales, finance, and engineering) to the
division managers, the M-form structure “economizes on bounded rationality” and
hence enjoys lower information, fine-tuning, and displacement costs than U-form
structure does in resource allocation. In short, the M-form firm can operate as a
“miniature capital market” and has a better ability in assigning resource to high-yeild
uses.
One might notice that there is a certain degree of overlapped focus in discussing
organization forms and hierarchy designs. In fact, the distinguishing feature of fall
hierarchies, compared to flat hierarchies, is decentralized decision making, which also
happens to be one of the important features of the M-form structure that distinguish it
39

from the U-form structure. From this perspective, discussions on the hierarchy heights
can shed substantial light on organization forms.
Admittedly the M-form firm has many advantages in economizing bounded ratio-
nality in organizations. For a recent example, Maskin, Qian and Xu [21] argue that
one of the superiorities of the M-form structure is that the M-form structure facili-
tates relative performance evaluation. However, as information technology and the
external resource market advance, the rationality of the firm improves and hence the
relative advantage of the M-form firm should diminish. In fact, recently many firms
“reengineer” or “downsize” by eliminating middle-layer managers in order to survive
competition,15 suggesting that it can be more efficient for top managers to take back
some of the decision rights that were delegated to the middle-layer managers. Also,
firms with a tall hierarchy are getting replaced by firms with a flat hierarchy.16 These
facts seem to suggest that there might be a increasingly important cost in the M-form
structure that has been long overlooked.
One crucial assumption underline the M-form Hypothesis is that the more internal
a organization’s controlling apparatus is, the more efficient the organization will be.
This assumption is also used by Williamson to argue the superiority of the firm over
the market in allocating resource because the firm has a more internal control than
the market has. However, this assumption has been challenged by the recent devel-
oped literature on misallocation in internal resource (especially capital) market where
15 See Hammer and Champy[11].16 See for example Buble[8].
40

many empirical evidences are found to show that the firm can actually underperform
the market in resource allocation. For example Scharfstein [26] identify a peculiar
inefficient pattern in the way multi-segment firms allocate resource inside the firm –
low-profit segments tend to be overinvested and high-profit segments tend to be un-
derinvested, that is, resource allocations are flattened. This finding cases serious doubt
on Williamson’s view about the firm. Moreover, it is also found that the seriousness of
this flattened resource allocations (henceforth FRA) problem is positively correlated
with the diversity of the firm and negatively correlated with the managerial owner-
ship.17 Again, all these evidences point to a cost in the firm that is rarely understood.
Recently, the theoretical rationale for why FRA happen in the firm but not in the mar-
ket has been explored by the previous chapter and Scharfstein and Stein [27]. In the
current paper, we extend the previous chapter and reexamine the M-form hypothesis
from the perspective of FRA.
The followings are our two main research questions: First, what is the potential
pattern of FRA when divisionalization is possible? Second, and most importantly,
how does the heights of a hierarchy affect its efficiency in resource allocation?
The answer to the first question the firm only has two business segments is provided
by the previous chapter and Scharfstein and Stein [27]: it is simply that the high-profit
segment gets underinvested and the low-profit segment gets overinvested. There is
no important role for divisionalization in a two-segment firm because with or without
17 The diversity result is found by Rajan, Servaes and Zingales [24], and the effectof managerial ownership is found by Scharfstein [26].
41

divisionalization it is still one person being in charge of the task of resource allocation.
As a result there is always only one layer of resource allocations flattening. The
only difference is that resource allocations are flattened by the CEO if the firm is not
divisionalized and by the division manager if the firm is divisionalized.
Obviously, most multi-segment firms have more than two business segments in
practice18. The pattern of FRA become subtler when the firm has many (more than
two) business segments and divisionalization become an important issue because it
will create new layers of allocations flattening under the existing one. The allocations
flattening effect of the division manager necessarily affects the allocation decision
of the CEO and hence the undivisionalized segments or segments belong to other
divisions.
The answer to the second question is not trivial, either. While increasing the layers
of a hierarchy would seems to entail additional losses of control,19 it does not nec-
essary do so.20 In our context, adding layers to a hierarchy means replacing a “big”
principal-agent problem with several “small” ones. Therefore, it is difficult to draw
any conclusion with out working out a specific model.
We consider a firm with three different business segments (see Figure 3) that can
be organized as a flat hierarchy, consisting one CEO directly controlling all three
segments, or three different tall hierarchies, consisting on division manager directly18 In fact, some of them might even have hundreds or thousands of business segment underthe name of one firm. According to the Economist (Sep. 1st-7th 2001), Toshiba,Fujitsu, and Hitachi respectively has 323, 517, and 1069 segments.19 See for example Williamson [35].20 See Mirrless [22]and Calvo and Wellisz[9].
42

controlling two segments and then a CEO controlling the division manager and the
segment that does not belong to the division. Both the CEO and the division manager
are agents of the firm’s owner and are in charge of both allocating resource to and
compensating their direct subordinates by paying them cash. In addition to the cash
they received, the segment managers also have an empire building tendency and hence
care about managing a segment allocated with as much resource as possible. Since a
more profitable segment is supposed to receive more resource and the private benefit
of empire building is a concave function of resource, a resource allocator can save
cash by redirecting some resource from the segment manager who has lower marginal
utility of resource (the manager the more profitable segment) to the segment manager
who has higher marginal utility of resource (the manager of the less-profit segment),
while keeping the segment managers receiving the same reservation values. Ineffi-
cient FRA is in the interest of the resource allocators because they do not bear the full
cost of misallocation but enjoy the full benefit of cash payment saving. The previous
chapter identifies the source of the problem of FRA as a negative externality caused
by the resource allocator (the CEO) maximizing the welfare of a sub-society that ex-
cludes the owner without considering the cost to the whole society. In the current
paper, an additional negative externality can added by divisionalization because the
division manager will be maximizing the welfare of a even smaller sub-society that
exclude, the owner, the CEO, and the manager of the segment that does not belong to
the division. As a result, flat hierarchy outperforms any tall hierarchies in resources
43

Figure 3: Four Hierarchies
F Owner (O)
CEO (C)
1 (M1) 2 (M2) 3 (M3)
(1− φ)
φ
(SC ,K)
(S1, k1) (S2, k2) (S3, k3)
T1 Owner (O)
CEO (C)
1 (M1) 2 (M2) 3 (M3)
Division Manager (D)
(1− φ)
φ
(SC ,K)
(S1, k1) (S2, k2) (S3, k3)
(SD, kD)
T2 Owner (O)
CEO (C)
2 (M2) 1 (M1) 3 (M3)
Division Manager (D)
(1− φ)
φ
(SC ,K)
(S2, k2) (S1, k1) (S3, k3)
(SD, kD)
T3 Owner (O)
CEO (C)
3 (M3) 1 (M1) 2 (M2)
Division Manager (D)
(1− φ)
φ
(SC ,K)
(S3, k3) (S1, k1) (S2, k2)
(SD, kD)
allocation because increasing the layer of a hierarchy necessarily aggravates the prob-
lem of FRA.
Generally speaking, the major differences between the U-form and the M-form
structure is that most of the management decisions are made by the CEO in the U-
form structure, whereas in the M-form structure some decisions (functional decisions)
44

are delegated to lower-level division managers. In our setting, the tall hierarchy can
be associated with the M-form structure since some of the decisions are delegated to
lower-level division managers in the tall hierarchy, and the flat hierarchy can repre-
sents the U-form structure since it is only the CEO is making all the decisions in the
flat hierarchy. With this linkage, our results suggest that the U-form structure is more
efficient than the M-form structure in resource allocation, as opposed to Williamson’s
M-form hypothesis.
In fact, Williamson reckons that there are factors other than divisionalization and
delegation that are also important for the M-form structure to realize its performance
potential. However, what is surprising in our result is that when FRA arise, the M-
form structure can not even work as efficiently as, let alone more efficiently than, the
U-form structure. By concentrating on FRA, we highlight the possibility that even the
firm might be able to develop an internal resource allocation capacity that can assign
resources to high yield uses, it might not has the right incentives to do so. This is an
inherent defect of the M-form structure that needs to be considered more seriously
than before.
One might argue that, in the original text of Williamson, resource allocation was
considered am example of the strategic decisions that need to be preserved for the
CEO in both the U-form and M-form structure. So, in a sense, whether resource al-
location is delegated can not seem to serve as distinction between the U-form and
M-form structure. However, we believe this view is taking the text too literally. After
45
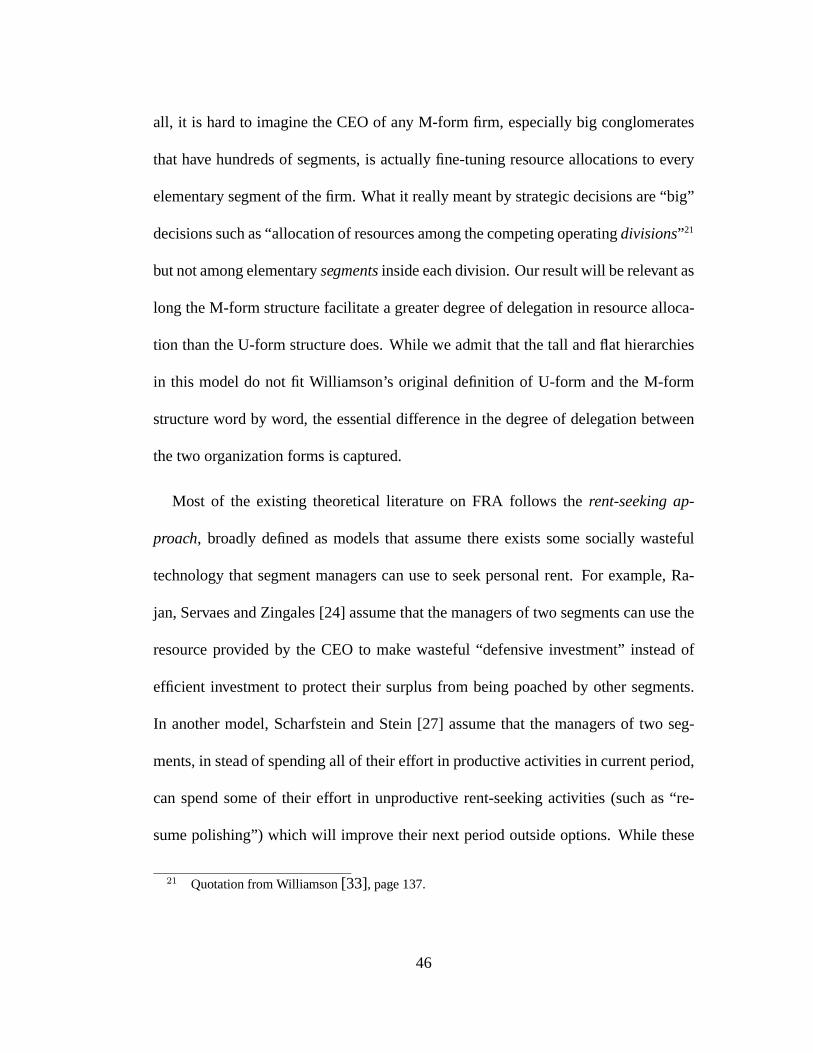
all, it is hard to imagine the CEO of any M-form firm, especially big conglomerates
that have hundreds of segments, is actually fine-tuning resource allocations to every
elementary segment of the firm. What it really meant by strategic decisions are “big”
decisions such as “allocation of resources among the competing operating divisions”21
but not among elementary segments inside each division. Our result will be relevant as
long the M-form structure facilitate a greater degree of delegation in resource alloca-
tion than the U-form structure does. While we admit that the tall and flat hierarchies
in this model do not fit Williamson’s original definition of U-form and the M-form
structure word by word, the essential difference in the degree of delegation between
the two organization forms is captured.
Most of the existing theoretical literature on FRA follows the rent-seeking ap-
proach, broadly defined as models that assume there exists some socially wasteful
technology that segment managers can use to seek personal rent. For example, Ra-
jan, Servaes and Zingales [24] assume that the managers of two segments can use the
resource provided by the CEO to make wasteful “defensive investment” instead of
efficient investment to protect their surplus from being poached by other segments.
In another model, Scharfstein and Stein [27] assume that the managers of two seg-
ments, in stead of spending all of their effort in productive activities in current period,
can spend some of their effort in unproductive rent-seeking activities (such as “re-
sume polishing”) which will improve their next period outside options. While these
21 Quotation from Williamson [33], page 137.
46

model did provide useful insights to the problem, they share two major defects. First,
and most importantly, their results are very sensitive to the detailed design of the
rent-seeking game used in the models, implying a slight change of the model can
overturn the results22. Second, the total resource available to the whole firm is ex-
ogenous. As a result, these models can not rule out the possibility that all segments
are underinvested or overinvested, cases that are anomalies to FRA and can happen if
the ultimate resource provider decide to underinvest or overinvest substantially in the
firm. The previous chapter fixes these two problems and prove the results of FRA in a
simpler model with two segments that does not involve any rent seeking behavior and
endogenizes the total resource available to the firm.
In another rent-seeking model discussing hierarchy design, Inderst, Müller, and
Wärneryd [18] argue that firms with more layers of hierarchy may experience lower
influence activities. Combined with the results of the rent-seeking approach on FRA,
this would seem to suggest that the FRA problem will be less severe in firms with more
levels of hierarchy. This conjecture strengthens the motivation of the current paper
since it contradict with our result and hence highlight the potential difference between
our approach and the rent-seeking approach. However, given the problematic linkage
between rent-seeking behavior and FRA, this conjecture is unlikely to be relevant.
As mentioned above, we obtain our result by extending the model of The previous
22 For example, in Scharfstein and Stein [27] if one add the assumption that thesegment managers’s outside options are positively related with the segment’s productivity,completely opposite results obtain.
47

chapter. An analogous research agenda is also followed in the related capital budget-
ing literature. Harris and Raviv [16] expended their earlier paper (Harris and Raviv
[15]) that rationalizes the capital budgeting procedure and argue that delegation of re-
source allocation is more likely to be efficient when decentralized information is more
costly to elicit or the value of the information is lower.23 This result reconfirms the
role of hierarchies in economizing information process cost and complement our re-
sult when information is decentralized. However, this capital budgeting literature can
not address the problem of FRA because agency problems and diversity of the firm
are the two major sources of FRA but do not play any role in the capital budgeting
literature.
The rest of the paper is organized as follows: Section 2 setups the model. Section
3 analyzes the model and presents the results. Section 4 concludes the paper.
2.2 Model Setup
2.2.1 Assumptions and Definitions:
There are three business segments in a firm, indexed by i, i ∈ {1, 2, 3}. Denote the
revenue function of segment i as Vi(ki), where ki is the segment i’s resource input.
Each Vi satisfies the following assumption:
Assumption 1: Vi : R→ R, i ∈ {1, 2, 3}, is a continuously differentiable strictly
concave function which satisfies Vi(0) = 0, −∞ < Vi (k) < 0, and
V3(k) < V2(k) < V1(k). (32)23 Recently Bernardo, Cai and Luo [4] extended Harris and Raviv’s [16] model byincorporating moral hazard.
48

Inequality (32) reflects the diversity among the three segments, which is mod-
eled by the differences in their marginal revenue of resource. By this construc-
tion, segment 1 is the most profitable segment, segment 3 is the least profitable
segment, and segment 2 is the medium segment. The total profit of the firm is
V1(k1) + V2(k2) + V3(k3)− k1 − k2 − k3 and denoted as Φ(k1, k2, k3).
There are four kinds of professionals in the firm: the owner (henceforth O), the
CEO (henceforth C), the division manager (henceforth D), and the segment man-
agers (henceforth Mi, i ∈ {1, 2, 3}). While the O, C, and Mi’s are assumed to be
indispensable to the firm, the existence of D need to be endogenously determined,
depending on whether there is divisionalization. When there is no divisionalization
and henceD is not employed, the firm consist of a two-tier hierarchy (as shown by F
of Figure 3.), with O at the top as C’s principal, C at the middle asMi’s principal and
Mi’s at the bottom of the hierarchy as simply agents. When there is divisionalization
and hence D is hired, the firm consists of a three-tier hierarchy (as shown by T1, T2,
or T3 of Figure 3.), with O at the top as C’s principal, C at the second level as D’s
principal, D’s at third level as the principal of those Mi’s that belong to the division,
andMi’s at the bottom level of the hierarchy as simply agents.
Except Mi’s, all other professionals are potential shareholders of the firm. Denote
total managerial ownership, the sum of shares owned by C and D, as φ < 1. Con-
sequently, the fraction of shares owned by O should be 1 − φ. For simplicity, we
assume that Mi’s possess no ownership of the firm. Relaxing this assumption will
49

not change the result because, as it turns out, it is the total managerial ownership (φ)
and its distribution between the decision makers, C and D, that matters. Denote also
the fraction of managerial ownership owned by D as ρ. As a result, the ownership
of C and D are (1− ρ)φ and ρφ, respectively. In this paper, ρ and φ are exogenous.
Arguably, managerial ownerships can be decision variables of O. But, in practice,
there are many reasons outside our model why the owner of a firm is refrained from
freely rewarding the management with shares. One example is that the owner might
want to maintain her status as a majority shareholder. Also, endoginizing ρ and φ is
too difficult to analyze in the current framework and would not bring any qualitative
changes to our results, as shown in the previous chapter with a less complex model.
WhileO,C,D, andMi’s all care about their personal wealth – the sum of the value
of cash and shares they own,Mi’s also enjoy a private benefit, b(ki) from managing a
segment with resource ki 24. This private benefit reflects the empire building tendency
of the segment managers and satisfies the following assumption:
Assumption 2: b : R → R, is a continuously differentiable function which satis-
fies
limki→0+
b (ki) =∞, b (ki) > 0, and −∞ < b (ki) < 0.
O alone owns a unlimited endowment of cash and resource25, whereas C, D, and
Mi’s have no endowment to start out with. In each layer of principal-agent relation-
24 The possibility that O, C, or D might also enjoy private benefit from resourcewill not change the current result qualitatively and hence is ruled out for simplicity.25 One way to envision this is to imagine O as a group of dispersed shareholderswho act cooperatively.
50

ship, the principal decides only how much cash and resource to give his/her direct
agents out of the cash and resource provided by the principal’s principal, if the prin-
cipal is not O. If the principal is O, then she provides cash and resource out of her
own endowment. By this setting, we implicitly invoke two important assumptions:
Assumption 3: The amount of cash and resource a principal provides to each of
his/her agent are not contractible to the principal’s principal.
Assumption 4: A principal can divert any cash provided by his/her principal that
are not given to his/her agents.
“Resource” include anything that can be transformed into revenue, whereas “cash”
is used to compensate employees to satisfy their participation constraints and is broadly
defined to include all means of compensating a employee, such as salary, employee
benefits, or cooperate perks. Assumption 3 can be rationalized by the well-known
difficulty in attributing a firm’s resource usage to each individual business segment
in accurate accounting terms. Assumption 4 can be due to a budgeting system that
facilitates flexibility. For example, the shareholder could allow a certain budget for
employees’ traveling. To the extent that a CEO can spend more on his own traveling,
he might want to reduce the travel spending of his subordinates, given the assumption
that everybody enjoys traveling.
Denote the cash that C got paid,D got paid, andMi’s got paid as, SC , SD, and Si,
respectively. To include all the possible hierarchy designs, we denote the segment that
is directly managed by C (the “independent” segment) as segment l and the segments
51

that are grouped into a division and managed by D (the divisionalized segments) as
segments m and n with n > m so that segment n (m) represents the divisionalized
segment that is less (more) profitable. According our setup above, the utility functions
for O, C, D, andMi’s are respectively
UO : = −SC + (1− φ)Φ(kl, km, kn),
UC : = SC − SD − Sl + (1− ρ)φΦ(kl, km, kn),
UD : = SD − Sm − Sn + ρφΦ(kl, km, kn), and
UMi : = Si + b(ki).
The first-best resource allocations are defined as follows:
Definition 6 The first-best resource allocation for segment i is k∗i such that
k∗i = argmaxki[Vi(ki) + b(ki)− ki].
Assume also that for all i there exist ki < ∞ such that Vi (ki) + b (ki) < 126.
According to the difference in the segments’ marginal revenue, we have
k∗1 > k∗2 > k
∗3,
which reflects the idea that a more profitable segment usually deserves a higher re-
source allocation. The following four definition characterize FRA, which is compli-
cated by the possibility of divisionalization.
Definition 7 The resource allocations are flattened at the division’s level if kn ≥ k∗nand km ≤ k∗m26 This combined with the boundary condition in Assumption 2 guarantees that k∗i ∈ (0,∞) for alli.
52

Definition 8 The resource allocations are flattened at the firm’s if k3 ≥ k∗3 andk1 ≤ k∗1
Definition 9 The resource allocations are weakly flattened if they are flattened at thedivision’s level or at the firm’s level.
Definition 10 The resource allocations are strongly flattened if they are flattened atthe division’s level and at the firm’s level.
To rule out non-instructive corner solutions where the CEO, division manager, or
the segment managers receiving zero net cash, we also make the following assump-
tion:
Assumption 5: The reservation values of the CEO, the division manager and the
segment managers are high enough (in particular strictly greater then zero) so that
their participation can not be satisfied without being paid a positive net cash.
With three segments, there are totally four possible hierarchies F , T1, T2, and T3,
as shown in Figure 3. Among them, F is the only flat hierarchy, representing U-
form structure or organizations without divisionalization, whereas T1, T2, and T3 are
tall hierarchies, representing M-form structure or organizations with divisionalization.
The respective problems for flat and tall hierarchies are formulated in the following
two subsections.
2.2.2 The Flat Hierarchy (F )
Under F , C directly manage three segment managers without the help of D. So
in this case, φ is simply the ownership of C. Denote S := (S1, S2, S3) and k :=
(k1, k2, k3). To determine the resource allocations, we have to solve the following
53

two-tier principal-agent problem:
max(SC ,K)
−SC + (1− φ)Φ(k1, k2, k3)
subject to
SC −3
i=1
Si + φΦ(k1, k2, k3) ≥ uC (33)
(S,k) = argmax(S,k)
SC −3
i=1
Si + φΦ(k1, k2, k3)
subject to3
i=1
Si ≤ SC
3
i=1
ki ≤ K (34)
Si + b(ki) ≥ ui for i ∈ {1, 2, 3}, (35)
with all decision variables non-negative and uC and ui respectively representing the
reservation value of the CEO and the manager of segment i.
2.2.3 The Tall Hierarchy (Tl)
For Tl, the following three-tier principal-agent problem need to be solved:
max(SC ,K)
−SC + (1− φ)Φ(kl, km, kn)
subject to
SC − SD − Sl + (1− ρ)φΦ(kl, km, kn) ≥ uC (36)
(SD, Sl, kD, kl) = arg max(SD,Sl,kD ,kl)
SC − SD − Sl + (1− ρ)φΦ(kl, km, kn)
54

subject to
SD + Sl ≤ SC (37)
kD + kl ≤ K (38)
SD − Sm − Sn + ρφΦ(kl, km, kn) ≥ uD (39)
(Sm, Sn, km, kn) = arg max(Sm,Sn,km,kn)
SD − Sm − Sn + ρφΦ(kl, km, kn)
subject to
Sm + Sn ≤ SD (40)
km + kn ≤ kD (41)
Sm + b(km) ≥ um and Sn + b(kn) ≥ un, (42)
with all decision variables non-negative and uC , uD and ui respectively representing
the reservation value of the CEO, the division manager and the manager of segment i.
2.3 The Analysis
The following two lemmas characterize the equilibrium for the resource allocations
under flat and tall hierarchies.
Lemma 20 The equilibrium resource allocations (k1, k2, k3) for the flat hierarchysatisfy the first-order conditions for C’s problem, which are
φ [V2(k2)− V1(k1)] + b (k2)− b (k1) = 0, (43)
andφ [V3(k3)− V1(k1)] + b (k3)− b (k1) = 0, (44)
55

and the first-order condition for O’s problem, which is
V1 (k1) + b (k1)− 1 + [V1 (k2) + b (k2)− 1]∂k2∂k1
+ [V3 (k3) + b (k3)− 1]∂k3∂k1
= 0.
(45)
Proof. All proofs of this chapter are in Appendix B.
Lemma 21 The equilibrium resource allocations (k1, k2, k3) for the tall hierarchysatisfy the first-order condition forD’s problem, which is
ρφ [Vm(km)− Vn(kn)] + b (km)− b (kn) = 0, (46)
and the first-order condition for C’s problem, which is
MBC := φ Vm (km)∂km∂kn
+ Vn (kn)− Vl (kl)∂km∂kn
+ 1 (47)
+b (km)∂km∂kn
+ b (kn)− b (kl) ∂km∂kn
+ 1 = 0,
and the first-order condition for O’s problem, which is
MBO := Vl (kl) + b (kl)− 1 + [Vm (km) + b (km)− 1]∂km∂kl
(48)
+ [Vn (kn) + b (kn)− 1]∂kn∂kl
= 0.
Since the concavity of Vi’s and b only guarantees the second-order conditions for
equations (43), (44) and (46), we also need the following assumption to ensure the
optimality of the solutions in Lemma 20 and 2:
Assumption 6:
∂
∂knMBC < 0 (49)
and
∂
∂klMBO < 0. (50)
One example where Assumption 6 holds is when functionsVi’s and b are quadratic27.27 When functionsVi and b are quadratic, ∂MBC/∂kn < 0 since ∂2km/∂k
2n = 0
and ∂MBO/∂kl < 0 since ∂2km/∂k2l = ∂2kn/∂k2l = 0 (can be obtained from equation (91)).
56

Proposition 22 (a) The resource allocated to the three segments are positively re-lated to each other, i.e.
∂km∂kn
> 0,∂kn∂kl
> 0 and hence∂km∂kl
> 0
(b) As D’s portion of ownership (φρ) increases, the resource allocated to the twodivisionalized segments will move apart from each other, i.e.
∂km∂ρ
> 0 and hence∂kn∂ρ
< 0;∂km∂φ
> 0 and hence∂kn∂φ
< 0.
Part (b) of Proposition 22 confirms the result of Scharfstein [26] and the intuition
that reduced separation of ownership from control results in more efficient alloca-
tions28 since, generally speaking, less flattened allocations are more efficient.
One important problem in the internal resource market is that segments can not
get their optimal resource allocations based on their own profit-maximizing concerns.
The resource allocated to one segment necessarily depends on attributes, such as cash
flow (Shin and Stulz [28]), of the other segments in the firm. This externality is
previously modeled in the previous chapter. We extended it in the following result by
incorporating divisionalization:
Proposition 23 <Socialism in the Internal Resource Market> Any change in thetotal resource available to the firm (division) will cause the resource allocation ofeach segment in the firm (division) to change in the same direction, i.e.
0 <∂kl∂K
< 1, 0 <∂kD∂K
< 1, 0 <∂km∂kD
< 1, and 0 <∂kn∂kD
< 1.
We characterize a general pattern of FRA for all the hierarchies in the next result.
Proposition 24 The resource allocations are strongly flattened in F and stronglyflattened in Tl. In particular, segment 1 (the most profitable segment) is always under-invested, i.e. k1 < k∗1, except in T1; segment 3 (the least profitable segment) is alwaysoverinvested, i.e. k3 > k∗3, except in T3.28 This is statement is formally proved in Proposition 10.
57

The reason why there could be cases that resource allocations are only weakly flat-
tened but not strongly flattened is because the resource flattening of the division man-
ager complicates the resource allocations flattening of the CEO. As previously shown
in the previous chapter, there could be overinvestment or underinvestment in the total
resource available to the firm when the CEO is the only one flattening the resource
allocations. In the current model, the division manager also has the ability to flatten
resource allocations inside the division and hence there can also be overinvestment or
underinvestment in the total resource available to the division. As a result, it could
be optimal to overinvest (underinvest) in segment 1 (3) if the underinvestment (over-
investment) in the total resource available to the division is so severe that the benefit
of increasing (decreasing) the total resource available to the division out weights the
cost of overinvesting (underinvesting) in segment 1 (3), since the resource allocations
to the division and the independent segment, kD and kl respectively, should always
move in the same direction as shown in Proposition 22.
The next result characterize FRA for each tall hierarchy.
Proposition 25 (a) Under T2, the resource allocations are strongly flattened.(b) Under T1 (T3), the resource allocations are flattened at the division’s level if
they are flattened at the firm’s level and φ is big enough.
DenoteWF(φ) as the equilibrium value of the firm under F with managerial own-
ership φ and W Tl(φ, ρ) as the equilibrium value of the firm under hierarchy Tl with
managerial ownership φ and division manager owning ρ of the managerial ownership.
In the next result, we establish a way to compare the efficiency ofF and Tl by showing
58

that the allocations under F is a special case of the allocations under Tl.
Proposition 26 When D owns 100% of the managerial ownership (ρ = 1), all hier-archies perform equally efficiently, i.e.
WF(φ) =W Tl(φ, 1) for l ∈ {1, 2, 3} .
Proposition 26 establishes a important observation that allows us to compare F
and Tl without calculating out their respective values. In the following proposition we
establish our key results:
Proposition 27 (a). The equilibrium firm value increases in the managerial owner-ship, i.e. ∂W Tl(φ, ρ)/∂φ > 0.
(b). The equilibrium firm value increases in the D’s portion of managerial owner-ship, i.e. ∂W Tl(φ, ρ)/∂ρ > 0 and, as a result, F is more efficient than Tl.
While both parts (a) and (b) of Proposition 27 simply reconfirm the intuition that
increased managerial ownership improve efficiency, part (b), combined with Proposi-
tion 26, also implies that divisionalization destroys value.
2.4 Conclusion
This paper extended Chou’s [?] model of FRA to examine the efficiency of different
hierarchy designs. It is shown that flat hierarchies are more efficient in resource al-
location than tall hierarchies because increasing the layer of hierarchies will cause a
additional negative externality in resource allocation and hence aggravate the problem
of FRA. This result suggests that the U-form structure can out-perform the M-form
structure – as opposite to Williamson’s view that the M-form structure prevails be-
cause it is more capable in assigning resource to high-yield uses than the U-form
structure is.
59

3 The Boundaries of the Firms in the Absence of PropertyRights
3.1 Introduction
A vast literature of property right approach to the theory of the firm has been es-
tablished since the seminal papers of Grossman, Hart and Moore (henceforth GHM,
including Grossman and Hart[10] and Hart and Moore[12]). One of the general theme
of this literature is that, when contracts are incomplete, ownership of physical assets
can matter because it can alter the marginal return to investment and hence change the
investors incentive to invest. One obvious and important limitation of this approach
is that it does not apply to human capital intensive firms, such as law, consulting, and
high-tech firms, because human capital is simply inalienable. Therefore, as advocated
by Zingales[36], a new theory of the firm is warranted to deal with the increasingly
important human capital intensive firms. This paper presents a very simple model in
this direction, using the same incomplete-contract methodology of GHM, and shows
how classical questions such as what is a firm? and what determines the boundaries
of the firm? can be answered when there is no physical asset.
What motivates this paper is the following observation of the real world firm: when
people work inside the boundaries of one firm the values of their individual human
capital are usually harder to access for the external labor markets then when people
work as many separated firms. The external labor market can only estimate the value
of each employee’s human capital based on the market’s belief about how much each
60

employee contribute in different components of the firm’s output. This suggests the
boundaries of the firms can serve as information barriers that prevent inside informa-
tion about individual employees from being clearly observed by outside employers.
This observation also naturally leads to the following question: Is this unobservability
of the external labor market a cost or a benefit? We find that both situation can be the
case.
We should use the following example in economics research to help illustrating
the idea. Suppose solving some economic problem requires a model and an empirical
test that can be produced by two economists A (a theorist) and B (a econometrician),
respectively. The total value of solving the problem equals the sum of the values of
the model and the test which are both increasing functions of the investments of both
economists. There are two ways A and B can work on the problem: to publish two
single-author papers separately (one with the model and the other one with the test)
or to publish one joint paper. The former represents the case when two people work
as independent firms and will be refereed as ‘separation.’ The latter represents the
case when two people work inside the boundaries of the firm and will be refereed as
‘integration.’
After the research is done (published), A and B can capitalize their idea by con-
sulting for the government on how to implement the solution. The implementation
requires the human capital of both of the two economist and will not be accomplished
by any single one of them. If A and B agree to consult, the problem is solved and
61
a reward which equals to the sum of the values of the model and the test will be
awarded jointly to A and B by the government. However, if they don’t agree, they
can independently use their respective human capital to teach in a university, which
does not require any agreement between A and B. Assume that after they both made
their investments A and B bargain over the total consulting reward in a 50-50 Nash
bargaining game with their respective teaching rewards as reservation values.
How is GHM approach supposed to work and why can’t it work in our example?
As in all 50-50 Nash bargaining game, the total payoff of a economist is the sum of
the following two parts: (i) his ‘teaching payoff’ (or ‘no-trade payoff’ as generally
referred in the literature) and (ii) 50% of the difference of the total reward for two
of them between consulting and teaching. This implies that any factor that affect the
marginal return in teaching will affect A and B’s marginal returns in consulting, even
though teaching will never be a equilibrium action of A and B, because the bargaining
structure entails teaching payoffs enter (positively) into each economist’s objective
function. The GHM intuition is that if ownership of physical assets, for example
computers, is complementary in teaching to A and B’s investment, then ownership
can induce higher investment. This intuition does not apply to human capital intensive
industries because ownership of physical asset should has very small influence on
investment incentives. Instead, what might matter is the way A and B work with each
other: separation or integration.
If A and B separate, the university can easily identified who did the model and who
62

did the test and hence can attribute the value of the model and test to their respective
producer. On the other hand, if A and B integrate, it is more difficult for the university
to identified who did what and hence A and B will be paid with the estimated value
of their human capitals in teaching based on the university’s belief about each econo-
mist’s contribution to the model and the test. For example if the university believe
that B contribute 20% of the model and 70% of the test, then the value of B’s human
capital equals 20% of the model’s value plus 70% of the test’s value. To reflect the
idea that A and B’s investments are relation-specific investment in consulting, we as-
sume that the university is only willing to pay each economists a portion say 90% of
the estimated value of each economist’s research29.
Recall that the total payoff of a economist is the sum of his teaching payoff and
50% of the difference of total reward for two of them between consulting and teaching.
Since the latter term will be the same no matter A and B separate or integrate, the
difference of incentives between the two cases lies in the first term which equals 90%
of the marginal return of A and B’srespective products if they separate or 90% of a
mixture of the marginal returns of the model and test according to the university’s
belief about each economist’s contribution in the two product if A and B integrate
. For example, if they integrate and the university believe B contribute 20% of the
model and 70% of the test, then B’s marginal return in teaching will be 90 % of the
sum of 20% of the model’s marginal return and 70% of the test’s marginal return.
29 This could be because teaching is a less profitable use of the idea.
63

By assuming that marginal returns are decreasing and marginal costs of invest-
ments are constant, we can compare the equilibrium investment level under separa-
tion and integration by simply comparing each economist’s marginal return in the two
cases. In the example mentioned above, integration will provide better incentive for
B to invest if (100%) of the marginal return of the test is lower than the sum of 20%
of the model’s marginal return plus 70% of the test’s marginal return. Obviously, this
can only be the case when the model’s marginal return from B’s investment is large
enough, i.e. there is a substantial positive externality in B’s investment to the value
of the model. Given that there is always underinvestment due to the hold-up prob-
lem and hence whichever way of publishing gives better investment incentive will be
more efficient, we can see that publishing a joint paper will be more efficient than
publishing two separated papers when there exists substantial externality in A and B’s
investments.
This paper is still a work in progress at this moment with mostly a preliminary
model in section 2. Literature review and conclusion will be added latter.
3.2 Model
A primary project requires the investment a ≥ 0 and b ≥ 0 of two persons A and
B, respectively. The private marginal costs of investments are unity. Given a and
b, the values of A and B’s human capitals worth A (a, b) and B (a, b), respectively
if the project is carried out, with Aa > 0 and Bb > 0. Notice that one person’s
investment will affect the value of the value of the other person’s human capital, i.e.
64

there exists investment externality between A and B. For simplicity, we will focus on
positive investment externality by assuming that Ab > 0 and Ba > 0. Furthermore,
we assume that Aaa < 0, Abb < 0, , Baa < 0, and Bbb < 0.
The primary project is a joint production of A and B in the sense that it requires
both A and B to agree to use their human capital in the project. If they do agree,
the a return which equals A (a, b) + B (a, b) will be paid jointly to A and B. If they
do not agree, each of them can use his human capital independently in a secondary
project. However, the values of A and B’s human capital will be discounted in their
respective secondary project because these secondary projects are less efficient uses of
their human capitals. Denote the values of A and B’s human capitals in the secondary
projects as A (a, b) and B (a, b), respectively, and assume that A = φA and B = φB
where φ ∈ (0, 1). A and B know that it is jointly more profitable form them to
agree on the primary project but need to decide how to split the joint return A (a, b)+
B (a, b). Specifically, we assume that after A and B both made their investments they
bargain over A (a, b) + B (a, b) in a 50-50 Nash bargaining game with their payoffs
in secondary projects as reservation values.
There are two ways for A and B to work (make investment): to separate and work
as two firms or to integrate and work as one firm. The payoffs for A and B in their
secondary projects depend on whether they separate or integrate. Denote α ∈ [0, 1] as
the probability the clients of the secondary projects believe A is actually the owner of
the human capital that is worth A and β ∈ [0, 1] as the probability the clients believe
65

B is actually the owner of the human capital that is worth B. Assume the payoffs
for A and B in their secondary projects equal the clients’ estimations of the worth
of A and B’s human capital. As a result, A and B will receive αA + (1− β)B and
(1− α)A + βB respectively in their secondary projects. As the central idea of the
paper, we distinguish separation with integration by assuming that α = 1 and β = 1
if A and B separate, whereas α < 1 and β < 1 if A and B integrate. This assumption
reflect the idea that when A and B separate their clients can clearly observe the value
of their individual human capitals whereas when A and B integrate their individual
identities are blurred and hence the clients can only make estimation about the value
of A and B’s human capital with potentially small but positive possibility that one of
them is owning the other’s human capital. As a result, the estimated value of one’s
human capital become a mixture of the value of human capitals of everyone in the
firm. Finally, note that separation and integration are two scenario that we wish to
compare. They are not a choice of any player in the model.
We will set our benchmark as the first best investment which is a pair (a∗, b∗) such
that
(a∗, b∗) = argmaxA+B − a− b
or
Aa (a∗, b∗) +Ba (a∗, b∗) = 1
and
Ab (a∗, b∗) +Bb (a∗, b∗) = 1.
66

3.2.1 Separation
When A and B are separated, 50-50 Nash bargaining implies that A will get
A+1
2[A+B − A−B]− a
and B will get
B +1
2[A+B − A−B]− b
In this case, equilibrium investments are aS and bS such that
1
2Aa a
S, bS +Ba aS, bS +Aa a
S, bS −Ba aS, bS = 1
1
2Ab a
S, bS +Bb aS, bS − Ab aS, bS +Bb a
S, bS = 1
The first observation is that there will be underinvestment problem due to the hold-up
problem:
Proposition 28 aS < a∗ and bS < b∗
Proof. Since 12[Aaa +Baa +Aaa −Baa] = 1
2[(1 + φ)Aaa + (1− φ)Baa] < 0,
12[Aa +Ba +Aa −Ba] is decreasing in a. Therefore, aS < a∗ ⇐= Aa − Ba <
Aa +Ba ⇐= φ (Aa −Ba) < Aa +Ba ⇐= (Aa −Ba) < Aa +Ba.3.2.2 Integration
When A and B are integrated, 50-50 Nash bargaining implies that A will get
αA+ (1− β)B +1
2[A+B − A−B]− a
and B will get
(1− α)A+ βB +1
2[A+B − A−B]− b
67
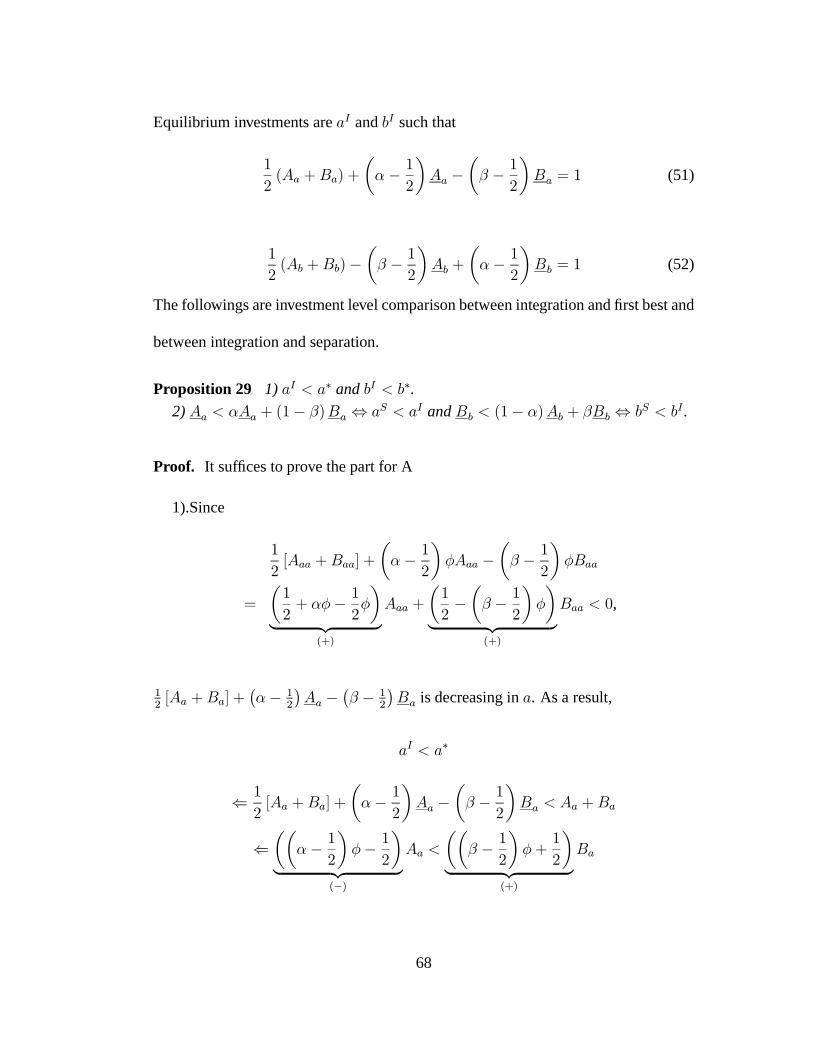
Equilibrium investments are aI and bI such that
1
2(Aa +Ba) + α− 1
2Aa − β − 1
2Ba = 1 (51)
1
2(Ab +Bb)− β − 1
2Ab + α− 1
2Bb = 1 (52)
The followings are investment level comparison between integration and first best and
between integration and separation.
Proposition 29 1) aI < a∗ and bI < b∗.2) Aa < αAa + (1− β)Ba ⇔ aS < aI and Bb < (1− α)Ab + βBb ⇔ bS < bI .
Proof. It suffices to prove the part for A
1).Since
1
2[Aaa +Baa] + α− 1
2φAaa − β − 1
2φBaa
=1
2+ αφ− 1
2φ
(+)
Aaa +1
2− β − 1
2φ
(+)
Baa < 0,
12[Aa +Ba] + α− 1
2Aa − β − 1
2Ba is decreasing in a. As a result,
aI < a∗
⇐ 1
2[Aa +Ba] + α− 1
2Aa − β − 1
2Ba < Aa +Ba
⇐ α− 12
φ− 12
(−)
Aa < β − 12
φ+1
2
(+)
Ba
68

2). Since the marginal returns of a under separation and integration are both de-
creasing functions of a, the comparison of equilibrium investment can be obtain by
comparing the marginal returns of separation and integration.
Many examples can be found in elementary economic textbooks that illustrate the
concept that institutions likes merger exist to internalize externality. The general in-
tuition is that inefficiency arises when two firms operate independently because each
firm will not consider the externality of its action to the other firm and integration of
the two firms achieves efficiency because the owner of the integrated firm will choose
to maximize joint surplus and hence internalize the externality. It is important to note
that the example above works only for physical asset intensive firms because then in-
tegration can change a two-person noncooperative game (two separated firms) into a
one-person decision problem (one integrated firm.) When the two firms are human
capital intensive, as the case that we are interested in this paper, the intuition is less
trivial because under integration there are still two persons making decisions about
their human capitals. The following result reconfirms the intuition:
Corollary 30 Integration is efficient when there exists substantial investment exter-nality.
Proof. When Ab and Ba are big enough such that αAa + (1− β)Ba = αAa > Aa
and (1− α)Ab + βBb = βBb > Bb, we have aI > aS and bI > bS.
The two essential factors at work in the model are hold-up problem and investment
externality. The former causes underinvestment in both separation and integration.
69

The latter, however, can serve as a remedy to the underinvestment problem that is
better utilized by integration. The intuition behind Corollary 30 is that integration
work best when the there is a strong remedy to work with
The following is a partial ordering between separation and integration which fol-
lows directly from Proposition 29:
Corollary 31 If Aa < αAa + (1− β)Ba and Bb < (1− α)Ab + βBb, then inte-gration is efficient. If Aa > αAa + (1− β)Ba and Bb > (1− α)Ab + βBb, thenseparation is efficient.
In the following results, we can characterize the implementable set of investments
and the condition under which the first best can be implemented. By solving the
F.O.C.’s for α and β, we have
α (a, b) =(φ− 1)2φ
+Ab (a, b)−Ba (a, b)
φ (Ab (a, b)Aa (a, b)−Bb (a, b)Ba (a, b))
and
β (a, b) =(φ+ 1)
2φ+
Bb (a, b)− Aa (a, b)φ (Ab (a, b)Aa (a, b)−Bb (a, b)Ba (a, b)) .
Proposition 32 If α (a, b) ∈ [0, 1] and β (a, b) ∈ [0, 1], then a and b are imple-mentable in integration with β (a, b) and α (a, b).
Corollary 33 If α (a∗, b∗) ∈ [0, 1] and β (a∗, b∗) ∈ [0, 1] , then the first best can beimplemented by integration.
3.3 Discussion
It is important to note that the definition of the firm in this paper can be very different
from the existing GHM point of view, in which a firm contains exactly one people:
70

two firms from the GHM point of view that always works together and hence does
not have clearly defined individual image can be considered as one firm in our point
of view.
71

4 Appendix A
Proof of Proposition 1. The CEO’s problem, given the owner’s decision of (S,K),
is to find (S1, S2, k1, k2) such that
(S1, S2, k1, k2) = arg max(S1,S2,k1,k2)
φΦ(k1, k2) + S − S1 − S2 (53)
subject to
S1 + S2 ≤ S,
k1 + k2 ≤ K (54)
Si + b(ki) ≥ uMi for i ∈ {1, 2}. (55)
Since equation (55) will hold as equality in equilibrium, we have a
Si = uMi − b(ki) for i ∈ {1, 2}. (56)
Also, since the CEO does not have incentive to leave any resource not invested in one
of the segments, equation (54) will also holds as equality. By plugging equation (56)
and k2 = K − k1into equation (53), the CEO’s problem becomes to find (S1, S2, k1)
such that
(S1, S2, k1) = arg max(S1,S2,k1)
φΦ(k1,K − k1) + S + b(k1) + b(K − k1)− C2
subject to
S1 + S2 ≤ S,
72
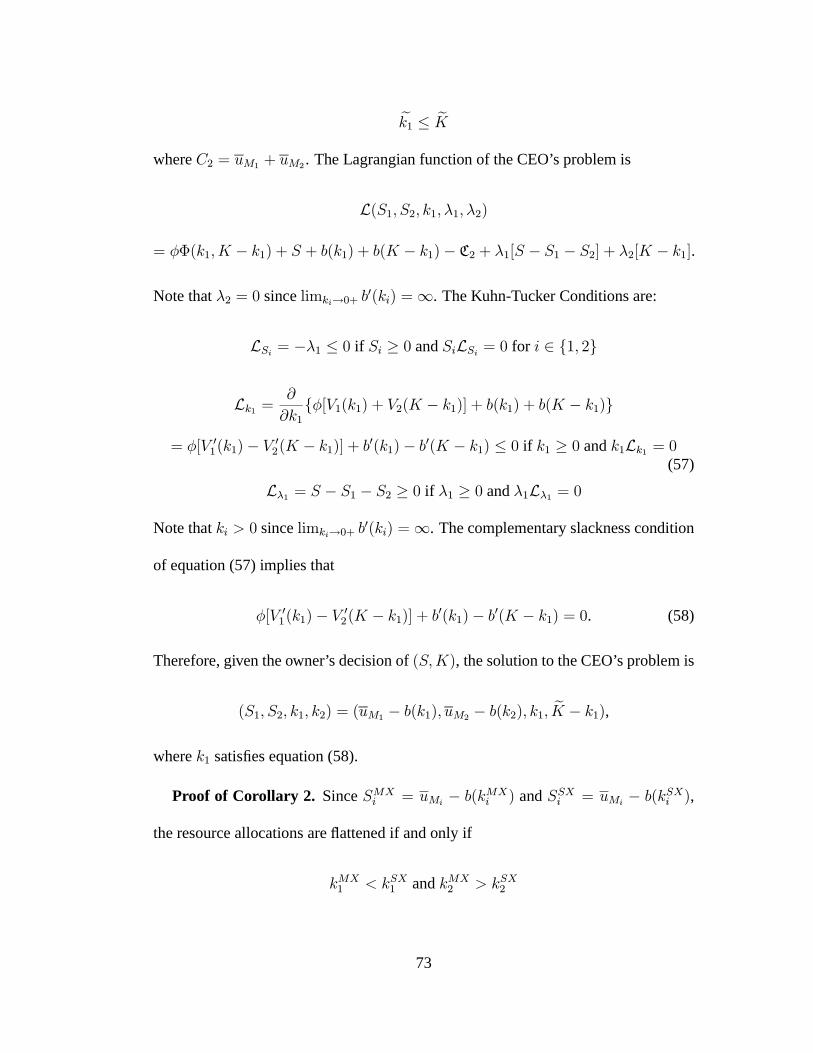
k1 ≤ K
where C2 = uM1 + uM2 . The Lagrangian function of the CEO’s problem is
L(S1, S2, k1,λ1,λ2)
= φΦ(k1, K − k1) + S + b(k1) + b(K − k1)− C2 + λ1[S − S1 − S2] + λ2[K − k1].
Note that λ2 = 0 since limki→0+ b (ki) =∞. The Kuhn-Tucker Conditions are:
LSi = −λ1 ≤ 0 if Si ≥ 0 and SiLSi = 0 for i ∈ {1, 2}
Lk1 =∂
∂k1{φ[V1(k1) + V2(K − k1)] + b(k1) + b(K − k1)}
= φ[V1(k1)− V2(K − k1)] + b (k1)− b (K − k1) ≤ 0 if k1 ≥ 0 and k1Lk1 = 0(57)
Lλ1 = S − S1 − S2 ≥ 0 if λ1 ≥ 0 and λ1Lλ1 = 0
Note that ki > 0 since limki→0+ b (ki) =∞. The complementary slackness condition
of equation (57) implies that
φ[V1(k1)− V2(K − k1)] + b (k1)− b (K − k1) = 0. (58)
Therefore, given the owner’s decision of (S,K), the solution to the CEO’s problem is
(S1, S2, k1, k2) = (uM1 − b(k1), uM2 − b(k2), k1, K − k1),
where k1 satisfies equation (58).
Proof of Corollary 2. Since SMXi = uMi− b(kMXi ) and SSXi = uMi
− b(kSXi ),
the resource allocations are flattened if and only if
kMX1 < kSX1 and kMX2 > kSX2
73

⇔ uM1 − b(kMX1 ) > uM1 − b(kSX1 ) and uM2 − b(kMX2 ) < uM2 − b(kSX2 )
⇔ SMX1 > SSX1 and SMX2 < SSX2 .
Proof of Proposition 3. By applying the implicit-function theorem to equation
(12), we can write kMX2 as a function of φ and kMX1 , i.e. kMX2 := f(φ, kMX1 ). Also,
the following partial derivatives are well-defined and can be obtained by the implicit-
function rule:
∂kMX1
∂φ= − V1(k
MX1 )− V2(kMX2 )
φV1 (kMX1 ) + b (kMX1 )
,
∂kMX2
∂φ=
V1(kMX1 )− V2(kMX2 )
φV2 (kMX2 ) + b (kMX2 )
, and
∂kMX2
∂kMX1
=φV1 (k
MX1 ) + b (kMX1 )
φV2 (kMX2 ) + b (kMX2 )
.
Under the assumptions we made about the function Vi’s and b, these partial derivatives
satisfy
∂kMX1
∂φ> 0,
∂kMX2
∂φ< 0, and 0 <
∂kMX2
∂kMX1
<∞.
Proof of Proposition 4. Since ∂KMX
∂kMX1
= 1 +∂kMX
2
∂kMX1
and 0 < ∂kMX2
∂kMX1
< ∞, we get
1 < ∂KMX
∂kMX1
< ∞, which implies 0 < ∂kMX1
∂KMX < 1. And 0 < ∂kMX2
∂KMX < 1 follows from
the fact that ∂kMX2
∂KMX = 1− ∂kMX1
∂KMX .
Proof of Proposition 5. Proposition 4 implies that there is a one-to-one correspon-
dence between K and k1. So, with the CEO’s problem solved in Proposition 1, the
owner’s problem can be rewritten as finding (S, k1) such that
(S, k1) = arg max(S,k1)
−S + (1− φ)Φ k1, f(φ, k1)
74

subject to
S + φΦ k1, f(φ, k1) + b(k1) + b f(φ, k1) ≥ C1, (59)
where C1 := uC + uM1 + uM2 .30
The Lagrangian function of the owner’s problem is
L(S, k1,λ3)
= −S + (1− φ)Φ [k1, k2(φ, k1)]
+λ3 {S + φΦ [k1, k2(φ, k1)] + b(k1) + b [k2(φ, k1)]− C1} .
The Kuhn-Tucker Conditions are:
LS = −1 + λ1 ≤ 0 if S ≥ 0 and SLS = 0 (60)
Lk1 = (1− φ) V1(k1) + V2 [k2(φ, k1)]∂k2(φ, k1)
∂k1− 1− ∂k2(φ, k1)
∂k1
+λ3{φ V1(k1) + V2 [k2(φ, k1)]∂k2(φ,k1)
∂k1− 1− ∂k2(φ,k1)
∂k1
+b (k1) + b [k2(φ, k1)]∂k2(φ,k1)
∂k1}
≤ 0 if k1 ≥ 0 and k1Lk1 = 0
Lλ3 = S + φΦ [k1, k2(φ, k1)]− C1 ≥ 0 if λ3 ≥ 0 and λ3Lλ3 = 0.
Since S > 0, the complementary slackness condition of equation (60) implies that
λ1 = 1, which in turn implies that equation (59) will hold as equality and
Lk1 = V1(k1)+b (k1)−1+{V2 [k2(φ, k1)] + b [k2(φ, k1)]− 1}∂k2(φ, k1)
∂k1= 0, (61)
30 Note here that we can ignore equation (91) since it is redundant given the condition that uC > 0and equation (49).
75

since we rule out corner solution for k1 by the assumption that limki→0+ b (ki) =∞.
So, the solution of this case is
(SMX , KMX , SMX1 , SMX2 , kMX1 , kMX2 ) =
{uC − φΦ [k1, k2(φ, k1)+] + SMX1 + SMX2 , k1 + k2(φ, k1),
uM1 − b(k1), uM2 − b(k2), k1, k2(φ, k1)},
where k1 satisfies equation (61).
Proof of Proposition 7. One of the following four mutually exclusive cases must
be true: (1) kMX1 ≥ k∗1 and kMX2 ≤ k∗2, (2) kMX1 ≥ k∗1 and kMX2 > k∗2, (3) kMX1 < k∗1
and kMX2 ≤ k∗2, and (4) kMX1 < k∗1 and kMX2 > k∗2. Case (1) is not possible because it
violates the CEO’s decision rule, equation (12) of Proposition 1. Also, cases (3) and
(4) are not possible because they violate the owner’s decision rule, equation (14) of
Proposition 5. Therefore, case (4) must be true, and the wage flattening effect follows
directly from Corollary 2.
Proof of Proposition 9. If equation (15) holds, then, by appealing to equation
(14), kMX1 > k1 and hence kMX2 = f(φ, kMX1 ) > f(φ, k1). Therefore, there is
overinvestment in total resource available to the firm since kMX1 + kMX2 > k∗1 + k∗2.
The proof of the case of underinvestment is symmetric.
76

Proof of Proposition 10.
dW
dφ= V1 k
MX1 (φ) + b kMX1 (φ) − 1 dkMX1 (φ)
dφ
+ V2 f φ, kMX1 (φ) + b f φ, kMX1 (φ) − 1
∗ ∂f φ, kMX1 (φ)
∂φ+
∂f φ, kMX1 (φ)
∂kMX1 (φ)
dkMX1 (φ)
dφ
= { V1 kMX1 (φ) + b kMX1 (φ) − 1
+ V2 f φ, kMX1 (φ) + b f φ, kMX1 (φ) − 1 ∂f φ, kMX1 (φ)
∂kMX1 (φ)}dk
MX1 (φ)
dφ
+ V2 k2(φ, kMX1 ) + b k2(φ, k
MX1 ) − 1 ∂k2(φ, k
MX1 )
∂φ
= V2 k2(φ, kMX1 ) + b k2(φ, k
MX1 ) − 1 ∂k2(φ, k
MX1 )
∂φ(by Proposition 5)
> 0. (since V2 k2(φ, kMX1 ) + b k2(φ, k
MX1 ) − 1 < 0 (by Prop. 4) and
∂k2∂φ
< 0)
Proof of Proposition 11. By solving this special case of the model, we obtain the
following solutions: First, the first-best resource allocation is
k∗1 =d+ b− 12 (c+ a)
+α
2 (c+ a)and k∗2 =
d+ b− 12 (c+ a)
− α
2 (c+ a).
Second, according to the CEO’s decision rule in equation (12), the relation between
kMX1 and kMX2 is
kMX2 = kMX1 − φα
φa+ c(62)
and
∂
∂k1kMX2 = 1,
∂
∂φkMX2 = −α c
(φa+ c)2,∂
∂αkMX2 = − φ
φa+ c(63)
By plugging equation (62) into equation (14) and solving for the decision of the owner,
77
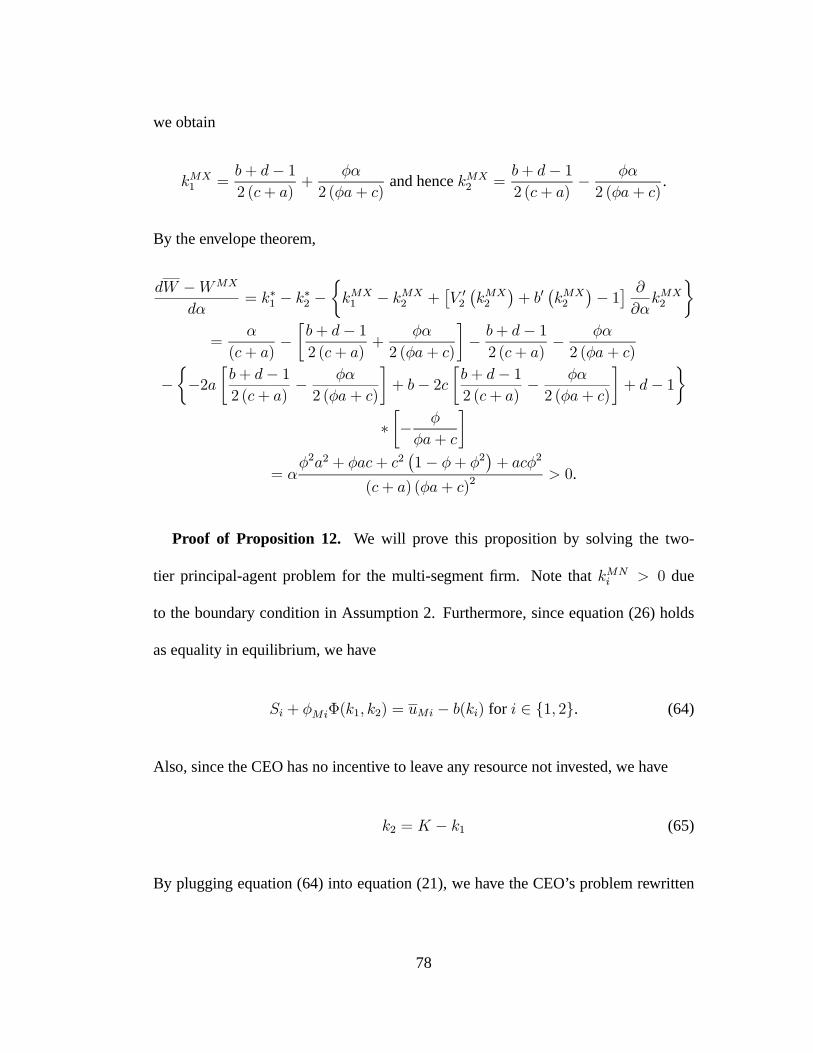
we obtain
kMX1 =b+ d− 12 (c+ a)
+φα
2 (φa+ c)and hence kMX2 =
b+ d− 12 (c+ a)
− φα
2 (φa+ c).
By the envelope theorem,
dW −WMX
dα= k∗1 − k∗2 − kMX1 − kMX2 + V2 kMX2 + b kMX2 − 1 ∂
∂αkMX2
=α
(c+ a)− b+ d− 1
2 (c+ a)+
φα
2 (φa+ c)− b+ d− 12 (c+ a)
− φα
2 (φa+ c)
− −2a b+ d− 12 (c+ a)
− φα
2 (φa+ c)+ b− 2c b+ d− 1
2 (c+ a)− φα
2 (φa+ c)+ d− 1
∗ − φ
φa+ c
= αφ2a2 + φac+ c2 1− φ+ φ2 + acφ2
(c+ a) (φa+ c)2> 0.
Proof of Proposition 12. We will prove this proposition by solving the two-
tier principal-agent problem for the multi-segment firm. Note that kMNi > 0 due
to the boundary condition in Assumption 2. Furthermore, since equation (26) holds
as equality in equilibrium, we have
Si + φMiΦ(k1, k2) = uMi − b(ki) for i ∈ {1, 2}. (64)
Also, since the CEO has no incentive to leave any resource not invested, we have
k2 = K − k1 (65)
By plugging equation (64) into equation (21), we have the CEO’s problem rewritten
78

as, given S, K, and φC ,
(S1,φM1, k1, S2,φM2
, k2)
= arg max(S1,φM1
,k1,S2,φM2,k2)
φCΦ(k1, K − k1) + S + b(k1) + b(K − k1)− C2
subject to
S1 + S2 ≤ S, (66)
φM1+ φM2
≤ φC ,
where C2 = uM1 + uM2 . The Lagrangian function of the CEO’s problem is
L(S1, S2,φM1,φM2
, k1,λ1,λ2)
= φCΦ(k1,K − k1) + S + b(k1) + b(K − k1) + C2
+λ1[S − S1 − S2] + λ2[φC − φM1− φM2
].
The Kuhn-Tucker Conditions are:
LSi = −λ1 ≤ 0 if Si ≥ 0 and SiLSi = 0 for i ∈ {1, 2} (67)
LφM1= −λ2 ≤ 0 if φM1
≥ 0 and φM1LφM1
= 0 for i ∈ {1, 2} (68)
Lk1 = φC [V1(k1)− V2(K − k1)] + b (k1)− b (K − k1) ≤ 0 if k1 ≥ 0 and k1Lk1 = 0
(69)
Lλ1 = S − S1 − S2 ≥ 0 if λ1 ≥ 0 and λ1Lλ1 = 0 (70)
79

Lλ2 = φC − φM1− φM2
≥ 0 if λ2 ≥ 0 and λ2Lλ2 = 0. (71)
We will analyze the following four different possible cases:
Case 1:If λ1 > 0 and λ2 > 0: We can rule out this case by our assumption that
uC > 0 since equation (23) will never hold.
Case 2:If λ1 > 0 and λ2 = 0: In this case, we know that Si = 0 from equation
(67) and hence S = S1 + S2 = 0 from equation (70). Also equation (64) implies that
φM1> 0 (since we assume that uMi
> b(ki)) and hence φC > 0 (since φC > φM1
from equation (71)). Since k1 > 0, then Lk1 = 0 implies that
φC [V1(k1)− V2(K − k1)] + b (k1)− b (K − k1) = 0
or
φC [V1(k1)− V2(k2)] + b (k1)− b (k2) = 0. (72)
By the implicit-function theorem, we can rewrite the relation among k1, k2, and φC
as
k2 := g (φC , k1) (73)
As shown in Proposition 5, for any given φC , there exists a one-to-one correspondence
between k1 and K. Therefore, we can rewrite the owner’s problem as
(k1,φC) = arg max(k1,φC)
(1− φC)Φ(k1, g φC , k1 ) (74)
subject to
φC ≤ 1
80

φC ≥uM1 − b(k1)
Φ(k1, g φC , k1 )+uM2 − b(g φC , k1 )
Φ(k1, g φC , k1 )(75)
φCΦ(k1, g φC , k1 ) + b(k1) + b(g φC , k1 ≥ C1, (76)
where C1 = uC + uM1 + uM2 . Note that, with the assumption that uC > 0, equation
(75) is redundant because it will never bind given the existence of equation (76). So,
the Lagrangian function of the owner’s problem is
L(k1,φC ,λ1,λ2) = (1−φC)Φ(k1, g)+λ3[1−φC ]+λ4[φCΦ(k1, g)+b(k1)+b(g)−C1].
The Kuhn-Tucker Conditions are:
Lk1 = (1−φC)∂
∂k1Φ+λ4[φC
∂
∂k1Φ+b (k1)+b (g)
∂
∂k1g] ≤ 0 if k1 ≥ 0 and k1Lk1 = 0.
(77)
LφC = −Φ+ (1− φC)[V2(g)− 1]∂g
∂φC− λ3
+λ4{Φ+ φC [V2(g)− 1]∂g
∂φC+ b (g)
∂g
∂φC} (78)
≤ 0 if φC ≥ 0 and φCLφC = 0. (79)
Lλ3 = 1− φC ≥ 0 if λ3 ≥ 0 and λ3Lλ3 = 0. (80)
Lλ4 = φCΦ(k1, g) + b(k1) + b(g)− C1 ≥ 0 if λ4 ≥ 0 and λ4Lλ4 = 0.
Case 2.1: When Condition 1 fails (λ4 > 0):
81

Since k1 > 0, the complementary slackness condition in equation (77) implies
that
(1− φC)∂
∂k1Φ+ λ4[φC
∂
∂k1Φ+ b (k1) + b (g)
∂
∂k1g] = 0 (82)
Note that
∂
∂k1Φ+ b (k1) + b (g)
∂
∂k1g = 0 (83)
since another way of solving the problem is to plug φCΦ(k1, g ) + b(k1) + b(g) = C1
into the objective function of the owner’s problem, equation (74), and equation (83)
follows from the first-order condition. Comparing equations (82) and (83) gives us
that
λ4 = 1.
Plugging this into equation (79) we have
LφC = [V2(g) + b (g)− 1]∂g
∂φC− λ3 = 0.
This, in turn, implies that λ3 > 0 since [V2(g) + b (g) − 1] < 0 from Proposition 7
and ∂g∂φC
=V1(k
MN1 )−V2(g)
φV2 (g)+b (g)< 0. Therefore, we know that equation (22) will bind and
hence φC = 1.
Case 2.2: When Condition 1 fails (λ4 = 0):
Since φC > 0, then the complementary slackness condition in equation (79) im-
plies that
1− Φ+ λ3
[V2(g)− 1] ∂g∂φC
= φC ⇔
82

φC =[V2(g)− 1]V1(k1)− (Φ+ λ3) b (g)
[V2(g)− 1]V1(k1) + (Φ+ λ3)V2 (g). (84)
If λ3 > 0, then φC = 1 (from equation (80)), which contradict with equation (84).
Therefore λ3 = 0. When Condition 2 also holds, i.e.
[V2(g)− 1]V1(k1)− Φb (g) < 0, (85)
we know that
[V2(g)− 1]V1(k1) + ΦV2 (g) < 0 because (86)
[V2(g)− 1]V1(k1) + ΦV2 (g) < [V2(g)− 1]V1(k1)− Φb (g) (87)
(Recall that b (g) and V2 (g) are both negative.). Equations (85), (86), and (87) imply
that 1 > φC > 0. Therefore, equation (84) is an interior solution.
Also, in this case, equation (77) becomes
Lk1 = V1(k1) + V2(g)∂
∂k1g − 1− ∂
∂k1g ≤ 0 if k1 ≥ 0 and k1Lk1 = 0.
If k1 > 0, then
V1(k1) + V2(g(k1))∂g
∂k1− 1− ∂g
∂k1= 0 (88)
So the solution will be
(S,K,φC , S1, S2,φM1,φM2
, k1)
= (0, k1 + g,[V2(g)− 1]V1(k1)− Φb (g)
[V2(g)− 1]V1(k1) + ΦV2 (g), 0, 0,
uM1 − b(k1)Φ(k1, g)
,uM2 − b (g)Φ (k1, g)
, k1),
where k1 satisfies equation (88).
83

As of when Condition 2 fails, i.e.
[V2(g)− 1]V1(k1)− Φb (g) ≥ 0,
if [V2(g)−1]V1(k1)+ΦV2 (g) < 0, then.φC ≤ 0; else if [V2(g)−1]V1(k1)+ΦV2 (g) ≥
0, then φC > 1. Therefore, λ4 = 0 cannot be the case when Condition 2 fails.
Note that Condition 1 is only consistent with the cases when S = 0 because oth-
erwise the owner can always gain from reducing S a infinitesimal amount without
violating the CEO’s participation constraint. Therefore, the following two cases are
associated with the failure of Condition 1.
Case 3:If λ1 = 0 and λ2 > 0: In this case, we know that φM1= 0 from equation
(68) and hence φC = φM1+ φM2
= 0 from equation (71). Also equation (64) implies
that Si > 0 (since we assume that uMi> b(ki)) and hence SC > 0 (since SC > Si
from equation (70)). Since the CEO has no incentive at all (φC = 0) to allocate
the resource to increase segmental productivity, he will just split equally whatever
he get from the owner to each segment managers, i.e. kMN1 = kMN2 . However, this
case cannot be a equilibrium because the owner can always gain by substituting some
of the cash paid to the CEO with shares that has the same value, resulting in better
resource allocations (according to Proposition 10) and hence higher firm value without
breaking the participation constraint.
Case 4:If λ1 = 0 and λ2 = 0, the solution of k1 will be the same as in case 2. The
84
Lagrangian function of the owner’s problem is
L(S, k1,φC ,λ1,λ2) = −S + (1− φC)Φ(k1, k2) + λ5[1− φC ]
+λ6[φCΦ(k1, g) + S + b(k1) + b(g)− C1].
The Kuhn-Tucker Conditions are:
LS = −1 + λ6 ≤ 0 if S ≥ 0 and SLS = 0. (89)
Lk1 = (1−φC)∂
∂k1Φ+λ6[φC
∂
∂k1Φ+b (k1)+b (g)
∂
∂k2k2] ≤ 0 if k1 ≥ 0 and k1Lk1 = 0.
(90)
LφC = −Φ+ (1− φC)[V2(k2)− 1]∂k2∂φC
− λ5
+λ6{Φ+ φC [V2(k2)− 1]∂k2∂φC
+ b (k2)∂k2∂φC
}
≤ 0 if φC ≥ 0 and φCLφC = 0.
Lλ5 = 1− φC ≥ 0 if λ5 ≥ 0 and λ5Lλ5 = 0.
Lλ6 = φCΦ(k1, g) + S + b(k1) + b(g)− C1 ≥ 0 if λ6 ≥ 0 and λ6Lλ6 = 0.
Since S > 0, equation (89) implies that λ6 = 1. However, for the same reason as in
case 2.1, φC = 1.
To sum up, when conditions 1 and 2 hold (as in case 2.2), 0 < φC < 1 and the
solution is as stated above, otherwise (as in case 2.1 or 4), φC = 1.
Proof of Proposition 16. (a) The proof is similar to the one of Proposition 7. The
only difference is when managerial ownership is endogenous the owner’s decision
85

rule change from equation (14) to (31). The listed three cases are the the ones that are
consistent with the CEO’s and the owner’s first order conditions.
(b) For each segment i, we know
Vi kSNi + b kSNi − kSNi = Vi (k
∗i ) + b (k
∗i )− k∗i >
Vi k−i + b k−i − k−i > Vi k
−i − k−i > Vi kMNi − kMNi .
So
2
i=1
Vi kSNi + b kSNi − kSNi >
2
i=1
Vi kMNi − kMNi .
Proof of Proposition 17. The proof is similar to the one for Proposition 9.
Proof of Proposition 19. By plugging equation (62) into equation (31) and solving
for the decision of the owner, we obtain
kMN1 =b− 12a
+φα
2 (φa+ c)and hence kMN2 =
b− 12a− φα
2 (φa+ c).
By envelop theorem, we have
dW −WMX
dα= k∗1 − k∗2 − kMN1 − kMN2 + V2 kMN2 − 1 ∂
∂αkMN2
=1
2αφ2a2 + φac+ φac− φ2ac+ 2c2 − 2φc2
(c+ a) (φa+ c)2> 0.
86

5 Appendix B
Proof of Lemma 20. With (33) and (35) binding under Assumption 5 and (34) bind-
ing naturally, the three first-order conditions follow directly.
Proof of Lemma 21. With (36), (39) and (42) binding under Assumption 5 and
(38) and (41) binding naturally, the three first-order conditions follow directly.
Proof of Proposition 22. By applying the implicit-function rule to (46), we have
∂km∂kn
=ρφVn (kn) + b (kn)
ρφVm(km) + b (km)> 0,
and also that
∂km∂ρ
= −φ [Vm(km)− Vn(kn)]ρφVm(km) + b (km)
> 0 and∂kn∂ρ
=φ [Vm(km)− Vn(kn)]ρφVn (kn) + b (kn)
< 0.
∂km∂φ
= −ρ [Vm(km)− Vn(kn)]ρφVm(km) + b (km)
> 0 and∂kn∂φ
=ρ [Vm(km)− Vn(kn)]ρφVn (kn) + b (kn)
< 0.
Again By applying the implicit-function rule to (47), we have
∂kn∂kl
=[φVl (kl) + b (kl)]
∂km∂kn
+ 1
∂∂knMBC
(91)
Also, under (49), we have, via (91),
∂kn∂kl
> 0 and hence∂km∂kl
=∂kn∂kl
∂km∂kn
> 0.
Proof of Proposition 23. First, K = kl + kD implies
∂K
∂kl= 1 +
∂kD∂kl
(92)
. Second,
0 <∂kD∂kl
=∂kn∂kl
+∂kn∂kl
∂km∂kn
<∞. (93)
87

Third, (92) and (93) implies that 1 < ∂K∂kl< ∞, which in turn implies 0 < ∂kl
∂K< 1.
Finally, 0 < ∂kD∂K
< 1 follows from that fact that ∂kD∂K
= 1− ∂kl∂K
. This proves the first
two inequalities. The last two inequality can be proved by the same procedure applied
to kD = km + kn.
We need the following lemma for the proof of Proposition 24.
Lemma 34 Inside the division, the resource allocated to the more profitable segmentis always greater than the resource allocated to the less profitable segment, i.e. km >kn.
Proof of Lemma 34. It follows directly from (46) since by definition n > m.
Proof of Proposition 24. The following are the eight possible cases:
Case 1: k1 < k∗1, k2 < k∗2, and k3 < k∗3: This cases is impossible because (48) will
not hold since ∂km∂kl
> 0 and ∂kn∂kl> 0 under Assumption 6.
Case 2: k1 ≥ k∗1, k2 ≥ k∗2, and k3 ≥ k∗3: This cases is impossible for the same
reason as in Case 1.
Case 3: k1 < k∗1, k2 < k∗2, and k3 ≥ k∗3: It is possible that all the I.C. constraints
are satisfied.
Case 4: k1 < k∗1, k2 ≥ k∗2, and k3 ≥ k∗3: It is possible that all the I.C. constraints
are satisfied.
Case 5: k1 < k∗1, k2 ≥ k∗2, and k3 < k∗3: This cases is impossible for F because
V2 (k2) + b (k2) < 1 and V3 (k3) + b (k3) ≥ 1 implies V2 (k2)− V3 (k3) + b (k2) −
b (k3) < 0 which implies φ [V2 (k2)− V3 (k3)] + b (k2) − b (k3) < 0 which violate
88
equations (77) and (44). T1 can not be the case because (46) will be violated. T2 can
not be the case for the following reason: First,
ρφ [V1 (k1)− V3 (k3)] + [b (k1)− b (k3)] = 0 ((46)) and 1 ≥ ρ
imply that
φ [V1 (k1)− V3 (k3)] + [b (k1)− b (k3)] > 0. (94)
Second, V2 (k2) + b (k2) < 1 and V3 (k3) + b (k3) ≥ 1 imply [V3 (k3)− V2 (k2)] +
[b (k3)− b (k2)] > 0 and hence
φ [V3 (k3)− V2 (k2)] + [b (k3)− b (k2)] > 0, (95)
since k3 < k2. Third, equations (94) and (95) imply that
φ [V1 (k1)− V2 (k2)] + [b (k1)− b (k2)] > 0. (96)
Finally, equations (94) and (96) imply that
{φ [V1 (k1)− V2 (k2)] + [b (k1)− b (k2)]}∂k1∂k3
+φ [V3 (k3)− V2 (k2)] + [b (k3)− b (k2)] > 0,
which violates (47). Only under T3, it is possible that all the I.C. constraints are
satisfied.
Case 6: k1 ≥ k∗1, k2 < k∗2, and k3 ≥ k∗3: This cases is impossible for F because
V1 (k1) + b (k1) < 1 and V2 (k2) + b (k2) ≥ 1 implies V1 (k1)− V2 (k2) + b (k1) −
b (k2) < 0 which implies φ [V1 (k1)− V2 (k2)] + b (k1) − b (k2) < 0 which violate
equations (77) and (44). T3 can not be the case because (46) will be violated. T2 can
89

not be the case for the following reason: First,
ρφ [V1 (k1)− V3 (k3)] + [b (k1)− b (k3)] = 0 ((46)) and 1 ≥ ρ
imply that
φ [V1 (k1)− V3 (k3)] + [b (k1)− b (k3)] > 0.
Second, V1 (k2) + b (k2) ≥ 1 and V1 (k1) + b (k1) < 1 imply [V1 (k1)− V2 (k2)] +
[b (k1)− b (k2)] < 0 and hence
φ [V1 (k1)− V2 (k2)] + [b (k1)− b (k2)] < 0.
since k2 < k1. Third, equations (94) and (95) imply that
φ [V3 (k1)− V2 (k2)] + [b (k3)− b (k2)] < 0.
Finally, equations (94) and (96) imply that
{φ [V1 (k1)− V2 (k2)] + [b (k1)− b (k2)]}∂k1∂k3
+φ [V3 (k3)− V2 (k2)] + [b (k3)− b (k2)] < 0,
which violates (47). Only under T1, it is possible that all the I.C. constraints are
satisfied.
Case 7: k1 ≥ k∗1, k2 < k∗2, and k3 < k∗3: This cases is impossible for F because
V1 (k1) + b (k1) < 1 and V3 (k3) + b (k3) ≥ 1 implies V1 (k1)− V3 (k3) + b (k1) −
b (k3) < 0 which implies φ [V1 (k1)− V3 (k3)] + b (k1) − b (k3) < 0 which violate
equations (77) and (44). It can not be T3 or T2 because (46) will be violated. It can not
be T1 because V1 (k1) + b (k1) < 1, V1 (k2) + b (k2) ≥ 1 and V3 (k3) + b (k3) ≥ 1
90

imply
[V2 (k2)− V1 (k1)] + [b (k2)− b (k1)] > 0 and hence (since k1 > k2)
φ [V2 (k2)− V1 (k1)] + [b (k2)− b (k1)] > 0;
[V3 (k3)− V1 (k1)] + [b (k3)− b (k1)] > 0 and hence (since k1 > k3)
φ [V3 (k3)− V1 (k1)] + [b (k3)− b (k1)] > 0,
which imply
{φ [V2 (k2)− V1 (k1)] + [b (k2)− b (k1)]}∂k1∂k3
+φ [V3 (k3)− V1 (k1)] + [b (k3)− b (k1)] > 0,
which violates (47).
Case 8: k1 ≥ k∗1, k2 ≥ k∗2, and k3 < k∗3: This cases is impossible for F because
V1 (k1) + b (k1) < 1 and V3 (k3) + b (k3) ≥ 1 implies V1 (k1)− V3 (k3) + b (k1) −
b (k3) < 0 which implies φ [V1 (k1)− V3 (k3)] + b (k1)− b (k3) < 0 which violates
equations (77) and (44). It can not be T1 or T2 because (46) will be violated. It can not
be T3 because V1 (k1) + b (k1) < 1, V1 (k2) + b (k2) < 1 and V3 (k3) + b (k3) ≥ 1
imply
[V1 (k1)− V3 (k3)] + [b (k1)− b (k3)] < 0
and hence φ [V1 (k1)− V3 (k3)] + [b (k1)− b (k3)] < 0;
[V2 (k2)− V3 (k3)] + [b (k2)− b (k3)] < 0
and hence φ [V2 (k2)− V3 (k3)] + [b (k2)− b (k3)] < 0,
91

which imply
{φ [V1 (k1)− V3 (k3)] + [b (k1)− b (k3)]}∂k1∂k3
+φ [V2 (k2)− V3 (k3)] + [b (k2)− b (k3)] < 0,
which violates (47).
To sum up, only under T3 can case 5 (segment 3 is underinvested) be possible, and
only under T1 can case 6 (segment 1 is overinvested) be possible. This concludes the
proof.
Proof of Proposition 25. (a) The result directly follows from Proposition 23.
(b) T1: Suppose not, then V1 (k1) + b (k1) ≥ 1 and V2 (k2) + b (k2) < 1 implies
that
[V2 (k2)− V1 (k1)] + b (k2)− b (k1) < 0
which in turn implies there exist φ such that
φ [V2 (k2)− V1 (k1)] + b (k2)− b (k1) < 0 for φ > φ. (97)
Also,
ρφ [V2(k2)− V3(k3)] + b (k2)− b (k3) = 0
implies that
φV2(k2) + b (k2) > φV3(k3) + b (k3). (98)
Combining (97) and (98) obtains
∂k2∂k3
[φV2 (k2)− φV1 (k1) + b (k2)− b (k1)]
+φV3 (k3)− φV1 (k1) + b (k3)− b (k1) < 0
92

which violates (47).
The proof for T3 is symmetric.
Proof of Proposition 26. For F ,
φ [V2(k2)− V1(k1)] + b (k2)− b (k1) = 0
φ [V3(k3)− V1(k1)] + b (k3)− b (k1) = 0
When ρ = 1. For Tl, we have
φ [Vm(km)− Vn(kn)] + b (km)− b (kn) = 0 and (99)
φ Vm (km)∂km∂kn
+ Vn (kn)− Vl (kl)∂km∂kn
+ 1 (100)
+b (km)∂km∂kn
+ b (kn)− b (kl) ∂km∂kn
+ 1 = 0
Equations (99) and (100) implies
φ [Vl (kl)− Vn(kn)] + b (kl)− b (kn) = 0.
In both cases,
φV1(k1) + b (k1) = φV2(k2) + b (k2) = φV3(k3) + b (k3),
i.e. the relationship between k1, k2, and k3 are the same. This implies that O’s aggre-
gate investment will also be the same. ThereforeWF =W Tl when ρ = 1.
Proof of Proposition 27. (a). For T1, lets write k2 as a function of k3 and then k3
93

as a function of k1. As a result,
∂W T1(φ, ρ)∂φ
= [V2 (k2) + b (k2)− 1]∂k2∂φ
+∂k2∂k3
∂k3∂φ
+∂k2∂k3
∂k3∂k1
∂k1∂φ
+ [V3 (k3) + b (k3)− 1]∂k3∂φ
+∂k3∂k1
∂k1∂φ
+ [V1 (k1) + b (k1)− 1]∂k1∂φ
= [V2 (k2) + b (k2)− 1]∂k2∂φ
+∂k2∂k3
∂k3∂φ
+ [V3 (k3) + b (k3)− 1]∂k3∂φ
(by the envelop theorem)
= [V3 (k3) + b (k3)− 1]∂k3∂φ
(since∂k2∂φ
+∂k2∂k3
∂k3∂φ
= 0)
> 0 (since V3 (k3) + b (k3)− 1 > 0 and∂k3∂φ
< 0).
The proof for T2 and T3 is similar with appropriate rewriting the relationship between
k1, k2, and k3.
(b). The proof for ∂W Tl(φ, ρ)/∂ρ > 0 is the same as the case of (a). F is more
efficient than Tl follows from ∂W Tl(φ, ρ)/∂ρ > 0 and Proposition 26.
94

6 References
[1] A. W. Beggs, Queues and Hierarchies, Review of Economic Studies, 68 2001,297-322.
[2] R. Antel and G. Eppen, Capital Rationing and Organizational Slack in CapitalBudgeting, Management Science 31 1985, 163-174.
[3] P. Berger and E. Ofek, Diversification’s effect on firm value, Journal of FinancialEconomics, 37 1995, 39-65.
[4] A. Bernardo, H. Cai and J. Luo, Capital Budgeting Compensation with Asym-metric Information and Moral Hazard, Journal of Financial Economics, 61 2001,311-344.
[5] R. Bliss and R. Rosen, CEO Compensation and Bank Mergers, Journal of Finan-cial Economics, 61 2001, 107-138.
[6] P. Bolton and M. Dewatripont, The Firm as a Communication Network, QuarterlyJournal of Economics, 109 (4) 1994, 809-839.
[7] P. Bolton and D. Scharfstein, Corporate Finance, the Theory of the Firm, andOrganization, Journal of Economic Perspectives, 12 1998, 95-114.
[8] M. Buble, Transition Processes of Organizational Structures in Large Enterprises,Management, 1 (1), 1996, 1-16.
[9] G. Calvo and S. Wellisz, Supervision, Loss of Control and the Optimal Size ofthe Firm, Journal of Political Economy, 86 1978, 943-952.
[10] S. Grossman and O. Hart, The Costs and Benefits of Ownership: A Theory ofVertical and Lateral Integration, Journal of Political Economy, 94 1986, 691-719.
[11] M. Hammer and J. Champy, Reengineering the Corporation, New York: HarperCollins, 1993.
[12] O. Hart and J. Moore, Property Rights and the Nature of the Firm, Journal ofPolitical Economy, 98 1990, 1119-58.
[13] O. Hart and J. Moore, On the Design of Hierarchies: Coordination and Special-ization, NEBR working paper 7388, 1999.
95

[14] O. Hart and J. Moore, Default and Renegotiation: A Dynamic Model of Debt,Quarterly Journal of Economics, 113 1998, 1-41.
[15] M. Harris and A. Raviv, The Capital Budgeting Process: Incentives and Informa-tion, Journal of Finance, 51 (4) 1996, 1139-1174.
[16] M. Harris and A. Raviv, Capital Budgeting and Delegation, Journal of FinancialEconomics, 50 1998, 259-289.
[17] R. Inderst and H. Müller, Project Bundling, Liquidity Spillovers, and Capital Mar-ket Discipline, Discussion Paper, University of Mannheim, 2000.
[18] R. Inderst, H. Müller, and K. Wärneryd, Influence Costs and Hierarchy, Discus-sion Paper, University of Mannheim, 2000.
[19] M. Jensen and W. Mercklin, Theory of the Firm: Managerial Behavior, AgencyCosts, and Ownership Structure, Journal of Financial Economics, 3 1979, 305-360.
[20] L. Lang and R. Stulz, Tobin’s q, Corporation Diversification, and Firm Perfor-mance, Journal of Political Economy, 102 1994, 1248-1280.
[21] E. Maskin, Y. Quian, and C. Xu, Incentives, Information, and OrganizationalForm, Review of Economic Studies, 67 2000, 359-378.
[22] J. A. Mirrless, The Optimal Structure of Incentives and Authority within an Or-ganization, Bell Journal of Economics, 7 1976, 105-131.
[23] R. Morck, A. Shleifer, and R. Vishny, Do Managerial Objectives Drives Bad Ac-quisitions?, Journal of Finance, 45 1990, 31-48.
[24] R. Rajan, H. Servaes, and L. Zingales, The Cost of Diversity: The DiversificationDiscount and Inefficient Investment, Journal of Finance, 55 (1) 2000, 35-80.
[25] R. Rajan and L. Zingales, The Firm as a Dedicated: A theory of the Origins andGrowth of Firms, Quarterly Journal of Economics, 116 (3) 2001, 805-851.
[26] D. Scharfstein, The Dark Side of the Internal Capital market II: Evidence fromDiversified Conglomerate, NEBR working paper 6352, 1998.
[27] D. Scharfstein and J. Stein, The Dark Side of the internal capital market: Di-visional rent seeking and inefficient investment, Journal of Finance, 55 2000,2537-64.
96

[28] H. Shin and R. Stulz, Are the internal capital market Efficient?, Quarterly Journalof Economics 113 1998, 531-553.
[29] J. Stein, the Internal Capital Market and the Competition for Corporate Resources,Journal of Finance, 52 1997, 111-134.
[30] L. Stole and J. Zwiebel, Organizational Design and Technology Choice underIntrafirm Bargaining, American Economic Review, 86 (1) 1996, 195-222.
[31] R. Stulz, Managerial Discretion and Optimal Financing Policies, Journal of Fi-nancial Economics, 26 1991, 3-27.
[32] T. Whited, Is It Inefficient Investment that Causes the Diversification Discount?,Journal of Finance, forthcoming.
[33] O. Williamson, Markets and Hierarchies: Analysis and Antitrust Implications,New York: Free Press, 1975.
[34] J. Wulf, Influence and Inefficiency in the Internal Capital Market: Theory andEvidence, Working Paper, University of Pennsylvania, 2000.
[35] O. Williamson, Hierarchical Control and Optimal Firm Size, Journal of PoliticalEconomy, 75 (2) 1967, 123-138.
[36] L. Zingales, In Search of New Foundations, Journal of Finance, 55 2000, 1623-53.
97