united states world agricultural service...
TRANSCRIPT
United States Department of Agriculture Foreign
Agricultural Service Circular Series WAP 12-15 December 2015
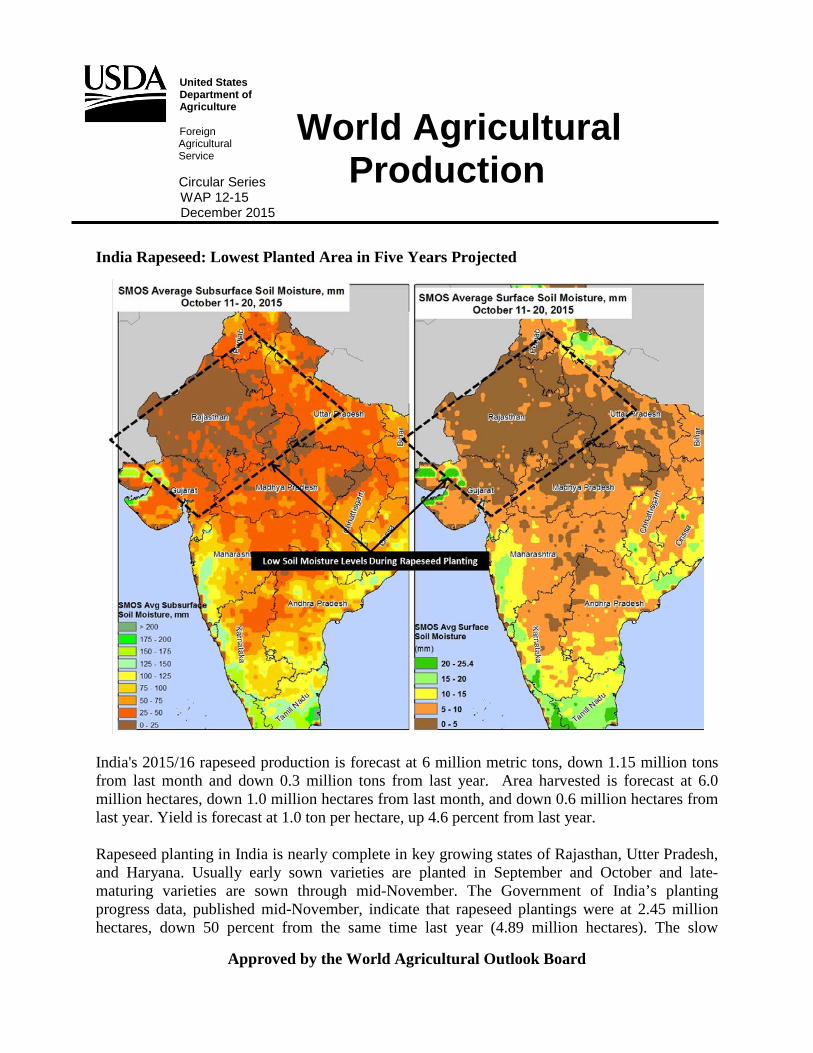
India Rapeseed: Lowest Planted Area in Five Years Projected
India's 2015/16 rapeseed production is forecast at 6 million metric tons, down 1.15 million tons from last month and down 0.3 million tons from last year. Area harvested is forecast at 6.0 million hectares, down 1.0 million hectares from last month, and down 0.6 million hectares from last year. Yield is forecast at 1.0 ton per hectare, up 4.6 percent from last year. Rapeseed planting in India is nearly complete in key growing states of Rajasthan, Utter Pradesh, and Haryana. Usually early sown varieties are planted in September and October and late-maturing varieties are sown through mid-November. The Government of India’s planting progress data, published mid-November, indicate that rapeseed plantings were at 2.45 million hectares, down 50 percent from the same time last year (4.89 million hectares). The slow
World Agricultural Production
Approved by the World Agricultural Outlook Board
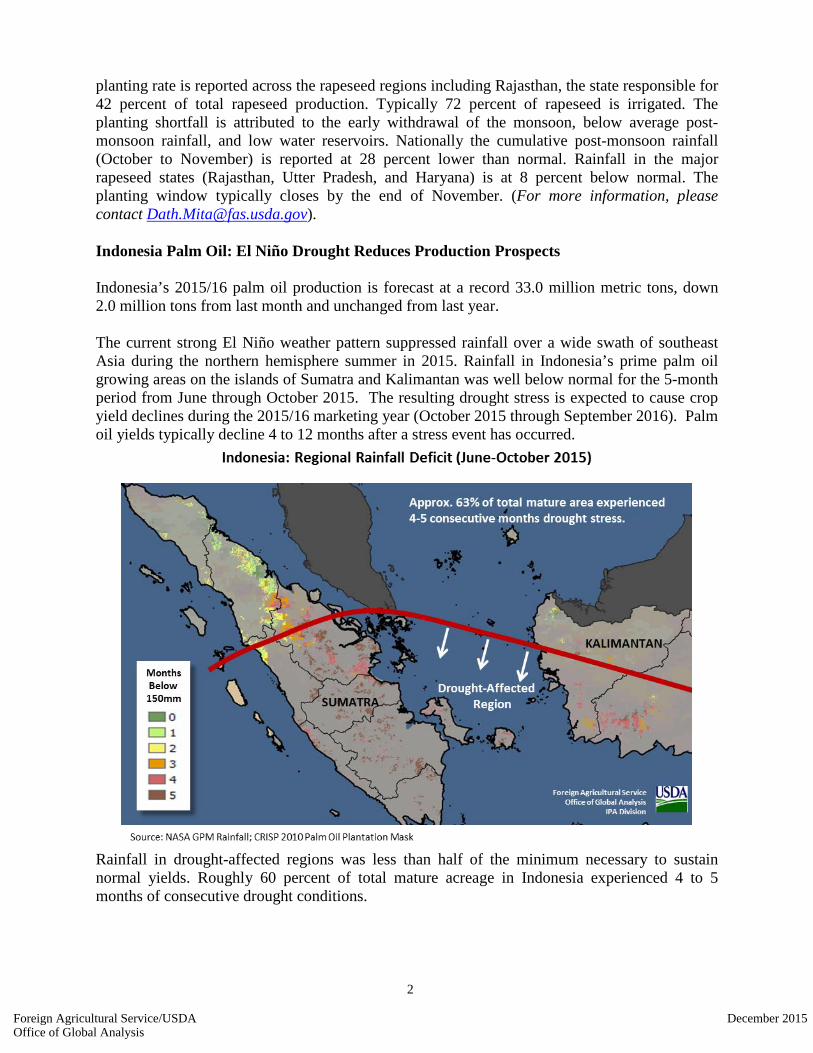
planting rate is reported across the rapeseed regions including Rajasthan, the state responsible for 42 percent of total rapeseed production. Typically 72 percent of rapeseed is irrigated. The planting shortfall is attributed to the early withdrawal of the monsoon, below average post-monsoon rainfall, and low water reservoirs. Nationally the cumulative post-monsoon rainfall (October to November) is reported at 28 percent lower than normal. Rainfall in the major rapeseed states (Rajasthan, Utter Pradesh, and Haryana) is at 8 percent below normal. The planting window typically closes by the end of November. (For more information, please contact [email protected]). Indonesia Palm Oil: El Niño Drought Reduces Production Prospects Indonesia’s 2015/16 palm oil production is forecast at a record 33.0 million metric tons, down 2.0 million tons from last month and unchanged from last year. The current strong El Niño weather pattern suppressed rainfall over a wide swath of southeast Asia during the northern hemisphere summer in 2015. Rainfall in Indonesia’s prime palm oil growing areas on the islands of Sumatra and Kalimantan was well below normal for the 5-month period from June through October 2015. The resulting drought stress is expected to cause crop yield declines during the 2015/16 marketing year (October 2015 through September 2016). Palm oil yields typically decline 4 to 12 months after a stress event has occurred.
Rainfall in drought-affected regions was less than half of the minimum necessary to sustain normal yields. Roughly 60 percent of total mature acreage in Indonesia experienced 4 to 5 months of consecutive drought conditions.
2
Foreign Agricultural Service/USDA December 2015Office of Global Analysis

Approximately 50 percent of total palm oil area is sown with trees that are less than 10 years old. These trees are reportedly more resilient to drought than those cultivated a decade or two ago, and are expected to experience less severe yield declines in 2015/16 than occurred in 1997/98. The last strong El Niño occurred in 1997/98 resulting in approximately 20 percent reduction in yields. It should also be noted that the current drought intensity in 2015 is much less severe than at the same point in 1997. Indonesian oil palm trees, therefore, have experienced less severe moisture stress than in 1997. (For more information, please contact [email protected]). Malaysia Palm Oil: El Niño Drought Forecast to Have Modest Production Impact USDA forecasts 2015/16 palm oil production in Malaysia at a record 20.5 million metric tons, down 0.5 million tons from last month, but up 0.6 million tons from last year. Malaysia’s decrease in production is less severe than in Indonesia. The current strong El Niño weather pattern suppressed rainfall over a wide swath of Southeast Asia during the northern hemisphere summer in 2015. Rainfall in Malaysia’s prime palm oil growing areas was below normal for the 5-month period from June through October 2015. The resulting drought stress is expected to cause crop yield declines during the current 2015/16 marketing year (October 2015 through September 2016). Palm oil yields typically decline 4 to 12 months after a stress event has occurred. Similarly to Indonesia, rainfall in Malaysia’s drought affected regions was less-than-half of the minimum necessary to sustain normal yields, as well. Roughly 51 percent of total mature acreage in Malaysia experienced 4 to 5 consecutive months of drought conditions, though the severity of drought was considerably less than that occurring in Indonesia. Approximately 25 percent of total palm oil area is sown with trees that are less than 10 years old. Trees that are planted more recently tend to be more resilient to drought than those cultivated a decade or two ago, and are expected to experience less severe yield declines in 2015/16 than occurred in 1997/98. It should also be noted that the current drought intensity in 2015 is much less severe than at the same point in 1997. Malaysian oil palm trees, therefore, have experienced less severe moisture stress than in 1997, and yield declines are expected to be less severe. Palm oil yields declined approximately 12 percent in 1997/98 as a result of El Niño-induced drought. (For more information, please contact [email protected]). India Rice: Early Harvest Returns Indicate Reduced Productivity India's 2015/16 rice production is forecast at 100 million metric tons, down 3.5 million tons from last month and down 4.8 million tons from last year. Area is forecast at 43 million hectares, the same as last year. Paddy yield is forecast at 3.49 tons per hectare, down 4.6 percent from last year. The kharif rice harvest is almost complete in the northwest major growing states and the harvest is in progress in the east and northeastern states. Approximately 85 percent of India’s rice is grown during kharif season (southwest monsoon season, May through September) mainly in Punjab, Haryana, Utter Pradesh, and Bihar states. The rest of the rice crop is grown under
3
Foreign Agricultural Service/USDA December 2015Office of Global Analysis

irrigation during the rabi season (winter season, November through March). It is estimated that 50 percent of kharif rice is irrigated using canals and tube wells and almost all of the rabi rice is irrigated. A significant number of regions in the major rice growing states, especially in Northeast India (Utter Pradesh, and Bihar), experienced prolonged spells of drought during critical reproductive stages, leading to lower than expected yields. In September, the rice crop in the northern states of Utter Pradesh, Bihar, West Bengal, and Assam entered critical reproductive stages under relatively poor conditions due to water deficits. At the end of September, rainfall in major rice growing regions was lower-than-normal, resulting in drier-than-normal crop conditions. Early kharif rice harvest reports indicate below normal yields across the rice growing regions, especially in Northeast India. USDA yield simulation models indicate reduced yield prospects compared to the previous year. The rabi season rice planting is in progress. The rabi crop is predominantly grown in the southeastern states of West Bengal, Andhra Pradesh, Orissa, Karnataka, Assam, and Tamil Nadu. The early withdraw of the monsoon, and lower water reservoirs have resulted in slow sowing rate. According to the Government of India’s planting progress reports in mid-November, rabi rice plantings were at a record low, 53 percent less than the same period last year. The post-monsoon cumulative rainfall (October through November) is reported at 28 percent lower-than-normal country wide and 60 percent below normal in the major rabi rice growing states in the east and northeast. (For more information contact [email protected]). China Cotton: Area and Yield Revised Downward China’s 2015/16 cotton production is estimated at 24.3 million bales (5.3 million tons), down 0.7 million bales from last month and down 5.7 million bales from last year. Area is estimated at a record-low 3.45 million hectares, down 0.05 million hectares from last month and down 0.95 million hectares from last year. Yield is estimated at 1,534 kilograms per hectare, down slightly from last month but up 3.5 percent from last year.
4
Foreign Agricultural Service/USDA December 2015Office of Global Analysis

The area reduction in 2015/16 is related to recent changes in China’s cotton support policy that were intended to deal with the country’s massive stocks that had accumulated over several years. The new support policy resulted in lower profits and greater economic uncertainty for cotton farmers, who responded by shifting from cotton to other crops such as corn and rice, which offered higher returns. The largest area reductions took place in provinces located in the Yellow and Yangtze River regions of eastern China. Chinese government agencies and cotton industry groups have reported area reductions of 30 to 50 percent in these areas. Although the subsidies offered to farmers in Xinjiang province were similar to last year, lower market prices and other factors led to a reduction in planted area in Xinjiang as well. More than 75 percent of China’s cotton is now produced in Xinjiang, where a favorable climate, high levels of mechanization, and fewer pest and disease problems result in the country’s highest cotton yields. (For more information, please contact [email protected]). Australia Cotton: Dryland Area Increases
USDA forecasts Australia’s 2015/16 cotton crop at 2.4 million bales, up 0.3 million bales from last month, and up 0.1 million bales from last year. Harvested area is forecast at 285,000 hectares, up 60,000 hectares from last month, and up 80,000 hectares from last year. Yield is forecast at 1,833 kilograms per hectare. The higher planted area is attributed to an increase in dryland cotton plantings. For 2015/16 dryland area is expected to be 100,000 hectares; this will be the first
time in three years that a significant area has been planted to dryland cotton. Dryland cotton planting tends to be more opportunistic and varies with seasonal weather forecast, planting conditions, and prices at sowing. Above-average rainfall during October and November has resulted in increased dryland planting. Irrigated cotton area is forecast to increase to 185,000 hectares, reflecting an increase in reservoir levels to last season’s levels. Irrigated cotton area produces on average about 90 percent of Australia’s total cotton production. Yields are substantially higher than dryland yields and the difference widens in low rainfall years. (For more information, please contact [email protected]). Pakistan Cotton: Early Market Arrivals Indicate Significantly Lower Yields USDA forecasts Pakistan's 2015/16 cotton production at 8.0 million 480-pound bales, down 1.0 million bales from last month and down 2.6 million bales from last year. Harvested area is estimated at 2.8 million hectares, down 0.05 million hectares from last month, and down 0.15
5
Foreign Agricultural Service/USDA December 2015Office of Global Analysis

million hectares from last year. Yield is estimated at 622 kilograms per hectare, down 9.5 percent from last month, and down 20.4 percent from last year. Harvest is almost complete in most regions as farmers prepare for wheat planting. According to the Pakistan Cotton Ginner’s Association (PCGA), cumulative market arrivals through November are significantly lower compared to the same period last year. PCGA December 3rd report indicated arrivals were down country wide 28 percent, with Punjab down approximately 40 percent and Sindh down approximately 3 percent. About 80 percent of the total Pakistan cotton crop is produced in Punjab province. The major factor contributing to the low productivity is the unprecedented infestation of white-fly and cotton leaf curl virus resulting in significant crop damage. The damage was worse than usual due to inadequate pest chemical control practices as farmers attempted to minimize production costs. In recent years farmers have faced increased prices of agricultural chemicals and relatively lower cotton prices. In addition, yield prospects are low due to the fact that farmers are cutting down the number of cotton pickings in order to plant wheat early and take advantage of relatively profitable wheat prices. (For more information, please contact [email protected]). Australia Wheat: Production Estimate Unchanged USDA estimates 2015/16 Australia wheat production at 26.0 million tons, unchanged from last month and up 2.3 million tons from last year. Area is forecast at 13.8 million hectares, unchanged from last month and from last year. Yield is forecast at 1.88 tons per hectare which is 3.0 percent below the 5-year average of 1.93 tons per hectare. Generally favorable growing conditions from May (when sowing begins) until August were followed by dryness from mid-September through mid-October. The lower rainfall and above average temperatures stressed the wheat crop as it entered heading and grain fill stages, thus lowering yield expectations in southern New South Wales and parts of Western Australia. In Victoria, these conditions have affected the entire state, but particularly the Wimmera and Mallee regions where soil moisture reserves are low. As of mid-December wheat harvest is about half complete. Harvesting starts in central Queensland during August and progresses down the east coast to Victoria, finishing during January. On the west coast, the wheat harvest extends from October through January. (For more information, please contact [email protected]). India Soybean: Low Record Yields Significantly Reduce Production USDA estimates 2015/16 India soybean production at 8 million metric tons, down 1.5 million tons from last month, and down 0.7 million tons from last year. The decrease is attributed to continued reports of deteriorating yield prospects. Harvested area is estimated at 11.65 million hectares, same as last month, up 6.8 percent from last year, and the second largest on record. Yield is estimated at 0.69 tons per hectare, down 16.3 percent from last month, down 14 percent from last year, and is the lowest in 10 years. India’s soybeans are grown exclusively during the kharif season (southwest monsoon season, June through September) under rainfed conditions. Most of the soybean crop is grown in northwestern and central India where the main producing states are Madhya Pradesh (53
6
Foreign Agricultural Service/USDA December 2015Office of Global Analysis

percent), Maharashtra (34 percent), and Rajasthan (8 percent). The optimum planting period is typically the third week of June to the second week of July. The majority of 2015/16 crop was planted during this period. The 2015/16 soybean season started favorably with timely arrival of the monsoon rainfall. Overall, all major soybean growing areas received abundant June rainfall that resulted in the second largest planting area and favorable plant establishment. Most regions in Maharashtra and Rajasthan received below average rainfall in July and August, but during the same period most areas in Madhya Pradesh received above average rainfall. Low rainfall in some areas and above-average rainfall in others resulted in similar outcomes: below average yield. Overall yield is estimated at a 10-year record low. Harvest is almost complete. (For more information contact [email protected]). South Africa Corn: Planting Delayed due to Drought South Africa’s 2015/16 corn production is forecast at 12.0 million tons, down 0.75 million tons from last month but up 1.2 million tons from last year. Harvested area is forecast at 3.0 million hectares, unchanged from last month and slightly down from last year. Yield is forecast at 4.0 tons per hectare, up 13 percent from last year’s yield of 3.54 tons per hectare and near the 5-year average yield of 4.02 tons per hectare.
Sparse rainfall during October and November has delayed corn planting in South Africa. Planting has been delayed by 40 days or more in the eastern corn belt of KwaZulu-Natal, Mpumalanga, and eastern Free State provinces. Planting in the eastern corn belt typically begins in early October, after sufficient rainfall has been received. Satellite imagery from Landsat-8, and the MODIS Terra and Aqua satellites, however, indicates that very little vegetation has emerged by early December, confirming that planting progress and plant emergence is greatly behind schedule. Dryness in South Africa is often associated with a strong El Niño. During the past 33 years, strong to very strong El Niño conditions occurred in 1982/83, 1992/93, and 1997/98, and corn yields were correspondingly reduced from trend yields by 17 to 61 percent. (For more information, please contact [email protected]).
7
Foreign Agricultural Service/USDA December 2015Office of Global Analysis

World Agricultural Production U.S. Department of Agriculture
Foreign Agricultural Service / Office of Global Analysis International Production Assessment Division (IPAD / PECAD)
Ag Box 1051, Room 4630, South Building Washington, DC 20250-1051
http://www.pecad.fas.usda.gov/ Telephone: (202) 720-1156 Fax: (202) 720-1158
This report uses information from the Foreign Agricultural Service’s (FAS) global network of agricultural attachés and counselors, official statistics of foreign governments and other foreign source materials, and the analysis of economic data and satellite imagery. Estimates of foreign area, yield, and production are from the International Production Assessment Division, FAS, and are reviewed by USDA’s Inter-Agency Commodity Estimates Committee. Estimates of U.S. area, yield, and production are from USDA’s National Agricultural Statistics Service. Numbers within the report may not add to totals because of rounding. This report reflects official USDA estimates released in the World Agricultural Supply and Demand Estimates (WASDE-548), December 10, 2015. Printed copies are available from the National Technical Information Service. Download an order form at http://www.ntis.gov/products/specialty/usda/fas_a-g.asp, or call NTIS at 1-800-363-2068. The FAS International Production Assessment Division prepared this report. The next issue of World Agricultural Production will be released after 12:00 p.m. Eastern Time, January 12, 2016.
Conversion Table
Metric tons to bushels
Wheat, soybeans = MT * 36.7437 Corn, sorghum, rye = MT * 39.36825 Barley = MT * 45.929625 Oats = MT * 68.894438
Metric tons to 480-lb bales
Cotton = MT * 4.592917
Metric tons to hundredweight
Rice = MT * 22.04622
Area & weight
1 hectare = 2.471044 acres 1 kilogram = 2.204622 pounds
8
Foreign Agricultural Service/USDA December 2015Office of Global Analysis

For further information, contact: U.S. Department of Agriculture Foreign Agricultural Service
Office of Global Analysis International Production Assessment Division
Ag Box 1051, Room 4630, South Building Washington, DC 20250-1051
Telephone: (202) 720-1156 Fax: (202) 720-1158
GENERAL INFORMATION Director Ronald Frantz 202-720-4056 [email protected] Deputy Director Robert Tetrault 202-720-1071 [email protected] USDA Remote Sensing Advisor Glenn Bethel 202-720-1280 [email protected] Sr. Analyst/Satellite Imagery Curt Reynolds, PhD 202-690-0134 [email protected] Archives Manager/Technical Lead Sr. Analyst/ Technical Lead Dath Mita, PhD 202-720-7339 [email protected] Sr. Analyst/ Global Special Jim Crutchfield 202-690-0135 [email protected] Projects Manager/Technical Lead Sr. Analyst/Technical Lead Vacant GIS Analyst/WAP Coordinator Justin Jenkins 202-720-0419 [email protected] COUNTRY- AND REGION-SPECIFIC INFORMATION South América, Argentina and Colombia Denise McWilliams, PhD 202-720-0107 [email protected] Western and Central Europe Bryan Purcell 202-690-0138 [email protected] and North Africa Russia, Kazakhstan, Ukraine Mark Lindeman 202-690-0143 [email protected] and other FSU-12 countries
Canada, Caribbean, Sri Lanka Arnella Trent 202-720-0881 [email protected] and Bangladesh
East Asia, China, and Japan Paulette Sandene 202-690-0133 [email protected] India, Pakistan, and Nepal Dath Mita, PhD 202-720-7339 [email protected] Sub-Saharan Africa, Mexico, Curt Reynolds, PhD 202-690-0134 [email protected] Nigeria and South Africa S.E. Asia, Indonesia, Thailand, Malaysia, Michael Shean 202-720-7366 [email protected] Cambodia, and Vietnam Brazil, Venezuela, Central America, Vacant Australia, New Zealand, Jim Crutchfield 202-690-0135 [email protected] Papua New Guinea and South Pacific Islands Middle East, Afghanistan, Iraq, Bill Baker, PhD 202-260-8109 [email protected] Iran, Syria Western United States Justin Jenkins 202-720-0419 [email protected] Eastern United States Vacant
Foreign Agricultural Service/USDA December 2015Office of Global Analysis

The Foreign Agricultural Service (FAS) updates its production, supply and distribution (PSD) database for cotton, oilseeds, and grains at 12:00 p.m. on the day the World Agricultural Supply and Demand Estimates
(WASDE) report is released. This circular is released by 12:15 p.m.
FAS Reports and Databases:
Current World Market and Trade and World Agricultural Production Reports: http://apps.fas.usda.gov/psdonline/psdDataPublications.aspx
Archives World Market and Trade and World Agricultural Production Reports: http://usda.mannlib.cornell.edu/MannUsda/viewTaxonomy.do?taxonomyID=7
Production, Supply and Distribution Database (PSD Online): http://apps.fas.usda.gov/psdonline/psdHome.aspx
EU Countries Area & Production Estimates http://apps.fas.usda.gov/psdonline/psdDownload.aspx
Global Agricultural Trade System (U.S. Exports and Imports): http://apps.fas.usda.gov/gats/default.aspx
Export Sales Report: http://apps.fas.usda.gov/esrquery/
Global Agricultural Information Network (Agricultural Attaché Reports): http://gain.fas.usda.gov/Pages/Default.aspx
Other USDA Reports: World Agricultural Supply and Demand Estimates (WASDE):
http://www.usda.gov/oce/commodity/wasde/ Economic Research Service: http://www.ers.usda.gov/topics/crops
National Agricultural Statistics Service: http://www.nass.usda.gov/Publications/
Foreign Agricultural Service/USDA December 2015Office of Global Analysis

Million Metric Tons
Table 01 World Crop Production Summary
World
-
Total
Foreign
North
America
North
America
North
America
Former
Soviet
Former
Soviet
Asia
(WAP)
Asia
(WAP)
Asia
(WAP)
Asia
(WAP)
Asia
(WAP)
South
America
South
America
Selected
Other
Selected
Other
Selected
Other
All
Others
none
-
none
-
United
States
Mexico
-
Canada
-
Russia
-
Ukraine
-
China
-
India
-
Indo-
nesia
Paki-
stan
Thai-
land
Argen-
tina
Brazil
-
Aus-
tralia
Turkey
-
none
-
none
-
South
Africa
Commodity
---Million metric tons---
Wheat
2013/14 240.718.81.925.35.310.50.024.00.093.5121.922.352.13.437.558.1657.2715.3
2014/15 prel. 246.515.31.823.76.012.50.025.50.095.9126.224.859.13.729.455.1670.2725.3
2015/16 proj.
Nov 252.419.51.526.06.010.50.025.00.088.9130.027.060.53.826.055.8677.1733.0
Dec 252.719.51.526.06.010.50.025.00.088.9130.027.060.53.827.655.8679.1734.9
Coarse Grains
2013/14 330.513.115.512.282.635.75.05.69.143.2225.139.935.732.028.7367.1913.91,281.0
2014/15 prel. 348.79.511.311.787.633.54.95.68.842.0222.139.340.432.422.0377.2919.71,297.0
2015/16 proj.
Nov 324.514.113.412.884.134.14.85.79.640.1231.532.839.031.323.7368.2901.41,269.6
Dec 324.014.112.612.784.133.54.85.79.639.1231.532.839.031.325.7368.2900.41,268.6
Rice, Milled
2013/14 148.40.50.00.68.31.020.56.736.3106.6142.50.10.60.10.06.1472.3478.4
2014/15 prel. 149.00.50.00.58.51.018.86.935.8104.8144.60.00.70.20.07.1471.1478.2
2015/16 proj.
Nov 148.10.50.00.58.00.916.46.936.3103.5145.50.00.70.10.06.1467.4473.5
Dec 147.60.50.00.28.00.916.46.936.3100.0145.50.00.70.10.06.1463.3469.3
Total Grains
2013/14 719.732.317.438.196.247.225.436.345.4243.4489.562.388.435.566.3431.32,043.42,474.7
2014/15 prel. 744.225.213.035.8102.147.023.638.044.6242.6492.964.1100.136.351.4439.42,061.02,500.5
2015/16 proj.
Nov 725.034.114.939.298.145.521.237.645.9232.5507.059.9100.235.249.7430.12,046.02,476.0
Dec 724.434.114.238.998.144.921.237.645.9228.0507.059.9100.235.253.3430.12,042.82,472.8
Oilseeds
2013/14 81.82.51.95.890.056.90.64.611.536.858.916.713.60.924.099.0406.4505.4
2014/15 prel. 84.62.61.84.399.266.10.55.112.133.657.716.313.01.222.5116.0420.5536.6
2015/16 proj.
Nov 82.12.22.14.0102.861.30.64.312.534.854.416.313.21.021.5117.7413.2531.0
Dec 82.02.22.14.0102.861.30.63.912.132.054.116.513.31.023.5117.7411.3529.0
Cotton
2013/14 17.62.30.04.18.01.20.09.50.031.032.80.00.00.90.012.9107.5120.4
2014/15 prel. 17.63.20.12.37.01.10.010.60.029.530.00.00.01.40.016.3102.8119.1
2015/16 proj.
Nov 16.42.80.12.16.51.00.09.00.028.525.00.00.01.00.013.392.3105.6
Dec 16.32.70.12.46.51.00.08.00.028.524.30.00.01.00.013.090.7103.7
1/ Includes wheat, coarse grains, and rice (milled) shown above.
Foreign Agricultural Service/USDA December 2015Office of Global Analysis

Table 02 Wheat Area, Yield, and Production
From last month From last year
MMTPercent
Yield
(Metric tons per hectare)
Dec 2013/14 MMT
Country / Region
Area
(Million hectares)
Production
(Million metric tons)
Change in Production
2013/14
Prel.
2014/15 Nov Nov
Prel.
2014/15 Dec
Prel.
2014/15 Nov Dec Percent
2015/16 Proj.2015/16 Proj. 2015/16 Proj.
2013/14
219.88World 1.329.590.271.95734.93222.42 224.82 224.81 3.25 3.26 3.26 3.27 715.26 725.34 732.98
18.35United States 1.260.690.000.0055.8418.77 19.06 19.06 3.17 2.94 2.93 2.93 58.11 55.15 55.84
201.53Total Foreign 1.338.900.291.95679.09203.65 205.76 205.75 3.26 3.29 3.29 3.30 657.16 670.20 677.14
none
25.88European Union 0.731.140.250.39157.6626.79 26.70 26.69 5.59 5.84 5.89 5.91 144.58 156.53 157.27
24.12China 3.003.790.000.00130.0024.07 24.15 24.15 5.06 5.24 5.38 5.38 121.93 126.21 130.00
South Asia
30.00 India -7.21-6.910.000.0088.9430.47 30.60 30.60 3.12 3.15 2.91 2.91 93.51 95.85 88.94
8.64 Pakistan -1.96-0.500.000.0025.009.10 9.10 9.10 2.78 2.80 2.75 2.75 24.00 25.50 25.00
2.55 Afghanistan -0.50-0.030.000.005.002.56 2.55 2.55 1.96 1.96 1.96 1.96 5.00 5.03 5.00
0.77 Nepal -5.26-0.100.000.001.800.77 0.77 0.77 2.48 2.47 2.34 2.34 1.90 1.90 1.80
Former Soviet Union - 12
23.40 Russia 2.401.420.000.0060.5023.64 25.50 25.50 2.23 2.50 2.37 2.37 52.09 59.08 60.50
6.57 Ukraine 9.092.250.000.0027.006.30 7.00 7.00 3.39 3.93 3.86 3.86 22.28 24.75 27.00
12.95 Kazakhstan 7.731.000.000.0014.0011.92 11.50 11.50 1.08 1.09 1.22 1.22 13.94 13.00 14.00
1.40 Uzbekistan 0.700.050.000.007.201.40 1.40 1.40 4.86 5.11 5.14 5.14 6.80 7.15 7.20
0.69 Belarus -17.24-0.500.000.002.400.73 0.70 0.70 3.06 4.00 3.43 3.43 2.10 2.90 2.40
10.44Canada -6.19-1.826.151.6027.609.48 9.60 9.60 3.59 3.10 2.71 2.88 37.53 29.42 26.00
South America
3.50 Argentina -16.00-2.000.000.0010.504.20 3.50 3.50 3.00 2.98 3.00 3.00 10.50 12.50 10.50
2.20 Brazil 0.000.000.000.006.002.73 2.45 2.45 2.41 2.20 2.45 2.45 5.30 6.00 6.00
0.50 Uruguay 57.410.62-2.30-0.041.700.40 0.49 0.48 3.30 2.70 3.59 3.54 1.65 1.08 1.74
12.63Australia 9.862.330.000.0026.0013.81 13.80 13.80 2.00 1.71 1.88 1.88 25.30 23.67 26.00
Africa
1.35 Egypt -2.41-0.200.000.008.101.35 1.26 1.26 6.11 6.15 6.43 6.43 8.25 8.30 8.10
3.28 Morocco 56.862.900.000.008.003.06 3.20 3.20 2.13 1.67 2.50 2.50 7.00 5.10 8.00
1.75 Ethiopia -11.36-0.500.000.003.901.80 1.80 1.80 2.43 2.44 2.17 2.17 4.25 4.40 3.90
2.00 Algeria 42.110.800.000.002.701.70 2.10 2.10 1.65 1.12 1.29 1.29 3.30 1.90 2.70
Middle East
7.70 Turkey 27.874.250.000.0019.507.71 7.86 7.86 2.44 1.98 2.48 2.48 18.75 15.25 19.50
6.40 Iran 7.691.000.000.0014.006.80 6.80 6.80 2.27 1.91 2.06 2.06 14.50 13.00 14.00
2.57 Iraq -5.71-0.200.000.003.302.46 2.45 2.45 1.29 1.42 1.35 1.35 3.30 3.50 3.30
1.55 Syria 40.001.000.000.003.501.30 1.45 1.45 2.58 1.92 2.41 2.41 4.00 2.50 3.50
0.64Mexico 2.520.090.000.003.780.71 0.82 0.82 5.29 5.21 4.59 4.59 3.38 3.69 3.78
8.06Others -4.54-1.000.000.0021.018.40 8.22 8.22 2.73 2.62 2.56 2.56 22.01 22.01 21.01
World and Selected Countries and Regions
Foreign Agricultural Service/USDA December 2015Office of Global Analysis

Table 03 Total Coarse Grain Area, Yield, and Production
From last month From last year
MMTPercent
Yield
(Metric tons per hectare)
Dec 2013/14 MMT
Country / Region
Area
(Million hectares)
Production
(Million metric tons)
Change in Production
2013/14
Prel.
2014/15 Nov Nov
Prel.
2014/15 Dec
Prel.
2014/15 Nov Dec Percent
2015/16 Proj.2015/16 Proj. 2015/16 Proj.
2013/14
321.81World -2.19-28.40-0.08-1.001,268.56322.45 321.92 321.51 3.98 4.02 3.94 3.95 1,281.02 1,296.97 1,269.56
39.81United States -2.41-9.080.000.00368.1637.77 37.66 37.66 9.22 9.99 9.78 9.78 367.09 377.23 368.16
282.00Total Foreign -2.10-19.33-0.11-1.00900.41284.68 284.26 283.85 3.24 3.23 3.17 3.17 913.93 919.73 901.41
none
38.38China 4.219.350.000.00231.5039.12 39.83 39.83 5.86 5.68 5.81 5.81 225.07 222.15 231.50
31.39European Union -11.85-20.21-0.02-0.03150.4330.76 30.42 30.46 5.06 5.55 4.95 4.94 158.92 170.64 150.46
South America
16.81 Brazil -4.02-3.520.000.0084.0816.75 16.78 16.78 4.91 5.23 5.01 5.01 82.60 87.60 84.08
5.93 Argentina -0.21-0.07-1.76-0.6033.465.17 5.43 5.30 6.01 6.48 6.27 6.31 35.67 33.53 34.06
Former Soviet Union - 12
15.49 Russia -3.43-1.390.000.0039.0016.73 16.10 16.10 2.31 2.41 2.42 2.42 35.74 40.39 39.00
8.78 Ukraine -16.57-6.520.000.0032.838.44 7.44 7.44 4.55 4.66 4.41 4.41 39.92 39.35 32.83
2.26 Kazakhstan 1.470.050.000.003.442.31 2.39 2.39 1.55 1.47 1.44 1.44 3.51 3.39 3.44
1.23 Belarus -5.66-0.240.000.004.001.21 1.22 1.22 3.10 3.50 3.29 3.29 3.79 4.24 4.00
Africa
13.25 Nigeria -5.60-1.070.000.0017.9513.65 13.10 13.10 1.46 1.39 1.37 1.37 19.29 19.02 17.95
3.28 South Africa 11.911.34-5.61-0.7512.623.25 3.22 3.22 4.73 3.47 4.15 3.92 15.52 11.28 13.37
5.17 Tanzania 8.080.500.000.006.695.25 5.25 5.25 1.26 1.18 1.27 1.27 6.51 6.19 6.69
4.08 Burkina 4.800.210.000.004.503.85 3.85 3.85 1.11 1.12 1.17 1.17 4.54 4.29 4.50
6.16 Ethiopia -7.12-0.950.000.0012.405.89 5.84 5.84 2.35 2.27 2.12 2.12 14.47 13.35 12.40
0.94 Egypt 0.590.040.000.006.860.97 0.97 0.97 7.10 7.04 7.05 7.05 6.66 6.82 6.86
3.02 Mali -2.22-0.100.000.004.403.20 3.20 3.20 1.15 1.41 1.38 1.38 3.48 4.50 4.40
25.24India -6.84-2.87-2.49-1.0039.1024.38 24.98 24.80 1.71 1.72 1.61 1.58 43.22 41.97 40.10
Southeast Asia
3.12 Indonesia 9.090.800.000.009.602.94 3.14 3.14 2.92 2.99 3.06 3.06 9.10 8.80 9.60
2.58 Philippines 1.680.130.000.007.802.56 2.60 2.60 2.91 3.00 3.00 3.00 7.53 7.67 7.80
1.18 Vietnam 13.210.700.000.006.001.25 1.30 1.30 4.40 4.24 4.62 4.62 5.19 5.30 6.00
1.15 Thailand -2.06-0.100.000.004.761.13 1.12 1.12 4.31 4.30 4.25 4.25 4.96 4.86 4.76
9.39Mexico -3.29-1.070.000.0031.339.31 9.08 9.08 3.41 3.48 3.45 3.45 32.02 32.39 31.33
5.40Canada 16.683.678.421.9925.664.44 4.91 4.87 5.33 4.95 4.82 5.27 28.75 21.99 23.67
5.19Australia 8.791.02-0.78-0.1012.685.31 5.64 5.64 2.34 2.19 2.27 2.25 12.16 11.65 12.78
Middle East
4.24 Turkey 48.554.600.000.0014.084.28 4.35 4.35 3.08 2.21 3.24 3.24 13.08 9.48 14.08
2.07 Iran 1.740.100.000.005.862.01 2.04 2.04 2.59 2.87 2.88 2.88 5.36 5.76 5.86
66.31Others -3.62-3.74-0.51-0.5199.4070.53 70.08 69.98 1.46 1.46 1.43 1.42 96.90 103.14 99.91
World and Selected Countries and Regions; Coarse Grain includes: Barley, Corn, Millet, Mixed Grains, Oats, Rye and Sorghum
Foreign Agricultural Service/USDA December 2015Office of Global Analysis

Table 04 Corn Area, Yield, and Production
From last month From last year
MMTPercent
Yield
(Metric tons per hectare)
Dec 2013/14 MMT
Country / Region
Area
(Million hectares)
Production
(Million metric tons)
Change in Production
2013/14
Prel.
2014/15 Nov Nov
Prel.
2014/15 Dec
Prel.
2014/15 Nov Dec Percent
2015/16 Proj.2015/16 Proj. 2015/16 Proj.
2013/14
181.16World -3.47-34.96-0.10-1.00973.87178.67 177.46 177.28 5.47 5.65 5.49 5.49 991.44 1,008.82 974.87
35.39United States -3.95-14.280.000.00346.8233.64 32.64 32.64 9.93 10.73 10.62 10.62 351.27 361.09 346.82
145.77Total Foreign -3.19-20.68-0.16-1.00627.05145.02 144.81 144.63 4.39 4.47 4.34 4.34 640.17 647.73 628.05
none
36.32China 4.349.350.000.00225.0037.12 37.85 37.85 6.02 5.81 5.94 5.94 218.49 215.65 225.00
South America
15.80 Brazil -4.12-3.500.000.0081.5015.75 15.80 15.80 5.06 5.40 5.16 5.16 80.00 85.00 81.50
3.40 Argentina -3.40-0.900.000.0025.603.20 3.20 3.20 7.65 8.28 8.00 8.00 26.00 26.50 25.60
0.32 Bolivia 0.690.010.000.000.730.32 0.32 0.32 2.30 2.30 2.31 2.31 0.73 0.73 0.73
9.66European Union -23.80-18.040.000.0057.759.53 9.27 9.29 6.69 7.95 6.23 6.22 64.64 75.79 57.75
Africa
3.08 South Africa 11.111.20-5.88-0.7512.003.05 3.00 3.00 4.85 3.54 4.25 4.00 14.93 10.80 12.75
4.25 Nigeria -6.85-0.520.000.007.004.15 3.80 3.80 1.81 1.81 1.84 1.84 7.70 7.52 7.00
2.68 Ethiopia -7.69-0.500.000.006.002.40 2.40 2.40 2.78 2.71 2.50 2.50 7.45 6.50 6.00
0.71 Egypt 0.670.040.000.006.000.75 0.75 0.75 8.12 8.00 8.00 8.00 5.80 5.96 6.00
4.12 Tanzania 10.000.500.000.005.504.00 4.00 4.00 1.30 1.25 1.38 1.38 5.36 5.00 5.50
1.68 Malawi -26.78-1.050.000.002.881.75 1.75 1.75 2.17 2.25 1.64 1.64 3.64 3.93 2.88
1.00 Zambia -22.54-0.760.000.002.621.21 0.96 0.96 2.57 2.80 2.72 2.72 2.57 3.38 2.62
1.80 Kenya 5.660.150.000.002.801.65 1.70 1.70 1.56 1.61 1.65 1.65 2.80 2.65 2.80
1.00 Uganda -5.45-0.150.000.002.601.00 1.00 1.00 2.75 2.75 2.60 2.60 2.75 2.75 2.60
0.90 Zimbabwe -46.15-0.600.000.000.701.30 1.53 1.53 0.89 1.00 0.46 0.46 0.80 1.30 0.70
Former Soviet Union - 12
4.83 Ukraine -19.16-5.450.000.0023.004.63 4.00 4.00 6.40 6.15 5.75 5.75 30.90 28.45 23.00
2.32 Russia 19.212.180.000.0013.502.60 2.70 2.70 5.01 4.36 5.00 5.00 11.64 11.33 13.50
South Asia
9.07 India -11.28-2.67-6.67-1.5021.009.30 9.20 9.00 2.68 2.55 2.45 2.33 24.26 23.67 22.50
1.14 Pakistan 2.200.110.000.005.101.14 1.15 1.15 4.38 4.38 4.43 4.43 4.99 4.99 5.10
0.91 Nepal -13.04-0.300.000.002.000.91 0.90 0.90 2.52 2.54 2.22 2.22 2.28 2.30 2.00
Southeast Asia
3.12 Indonesia 9.090.800.000.009.602.94 3.14 3.14 2.92 2.99 3.06 3.06 9.10 8.80 9.60
2.58 Philippines 1.680.130.000.007.802.56 2.60 2.60 2.91 3.00 3.00 3.00 7.53 7.67 7.80
1.18 Vietnam 13.210.700.000.006.001.25 1.30 1.30 4.40 4.24 4.62 4.62 5.19 5.30 6.00
1.12 Thailand -2.08-0.100.000.004.701.10 1.09 1.09 4.38 4.36 4.31 4.31 4.90 4.80 4.70
7.05Mexico -7.77-1.980.000.0023.507.33 7.00 7.00 3.24 3.48 3.36 3.36 22.88 25.48 23.50
1.48Canada 18.392.1110.571.3013.601.23 1.30 1.31 9.59 9.36 9.46 10.38 14.19 11.49 12.30
0.58Turkey 25.001.200.000.006.000.55 0.62 0.62 8.79 8.73 9.68 9.68 5.10 4.80 6.00
23.68Others -4.78-2.64-0.10-0.0552.5822.34 22.49 22.48 2.26 2.47 2.34 2.34 53.57 55.21 52.63
World and Selected Countries and Regions
Foreign Agricultural Service/USDA December 2015Office of Global Analysis

Table 05 Barley Area, Yield, and Production
From last month From last year
MMTPercent
Yield
(Metric tons per hectare)
Dec 2013/14 MMT
Country / Region
Area
(Million hectares)
Production
(Million metric tons)
Change in Production
2013/14
Prel.
2014/15 Nov Nov
Prel.
2014/15 Dec
Prel.
2014/15 Nov Dec Percent
2015/16 Proj.2015/16 Proj. 2015/16 Proj.
2013/14
50.62World 2.823.980.240.35145.1649.67 50.01 49.97 2.85 2.84 2.90 2.90 144.52 141.19 144.81
1.23United States 18.040.710.000.004.671.01 1.26 1.26 3.84 3.91 3.71 3.71 4.72 3.95 4.67
49.39Total Foreign 2.383.260.250.35140.5048.66 48.75 48.71 2.83 2.82 2.87 2.88 139.80 137.24 140.15
none
12.41European Union 0.450.270.060.0460.7312.39 12.36 12.34 4.81 4.88 4.91 4.92 59.67 60.46 60.70
Former Soviet Union - 12
8.02 Russia -16.61-3.330.000.0016.708.80 8.20 8.20 1.92 2.27 2.04 2.04 15.39 20.03 16.70
3.23 Ukraine -7.94-0.750.000.008.703.20 2.90 2.90 2.34 2.95 3.00 3.00 7.56 9.45 8.70
1.84 Kazakhstan 7.790.190.000.002.601.91 2.00 2.00 1.38 1.26 1.30 1.30 2.54 2.41 2.60
0.57 Belarus -11.11-0.250.000.002.000.63 0.60 0.60 2.94 3.60 3.33 3.33 1.67 2.25 2.00
0.33 Azerbaijan 16.670.100.000.000.700.30 0.30 0.30 2.50 2.00 2.33 2.33 0.82 0.60 0.70
2.65Canada 15.541.118.220.638.232.14 2.35 2.35 3.86 3.33 3.23 3.50 10.24 7.12 7.60
3.81Australia 8.560.69-2.25-0.208.703.84 4.00 4.00 2.41 2.09 2.23 2.18 9.17 8.01 8.90
Middle East
3.33 Turkey 85.003.400.000.007.403.40 3.40 3.40 2.19 1.18 2.18 2.18 7.30 4.00 7.40
1.64 Iran 3.130.100.000.003.301.58 1.60 1.60 1.71 2.03 2.06 2.06 2.80 3.20 3.30
1.07 Iraq 5.000.050.000.001.051.15 1.16 1.16 0.88 0.87 0.91 0.91 0.94 1.00 1.05
1.28 Syria 42.860.150.000.000.500.50 0.70 0.70 0.71 0.70 0.71 0.71 0.90 0.35 0.50
Africa
1.21 Ethiopia -9.52-0.200.000.001.901.25 1.20 1.20 1.70 1.68 1.58 1.58 2.05 2.10 1.90
1.69 Morocco 105.881.800.000.003.501.44 1.60 1.60 1.60 1.18 2.19 2.19 2.70 1.70 3.50
0.90 Algeria 0.000.000.000.001.300.80 1.00 1.00 1.67 1.63 1.30 1.30 1.50 1.30 1.30
0.24 Tunisia -55.56-0.500.000.000.400.58 0.40 0.40 1.31 1.55 1.00 1.00 0.32 0.90 0.40
0.08 South Africa 14.900.050.000.000.350.09 0.10 0.10 3.28 3.55 3.65 3.65 0.27 0.30 0.35
South America
1.27 Argentina 17.240.500.000.003.400.90 0.95 0.95 3.74 3.22 3.58 3.58 4.75 2.90 3.40
0.11 Uruguay -7.04-0.03-13.16-0.050.330.10 0.10 0.09 3.59 3.55 3.65 3.59 0.40 0.36 0.38
0.11 Brazil -6.67-0.020.000.000.280.12 0.10 0.10 3.14 2.56 2.80 2.80 0.33 0.30 0.28
0.70India -12.62-0.230.000.001.600.67 0.80 0.80 2.52 2.72 2.00 2.00 1.75 1.83 1.60
0.45China 0.000.000.000.001.500.44 0.42 0.42 3.33 3.41 3.57 3.57 1.50 1.50 1.50
0.22Mexico 6.360.040.000.000.590.22 0.23 0.23 2.56 2.56 2.60 2.60 0.55 0.55 0.59
0.28Afghanistan 0.000.000.000.000.400.28 0.28 0.28 1.43 1.43 1.43 1.43 0.40 0.40 0.40
1.97Others 3.130.13-1.29-0.064.351.95 2.01 2.00 2.17 2.16 2.19 2.17 4.27 4.22 4.41
World and Selected Countries and Regions
Foreign Agricultural Service/USDA December 2015Office of Global Analysis

Table 06 Oats Area, Yield, and Production
From last month From last year
MMTPercent
Yield
(Metric tons per hectare)
Dec 2013/14 MMT
Country / Region
Area
(Million hectares)
Production
(Million metric tons)
Change in Production
2013/14
Prel.
2014/15 Nov Nov
Prel.
2014/15 Dec
Prel.
2014/15 Nov Dec Percent
2015/16 Proj.2015/16 Proj. 2015/16 Proj.
2013/14
9.68World 0.970.22-1.35-0.3122.539.37 9.77 9.69 2.43 2.38 2.34 2.33 23.50 22.31 22.84
0.41United States 27.580.280.000.001.300.42 0.52 0.52 2.30 2.43 2.52 2.52 0.94 1.02 1.30
9.27Total Foreign -0.30-0.06-1.43-0.3121.238.95 9.25 9.17 2.43 2.38 2.33 2.31 22.56 21.29 21.54
none
2.65European Union -2.86-0.22-1.27-0.107.622.54 2.61 2.63 3.16 3.09 2.96 2.90 8.38 7.85 7.72
Former Soviet Union - 12
3.01 Russia -5.07-0.270.000.005.003.08 3.00 3.00 1.64 1.71 1.67 1.67 4.93 5.27 5.00
0.24 Ukraine -38.52-0.240.000.000.380.25 0.20 0.20 1.94 2.49 1.88 1.88 0.47 0.61 0.38
0.13 Belarus -14.89-0.070.000.000.400.14 0.14 0.14 2.65 3.36 2.86 2.86 0.35 0.47 0.40
0.22 Kazakhstan 10.620.020.000.000.250.19 0.20 0.20 1.39 1.18 1.25 1.25 0.31 0.23 0.25
1.11Canada 15.140.452.390.083.430.93 1.10 1.05 3.51 3.21 3.05 3.27 3.91 2.98 3.35
South America
0.22 Argentina -7.62-0.040.000.000.490.25 0.24 0.24 2.07 2.14 2.06 2.06 0.45 0.53 0.49
0.17 Brazil 0.000.000.000.000.300.15 0.15 0.15 2.24 2.00 2.00 2.00 0.38 0.30 0.30
0.14 Chile 11.640.05-38.16-0.290.470.09 0.14 0.09 4.49 4.68 5.51 5.53 0.61 0.42 0.76
0.03 Uruguay 143.480.030.000.000.060.01 0.04 0.04 1.41 1.64 1.40 1.40 0.04 0.02 0.06
Oceania
0.72 Australia 19.600.210.000.001.300.68 0.80 0.80 1.76 1.59 1.63 1.63 1.26 1.09 1.30
0.01 New Zealand 0.000.000.000.000.040.01 0.01 0.01 5.60 6.00 6.00 6.00 0.03 0.04 0.04
0.20China 0.000.000.000.000.600.20 0.20 0.20 2.90 3.00 3.00 3.00 0.58 0.60 0.60
Africa
0.09 Algeria 0.000.000.000.000.110.09 0.09 0.09 1.29 1.29 1.29 1.29 0.11 0.11 0.11
0.05 Morocco 0.000.000.000.000.060.05 0.05 0.05 1.19 1.19 1.19 1.19 0.06 0.06 0.06
0.03 South Africa 0.000.000.000.000.060.03 0.03 0.03 2.19 1.83 1.83 1.83 0.06 0.06 0.06
Other Europe
0.07 Norway 0.000.000.000.000.240.07 0.07 0.07 3.10 3.42 3.42 3.42 0.21 0.24 0.24
0.03 Serbia 0.000.000.000.000.070.03 0.03 0.03 2.20 2.20 2.20 2.20 0.07 0.07 0.07
0.01 Albania 0.000.000.000.000.030.01 0.01 0.01 2.15 2.08 2.08 2.08 0.03 0.03 0.03
0.01 Bosnia and Herzegovina 11.110.000.000.000.030.01 0.01 0.01 2.80 2.70 2.73 2.73 0.03 0.03 0.03
0.09Turkey 0.000.000.000.000.210.09 0.09 0.09 2.33 2.33 2.33 2.33 0.21 0.21 0.21
0.05Mexico 0.000.000.000.000.090.05 0.05 0.05 1.80 1.80 1.80 1.80 0.09 0.09 0.09
0.01Others -3.850.000.000.000.030.01 0.01 0.01 1.79 1.86 1.79 1.79 0.03 0.03 0.03
World and Selected Countries and Regions
Foreign Agricultural Service/USDA December 2015Office of Global Analysis

Table 07 Rye Area, Yield, and Production
From last month From last year
MMTPercent
Yield
(Metric tons per hectare)
Dec 2013/14 MMT
Country / Region
Area
(Million hectares)
Production
(Million metric tons)
Change in Production
2013/14
Prel.
2014/15 Nov Nov
Prel.
2014/15 Dec
Prel.
2014/15 Nov Dec Percent
2015/16 Proj.2015/16 Proj. 2015/16 Proj.
2013/14
5.45World -9.36-1.36-0.63-0.0813.194.99 4.73 4.72 2.89 2.91 2.81 2.79 15.74 14.55 13.28
0.11United States 59.560.110.000.000.290.10 0.15 0.15 1.72 1.76 2.00 2.00 0.19 0.18 0.29
5.33Total Foreign -10.24-1.47-0.65-0.0812.904.89 4.58 4.58 2.92 2.94 2.83 2.82 15.55 14.37 12.98
none
2.58European Union -13.52-1.20-0.17-0.017.662.11 1.91 1.91 3.94 4.19 4.02 4.00 10.15 8.86 7.67
Former Soviet Union - 12
1.78 Russia 0.640.020.000.003.301.85 1.80 1.80 1.89 1.77 1.83 1.83 3.36 3.28 3.30
0.32 Belarus -15.79-0.150.000.000.800.34 0.33 0.33 2.01 2.79 2.46 2.46 0.65 0.95 0.80
0.28 Ukraine -21.05-0.100.000.000.380.19 0.15 0.15 2.29 2.57 2.50 2.50 0.64 0.48 0.38
0.04 Kazakhstan -18.03-0.010.000.000.050.04 0.04 0.04 1.10 1.42 1.25 1.25 0.04 0.06 0.05
0.14Turkey 0.000.000.000.000.350.14 0.14 0.14 2.50 2.50 2.50 2.50 0.35 0.35 0.35
0.09Canada 3.210.01-2.17-0.010.230.09 0.10 0.10 2.56 2.48 2.40 2.37 0.22 0.22 0.23
South America
0.00 Chile 0.000.00-92.96-0.070.010.00 0.01 0.00 4.00 5.00 5.92 5.00 0.00 0.01 0.07
0.04 Argentina -42.27-0.040.000.000.060.05 0.04 0.04 1.49 1.90 1.56 1.56 0.05 0.10 0.06
Other Europe
0.00 Bosnia and Herzegovina -11.110.000.000.000.010.00 0.00 0.00 3.00 2.25 2.67 2.67 0.01 0.01 0.01
0.00 Switzerland 0.000.000.000.000.010.00 0.00 0.00 5.00 5.50 5.50 5.50 0.01 0.01 0.01
0.00 Serbia 0.000.000.000.000.010.00 0.00 0.00 2.50 2.50 2.50 2.50 0.01 0.01 0.01
0.04Australia 10.000.000.000.000.020.04 0.04 0.04 0.57 0.57 0.61 0.61 0.02 0.02 0.02
0.03Others 0.000.000.000.000.030.03 0.03 0.03 0.90 0.93 0.93 0.93 0.03 0.03 0.03
World and Selected Countries and Regions
Foreign Agricultural Service/USDA December 2015Office of Global Analysis

Table 08 Sorghum Area, Yield, and Production
From last month From last year
MMTPercent
Yield
(Metric tons per hectare)
Dec 2013/14 MMT
Country / Region
Area
(Million hectares)
Production
(Million metric tons)
Change in Production
2013/14
Prel.
2014/15 Nov Nov
Prel.
2014/15 Dec
Prel.
2014/15 Nov Dec Percent
2015/16 Proj.2015/16 Proj. 2015/16 Proj.
2013/14
39.08World 7.524.75-0.66-0.4567.9642.90 43.35 43.22 1.56 1.47 1.58 1.57 60.99 63.20 68.41
2.67United States 37.274.100.000.0015.082.59 3.09 3.09 3.74 4.24 4.87 4.87 9.97 10.99 15.08
36.42Total Foreign 1.260.66-0.84-0.4552.8740.31 40.25 40.12 1.40 1.30 1.32 1.32 51.02 52.22 53.32
none
Africa
5.00 Nigeria -8.21-0.550.000.006.155.50 5.30 5.30 1.32 1.22 1.16 1.16 6.59 6.70 6.15
1.82 Ethiopia -5.00-0.200.000.003.801.80 1.80 1.80 2.26 2.22 2.11 2.11 4.11 4.00 3.80
4.36 Sudan -12.43-0.780.000.005.508.63 8.00 8.00 0.52 0.73 0.69 0.69 2.25 6.28 5.50
1.80 Burkina 3.490.060.000.001.901.80 1.80 1.80 1.04 1.02 1.06 1.06 1.88 1.84 1.90
0.94 Mali 0.000.000.000.001.301.00 1.00 1.00 0.87 1.30 1.30 1.30 0.82 1.30 1.30
3.10 Niger 10.000.100.000.001.103.00 3.00 3.00 0.42 0.33 0.37 0.37 1.29 1.00 1.10
0.80 Cameroon 0.000.000.000.001.150.80 0.80 0.80 1.44 1.44 1.44 1.44 1.15 1.15 1.15
0.71 Tanzania 0.000.000.000.000.840.90 0.90 0.90 1.17 0.93 0.93 0.93 0.83 0.84 0.84
0.14 Egypt 0.000.000.000.000.750.14 0.14 0.14 5.31 5.36 5.36 5.36 0.75 0.75 0.75
0.35 Uganda 6.670.020.000.000.320.35 0.35 0.35 0.85 0.86 0.91 0.91 0.30 0.30 0.32
0.23 Ghana 2.390.010.000.000.300.25 0.25 0.25 1.11 1.17 1.20 1.20 0.25 0.29 0.30
0.63 Mozambique 44.440.100.000.000.330.62 0.62 0.62 0.30 0.36 0.52 0.52 0.19 0.23 0.33
0.08 South Africa 83.760.100.000.000.220.07 0.08 0.08 3.35 1.65 2.87 2.87 0.27 0.12 0.22
2.07Mexico 14.040.880.000.007.151.72 1.80 1.80 4.10 3.66 3.97 3.97 8.50 6.27 7.15
South America
1.00 Argentina 11.430.40-13.33-0.603.900.77 1.00 0.87 4.40 4.55 4.50 4.48 4.40 3.50 4.50
0.73 Brazil 0.000.000.000.002.000.73 0.73 0.73 2.59 2.74 2.74 2.74 1.89 2.00 2.00
South Asia
5.79 India 8.910.450.000.005.505.50 6.00 6.00 0.96 0.92 0.92 0.92 5.54 5.05 5.50
0.24 Pakistan 0.000.000.000.000.150.24 0.24 0.24 0.60 0.60 0.60 0.60 0.15 0.15 0.15
0.65China 0.000.000.000.002.600.61 0.61 0.61 4.15 4.26 4.26 4.26 2.70 2.60 2.60
0.53Australia 4.560.104.760.102.200.65 0.70 0.70 2.41 3.23 3.00 3.14 1.28 2.10 2.10
0.14European Union -9.43-0.086.690.050.800.15 0.14 0.15 5.21 6.03 5.19 5.50 0.70 0.88 0.75
5.32Others 1.130.060.000.004.935.09 4.99 4.99 0.97 0.96 0.99 0.99 5.18 4.88 4.93
World and Selected Countries and Regions
Foreign Agricultural Service/USDA December 2015Office of Global Analysis

World and Selected Countries and Regions
Table 09 Rice Area, Yield, and Production
From last month From last year
MMTPercent
Yield
(Metric tons per hectare)
Dec 2013/14 MMT
Country / Region
Area
(Million hectares)
Production
(Million metric tons)
Change in Production
2013/14
Prel.
2014/15 Nov Nov
Prel.
2014/15 Dec
Prel.
2014/15 Nov Dec Percent
2015/16 Proj.2015/16 Proj. 2015/16 Proj.
2013/14
161.72World -1.85-8.87-0.88-4.18469.32159.93 159.17 158.78 4.41 4.46 4.43 4.41 478.44 478.19 473.50
1.00United States -14.30-1.010.000.006.061.18 1.04 1.04 8.62 8.49 8.32 8.32 6.12 7.07 6.06
160.73Total Foreign -1.67-7.86-0.89-4.18463.26158.75 158.13 157.74 4.39 4.43 4.41 4.38 472.32 471.12 467.44
none
East Asia
30.31 China 0.650.940.000.00145.5030.31 30.35 30.35 6.72 6.81 6.85 6.85 142.53 144.56 145.50
1.62 Japan 0.740.060.000.007.901.61 1.61 1.61 6.73 6.70 6.74 6.74 7.94 7.84 7.90
0.83 Korea, South 2.030.091.620.074.330.82 0.80 0.80 6.76 6.91 7.09 7.22 4.23 4.24 4.26
0.57 Korea, North -5.88-0.100.000.001.600.57 0.53 0.53 5.07 4.63 4.69 4.69 1.88 1.70 1.60
South Asia
44.14 India -4.58-4.80-3.38-3.50100.0043.00 43.20 43.00 3.62 3.66 3.59 3.49 106.65 104.80 103.50
11.75 Bangladesh 0.290.100.000.0034.6011.79 12.00 12.00 4.39 4.39 4.33 4.33 34.39 34.50 34.60
2.78 Pakistan 0.000.000.000.006.902.85 2.85 2.85 3.62 3.63 3.63 3.63 6.70 6.90 6.90
1.50 Nepal 0.000.000.000.003.101.56 1.56 1.56 3.37 2.98 2.98 2.98 3.36 3.10 3.10
1.15 Sri Lanka 15.790.450.000.003.301.15 1.23 1.23 3.63 3.64 3.96 3.96 2.84 2.85 3.30
Southeast Asia
12.10 Indonesia 1.510.540.000.0036.3011.90 12.16 12.16 4.72 4.73 4.70 4.70 36.30 35.76 36.30
7.79 Vietnam 0.450.130.000.0028.207.69 7.66 7.66 5.79 5.84 5.89 5.89 28.16 28.07 28.20
10.92 Thailand -12.53-2.350.000.0016.4010.27 9.65 9.65 2.84 2.77 2.57 2.57 20.46 18.75 16.40
7.05 Burma -3.17-0.400.000.0012.207.03 6.80 6.80 2.65 2.80 2.80 2.80 11.96 12.60 12.20
4.80 Philippines -5.58-0.67-2.17-0.2511.254.71 4.50 4.35 3.92 4.02 4.06 4.11 11.86 11.92 11.50
2.97 Cambodia -7.45-0.350.000.004.353.03 2.90 2.90 2.49 2.43 2.34 2.34 4.73 4.70 4.35
0.89 Laos -6.67-0.130.000.001.750.96 0.93 0.93 2.94 3.11 3.00 3.00 1.65 1.88 1.75
0.69 Malaysia 0.560.010.000.001.810.69 0.69 0.69 3.91 4.02 4.04 4.04 1.76 1.80 1.81
South America
2.40 Brazil -5.49-0.470.000.008.002.30 2.30 2.30 5.09 5.42 5.12 5.12 8.30 8.47 8.00
0.41 Peru 7.650.150.000.002.150.38 0.40 0.40 7.72 7.73 7.80 7.80 2.16 2.00 2.15
Africa
0.77 Egypt -11.70-0.530.000.004.000.65 0.80 0.80 8.94 10.10 7.25 7.25 4.75 4.53 4.00
1.30 Madagascar -6.99-0.18-9.76-0.262.371.45 1.45 1.45 2.78 2.74 2.83 2.55 2.31 2.55 2.62
2.50 Nigeria -4.44-0.130.000.002.712.70 2.40 2.40 1.76 1.67 1.79 1.79 2.77 2.84 2.71
0.43European Union 2.600.050.000.001.930.43 0.42 0.42 6.45 6.37 6.58 6.58 1.94 1.88 1.93
0.59Iran 3.850.070.000.001.780.60 0.63 0.63 4.24 4.33 4.32 4.32 1.65 1.72 1.78
10.47Others -1.63-0.35-1.15-0.2420.8310.34 10.32 10.29 3.05 3.11 3.10 3.08 21.07 21.18 21.08
Yield is on a rough basis, before the milling process. Production is on a milled basis, after the milling process.
Foreign Agricultural Service/USDA December 2015Office of Global Analysis

World and Selected Countries and Regions
Table 10 Total Oilseed Area, Yield, and Production
From last month From last year
MMTPercent
Yield
(Metric tons per hectare)
Dec 2013/14 MMT
Country / Region
Area
(Million hectares)
Production
(Million metric tons)
Change in Production
2013/14
Prel.
2014/15 Nov Nov
Prel.
2014/15 Dec
Prel.
2014/15 Nov Dec Percent
2015/16 Proj.2015/16 Proj. 2015/16 Proj.
2013/14
--World Total -1.42-7.61-0.38-1.99528.96-- -- -- -- -- -- -- 505.37 536.56 530.95
--Total Foreign -2.20-9.25-0.47-1.93411.29-- -- -- -- -- -- -- 406.35 420.54 413.21
--Oilseed, Copra 1.360.070.000.005.51-- -- -- -- -- -- -- 5.43 5.43 5.51
--Oilseed, Palm Kernel 1.280.21-3.51-0.6016.49-- -- -- -- -- -- -- 15.74 16.29 17.09
none
230.76Major OilSeeds -1.53-7.89-0.27-1.39506.96234.35 233.17 232.29 2.10 2.20 2.18 2.18 484.21 514.85 508.35
35.44United States 1.421.65-0.06-0.07117.6738.98 38.71 38.71 2.79 2.98 3.04 3.04 99.02 116.03 117.74
none
195.32Foreign Oilseeds -2.39-9.54-0.34-1.33389.28195.37 194.45 193.58 1.97 2.04 2.01 2.01 385.19 398.82 390.61
59.15South America 0.020.040.000.00180.0361.57 63.01 63.01 2.73 2.92 2.86 0.00 161.51 179.99 180.03
31.47 Brazil 3.663.620.000.00102.7133.35 34.46 34.46 2.86 2.97 2.98 0.00 89.92 99.09 102.71
21.64 Argentina -7.28-4.810.000.0061.3122.05 22.21 22.21 2.63 3.00 2.76 0.00 56.92 66.12 61.31
3.36 Paraguay 8.650.710.000.008.973.35 3.52 3.52 2.47 2.46 2.55 0.00 8.32 8.26 8.97
1.18 Bolivia 16.780.500.000.003.451.28 1.50 1.50 2.26 2.30 2.30 0.00 2.67 2.95 3.45
1.34 Uruguay 0.440.010.000.003.171.36 1.16 1.16 2.49 2.31 2.73 0.00 3.34 3.15 3.17
24.74China -6.19-3.57-0.48-0.2654.1424.31 22.82 22.77 2.38 2.37 2.38 0.00 58.89 57.71 54.40
40.82South Asia -7.25-2.77-8.40-3.2535.4339.09 39.03 37.98 1.00 0.98 0.99 0.00 40.93 38.20 38.68
37.18 India -4.90-1.61-8.37-2.8531.2235.36 35.45 34.45 0.97 0.93 0.96 0.00 36.07 32.83 34.07
3.37 Pakistan -22.71-1.16-9.20-0.403.953.46 3.31 3.26 1.36 1.48 1.31 0.00 4.59 5.11 4.35
12.17European Union -11.15-3.98-0.05-0.0231.7311.96 11.73 11.73 2.63 2.99 2.71 0.00 32.05 35.72 31.75
20.76Former Soviet Union - 12 -1.10-0.370.700.2333.3821.22 20.74 20.74 1.68 1.59 1.60 0.00 34.89 33.75 33.14
9.11 Russia 2.400.310.760.1013.309.34 9.38 9.38 1.49 1.39 1.41 0.00 13.58 12.99 13.20
7.65 Ukraine 1.230.201.230.2016.507.98 7.88 7.88 2.19 2.04 2.07 0.00 16.73 16.30 16.30
1.30 Uzbekistan -5.10-0.080.000.001.451.29 1.29 1.29 1.24 1.19 1.13 0.00 1.61 1.53 1.45
10.05Canada 4.420.999.121.9623.5110.61 10.15 10.34 2.38 2.12 2.12 0.00 23.96 22.51 21.54
18.31Africa 6.631.050.330.0616.8217.53 18.26 18.35 0.91 0.90 0.92 0.00 16.66 15.78 16.77
3.44 Nigeria 0.590.020.000.003.763.37 3.39 3.39 1.10 1.11 1.11 0.00 3.76 3.74 3.76
1.17 South Africa 11.930.220.000.002.051.34 1.38 1.38 1.63 1.37 1.49 0.00 1.90 1.84 2.05
1.29 Tanzania -1.92-0.020.000.000.921.24 1.24 1.24 0.82 0.75 0.74 0.00 1.07 0.94 0.92
3.46Southeast Asia -0.87-0.040.270.014.923.41 3.36 3.37 1.41 1.45 1.46 0.00 4.89 4.96 4.90
1.11 Indonesia -1.85-0.030.750.011.751.10 1.05 1.07 1.64 1.63 1.65 0.00 1.82 1.79 1.74
1.92 Burma -0.84-0.020.000.002.381.89 1.88 1.88 1.20 1.27 1.27 0.00 2.31 2.40 2.38
3.21Australia -7.23-0.31-0.93-0.043.952.97 2.81 2.75 1.80 1.44 1.42 0.00 5.78 4.26 3.99
1.13Turkey -16.23-0.42-1.24-0.032.151.07 0.97 0.96 2.20 2.40 2.25 0.00 2.49 2.57 2.18
1.54Others -4.41-0.150.000.003.231.62 1.57 1.57 2.04 2.09 2.06 2.06 3.15 3.38 3.23
World Total and Total Foreign: (Major Oilseeds plus copra and palm kernel) Major Oilseeds: (soybeans, sunflowerseeds, peanuts(inshell), cottonseed and
rapeseed)
Foreign Agricultural Service/USDA December 2015Office of Global Analysis

Table 11 Soybean Area, Yield, and Production
From last month From last year
MMTPercent
Yield
(Metric tons per hectare)
Dec 2013/14 MMT
Country / Region
Area
(Million hectares)
Production
(Million metric tons)
Change in Production
2013/14
Prel.
2014/15 Nov Nov
Prel.
2014/15 Dec
Prel.
2014/15 Nov Dec Percent
2015/16 Proj.2015/16 Proj. 2015/16 Proj.
2013/14
113.08World 0.351.11-0.28-0.91320.11118.65 120.99 121.00 2.50 2.69 2.65 2.65 283.12 319.00 321.02
30.86United States 1.381.480.000.00108.3533.42 33.36 33.36 2.96 3.20 3.25 3.25 91.39 106.88 108.35
82.23Total Foreign -0.17-0.37-0.43-0.91211.7585.22 87.63 87.64 2.33 2.49 2.43 2.42 191.73 212.12 212.66
none
South America
30.10 Brazil 3.953.800.000.00100.0032.10 33.30 33.30 2.88 3.00 3.00 3.00 86.70 96.20 100.00
19.40 Argentina -7.17-4.400.000.0057.0019.79 20.00 20.00 2.76 3.10 2.85 2.85 53.50 61.40 57.00
3.26 Paraguay 8.640.700.000.008.803.24 3.40 3.40 2.52 2.50 2.59 2.59 8.19 8.10 8.80
1.00 Bolivia 16.980.450.000.003.101.08 1.28 1.28 2.40 2.45 2.42 2.42 2.40 2.65 3.10
1.31 Uruguay 0.030.000.000.003.111.33 1.12 1.12 2.52 2.33 2.78 2.78 3.30 3.11 3.11
East Asia
6.85 China -6.88-0.850.000.0011.506.80 6.40 6.40 1.78 1.82 1.80 1.80 12.20 12.35 11.50
0.08 Korea, South -13.67-0.020.000.000.120.08 0.07 0.07 1.93 1.85 1.71 1.71 0.15 0.14 0.12
0.12 Korea, North -9.09-0.020.000.000.150.12 0.11 0.11 1.41 1.40 1.36 1.36 0.16 0.17 0.15
0.13 Japan -2.65-0.010.000.000.220.13 0.13 0.13 1.55 1.71 1.69 1.69 0.20 0.23 0.22
12.20India -8.05-0.70-15.79-1.508.0010.91 11.65 11.65 0.78 0.80 0.82 0.69 9.50 8.70 9.50
1.86Canada 3.070.194.790.296.242.24 2.20 2.20 2.88 2.71 2.70 2.83 5.36 6.05 5.95
Former Soviet Union - 12
1.20 Russia 7.900.213.700.102.801.91 2.00 2.00 1.36 1.36 1.35 1.40 1.64 2.60 2.70
1.35 Ukraine -2.56-0.105.560.203.801.80 2.10 2.10 2.05 2.17 1.71 1.81 2.77 3.90 3.60
0.47European Union 13.260.240.000.002.050.57 0.73 0.73 2.57 3.16 2.80 2.80 1.21 1.81 2.05
Southeast Asia
0.45 Indonesia -1.59-0.013.330.020.620.46 0.43 0.45 1.44 1.37 1.40 1.38 0.65 0.63 0.60
0.11 Vietnam 0.570.000.000.000.180.12 0.12 0.12 1.44 1.45 1.46 1.46 0.16 0.17 0.18
0.04 Thailand -5.660.000.000.000.050.03 0.03 0.03 1.60 1.71 1.67 1.67 0.06 0.05 0.05
0.17 Burma 0.000.000.000.000.200.17 0.17 0.17 1.23 1.21 1.21 1.21 0.21 0.20 0.20
0.18Mexico 1.410.010.000.000.360.19 0.20 0.20 1.35 1.84 1.85 1.85 0.24 0.36 0.36
0.08Iran 0.000.000.000.000.200.08 0.08 0.08 2.45 2.44 2.44 2.44 0.19 0.20 0.20
Africa
0.50 South Africa 7.550.080.000.001.140.69 0.70 0.70 1.88 1.54 1.63 1.63 0.95 1.06 1.14
0.65 Nigeria 0.000.000.000.000.650.65 0.65 0.65 1.00 1.00 1.00 1.00 0.65 0.65 0.65
0.11 Zambia 0.000.000.000.000.210.11 0.11 0.11 1.88 1.88 1.88 1.88 0.21 0.21 0.21
0.16 Uganda 0.000.000.000.000.190.16 0.16 0.16 1.19 1.19 1.19 1.19 0.19 0.19 0.19
Middle East
0.08 Iran 0.000.000.000.000.200.08 0.08 0.08 2.45 2.44 2.44 2.44 0.19 0.20 0.20
0.04 Turkey -33.33-0.050.000.000.090.04 0.03 0.03 3.71 3.86 3.60 3.60 0.13 0.14 0.09
0.34Others 16.350.11-1.50-0.010.790.36 0.39 0.38 1.82 1.91 2.08 2.08 0.62 0.68 0.80
World and Selected Countries and Regions
Foreign Agricultural Service/USDA December 2015Office of Global Analysis

Table 12 Cottonseed Area, Yield, and Production
From last month From last year
MMTPercent
Yield
(Metric tons per hectare)
Dec 2013/14 MMT
Country / Region
Area
(Million hectares)
Production
(Million metric tons)
Change in Production
2013/14
Prel.
2014/15 Nov Nov
Prel.
2014/15 Dec
Prel.
2014/15 Nov Dec Percent
2015/16 Proj.2015/16 Proj. 2015/16 Proj.
2013/14
31.90World -12.34-5.47-2.27-0.9038.8733.00 30.27 30.31 1.43 1.34 1.31 1.28 45.68 44.34 39.77
3.05United States -18.37-0.85-1.73-0.073.803.78 3.30 3.30 1.25 1.23 1.17 1.15 3.81 4.65 3.86
28.84Total Foreign -11.64-4.62-2.32-0.8335.0729.21 26.98 27.01 1.45 1.36 1.33 1.30 41.87 39.69 35.90
none
South Asia
11.70 India -3.20-0.40-1.63-0.2012.1012.70 11.80 11.80 1.11 0.98 1.04 1.03 12.95 12.50 12.30
2.90 Pakistan -23.91-1.10-10.26-0.403.502.95 2.85 2.80 1.41 1.56 1.37 1.25 4.10 4.60 3.90
4.80China -18.86-2.22-2.65-0.269.544.40 3.50 3.45 2.67 2.67 2.80 2.77 12.84 11.76 9.80
Former Soviet Union - 12
1.30 Uzbekistan -5.10-0.080.000.001.451.29 1.29 1.29 1.24 1.19 1.13 1.13 1.61 1.53 1.45
0.58 Turkmenistan -8.19-0.05-8.19-0.050.550.55 0.55 0.55 1.06 1.10 1.09 1.00 0.61 0.60 0.60
0.19 Tajikistan -16.56-0.030.000.000.130.18 0.15 0.15 0.92 0.90 0.87 0.87 0.18 0.16 0.13
0.14 Kazakhstan -15.96-0.02-19.39-0.020.080.13 0.10 0.10 0.96 0.73 0.99 0.80 0.13 0.09 0.10
South America
1.12 Brazil -6.78-0.160.000.002.201.02 0.93 0.93 2.38 2.31 2.38 2.38 2.67 2.36 2.20
0.56 Argentina -9.33-0.040.000.000.340.48 0.45 0.45 0.75 0.78 0.76 0.76 0.42 0.38 0.34
Middle East
0.33 Turkey -17.18-0.18-3.07-0.030.850.43 0.38 0.37 2.24 2.40 2.32 2.31 0.74 1.03 0.88
0.11 Syria -7.22-0.010.000.000.090.06 0.05 0.05 2.51 1.62 1.80 1.80 0.28 0.10 0.09
0.10 Iran 2.080.000.000.000.100.11 0.11 0.11 0.90 0.87 0.89 0.89 0.09 0.10 0.10
0.44Australia 4.080.0313.850.090.740.21 0.23 0.29 4.31 3.47 2.89 2.60 1.88 0.71 0.65
0.31European Union -26.77-0.14-4.25-0.020.380.36 0.32 0.32 1.54 1.47 1.27 1.22 0.48 0.52 0.40
Africa
0.65 Burkina -10.99-0.040.000.000.330.66 0.63 0.63 0.53 0.57 0.53 0.53 0.35 0.37 0.33
0.45 Mali 2.640.010.000.000.310.54 0.58 0.58 0.54 0.56 0.54 0.54 0.24 0.30 0.31
0.22 Cameroon -3.02-0.018.440.020.260.23 0.22 0.22 1.14 1.15 1.08 1.17 0.25 0.27 0.24
0.45 Cote d'Ivoire 0.000.000.000.000.230.41 0.44 0.44 0.47 0.55 0.52 0.52 0.21 0.23 0.23
0.35 Benin -13.81-0.03-4.19-0.010.210.35 0.31 0.33 0.54 0.68 0.69 0.62 0.19 0.24 0.22
0.35 Tanzania -13.24-0.020.000.000.120.40 0.40 0.40 0.47 0.34 0.30 0.30 0.17 0.14 0.12
0.13 Egypt -35.00-0.060.000.000.100.16 0.10 0.10 1.02 1.02 1.04 1.04 0.13 0.16 0.10
0.29 Nigeria 25.580.020.000.000.110.22 0.24 0.24 0.40 0.40 0.45 0.45 0.11 0.09 0.11
0.05 Uganda -3.810.000.000.000.100.06 0.06 0.06 1.22 1.75 1.68 1.68 0.06 0.11 0.10
0.26 Zimbabwe 20.630.010.000.000.080.18 0.18 0.18 0.39 0.35 0.42 0.42 0.10 0.06 0.08
0.06 Sudan 56.060.040.000.000.100.07 0.11 0.11 1.34 0.99 0.94 0.94 0.08 0.07 0.10
0.12Mexico -30.39-0.140.000.000.320.18 0.13 0.13 2.58 2.56 2.48 2.48 0.32 0.46 0.32
0.30Burma -5.41-0.020.000.000.350.30 0.29 0.29 1.23 1.23 1.23 1.23 0.37 0.37 0.35
0.61Others -1.24-0.0110.220.040.400.62 0.61 0.67 0.54 0.65 0.60 0.59 0.33 0.40 0.36
World and Selected Countries and Regions
Foreign Agricultural Service/USDA December 2015Office of Global Analysis

Table 13 Peanut Area, Yield, and Production
From last month From last year
MMTPercent
Yield
(Metric tons per hectare)
Dec 2013/14 MMT
Country / Region
Area
(Million hectares)
Production
(Million metric tons)
Change in Production
2013/14
Prel.
2014/15 Nov Nov
Prel.
2014/15 Dec
Prel.
2014/15 Nov Dec Percent
2015/16 Proj.2015/16 Proj. 2015/16 Proj.
2013/14
25.41World 3.511.380.000.0040.7923.65 24.40 24.40 1.62 1.67 1.67 1.67 41.12 39.41 40.79
0.42United States 18.950.450.000.002.800.54 0.64 0.64 4.49 4.40 4.40 4.40 1.89 2.35 2.80
24.99Total Foreign 2.530.940.000.0037.9923.12 23.76 23.76 1.57 1.60 1.60 1.60 39.22 37.06 37.99
none
4.63China 1.320.220.000.0016.704.60 4.60 4.60 3.66 3.58 3.63 3.63 16.97 16.48 16.70
Africa
2.50 Nigeria 0.000.000.000.003.002.50 2.50 2.50 1.20 1.20 1.20 1.20 3.00 3.00 3.00
2.16 Sudan 94.290.910.000.001.871.25 2.18 2.18 0.82 0.77 0.86 0.86 1.77 0.96 1.87
0.92 Senegal 8.370.060.000.000.730.88 0.77 0.77 0.74 0.76 0.94 0.94 0.68 0.67 0.73
0.46 Cameroon -14.06-0.090.000.000.550.47 0.40 0.40 1.37 1.36 1.38 1.38 0.64 0.64 0.55
0.33 Ghana 0.000.000.000.000.440.40 0.40 0.40 1.24 1.10 1.10 1.10 0.41 0.44 0.44
0.50 Chad 0.000.000.000.000.400.50 0.50 0.50 0.80 0.80 0.80 0.80 0.40 0.40 0.40
0.36 Malawi 0.000.000.000.000.380.37 0.37 0.37 1.05 1.03 1.03 1.03 0.38 0.38 0.38
0.48 Congo (Kinshasa) 0.000.000.000.000.370.48 0.48 0.48 0.78 0.78 0.78 0.78 0.37 0.37 0.37
0.78 Niger 0.000.000.000.000.350.74 0.74 0.74 0.44 0.47 0.47 0.47 0.34 0.35 0.35
0.37 Mali 0.000.000.000.000.330.38 0.38 0.38 1.38 0.87 0.87 0.87 0.52 0.33 0.33
0.42 Uganda 0.000.000.000.000.300.43 0.43 0.43 0.70 0.71 0.71 0.71 0.30 0.30 0.30
0.45 Burkina 0.000.000.000.000.350.45 0.45 0.45 0.78 0.78 0.78 0.78 0.35 0.35 0.35
0.21 Guinea 0.000.000.000.000.260.21 0.21 0.21 1.24 1.24 1.24 1.24 0.26 0.26 0.26
0.06 Egypt 0.500.000.000.000.200.06 0.06 0.06 3.16 3.16 3.33 3.33 0.20 0.20 0.20
0.10 Central African Republic 0.000.000.000.000.150.10 0.10 0.10 1.50 1.50 1.50 1.50 0.15 0.15 0.15
0.05 South Africa 13.330.010.000.000.090.06 0.05 0.05 1.90 1.29 1.89 1.89 0.10 0.08 0.09
0.29 Mozambique 0.000.000.000.000.110.29 0.29 0.29 0.38 0.38 0.38 0.38 0.11 0.11 0.11
0.08 Cote d'Ivoire 0.000.000.000.000.090.08 0.08 0.08 1.19 1.13 1.13 1.13 0.10 0.09 0.09
0.15 Benin 0.000.000.000.000.140.16 0.16 0.16 0.87 0.90 0.90 0.90 0.13 0.14 0.14
South Asia
5.40 India -4.08-0.200.000.004.704.60 4.50 4.50 1.05 1.07 1.04 1.04 5.65 4.90 4.70
0.09 Pakistan 11.760.010.000.000.100.10 0.11 0.11 1.07 0.89 0.90 0.90 0.10 0.09 0.10
Southeast Asia
0.66 Indonesia -1.74-0.020.000.001.130.63 0.62 0.62 1.77 1.83 1.84 1.84 1.16 1.15 1.13
0.89 Burma 0.000.000.000.001.380.89 0.89 0.89 1.55 1.55 1.55 1.55 1.38 1.38 1.38
0.21 Vietnam 2.540.010.000.000.490.22 0.22 0.22 2.18 2.20 2.20 2.20 0.46 0.47 0.49
0.03 Thailand 0.000.000.000.000.050.03 0.03 0.03 1.47 1.50 1.50 1.50 0.05 0.05 0.05
South America
0.38 Argentina -1.52-0.020.000.001.170.34 0.36 0.36 2.64 3.48 3.25 3.25 1.00 1.19 1.17
0.11 Brazil -4.62-0.020.000.000.330.11 0.11 0.11 3.00 3.15 3.00 3.00 0.32 0.35 0.33
0.06Mexico 3.960.000.000.000.110.06 0.06 0.06 1.75 1.74 1.75 1.75 0.10 0.10 0.11
1.86Others 3.580.060.000.001.771.76 1.75 1.75 1.00 0.97 1.01 1.01 1.86 1.71 1.77
World and Selected Countries and Regions
Foreign Agricultural Service/USDA December 2015Office of Global Analysis

Table 14 Sunflowerseed Area, Yield, and Production
From last month From last year
MMTPercent
Yield
(Metric tons per hectare)
Dec 2013/14 MMT
Country / Region
Area
(Million hectares)
Production
(Million metric tons)
Change in Production
2013/14
Prel.
2014/15 Nov Nov
Prel.
2014/15 Dec
Prel.
2014/15 Nov Dec Percent
2015/16 Proj.2015/16 Proj. 2015/16 Proj.
2013/14
24.13World -0.81-0.33-0.09-0.0439.6523.14 22.89 22.87 1.75 1.73 1.73 1.73 42.33 39.98 39.69
0.59United States 31.240.310.000.001.320.61 0.72 0.72 1.55 1.65 1.83 1.83 0.92 1.01 1.32
23.54Total Foreign -1.64-0.64-0.09-0.0438.3322.53 22.17 22.15 1.76 1.73 1.73 1.73 41.42 38.97 38.37
none
Former Soviet Union - 12
6.80 Russia 5.270.470.000.009.406.37 6.50 6.50 1.55 1.40 1.45 1.45 10.55 8.93 9.40
5.30 Ukraine 7.840.800.000.0011.005.30 5.10 5.10 2.19 1.92 2.16 2.16 11.60 10.20 11.00
0.82 Kazakhstan -12.28-0.060.000.000.450.77 0.68 0.68 0.70 0.67 0.67 0.67 0.57 0.51 0.45
4.62European Union -13.23-1.180.000.007.754.28 4.15 4.15 1.96 2.09 1.87 1.87 9.05 8.93 7.75
South America
1.30 Argentina -11.39-0.360.000.002.801.44 1.40 1.40 1.54 2.19 2.00 2.00 2.00 3.16 2.80
0.03 Uruguay 29.550.010.000.000.060.03 0.04 0.04 1.40 1.47 1.50 1.50 0.04 0.04 0.06
0.18 Bolivia 15.000.050.000.000.350.20 0.22 0.22 1.50 1.50 1.60 1.60 0.27 0.30 0.35
0.15 Brazil 0.000.000.000.000.180.12 0.12 0.12 1.59 1.50 1.50 1.50 0.23 0.18 0.18
0.04 Paraguay 8.570.010.000.000.110.06 0.07 0.07 1.51 1.69 1.75 1.75 0.06 0.11 0.11
0.92China -2.13-0.050.000.002.300.92 0.92 0.92 2.63 2.55 2.50 2.50 2.42 2.35 2.30
South Asia
0.75 India 0.000.000.000.000.420.55 0.50 0.50 0.89 0.76 0.84 0.84 0.67 0.42 0.42
0.16 Pakistan -5.00-0.010.000.000.190.16 0.15 0.15 1.25 1.25 1.27 1.27 0.20 0.20 0.19
Middle East
0.69 Turkey -16.67-0.200.000.001.000.53 0.49 0.49 2.03 2.26 2.04 2.04 1.40 1.20 1.00
0.07 Iran 0.000.000.000.000.090.07 0.07 0.07 1.29 1.29 1.29 1.29 0.09 0.09 0.09
0.01 Israel 0.000.000.000.000.020.01 0.01 0.01 1.20 1.60 1.60 1.60 0.01 0.02 0.02
Africa
0.01 Egypt 0.000.000.000.000.020.01 0.01 0.01 2.67 2.43 2.43 2.43 0.02 0.02 0.02
0.02 Morocco 0.000.000.000.000.020.02 0.02 0.02 1.12 1.25 1.25 1.25 0.02 0.02 0.02
0.60 South Africa 21.030.140.000.000.800.58 0.62 0.62 1.39 1.15 1.30 1.30 0.83 0.66 0.80
0.57Burma 0.000.000.000.000.450.54 0.54 0.54 0.63 0.83 0.83 0.83 0.36 0.45 0.45
0.03Canada 32.730.02-22.34-0.020.070.03 0.05 0.04 1.86 1.90 1.96 1.92 0.05 0.06 0.09
0.02Australia 57.890.01-33.33-0.020.030.02 0.04 0.03 1.06 1.19 1.25 1.20 0.02 0.02 0.05
0.47Others -25.20-0.280.000.000.830.53 0.51 0.51 2.01 2.08 1.63 1.63 0.95 1.11 0.83
World and Selected Countries and Regions
Foreign Agricultural Service/USDA December 2015Office of Global Analysis

Table 15 Rapeseed Area, Yield, and Production
From last month From last year
MMTPercent
Yield
(Metric tons per hectare)
Dec 2013/14 MMT
Country / Region
Area
(Million hectares)
Production
(Million metric tons)
Change in Production
2013/14
Prel.
2014/15 Nov Nov
Prel.
2014/15 Dec
Prel.
2014/15 Nov Dec Percent
2015/16 Proj.2015/16 Proj. 2015/16 Proj.
2013/14
36.24World -6.35-4.580.670.4567.5435.91 34.62 33.72 1.99 2.01 1.94 2.00 71.96 72.12 67.09
0.51United States 23.070.260.000.001.400.63 0.70 0.70 1.96 1.81 2.01 2.01 1.00 1.14 1.40
35.72Total Foreign -6.82-4.840.690.4566.1435.28 33.92 33.02 1.99 2.01 1.94 2.00 70.95 70.98 65.69
none
6.77European Union -11.86-2.900.000.0021.556.76 6.54 6.54 3.15 3.62 3.30 3.30 21.30 24.45 21.55
8.16Canada 4.810.7910.971.7017.208.34 7.90 8.10 2.27 1.97 1.96 2.12 18.55 16.41 15.50
7.53China -4.55-0.670.000.0014.107.59 7.40 7.40 1.92 1.95 1.91 1.91 14.46 14.77 14.10
South Asia
7.13 India -4.91-0.31-16.08-1.156.006.60 7.00 6.00 1.02 0.96 1.02 1.00 7.30 6.31 7.15
0.21 Pakistan -27.27-0.060.000.000.160.25 0.20 0.20 0.90 0.88 0.80 0.80 0.19 0.22 0.16
0.25 Bangladesh 0.000.000.000.000.230.25 0.25 0.25 0.92 0.92 0.92 0.92 0.23 0.23 0.23
Former Soviet Union - 12
1.11 Russia -24.86-0.360.000.001.101.06 0.88 0.88 1.26 1.38 1.26 1.26 1.39 1.46 1.10
1.00 Ukraine -22.73-0.500.000.001.700.88 0.68 0.68 2.36 2.50 2.52 2.52 2.35 2.20 1.70
0.40 Belarus -58.90-0.430.000.000.300.40 0.17 0.17 1.68 1.82 1.82 1.82 0.68 0.73 0.30
0.25 Kazakhstan -6.64-0.020.000.000.230.24 0.23 0.23 0.95 0.99 1.00 1.00 0.24 0.24 0.23
2.72Australia -10.51-0.36-3.13-0.103.102.71 2.50 2.40 1.41 1.28 1.28 1.29 3.83 3.46 3.20
South America
0.04 Chile -0.500.000.000.000.200.05 0.05 0.05 3.68 4.10 4.00 4.00 0.14 0.20 0.20
0.05 Paraguay 12.200.010.000.000.050.03 0.04 0.04 1.15 1.28 1.31 1.31 0.05 0.04 0.05
0.02Switzerland 0.000.000.000.000.070.02 0.02 0.02 3.32 3.14 3.14 3.14 0.07 0.07 0.07
0.05Ethiopia 3.900.000.000.000.080.05 0.05 0.05 1.45 1.60 1.60 1.60 0.07 0.08 0.08
0.04Others -25.00-0.030.000.000.080.05 0.04 0.04 2.26 2.13 2.08 2.08 0.10 0.10 0.08
World and Selected Countries and Regions
Foreign Agricultural Service/USDA December 2015Office of Global Analysis
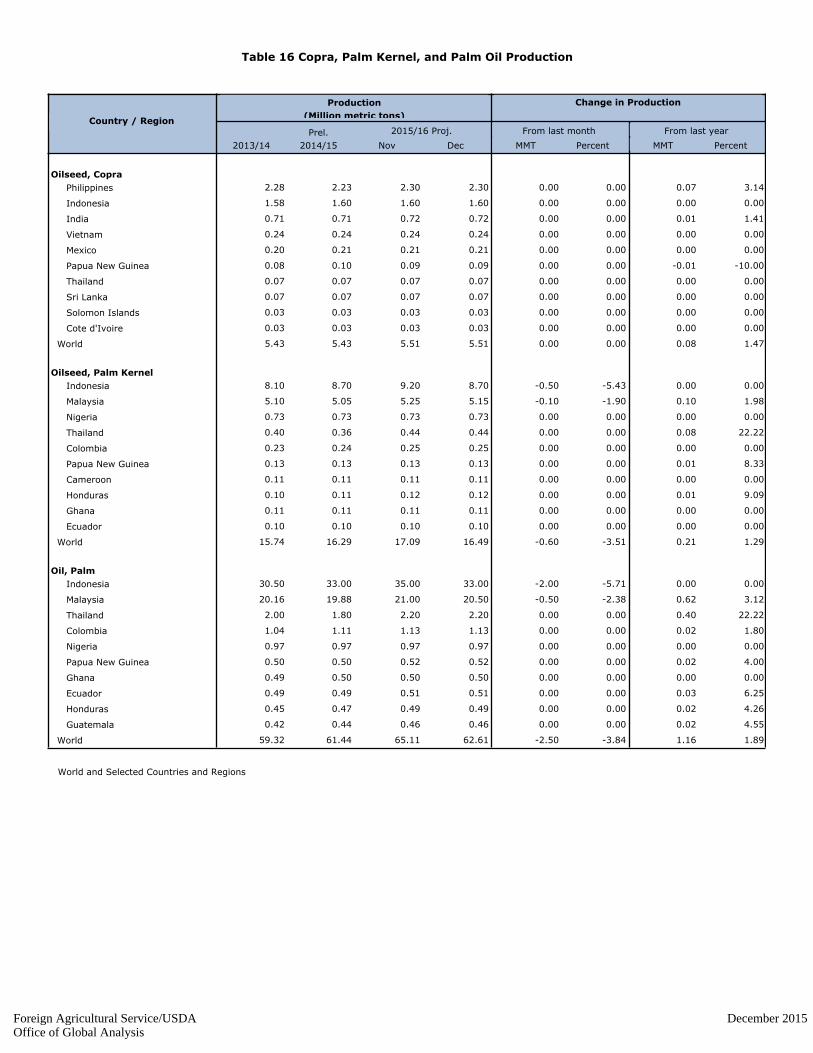
Table 16 Copra, Palm Kernel, and Palm Oil Production
Country / Region
Production
(Million metric tons)
2013/14
Prel.
2014/15
2015/16 Proj.
Nov Dec MMT Percent MMT Percent
Change in Production
From last month From last year
Oilseed, Copra
0.00 0.00 0.07 3.14 Philippines 2.28 2.302.302.23
0.00 0.00 0.00 0.00 Indonesia 1.58 1.601.601.60
0.00 0.00 0.01 1.41 India 0.71 0.720.720.71
0.00 0.00 0.00 0.00 Vietnam 0.24 0.240.240.24
0.00 0.00 0.00 0.00 Mexico 0.20 0.210.210.21
0.00 0.00 -0.01 -10.00 Papua New Guinea 0.08 0.090.090.10
0.00 0.00 0.00 0.00 Thailand 0.07 0.070.070.07
0.00 0.00 0.00 0.00 Sri Lanka 0.07 0.070.070.07
0.00 0.00 0.00 0.00 Solomon Islands 0.03 0.030.030.03
0.00 0.00 0.00 0.00 Cote d'Ivoire 0.03 0.030.030.03
0.00 0.00 0.08 1.47 World 5.43 5.515.515.43
Oilseed, Palm Kernel
-0.50 -5.43 0.00 0.00 Indonesia 8.10 8.709.208.70
-0.10 -1.90 0.10 1.98 Malaysia 5.10 5.155.255.05
0.00 0.00 0.00 0.00 Nigeria 0.73 0.730.730.73
0.00 0.00 0.08 22.22 Thailand 0.40 0.440.440.36
0.00 0.00 0.00 0.00 Colombia 0.23 0.250.250.24
0.00 0.00 0.01 8.33 Papua New Guinea 0.13 0.130.130.13
0.00 0.00 0.00 0.00 Cameroon 0.11 0.110.110.11
0.00 0.00 0.01 9.09 Honduras 0.10 0.120.120.11
0.00 0.00 0.00 0.00 Ghana 0.11 0.110.110.11
0.00 0.00 0.00 0.00 Ecuador 0.10 0.100.100.10
-0.60 -3.51 0.21 1.29 World 15.74 16.4917.0916.29
Oil, Palm
-2.00 -5.71 0.00 0.00 Indonesia 30.50 33.0035.0033.00
-0.50 -2.38 0.62 3.12 Malaysia 20.16 20.5021.0019.88
0.00 0.00 0.40 22.22 Thailand 2.00 2.202.201.80
0.00 0.00 0.02 1.80 Colombia 1.04 1.131.131.11
0.00 0.00 0.00 0.00 Nigeria 0.97 0.970.970.97
0.00 0.00 0.02 4.00 Papua New Guinea 0.50 0.520.520.50
0.00 0.00 0.00 0.00 Ghana 0.49 0.500.500.50
0.00 0.00 0.03 6.25 Ecuador 0.49 0.510.510.49
0.00 0.00 0.02 4.26 Honduras 0.45 0.490.490.47
0.00 0.00 0.02 4.55 Guatemala 0.42 0.460.460.44
-2.50 -3.84 1.16 1.89 World 59.32 62.6165.1161.44
World and Selected Countries and Regions
Foreign Agricultural Service/USDA December 2015Office of Global Analysis

Table 17 Cotton Area, Yield, and Production
From last month From last year
MBalesPercent
Yield
(Kilograms per hectare)
Dec 2013/14 MBales
Country / Region
Area
(Million hectares)
Production
(Million 480 lb. bales)
Change in Production
2013/14
Prel.
2014/15 Nov Nov
Prel.
2014/15 Dec
Prel.
2014/15 Nov Dec Percent
2015/16 Proj.2015/16 Proj. 2015/16 Proj.
2013/14
32.79World -12.93-15.40-1.81-1.92103.7134.01 31.09 31.24 799 763 740 723 120.41 119.11 105.63
3.05United States -20.15-3.29-1.88-0.2513.033.78 3.30 3.30 921 939 877 860 12.91 16.32 13.28
29.74Total Foreign -11.78-12.11-1.81-1.6790.6830.22 27.80 27.94 787 741 723 707 107.50 102.79 92.35
none
South Asia
11.70 India -3.39-1.000.000.0028.5012.70 11.80 11.80 577 506 526 526 31.00 29.50 28.50
2.90 Pakistan -24.53-2.60-11.11-1.008.002.95 2.85 2.80 713 782 688 622 9.50 10.60 9.00
4.80China -19.00-5.70-2.80-0.7024.304.40 3.50 3.45 1,486 1,484 1,555 1,534 32.75 30.00 25.00
South America
1.12 Brazil -7.14-0.500.000.006.501.02 0.93 0.93 1,555 1,494 1,530 1,530 8.00 7.00 6.50
0.56 Argentina -9.09-0.100.000.001.000.48 0.45 0.45 474 499 484 484 1.22 1.10 1.00
0.02 Paraguay 9.380.000.000.000.040.02 0.02 0.02 381 348 381 381 0.04 0.03 0.04
Africa
0.65 Burkina -11.11-0.150.000.001.200.66 0.63 0.63 421 445 418 418 1.25 1.35 1.20
0.45 Mali 2.800.030.000.001.100.54 0.58 0.58 411 433 413 413 0.85 1.07 1.10
0.45 Cote d'Ivoire 0.000.000.000.000.860.41 0.44 0.44 382 450 423 423 0.78 0.86 0.86
0.35 Benin -13.79-0.10-3.85-0.030.630.35 0.31 0.33 358 451 457 412 0.58 0.73 0.65
0.13 Egypt -35.24-0.190.000.000.340.16 0.10 0.10 729 728 740 740 0.44 0.53 0.34
0.22 Cameroon -2.83-0.028.420.040.520.23 0.22 0.22 495 502 470 510 0.50 0.53 0.48
0.35 Tanzania -13.18-0.040.000.000.270.40 0.40 0.40 235 169 147 147 0.38 0.31 0.27
0.29 Nigeria 25.000.050.000.000.250.22 0.24 0.24 199 203 227 227 0.26 0.20 0.25
0.26 Zimbabwe 8.110.020.000.000.200.18 0.18 0.18 224 224 242 242 0.26 0.19 0.20
0.12 Ethiopia 2.170.000.000.000.190.13 0.13 0.13 308 308 315 315 0.17 0.18 0.19
Former Soviet Union - 12
1.30 Uzbekistan -5.13-0.200.000.003.701.29 1.29 1.29 687 661 627 627 4.10 3.90 3.70
0.58 Turkmenistan -8.20-0.13-8.20-0.131.400.55 0.55 0.55 587 609 604 554 1.55 1.53 1.53
0.19 Tajikistan -16.25-0.070.000.000.340.18 0.15 0.15 516 498 486 486 0.45 0.40 0.34
0.14 Kazakhstan -16.67-0.04-20.00-0.050.200.13 0.10 0.10 536 408 550 440 0.34 0.24 0.25
Middle East
0.33 Turkey -17.19-0.55-5.36-0.152.650.43 0.38 0.37 1,517 1,620 1,604 1,559 2.30 3.20 2.80
0.10 Syria -8.33-0.030.000.000.280.06 0.05 0.05 1,306 1,089 1,197 1,197 0.60 0.30 0.28
0.12 Iran 0.000.000.000.000.300.11 0.11 0.11 606 594 594 594 0.32 0.30 0.30
0.44Australia 4.350.1014.290.302.400.21 0.23 0.29 2,047 2,443 2,032 1,833 4.10 2.30 2.10
0.12Mexico -30.45-0.420.000.000.950.18 0.13 0.13 1,652 1,643 1,591 1,591 0.93 1.37 0.95
0.30Burma -5.03-0.050.000.000.850.30 0.29 0.29 646 650 649 649 0.89 0.90 0.85
1.78Others -10.93-0.461.160.043.741.96 1.76 1.94 483 466 457 420 3.95 4.20 3.70
World and Selected Countries and Regions
Foreign Agricultural Service/USDA December 2015Office of Global Analysis

TABLE 18 The table below presents a record of the differences between the December projection and the final Estimate. Using world wheat production as an example, the "root mean square error” means that chances are 2 out of 3 that the current forecast will not be above or below the final estimate by more than 0.8 percent. Chances are 9 out of 10 (90% confidence level) that the difference will not exceed 1.4 percent. The average difference between the December projection and the final estimate is 4.0 million tons, ranging from 0.4 million to 10.2 million tons. The December projection has been below the estimate 25 times and above 9 times.
RELIABILITY OF PRODUCTION PROJECTIONS 1/
COMMODITY AND REGION
Root mean square error
90 percent confidence
interval
Difference between forecast and final estimate
Average Smallest Largest
Years Below final
Above final
Percent ---Million metric tons---
WHEAT
World 0.8 1.4 4.0 0.4 10.2 25 9
U.S. 0.4 0.7 0.2 0.0 1.2 16 12
Foreign 0.9 1.6 4.0 0.4 10.3 25 9
COARSE GRAINS 2/
World 1.4 2.3 10.6 0.0 24.2 25 9
U.S. 1.4 2.3 2.4 0.0 7.5 18 16
Foreign 1.9 3.2 10.7 0.3 26.5 24 10
RICE (Milled)
World 2.0 3.4 5.6 0.0 16.2 27 7
U.S. 2.9 4.9 0.1 0.0 0.5 17 13
Foreign 2.0 3.5 5.6 0.1 16.2 28 6
SOYBEANS
World 3.9 6.6 5.1 0.1 23.8 20 14
U.S. 2.0 3.5 1.1 0.1 2.7 15 19
Foreign 6.4 10.9 5.2 0.1 25.1 17 17
COTTON ---Million 480-lb. bales---
World 3.0 5.1 2.2 0.0 6.4 19 14
U.S. 2.0 3.4 0.2 0.0 0.8 17 16
Foreign 3.6 6.1 2.2 0.0 6.7 18 15
UNITED STATES -------Million bushels-------
CORN 1.4 2.3 89 0 250 18 15
SORGHUM 4.3 7.3 16 1 53 16 18
BARLEY 1.5 2.6 4 0 24 13 10
OATS 1.2 2.0 2 0 18 7 9
1/ Marketing years 1981/82 through 2014/15. Final for grains, soybeans and cotton is defined as the first December estimate following the marketing year for 1981/82 through 2013/14, and for 2014/15 last month’s estimate. 2/ Includes corn, sorghum, barley, oats, rye, millet, and mixed grain
December 2015 Office of Global Analysis, FAS, USDA
Foreign Agricultural Service/USDA December 2015Office of Global Analysis