chickens and eggs 05/23/2016 - cornell...
TRANSCRIPT
Chickens and Eggs
ISSN: 1948-9064
Released May 23, 2016, by the National Agricultural Statistics Service (NASS), Agricultural Statistics Board, United States Department of
Agriculture (USDA).
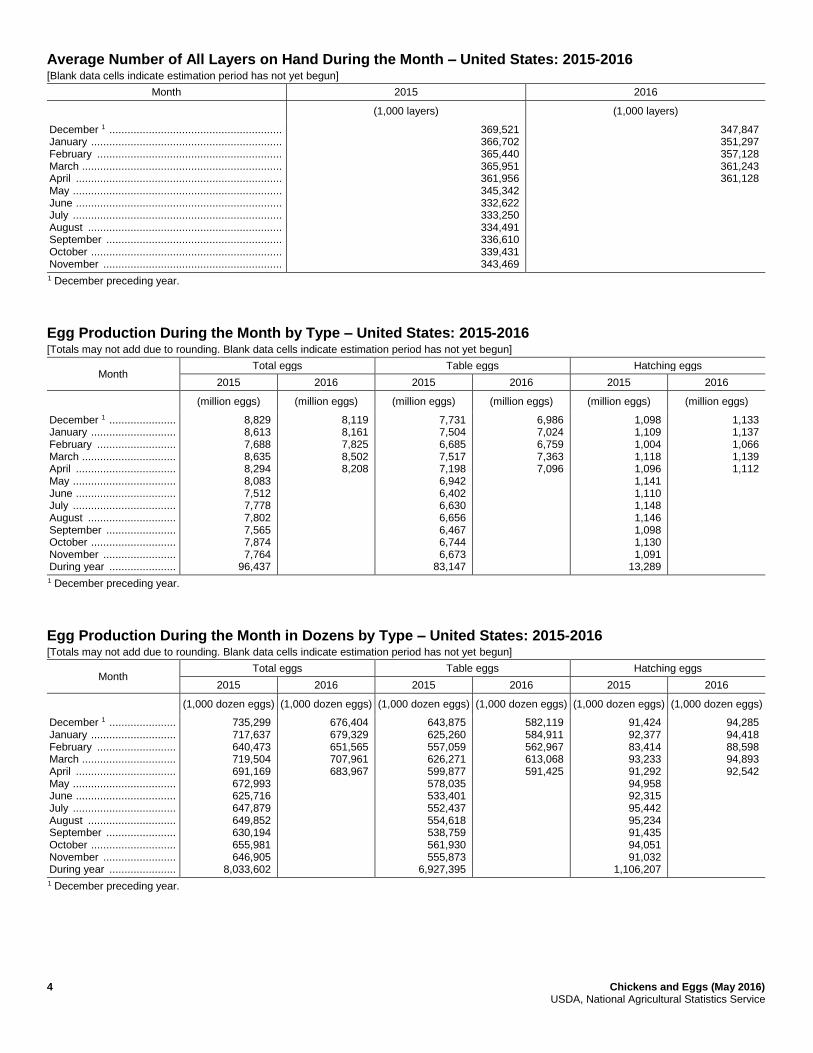
April Egg Production Down 1 Percent United States egg production totaled 8.21 billion during April 2016, down 1 percent from last year. Production included
7.10 billion table eggs, and 1.11 billion hatching eggs, of which 1.02 billion were broiler-type and 93 million were egg-
type. The total number of layers during April 2016 averaged 361 million, down slightly from last year. April egg
production per 100 layers was 2,273 eggs, down 1 percent from April 2015.
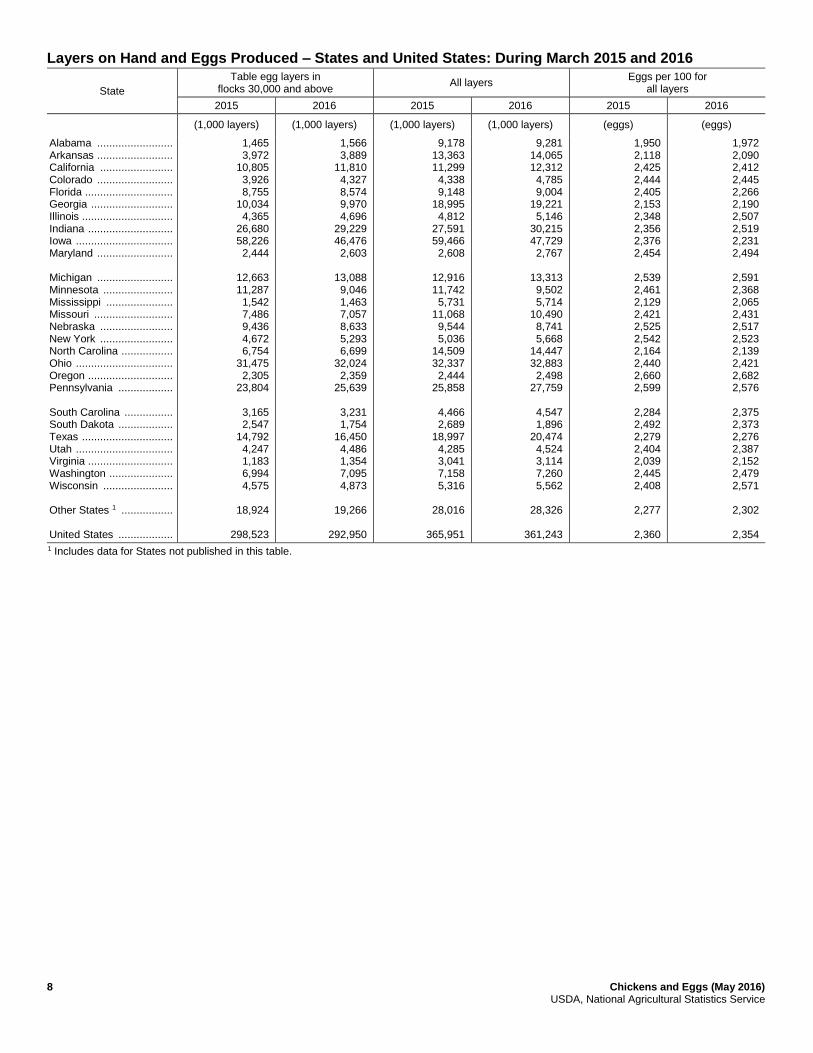
All layers in the United States on May 1, 2016 totaled 361 million, up 1 percent from last year. The 361 million layers
consisted of 302 million layers producing table or market type eggs, 54.8 million layers producing broiler-type hatching
eggs, and 3.95 million layers producing egg-type hatching eggs. Rate of lay per day on May 1, 2016, averaged 76.0 eggs
per 100 layers, up slightly from May 1, 2015.
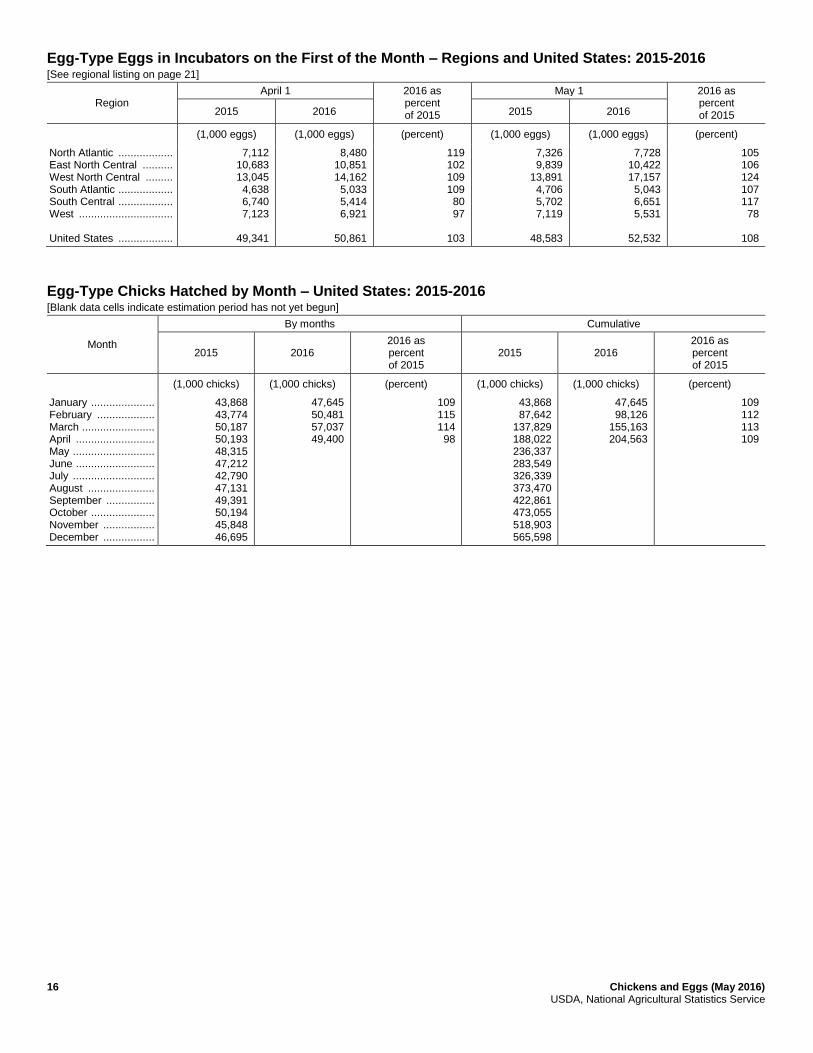
Egg-Type Chicks Hatched Down 2 Percent Egg-type chicks hatched during April 2016 totaled 49.4 million, down 2 percent from April 2015. Eggs in incubators
totaled 52.5 million on May 1, 2016, up 8 percent from a year ago.
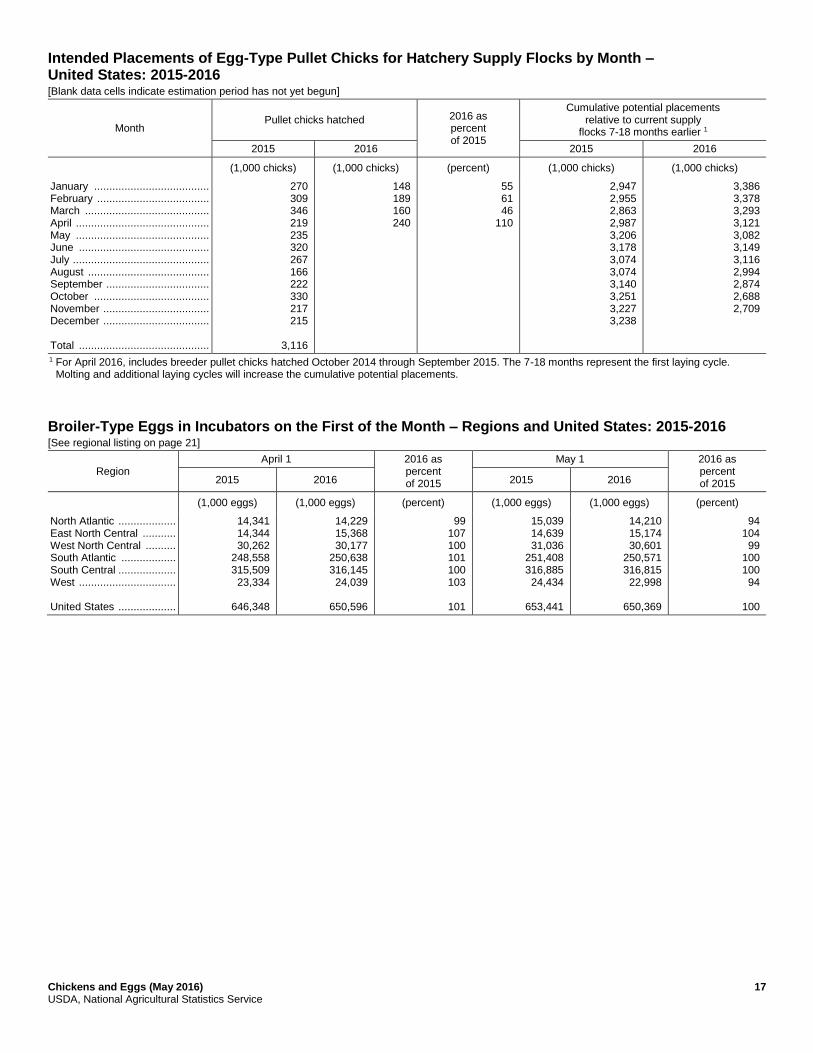
Domestic placements of egg-type pullet chicks for future hatchery supply flocks by leading breeders totaled 240 thousand
during April 2016, up 10 percent from April 2015.
Broiler-Type Chicks Hatched Up 1 Percent Broiler-type chicks hatched during April 2016 totaled 781 million, up 1 percent from April 2015. Eggs in incubators
totaled 650 million on May 1, 2016, down slightly from a year ago.
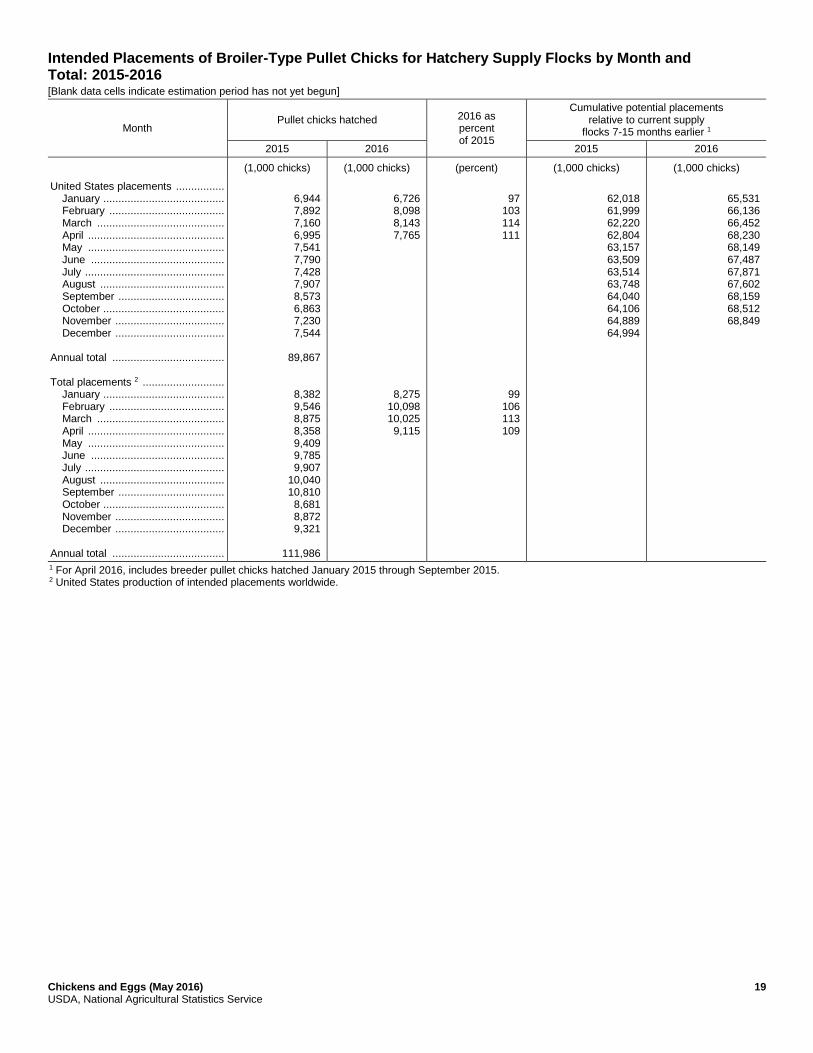
Leading breeders placed 7.77 million broiler-type pullet chicks for future domestic hatchery supply flocks during April
2016, up 11 percent from April 2015.

2 Chickens and Eggs (May 2016) USDA, National Agricultural Statistics Service
This page intentionally left blank.

Chickens and Eggs (May 2016) 3 USDA, National Agricultural Statistics Service
Contents
Average Number of All Layers on Hand During the Month – United States: 2015-2016 ...................................................... 4
Egg Production During the Month by Type – United States: 2015-2016 ............................................................................... 4
Egg Production During the Month in Dozens by Type – United States: 2015-2016 .............................................................. 4
Average Number of Layers During the Month – United States .............................................................................................. 5
All Egg Production During the Month – United States .......................................................................................................... 5
Layers on Hand and Eggs Produced by Type and Molt – United States: March-April 2015 and 2016 ................................. 6
Layers on Hand and Eggs Produced by Type and Molt – United States: April-May 2015 and 2016 .................................... 7
Layers on Hand and Eggs Produced – States and United States: During March 2015 and 2016 ........................................... 8
Layers on Hand and Eggs Produced – States and United States: During April 2015 and 2016 ............................................. 9
Egg Production by Type – States and United States: March 2015 and 2016 ........................................................................ 10
Egg Production by Type – States and United States: April 2015 and 2016 .......................................................................... 11
Egg Production in Dozens by Type – States and United States: March 2015 and 2016....................................................... 12
Egg Production in Dozens by Type – States and United States: April 2015 and 2016......................................................... 13
Molted as Percent of All Layers by Month – United States: 2015-2016 .............................................................................. 14
Molted as Percent of All Layers – States and United States: May 1, 2015 and 2016 ........................................................... 14
Hatchery Production – United States: 2015 and 2016 .......................................................................................................... 15
Egg-Type Eggs in Incubators on the First of the Month – Regions and United States: 2015-2016 ..................................... 16
Egg-Type Chicks Hatched by Month – United States: 2015-2016 ....................................................................................... 16
Intended Placements of Egg-Type Pullet Chicks for Hatchery Supply Flocks by Month –
United States: 2015-2016 ...................................................................................................................................................... 17
Broiler-Type Eggs in Incubators on the First of the Month – Regions and United States: 2015-2016 ................................ 17
Broiler-Type Chicks Hatched – States and United States: April 2015 and 2016.................................................................. 18
Broiler-Type Chicks Hatched by Month – United States: 2015-2016 .................................................................................. 18
Intended Placements of Broiler-Type Pullet Chicks for Hatchery Supply Flocks by Month and Total: 2015-2016 ............ 19
Statistical Methodology ........................................................................................................................................................ 20
Regional Listing .................................................................................................................................................................... 21
Terms and Definitions of Chickens and Eggs Estimates ...................................................................................................... 21
Information Contacts ............................................................................................................................................................ 22
4 Chickens and Eggs (May 2016) USDA, National Agricultural Statistics Service
Average Number of All Layers on Hand During the Month – United States: 2015-2016 [Blank data cells indicate estimation period has not yet begun]
Month 2015 2016
(1,000 layers) (1,000 layers)
December 1 ......................................................... January ............................................................... February ............................................................. March .................................................................. April .................................................................... May ..................................................................... June .................................................................... July ..................................................................... August ................................................................ September .......................................................... October ............................................................... November ...........................................................
369,521 366,702 365,440 365,951 361,956 345,342 332,622 333,250 334,491 336,610 339,431 343,469
347,847 351,297 357,128 361,243 361,128
1 December preceding year.
Egg Production During the Month by Type – United States: 2015-2016 [Totals may not add due to rounding. Blank data cells indicate estimation period has not yet begun]
Month Total eggs Table eggs Hatching eggs
2015 2016 2015 2016 2015 2016
(million eggs) (million eggs) (million eggs) (million eggs) (million eggs) (million eggs)
December 1 ...................... January ............................ February .......................... March ............................... April ................................. May .................................. June ................................. July .................................. August ............................. September ....................... October ............................ November ........................ During year ......................
8,829 8,613 7,688 8,635 8,294 8,083 7,512 7,778 7,802 7,565 7,874 7,764
96,437
8,119 8,161 7,825 8,502 8,208
7,731 7,504 6,685 7,517 7,198 6,942 6,402 6,630 6,656 6,467 6,744 6,673
83,147
6,986 7,024 6,759 7,363 7,096
1,098 1,109 1,004 1,118 1,096 1,141 1,110 1,148 1,146 1,098 1,130 1,091
13,289
1,133 1,137 1,066 1,139 1,112
1 December preceding year.
Egg Production During the Month in Dozens by Type – United States: 2015-2016 [Totals may not add due to rounding. Blank data cells indicate estimation period has not yet begun]
Month Total eggs Table eggs Hatching eggs
2015 2016 2015 2016 2015 2016
(1,000 dozen eggs) (1,000 dozen eggs) (1,000 dozen eggs) (1,000 dozen eggs) (1,000 dozen eggs) (1,000 dozen eggs)
December 1 ...................... January ............................ February .......................... March ............................... April ................................. May .................................. June ................................. July .................................. August ............................. September ....................... October ............................ November ........................ During year ......................
735,299 717,637 640,473 719,504 691,169 672,993 625,716 647,879 649,852 630,194 655,981 646,905
8,033,602
676,404 679,329 651,565 707,961 683,967
643,875 625,260 557,059 626,271 599,877 578,035 533,401 552,437 554,618 538,759 561,930 555,873
6,927,395
582,119 584,911 562,967 613,068 591,425
91,424 92,377 83,414 93,233 91,292 94,958 92,315 95,442 95,234 91,435 94,051 91,032
1,106,207
94,285 94,418 88,598 94,893 92,542
1 December preceding year.

Chickens and Eggs (May 2016) 5 USDA, National Agricultural Statistics Service
325
330
335
340
345
350
355
360
365
370
Dec Jan Feb Mar Apr May Jun Jul Aug Sep Oct Nov
Million layers
Average Layers During the Month – United States
2015 2016
7,300
7,500
7,700
7,900
8,100
8,300
8,500
8,700
8,900
Dec Jan Feb Mar Apr May Jun Jul Aug Sep Oct Nov
Million eggs
All Egg Production During the Month – United States
2015 2016
December previous year
December previous year

6 Chickens and Eggs (May 2016) USDA, National Agricultural Statistics Service
Layers on Hand and Eggs Produced by Type and Molt – United States: March-April 2015 and 2016 [Totals may not add due to rounding]
Item 2015 2016 2016 as percent of 2015
Layers during March All layers ................................................................................................................ 1,000 Table egg type ................................................................................................... 1,000 Hatching egg type .............................................................................................. 1,000 Broiler-type hatching ...................................................................................... 1,000 Egg-type hatching .......................................................................................... 1,000 Eggs per 100 layers during March All layers ............................................................................................................ number Table egg type ............................................................................................... number Hatching egg type .......................................................................................... number Broiler-type hatching .................................................................................. number Egg-type hatching ...................................................................................... number Eggs produced during March All layers .............................................................................................................. million Table egg type ................................................................................................. million Hatching egg type ............................................................................................ million Broiler-type hatching .................................................................................... million Egg-type hatching ........................................................................................ million Eggs produced during March All layers ..................................................................................................... 1,000 dozen Table egg type ........................................................................................ 1,000 dozen Hatching egg type ................................................................................... 1,000 dozen Broiler-type hatching ........................................................................... 1,000 dozen Egg-type hatching ............................................................................... 1,000 dozen Layers on April 1 All layers ................................................................................................................ 1,000 Table egg type ................................................................................................... 1,000 Hatching egg type .............................................................................................. 1,000 Broiler-type hatching ...................................................................................... 1,000 Egg-type hatching .......................................................................................... 1,000 Eggs per 100 layers on April 1 All layers ............................................................................................................ number Table egg type ............................................................................................... number Hatching egg type .......................................................................................... number Broiler-type hatching .................................................................................. number Egg-type hatching ...................................................................................... number Molted layers on April 1 Being molted ....................................................................................................... percent Molt completed .................................................................................................... percent Layers sold for slaughter during March ...................................................................... 1,000 Layers rendered, died, destroyed, composted or disappeared for any reason during March ............................................................ 1,000 Pullets on April 1 ........................................................................................................ 1,000 Pullets added during March 1 ..................................................................................... 1,000
365,951 308,050 57,901 54,375 3,526
2,360 2,440 1,931 1,891 2,552
8,635 7,517 1,118 1,028
90
719,504 626,271 93,233 85,691 7,542
366,022 307,585 58,437 54,913 3,524
76.9 79.6 62.3 61.0 83.6
2.1 17.7
17,259
7,762
109,386
25,780
361,243 302,464 58,779 55,097 3,682
2,354 2,434 1,938 1,902 2,471
8,502 7,363 1,139 1,048
91
707,961 613,068 94,893 87,301 7,592
361,513 302,816 58,697 54,954 3,743
75.5 78.0 62.4 61.3 78.4
2.9 19.2
18,023
7,921
117,033
25,676
99 98
102 101 104
100 100 100 101 97
98 98
102 102 101
98 98
102 102 101
99 98
100 100 106
98 98
100 100 94
138 108
104
102
107
100
1 Pullet chicks less than 3 days old added to pullet flocks.

Chickens and Eggs (May 2016) 7 USDA, National Agricultural Statistics Service
Layers on Hand and Eggs Produced by Type and Molt – United States: April-May 2015 and 2016 [Totals may not add due to rounding]
Item 2015 2016 2016 as percent of 2015
Layers during April All layers ............................................................................................................... 1,000 Table egg type .................................................................................................. 1,000 Hatching egg type ............................................................................................. 1,000 Broiler-type hatching ..................................................................................... 1,000 Egg-type hatching ......................................................................................... 1,000 Eggs per 100 layers during April All layers ............................................................................................................ number Table egg type ............................................................................................... number Hatching egg type .......................................................................................... number Broiler-type hatching .................................................................................. number Egg-type hatching ...................................................................................... number Eggs produced during April All layers .............................................................................................................. million Table egg type ................................................................................................. million Hatching egg type ............................................................................................ million Broiler-type hatching .................................................................................... million Egg-type hatching ........................................................................................ million Eggs produced during April All layers .................................................................................................... 1,000 dozen Table egg type ....................................................................................... 1,000 dozen Hatching egg type .................................................................................. 1,000 dozen Broiler-type hatching .......................................................................... 1,000 dozen Egg-type hatching .............................................................................. 1,000 dozen Layers on May 1 All layers ............................................................................................................... 1,000 Table egg type .................................................................................................. 1,000 Hatching egg type ............................................................................................. 1,000 Broiler-type hatching ..................................................................................... 1,000 Egg-type hatching ......................................................................................... 1,000 Eggs per 100 layers on May 1 All layers ............................................................................................................ number Table egg type ............................................................................................... number Hatching egg type .......................................................................................... number Broiler-type hatching .................................................................................. number Egg-type hatching ...................................................................................... number Molted layers on May 1 Being molted ...................................................................................................... percent Molt completed .................................................................................................. percent Layers sold for slaughter during April ........................................................................ 1,000 Layers rendered, died, destroyed, composted or disappeared for any reason during April ............................................................. 1,000 Pullets on May 1 ....................................................................................................... 1,000 Pullets added during April 1 ....................................................................................... 1,000
361,956 303,568 58,388 54,967 3,421
2,291 2,371 1,877 1,839 2,485
8,294 7,198 1,096 1,011
85
691,169 599,877 91,292 84,159 7,133
357,858 299,536 58,322 55,011 3,311
75.8 78.4 62.7 61.5 83.1
3.1 17.4
16,196
14,634
111,468
26,333
361,128 302,401 58,727 54,876 3,851
2,273 2,347 1,894 1,857 2,415
8,208 7,096 1,112 1,019
93
683,967 591,425 92,542 84,826 7,716
360,712 301,973 58,739 54,785 3,954
76.0 78.4 63.6 62.3 81.6
2.7 18.7
16,257
8,054
118,595
26,362
100 100 101 100 113
99 99
101 101 97
99 99
101 101 109
99 99
101 101 108
101 101 101 100 119
100 100 101 101 98
87 107
100
55
106
100
1 Pullet chicks less than 3 days old added to pullet flocks.
8 Chickens and Eggs (May 2016) USDA, National Agricultural Statistics Service
Layers on Hand and Eggs Produced – States and United States: During March 2015 and 2016
State
Table egg layers in flocks 30,000 and above
All layers Eggs per 100 for
all layers
2015 2016 2015 2016 2015 2016
(1,000 layers) (1,000 layers) (1,000 layers) (1,000 layers) (eggs) (eggs)
Alabama ......................... Arkansas ......................... California ........................ Colorado ......................... Florida ............................. Georgia ........................... Illinois .............................. Indiana ............................ Iowa ................................ Maryland ......................... Michigan ......................... Minnesota ....................... Mississippi ...................... Missouri .......................... Nebraska ........................ New York ........................ North Carolina ................. Ohio ................................ Oregon ............................ Pennsylvania .................. South Carolina ................ South Dakota .................. Texas .............................. Utah ................................ Virginia ............................ Washington ..................... Wisconsin ....................... Other States 1 ................. United States ..................
1,465 3,972
10,805 3,926 8,755
10,034 4,365
26,680 58,226 2,444
12,663 11,287 1,542 7,486 9,436 4,672 6,754
31,475 2,305
23,804
3,165 2,547
14,792 4,247 1,183 6,994 4,575
18,924
298,523
1,566 3,889
11,810 4,327 8,574 9,970 4,696
29,229 46,476 2,603
13,088 9,046 1,463 7,057 8,633 5,293 6,699
32,024 2,359
25,639
3,231 1,754
16,450 4,486 1,354 7,095 4,873
19,266
292,950
9,178 13,363 11,299 4,338 9,148
18,995 4,812
27,591 59,466 2,608
12,916 11,742 5,731
11,068 9,544 5,036
14,509 32,337 2,444
25,858
4,466 2,689
18,997 4,285 3,041 7,158 5,316
28,016
365,951
9,281 14,065 12,312 4,785 9,004
19,221 5,146
30,215 47,729 2,767
13,313 9,502 5,714
10,490 8,741 5,668
14,447 32,883 2,498
27,759
4,547 1,896
20,474 4,524 3,114 7,260 5,562
28,326
361,243
1,950 2,118 2,425 2,444 2,405 2,153 2,348 2,356 2,376 2,454
2,539 2,461 2,129 2,421 2,525 2,542 2,164 2,440 2,660 2,599
2,284 2,492 2,279 2,404 2,039 2,445 2,408
2,277
2,360
1,972 2,090 2,412 2,445 2,266 2,190 2,507 2,519 2,231 2,494
2,591 2,368 2,065 2,431 2,517 2,523 2,139 2,421 2,682 2,576
2,375 2,373 2,276 2,387 2,152 2,479 2,571
2,302
2,354
1 Includes data for States not published in this table.

Chickens and Eggs (May 2016) 9 USDA, National Agricultural Statistics Service
Layers on Hand and Eggs Produced – States and United States: During April 2015 and 2016
State
Table egg layers in flocks 30,000 and above
All layers Eggs per 100 for
all layers
2015 2016 2015 2016 2015 2016
(1,000 layers) (1,000 layers) (1,000 layers) (1,000 layers) (eggs) (eggs)
Alabama .......................... Arkansas ......................... California ......................... Colorado .......................... Florida ............................. Georgia ........................... Illinois .............................. Indiana ............................ Iowa ................................. Maryland .......................... Michigan .......................... Minnesota ........................ Mississippi ....................... Missouri ........................... Nebraska ......................... New York ......................... North Carolina ................. Ohio ................................. Oregon ............................ Pennsylvania ................... South Carolina ................. South Dakota ................... Texas .............................. Utah ................................. Virginia ............................ Washington ..................... Wisconsin ........................ Other States 1 .................. United States ...................
1,426 3,935
10,944 4,172 8,688 9,785 4,403
26,468 54,876 2,278
12,457 11,175 1,516 7,526 9,353 4,528 6,417
32,026 2,199
23,702
3,089 2,518
14,845 4,226 1,269 6,881 4,375
18,964
294,041
1,521 3,881
11,848 4,339 8,167 9,824 5,003
29,271 47,888 2,595
12,893 9,311 1,432 6,901 8,836 5,303 6,437
31,494 2,319
25,493
3,232 1,836
16,404 4,357 1,304 6,930 4,926
19,142
292,887
9,462 13,573 11,437 4,621 9,052
18,855 4,862
27,383 56,106 2,441
12,710 11,629 5,705
11,085 9,461 4,889
14,162 32,887 2,338
25,699
4,417 2,660
18,892 4,264 3,123 7,046 5,114
28,083
361,956
9,237 13,983 12,354 4,769 8,615
19,110 5,473
30,308 49,242 2,766
13,130 9,766 5,704
10,323 8,944 5,698
14,096 32,353 2,458
27,632
4,537 1,978
20,362 4,395 3,044 7,095 5,615
28,141
361,128
1,860 2,063 2,352 2,316 2,254 2,090 2,283 2,326 2,319 2,376
2,478 2,408 2,033 2,346 2,473 2,454 2,125 2,344 2,524 2,537
2,151 2,444 2,213 2,298 1,921 2,455 2,327
2,211
2,291
1,895 2,031 2,356 2,453 2,159 2,088 2,284 2,412 2,203 2,386
2,544 2,253 1,981 2,393 2,449 2,404 2,093 2,321 2,563 2,508
2,204 2,376 2,185 2,344 2,070 2,297 2,351
2,217
2,273
1 Includes data for States not published in this table.

10 Chickens and Eggs (May 2016) USDA, National Agricultural Statistics Service
Egg Production by Type – States and United States: March 2015 and 2016 [Totals may not add due to rounding. Data by type of flock not shown for some States to avoid disclosing individual operations, data included in United States totals]
State Total production Table eggs Hatching eggs
2015 2016 2015 2016 2015 2016
(million eggs) (million eggs) (million eggs) (million eggs) (million eggs) (million eggs)
Alabama ........................... Arkansas ........................... California .......................... Colorado ........................... Florida ............................... Georgia ............................. Illinois ................................ Indiana .............................. Iowa .................................. Maryland ........................... Michigan ........................... Minnesota ......................... Mississippi ........................ Missouri ............................ Nebraska .......................... New York .......................... North Carolina ................... Ohio .................................. Oregon .............................. Pennsylvania .................... South Carolina .................. South Dakota .................... Texas ................................ Utah .................................. Virginia .............................. Washington ....................... Wisconsin ......................... Other States 1 ................... United States ....................
179 283 274 106 220 409 113 650
1,413 64
328 289 122 268 241 128 314 789 65
672
102 67
433 103 62
175 128
638
8,635
183 294 297 117 204 421 129 761
1,065 69
345 225 118 255 220 143 309 796 67
715
108 45
466 108 67
180 143
652
8,502
37 108 (D) (D) 216 238 109 632
1,394 63
(D) 283 41
(D) 241 (D) 170 (D) 65
641
78 67
(D) 103 29
(D) (D)
502
7,517
40 101 (D) (D) 199 244 124 743
1,048 68
(D) 218 36
(D) 220 (D) 166 (D) 67
684
84 45
(D) 108 34
(D) (D)
515
7,363
142 175 (D) (D)
4 171
4 18 19 1
(D) 6
81 (D)
- (D) 144 (D)
- 31
24
- (D)
- 33
(D) (D)
136
1,118
143 193 (D) (D)
5 177
5 18 17 1
(D) 7
82 (D)
- (D) 143 (D)
- 31
24
- (D)
- 33
(D) (D)
137
1,139
- Represents zero. (D) Withheld to avoid disclosing data for individual operations. 1 Not published separately to avoid disclosing individual operations.

Chickens and Eggs (May 2016) 11 USDA, National Agricultural Statistics Service
Egg Production by Type – States and United States: April 2015 and 2016 [Totals may not add due to rounding. Data by type of flock not shown for some States to avoid disclosing individual operations, data included in United States totals]
State Total production Table eggs Hatching eggs
2015 2016 2015 2016 2015 2016
(million eggs) (million eggs) (million eggs) (million eggs) (million eggs) (million eggs)
Alabama ............................ Arkansas ........................... California ........................... Colorado ............................ Florida ............................... Georgia ............................. Illinois ................................ Indiana .............................. Iowa ................................... Maryland ............................ Michigan ............................ Minnesota .......................... Mississippi ......................... Missouri ............................. Nebraska ........................... New York ........................... North Carolina ................... Ohio ................................... Oregon .............................. Pennsylvania ..................... South Carolina ................... South Dakota ..................... Texas ................................ Utah ................................... Virginia .............................. Washington ....................... Wisconsin .......................... Other States 1 .................... United States .....................
176 280 269 107 204 394 111 637
1,301 58
315 280 116 260 234 120 301 771 59
652
95 65
418 98 60
173 119
621
8,294
175 284 291 117 186 399 125 731
1,085 66
334 220 113 247 219 137 295 751 63
693
100 47
445 103 63
163 132
624
8,208
34 104 (D) (D) 200 225 107 620
1,282 57
(D) 274 37
(D) 234 (D) 162 (D) 59
623
72 65
(D) 98 28
(D) (D)
488
7,198
38 96
(D) (D) 181 225 120 712
1,066 65
(D) 214 34
(D) 219 (D) 156 (D) 63
660
77 47
(D) 103 32
(D) (D)
493
7,096
142 176 (D) (D)
4 169
4 17 19 1
(D) 6
79 (D)
- (D) 139 (D)
- 29
23
- (D)
- 32
(D) (D)
133
1,096
137 188 (D) (D)
5 174
5 19 19 1
(D) 6
79 (D)
- (D) 139 (D)
- 33
23
- (D)
- 31
(D) (D)
131
1,112
- Represents zero. (D) Withheld to avoid disclosing data for individual operations. 1 Not published separately to avoid disclosing individual operations.

12 Chickens and Eggs (May 2016) USDA, National Agricultural Statistics Service
Egg Production in Dozens by Type – States and United States: March 2015 and 2016 [Totals may not add due to rounding. Data by type of flock not shown for some States to avoid disclosing individual operations, data included in United States totals]
State Total production Table eggs Hatching eggs
2015 2016 2015 2016 2015 2016
(1,000 dozen eggs) (1,000 dozen eggs) (1,000 dozen eggs) (1,000 dozen eggs) (1,000 dozen eggs) (1,000 dozen eggs)
Alabama ......................... Arkansas ......................... California ........................ Colorado ......................... Florida ............................. Georgia ........................... Illinois .............................. Indiana ............................ Iowa ................................ Maryland ......................... Michigan ......................... Minnesota ....................... Mississippi ...................... Missouri .......................... Nebraska ........................ New York ........................ North Carolina ................. Ohio ................................ Oregon ............................ Pennsylvania .................. South Carolina ................ South Dakota .................. Texas .............................. Utah ................................ Virginia ............................ Washington ..................... Wisconsin ....................... Other States 1 ................. United States ..................
14,908 23,575 22,759 8,884
18,341 34,134 9,417
54,175 117,800
5,367
27,358 24,100 10,100 22,267 20,117 10,642 26,142 65,733 5,417
55,983
8,492 5,567
36,058 8,608 5,200
14,592 10,708
53,060
719,504
15,217 24,484 24,741 9,758
17,034 35,084 10,692 63,408 88,734 5,733
28,750 18,709 9,791
21,225 18,292 11,958 25,775 66,333 5,558
59,625
8,983 3,733
38,833 9,033 5,534
15,017 11,917
54,010
707,961
3,075 8,967
(D) (D)
17,983 19,867 9,050
52,683 116,200
5,250
(D) 23,567 3,392
(D) 20,117
(D) 14,167
(D) 5,417
53,375
6,525 5,567
(D) 8,608 2,442
(D) (D)
41,718
626,271
3,300 8,392
(D) (D)
16,617 20,342 10,317 61,875 87,292 5,625
(D)
18,167 2,958
(D) 18,292
(D) 13,825
(D) 5,558
57,025
7,025 3,733
(D) 9,033 2,817
(D) (D)
42,676
613,068
11,833 14,608
(D) (D) 358
14,267 367
1,492 1,600
117
(D) 533
6,708 (D)
- (D)
11,975 (D)
- 2,608
1,967
- (D)
- 2,758
(D) (D)
11,342
93,233
11,917 16,092
(D) (D) 417
14,742 375
1,533 1,442
108
(D) 542
6,833 (D)
- (D)
11,950 (D)
- 2,600
1,958
- (D)
- 2,717
(D) (D)
11,334
94,893
- Represents zero. (D) Withheld to avoid disclosing data for individual operations. 1 Not published separately to avoid disclosing individual operations.

Chickens and Eggs (May 2016) 13 USDA, National Agricultural Statistics Service
Egg Production in Dozens by Type – States and United States: April 2015 and 2016 [Totals may not add due to rounding. Data by type of flock not shown for some States to avoid disclosing individual operations, data included in United States totals]
State Total production Table eggs Hatching eggs
2015 2016 2015 2016 2015 2016
(1,000 dozen eggs) (1,000 dozen eggs) (1,000 dozen eggs) (1,000 dozen eggs) (1,000 dozen eggs) (1,000 dozen eggs)
Alabama .......................... Arkansas ......................... California ......................... Colorado .......................... Florida ............................. Georgia ........................... Illinois .............................. Indiana ............................ Iowa ................................. Maryland .......................... Michigan .......................... Minnesota ........................ Mississippi ....................... Missouri ........................... Nebraska ......................... New York ......................... North Carolina ................. Ohio ................................. Oregon ............................ Pennsylvania ................... South Carolina ................. South Dakota ................... Texas .............................. Utah ................................. Virginia ............................ Washington ..................... Wisconsin ........................ Other States 1 .................. United States ...................
14,667 23,266 22,433 8,908
17,042 32,800 9,309
53,092 108,408
4,875
26,250 23,316 9,634
21,650 19,492 9,925
25,067 64,292 4,917
54,375
7,883 5,425
34,841 8,175 5,017
14,392 9,892
51,826
691,169
14,542 23,667 24,250 9,759
15,525 33,266 10,416 60,867 90,367 5,508
27,759 18,317 9,450
20,559 18,242 11,366 24,541 62,600 5,258
57,758
8,333 3,950
37,075 8,617 5,259
13,600 11,025
52,091
683,967
2,850 8,633
(D) (D)
16,675 18,758 8,942
51,650 106,850
4,758
(D) 22,808 3,067
(D) 19,492
(D) 13,475
(D) 4,917
51,925
6,000 5,425
(D) 8,175 2,350
(D) (D)
40,843
599,877
3,125 7,967
(D) (D)
15,092 18,758 10,033 59,300 88,825 5,400
(D)
17,800 2,842
(D) 18,242
(D) 12,983
(D) 5,258
55,008
6,408 3,950
(D) 8,617 2,642
(D) (D)
41,217
591,425
11,817 14,633
(D) (D) 367
14,042 367
1,442 1,558
117
(D) 508
6,567 (D)
- (D)
11,592 (D)
- 2,450
1,883
- (D)
- 2,667
(D) (D)
10,983
91,292
11,417 15,700
(D) (D) 433
14,508 383
1,567 1,542
108
(D) 517
6,608 (D)
- (D)
11,558 (D)
- 2,750
1,925
- (D)
- 2,617
(D) (D)
10,874
92,542
- Represents zero. (D) Withheld to avoid disclosing data for individual operations. 1 Not published separately to avoid disclosing individual operations.

14 Chickens and Eggs (May 2016) USDA, National Agricultural Statistics Service
Molted as Percent of All Layers by Month – United States: 2015-2016 [As of the first of the month. Blank data cells indicate estimation period has not yet begun]
Month Being molted Molt completed
2015 2016 2015 2016
(percent) (percent) (percent) (percent)
January ................................................. February ............................................... March .................................................... April ...................................................... May ....................................................... June ...................................................... July ....................................................... August .................................................. September ............................................ October ................................................. November ............................................. December .............................................
2.1 3.3 1.9 2.1 3.1 2.4 3.0 2.7 3.4 3.4 3.4 1.8
2.5 2.9 1.5 2.9 2.7
17.7 17.5 18.5 17.7 17.4 17.2 18.2 19.2 19.7 20.5 21.3 21.9
21.3 20.6 20.7 19.2 18.7
Molted as Percent of All Layers – States and United States: May 1, 2015 and 2016 [As of the first of the month]
State Being molted Molt completed
2015 2016 2015 2016
(percent) (percent) (percent) (percent)
Alabama ............................................... Arkansas ............................................... California .............................................. Colorado ............................................... Florida ................................................... Georgia ................................................. Illinois .................................................... Indiana .................................................. Iowa ...................................................... Maryland ............................................... Michigan ............................................... Minnesota ............................................. Mississippi ............................................ Missouri ................................................ Nebraska .............................................. New York .............................................. North Carolina ....................................... Ohio ...................................................... Oregon .................................................. Pennsylvania ........................................ South Carolina ...................................... South Dakota ........................................ Texas .................................................... Utah ...................................................... Virginia .................................................. Washington ........................................... Wisconsin ............................................. Other States 1 ....................................... United States ........................................
0.5 1.5 4.5 2.0
10.0 2.0 7.5 3.5 4.5 3.5
3.0 2.0 1.0 2.5
- 3.5 3.0 3.5 4.5 0.5
2.5
- 2.5
10.5 6.5 5.0 2.5
2.5
3.1
1.5 2.0 4.5 3.0
10.0 2.5
- 3.0 1.0
-
- 3.5 2.0
- 3.0 1.5
- 6.0 6.5 1.0
4.5 5.0 5.5 4.5 3.0 5.0
-
2.9
2.7
6.5 15.0 22.0 11.5 40.0 15.5 22.5 26.0 26.0
-
10.3 17.0 13.5 16.0 1.5 0.5
12.0 20.0 19.5 0.5
6.0
12.0 29.5 33.0 15.5 20.0 29.0
9.1
17.4
8.5 19.5 11.5 23.5 61.5 16.5 18.5 18.0 21.0
-
6.0 19.5 25.0 9.5
20.5 3.0
14.5 21.5 10.5 4.0
19.5 28.0 47.5 31.0 20.0 17.5 29.0
10.5
18.7
- Represents zero. 1 Includes data for States not published in this table.

Chickens and Eggs (May 2016) 15 USDA, National Agricultural Statistics Service
Hatchery Production – United States: 2015 and 2016
Item 2015 2016 2016 as percent of 2015
(1,000) (1,000) (percent)
Egg-type Eggs in incubators on May 1 .................................................................................... Chicks hatched during April ..................................................................................... Chicks hatched January through April ...................................................................... Pullets hatched during April for intended placements: Hatchery supply flocks ........................................................................................... Cumulative potential placements 7-18 months earlier 1 .......................................... Broiler-type Eggs in incubators on May 1 .................................................................................... Chicks hatched during April ..................................................................................... Chicks hatched January through April ...................................................................... Pullets hatched during April for intended placements: Hatchery supply flocks ........................................................................................... Cumulative potential placements 7-15 months earlier 2 ..........................................
48,583 50,193
188,022
219 2,987
653,441 773,353
3,068,100
6,995 62,804
52,532 49,400
204,563
240 3,121
650,369 780,729
3,132,927
7,765 68,230
108 98
109
110 104
100 101 102
111 109
1 2016 includes pullet chicks hatched October 2014 through September 2015. 2 2016 includes pullet chicks hatched January 2015 through September 2015.
16 Chickens and Eggs (May 2016) USDA, National Agricultural Statistics Service
Egg-Type Eggs in Incubators on the First of the Month – Regions and United States: 2015-2016 [See regional listing on page 21]
Region April 1 2016 as
percent of 2015
May 1 2016 as percent of 2015 2015 2016 2015 2016
(1,000 eggs) (1,000 eggs) (percent) (1,000 eggs) (1,000 eggs) (percent)
North Atlantic .................. East North Central .......... West North Central ......... South Atlantic .................. South Central .................. West ............................... United States ..................
7,112 10,683 13,045 4,638 6,740 7,123
49,341
8,480 10,851 14,162 5,033 5,414 6,921
50,861
119 102 109 109 80 97
103
7,326 9,839
13,891 4,706 5,702 7,119
48,583
7,728 10,422 17,157 5,043 6,651 5,531
52,532
105 106 124 107 117 78
108
Egg-Type Chicks Hatched by Month – United States: 2015-2016 [Blank data cells indicate estimation period has not yet begun]
Month
By months Cumulative
2015 2016 2016 as percent of 2015
2015 2016 2016 as percent of 2015
(1,000 chicks) (1,000 chicks) (percent) (1,000 chicks) (1,000 chicks) (percent)
January ..................... February ................... March ........................ April .......................... May ........................... June .......................... July ........................... August ...................... September ................ October ..................... November ................. December .................
43,868 43,774 50,187 50,193 48,315 47,212 42,790 47,131 49,391 50,194 45,848 46,695
47,645 50,481 57,037 49,400
109 115 114 98
43,868 87,642
137,829 188,022 236,337 283,549 326,339 373,470 422,861 473,055 518,903 565,598
47,645 98,126
155,163 204,563
109 112 113 109
Chickens and Eggs (May 2016) 17 USDA, National Agricultural Statistics Service
Intended Placements of Egg-Type Pullet Chicks for Hatchery Supply Flocks by Month – United States: 2015-2016 [Blank data cells indicate estimation period has not yet begun]
Month Pullet chicks hatched 2016 as
percent of 2015
Cumulative potential placements relative to current supply
flocks 7-18 months earlier 1
2015 2016 2015 2016
(1,000 chicks) (1,000 chicks) (percent) (1,000 chicks) (1,000 chicks)
January ...................................... February ..................................... March ......................................... April ............................................ May ............................................ June ........................................... July ............................................. August ........................................ September .................................. October ...................................... November ................................... December ................................... Total ...........................................
270 309 346 219 235 320 267 166 222 330 217 215
3,116
148 189 160 240
55 61 46
110
2,947 2,955 2,863 2,987 3,206 3,178 3,074 3,074 3,140 3,251 3,227 3,238
3,386 3,378 3,293 3,121 3,082 3,149 3,116 2,994 2,874 2,688 2,709
1 For April 2016, includes breeder pullet chicks hatched October 2014 through September 2015. The 7-18 months represent the first laying cycle. Molting and additional laying cycles will increase the cumulative potential placements.
Broiler-Type Eggs in Incubators on the First of the Month – Regions and United States: 2015-2016 [See regional listing on page 21]
Region April 1 2016 as
percent of 2015
May 1 2016 as percent of 2015 2015 2016 2015 2016
(1,000 eggs) (1,000 eggs) (percent) (1,000 eggs) (1,000 eggs) (percent)
North Atlantic ................... East North Central ........... West North Central .......... South Atlantic .................. South Central ................... West ................................ United States ...................
14,341 14,344 30,262
248,558 315,509 23,334
646,348
14,229 15,368 30,177
250,638 316,145 24,039
650,596
99 107 100 101 100 103
101
15,039 14,639 31,036
251,408 316,885 24,434
653,441
14,210 15,174 30,601
250,571 316,815 22,998
650,369
94 104 99
100 100 94
100

18 Chickens and Eggs (May 2016) USDA, National Agricultural Statistics Service
Broiler-Type Chicks Hatched – States and United States: April 2015 and 2016
State
During April January-April
2015 2016 2016 as percent of 2015
2015 2016 2016 as percent of 2015
(1,000 chicks) (1,000 chicks) (percent) (1,000 chicks) (1,000 chicks) (percent)
Alabama ................................................. Arkansas ................................................. Delaware ................................................ Florida ..................................................... Georgia ................................................... Kentucky ................................................. Louisiana ................................................ Maryland ................................................. Mississippi .............................................. Missouri .................................................. North Carolina ......................................... Oklahoma ............................................... Pennsylvania .......................................... South Carolina ........................................ Texas ...................................................... Virginia .................................................... California, Tennessee, and West Virginia .................................. 19 States 1 .............................................. Other States 2 ......................................... United States ..........................................
105,122 77,542 16,781 4,318
119,503 27,673 13,837 27,885 64,963 29,350
76,370 23,478 15,879 19,433 55,092 23,416
43,863
744,505
28,848
773,353
102,384 80,232 17,491 4,365
124,544 27,211 12,430 27,606 65,121 28,439
76,104 24,624 16,826 19,184 56,563 23,079
44,327
750,530
30,199
780,729
97 103 104 101 104 98 90 99
100 97
100 105 106 99
103 99
101
101
105
101
416,887 310,088 67,458 16,624
479,194 110,734 55,150
110,826 257,785 116,956
299,511 91,643 62,699 75,623
217,540 93,914
171,364
2,953,996
114,104
3,068,100
420,548 319,167 69,745 17,655
496,039 111,144 51,104
112,745 263,430 116,645
304,234 98,560 66,996 77,678
222,717 92,430
174,196
3,015,033
117,894
3,132,927
101 103 103 106 104 100 93
102 102 100
102 108 107 103 102 98
102
102
103
102
1 States in the weekly hatchery production estimating program. 2 Not published separately to avoid disclosing data for individual operations.
Broiler-Type Chicks Hatched by Month – United States: 2015-2016 [Blank data cells indicate estimation period has not yet begun]
Month
By months Cumulative
2015 2016 2016 as percent of 2015
2015 2016 2016 as percent of 2015
(1,000 chicks) (1,000 chicks) (percent) (1,000 chicks) (1,000 chicks) (percent)
January ..................... February ................... March ........................ April .......................... May ........................... June .......................... July ........................... August ...................... September ................ October ..................... November ................. December .................
792,030 711,289 791,428 773,353 809,844 787,930 805,512 799,162 761,688 755,076 732,518 798,157
799,420 748,650 804,128 780,729
101 105 102 101
792,030 1,503,319 2,294,747 3,068,100 3,877,944 4,665,874 5,471,386 6,270,548 7,032,236 7,787,312 8,519,830 9,317,987
799,420 1,548,070 2,352,198 3,132,927
101 103 103 102
Chickens and Eggs (May 2016) 19 USDA, National Agricultural Statistics Service
Intended Placements of Broiler-Type Pullet Chicks for Hatchery Supply Flocks by Month and Total: 2015-2016 [Blank data cells indicate estimation period has not yet begun]
Month Pullet chicks hatched 2016 as
percent of 2015
Cumulative potential placements relative to current supply
flocks 7-15 months earlier 1
2015 2016 2015 2016
(1,000 chicks) (1,000 chicks) (percent) (1,000 chicks) (1,000 chicks)
United States placements ................ January ........................................ February ...................................... March .......................................... April ............................................. May ............................................. June ............................................ July .............................................. August ......................................... September ................................... October ........................................ November .................................... December .................................... Annual total ..................................... Total placements 2 ........................... January ........................................ February ...................................... March .......................................... April ............................................. May ............................................. June ............................................ July .............................................. August ......................................... September ................................... October ........................................ November .................................... December .................................... Annual total .....................................
6,944 7,892 7,160 6,995 7,541 7,790 7,428 7,907 8,573 6,863 7,230 7,544
89,867
8,382 9,546 8,875 8,358 9,409 9,785 9,907
10,040 10,810 8,681 8,872 9,321
111,986
6,726 8,098 8,143 7,765
8,275 10,098 10,025 9,115
97
103 114 111
99 106 113 109
62,018 61,999 62,220 62,804 63,157 63,509 63,514 63,748 64,040 64,106 64,889 64,994
65,531 66,136 66,452 68,230 68,149 67,487 67,871 67,602 68,159 68,512 68,849
1 For April 2016, includes breeder pullet chicks hatched January 2015 through September 2015. 2 United States production of intended placements worldwide.

20 Chickens and Eggs (May 2016) USDA, National Agricultural Statistics Service
Statistical Methodology
Survey Procedures: Primary data for the Chickens and Eggs report are from weekly and/or monthly questionnaires sent
to producers. An attempt is made to collect information for layer and egg estimates from each known contractor and
independent producer who has at least 30,000 table egg layers, flocks of hatchery supply layers, or pullet only operations
with at least 500 pullets. Coverage for operations with less than 30,000 table egg layers are estimated each month based
on data reported in December. Approximately 500 contractors, independent egg producers, and pullet only operations are
contacted each month. Data for broiler hatchery estimates are collected weekly from all broiler-type hatcheries that hatch
at least one million chicks a year. Data for egg-type hatchery estimates are collected monthly from all egg-type hatcheries
that hatch at least 50,000 chicks a year.
Estimating Procedures: Sound statistical methodology is employed to derive estimates from the reported data. All data
are analyzed for unusual values. Data from each operation are compared to their own past operating profile and to trends
from similar operations. Data for missing operations are estimated based on similar operations or historical data. NASS
field offices prepare these estimates by using a combination of survey indications and historic trends. Individual State
estimates are reviewed by the Agricultural Statistics Board for reasonableness. Individual hatchery data are summed to
State, regional, and United States totals.
For chicken hatcheries, chicks hatched consist of all chicks of domesticated breeds including males and chicks destined
for hatchery supply flocks and research purposes. Eggs set are eggs in incubators for the purpose of hatching. The
relationship of egg-type chicks hatched to chicken inventory and poultry marketings are carefully monitored. The
disposition of egg-type chicks hatched prior to placement into the laying flock can vary significantly, which can make
comparisons to changes in layer inventory inconsistent over time. Broiler chicks placed are specifically for meat
production. Intended placement data reported by leading breeders include pullet chicks expected from eggs sold the
preceding month. The breeders in this report account for a large percentage of replacement pullets for hatchery supply
flocks. Production of replacement pullets by these breeders indicates the number of pullets available to hatchery supply
layer flocks several months before the pullets will actually move into the laying flocks. “Hatchery Supply Flocks” include
all generations of layers which could lay eggs to supply a hatchery. This includes the generations of parents, grandparents,
great-grandparents, pedigree, etc. Also included are research flocks, vaccine flocks, and specific pathogen-free flocks. The
broiler cumulative potential placements are a moving total of the intended placements 7-15 months earlier. The egg-type
cumulative potential placements of 7-18 months earlier represent the first laying cycle. Molting and additional laying
cycles will increase the cumulative potential placements of egg-type hatching flocks.
Revision Policy: The previous month's estimates are subject to revision if late reports or corrected data indicates a
different level. Additionally, revisions after the monthly report will be made at the end of the marketing year and
published in the annual reports of Chickens and Eggs Summary and Hatchery Production Summary. Estimates will also be
reviewed for chickens and eggs after data from the 5-year Census of Agriculture are available. No revisions will be made
after that date.
Reliability: Estimates are based on a census of all known contractors and independent producers who have at least 30,000
table egg layers, flocks of hatchery supply layers, pullet only operations with at least 500 pullets, or operating hatcheries
and therefore, have no sampling error. However, estimates are subject to errors such as omission, duplication, and
mistakes in reporting, recording, and processing the data. While these errors cannot be measured directly, they are
minimized through strict quality controls in the data collection process and a careful review of all reported data for
consistency and reasonableness.
To assist in evaluating the reliability of the estimates in this report, the “Root Mean Square Error” is shown for selected
items in the following table. The “Root Mean Square Error” is a statistical measure based on past performance and is
computed using the differences between first and final estimates. The “Root Mean Square Error” for all layers over the
past 24 months is 1.9 percent. This means that chances are 2 out of 3 that the final estimate will not be above or below the
current estimate of 361 million layers by more than 1.9 percent. Chances are 9 out of 10 that the difference will not
exceed 3.2 percent.

Chickens and Eggs (May 2016) 21 USDA, National Agricultural Statistics Service
Reliability of Layer and Egg Estimates [Based on data for the past twenty-four months]
Item Root mean
square error
90 percent confidence
level
Difference between first and latest estimate
Average Smallest Largest Months
Below latest Above latest
(percent) (percent) (1,000) (1,000) (1,000) (number) (number)
All layers .........................................
1.9
3.2
5,648
43
12,554
24
0
(million) (million) (million)
Eggs ............................................... 1.9 3.3 137 2 308 24 0
Egg-Type Regional Listing
North Atlantic: Connecticut, New York, Pennsylvania.
East North Central: Illinois, Indiana, Michigan, Ohio, Wisconsin.
West North Central: Iowa, Kansas, Minnesota, Missouri, Nebraska.
South Atlantic: Florida, Georgia, Virginia.
South Central: Alabama, Mississippi, Texas.
West: California, Idaho, New Mexico.
Broiler-Type Regional Listing North Atlantic: New York, Pennsylvania.
East North Central: Indiana, Ohio, Wisconsin.
West North Central: Iowa, Minnesota, Missouri.
South Atlantic: Delaware, Florida, Georgia, Maryland, North Carolina, South Carolina, Virginia, West Virginia.
South Central: Alabama, Arkansas, Kentucky, Louisiana, Mississippi, Oklahoma, Tennessee, Texas.
West: California, Oregon, Washington.
Terms and Definitions of Chickens and Eggs Estimates
All Layers includes both table egg and hatching egg flocks regardless of size.
Intended Placements are reported by leading breeders. Coverage may not be 100 percent. Includes expected pullet chicks
from eggs sold during the preceding month at the rate of 125 pullet chicks per case of 30 dozen eggs.
Molted Layers is the same data series as the previously published Forced Molt Layers. Nomenclature changed as of
January 2015.

Information Contacts
Listed below are the commodity specialists in the Livestock Branch of the National Agricultural Statistics Service to
contact for additional information. E-mail inquiries may be sent to [email protected]
Dan Kerestes, Chief, Livestock Branch .......................................................................................................... (202) 720-3570
Bruce Boess, Head, Poultry and Specialty Commodities Section ................................................................... (202) 720-4447
Aaron Cosgrove – Egg Products, Poultry Slaughter, Trout Production ................................................... (202) 690-3237
Alissa Cowell-Mytar – Cold Storage ........................................................................................................ (202) 720-4751
Heidi Gleich – Broiler Hatchery, Chicken Hatchery ................................................................................ (202) 720-0585
Tom Kruchten – Census of Aquaculture .................................................................................................. (202) 690-4870
Kim Linonis – Layers, Eggs ..................................................................................................................... (202) 690-8632
Sammy Neal – Catfish Production, Mink, Turkey Hatchery, Turkeys Raised ......................................... (202) 720-3244
Joshua O’Rear – Honey, Honey Bee Colonies .......................................................................................... (202) 690-3676
Access to NASS Reports For your convenience, you may access NASS reports and products the following ways:
All reports are available electronically, at no cost, on the NASS web site: www.nass.usda.gov
Both national and state specific reports are available via a free e-mail subscription. To set-up this free
subscription, visit www.nass.usda.gov and click on “National” or “State” in upper right corner above “search”
box to create an account and select the reports you would like to receive.
For more information on NASS surveys and reports, call the NASS Agricultural Statistics Hotline at (800) 727-9540,
7:30 a.m. to 4:00 p.m. ET, or e-mail: [email protected].
The U.S. Department of Agriculture (USDA) prohibits discrimination against its customers, employees, and applicants for
employment on the basis of race, color, national origin, age, disability, sex, gender identity, religion, reprisal, and where
applicable, political beliefs, marital status, familial or parental status, sexual orientation, or all or part of an individual's
income is derived from any public assistance program, or protected genetic information in employment or in any program
or activity conducted or funded by the Department. (Not all prohibited bases will apply to all programs and/or
employment activities.)
If you wish to file a Civil Rights program complaint of discrimination, complete the USDA Program Discrimination
Complaint Form (PDF), found online at http://www.ascr.usda.gov/complaint_filing_cust.html, or at any USDA office, or
call (866) 632-9992 to request the form. You may also write a letter containing all of the information requested in the
form. Send your completed complaint form or letter to us by mail at U.S. Department of Agriculture, Director, Office of
Adjudication, 1400 Independence Avenue, S.W., Washington, D.C. 20250-9410, by fax (202) 690-7442 or email at