uncertainty in an emissions constrained world: case austria
TRANSCRIPT

M. Jonas et al.
22 Sept. 2011 – 1
12th Austrian Climate Colloquium:
Uncertainty in an
Emissions Constrained World: Case Austria
Vienna, Austria
21–22 September 2011
M. JONAS1
Collaborators: V. KREY, P. Rafaj, F. WAGNER (IIASA)
G. BACHNER, K. STEININGER (U Graz, AT)
G. MARLAND (CDIAC + ASU, US)
Z. NAHORSKI (SRI PAS, PL)
1International Institute for Systems Analysis, Austria; [email protected]
M. Jonas et al.
22 Sept. 2011 – 2
1. Contents
2. Historical background
3. Motivation
4. Constrained cumulative emissions: uncertainty + risk
5. Global emissions equity (C&C)
6. Monitor compliance: targets/pledges + sustainability
7. Conclusions
M. Jonas et al.
22 Sept. 2011 – 3
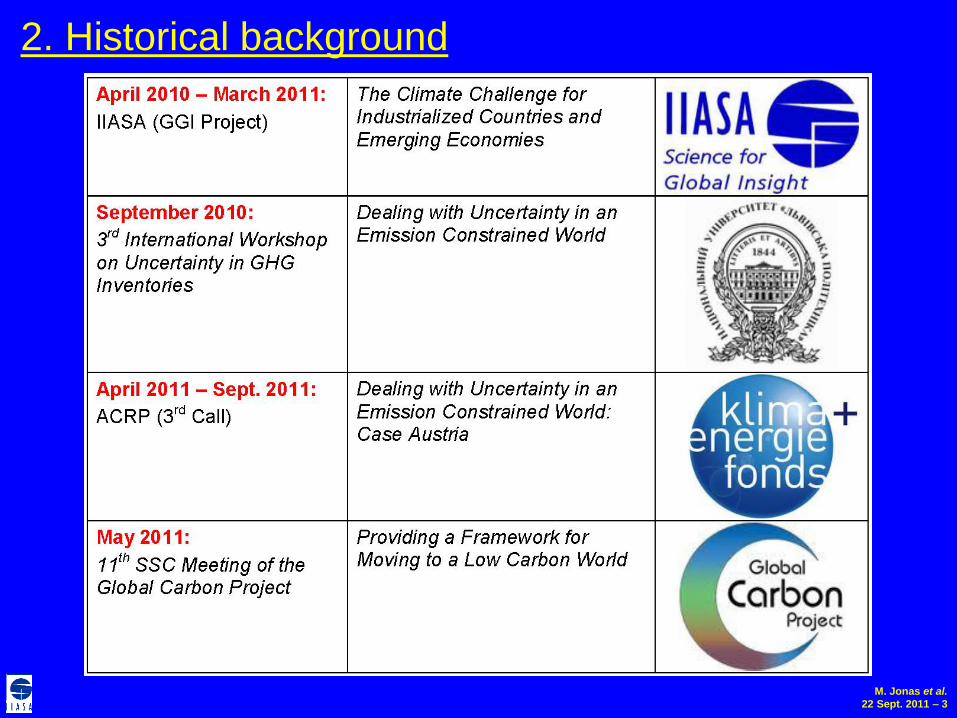
2. Historical background

M. Jonas et al.
22 Sept. 2011 – 4
3. Motivation
2. To put uncertainties that are associated with
accounting emissions for compliance purposes
into a wider quantitative context
1. To bring a global long-term emissions-temperature-
uncertainty issue (2ºC-by-2050) to the here and now
to emission targets on the near-term time scale
to emission targets on the national scale
M. Jonas et al.
22 Sept. 2011 – 5
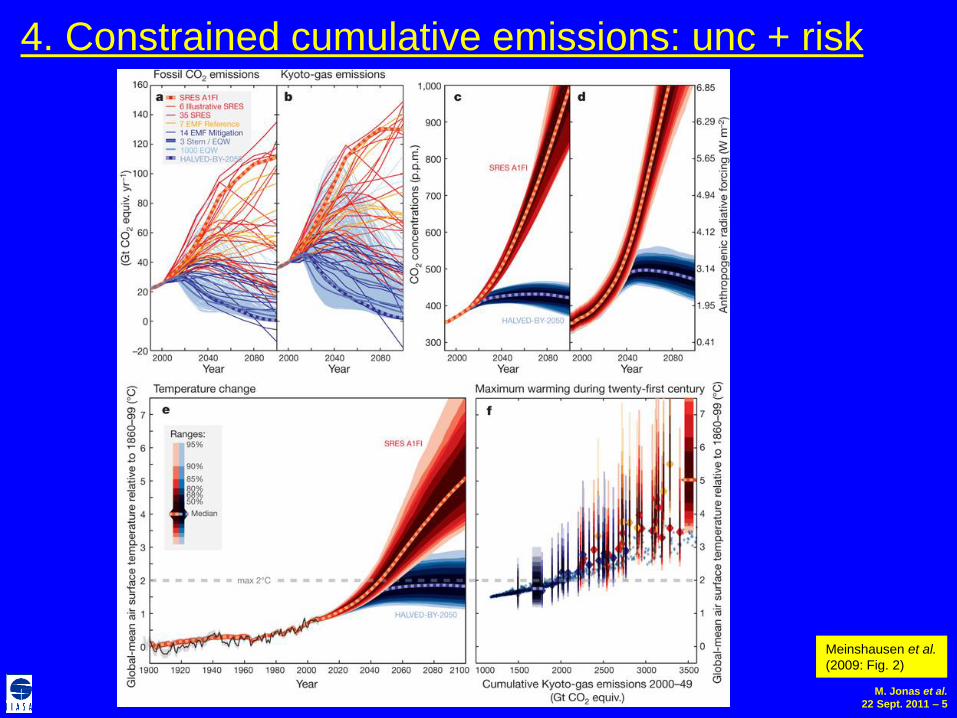
Meinshausen et al.
(2009: Fig. 2)
4. Constrained cumulative emissions: unc + risk
M. Jonas et al.
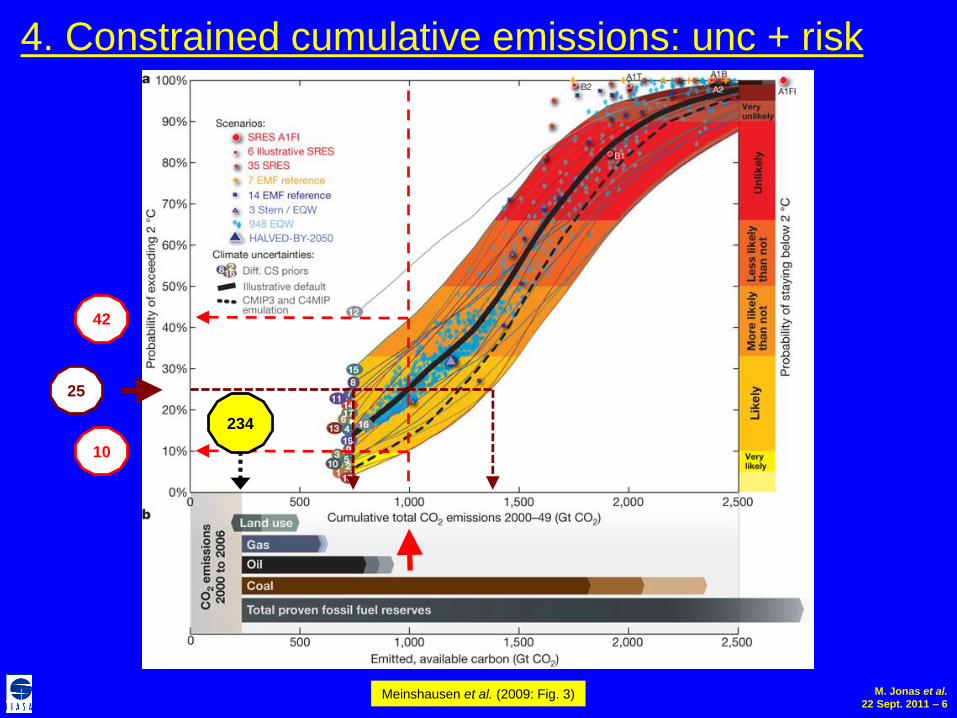
22 Sept. 2011 – 6Meinshausen et al. (2009: Fig. 3)
10
42
234
25
4. Constrained cumulative emissions: unc + risk

M. Jonas et al.
22 Sept. 2011 – 7
Probability of exceeding 2 oC:
Meinshausen et al. (2009: Tab. 1)
4. Constrained cumulative emissions: unc + risk
M. Jonas et al.
22 Sept. 2011 – 8
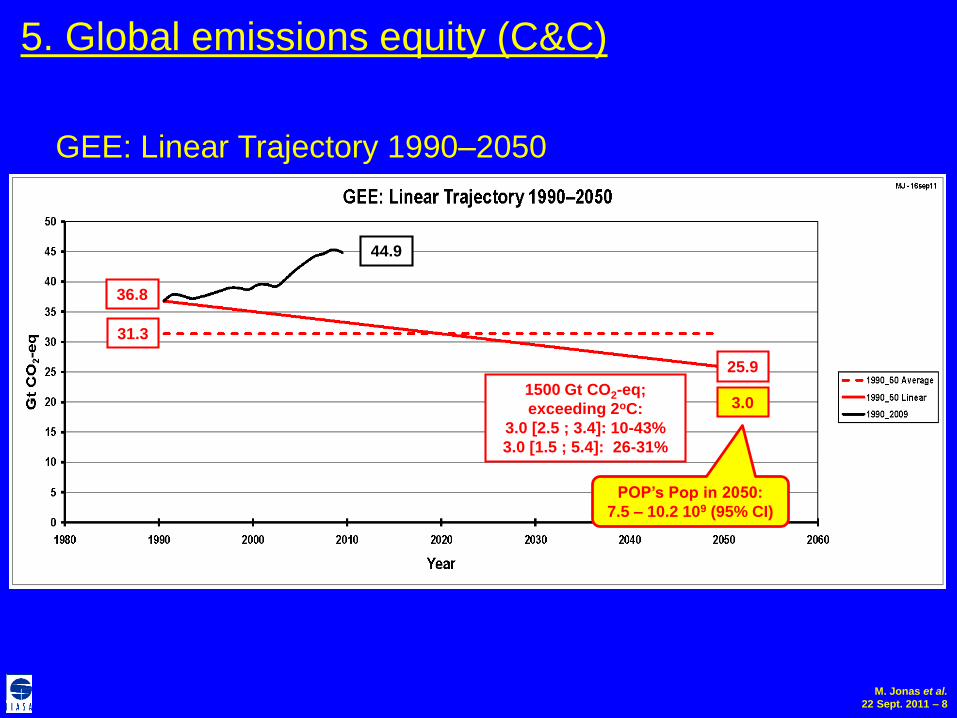
5. Global emissions equity (C&C)
GEE: Linear Trajectory 1990–2050
POP’s Pop in 2050:
7.5 – 10.2 109 (95% CI)
36.8
31.3
25.9
1500 Gt CO2-eq;
exceeding 2oC:
3.0 [2.5 ; 3.4]: 10-43%
3.0 [1.5 ; 5.4]: 26-31%
3.0
44.9

M. Jonas et al.
22 Sept. 2011 – 9
5. Global emissions equity (C&C)
GEE: Linear Trajectories 1990–2050 for FF and LU
36.8
25.9
31.5
5.3
1990–2050: FF + LU
1990–2050: FF
1990–2050: LU
3.0
0.0
M. Jonas et al.
22 Sept. 2011 – 10
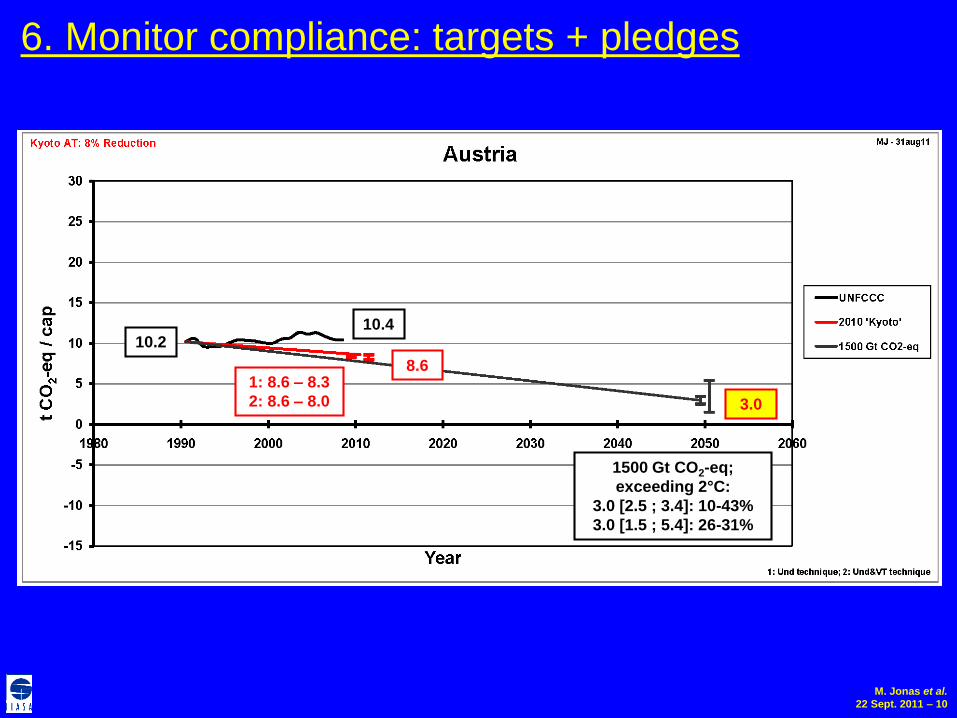
10.210.4
1500 Gt CO2-eq;
exceeding 2°C:
3.0 [2.5 ; 3.4]: 10-43%
3.0 [1.5 ; 5.4]: 26-31%
3.0
8.61: 8.6 – 8.3
2: 8.6 – 8.0
6. Monitor compliance: targets + pledges
M. Jonas et al.
22 Sept. 2011 – 11
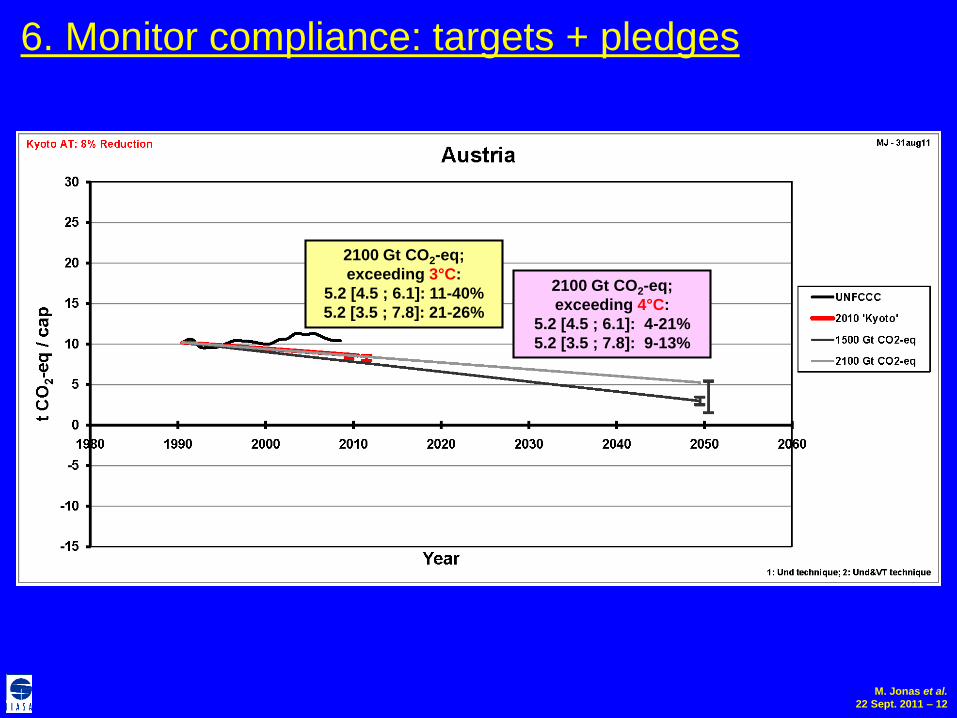
6. Monitor compliance: targets + pledges
M. Jonas et al.
22 Sept. 2011 – 12
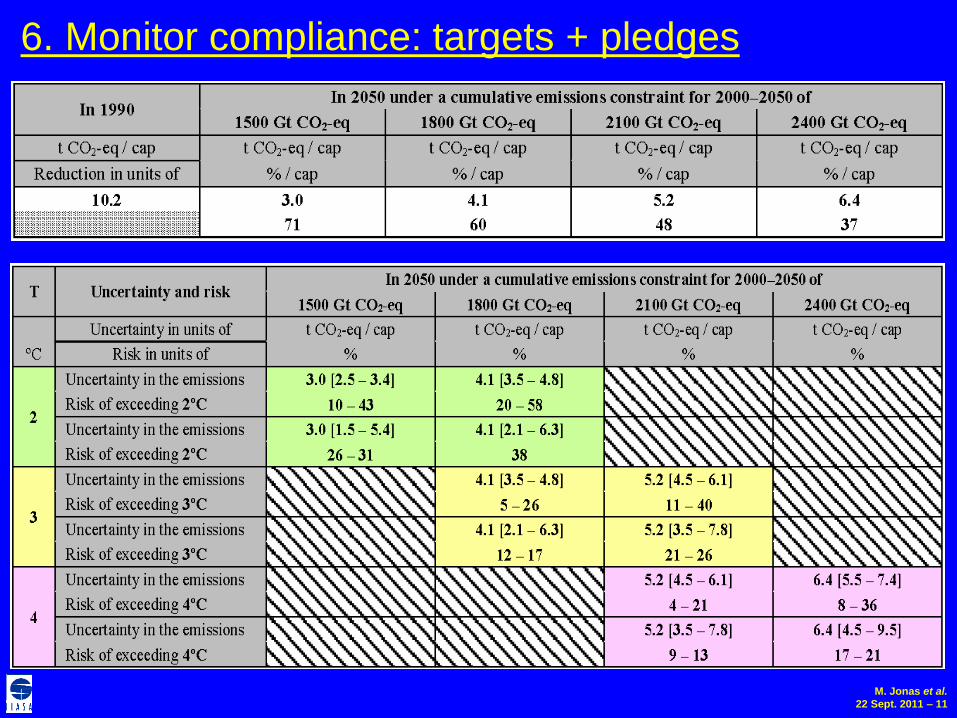
10.210.4
2400 Gt CO2-eq;
exceeding 4°C:
6.4 [5.5 ; 7.4]: 8-36%
6.4 [4.5 ; 9.5]: 17-21%
6.48.6
1: 8.6 – 8.3
2: 8.6 – 8.0
6. Monitor compliance: targets + pledges
2100 Gt CO2-eq;
exceeding 3°C:
5.2 [4.5 ; 6.1]: 11-40%
5.2 [3.5 ; 7.8]: 21-26%
2100 Gt CO2-eq;
exceeding 4°C:
5.2 [4.5 ; 6.1]: 4-21%
5.2 [3.5 ; 7.8]: 9-13%

M. Jonas et al.
22 Sept. 2011 – 13
10.210.4
8.11: 8.1 – 7.8
2: 8.1 – 7.5
6. Monitor compliance: targets + pledges
1800 Gt CO2-eq;
exceeding 2°C:
4.1 [3.5 ; 4.8]: 20-58%
4.1 [2.1 ; 6.3]: 38%
1800 Gt CO2-eq;
exceeding 3°C:
4.1 [3.5 ; 4.8]: 5-26%
4.1 [2.1 ; 6.3]: 12-17%

M. Jonas et al.
22 Sept. 2011 – 14
6. Monitor compliance: targets + pledges
1: .8 – 8.5
2: 8.8 – 8.2
1: 8.7 – 8.4
2: 8.7 – 8.1
10.2
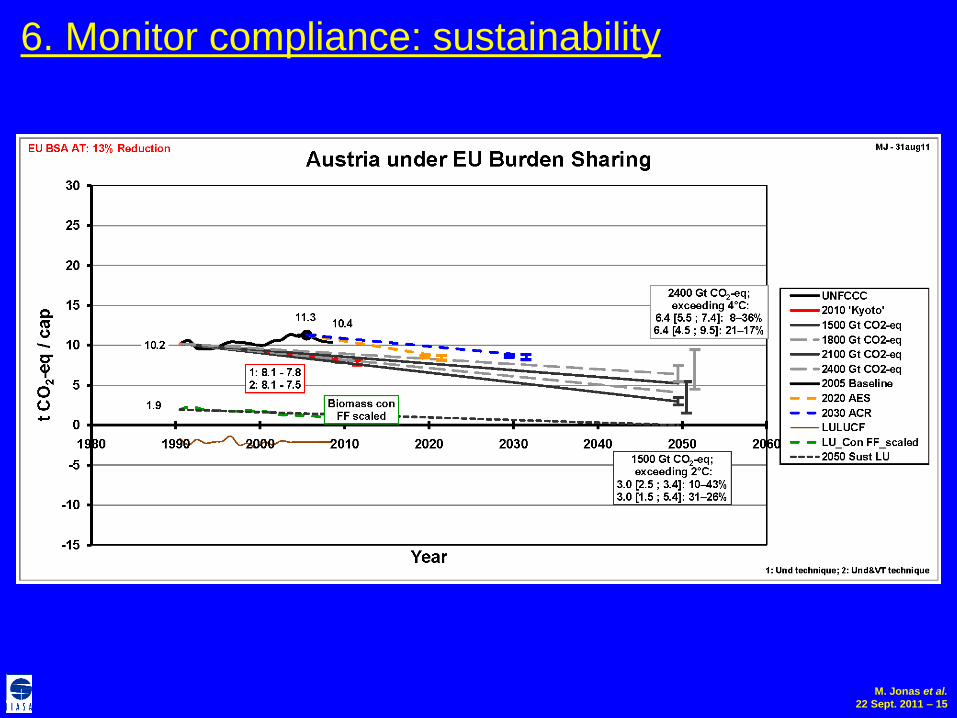
M. Jonas et al.
22 Sept. 2011 – 15
6. Monitor compliance: sustainability

M. Jonas et al.
22 Sept. 2011 – 16
7. Conclusions
3. Even if Austria buys emission certificates to comply
with the 13% emission reduction under the EU
BSA, this once-in-a-time purchase does not follow
the notion of constraining cumulative emissions.
2. Austria operates, like most other industrialized
economies, beyond a global warming of 4°C.
1. Scientists can come up with a monitoring framework
to help national decision-makers understand how
their mitigation measures play out in a global, long-
term ‘global warming + uncertainty + risk’ context.
M. Jonas et al.
22 Sept. 2011 – 17
References