uncertainty assessment for measurement and simulation in
TRANSCRIPT

ACTA IMEKO ISSN: 2221-870X December 2020, Volume 9, Number 4, 96 - 105
ACTA IMEKO | www.imeko.org December 2020 | Volume 9 | Number 4 | 96
Uncertainty assessment for measurement and simulation in selective laser melting: a case study of an aerospace part
Giulio D’Emilia1, Antoniomaria Di Ilio1, Antonella Gaspari1, Emanuela Natale1, Antonios G. Stamopoulos1
1 Department of Industrial and Information Engineering and Economics, University of l’Aquila, 67100, L’Aquila, Italy
Section: RESEARCH PAPER
Keywords: additive manufacturing; selective laser melting; simulation; experimental validation; measurement techniques; uncertainty
Citation: Giulio D'Emilia, Antoniomaria Di Ilio, Antonella Gaspari, Emanuela Natale, Antonios G. Stamopoulos, Uncertainty assessment for measurement and simulation in Selective Laser Melting: A case study of an aerospace part, Acta IMEKO, vol. 9, no. 4, article 13, December 2020, identifier: IMEKO-ACTA-09 (2020)-04-13
Section Editor: Francesco Bonavolonta, University of Naples Federico II, Italy
Received October 11, 2019; In final form December 10, 2019; Published December 2020
Copyright: This is an open-access article distributed under the terms of the Creative Commons Attribution 3.0 License, which permits unrestricted use, distribution, and reproduction in any medium, provided the original author and source are credited.
Corresponding author: Giulio D’Emilia, e-mail: [email protected]
1. INTRODUCTION
Additive manufacturing (AM) technologies enable the fabrication of parts with complex geometries without the need for tooling and assembly, thus allowing for a reduction of costs and time compared with conventional manufacturing processes [1], [2]. With AM methods, it is possible to realise components using a range of materials, such as steels, aluminium or titanium alloys, and metal-based or ceramic-matrix composites [2]. Due to its versatility and potentiality, AM plays a key role as one of the central paradigms of Industry 4.0, but it still requires further research and development [3].
Among the most frequently addressed problems related to AM are residual stresses. These are mainly caused by the thermal cycle of the process itself, which entails rapid heating, several
cooling rates and a relative re-melting of the secondary layer [4]. This whole procedure generates thermal stresses, which, in turn, produce residual stresses after the production of a certain part of the component, leading also to notable distortions, cracks and variations on the relative dimensions of the produced part [5], [6].
Numerical tools aimed at predicting residual stresses and geometrical irregularities exist, but these are mainly based on multi-physics and are either complicated and time consuming or simplified and case-specific [7], [8]. Furthermore, the phenomena AM is based on are typically non-stationary, increasing the difficulty of simulation.
These models could support process optimisation, provided they are able to discriminate the effects of redesign or treatments on the piece being produced. For this purpose, a metrological approach that includes an uncertainty analysis of simulation data
ABSTRACT In this work, the additive manufacturing process selective laser melting is analysed with the aim of realising a complex piece for aerospace applications. In particular, the effect of the manufacturing process and of the following thermal treatments on the dimensions of the workpiece is evaluated. The study is based on a hybrid approach including a simulation of the whole manufacturing process by advanced software packages and the dimensional measurements of the realised pieces taken by a coordinate measuring machine (CMM). The integrated use of simulation and measurements is carried out with the aim of validating the simulation results and of identifying the operational limits of both approaches; this analysis is based on metrological evaluation of the results of both the simulation and the tests, taking into account the uncertainty of the data. In addition, the main causes of uncertainty for the simulation activity and the experimental data have been identified, and the effects of some of them have also been experimentally evaluated. Based on the experimental validation, the simulation seems to predict the absolute displacement of the supports of the piece in a satisfactory way, while it is unable, in the actual configuration, to assess the conformity of the surface to its very tight shape tolerances. Conformity assessment of the surface should be carried out by CMM measurement. Integrated use of simulation and experimental results is expected to strongly improve the accuracy of simulation results for the effective and accurate design and control of the additive manufacturing process, including dimensional control and thermal treatments to mitigate induced thermal stresses.
ACTA IMEKO | www.imeko.org December 2020 | Volume 9 | Number 4 | 97
is necessary to evaluate the ability to resolve even small variations in the properties of the object being studied [9]. The way the mesh is realised, the accuracy of data on physical characteristics of the materials and the process parameters can all produce variability in the results, which in turn can affect the dimensional knowledge of the piece.
Furthermore, simulation data should be validated after part manufacturing, especially after additional thermal treatments, by comparison with measurements of different possible parameters such as microstructural variations, induced stresses and deviations on the part dimensions [10], [11]. This comparison requires the theoretical/experimental analysis of all the uncertainty contributions involved in the measurement process in order to assess the compatibility between model results and measurement data in probabilistic terms [12].
Many measurement techniques for validation exist that examine the piece characteristics at a micro- or macro-scale level [8], [10], [13]. The former group includes X-ray diffraction analysis, which is mainly based on computed tomography analysis of both the microstructure and the relative part dimensions [8], [10]. Techniques measuring the effects of residual stresses on a macroscopic scale, including distortions, cracks and variations on the relative dimensions of the produced part, belong to the latter group. In particular, the three-prong method, digital image correlation and the use of optical measuring machines are very popular in the industry [13], [14]. Coordinate measuring machines (CMMs) are also of general use for measuring the nominal geometry of the pieces.
Furthermore, in some cases, it might be necessary to resort to a merging of many measurement techniques in order to take into account all the possible aspects of interest for process control and optimisation [10]; thus, it is important to be able to fuse measurement data from different sensors.
Additionally, the characterisation of the part shape is particularly critical for quality control of AM products and for successful optimisation of AM processes as new materials, treatments and geometries are developed [14].
Shape deformation is one of the most noticeable effects following most metal AM processes due to the material thermal stresses. Hence, post-process characterisation methods would be highly beneficial in understanding and contributing to the reduction of these effects, especially for industries with stringent requirements, such as the aerospace and automotive industries.
Contact systems, such as mechanical probe-based CMMs, can measure forms with guaranteed high accuracy and have been widely used in such industries for many years, but they have limitations. For example, they can only measure a limited number of points on an object’s surface [14], [15]. The measurement uncertainty for CMMs strongly depends on the measurement procedure [16]. For this reason, a design of experiments (DOE) that controls for all of the parameters that influence uncertainty along with an evaluation of the resulting measurement uncertainty is necessary for assessing the conformity of the piece to the requirements. Knowledge of the measurement uncertainty is also needed to validate the theoretical model when the simulation is used as an instrument to optimise the AM process.
Validation of models by experimental techniques can also be supported by advanced data processing techniques, including advanced machine learning, deep learning and neural network algorithms, which are commonly used in many experimental fields [17], [18].
Based on the above considerations, establishing a hybrid methodology that is able to integrate contributions from
simulations and experiments is a non-trivial task. It should be taken step by step, with iterative merging of simulation and experimental data.
In summary, the main issues with regards to simulation are:
• simplifying the approach in order to guarantee that the models are reliable and efficient from the processing load point of view;
• identifying the most meaningful quantities and aspects to be considered;
• evaluating the uncertainty of the simulation data in order to define the ability of the model to discriminate the effects of changes in the piece’s design or manufacture process;
• assessing the interaction with experimental activity in order to allow for mutual validation. As for measurements, the following are topics of interest:
• sensor fusion and integration of different data bases, depending on specific measuring chains;
• data fusion between measurement and simulation data [19];
• optimisation of experimental activity (e.g. DOE, control of the environmental and procedural effects, in-situ calibration, virtual instruments and data validation) [20];
• the synthesis of information to determine meaningful features for the application of advanced machine and deep learning algorithms;
• uncertainty evaluation of experimental data. The present work will study the optimisation and realisation
of an aerospace part using AM technologies. Simulation and measurement aspects will be considered in
order to provide the most informative basis for validation of the model results.
This study will discuss a hybrid approach including a simulation of the whole manufacturing process by advanced software packages and dimensional measurements of the realised pieces taken by CMMs. The integrated use of simulation and measurements will be carried out with the aim of validating the simulation results and identifying the operational limits of both approaches. This analysis is based on metrological evaluation of results of both simulation and tests, taking into account the uncertainty of the data.
Indeed, the uncertainty of the data derived from both sources will be the driving criterion for success, and the causes of uncertainty for data provided by both simulation and measurement actions will be investigated in order to realise the best scenario for mutual validation.
As for measurements, CMM dimensional data will be analysed, taking into account all the steps of the measurement procedure.
It is expected that the uncertainty analysis will increase the reliability of the simulation approach as it will determine the accuracy of the simulation predictions, which can then be used to determine the feasibility of specific actions for AM process improvement.
The requirements of the measurement techniques in order to obtain reliable measurements for the validation of the simulation model and for understanding the physical phenomena involved in the process are also discussed.
The interactions between simulation and experimental data will be critically discussed in the Results section, including recommendations for the identification of the operational limits of both approaches and for mutual improvement.
ACTA IMEKO | www.imeko.org December 2020 | Volume 9 | Number 4 | 98
2. MATERIALS AND METHODS
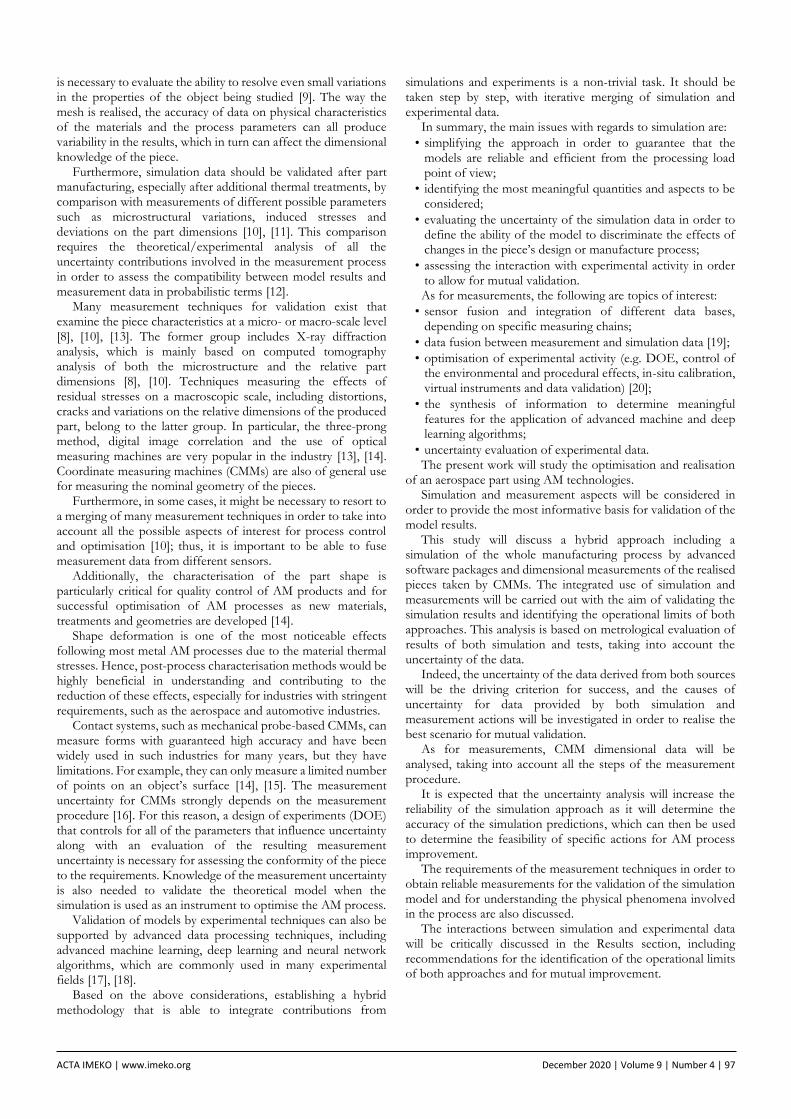
The piece under investigation is depicted in Figure 1. The bracket forms a part of the closing device for the antenna of a satellite, developed in close collaboration with Thales Alenia Space.
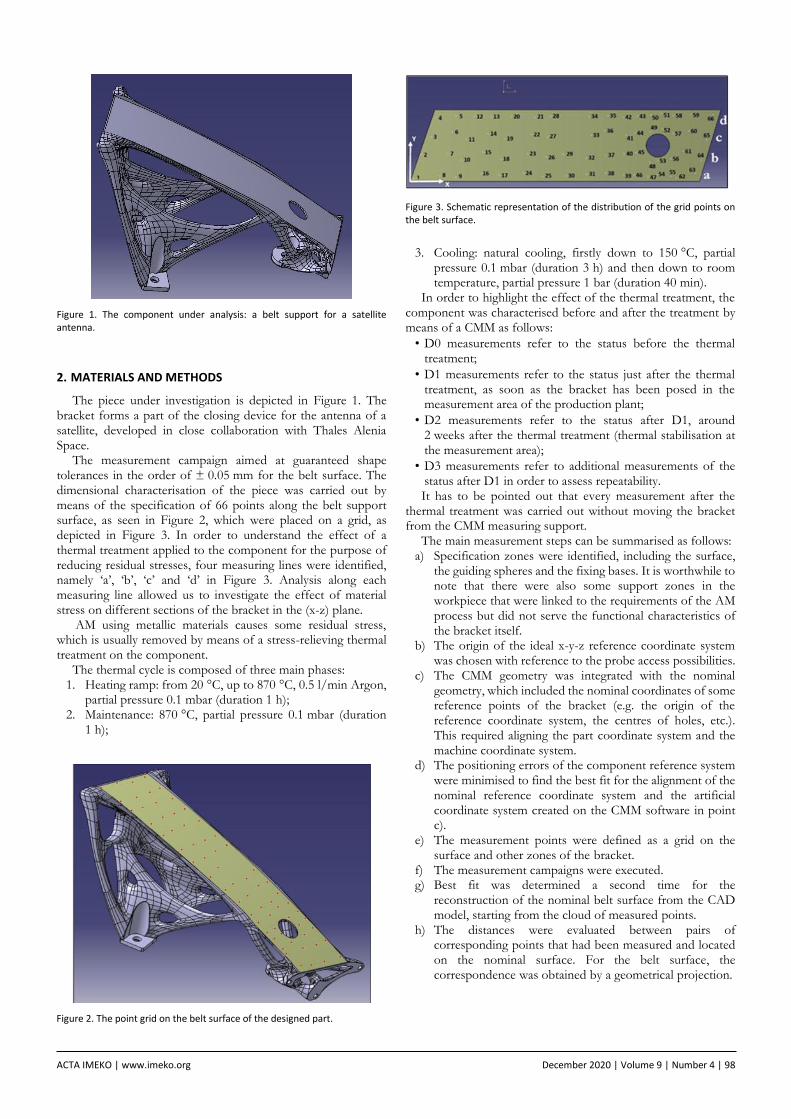
The measurement campaign aimed at guaranteed shape tolerances in the order of ± 0.05 mm for the belt surface. The dimensional characterisation of the piece was carried out by means of the specification of 66 points along the belt support surface, as seen in Figure 2, which were placed on a grid, as depicted in Figure 3. In order to understand the effect of a thermal treatment applied to the component for the purpose of reducing residual stresses, four measuring lines were identified, namely ‘a’, ‘b’, ‘c’ and ‘d’ in Figure 3. Analysis along each measuring line allowed us to investigate the effect of material stress on different sections of the bracket in the (x-z) plane.
AM using metallic materials causes some residual stress, which is usually removed by means of a stress-relieving thermal treatment on the component.
The thermal cycle is composed of three main phases: 1. Heating ramp: from 20 °C, up to 870 °C, 0.5 l/min Argon,
partial pressure 0.1 mbar (duration 1 h); 2. Maintenance: 870 °C, partial pressure 0.1 mbar (duration
1 h);
3. Cooling: natural cooling, firstly down to 150 °C, partial pressure 0.1 mbar (duration 3 h) and then down to room temperature, partial pressure 1 bar (duration 40 min).
In order to highlight the effect of the thermal treatment, the component was characterised before and after the treatment by means of a CMM as follows:
• D0 measurements refer to the status before the thermal treatment;
• D1 measurements refer to the status just after the thermal treatment, as soon as the bracket has been posed in the measurement area of the production plant;
• D2 measurements refer to the status after D1, around 2 weeks after the thermal treatment (thermal stabilisation at the measurement area);
• D3 measurements refer to additional measurements of the status after D1 in order to assess repeatability. It has to be pointed out that every measurement after the
thermal treatment was carried out without moving the bracket from the CMM measuring support.
The main measurement steps can be summarised as follows: a) Specification zones were identified, including the surface,
the guiding spheres and the fixing bases. It is worthwhile to note that there were also some support zones in the workpiece that were linked to the requirements of the AM process but did not serve the functional characteristics of the bracket itself.
b) The origin of the ideal x-y-z reference coordinate system was chosen with reference to the probe access possibilities.
c) The CMM geometry was integrated with the nominal geometry, which included the nominal coordinates of some reference points of the bracket (e.g. the origin of the reference coordinate system, the centres of holes, etc.). This required aligning the part coordinate system and the machine coordinate system.
d) The positioning errors of the component reference system were minimised to find the best fit for the alignment of the nominal reference coordinate system and the artificial coordinate system created on the CMM software in point c).
e) The measurement points were defined as a grid on the surface and other zones of the bracket.
f) The measurement campaigns were executed. g) Best fit was determined a second time for the
reconstruction of the nominal belt surface from the CAD model, starting from the cloud of measured points.
h) The distances were evaluated between pairs of corresponding points that had been measured and located on the nominal surface. For the belt surface, the correspondence was obtained by a geometrical projection.
Figure 1. The component under analysis: a belt support for a satellite antenna.
Figure 2. The point grid on the belt surface of the designed part.
Figure 3. Schematic representation of the distribution of the grid points on the belt surface.

ACTA IMEKO | www.imeko.org December 2020 | Volume 9 | Number 4 | 99
According to the previous steps, Figure 3 shows the CMM measurement points fitted to the Catia V5 model, which was used as a basis for comparison with the model results.
Deviations between the measurement points and the nominal geometry were used to check dimensional and shape tolerances.
It has to be pointed out that all of these actions allowed us to fit, rotate and shift surfaces represented by the measurement coordinates to the reference system of the model.
3. SIMULATING THE ADDITIVE MANUFACTURING PROCESS
In this section, the dependency of displacements while simulating the additive fabrication of the previously presented component seen in Figure 1 is described. After defining the structural loads this component was subject to, a topological optimisation was carried out, leading to a geometry characterised by high complexity, which did, therefore, make AM indispensable.
The simulation of the fabrication process was made mostly to foresee the deformations and distortions of the component caused by the process itself. Considering the drawbacks of selective laser melting, the accurate prediction of residual stresses and distortions caused by the heating and cooling of the several layers into which the component is divided may be crucial.
To this end, the Amphyon 2018 FE code was utilised [21]. This particular software, developed by Additive Works, is said to be accurate for predicting the distortions not only from the fabrication process but also from any potential thermal treatment afterwards.
Consequently, two simulations were performed using the mechanical process simulation tool. In one, the mesh density was adjusted, and in the second, the adaptive meshing method was retained. The external surfaces of the component were refined, and the model supports were considered to ensure closest fit to those used in the real case. To this end, the first model created had 244,262 elements of 1.294 mm each, while the second was meshed with 116,694 elements, sized 1.542 mm each. Both models had a similar number of layers, and a potential thermal treatment after the fabrication was considered. The purpose of this parametric analysis was the investigation of the sensitivity of the results with regard to mesh size and density as well as the necessary processing time in each case.
The results in terms of distortions are presented in Figure 4(a) and Figure 4(b), respectively, alongside the corresponding displacement scale. In both cases, the magnitude of the observed distortions is the same. Moreover, a significant displacement is reported at the supports of the component. In Figure 4(a), the
red area of the support on the left has a maximum displacement of 0.37 mm, while in Figure 4(b), the displacement reaches the value of 0.47 mm. Nevertheless, by comparing the distribution of the displacements, a significant difference is observed in the lower region of the component near the through hole; in Figure 4(a), a displacement up to 0.45 mm is registered, compared to almost 0.3 mm in the output shown in Figure 4(b). Thus, the two simulations describe a different situation in terms of the overall deformation of the component and the upper surface.
Considering the above, each simulation FE model created is quite sensitive to the model parameters themselves, such as the mesh size and density.
If the effect of the mesh size is considered, the uncertainty contribution for the displacement provided by the simulation can therefore be evaluated as: (0.45 – 0.30) mm / √3 = 0.087 mm.
Other contributions should be considered, due, for example, to the choice of material characteristics and process parameters. A complete evaluation of the uncertainty of the simulation results should be carried out by running the program using different values for the parameters of influence.
In any case, a first validation of the model was made by a measurement campaign assessing the component’s dimensions and distortions, as presented in the following sections.
4. RESULTS
The results of the measuring campaign are represented in Figures 5–8. In particular:
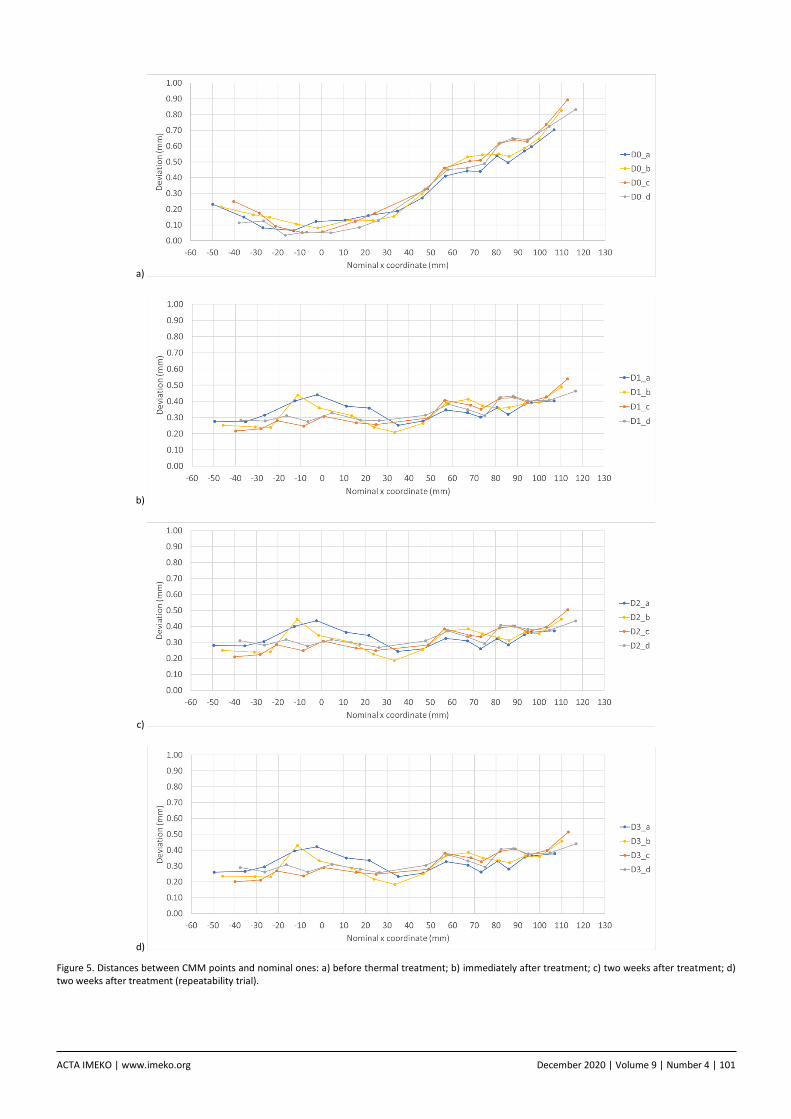
• Figures 5 a), b), c) and d) show the distances between CMM measured points and nominal ones before thermal treatment (D0), immediately after treatment (D1), approximately two weeks after treatment (D2) and in a repeated measure approximately two weeks after treatment (D3), respectively, for all four of the established measuring lines.
• Figures 6 a), b), c) and d) show the distances between CMM measured points and nominal ones along each of the four established lines. It can be seen that significant differences arise between data before treatment and data after treatment, in the order of 0.3 mm as the maximum difference.
• Figures 7 a), b), c) and d) show the distances between best fitted points and nominal ones in cases D0, D1, D2 and D3, respectively, for all of the four measuring lines.
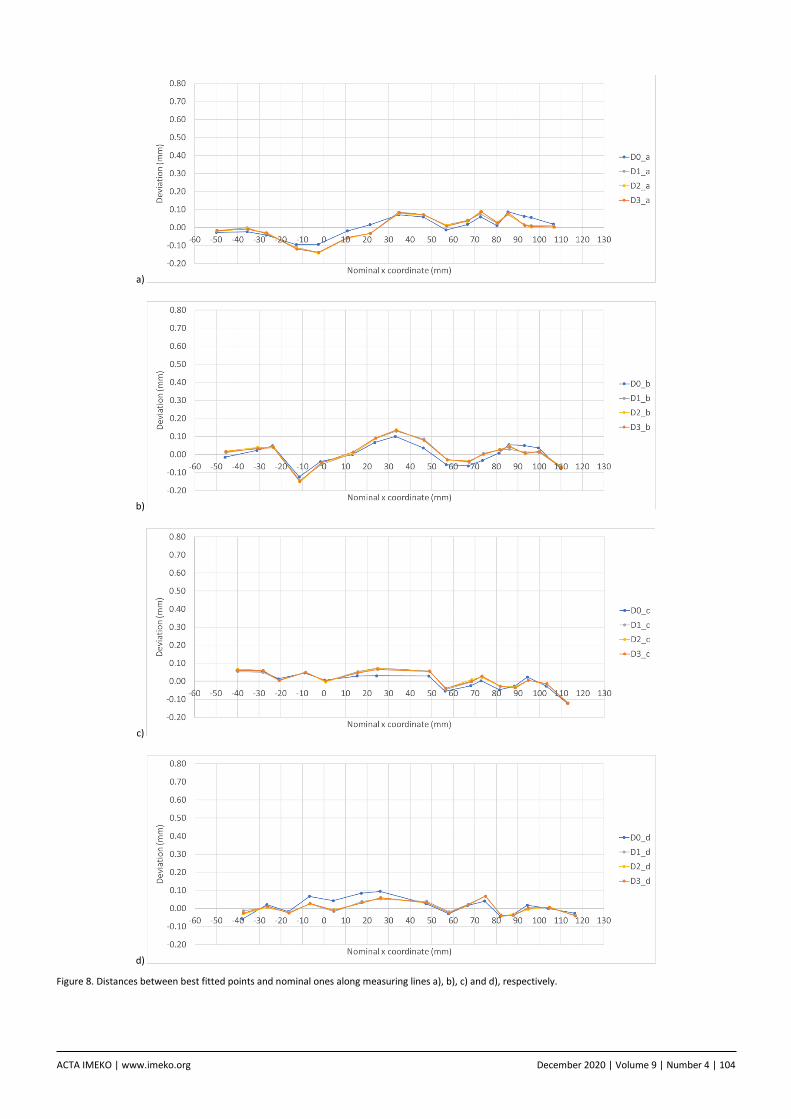
• Figures 8 a), b), c) and d) show the distances between best fitted points and nominal ones along each of the four lines. It can be seen that the best fitting procedure removes the differences between before and after treatment.
a) b)
Figure 4. Deformation obtained by simulations with different mesh size and discretisation.

ACTA IMEKO | www.imeko.org December 2020 | Volume 9 | Number 4 | 100
On the basis of the measuring data, some parameters of interest were calculated. First of all, the repeatability of the distances between CMM measured points and nominal ones, calculated on the basis of D2 and D3 data, was evaluated and found to equal 0.0094 mm in terms of max difference/√3; the value of 0.012 mm is found in terms of the root mean square (RMS) of the differences between the data.
Since the shape tolerance for the surface of the piece is equal to ± 0.05 mm, the expanded uncertainty of measurements found in the contribution of repeatability, which are in the order of 0.02 mm at a confidence level of 95 %, appears to be a critical value. That suggests the need for careful control of the whole measurement process to optimise it from a metrological point of view.
In particular, attention should be paid to the following aspects:
• workpiece alignment, which is the process of relating the part coordinate system and the machine coordinate system;
• the workpiece fixing procedure;
• the determination of the number of measurement points;
• the determination of the reference points on the nominal surface for the calculation of the distances of the experimental points from the surface itself. In Table 1, the RMS of differences between regression lines
and experimental points for the CMM data are shown for each line and in correspondence to each condition (D0, D1, D2, D3). In case D0, the fitting line has a slope other than zero; in cases D1-D3 (see Figure 5 b), 5 c), 5 d)) experimental distances are well fitted by horizontal lines, a sign that the experimental point clouds are parallel to the nominal surface. Therefore, measurements suggest that the main effect of the thermal treatment was a mitigation of the roto-translation of the surface of interest due to a reduction in thermal stresses in the supports.
With reference to Figure 5 and Figure 7, the max difference between measuring lines for each condition (D0, D1, D2, D3) for both CMM and best fitted data is shown in Table 2.
It can be seen that the variability between measuring lines is the same both for measured points and best fitted ones and both before and after the thermal treatment. This indicates that the surface irregularities were practically unaffected by the thermal treatment.
Finally, the average distance of the experimental points from the nominal surface in the area of the hole (Figure 4. Deformation obtained by simulations with different mesh size and discretisation.) was calculated and found to be equal to 0.39 mm in case D1 and 0.34 mm in cases D2 and D3. These values are comparable with the values obtained by means of the simulation, as said in Section 3 (0.45 mm and 0.30 mm for the highest displacement, corresponding to different mesh sizes and densities); therefore, the simulation results seem to be satisfactory.
5. CONCLUSIONS
This study aimed to analyse some practical issues of both technological and metrological type in order to optimise the AM process of a component for aerospace applications. Surface tolerances in the order of ± 0.05 mm have to be satisfied on specific parts of the specimen and should be checked by means of a hybrid approach based on both simulation of the process and dimensional measurement by CMM.
In particular, the effect of thermal treatment after the realisation of the piece was of interest with regard to the possibility of reducing surface irregularities and absolute displacement of the parts under tolerance.
Two kinds of analysis were carried out: 1. the evaluation of the causes of variability connected to the
simulation approach and to the experimental measurements and their effect, in order to estimate the uncertainty of data for conformity assessment purposes;
2. the evaluation of the capability of simulation and CMM measurements to contribute to the monitoring of the process, in order to use their indications for process optimisation.
The main results related to point 1) are the following:
• With regard to the simulation, the greatest effect of changing the mesh is in the order of 0.1 mm, without considering the uncertainty contributions due to material characteristics and process variability.
• With regard to the CMM measurements, repeatability is in the order of 0.01 mm. This does not take into account the effects of fixing or positioning or of the best fitting procedure that was done to evaluate the reference surface and its modification due to the process; these effects could increase the variability of the measurements. The main results related to point 2) are the following:
• In the area of interest, the differences between the predictions of absolute displacement, in the order of 0.45 mm, and the measured absolute displacements are negligible; therefore, the behaviour of the simulation seems to be satisfactory. Of course, variability of prediction should be taken into account. Measurements indicate that the main effect of the thermal treatment is to substantially mitigate the roto-translation of the surface of interest, which is caused by thermal stresses in the supports during manufacturing.
• The surface irregularities seem practically unaffected by the thermal treatment, being the same before and after it. Due to these considerations, simulation was useful for
predicting the behaviour of the supports, as we were unable to achieve the needed accuracy in the order of ± 0.05 mm for the conformity assessment of surface tolerances.
CMM measurements could be used for this assessment, provided that the procedure is optimised from a metrological point of view.
Table 1. RMS (mm) of differences between regression lines and experimental points for each line and in correspondence to each condition (D0, D1, D2, D3) for CMM data (ref. Figure 5).
Condition Line ‘a’ Line ‘b’ Line ‘c’ Line ‘d’
D0 0.089 0.11 0.11 0.088
D1 0.050 0.063 0.037 0.033
D2 0.052 0.064 0.036 0.033
D3 0.053 0.064 0.036 0.033
Table 2. Max difference between lines (mm) for each condition (D0, D1, D2, D3).
D0 D1 D2 D3
CMM data 0.17 0.17 0.16 0.16
Best fitted data 0.16 0.17 0.17 0.17
ACTA IMEKO | www.imeko.org December 2020 | Volume 9 | Number 4 | 101
a)
b)
c)
d)
Figure 5. Distances between CMM points and nominal ones: a) before thermal treatment; b) immediately after treatment; c) two weeks after treatment; d) two weeks after treatment (repeatability trial).

ACTA IMEKO | www.imeko.org December 2020 | Volume 9 | Number 4 | 102
a)
b)
c)
d)
Figure 6. Distances between CMM points and nominal ones along measuring lines a), b), c) and d), respectively.

ACTA IMEKO | www.imeko.org December 2020 | Volume 9 | Number 4 | 103
a)
b)
c)
d)
Figure 7. Distances between best fitted points and nominal ones: a) before thermal treatment; b) immediately after treatment; c) two weeks after treatment; d) two weeks after treatment (repeatability trial).
ACTA IMEKO | www.imeko.org December 2020 | Volume 9 | Number 4 | 104
a)
b)
c)
d)
Figure 8. Distances between best fitted points and nominal ones along measuring lines a), b), c) and d), respectively.

ACTA IMEKO | www.imeko.org December 2020 | Volume 9 | Number 4 | 105
Future work will be devoted to improving the whole hybrid procedure in order to reduce the uncertainty effects both on the simulation, taking into account all causes, and on the CMM measurements, including measurement data processing techniques.
This way, the uncertainty of the simulation process will be improved by validation from CMM measurements for better process control and definition. The CMM measurements will also enable assessment of the component’s conformity to the strict tolerances required for aerospace applications.
ACKNOWLEDGEMENT
The authors are grateful to Thales Alenia Space (Italy), Renishaw S.p.A. (To), TAV Vacuum Furnaces S.p.A (Caravaggio, BG) and Additive Works GmbH (Bremen) for their support of the present work.
REFERENCES
[1] A. Townsend, N. Senin, L. Blunt, R. K. Leach, J. S. Taylord, Surface texture metrology for metal additive manufacturing: A review, Precision Engineering 46 (2016), pp. 34-47. DOI: https://doi.org/10.1016/j.precisioneng.2016.06.001
[2] N. Li, S. Huang, G. Zhang, R. Qin, W. Liu, H. Xiong, G. Shi, J. Blackburn, Progress in additive manufacturing on new materials: A review, Journal of Materials Science and Technology 35 (2019), pp. 242-269. DOI: https://doi.org/10.1016/j.jmst.2018.09.002
[3] H. G. Lemu, On opportunities and limitations of additive manufacturing technology for Industry 4.0 era, in: Advanced Manufacturing and Automation VIII, vol 484. K. Wang, Y. Wang, J., Y. T. Strandhagen, T. Yu (editors). Springer, Singapore, 2018, ISBN 978-981-13-2375-1.
[4] C. Li, Z. Y. Liu, X. Y. Fang, Y. B. Guo, Residual stresses in metal additive manufacturing, Procedia CIRP, 71 (2018), pp. 348-353. DOI: https://doi.org/10.1016/j.procir.2018.05.039
[5] M. Shiomi, K. Osakada, K. Nakamura, T. Yamashita, F. Abe, Residual stress within metallic model made by selective laser melting process, CIRP Annals 53(1) (2004), pp. 195-198. DOI: https://doi.org/10.1016/S0007-8506(07)60677-5
[6] P. Mercelis, J-P. Kruth, Residual stresses in selective laser sintering and selective laser melting, Rapid Prototyping Journal 12(5) (2006), pp. 254-265. DOI: https://doi.org/10.1108/13552540610707013
[7] J. V. Aguado, B. Bognet, D. Canales, O. Desmaison, F. Boitout, F. Chinesta, A reduced order modeling approach for fast thermo-mechanics simulation of additive layer manufacturing, Proc. of the 1st ECCOMAS Simulation for Additive Manufacturing, Munich, Germany, 11-13 October 2017.
[8] O. Fergani, F. Berto, T. Welo, S. Y. Liang, Analytical modelling of residual stresses in additive manufacturing, Fatigue Fract Engng Mater Struct 40 (2017), pp. 971-978. DOI: https://doi.org/10.1111/ffe.12560
[9] D. Moser, C. Michael, M. Jayathi, Multi-scale computational modeling of residual stress in selective laser melting with uncertainty quantification, Additive Manufacturing 29 (2019), 100770. DOI: https://doi.org/10.1016/j.addma.2019.06.021
[10] A. Flood, F. Liou, Review of metal AM simulation validation techniques, Journal of Mechanics Engineering and Automation 8 (2018), pp. 43-52. DOI: https://doi.org/10.17265/2159-5275/2018.02.001
[11] G. D’Emilia, A. Di Ilio, A. Gaspari, E. Natale, R. Perilli, A. G. Stamopoulos, The role of measurement and simulation in additive manufacturing within the frame of Industry 4.0, II Workshop on Metrology for Industry 4.0 and IoT, Naples, Italy, 4-6 June 2019, pp. 382-387. DOI: https://doi.org/10.1109/METROI4.2019.8792876
[12] G. D'Emilia, D. Di Gasbarro, A. Gaspari, E. Natale, Managing the uncertainty of conformity assessment in environmental testing by machine learning, Measurement 124 (2018), pp. 560-567. DOI: https://doi.org/10.1016/j.measurement.2017.12.034
[13] S. A. Sillars, C. J. Sutcliffe, A. M. Philo, S. G. R. Brown, J. Sienz, N. P. Lavery, The three-prong method: A novel assessment of residual stress in laser powder bed fusion, Virtual and Physical Prototyping 13 (2018), pp. 20-25. DOI: https://doi.org/10.1080/17452759.2017.1392682
[14] R. Leach, Metrology for Additive Manufacturing, Measurement and Control 49 (2016), pp. 132-135. DOI: https://doi.org/10.1177/0020294016644479
[15] M. A. Badar, S. Raman, P. S. Pulat, Experimental verification of manufacturing error pattern and its utilization in form tolerance sampling, International Journal of Machine Tools and Manufacture 45 (2005), pp. 63-73. DOI: https://doi.org/10.1016/j.ijmachtools.2004.06.017
[16] A. A. Korolev, A. V. Kochetkov, O. V. Zakharov, Optimization of control points number at coordinate measurements based on the Monte-Carlo method, Journal of Physics: Conference Series 944 (2018), 012061, 8 pages. DOI: https://doi.org/10.1088/1742-6596/944/1/012061
[17] J. C. Francis, L. Bian, Deep learning for distortion prediction in laser-based additive manufacturing using big data, Manufacturing Letters 20 (2019), pp. 10-14. DOI: https://doi.org/10.1016/j.mfglet.2019.02.001
[18] G. D’Emilia, A. Gaspari, E. Hohowieler, A. Laghmouchi, E. Uhlmann, Improvement of defect detectability in machine tools using sensor-based condition monitoring applications, Procedia CIRP 67 (2018), pp. 325-331. DOI: https://doi.org/10.1016/j.procir.2017.12.221
[19] G. D’Emilia, A. Gaspari, E. Natale, Measurements for smart manufacturing in an Industry 4.0 scenario a case-study on a mechatronic system, 2018 Workshop on Metrology for Industry 4.0 and IoT, Brescia, Italy, 16-18 April 2018, pp. 107-111. DOI: https://doi.org/10.1109/METROI4.2018.8428341
[20] G. D’Emilia, A. Gaspari, Measurement-uncertainty as an innovative management tool in modern engineering systems, 14th IMEKO TC10 Workshop on Technical Diagnostics 2016: New Perspectives in Measurements, Tools and Techniques for Systems Reliability, Maintainability and Safety, Milan, Italy, 27-28 June 2016, pp. 197-202. Online [Accessed 02 December 2020] https://www.imeko.org/publications/tc10-2016/IMEKO-TC10-2016-040.pdf
[21] M. C. Kushan, O. Poyraz, Y. Uzunonat, S. Orak, Systematical review on the numerical simulations of laser power bed additive manufacturing, Sigma Journal of Engineering and Natural Sciences 36 (2018), pp. 1197-1214. Online [Accessed 02 December 2020] https://eds.yildiz.edu.tr/AjaxTool/GetArticleByPublishedArticleId?PublishedArticleId=2734