uncertainty, measurement, and models · uncertainty, measurement, and models lecture 2 ......
TRANSCRIPT
Uncertainty, Measurement, and
Models
Lecture 2
Physics 2CL
Summer Session 2011
Outline
• What is uncertainty (error) analysis and what
can it do for you
• Issues with measurement and observation
• What does a model do?
• Brief overview of circuit analysis
• Andrew Briggs – office hours 12 -2 pm MW
• Register Clicker on
http://www.iclicker.com/registration/

What is uncertainty (error)?
• Uncertainty (or error) in a measurement is not the same as a mistake
• Uncertainty results from:
– Limits of instruments
• finite spacing of markings on ruler
– Design of measurement
• using stopwatch instead of photogate
– Less-well defined quantities
• composition of materials
Understanding uncertainty is
important
• for comparing values
• for distinguishing between models
• for designing to specifications/planning
Measurements are less useful (often useless)
without a statement of their uncertainty
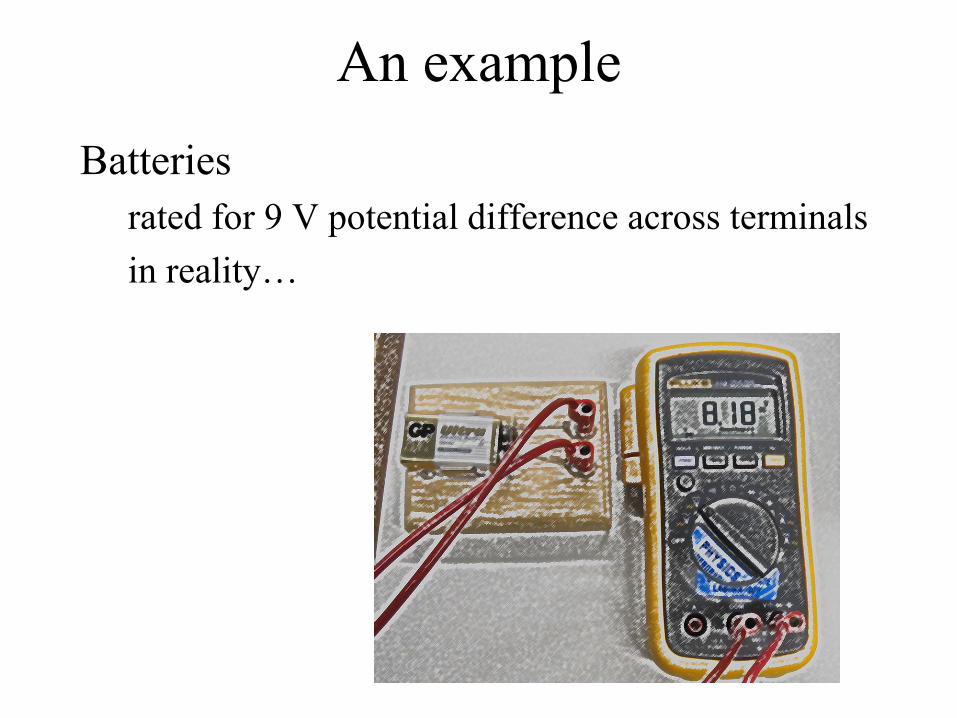
An example
Batteries
rated for 9 V potential difference across terminals
in reality…
Utility of uncertainty analysis
• Evaluating uncertainty in a measurement
and calculated quantities
• Propagating errors – ability to extend results
to other measurements
• Analyzing a distribution of values
• Quantifying relationships between
measured values
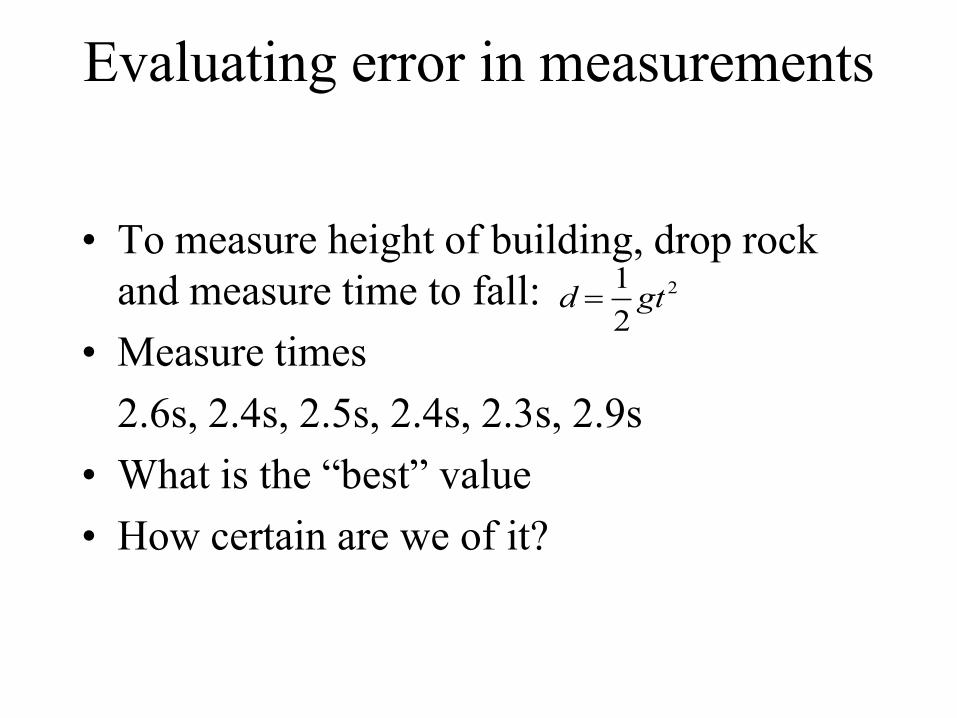
Evaluating error in measurements
• To measure height of building, drop rock
and measure time to fall:
• Measure times
2.6s, 2.4s, 2.5s, 2.4s, 2.3s, 2.9s
• What is the “best” value
• How certain are we of it?
d 1
2gt 2
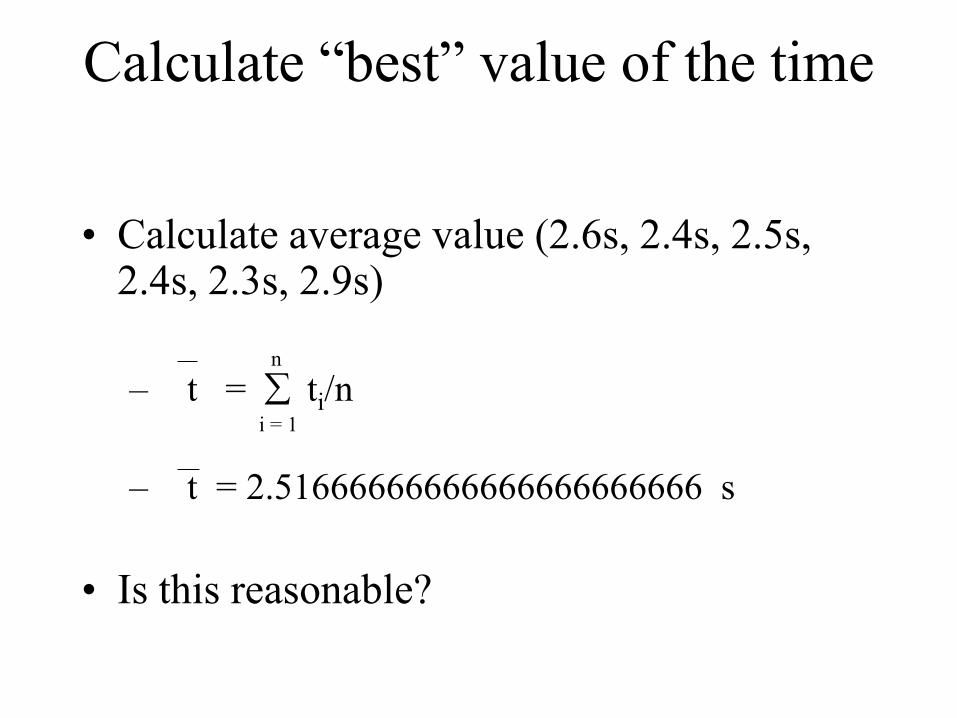
• Calculate average value (2.6s, 2.4s, 2.5s, 2.4s, 2.3s, 2.9s)
– t = ti/n
– t = 2.51666666666666666666666 s
• Is this reasonable?
Calculate “best” value of the time
i = 1
n
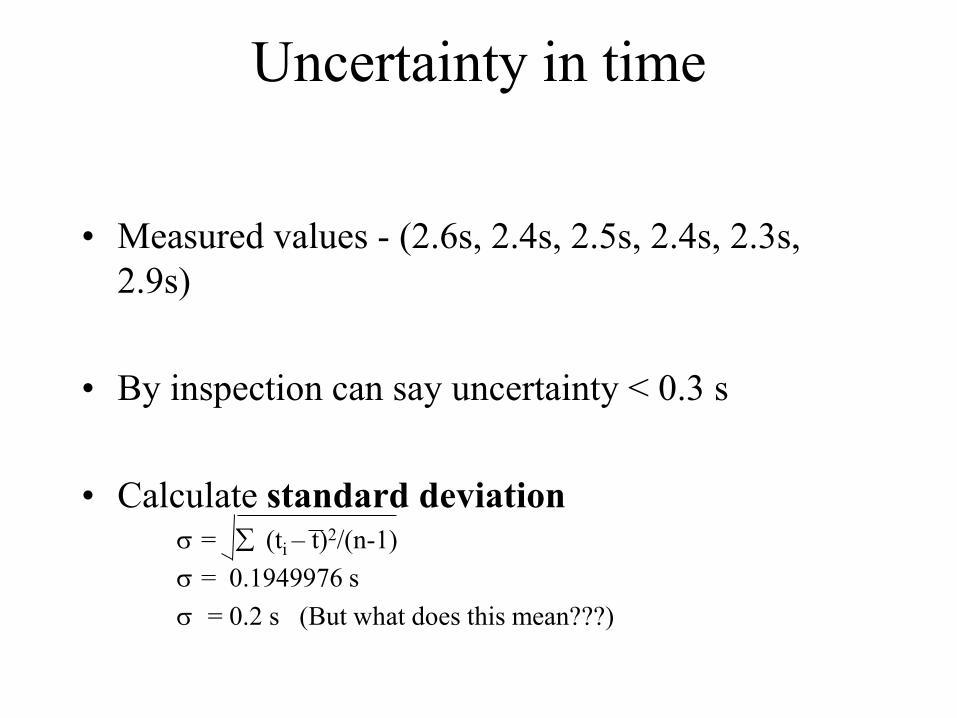
Uncertainty in time
• Measured values - (2.6s, 2.4s, 2.5s, 2.4s, 2.3s,
2.9s)
• By inspection can say uncertainty < 0.3 s
• Calculate standard deviation = (ti – t)2/(n-1)
= 0.1949976 s
= 0.2 s (But what does this mean???)
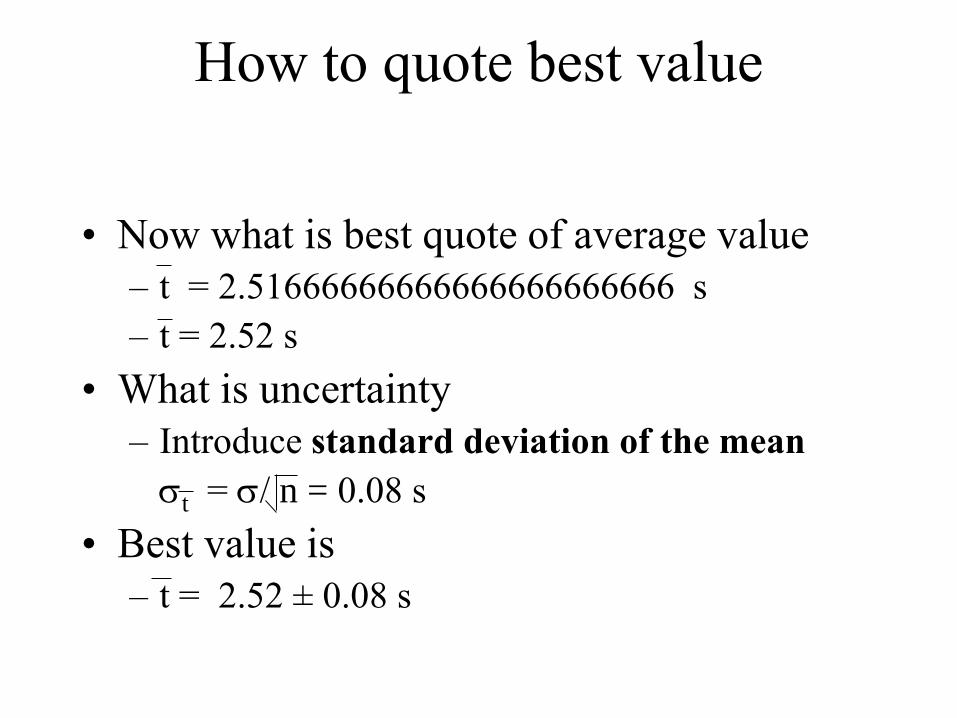
How to quote best value
• Now what is best quote of average value
– t = 2.51666666666666666666666 s
– t = 2.52 s
• What is uncertainty
– Introduce standard deviation of the mean
t = /n = 0.08 s
• Best value is
– t = 2.52 ± 0.08 s
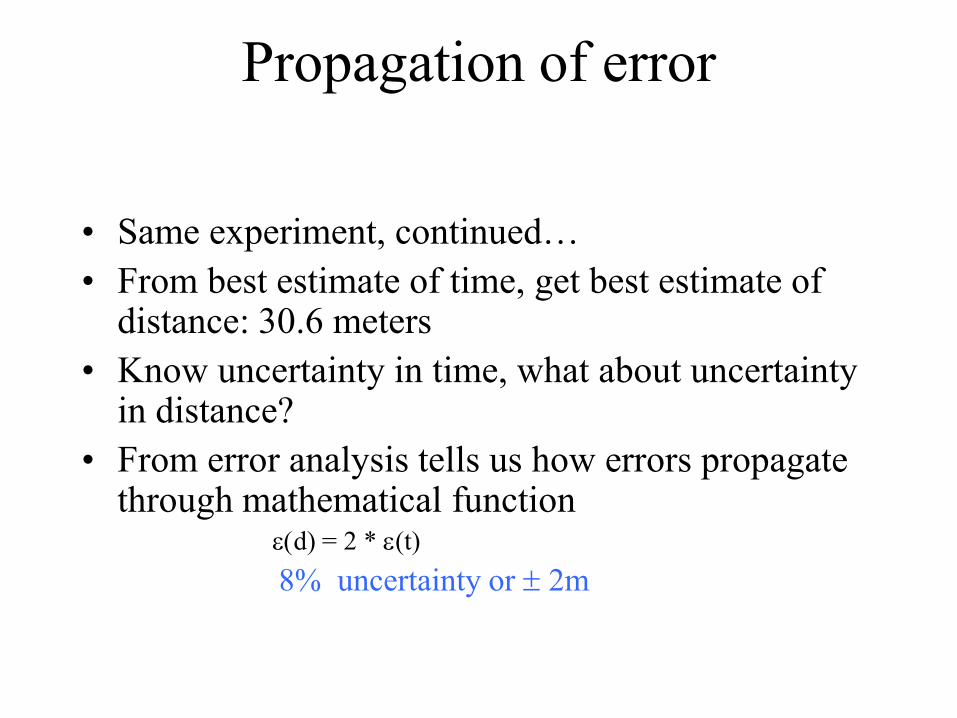
Propagation of error
• Same experiment, continued…
• From best estimate of time, get best estimate of distance: 30.6 meters
• Know uncertainty in time, what about uncertainty in distance?
• From error analysis tells us how errors propagate through mathematical function
e(d) = 2 * e(t)
8% uncertainty or 2m
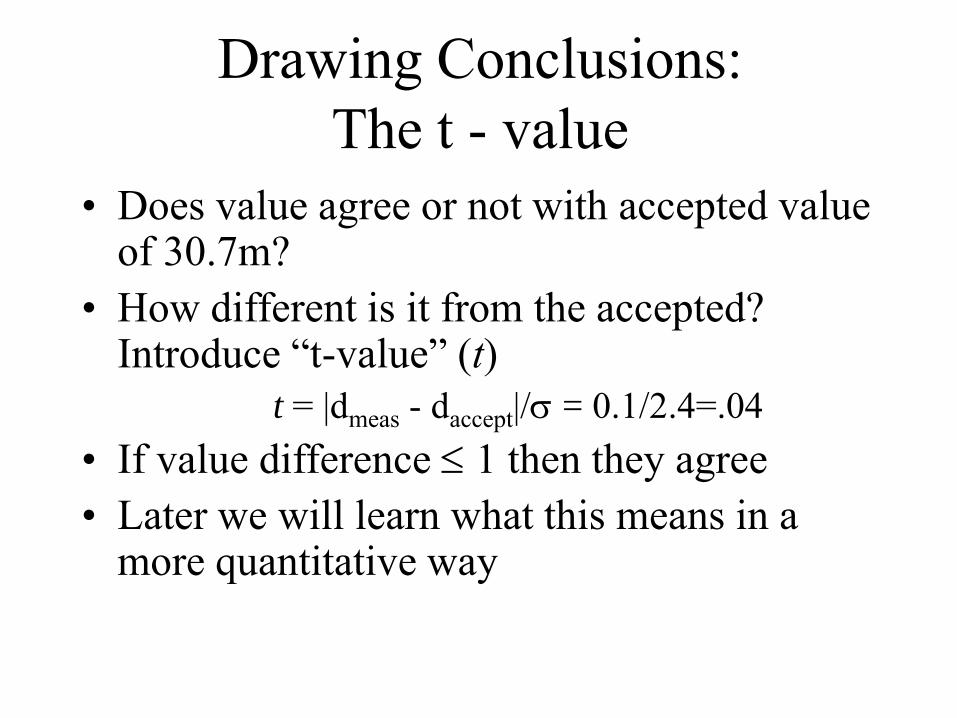
Drawing Conclusions:
The t - value
• Does value agree or not with accepted value of 30.7m?
• How different is it from the accepted? Introduce “t-value” (t)
t = |dmeas - daccept|/ = 0.1/2.4=.04
• If value difference 1 then they agree
• Later we will learn what this means in a more quantitative way
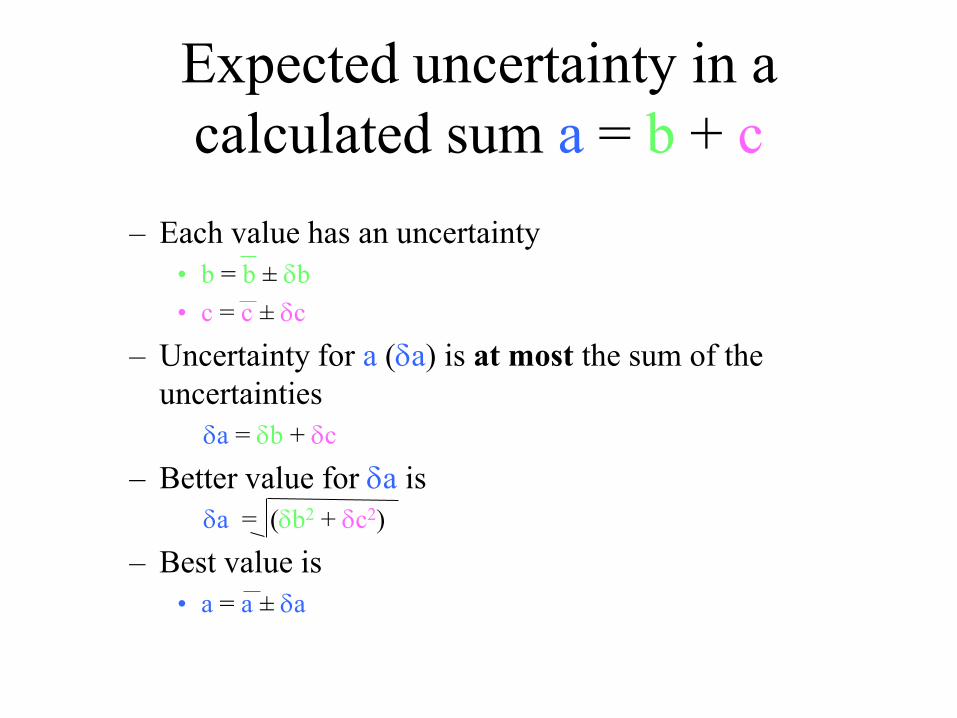
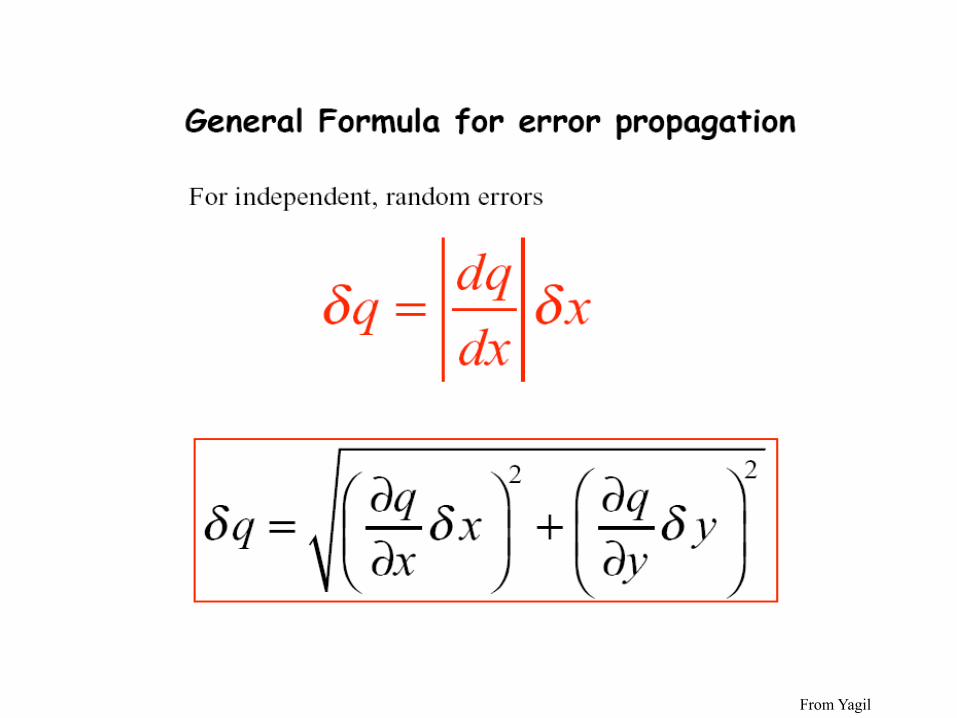
Expected uncertainty in a
calculated sum a = b + c
– Each value has an uncertainty
• b = b ± db
• c = c ± dc
– Uncertainty for a (da) is at most the sum of the
uncertainties
da = db + dc
– Better value for da is
da = (db2 + dc2)
– Best value is
• a = a ± da
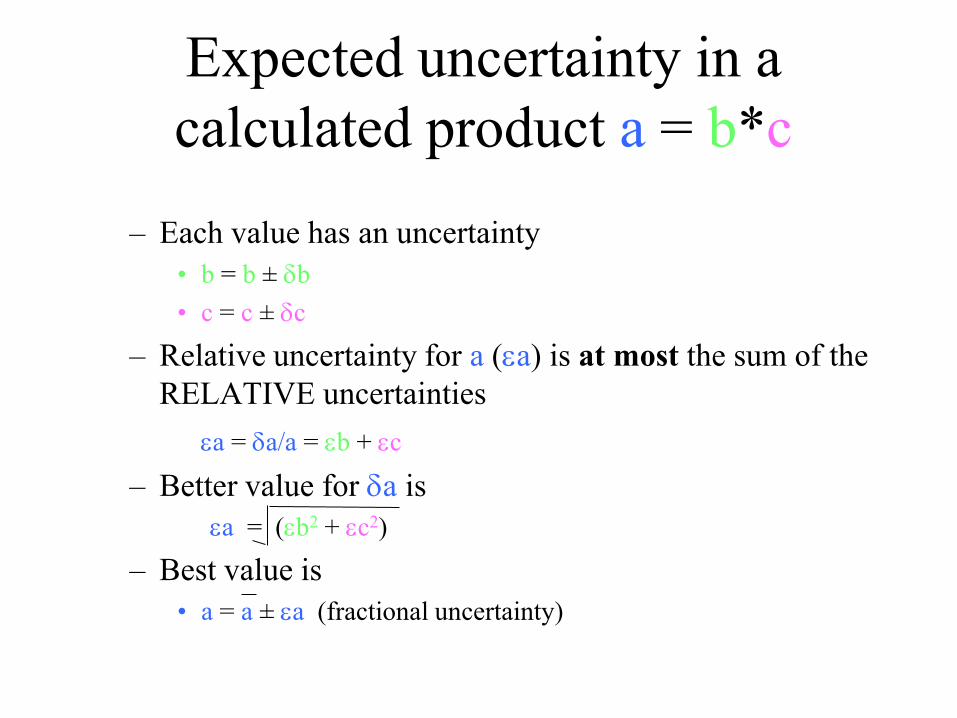
Expected uncertainty in a
calculated product a = b*c
– Each value has an uncertainty
• b = b ± db
• c = c ± dc
– Relative uncertainty for a (ea) is at most the sum of the
RELATIVE uncertainties
ea = da/a = eb + ec
– Better value for da is
ea = (eb2 + ec2)
– Best value is
• a = a ± ea (fractional uncertainty)

What about powers in a product
a = b*c2
– Each value has an uncertainty
• b = b ± db
• c = c ± dc
• ea = da/a (relative uncertainty)
– powers become a prefactor (weighting) in the error
propagation
• ea = (eb2 + (2*ec)2)
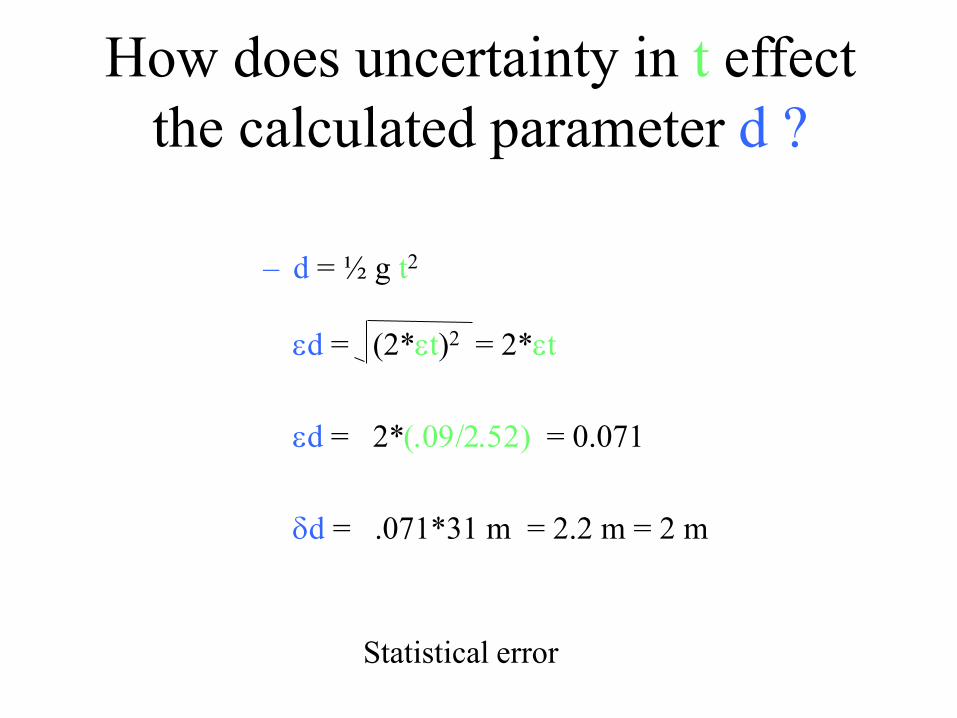
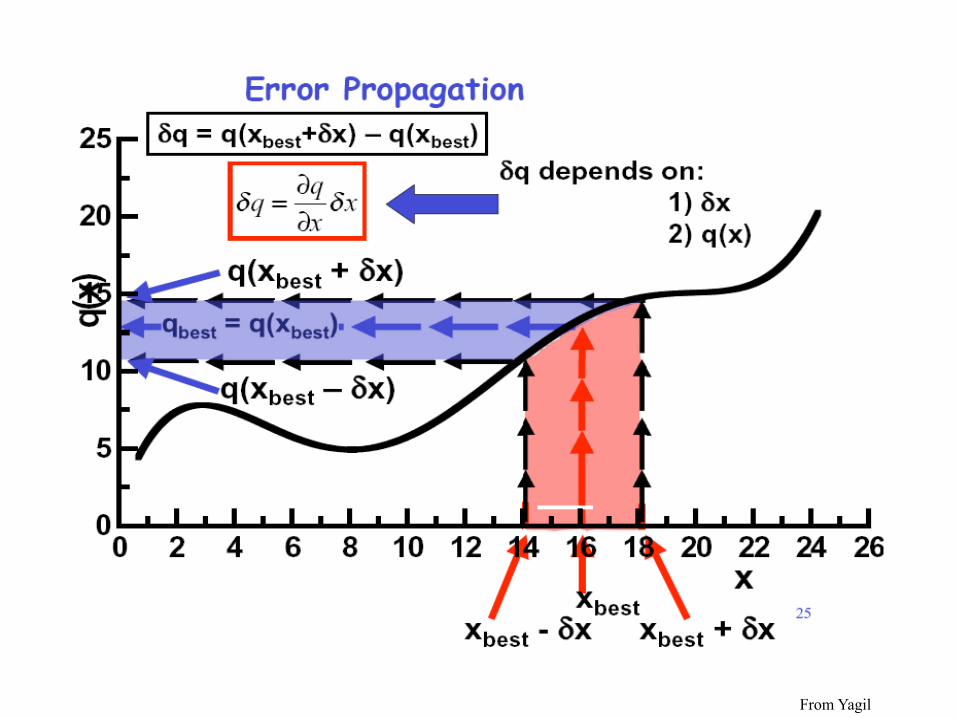
How does uncertainty in t effect
the calculated parameter d ?
– d = ½ g t2
ed = (2*et)2 = 2*et
ed = 2*(.09/2.52) = 0.071
dd = .071*31 m = 2.2 m = 2 m
Statistical error
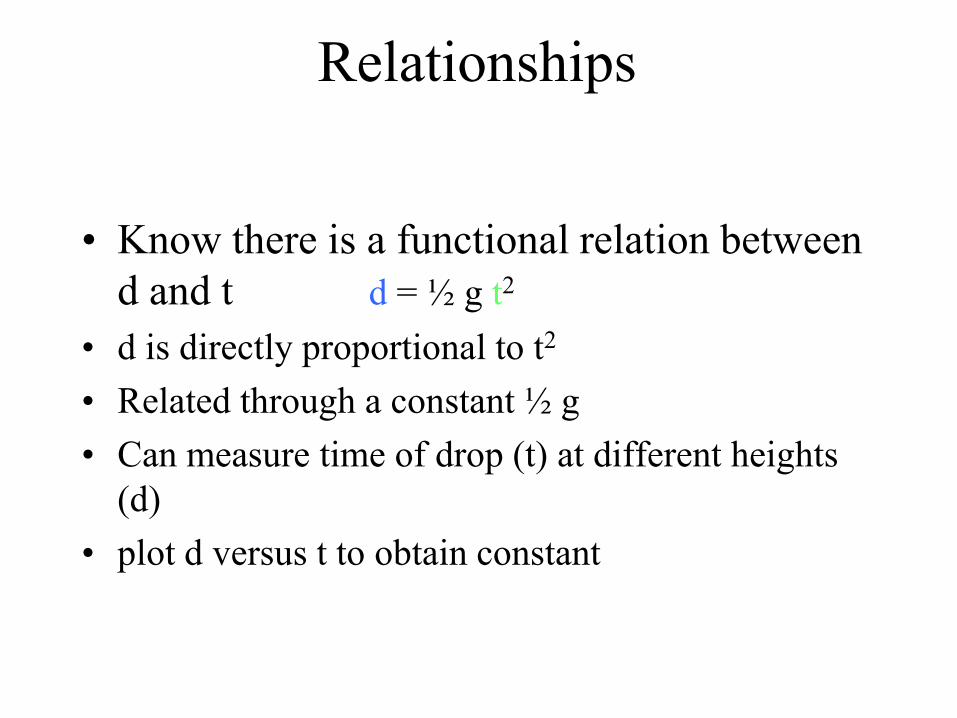
Relationships
• Know there is a functional relation between
d and t d = ½ g t2
• d is directly proportional to t2
• Related through a constant ½ g
• Can measure time of drop (t) at different heights
(d)
• plot d versus t to obtain constant

Quantifying relationships
0 2 4 6 8 100
100
200
300
400
500
FIT:
g = 8.3 ± 0.3 m/s2
d
ista
nce
[m
]
time [s]
d = ½ gt2
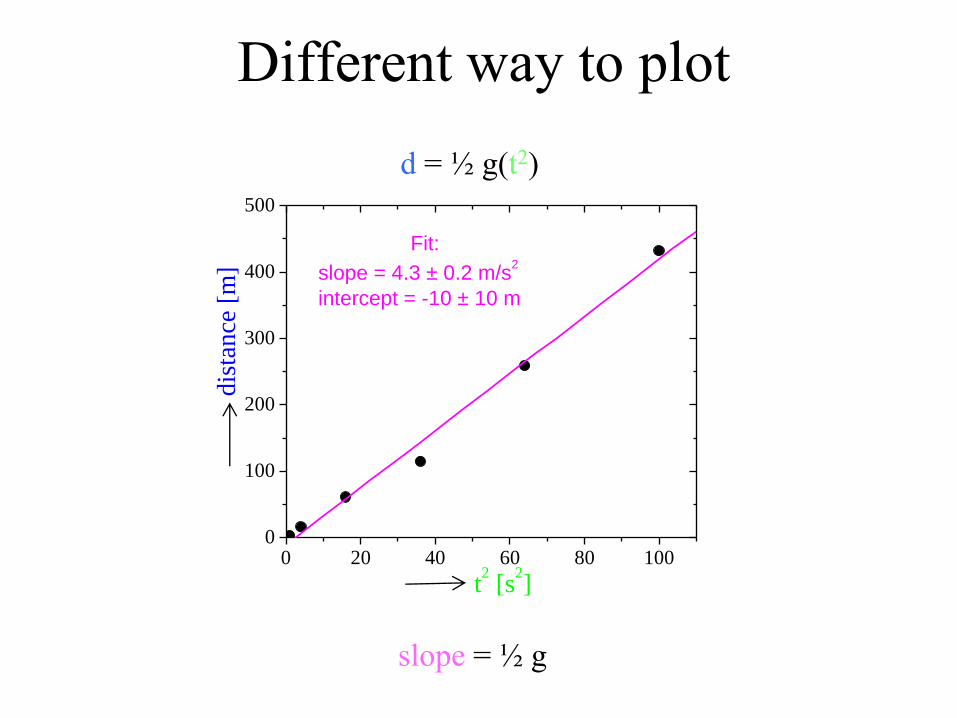
Different way to plot
0 20 40 60 80 1000
100
200
300
400
500
Fit:
slope = 4.3 ± 0.2 m/s2
intercept = -10 ± 10 m
dis
tan
ce [
m]
t2 [s
2]
d = ½ g(t2)
slope = ½ g
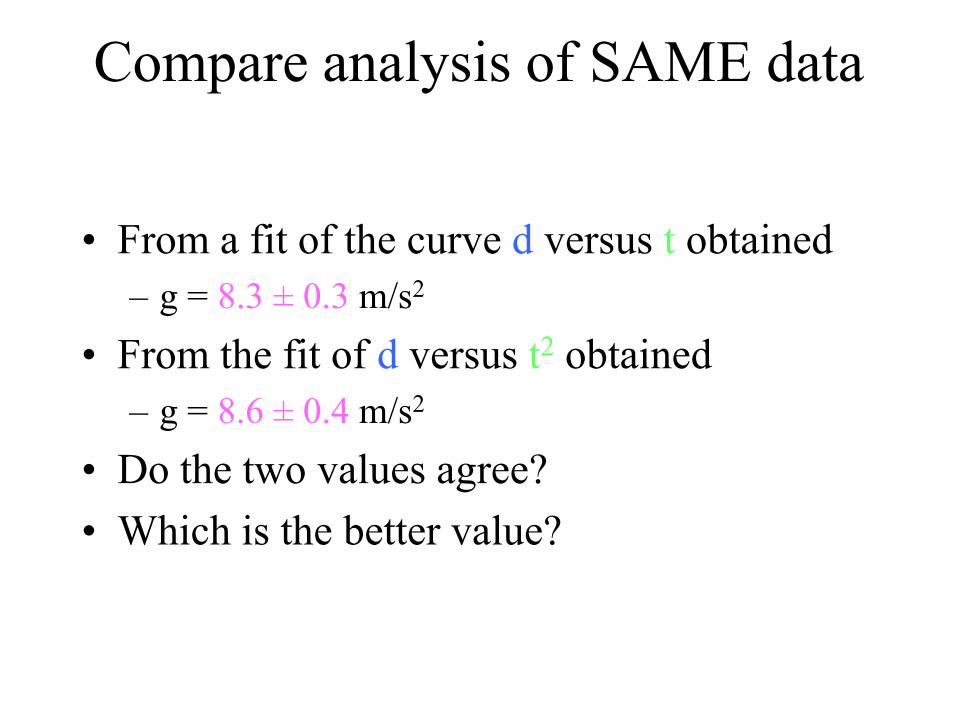
Compare analysis of SAME data
• From a fit of the curve d versus t obtained
– g = 8.3 ± 0.3 m/s2
• From the fit of d versus t2 obtained
– g = 8.6 ± 0.4 m/s2
• Do the two values agree?
• Which is the better value?
From Yagil
From Yagil
Measurement and Observation
• Measurement: deciding the amount of a
given property by observation
• Empirical
• Not logical deduction
• Not all measurements are created equal…
Reproducibility
• Same results under similar circumstances
– Reliable/precise
• „Similar‟ - a slippery thing
– Measure resistance of metal
• need same sample purity for repeatable measurement
• need same people in room?
• same potential difference?
– Measure outcome of treatment on patients
• Can‟t repeat on same patient
• Patients not the same
Precision and Accuracy
• Precise - reproducible
• Accurate - close to true value
• Example - temperature measurement
– thermometer with
• fine divisions
• or with coarse divisions
– and that reads
• 0 C in ice water
• or 5 C in ice water

P
r
e
c
i
s
i
o
n
Accuracy
AccuracyAccuracy vs. Precision
Random and Systematic Errors
• Accuracy and precision are related to types
of errors
– random (thermometer with coarse scale)
• can be reduced with repeated measurements, careful
design
– systematic (calibration error)
• difficult to detect with error analysis
• compare to independent measurement
Observations in Practice
• Does a measurement measure what you
think it does? Validity
• Are scope of observations appropriate?
– Incidental circumstances
– Sample selection bias
• Depends on model
Models
• Model is a construction that represents a
subject or imitates a system
• Used to predict other behaviors
(extrapolation)
• Provides context for measurements and
design of experiments
– guide to features of significance during
observation
Testing model
• Models must be consistent with data
• Decide between competing models
– elaboration: extend model to region of
disagreement
– precision: prefer model that is more precise
– simplicity: Ockham‟s razor
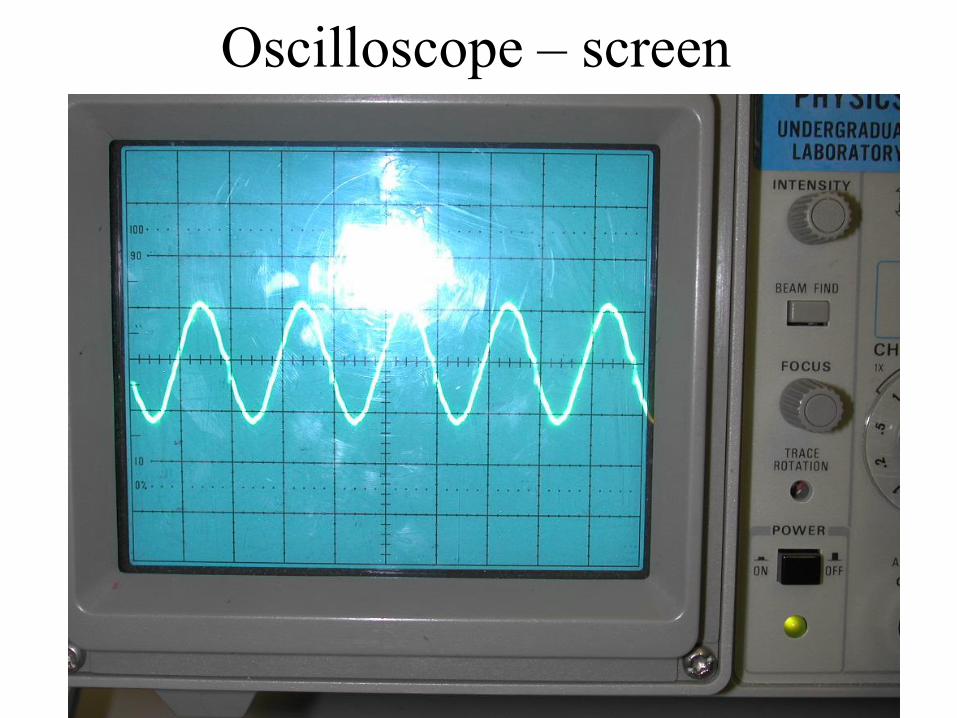
Oscilloscope – screen
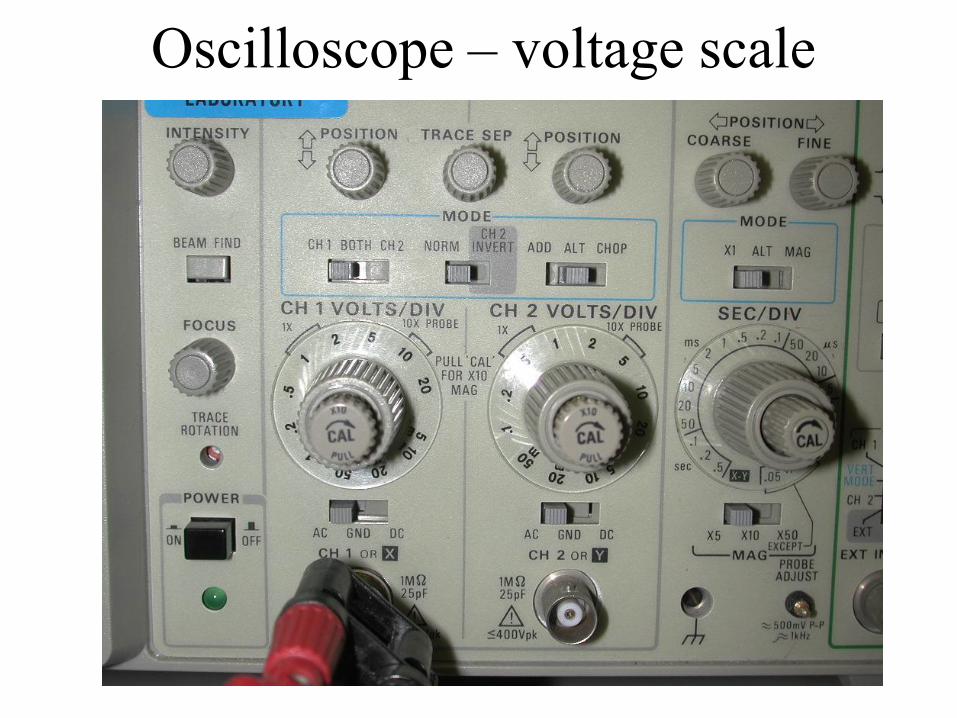
Oscilloscope – voltage scale
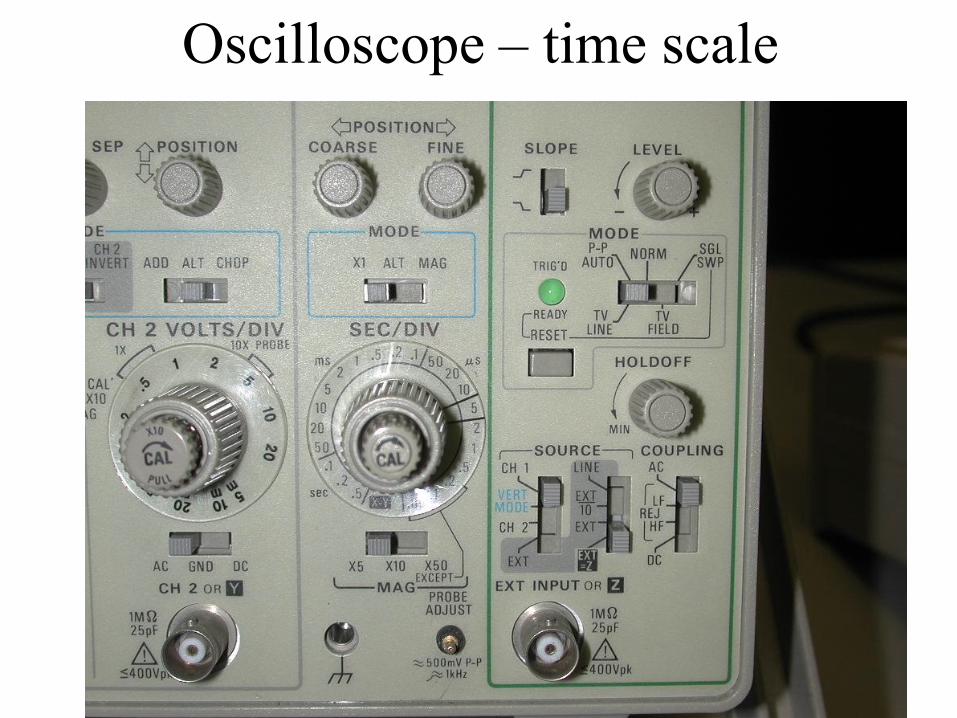
Oscilloscope – time scale
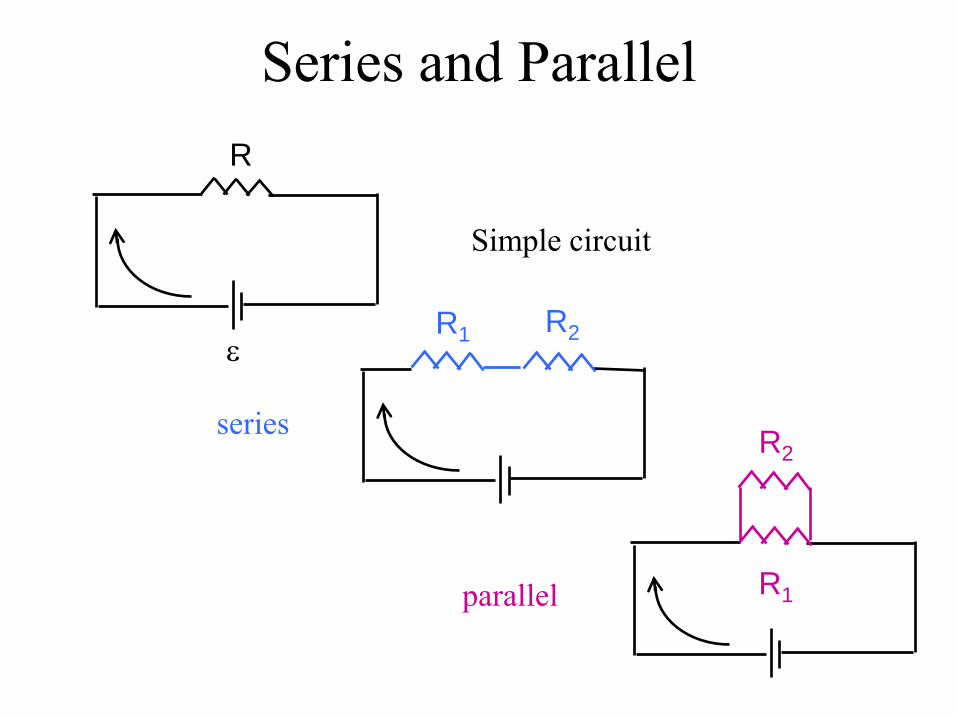
Series and Parallel
Simple circuit
series
parallel
R
eR1 R2
R1
R2
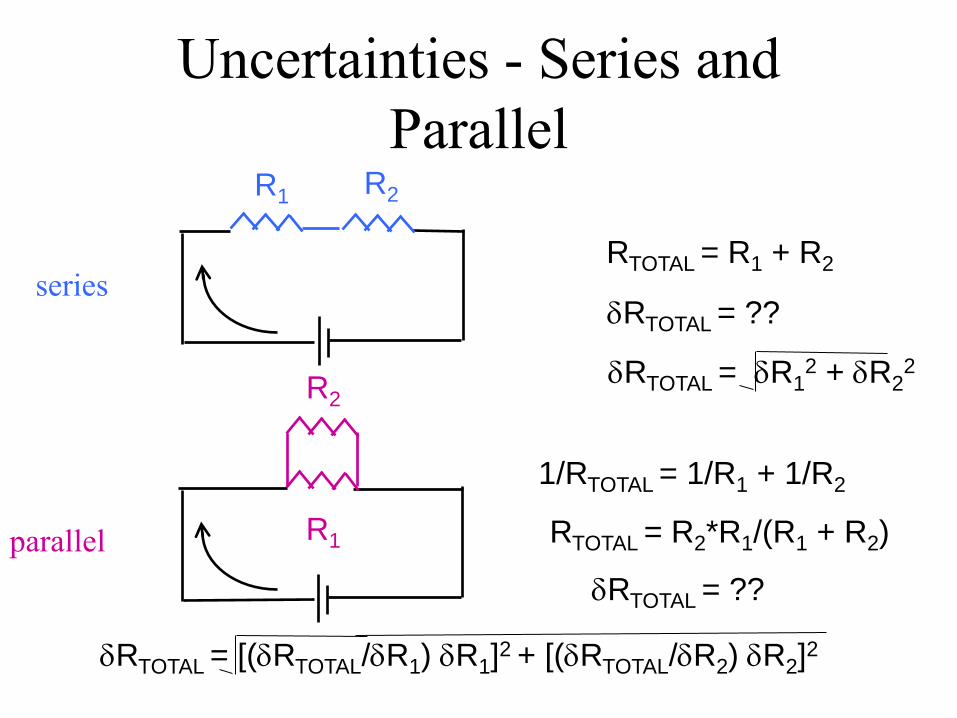
Uncertainties - Series and
Parallel
series
R1 R2
parallel R1
R2
RTOTAL = R1 + R2
1/RTOTAL = 1/R1 + 1/R2
dRTOTAL = ??
dRTOTAL = dR12 + dR2
2
dRTOTAL = ??
RTOTAL = R2*R1/(R1 + R2)
dRTOTAL = [(dRTOTAL/dR1) dR1]2 + [(dRTOTAL/dR2) dR2]
2
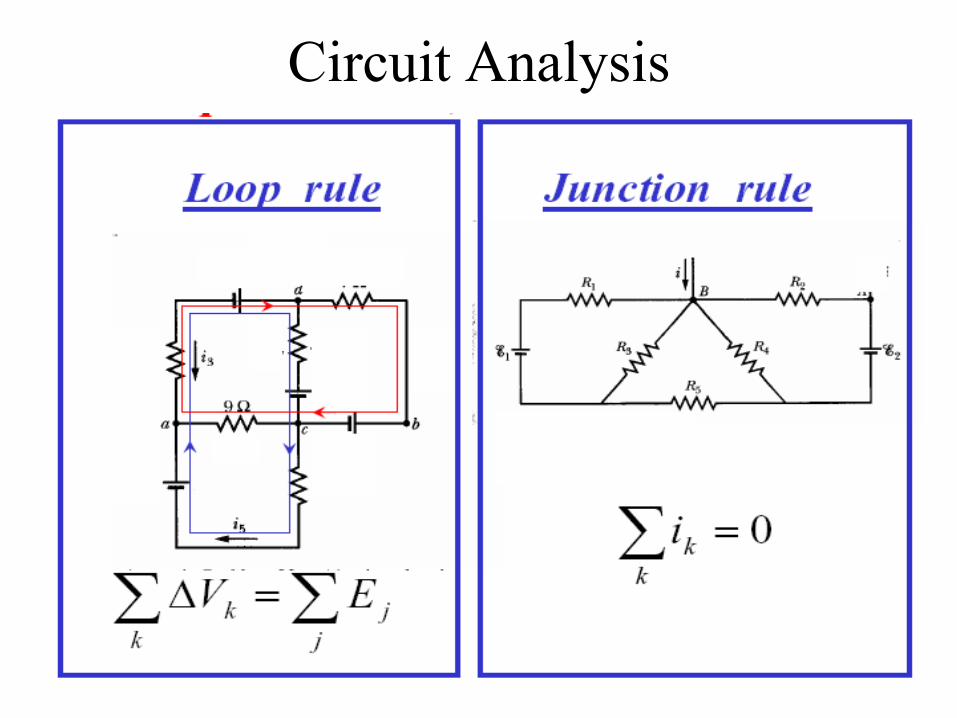
Circuit Analysis
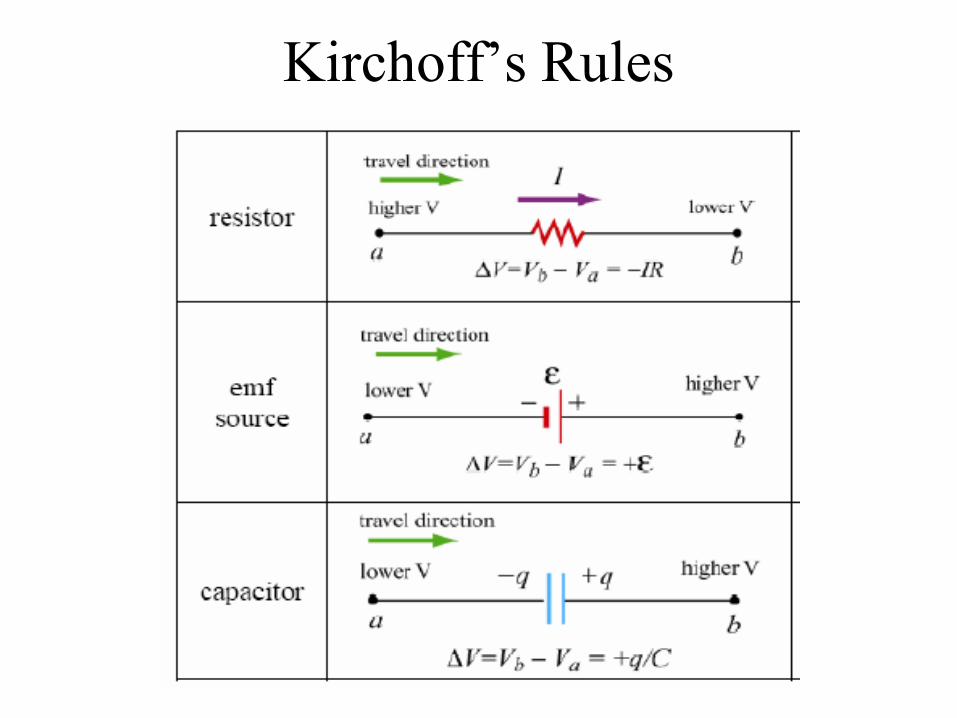
Kirchoff‟s Rules
Reminder
• perform lab #0
• Read and Prepare for lab # 1 on Tuesday
• Read Taylor through chapter 3
• Do assigned homework – Taylor problems
3.7, 3.36, 3.41
• Next week start Clickers
• Next week start quizzes