ulusoy electriculusoyelektrik.com.tr/uploads/other/pagedocument/yatirimci-sunumu... · august 2017...
TRANSCRIPT

Ulusoy Electric2Q 17 Results
August 2017

Enis UlusoyBoard Member & Deputy General Manager
Table of
Contents
2Q17 Highligts
Sector and Ulusoy Elektrik
Financials
1
6
19

2Q17 Highlights

August 2017 2Q17 Results
2Q17 Highlights
5
• Significant Growth with record high 2Q Revenues
• Increased margins, 28,5% EBITDA
• Government Focus & Priority in Energy Investments
• Stronger Position in the domestic market with new competition environment
• Electricity Distribution Company Investments
• Diversified Exports
• Strong Order Book for the upcoming quarters

Sector and Ulusoy Elektrik
August 2017 2Q17 Results
Sector (Domestic)
8
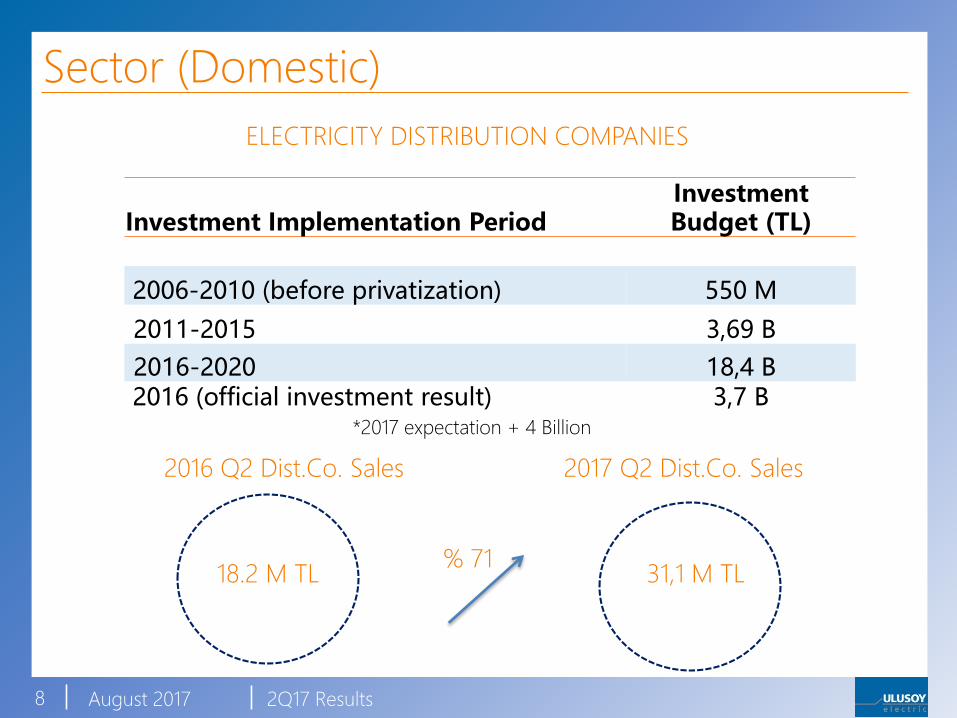
ELECTRICITY DISTRIBUTION COMPANIES
Investment Implementation PeriodInvestmentBudget (TL)
2006-2010 (before privatization) 550 M
2011-2015 3,69 B
2016-2020 18,4 B2016 (official investment result) 3,7 B
2016 Q2 Dist.Co. Sales 2017 Q2 Dist.Co. Sales
18.2 M TL 31,1 M TL % 71
*2017 expectation + 4 Billion

August 2017 2Q17 Results
Sector (Domestic)
9
DISTRIBUTORS
2016 Q2 Distributor Sales 2017 Q2 Distributor Sales
10.6 M TL 20,9 M TL % 97
• Positive Economic Environment• Residential & Industrial Investments• New Distributors
August 2017 2Q17 Results
Sector (Domestic)
10
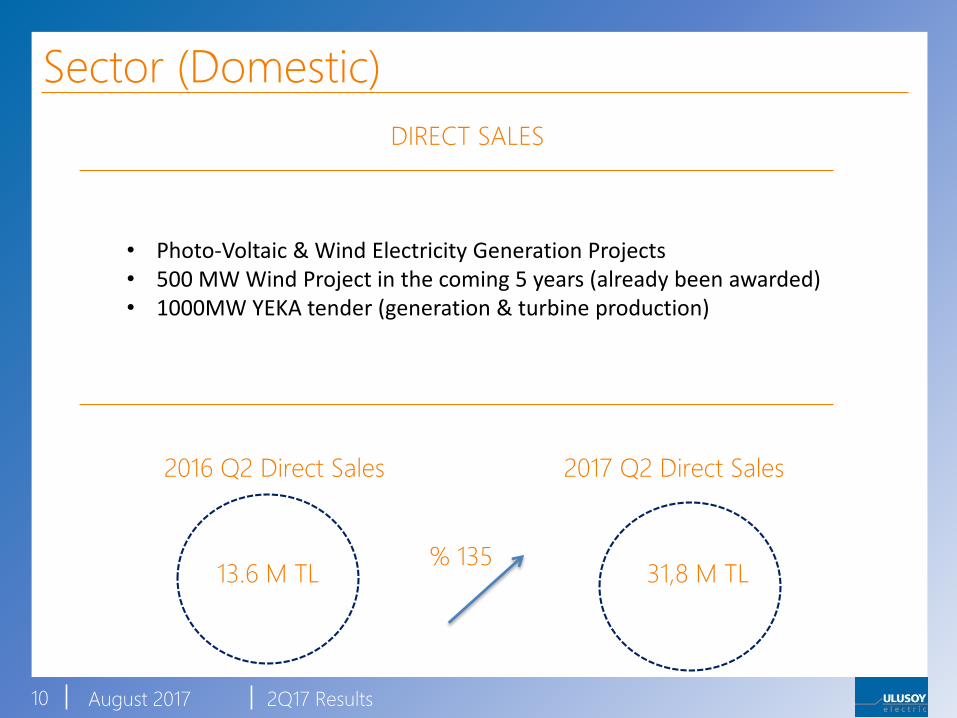
DIRECT SALES
2016 Q2 Direct Sales 2017 Q2 Direct Sales
13.6 M TL 31,8 M TL % 135
• Photo-Voltaic & Wind Electricity Generation Projects • 500 MW Wind Project in the coming 5 years (already been awarded)• 1000MW YEKA tender (generation & turbine production)

August 2017 2Q17 Results
Sector (Domestic)
11
2016 Q2 DOMESTIC REVENUE BREAKDOWN BY CUSTOMER SEGMENTS
43%
25%
32%
Q2 2016
Dist.Co. Distributors
Direct Sales
83,8 M TL 42.4 M TL
% 98
37%
25%
38%
Q2 2017
Dist. Co. Distributors
Direct Sales

August 2017 2Q17 Results
Sector (Export)
12
• Diversified and Sustainable Export• Transformer as a driving force for export markets• Indonesia Certification Completed• Recovering Middle East & North Africa Markets• New Import Regime in Algeria
1Q’17
41%
9%7%
5%
4%
4%
4%
4%
4%
19%
Jordan Morocco Turkmenistan
Lithuanian Algeria Sudan
Iraq Mauritania Palastine
Other 17 Countries
26%
22%
11%
5%
4%
4%
3%
4%
8%
3% 10%
Iraq Kosova Sudan
Finlandiya Kazakhstan Uzbekstan
Lithuania (Russia) Mauritania France
iran Other 19 Countries
2Q’17
August 2017 2Q17 Results
Sector (Export)
13
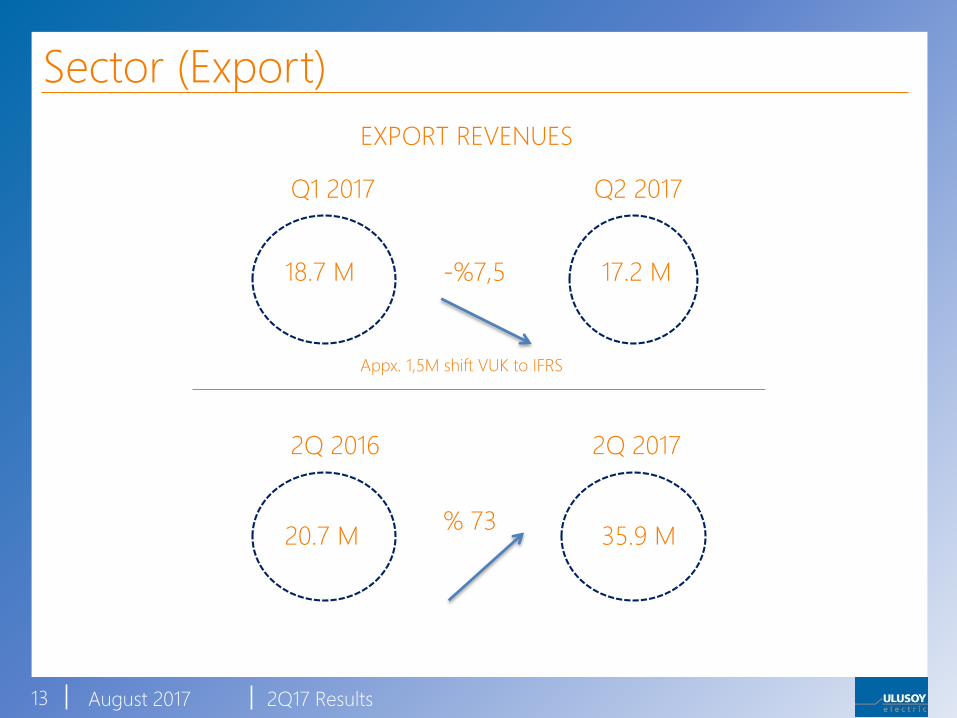
EXPORT REVENUES
Q2 2017Q1 2017
18.7 M 17.2 M-%7,5
2Q 2016 2Q 2017
20.7 M 35.9 M% 73
Appx. 1,5M shift VUK to IFRS
August 2017 2Q17 Results
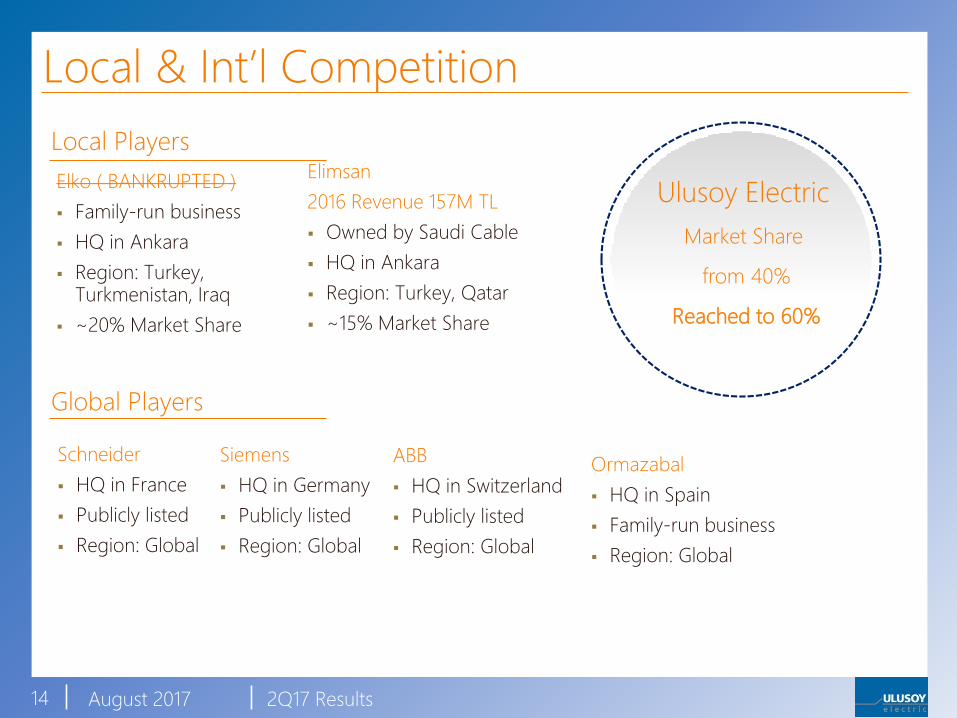
Local & Int’l Competition
14
Local Players
Global Players
Ormazabal
HQ in Spain
Family-run business
Region: Global
Elko ( BANKRUPTED )
Family-run business
HQ in Ankara
Region: Turkey, Turkmenistan, Iraq
~20% Market Share
Elimsan
2016 Revenue 157M TL
Owned by Saudi Cable
HQ in Ankara
Region: Turkey, Qatar
~15% Market Share
Schneider
HQ in France
Publicly listed
Region: Global
Siemens
HQ in Germany
Publicly listed
Region: Global
ABB
HQ in Switzerland
Publicly listed
Region: Global
Ulusoy Electric
Market Share
from 40%
Reached to 60%

August 2017 2Q17 Results
Revenue Breakdown
15
TL mn Q2'17 Q2'16 change
Cable Accessories 1,4 1,0 33%
Concrete Compact Substations 12,7 5,4 137%
Distribution Transformers 13,7 3,1 349%
Metal Clad 4,0 2,1 89%
Metal Enclosed 44,8 26,6 68%Other Sales(Trade Goods, Auxilary Materials) 11,4 5,0 130%
Railway Overhead Line Equipments 0,5 0,3 74%
RMU 11,9 7,1 68%
Metal Compact Substations 1,6 0,0 n.a.
Total 102,0 50,5 102%

August 2017 2Q17 Results
TRANSFORMER FACTORY
16
*Varies on ratings and types
FY 2016 2017 Q1 2017Q2 2Q 2017
863 173 699 872
TRANSFORMER PRODUCTION UNITS
FY 2016 2017 Q1 2017Q2 2Q 2017
13 4,2 13,7 17,9
TRANSFORMER REVENUES (M TL)
46%54%
domestic
export
AVG. UNIT PRICE*
20.527 TL5.800 USD
REVENUE BREAKDOWN

August 2017 2Q17 Results
Strong Orderbook
17
2017 Q2 ORDER INTAKE
DOMESTIC EXPORT
72 M TL
Q1 2017 Q2 2017 Q1 2017 Q2 2017
21.5 M TL19 M TL107.5 M TL

Financials
August 2017 2Q17 Results
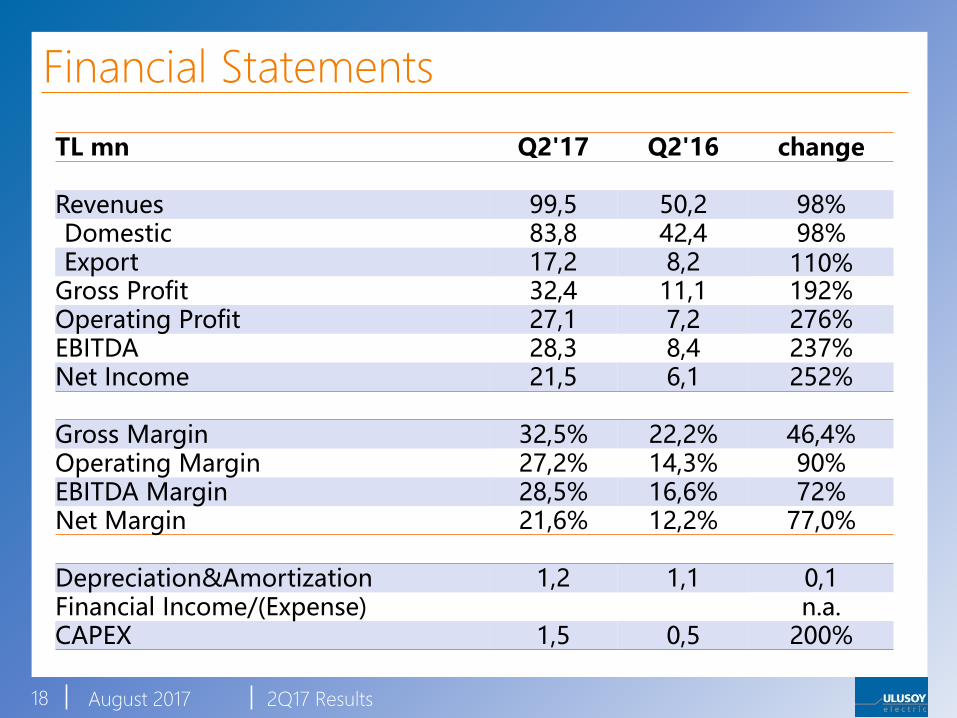
Financial Statements
18
TL mn Q2'17 Q2'16 change
Revenues 99,5 50,2 98%Domestic 83,8 42,4 98%Export 17,2 8,2 110%
Gross Profit 32,4 11,1 192%Operating Profit 27,1 7,2 276%EBITDA 28,3 8,4 237%Net Income 21,5 6,1 252%
Gross Margin 32,5% 22,2% 46,4%Operating Margin 27,2% 14,3% 90%EBITDA Margin 28,5% 16,6% 72%Net Margin 21,6% 12,2% 77,0%
Depreciation&Amortization 1,2 1,1 0,1Financial Income/(Expense) n.a.CAPEX 1,5 0,5 200%
August 2017 2Q17 Results
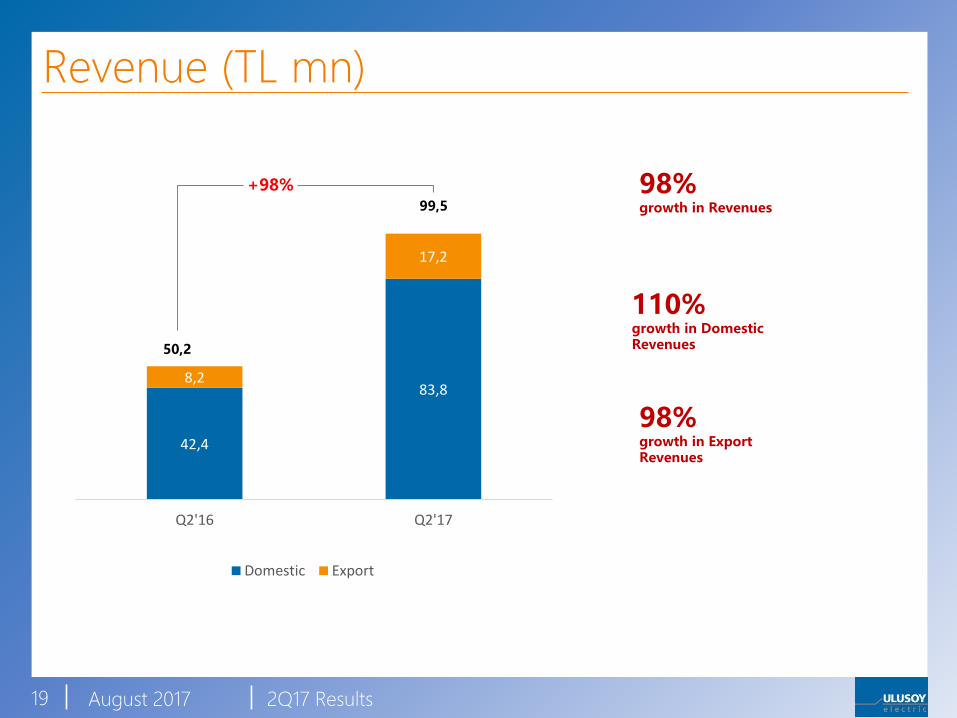
42,4
83,88,2
17,2
Q2'16 Q2'17
Domestic Export
Revenue (TL mn)
19
99,5
50,2
+98% 98% growth in Revenues
110% growth in Domestic Revenues
98% growth in Export Revenues
August 2017 2Q17 Results
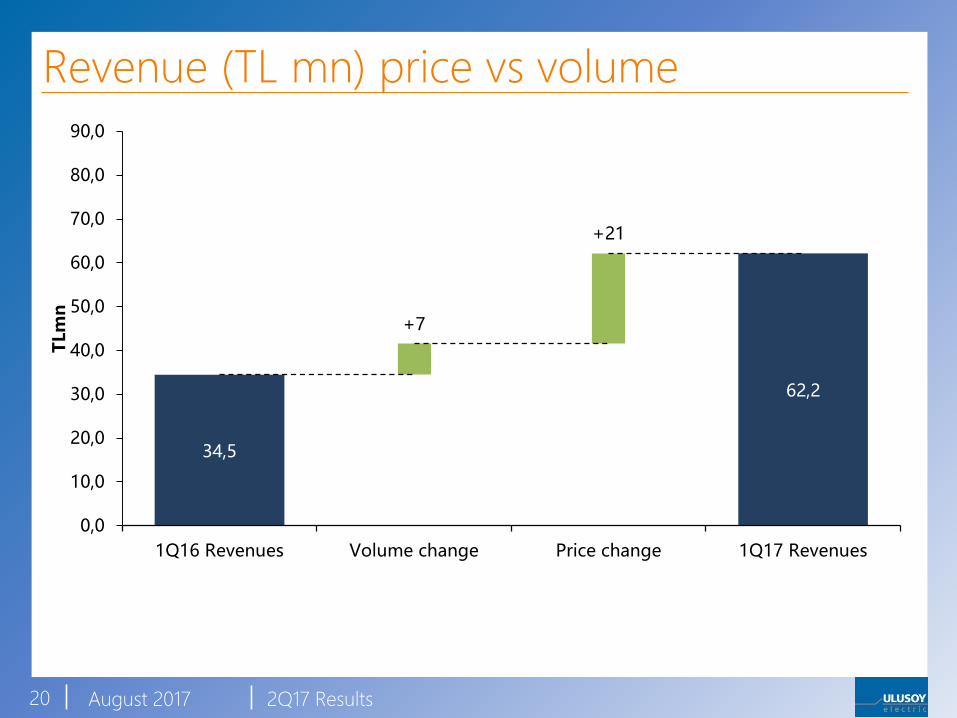
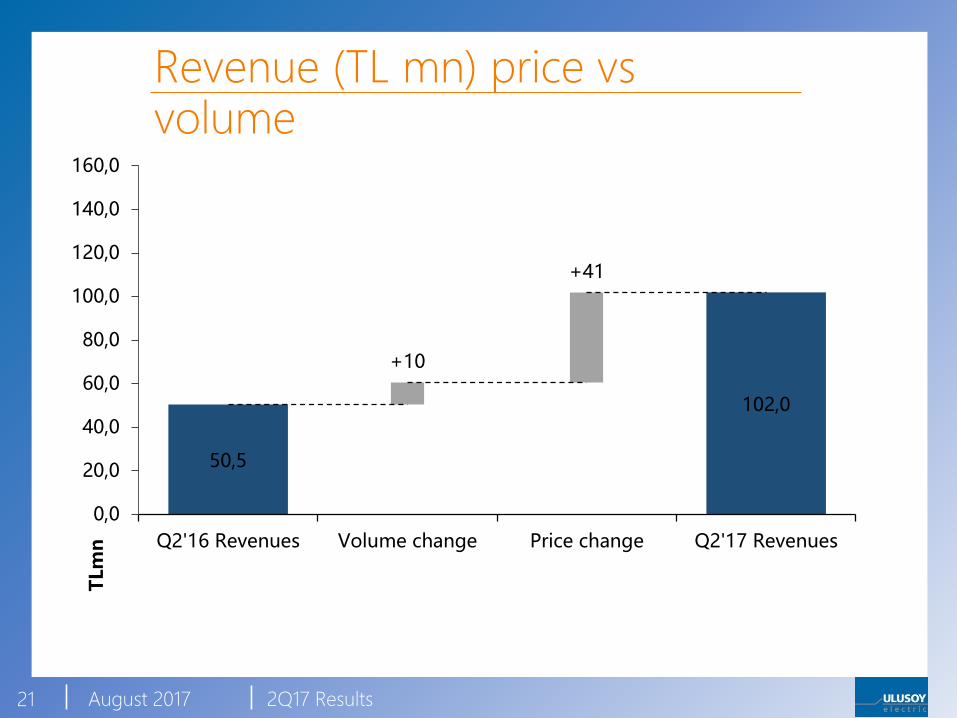
Revenue (TL mn) price vs volume
20
34,5
62,2
+7
+21
0,0
10,0
20,0
30,0
40,0
50,0
60,0
70,0
80,0
90,0
1Q16 Revenues Volume change Price change 1Q17 Revenues
TLm
n
August 2017 2Q17 Results
Revenue (TL mn) price vsvolume
21
50,5
102,0
+10
+41
0,0
20,0
40,0
60,0
80,0
100,0
120,0
140,0
160,0
Q2'16 Revenues Volume change Price change Q2'17 Revenues
TLm
n

August 2017 2Q17 Results
Margin Evolution (%)
22
20,5% 22,2%
32,5%
Q2'15 Q2'16 Q2'17
Gross margin
10,3%
16,6%
28,5%
Q2'15 Q2'16 Q2'17
EBITDA margin

August 2017 2Q17 Results
Financial Ratios
23
TL mn Q2'17 Q2'16
Net Debt Position
Cash&Equivalents 23,8 9,3
Financial Debt 7,2 6,9
Net Debt -16,7 -2,4
Financial Ratios
Current Ratio 2,02 1,76
Net Debt/Equity -0,11 -0,02
Current Assets/Total Assets 0,68 0,56
Current Liabilities/Total Liabilities 0,96 0,96
Total Liabilities/Total Assets 0,35 0,33
ROE 38,8% 17,2%
Margins
Gross Margin 32,5% 22,2%
Operating Margin 27,2% 14,3%
EBITDA Margin 28,5% 16,6%
Net Margin 21,6% 12,2%

August 2017 2Q17 Results
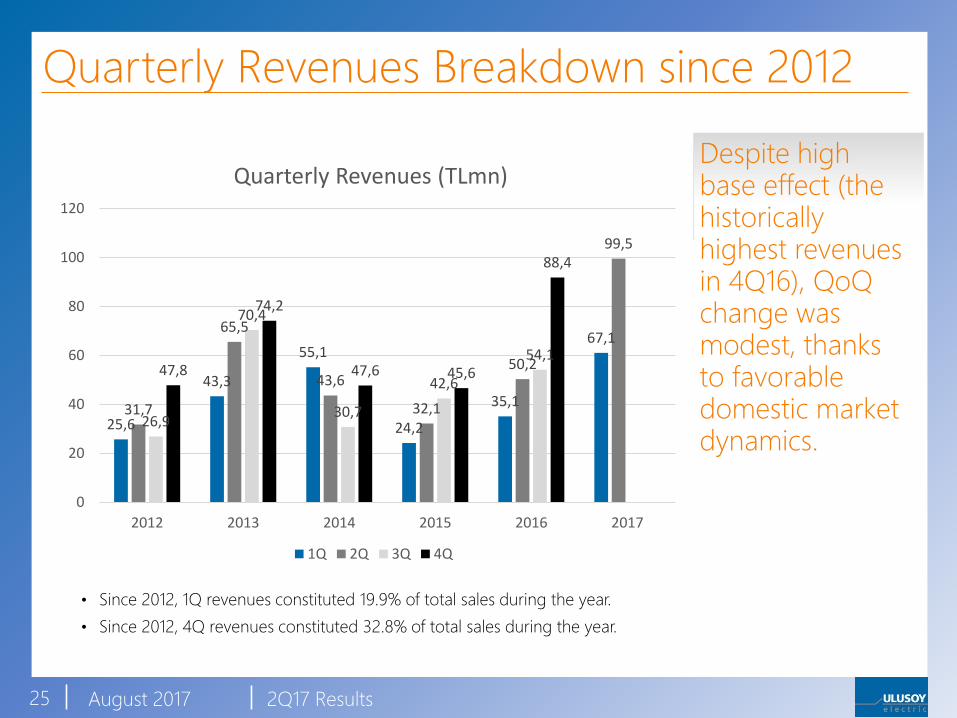
Quarterly Revenues Breakdown since 2012
24
1Q is the weakest while 4Q is the strongest quarters
25,631,7
26,9
47,843,3
65,570,4
74,2
55,1
43,6
30,7
47,6
24,232,1
42,645,6
35,1
50,254,1
88,4
67,1
99,5
0
20
40
60
80
100
120
1Q 2Q 3Q 4Q
Quarterly Revenues (TLmn)
2012 2013 2014 2015 2016 2017
• Since 2012, 1Q revenues constituted 19.9% of total sales during the year.
• Since 2012, 4Q revenues constituted 32.8% of total sales during the year.
August 2017 2Q17 Results
Quarterly Revenues Breakdown since 2012
25
Despite high base effect (thehistorically highest revenues in 4Q16), QoQchange was modest, thanks to favorable domestic market dynamics.
25,6
43,3
55,1
24,2
35,1
67,1
31,7
65,5
43,6
32,1
50,2
99,5
26,9
70,4
30,7
42,6
54,147,8
74,2
47,6 45,6
88,4
0
20
40
60
80
100
120
2012 2013 2014 2015 2016 2017
Quarterly Revenues (TLmn)
1Q 2Q 3Q 4Q
• Since 2012, 1Q revenues constituted 19.9% of total sales during the year.
• Since 2012, 4Q revenues constituted 32.8% of total sales during the year.

August 2017 2Q17 Results
Quarterly Revenues Changes since 2013
26
-9%
-26%
-49%
-23%-24%
51%
-21%
33%43%
98,00%
7%
-30%
33%
8%5%
55%
7%
63%
-60%
-40%
-20%
0%
20%
40%
60%
80%
100%
120%
2013 2014 2015 2016 2017
Revenues change (Quarterly)
1Q 2Q 3Q 4Q
• On average, 2Q revenues declined by 27% QoQ since 2013.
• On average, 4Q revenues increased by 35% QoQ since 2013.
Despiteseasonality factor, growthmomentum remainedstrong…

August 2017 2Q17 Results
Shareholder Structure
53,0%
18,4%
14,3%
14,3%
(2)
(3)
(4)
(1)
Pre IPO Post IPO Current
27
Sait Ulusoy Akgül Ulusoy
Kubilay Hakki Ulusoy
Enis Ulusoy
70,0%
30,0%
Family Free Float
88,8%
11,2%
Family Free Float

Thank YouFor further information please e-mail
or call Ulusoy Electric Investor Relations
at (+90 312 267 0712)