uk regulated networks - credit suisse
TRANSCRIPT
DISCLOSURE APPENDIX CONTAINS ANALYST CERTIFICATIONS AND THE STATUS OF NON US ANALYSTS. FOR OTHER IMPORTANT DISCLOSURES, visit www.credit-suisse.com/researchdisclosures or call +1 (877) 291-2683 US Disclosure: Credit Suisse does and seeks to do business with companies covered in its research reports. As a result, investors should be aware that the Firm may have a conflict of interest that could affect the objectivity of this report. Investors should consider this report as only a single factor in making their investment decision.
CREDIT SUISSE SECURITIES RESEARCH & ANALYTICS BEYOND INFORMATION®
Client-Driven Solutions, Insights, and Access
08 February 2013
Europe/United Kingdom
Equity Research
Multi Utilities (Utilities (Europe))
UK regulated networks SECTOR FORECAST
Read-across from CKI initiation: Favouring UK
energy grids over UK water
■ Changing ownership trends: Our Asian Utilities Team this week initiated
coverage of Cheung Kong Infrastructure (CKI). The company now owns the
fifth-largest portfolio of UK regulated energy and water networks, and is an
alternative way of getting exposure to UK regulated networks. In this note,
we analyse ownership trends, which assets are attractive and the read-
across to UK-listed energy networks.
■ Key points: (1) Diverging regulatory clarity between energy and water:
UK transmission and gas distribution have just had final proposals for the
forthcoming review period, and there is clarity on the OFGEM RIIO model.
But water companies are starting their price-setting process, and lower real
yields could reduce returns. We see a risk of dividend cuts for water stocks
in 2015, and they trade on c100bp lower dividend yields than NG/SSE.
(2) Narrow valuation gap unjustified: UK water is trading on a c20%
premium to spot RAB, versus c23% for NG. This comes despite NG’s assets
having more asset base growth and clarity. At this point of the regulatory
cycle (just 18 months left) water has historically traded towards a lower
premium. (3) Transactions more likely in energy than water: Once the
price controls in UK energy are confirmed (i.e. risk of Competition
Commission referrals passes), there will be 8 years of clarity. This may be a
trigger for transactions. While not necessarily involving NG or SSE, it should
flag value, in our view.
■ Stock Calls: In the UK, our top picks are National Grid (TP 770p,
Outperform) and SSE (TP 1,600p, Outperform). Both have regulated
energy businesses (in the case of SSE generating highly attractive returns)
with strong operating cash flows and quickly growing asset bases (c7-8%
p.a. RAB growth). We also believe there is power price upside for SSE. We
like CKI (TP HK$56.6, Outperform) for its sustainable, regulated and stable
DPS growth (16%, 17% and 11% in 2012-14E), yield attractiveness (vs. HK
universe and treasury yields) and potential upside from acquisitions.
Figure 1: Summary of our preferred picks
Stock National Grid SSE Cheung Kong Infra
Rating Outperform Outperform Outperform
Target Price 770p 1,600p HK$56.6
Upside potential 17% 19% 18%
Dividend yield 6.0% 6.2% 4.3%
3-yr yield CAGR 3.0% 4.0% 12.6%
Source: Thomson Reuters, Credit Suisse estimates
Research Analysts
Mark Freshney
44 20 7888 0887
Edwin Pang
852 2101 6406
Guy MacKenzie
44 20 7883 9534
Vincent Gilles
44 20 7888 1926
Specialist Sales: Mark Whitfeld
44 20 7888 8038

08 February 2013
UK regulated networks 2
Key charts for regulated utilities Figure 2: UK Government real yield Figure 3: UK RPI and CPI inflation
-2.0%
-1.0%
0.0%
1.0%
2.0%
3.0%
4.0%
5.0%
6.0%
Jan
-92
Jan
-94
Jan
-96
Jan
-98
Jan
-00
Jan
-02
Jan
-04
Jan
-06
Jan
-08
Jan
-10
Jan
-12
10yr real redemption yield 20yr real redemption yield
(2%)
(1%)
0%
1%
2%
3%
4%
5%
6%
2001
2002
2003
2004
2005
2006
2007
2008
2009
2010
2011
2012
2013
YoY RPI inflation
Credit Suisse LT est.
Source: Thomson Reuters, Credit Suisse research Source: Thomson Reuters, Credit Suisse research
Figure 4: National Grid: Combined premium to RAB and rate base (%)
-80%
-60%
-40%
-20%
0%
20%
40%
60%
80%
1995A 1996A 1997A 1998A 1999A 2000A 2001A 2002A 2003A 2004A 2005A 2006A 2007A 2008A 2009A 2010A 2011A 2012A
NG Premium to combined RAB/Rate base Lattice Premium to RAB
NGC review period
Tech boom: impact of Energis
Lattice review period
Lattice / NGC merger
EUA/NEES acquisitionsNGC review period
NiMo acquisition Keyspan acquisition
Gas dist'bn review
Transmission review
Transmission andgas distribution reivew
Source: Company data, Thomson Reuters, Credit Suisse research
Figure 5: UK Water premium to RAB (%)
(40%)
(30%)
(20%)
(10%)
0%
10%
20%
30%
40%
1990 1995 2000 2005 2010
March year-4 March year-5 Spot (4th Feb 2013)
AMP1 AMP2 AMP3 AMP4 AMP5
AMP 1-4average
Source: Company data, Thomson Reuters, Credit Suisse research

08 February 2013
UK regulated networks 3
Favouring energy over water Some context: Ownership breakdown
On 5th February 2013, our Asian Utilities Team initiated on CKI, which is a large owner of
UK regulated assets, and which they believe could buy further assets in the UK (for the full
note, click here). In this report, we look top-level at the ownership of UK regulated
networks, paying attention to the assets CKI owns. We show why our preference is for UK
energy, rather than water networks, and look at recent transaction multiples. Finally, we
summarise why SSE, NG and CKI are our three top UK regulated picks.
Figure 6: Breakdown of OFGEM and OFWAT
economically-regulated assets by type
Figure 7: Breakdown of OFGEM and OFWAT
economically-regulated assets by ownership type
Electricity
distribution
(OFGEM)
£21.3bn
18% Gas
distribution
(OFGEM)
£16.8bn
14%
Transmis'n
(OFGEM)
£20.3bn
17%
Water
(OFWAT)
£59.2bn
51%
Publicly
listed
(inc.
CKI/PAH)
£76.5bn
65%
Private
£36.9bn
31%
Public
sector
£4.2bn
4%
Source: Credit Suisse research Source: Credit Suisse research
We start with some background. Regulated networks is a major industry and asset class
for the UK economy. On our numbers, the regulated asset value of energy (gas and
electricity) networks is c£118bn (Figure 6). To put this into context, the £118bn compares
to:
■ The value of the RABs is c£1,900 per capita, and it should be noted that this does not
include the Scottish Water or Northern Ireland networks, which are in state ownership;
■ Face value of index-linked gilts issued by the UK Government is c£295bn, according
to our economists; and
■ The market value of the FTSE 100 is currently c£1,500bn, although this includes many
overseas assets.
It should also be noted that as well as being a big industry, the sector is the largest one
that is subject to a price cap and regulated returns (the other notable ones being rail and
airports). Finally, the regulated sector is a ‘growth’ sector, since:
■ In aggregate, more is invested each year than the depreciation. There are few
businesses with materially shrinking RABs, but many more growing substantially;
■ Prices and asset values are linked to UK RPI inflation, hence are ‘real’ assets. We
model RPI at 2.85% in the long-run, but it has in the past been running higher.
From an investor viewpoint, ownership of the assets has been changing, from being UK-
listed to being more dispersed (Figure 7). To this end, there have been a number of
transactions in the sector, and grids and water companies have been taken private. They
The value of OFGEM- and
OFWAT-regulated assets is
c£118bn, as of March
2013E. UK regulated utilities
is a big—and growing—
industry and asset class for
the UK economy
08 February 2013
UK regulated networks 4
are sometimes owned by infra-funds (financial owners, which are often private and not
traded). Equally, some of the buyers (e.g. PPL of the US, CKI and its related entity, PAH)
are publicly listed outside of the UK. The UK is now not the only place where the assets
are part of a publicly-traded group.
CKI an active buyer in the past three years
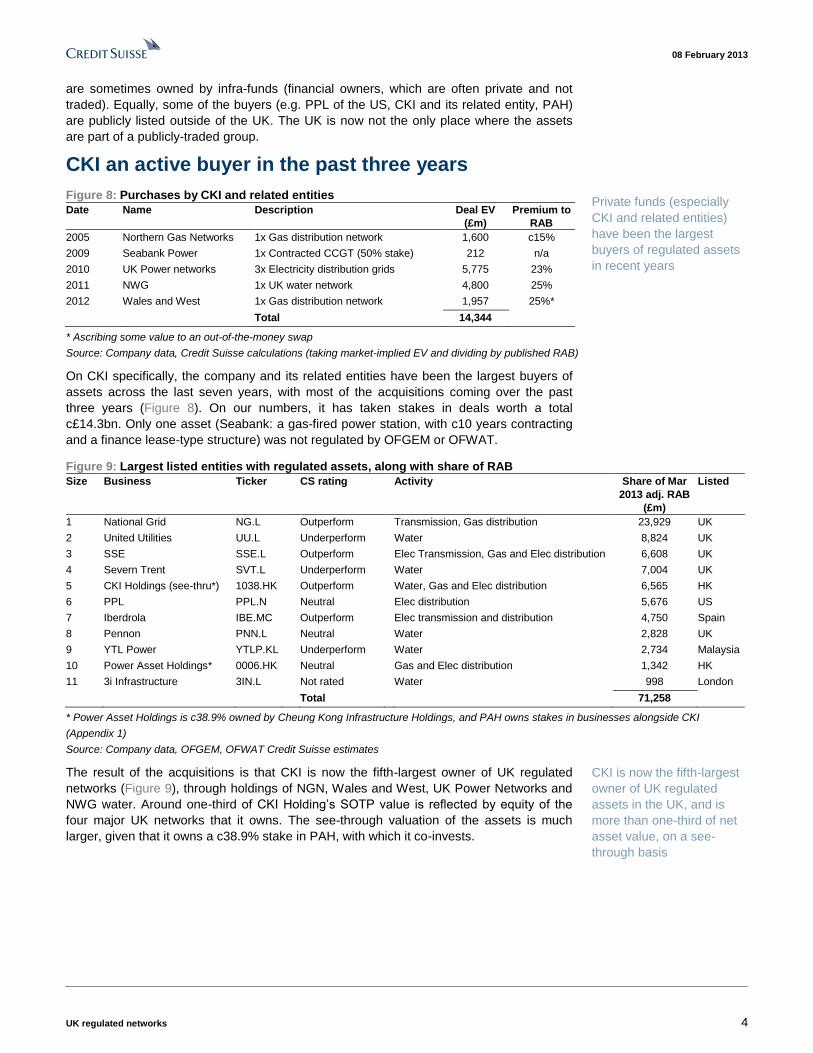
Figure 8: Purchases by CKI and related entities
Date Name Description Deal EV
(£m)
Premium to
RAB
2005 Northern Gas Networks 1x Gas distribution network 1,600 c15%
2009 Seabank Power 1x Contracted CCGT (50% stake) 212 n/a
2010 UK Power networks 3x Electricity distribution grids 5,775 23%
2011 NWG 1x UK water network 4,800 25%
2012 Wales and West 1x Gas distribution network 1,957 25%*
Total 14,344
* Ascribing some value to an out-of-the-money swap
Source: Company data, Credit Suisse calculations (taking market-implied EV and dividing by published RAB)
On CKI specifically, the company and its related entities have been the largest buyers of
assets across the last seven years, with most of the acquisitions coming over the past
three years (Figure 8). On our numbers, it has taken stakes in deals worth a total
c£14.3bn. Only one asset (Seabank: a gas-fired power station, with c10 years contracting
and a finance lease-type structure) was not regulated by OFGEM or OFWAT.
Figure 9: Largest listed entities with regulated assets, along with share of RAB
Size Business Ticker CS rating Activity Share of Mar
2013 adj. RAB
(£m)
Listed
1 National Grid NG.L Outperform Transmission, Gas distribution 23,929 UK
2 United Utilities UU.L Underperform Water 8,824 UK
3 SSE SSE.L Outperform Elec Transmission, Gas and Elec distribution 6,608 UK
4 Severn Trent SVT.L Underperform Water 7,004 UK
5 CKI Holdings (see-thru*) 1038.HK Outperform Water, Gas and Elec distribution 6,565 HK
6 PPL PPL.N Neutral Elec distribution 5,676 US
7 Iberdrola IBE.MC Outperform Elec transmission and distribution 4,750 Spain
8 Pennon PNN.L Neutral Water 2,828 UK
9 YTL Power YTLP.KL Underperform Water 2,734 Malaysia
10 Power Asset Holdings* 0006.HK Neutral Gas and Elec distribution 1,342 HK
11 3i Infrastructure 3IN.L Not rated Water 998 London
Total 71,258
* Power Asset Holdings is c38.9% owned by Cheung Kong Infrastructure Holdings, and PAH owns stakes in businesses alongside CKI
(Appendix 1)
Source: Company data, OFGEM, OFWAT Credit Suisse estimates
The result of the acquisitions is that CKI is now the fifth-largest owner of UK regulated
networks (Figure 9), through holdings of NGN, Wales and West, UK Power Networks and
NWG water. Around one-third of CKI Holding’s SOTP value is reflected by equity of the
four major UK networks that it owns. The see-through valuation of the assets is much
larger, given that it owns a c38.9% stake in PAH, with which it co-invests.
Private funds (especially
CKI and related entities)
have been the largest
buyers of regulated assets
in recent years
CKI is now the fifth-largest
owner of UK regulated
assets in the UK, and is
more than one-third of net
asset value, on a see-
through basis
08 February 2013
UK regulated networks 5
We prefer energy networks to water assets Within the regulated space, we prefer UK energy networks to water for three key reasons:
(1) Diverging clarity on returns: National Grid, SSE and CKI are putting regulatory
risk largely1 behind them. We think returns under RIIO are on the whole attractive.
Conversely, while UK water companies currently earn a generous spread over
their true cost of capital (c170bp, on our numbers), this will be reset in 2014 and
we expect a significant reduction (from 5.1% to c4.3%, real). To this end, low real
risk-free interest rates benefit energy networks (via cost of capital reductions) but
are potentially detrimental to UK Water, as low interest rates will be a key factor in
determining return allowances (and therefore profits) from 2015E;
(2) Energy finishing end of price review; versus Water approaching the start:
UK energy networks will soon have eight years of regulatory clarity in both
transmission and gas distribution, also setting a strong precedent for electricity
distribution (covering April 2015–March 2023). We believe this gives upside
potential as the market seeks relatively low-risk, stable returns. In contrast, there
is little visibility on cash flows beyond March 2015E in UK Water, as the price
control review (PR14) is just approaching. We expect PR14 could be a
challenging regulatory review for many UK Water companies, and that the
uncertainty as we approach the review could be a key area of focus in 2013; and
(3) Risk of dividend cuts in 2015E: While UU and SVT cut their dividends at the
start of the current regulatory period by 10% and 12.5%, respectively, we expect
cuts in 2015E to be potentially bigger, owing to (i) a steeper expected cut in
allowed returns (in relative terms), from 5.1% to 4.3% vanilla real – with the
balance of risk to the downside; (ii) weaker credit ratios in 2015E compared with
in 2010A, particularly when considering the RAB values will be logged down by 3-
5% owing to lower than expected construction price inflation; and (iii) comments
from OFWAT’s Chairman Johnson Cox at a recent City briefing suggesting
shareholders might share some of the windfall benefit from low financing costs
with customers. We see a risk of dividend cuts for water stocks at the coming
review (e.g. c15-20% for UU and SVT) and both trade on >c100bp lower dividend
yields than NG and SSE, hence we do not believe it is priced-in.
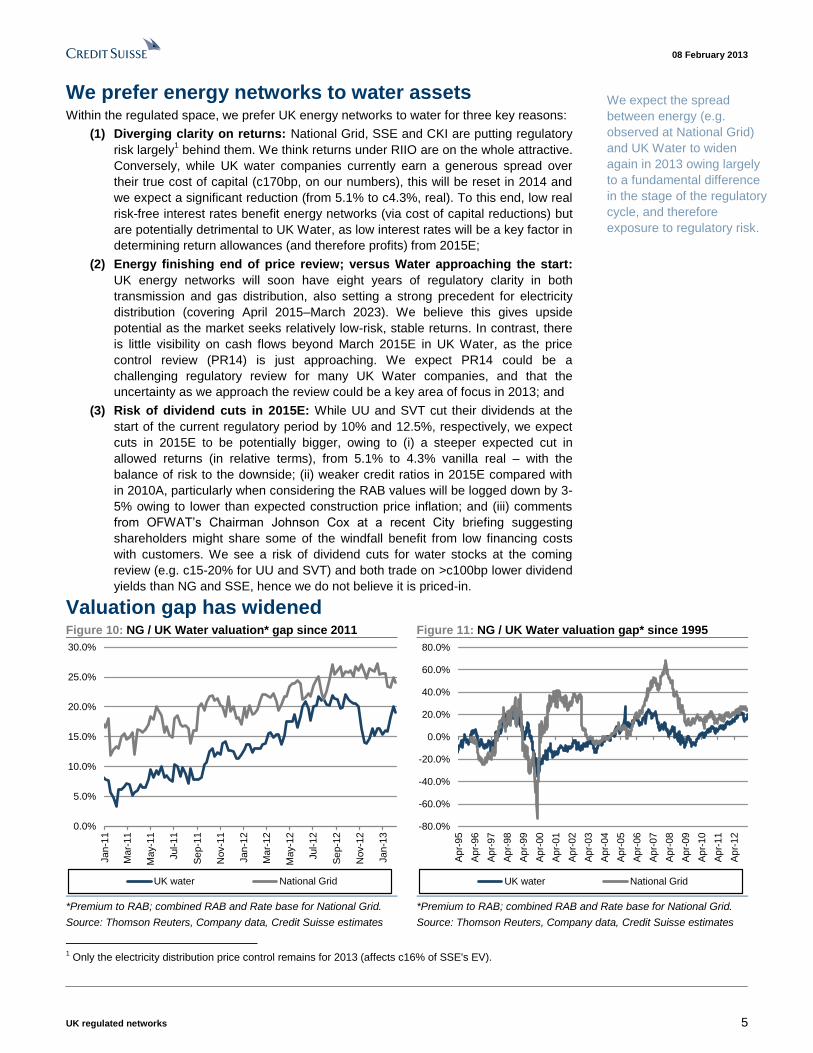
Valuation gap has widened Figure 10: NG / UK Water valuation* gap since 2011 Figure 11: NG / UK Water valuation gap* since 1995
0.0%
5.0%
10.0%
15.0%
20.0%
25.0%
30.0%
Jan
-11
Mar-
11
May-1
1
Jul-1
1
Se
p-1
1
Nov-1
1
Jan
-12
Mar-
12
May-1
2
Jul-1
2
Se
p-1
2
Nov-1
2
Jan
-13
UK water National Grid
-80.0%
-60.0%
-40.0%
-20.0%
0.0%
20.0%
40.0%
60.0%
80.0%
Ap
r-95
Ap
r-96
Ap
r-97
Ap
r-98
Ap
r-99
Ap
r-00
Ap
r-01
Ap
r-02
Ap
r-03
Ap
r-04
Ap
r-05
Ap
r-06
Ap
r-07
Ap
r-08
Ap
r-09
Ap
r-10
Ap
r-11
Ap
r-12
UK water National Grid
*Premium to RAB; combined RAB and Rate base for National Grid.
Source: Thomson Reuters, Company data, Credit Suisse estimates
*Premium to RAB; combined RAB and Rate base for National Grid.
Source: Thomson Reuters, Company data, Credit Suisse estimates
1 Only the electricity distribution price control remains for 2013 (affects c16% of SSE's EV).
We expect the spread
between energy (e.g.
observed at National Grid)
and UK Water to widen
again in 2013 owing largely
to a fundamental difference
in the stage of the regulatory
cycle, and therefore
exposure to regulatory risk.

08 February 2013
UK regulated networks 6
The valuation spread of energy networks (for which we take NG as a proxy) over water
has been wide owing to asset base growth and also diversification at National Grid.
However, UK Water is close to National Grid on historical norms (see Figure 10 and
Figure 11). Water is trading on a c20% premium to spot RAB, versus c23% for NG. This
comes despite NG’s energy assets having more asset base growth and being near the
start of a regulatory review period.
We expect this spread to again diverge, as (i) we have clarity that there will not be a
Competition Commission referral of the energy price controls, hence being positive for
energy networks; and (ii) investors begin to focus upon UK Water cash flows beyond
March 2015E, hence being negative for water networks.
Regulatory cycle
On the point of water valuations, we also note UK Water trades on clear regulatory cycles.
Valuations tend to deteriorate approaching regulatory reviews, and we view the sector as
expensive, considering average RAB premia at similar stages in previous reviews (see
Figure 12). Excluding AMP1, on average RAB premia at this stage have been c0%.
Figure 12: Cyclicality of UK Water valuations driven by regulation
(40%)
(30%)
(20%)
(10%)
0%
10%
20%
30%
40%
1990 1995 2000 2005 2010
March year-4 March year-5 Spot (4th Feb 2013)
AMP1 AMP2 AMP3* AMP4 AMP5
AMP 1-4
Source: Thomson Reuters, Company data, Credit Suisse estimates
At this point of the water
regulatory cycle, the stocks
have traded much more
cheaply

08 February 2013
UK regulated networks 7
Deals are possible in energy, less likely in water If anything, we think that once the price controls in UK regulated energy networks are
confirmed (we will know by early March), and if it becomes clear that a Competition
Commission referral is unlikely, there will be a trigger for deals in the energy sector.
Figure 13: Premia to RAB for large UK regulated assets since 2005
-20%
-10%
0%
10%
20%
30%
40%
50%
Feb
-05
Mid
Ken
t Wat
er
Jan-
06 S
utto
n an
d E
ast
Sur
rey
Wat
er
May
-06
Bris
tol W
ater
Jul-0
6 B
AA
Sep
-06
AW
G
Oct
-06
Sou
th E
ast W
ater
Oct
-06
Tha
mes
Wat
er
Oct
-07
Sou
ther
n W
ater
Nov
-07
UU
Ele
ctric
ity
Nov
-07
Kel
da
Oct
-09
Gat
wic
k
Nov
-09
Sou
th E
ast W
ater
Jul-1
0 E
DF
net
wor
k
Mar
-11
EO
N n
etw
orks
Aug
-11
Nor
thum
bria
nW
ater
Oct
-11
Bris
tol W
ater
Jun-
12 V
eolia
UK
Aug
-12
Wal
es a
nd W
est*
Jan-
13 S
tans
ted
Airp
ort
Feb
-13
Sut
ton
and
Eas
tS
urre
y W
ater
* We have included the book value of a large out-of-the-money RPI-to-LIBOR swap to arrive at this premium
** Company earned c40bps better returns, likely owing to small company premia, hence a higher premium to RAB
Source: Company data, Credit Suisse research, Credit Suisse estimates
On our numbers, a c9% post-tax nominal equity IRR requirement—our base-case for a
returns that bidders take—would justify a RAB premium of c20-30% for a typical low-
growth energy network.
We can see these kind of multiples in recent transactions, shown in Figure 13. Excluding
the outliers of Stansted Airport (where the regulation by the Civil Aviation Authority is
different) and Sutton and East Surrey Water (where the business is small and gets small
company premia and lower allowed gearing) we observe that the average premium was
c26%, in-line with the range we mention above. From press reports and company
announcements over the past three years mentioning bidding deadlines it appears that at
least five of these assets have been subject to competitive bidding processes, hence the
multiples would appear to be a fair reflection of the value. That said, the exact premia
would depend upon:
(1) Returns: Some businesses earn better returns, perhaps by being small or else having
legacy investments on high returns;
(2) Growth: If a network has very large growth investments to undertake, and is
generating economic profit, it is worth a bigger premium to the present day RAB.
Higher-growth assets will also have more favourable financeability premia (e.g.
allowed equity issue premia and shorter asset lives) to support that growth; and
(3) Incentives: Under OFGEM’s RIIO regulation, strongly-performing companies receive
better returns, whereas poorly-performing ones will receive less.
We think that a large deal in in water is less likely
Given our concerns, highlighted on page 5, we think a transaction is less likely in water.
Especially for UU and SVT, given their size. Furthermore, the ‘special merger regime’ in
UK water requires that all proposed mergers (e.g. where there is a large common
ownership of two water companies by one party) are referred to the Competition
Commission, and could require divestment of existing assets. We believe that the mere
prospect of a referral has prevented multiple acquisitions of UK water companies, and
could have led CKI to divest its holding in Cambridge Water during its acquisition of NWG.

08 February 2013
UK regulated networks 8
Top picks in the UK regulated power sector SSE (TP 1,600p, Outperform)
■ SSE is our top pick in the UK regulated sector on a one-year view. We see upside
potential to the UK power price, and SSE is the UK stock with the most diverse
generation fleet, and should benefit the most. There are attractive investment options
in regulated networks.
■ Around c35% of EV is regulated, and we value the assets on a c26% premium to
RAB. The asset base is growing at a c8% CAGR (c5.5% organic and c2.8% RPI
inflation), with the growth initially driven by investments in Scottish Transmission and
then distribution. There is upside to this amount if all the capex in Scotland comes
through; a scenario which we discount. SSE also achieves better returns, thanks to:
(i) Strong operational performance (which has historically increased returns
by c50bps more than the sector average); and also
(ii) Incentives on the Scottish Hydro transmission business, where SSE is
allowed a return of c7.02% vanilla real for the first five years of capex.
■ The stock has a FYmar14E dividend yield of 6.2%, rising to 6.5% in FYmar15E. The
stock discounts a c8.6% post-tax nominal cost of equity.
National Grid (TP 770p, Outperform)
■ National Grid is our second top pick in the UK. The capital investment plan is high, but
not to levels which would require an equity issue. In any event, the SCRIP dividend
and attractive capitalisation rates allow NG to adequately finance itself.
■ Around 65% of the business is in UK regulated assets, and we value it at a c32%
premium to RAB. We see c7-8% p.a. growth in the UK regulated assets (c5.0%
organic, c2.8% RPI inflation). The transitional measures awarded in the price controls,
and the attractive capitalisation policy (c85%) generates strong operating cash flows.
■ Gas transmission does not get the same favourable treatment as electricity
transmission (6.7% cost of equity and 62.5% gearing, versus 7.0% and 60% gearing
for Transmission), but Gas Transmission is only c14% of EV, and still generates value.
■ NG will review the long-term financing structure, and release it to the market by
FYmar13A results, due 16th May. We think NG can maintain the current dividend and
stop the SCRIP, albeit it would take away much of National Grid’s financing flexibility.
Cheung Kong Infrastructure (TP HK$56.6, Outperform)
■ We like CKI’s sustainable, regulated and stable DPS growth and potential upside from
acquisitions, as its balance sheet still offers leverage potential. We estimate the size of
potential acquisitions without the risk of debt-rating downgrades or equity capital
raising could be cHK$8bn.
■ We forecast CKI will offer dividend (DPS) growth of 16%, 17% and 11% in 2012-14E
(15% CAGR 2011-14E). This is backed by visible, sustainable and stable cash
generation growth from its existing domestic (i.e., PAH’s stake) and overseas
regulated investments. In particular, the value of its overseas investments is likely to
rise from HK$17.8bn in 2009 to HK$52.1bn by 2013E (31% CAGR) through debt
leverage and equity issuance.
■ CKI’s strategy is to invest in highly geared but ring-fenced (i.e. local debt without
recourse to asset owners) regulated assets, targeting cash return via shareholder
loans and dividends.
■ Our bottom-up asset model of six key regulated assets supports our cash return 14%
CAGR (2011-14E), implying CKI’s cash return on ex-PAH investment rising from 6.2%
in 2010 to 10.1% in 2014E, in line with the low-to-mid end of CKI’s criteria.

08 February 2013
UK regulated networks 9
Appendix 1: Our recent research UK sub-sector research
UK power utilities: Changing energy mix => Higher power prices (15 Pages, 9 Jan 2013)
UK Utilities: Q1 2013 outlook: Widening valuation gap: Top picks SSE / NG (51 Pages, 13
Dec 2012)
UK Water: Visibility continues to deteriorate (13 Pages, 2 Nov 2012)
Summary of key UK stock-specific research
CKI: Underlying DPS growth and M&A drive upside (59 pages, 5 Feb 2013)
SSE: A change of CEO, not a change in strategy (21 Pages, 28 Jan 2013)
Drax: Bringing biomass conversions to fruition (16 Pages, 25 Jan 2013)
SSE: Quality cash flows that generate value (43 Pages, 6 Dec 2012)
Centrica: British Gas Business under pressure (13 Pages, 16 Nov 2012)
Pennon: Downside priced-in (11 pages, 16 Nov 2012)
Centrica: In need of a strategic refresh (12 Pages, 9 Nov 2012)
Drax: Update post the equity placing (13 Pages, 26 Oct 2012)
Europe sub-sector research
European Utilities in 2013: 2013 shaping up to be like 2012 (53 Pages, 13 Dec 2012)
Euro power market in dislocation - Sliding below €50/MWh with downside risk (22 Pages,
12 Dec 2012)
European Utilities - Renewable subsidies: A double-edged sword (42 Pages, 12 Nov
2012)

08 F
eb
ruary
201
3
UK
reg
ula
ted
ne
two
rks
1
0
Appendix 2: Group structure of CKI Figure 14: Cheung Kong Infrastructure and Power Asset Holdings shareholder structure of key assets (%)
Cheung Kong (Holdings) Limitede
Hutchison Whampoa Limited
Cheung Kong InfrastructureHoldings Limited
Power Asset Holdings Limited
The Hong Kong Electric Company Limited
Power Asset Investment Limited
SA Power Networks
(Aust.)
Powercor (Aust.)
CitiPower (Aust.)
Northern Gas
Networks (UK)
Seabank Power
(UK)
UK Power Grid
networks (UK)
Wales & West
Utilities (UK)
Wellington Electricity
(NZ)
Stanley Power
(Canada)
TransAlta Cogen
Meridian Cogen
CKI 23%PAH 28%
CKI 23%PAH 28%
CKI 23%PAH 28%
CKI 47%PAH 41%
CKI 25%PAH 25%
CKI 40%PAH 40%
CKI 30%PAH 30%
CKI 50%PAH 50%
CKI 50%PAH 50%
50% 100%
Zhuhai Power (CN)
Zhuhai Jinwan Power (CN)
Jilin Siping Cogen (CN)
Cement/ Concrete (HK/CN);
Tollroad (CN)
Dali /Laoting
Windfarm (CN)
Ratchaburi Power (Thai)
45% 45% 45% 45% 25%
Envestra (Aust. listco)
Aquatower (Aust)
Southern Water (UK)
Spark Infrastructure (Aust . listco)
Northumbrian Water (UK)
Jointly Owned Assets by
CKI and PAH
Assets owned by PAH
Assets owned by CKI
8.5%Various 19% 49% 4.8% 40%
49.97%
76.4%
38.9%
100% 100%
49% 49% 49%T&D + Generation
Hong Kong regulated SOC @2009-2023 with 9.99% real
BOT fixed returns China coal-fired projects
Regulated Water UK: RAB @WACC 5.1% @2010-15 with RPI-X%
Regulated Power Distribution
UK: RAB @Allow return 4.7% @2010-15 with RPI-X% (X varies by operator depend on capex & real return)
Regulated Gas Distribution
UK: RAB @Allow return 4.3% @2007-13 with RPI-X% (X varies by operator depend on capex & real return)
Gas-fired Power generator
UK: Capacity 1.14 GW. No RAB but fixed long-term contract (full pass through) with SSE
Regulated Power Distribution
Aust: Fixed RAB with inflation adjustment. ESTA Utilities: South Aust. / Powercor/Citipower: Victoria
Enviro Waste (NZ)
100%
Source: Company data, Credit Suisse estimates

08 F
eb
ruary
201
3
UK
reg
ula
ted
ne
two
rks
1
1
Appendix 3: UK RAB assets held by CKI Figure 15: Share of asset base for assets owned by CKI
£ in millions, unless otherwise stated
March 2013
adj. RAB
(£m)
CKI
ownership
(A)
Share of
RAB
PAH
ownership
Share of
RAB
PAH
ownership (B)
CKI Indirect
holding (A*B)
PAH
Ownership
CKI
Direct +
Indirect
UK Power Grids: London 1,579 40.0% 632 40.0% 632 38.9% 15.6% 246 877
UK Power Grids: Southern Water 1,432 40.0% 573 40.0% 573 38.9% 15.6% 223 795
UK Power Grids:Eastern 2,247 40.0% 899 40.0% 899 38.9% 15.6% 350 1,248
Wales and West 1,920 30.0% 576 30.0% 576 38.9% 11.7% 224 800
Northern Gas Networks 1,881 47.0% 884 41.0% 771 38.9% 15.9% 300 1,184
NWG Water 3,637* 40.0% 1,455 0.0% - 38.9% 0.0% - 1,455
Southern Water 4,150* 4.8% 199 0.0% - 38.9% 0.0% - 199
5,217 3,450 1,342 6,559
Cheung Kong Infrastructure Holdings (ex-PAH) 5,217
Power Asset Holdings 1,342
CKI see-through 6,559
* Assuming a negative c3% adjustment for COPI, in-line SVT and UU
Source: Company data, Credit Suisse estimate

08 F
eb
ruary
201
3
UK
reg
ula
ted
ne
two
rks
1
2
Companies Mentioned (Price as of 07-Feb-2013)
Power Assets Holdings Limited (0006.HK, HK$69.1) Cheung Kong Infrastructure (1038.HK, HK$49.35, OUTPERFORM, TP HK$56.6) 3I Infrsttr (3IN.L, 125.5p) Iberdrola (IBE.MC, €3.71) National Grid (NG.L, 689.0p, OUTPERFORM, TP 770.0p) Pennon Group (PNN.L, 681.0p) PPL Corporation (PPL.N, $30.3) SSE (SSE.L, 1405.0p, OUTPERFORM, TP 1600.0p) Severn Trent (SVT.L, 1618.0p) United Utilities (UU.L, 726.0p) YTL Power (YTLP.KL, RM1.54)
Disclosure Appendix
Important Global Disclosures
The analysts identified in this report each certify, with respect to the companies or securities that the individual analyzes, that (1) the views expressed in this report accurately reflect his or her personal views about all of the subject companies and securities and (2) no part of his or her compensation was, is or will be directly or indirectly related to the specific recommendations or views expressed in this report.
Price and Rating History for Cheung Kong Infrastructure (1038.HK)
1038.HK Closing Price Target Price
Date (HK$) (HK$) Rating
04-Feb-13 49.45 56.60 O *
* Asterisk signifies initiation or assumption of coverage.
O U T PERFO RM
Price and Rating History for National Grid (NG.L)
NG.L Closing Price Target Price
Date (p) (p) Rating
13-May-10 564.70 670.00 N
26-May-10 497.40 570.00
21-Oct-10 594.00 648.00 O
11-Nov-11 629.00 675.00
23-Jan-12 614.00 700.00
08-Jun-12 662.00 730.00
13-Dec-12 717.50 770.00
* Asterisk signifies initiation or assumption of coverage.
N EU T RA L
O U T PERFO RM

08 F
eb
ruary
201
3
UK
reg
ula
ted
ne
two
rks
1
3
Price and Rating History for SSE (SSE.L)
SSE.L Closing Price Target Price
Date (p) (p) Rating
08-Apr-11 1312.00 1400.00 O
02-Mar-12 1309.00 1450.00
06-Dec-12 1430.00 1600.00
* Asterisk signifies initiation or assumption of coverage.
O U T PERFO RM
The analyst(s) responsible for preparing this research report received Compensation that is based upon various factors including Credit Suisse's total revenues, a portion of which are generated by Credit Suisse's investment banking activities
As of December 10, 2012 Analysts’ stock rating are defined as follows:
Outperform (O) : The stock’s total return is expected to outperform the relevant benchmark*over the next 12 months.
Neutral (N) : The stock’s total return is expected to be in line with the relevant benchmark* over the next 12 months.
Underperform (U) : The stock’s total return is expected to underperform the relevant benchmark* over the next 12 months.
*Relevant benchmark by region: As of 10th December 2012, Japanese ratings are based on a stock’s total return relative to the analyst's coverage universe which consists of all companies covered by the analyst within the relevant sector, with Outperforms representing the most attractiv e, Neutrals the less attractive, and Underperforms the least attractive investment opportunities. As of 2nd October 2012, U.S. and Canadian as well as European ra tings are based on a stock’s total return relative to the analyst's coverage universe which consists of all companies covered by the analyst within the relevant sector, with Outperforms representing the most attractive, Neutrals the less attractive, and Underperforms the least attractive investment opportunities. For Latin Ame rican and non-Japan Asia stocks, ratings are based on a stock’s total return relative to the average total return of the relevant country or regional benchmark; Australia, New Zealand are, and prior to 2nd October 2012 U.S. and Canadian ratings were based on (1) a stock’s absolute total return potential to its current share price and (2) the relative attractiveness of a stock’s total return potential within an analyst’s coverage universe. For Australian and New Zealand stocks, 12 -month rolling yield is incorporated in the absolute total return calculation and a 15% and a 7.5% threshold replace the 10-15% level in the Outperform and Underperform stock rating definitions, respectively. The 15% and 7.5% thresholds replace the +10-15% and -10-15% levels in the Neutral stock rating definition, respectively. Prior to 10th December 2012, Japanese ratings were based on a stock’s total return relative to the average total return of the relevant country or regional benchmark.
Restricted (R) : In certain circumstances, Credit Suisse policy and/or applicable law and regulations preclude certain types of communications, including an investment recommendation, during the course of Credit Suisse's engagement in an investment banking transaction and in certain other circumstances.
Volatility Indicator [V] : A stock is defined as volatile if the stock price has moved up or down by 20% or more in a month in at least 8 of the past 24 months or the analyst expects significant volatility going forward.
Analysts’ sector weightings are distinct from analysts’ stock ratings and are based on the analyst’s expectations for the fundamentals and/or valuation of the sector* relative to the group’s historic fundamentals and/or valuation:
Overweight : The analyst’s expectation for the sector’s fundamentals and/or valuation is favorable over the next 12 months.
Market Weight : The analyst’s expectation for the sector’s fundamentals and/or valuation is neutral over the next 12 months.
Underweight : The analyst’s expectation for the sector’s fundamentals and/or valuation is cautious over the next 12 months.
*An analyst’s coverage sector consists of all companies covered by the analyst within the relevant sector. An analyst may cover multiple sectors.
Credit Suisse's distribution of stock ratings (and banking clients) is:
Global Ratings Distribution
Rating Versus universe (%) Of which banking clients (%)
Outperform/Buy* 42% (53% banking clients)
Neutral/Hold* 38% (47% banking clients)
Underperform/Sell* 16% (41% banking clients)
Restricted 3%
*For purposes of the NYSE and NASD ratings distribution disclosure requirements, our stock ratings of Outperform, Neutral, and Underperform most closely correspond to Buy, Hold, and Sell, respectively; however, the meanings are not the same, as our stock ratings are determined on a relative basis. (Please refer to definitions above.) An investor's decision to buy or sell a security should be based on investment objectives, current holdin gs, and other individual factors.
08 F
eb
ruary
201
3
UK
reg
ula
ted
ne
two
rks
1
4
Credit Suisse’s policy is to update research reports as it deems appropriate, based on developments with the subject company, the sector or the market that may have a material impact on the research views or opinions stated herein.
Credit Suisse's policy is only to publish investment research that is impartial, independent, clear, fair and not misleading. For more detail please refer to Credit Suisse's Policies for Managing Conflicts of Interest in connection with Investment Research: http://www.csfb.com/research and analytics/disclaimer/managing_conflicts_disclaimer.html
Credit Suisse does not provide any tax advice. Any statement herein regarding any US federal tax is not intended or written to be used, and cannot be used, by any taxpayer for the purposes of avoiding any penalties.
Price Target: (12 months) for Cheung Kong Infrastructure (1038.HK)
Method: Our HK$56.6 target price (TP) is based on SOTP (sum-of-the-parts), backed by DCF for existing key assets (include PAH which account for 39% of our EV) and a HK$2.77 option value for potential M&A. Our base case option value is based on 1) CKI gearing up HK$8 billion for M&A (i.e. potential acquisition EV of HK$20 billion assuming a 40% equity-debt split), 2) a 9% cash return on equity, and 3) debt cost of 250 bps above US ten-year treasury.
Risk: We believe that the key risks for CKI is with regards to 1) market’s uncertainty over the terms of the new regulatory regime as we approach the next regulatory reset period (e.g. UK water and power; Australia power in 2015-2016), 2) greater government scrutiny on the use of financial engineering for tax management (i.e. shareholder loans), 3) financial impact of forex and interest rates, and 4) most importantly, the attractiveness of CKI’s dividend yield to investors if risk-free rate or investors’ risk appetite were to rise.
Price Target: (12 months) for National Grid (NG.L)
Method: We value National Grid on a Sum-of-the-Parts basis. We look at NG on a division-by-division DCF (as reported in the segmental analysis) in our SOTP, using an average 5.9% post-tax nominal discount rate. For the UK businesses, we assume returns converging to cost of capital after eight years of RIIO-T1 and RIIO-GD1, and for the US businesses we assume flat returns on equity. We deduct the economic value of net debt from the enterprise value to arrive at the equity value. This gets us to US businesses on an average 1.29x rate base, and UK businesses on an average 1.27x RAB. Overall, our SOTP is 770p/share.
Risk: National Grid is a cost of capital business, in our view. The principal risk is that discount rates increase. This could be through either higher risk-free rates or higher risk-premia. Other risks include NG's inability fund its renewals of debt or capex plan. There are also risks that National Grid cannot achieve its regulatory allowed returns (Nominal return on equity in the US, Real return on capital in the UK).
Price Target: (12 months) for SSE (SSE.L)
Method: Our main valuation methodology is sum-of-the-parts. We have analysed separately the cash flows we estimate will be generated on a division-by-division basis, including where applicable specific assets within each division (for instance, generation units) taking account of e.g. asset life, projected organic growth rates which reasonably accord with historic performance. We use an appropriate discount rate based on our cost of capital analysis and we estimate the impact of the commodity and investment cycle on financial and operational performance. We combine all and deduct net debt and hybrids as liabilities.
Risk: High risk - One of the key risks to our target price is generation spreads on gas, coal and hydro plant (the key generation types operated by SSE). If these fall, it could have a substantial impact on earnings. We also see regulatory risks arising from SSE's five-year price controls on its UK networks, and also ongoing interest from Ofgem, the UK regulator. Finally, SSE has financial debt, and so any stress on operational cash flows could endanger the financial strength of the business.
Please refer to the firm's disclosure website at www.credit-suisse.com/researchdisclosures for the definitions of abbreviations typically used in the target price method and risk sections.
See the Companies Mentioned section for full company names
The subject company (1038.HK, NG.L, SSE.L, 0006.HK, IBE.MC, PNN.L, PPL.N, UU.L) currently is, or was during the 12-month period preceding the date of distribution of this report, a client of Credit Suisse.
Credit Suisse provided investment banking services to the subject company (NG.L, SSE.L, PPL.N) within the past 12 months.
Credit Suisse provided non-investment banking services to the subject company (1038.HK, NG.L, SSE.L, IBE.MC, PNN.L, PPL.N, UU.L) within the past 12 months
Credit Suisse has managed or co-managed a public offering of securities for the subject company (NG.L, SSE.L, PPL.N) within the past 12 months.
Credit Suisse has received investment banking related compensation from the subject company (NG.L, SSE.L, PPL.N) within the past 12 months
Credit Suisse expects to receive or intends to seek investment banking related compensation from the subject company (1038.HK, NG.L, SSE.L, 0006.HK, PPL.N) within the next 3 months.
Credit Suisse has received compensation for products and services other than investment banking services from the subject company (1038.HK, NG.L, SSE.L, IBE.MC, PNN.L, PPL.N, UU.L) within the past 12 months

08 F
eb
ruary
201
3
UK
reg
ula
ted
ne
two
rks
1
5
As of the date of this report, Credit Suisse makes a market in the following subject companies (PPL.N).
Credit Suisse may have interest in (YTLP.KL)
Important Regional Disclosures
Singapore recipients should contact Credit Suisse AG, Singapore Branch for any matters arising from this research report.
The analyst(s) involved in the preparation of this report have not visited the material operations of the subject company (1038.HK, NG.L, SSE.L, 0006.HK, IBE.MC, PNN.L, PPL.N, SVT.L, UU.L, YTLP.KL) within the past 12 months
Restrictions on certain Canadian securities are indicated by the following abbreviations: NVS--Non-Voting shares; RVS--Restricted Voting Shares; SVS--Subordinate Voting Shares.
Individuals receiving this report from a Canadian investment dealer that is not affiliated with Credit Suisse should be advised that this report may not contain regulatory disclosures the non-affiliated Canadian investment dealer would be required to make if this were its own report.
For Credit Suisse Securities (Canada), Inc.'s policies and procedures regarding the dissemination of equity research, please visit http://www.csfb.com/legal_terms/canada_research_policy.shtml.
Credit Suisse Securities (Europe) Limited (Credit Suisse) acts as broker to (SSE.L, PNN.L).
The following disclosed European company/ies have estimates that comply with IFRS: (NG.L, SSE.L, IBE.MC, PNN.L, SVT.L, UU.L).
As of the date of this report, Credit Suisse acts as a market maker or liquidity provider in the equities securities that are the subject of this report.
Principal is not guaranteed in the case of equities because equity prices are variable.
Commission is the commission rate or the amount agreed with a customer when setting up an account or at any time after that.
To the extent this is a report authored in whole or in part by a non-U.S. analyst and is made available in the U.S., the following are important disclosures regarding any non-U.S. analyst contributors: The non-U.S. research analysts listed below (if any) are not registered/qualified as research analysts with FINRA. The non-U.S. research analysts listed below may not be associated persons of CSSU and therefore may not be subject to the NASD Rule 2711 and NYSE Rule 472 restrictions on communications with a subject company, public appearances and trading securities held by a research analyst account.
Credit Suisse (Hong Kong) Limited ........................................................................................................................................................ Edwin Pang
Credit Suisse Securities (Europe) Limited.................................................................................. Mark Freshney ; Guy MacKenzie ; Vincent Gilles
For Credit Suisse disclosure information on other companies mentioned in this report, please visit the website at www.credit-suisse.com/researchdisclosures or call +1 (877) 291-2683.

08 F
eb
ruary
201
3
UK
reg
ula
ted
ne
two
rks
1
6
References in this report to Credit Suisse include all of the subsidiaries and affiliates of Credit Suisse operating under its investment banking division. For more information on our structure, please use the following link: https://www.credit-suisse.com/who_we_are/en/.This report may contain material that is not directed to, or intended for distribution to or use by, any person or entity who is a citizen or resident of or located in any locality, state, country or other jurisdiction where such distribution, publication, availability or use would be contrary to law or regulation or which would subject Credit Suisse AG or its affiliates ("CS") to any registration or licensing requirement within such jurisdiction. All material presented in this report, unless specifically indicated otherwise, is under copyright to CS. None of the material, nor its content, nor any copy of it, may be altered in any way, transmitted to, copied or distributed to any other party, without the prior express written permission of CS. All trademarks, service marks and logos used in this report are trademarks or service marks or registered trademarks or service marks of CS or its affiliates. The information, tools and material presented in this report are provided to you for information purposes only and are not to be used or considered as an offer or the solicitation of an offer to sell or to buy or subscribe for securities or other financial instruments. CS may not have taken any steps to ensure that the securities referred to in this report are suitable for any particular investor. CS will not treat recipients of this report as its customers by virtue of their receiving this report. The investments and services contained or referred to in this report may not be suitable for you and it is recommended that you consult an independent investment advisor if you are in doubt about such investments or investment services. Nothing in this report constitutes investment, legal, accounting or tax advice, or a representation that any investment or strategy is suitable or appropriate to your individual circumstances, or otherwise constitutes a personal recommendation to you. CS does not advise on the tax consequences of investments and you are advised to contact an independent tax adviser. Please note in particular that the bases and levels of taxation may change. Information and opinions presented in this report have been obtained or derived from sources believed by CS to be reliable, but CS makes no representation as to their accuracy or completeness. CS accepts no liability for loss arising from the use of the material presented in this report, except that this exclusion of liability does not apply to the extent that such liability arises under specific statutes or regulations applicable to CS. This report is not to be relied upon in substitution for the exercise of independent judgment. CS may have issued, and may in the future issue, other communications that are inconsistent with, and reach different conclusions from, the information presented in this report. Those communications reflect the different assumptions, views and analytical methods of the analysts who prepared them and CS is under no obligation to ensure that such other communications are brought to the attention of any recipient of this report. CS may, to the extent permitted by law, participate or invest in financing transactions with the issuer(s) of the securities referred to in this report, perform services for or solicit business from such issuers, and/or have a position or holding, or other material interest, or effect transactions, in such securities or options thereon, or other investments related thereto. In addition, it may make markets in the securities mentioned in the material presented in this report. CS may have, within the last three years, served as manager or co-manager of a public offering of securities for, or currently may make a primary market in issues of, any or all of the entities mentioned in this report or may be providing, or have provided within the previous 12 months, significant advice or investment services in relation to the investment concerned or a related investment. Additional information is, subject to duties of confidentiality, available on request. Some investments referred to in this report will be offered solely by a single entity and in the case of some investments solely by CS, or an associate of CS or CS may be the only market maker in such investments. Past performance should not be taken as an indication or guarantee of future performance, and no representation or warranty, express or implied, is made regarding future performance. Information, opinions and estimates contained in this report reflect a judgment at its original date of publication by CS and are subject to change without notice. The price, value of and income from any of the securities or financial instruments mentioned in this report can fall as well as rise. The value of securities and financial instruments is subject to exchange rate fluctuation that may have a positive or adverse effect on the price or income of such securities or financial instruments. Investors in securities such as ADR's, the values of which are influenced by currency volatility, effectively assume this risk. Structured securities are complex instruments, typically involve a high degree of risk and are intended for sale only to sophisticated investors who are capable of understanding and assuming the risks involved. The market value of any structured security may be affected by changes in economic, financial and political factors (including, but not limited to, spot and forward interest and exchange rates), time to maturity, market conditions and volatility, and the credit quality of any issuer or reference issuer. Any investor interested in purchasing a structured product should conduct their own investigation and analysis of the product and consult with their own professional advisers as to the risks involved in making such a purchase. Some investments discussed in this report may have a high level of volatility. High volatility investments may experience sudden and large falls in their value causing losses when that investment is realised. Those losses may equal your original investment. Indeed, in the case of some investments the potential losses may exceed the amount of initial investment and, in such circumstances, you may be required to pay more money to support those losses. Income yields from investments may fluctuate and, in consequence, initial capital paid to make the investment may be used as part of that income yield. Some investments may not be readily realisable and it may be difficult to sell or realise those investments, similarly it may prove difficult for you to obtain reliable information about the value, or risks, to which such an investment is exposed. This report may provide the addresses of, or contain hyperlinks to, websites. Except to the extent to which the report refers to website material of CS, CS has not reviewed any such site and takes no responsibility for the content contained therein. Such address or hyperlink (including addresses or hyperlinks to CS's own website material) is provided solely for your convenience and information and the content of any such website does not in any way form part of this document. Accessing such website or following such link through this report or CS's website shall be at your own risk. This report is issued and distributed in Europe (except Switzerland) by Credit Suisse Securities (Europe) Limited, One Cabot Square, London E14 4QJ, England, which is regulated in the United Kingdom by The Financial Services Authority ("FSA"). This report is being distributed in Germany by Credit Suisse Securities (Europe) This report is being distributed in the United States and Canada by Credit Suisse Securities (USA) LLC; in Switzerland by Credit Suisse AG; in Brazil by Banco de Investimentos Credit Suisse (Brasil) S.A or its affiliates; in Mexico by Banco Credit Suisse (México), S.A. (transactions related to the securities mentioned in this report will only be effected in compliance with applicable regulation); in Japan by Credit Suisse Securities (Japan) Limited, Financial Instruments Firm, Director-General of Kanto Local Finance Bureau (Kinsho) No. 66, a member of Japan Securities Dealers Association, The Financial Futures Association of Japan, Japan Investment Advisers Association, Type II Financial Instruments Firms Association; elsewhere in Asia/ Pacific by whichever of the following is the appropriately authorised entity in the relevant jurisdiction: Credit Suisse (Hong Kong) Limited, Credit Suisse Equities (Australia) Limited, Credit Suisse Securities (Thailand) Limited, Credit Suisse Securities (Malaysia) Sdn Bhd, Credit Suisse AG, Singapore Branch, Credit Suisse Securities (India) Private Limited regulated by the Securities and Exchange Board of India (registration Nos. INB230970637; INF230970637; INB010970631; INF010970631), having registered address at 9th Floor, Ceejay House, Dr.A.B. Road, Worli, Mumbai - 18, India, T- +91-22 6777 3777, Credit Suisse Securities (Europe) Limited, Seoul Branch, Credit Suisse AG, Taipei Securities Branch, PT Credit Suisse Securities Indonesia, Credit Suisse Securities (Philippines ) Inc., and elsewhere in the world by the relevant authorised affiliate of the above. Research on Taiwanese securities produced by Credit Suisse AG, Taipei Securities Branch has been prepared by a registered Senior Business Person. Research provided to residents of Malaysia is authorised by the Head of Research for Credit Suisse Securities (Malaysia) Sdn Bhd, to whom they should direct any queries on +603 2723 2020. This research may not conform to Canadian disclosure requirements. In jurisdictions where CS is not already registered or licensed to trade in securities, transactions will only be effected in accordance with applicable securities legislation, which will vary from jurisdiction to jurisdiction and may require that the trade be made in accordance with applicable exemptions from registration or licensing requirements. Non-U.S. customers wishing to effect a transaction should contact a CS entity in their local jurisdiction unless governing law permits otherwise. U.S. customers wishing to effect a transaction should do so only by contacting a representative at Credit Suisse Securities (USA) LLC in the U.S. Please note that this research was originally prepared and issued by CS for distribution to their market professional and institutional investor customers. Recipients who are not market professional or institutional investor customers of CS should seek the advice of their independent financial advisor prior to taking any investment decision based on this report or for any necessary explanation of its contents. This research may relate to investments or services of a person outside of the UK or to other matters which are not regulated by the FSA or in respect of which the protections of the FSA for private customers and/or the UK compensation scheme may not be available, and further details as to where this may be the case are available upon request in respect of this report. CS may provide various services to US municipal entities or obligated persons ("municipalities"), including suggesting individual transactions or trades and entering into such transactions. Any services CS provides to municipalities are not viewed as "advice" within the meaning of Section 975 of the Dodd-Frank Wall Street Reform and Consumer Protection Act. CS is providing any such services and related information solely on an arm's length basis and not as an advisor or fiduciary to the municipality. In connection with the provision of the any such services, there is no agreement, direct or indirect, between any municipality (including the officials, management, employees or agents thereof) and CS for CS to provide advice to the municipality. Municipalities should consult with their financial, accounting and legal advisors regarding any such services provided by CS. In addition, CS is not acting for direct or indirect compensation to solicit the municipality on behalf of an unaffiliated broker, dealer, municipal securities dealer, municipal advisor, or investment adviser for the purpose of obtaining or retaining an engagement by the municipality for or in connection with Municipal Financial Products, the issuance of municipal securities, or of an investment adviser to provide investment advisory services to or on behalf of the municipality. If this report is being distributed by a financial institution other than Credit Suisse AG, or its affiliates, that financial institution is solely responsible for distribution. Clients of that institution should contact that institution to effect a transaction in the securities mentioned in this report or require further information. This report does not constitute investment advice by Credit Suisse to the clients of the distributing financial institution, and neither Credit Suisse AG, its affiliates, and their respective officers, directors and employees accept any liability whatsoever for any direct or consequential loss arising from their use of this report or its content. Principal is not guaranteed. Commission is the commission rate or the amount agreed with a customer when setting up an account or at any time after that.
Copyright © 2013 CREDIT SUISSE AG and/or its affiliates. All rights reserved.
Investment principal on bonds can be eroded depending on sale price or market price. In addition, there are bonds on which investment principal can be eroded due to changes in redemption amounts. Care is required when investing in such instruments.
When you purchase non-listed Japanese fixed income securities (Japanese government bonds, Japanese municipal bonds, Japanese government guaranteed bonds, Japanese corporate bonds) from CS as a seller, you will be requested to pay the purchase price only.
2013.02.08 CKI readacross.doc