credit-suisse - presentation
TRANSCRIPT
QUARTERLY RESULTS 2003 Q1
Slide 1
§ CONSOLIDATED RESULTS
§ CREDIT SUISSE FINANCIAL SERVICES
§ CREDIT SUISSE FIRST BOSTON
§ SUMMARY
§ CAUTIONARY STATEMENT REGARDINGFORWARD-LOOKING INFORMATION
PRESENTATION
Slide 2
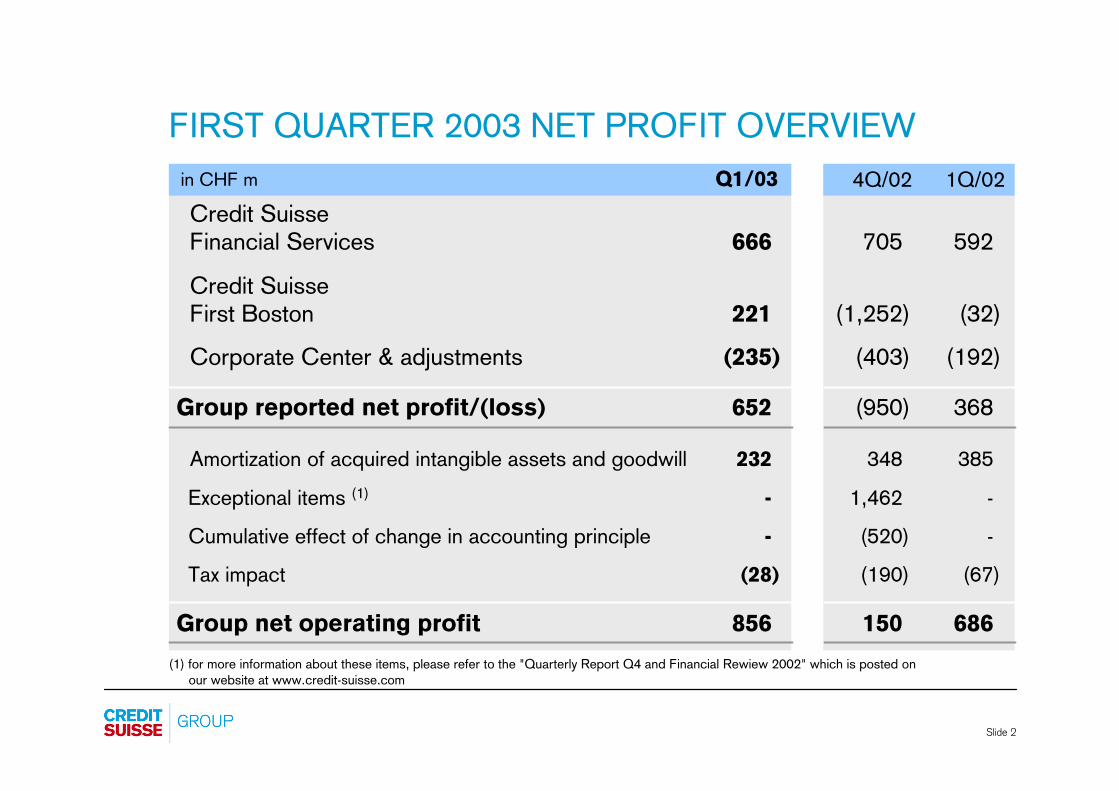
FIRST QUARTER 2003 NET PROFIT OVERVIEW
Credit SuisseFinancial Services 666 705 592
Credit SuisseFirst Boston 221 (1,252) (32)
Corporate Center & adjustments (235) (403) (192)
Group reported net profit/(loss) 652 (950) 368
Amortization of acquired intangible assets and goodwill 232 348 385
Exceptional items (1) - 1,462 -
Cumulative effect of change in accounting principle - (520) -
Tax impact (28) (190) (67)
Group net operating profit 856 150 686
4Q/02 1Q/02Q1/03in CHF m
(1) for more information about these items, please refer to the "Quarterly Report Q4 and Financial Rewiew 2002" which is posted onour website at www.credit-suisse.com
Slide 3
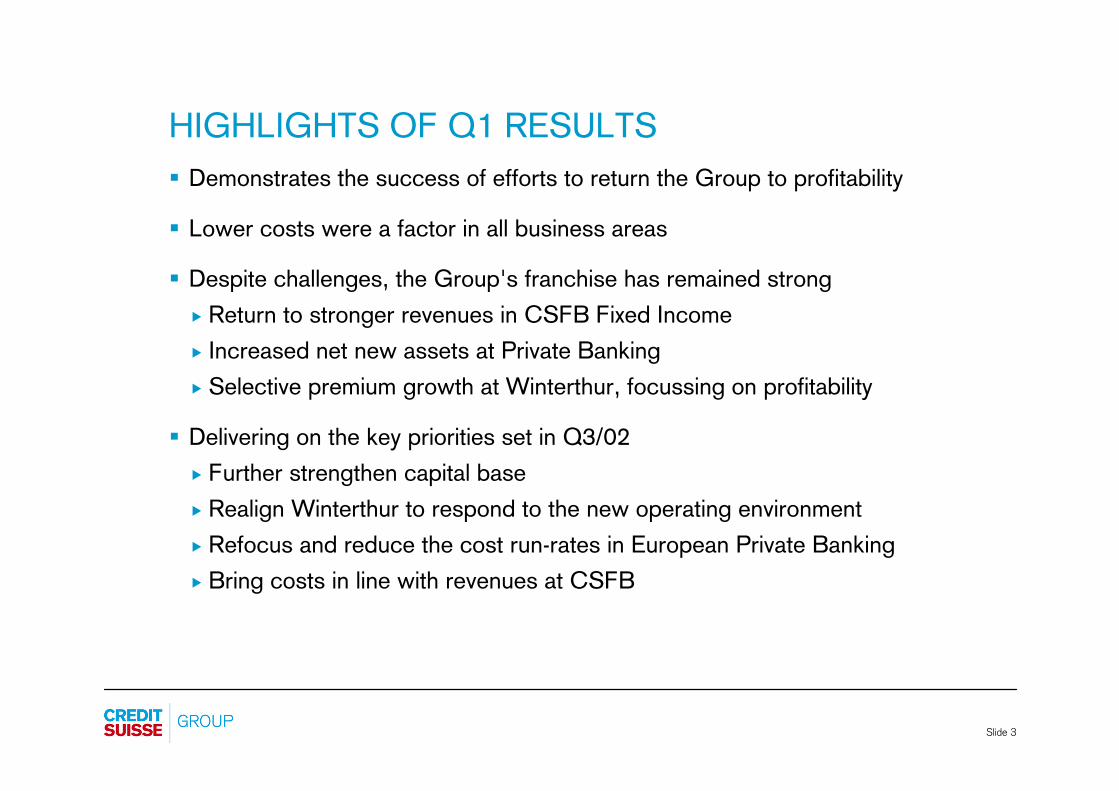
HIGHLIGHTS OF Q1 RESULTS§ Demonstrates the success of efforts to return the Group to profitability
§ Lower costs were a factor in all business areas
§ Despite challenges, the Group's franchise has remained strong� Return to stronger revenues in CSFB Fixed Income� Increased net new assets at Private Banking� Selective premium growth at Winterthur, focussing on profitability
§ Delivering on the key priorities set in Q3/02� Further strengthen capital base� Realign Winterthur to respond to the new operating environment� Refocus and reduce the cost run-rates in European Private Banking� Bring costs in line with revenues at CSFB
Slide 4
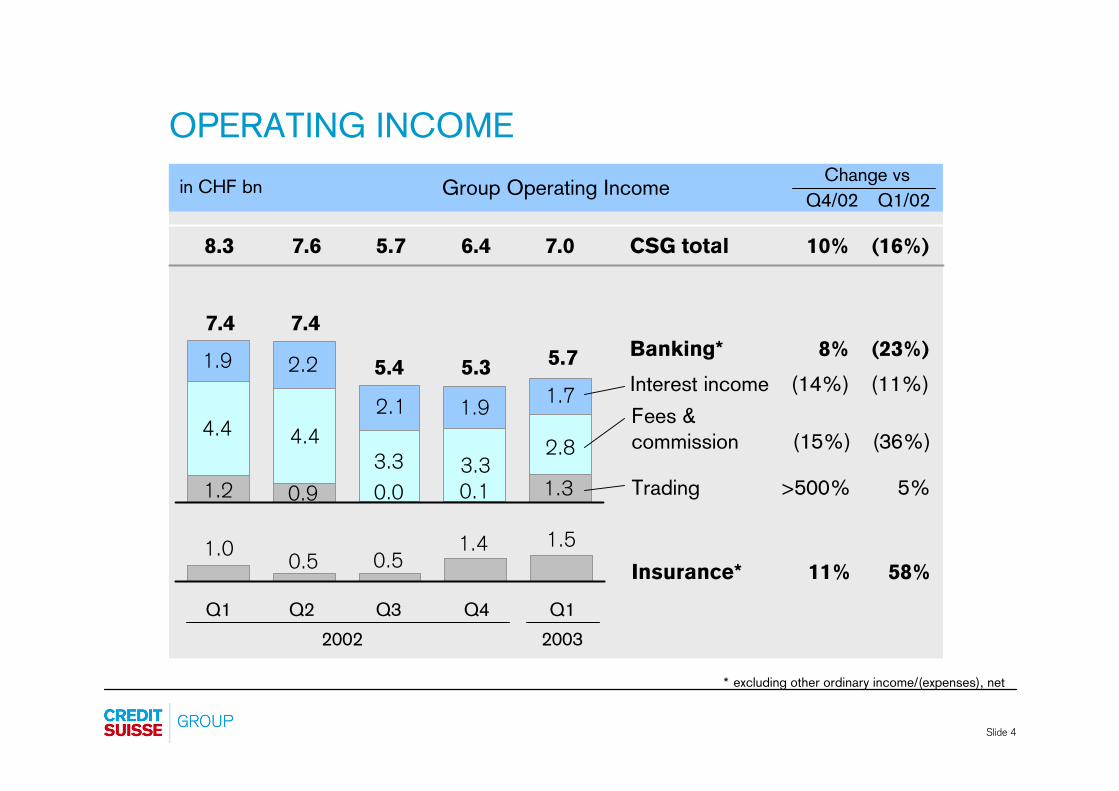
OPERATING INCOME
1.51.0 0.51.4
0.5
Group Operating Income
4.4
2.2
1.9
1.31.2 0.9 0.0 0.13.3
2.84.43.3
1.72.1
1.9
7.4 7.4
CSG total 10% (16%)8.3 7.6 5.7 6.4
Interest income (14%) (11%)Fees &commission (15%) (36%)
Trading >500% 5%
Banking* 8% (23%)
Insurance* 11% 58%
Q4/02 Q1/02Change vs
in CHF bn
7.0
5.4 5.7
20032002Q3Q2 Q4 Q1Q1
5.3
* excluding other ordinary income/(expenses), net
Slide 5
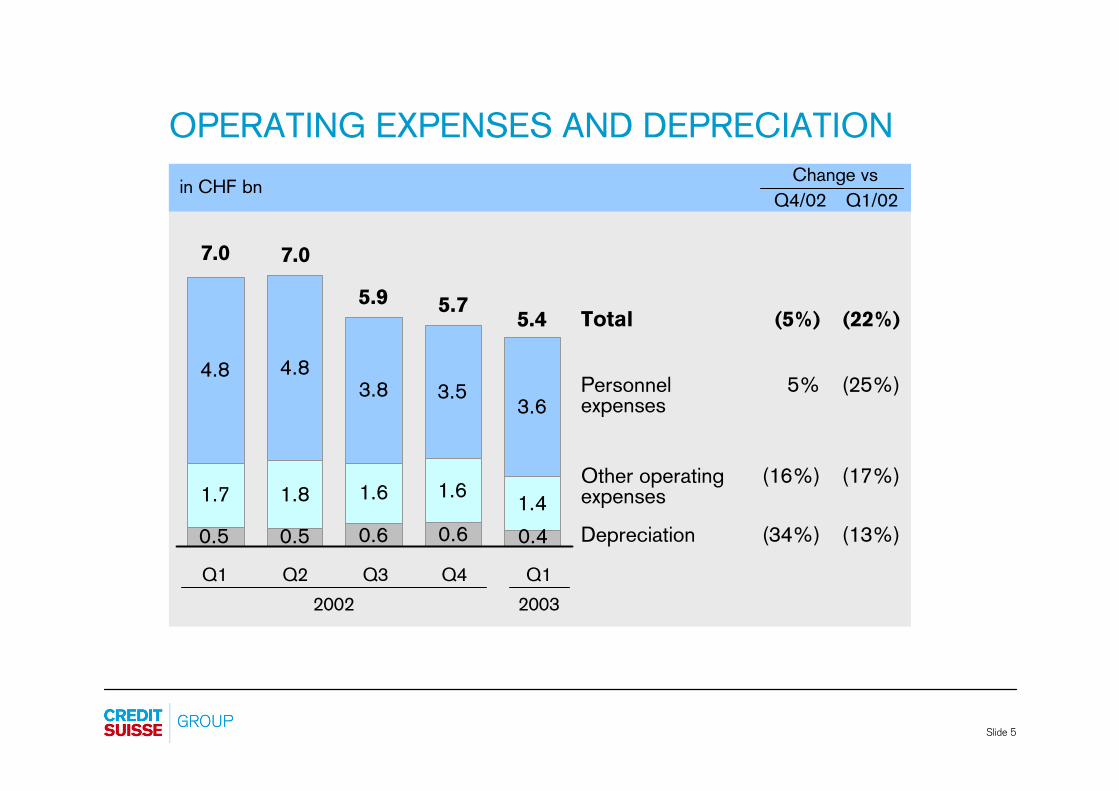
OPERATING EXPENSES AND DEPRECIATION
1.7 1.8 1.6 1.6 1.4
4.8 4.83.8 3.5
3.6
0.5 0.5 0.6 0.6 0.4
Q4/02 Q1/02Change vs
in CHF bn
7.0 7.0
5.9 5.7
20032002Q3Q2 Q4 Q1Q1
5.4
Personnel 5% (25%)expenses
Other operating (16%) (17%)expenses
Depreciation (34%) (13%)
Total (5%) (22%)
Slide 6
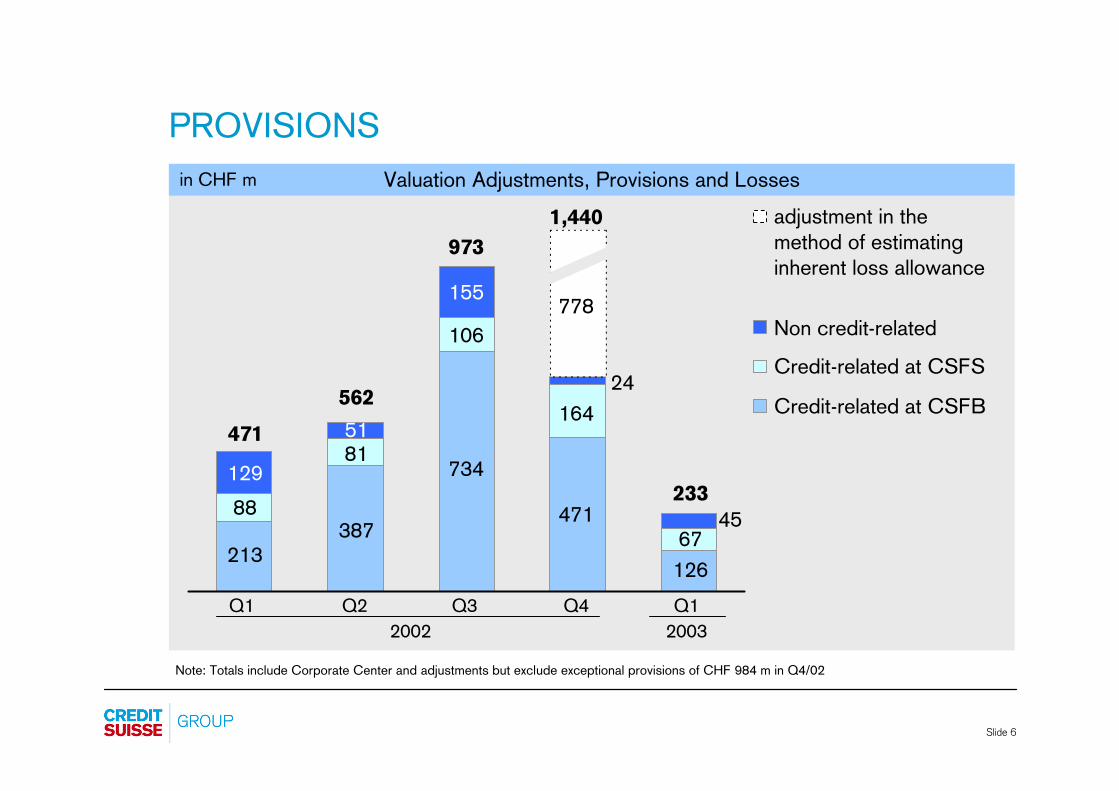
PROVISIONSValuation Adjustments, Provisions and Losses
20032002Q3Q2 Q4 Q1Q1
973
106
734
38788
81
562
129
471
213
Non credit-related
Credit-related at CSFB
Credit-related at CSFS
adjustment in the method of estimatinginherent loss allowance
471
51
778
164
1,440
in CHF m
Note: Totals include Corporate Center and adjustments but exclude exceptional provisions of CHF 984 m in Q4/02
24
12667
23345
155
Slide 7
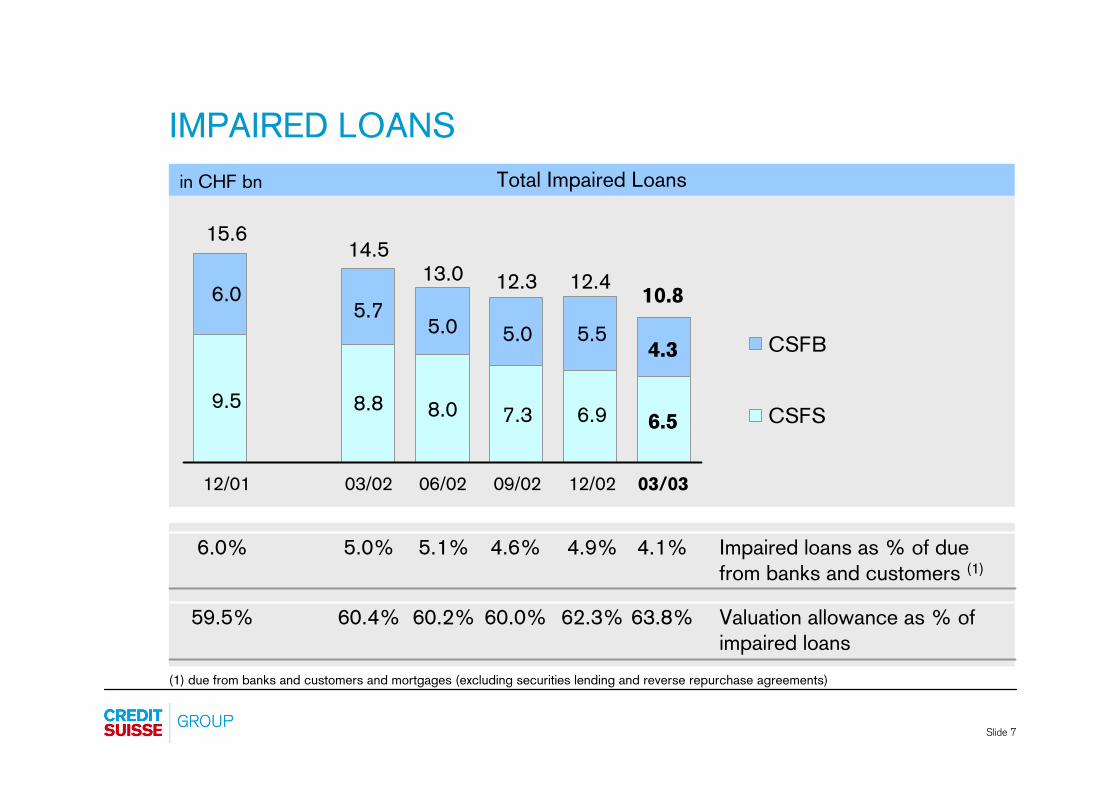
59.5% 60.4% 60.2% 60.0% 62.3% 63.8% Valuation allowance as % ofimpaired loans
6.0% 5.0% 5.1% 4.6% 4.9% 4.1% Impaired loans as % of duefrom banks and customers (1)
IMPAIRED LOANSTotal Impaired Loansin CHF bn
CSFB
CSFS
12/01 03/02 06/02 12/02
6.0
9.5
5.7
8.8
5.0
8.0 6.9
5.5
15.614.5
13.0 12.4
09/02
7.3
5.0
12.3
(1) due from banks and customers and mortgages (excluding securities lending and reverse repurchase agreements)
03/03
6.5
4.3
10.8
Slide 8
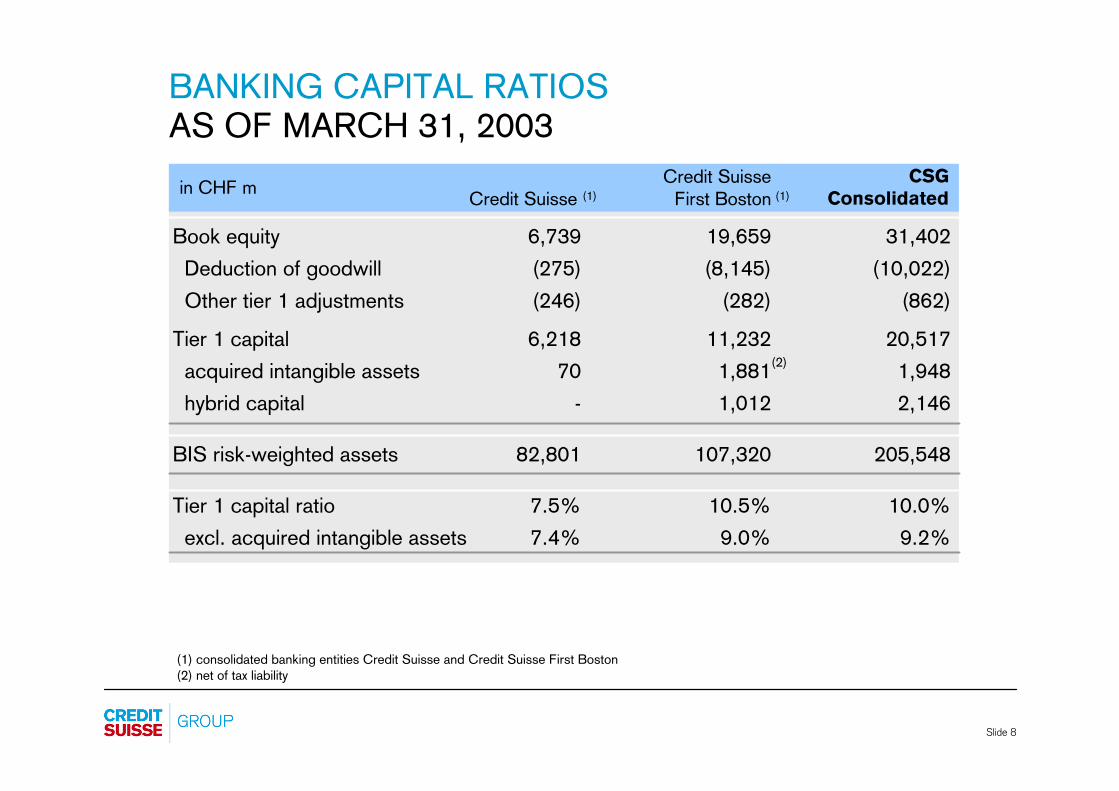
BANKING CAPITAL RATIOSAS OF MARCH 31, 2003
(1) consolidated banking entities Credit Suisse and Credit Suisse First Boston(2) net of tax liability
Book equity 6,739 19,659 31,402 Deduction of goodwill (275) (8,145) (10,022)Other tier 1 adjustments (246) (282) (862)
Tier 1 capital 6,218 11,232 20,517acquired intangible assets 70 1,881 1,948hybrid capital - 1,012 2,146
BIS risk-weighted assets 82,801 107,320 205,548
Tier 1 capital ratio 7.5% 10.5% 10.0%excl. acquired intangible assets 7.4% 9.0% 9.2%
Credit SuisseFirst Boston (1)
CSGConsolidatedin CHF m
(2)
Credit Suisse (1)
Slide 9
§ CONSOLIDATED RESULTS
§ CREDIT SUISSE FINANCIAL SERVICES
§ CREDIT SUISSE FIRST BOSTON
§ SUMMARY
§ CAUTIONARY STATEMENT REGARDINGFORWARD-LOOKING INFORMATION
PRESENTATION
Slide 10
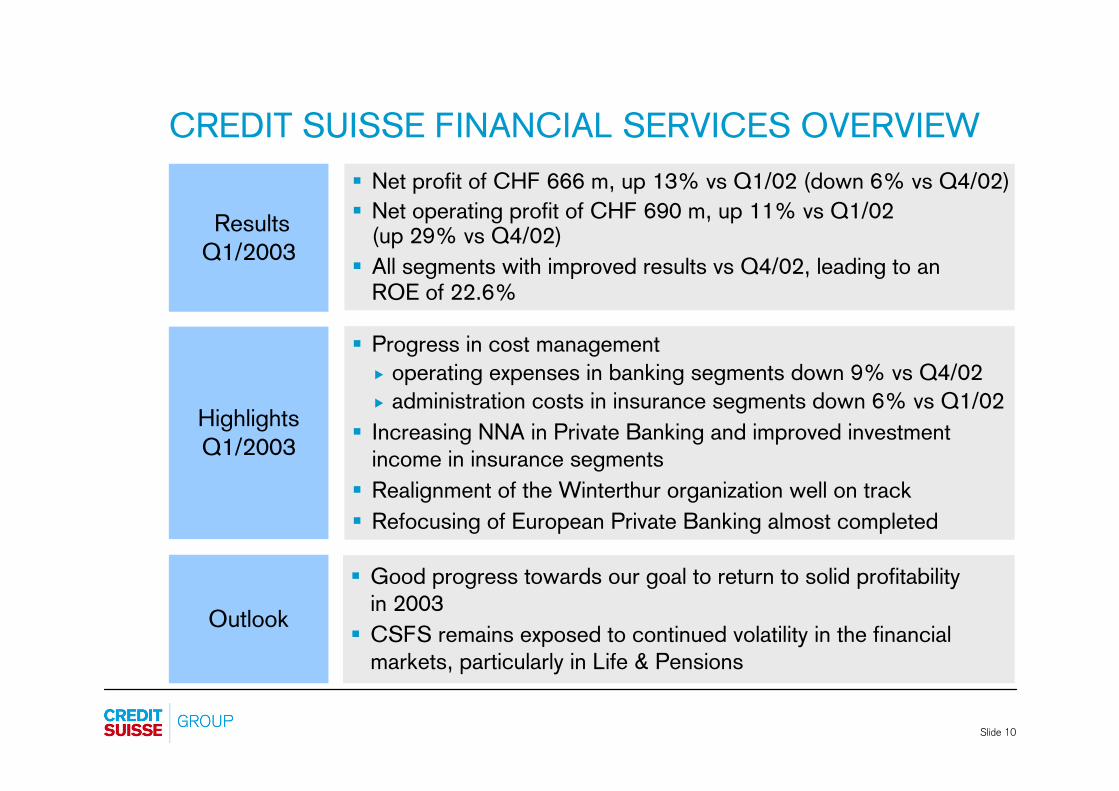
CREDIT SUISSE FINANCIAL SERVICES OVERVIEW
HighlightsQ1/2003
§ Good progress towards our goal to return to solid profitabilityin 2003§ CSFS remains exposed to continued volatility in the financial
markets, particularly in Life & Pensions
ResultsQ1/2003
Outlook
§ Net profit of CHF 666 m, up 13% vs Q1/02 (down 6% vs Q4/02)§ Net operating profit of CHF 690 m, up 11% vs Q1/02
(up 29% vs Q4/02)§ All segments with improved results vs Q4/02, leading to an
ROE of 22.6%
§ Progress in cost management� operating expenses in banking segments down 9% vs Q4/02� administration costs in insurance segments down 6% vs Q1/02§ Increasing NNA in Private Banking and improved investment
income in insurance segments§ Realignment of the Winterthur organization well on track§ Refocusing of European Private Banking almost completed
Slide 11
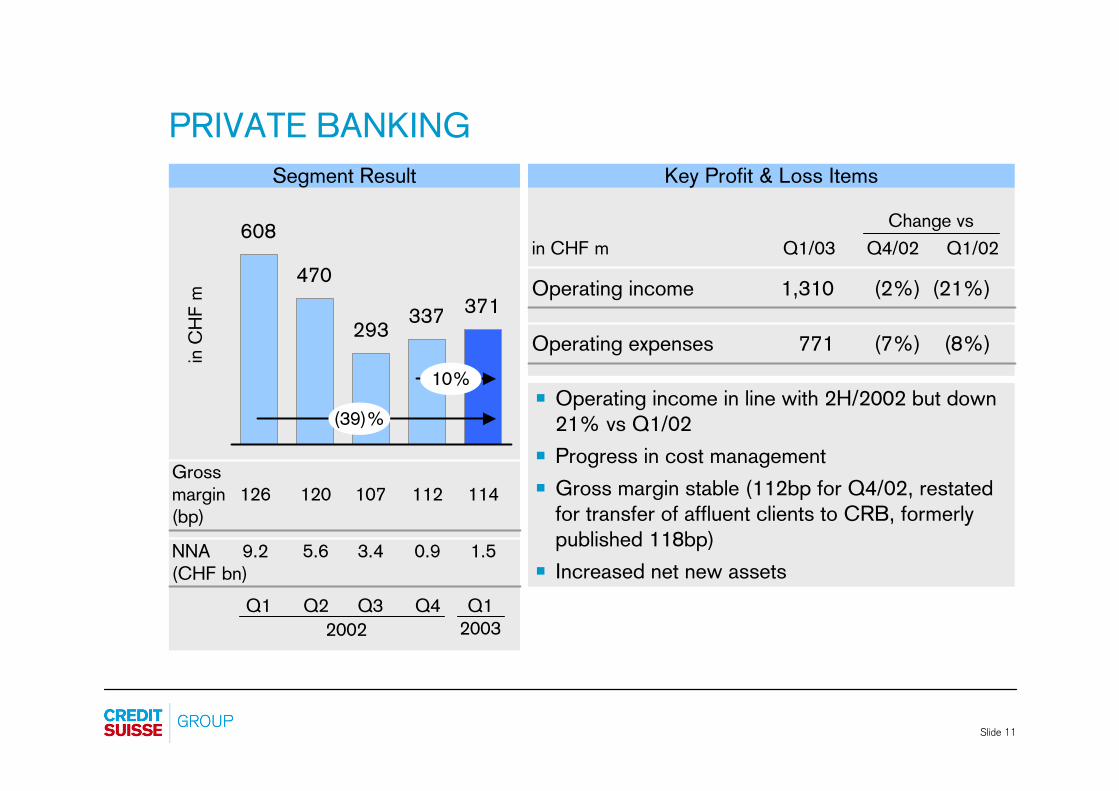
PRIVATE BANKING
608
470
293337 371
Operating income 1,310 (2%) (21%)
Segment Result Key Profit & Loss Itemsin
CH
F m
Operating expenses 771 (7%) (8%)
NNA (CHF bn)
126 120 107 112 114
9.2 5.6 3.4 0.9 1.5
Grossmargin(bp)
(39)%
10%POperating income in line with 2H/2002 but down
21% vs Q1/02P Progress in cost managementPGross margin stable (112bp for Q4/02, restated
for transfer of affluent clients to CRB, formerly published 118bp)
P Increased net new assets
20032002Q2Q1 Q3 Q1Q4
Change vsQ4/02 Q1/02in CHF m Q1/03
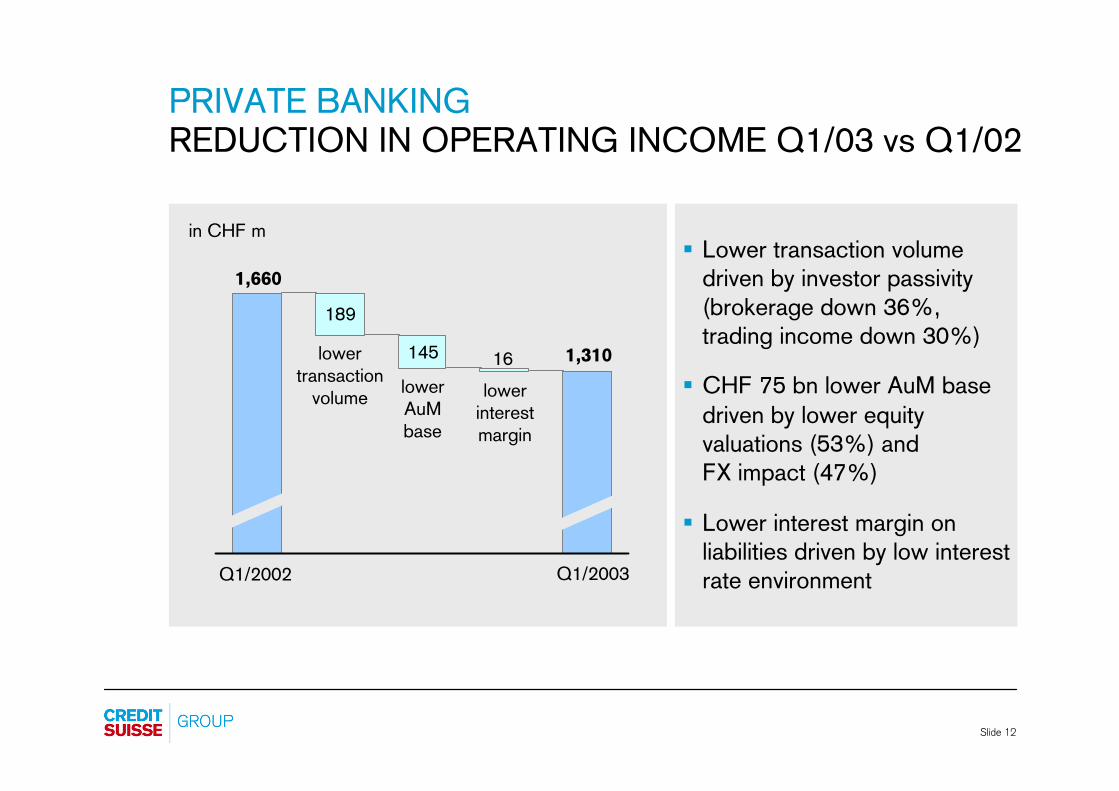
Slide 12
PRIVATE BANKINGREDUCTION IN OPERATING INCOME Q1/03 vs Q1/02
§ Lower transaction volume driven by investor passivity (brokerage down 36%, trading income down 30%)
§ CHF 75 bn lower AuM base driven by lower equity valuations (53%) andFX impact (47%)
§ Lower interest margin on liabilities driven by low interest rate environment
in CHF m
Q1/2002 Q1/2003
1,660
1,310
lower AuM base
lower interest margin
lower transaction
volume
145 16
189
Slide 13
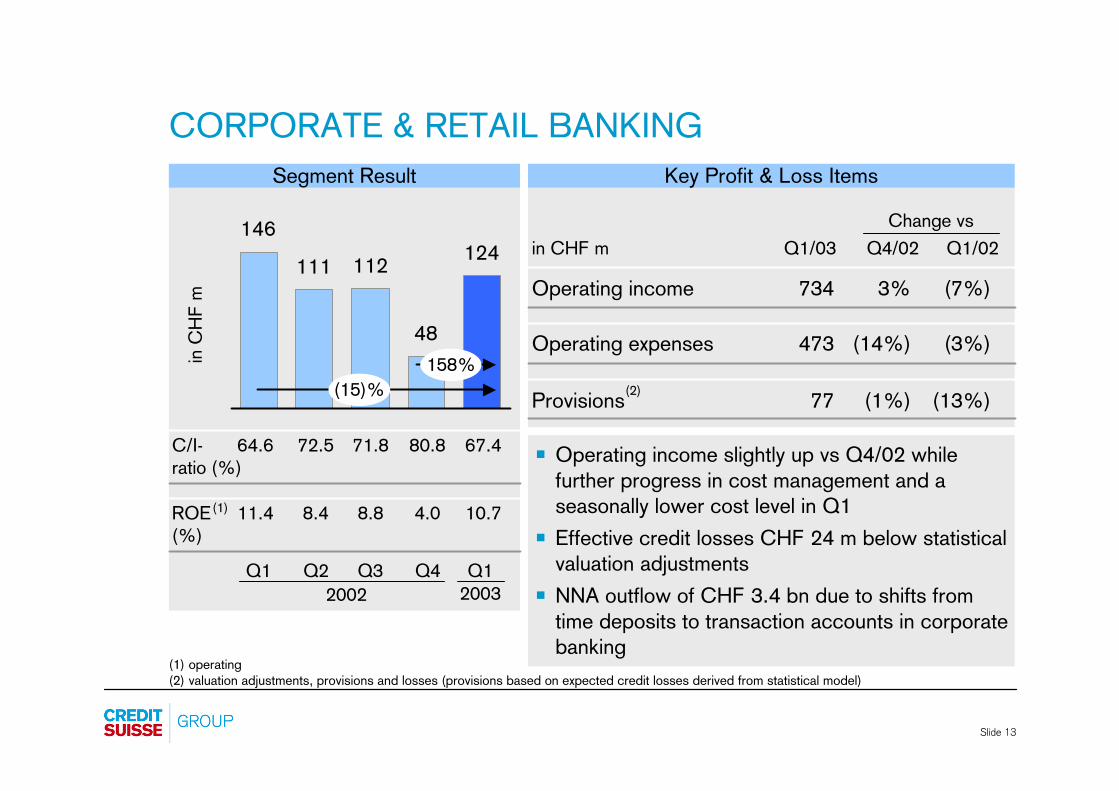
CORPORATE & RETAIL BANKING
146
111 112
48
124
Operating income 734 3% (7%)
Segment Result Key Profit & Loss Itemsin
CH
F m
Operating expenses 473 (14%) (3%)
Provisions 77 (1%) (13%)
64.6 72.5 71.8 80.8 67.4C/I-ratio (%)
(15)%158%
POperating income slightly up vs Q4/02 while further progress in cost management and a seasonally lower cost level in Q1
P Effective credit losses CHF 24 m below statistical valuation adjustments
PNNA outflow of CHF 3.4 bn due to shifts from time deposits to transaction accounts in corporate banking
20032002Q2Q1 Q3 Q1Q4
(1) operating(2) valuation adjustments, provisions and losses (provisions based on expected credit losses derived from statistical model)
Change vsQ4/02 Q1/02in CHF m
11.4 8.4 8.8 4.0 10.7ROE (%)
(1)
Q1/03
(2)
Slide 14
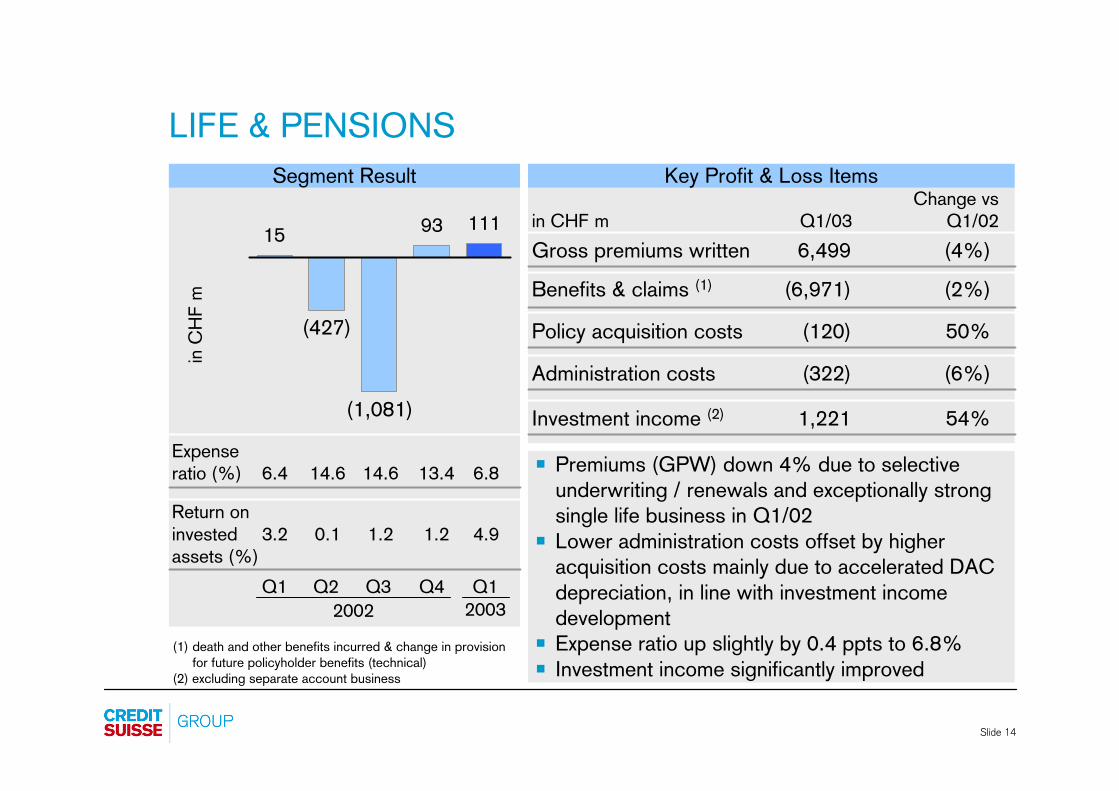
15 93 111
LIFE & PENSIONSSegment Result Key Profit & Loss Items
in C
HF
m
Return on invested assets (%)
6.4 14.6 14.6 13.4 6.8
3.2 0.1 1.2 1.2 4.9
Expenseratio (%) P Premiums (GPW) down 4% due to selective
underwriting / renewals and exceptionally strong single life business in Q1/02
P Lower administration costs offset by higher acquisition costs mainly due to accelerated DAC depreciation, in line with investment income development
P Expense ratio up slightly by 0.4 ppts to 6.8%P Investment income significantly improved
Q1/03
(1) death and other benefits incurred & change in provision for future policyholder benefits (technical)
(2) excluding separate account business
Change vsQ1/02in CHF m
(427)
(1,081)
20032002Q2Q1 Q3 Q1Q4
Gross premiums written 6,499 (4%)
Benefits & claims (1) (6,971) (2%)
Policy acquisition costs (120) 50%
Investment income (2) 1,221 54%
Administration costs (322) (6%)
Slide 15
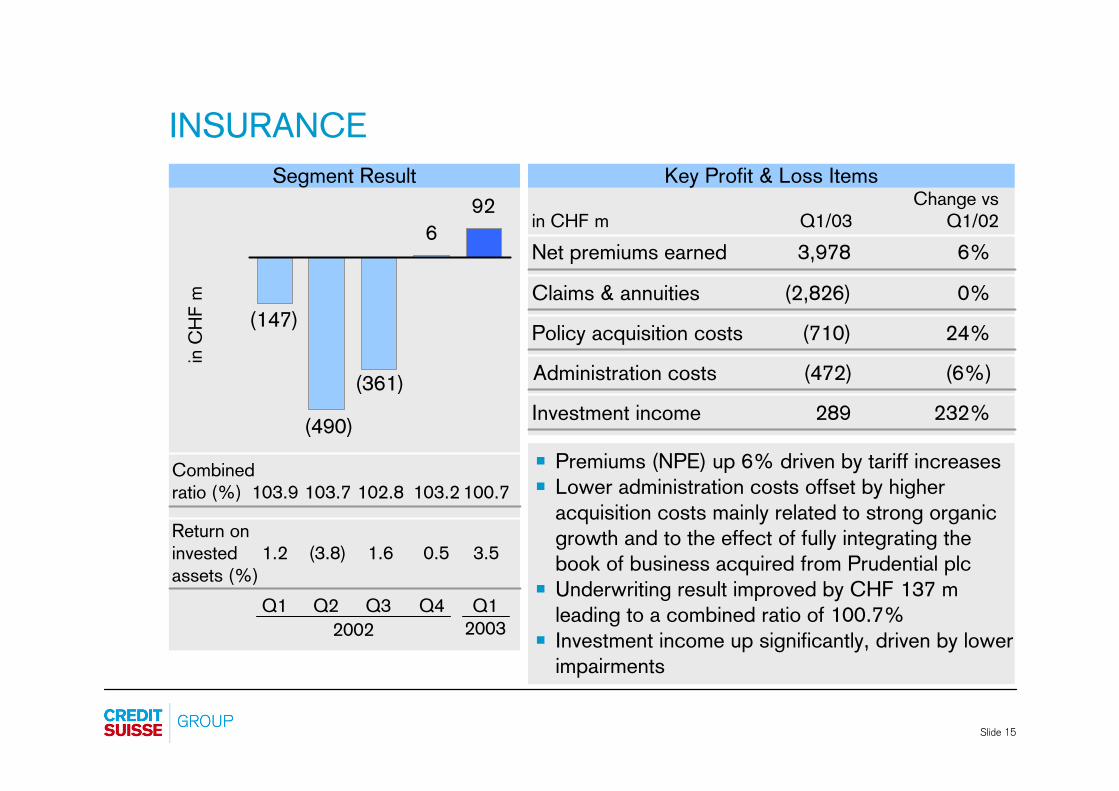
INSURANCE
692
Segment Result Key Profit & Loss Itemsin
CH
F m
Return on invested assets (%)
103.9 103.7 102.8 103.2 100.7
1.2 (3.8) 1.6 0.5 3.5
Combinedratio (%)
P Premiums (NPE) up 6% driven by tariff increasesP Lower administration costs offset by higher
acquisition costs mainly related to strong organic growth and to the effect of fully integrating the book of business acquired from Prudential plc
PUnderwriting result improved by CHF 137 m leading to a combined ratio of 100.7%
P Investment income up significantly, driven by lower impairments
20032002Q2Q1 Q3 Q1Q4
(147)
(490)
(361)
Net premiums earned 3,978 6%Q1/03
Change vsQ1/02in CHF m
Claims & annuities (2,826) 0%
Policy acquisition costs (710) 24%
Investment income 289 232%
Administration costs (472) (6%)
Slide 16
§ CONSOLIDATED RESULTS
§ CREDIT SUISSE FINANCIAL SERVICES
§ CREDIT SUISSE FIRST BOSTON
§ SUMMARY
§ CAUTIONARY STATEMENT REGARDINGFORWARD-LOOKING INFORMATION
PRESENTATION
Slide 17
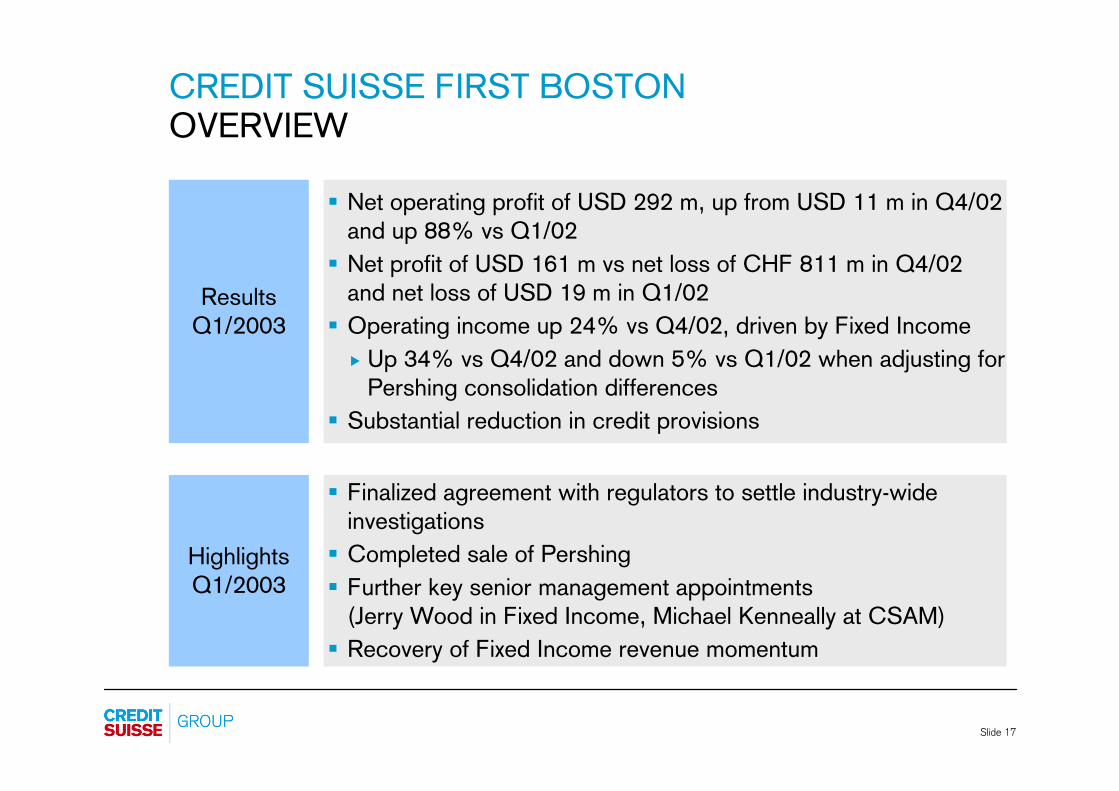
CREDIT SUISSE FIRST BOSTONOVERVIEW
Highlights Q1/2003
ResultsQ1/2003
§ Net operating profit of USD 292 m, up from USD 11 m in Q4/02 and up 88% vs Q1/02§ Net profit of USD 161 m vs net loss of CHF 811 m in Q4/02
and net loss of USD 19 m in Q1/02§ Operating income up 24% vs Q4/02, driven by Fixed Income� Up 34% vs Q4/02 and down 5% vs Q1/02 when adjusting for
Pershing consolidation differences§ Substantial reduction in credit provisions
§ Finalized agreement with regulators to settle industry-wide investigations§ Completed sale of Pershing§ Further key senior management appointments
(Jerry Wood in Fixed Income, Michael Kenneally at CSAM)§ Recovery of Fixed Income revenue momentum
Slide 18
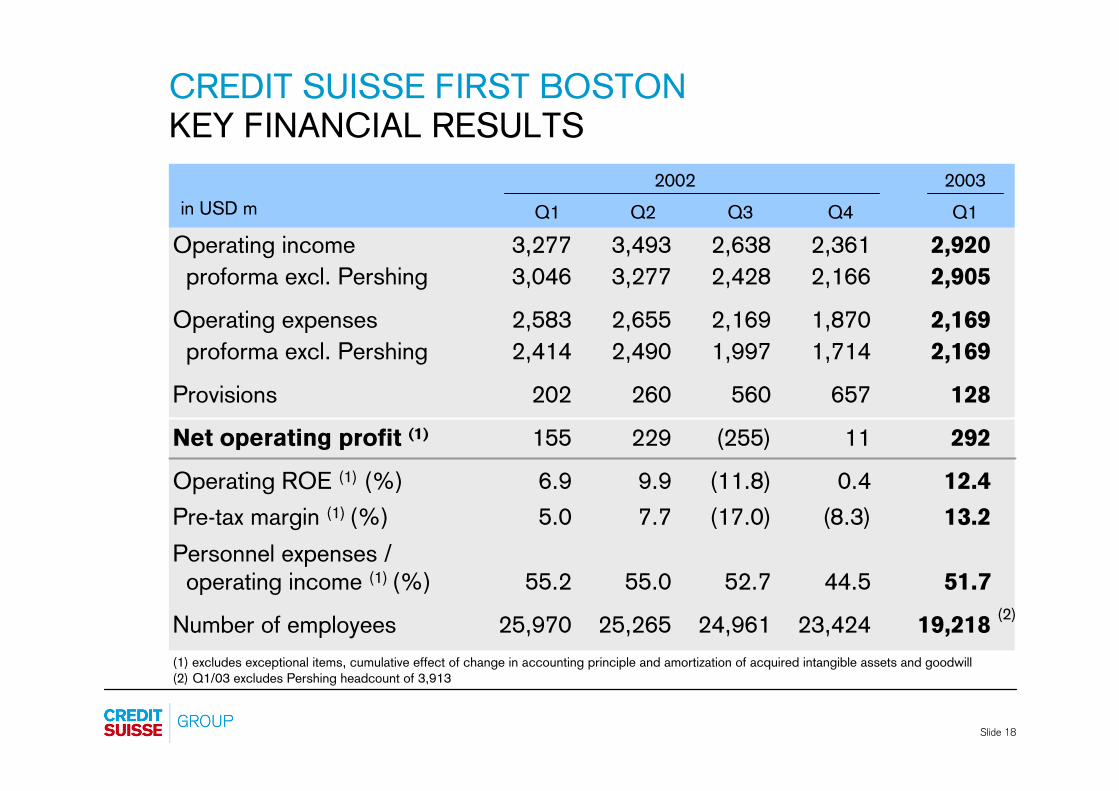
CREDIT SUISSE FIRST BOSTON KEY FINANCIAL RESULTS
Operating income 3,277 3,493 2,638 2,361 2,920proforma excl. Pershing 3,046 3,277 2,428 2,166 2,905
Operating expenses 2,583 2,655 2,169 1,870 2,169proforma excl. Pershing 2,414 2,490 1,997 1,714 2,169
Provisions 202 260 560 657 128
Net operating profit (1) 155 229 (255) 11 292
Operating ROE (1) (%) 6.9 9.9 (11.8) 0.4 12.4Pre-tax margin (1) (%) 5.0 7.7 (17.0) (8.3) 13.2Personnel expenses /
operating income (1) (%) 55.2 55.0 52.7 44.5 51.7
Number of employees 25,970 25,265 24,961 23,424 19,218(1) excludes exceptional items, cumulative effect of change in accounting principle and amortization of acquired intangible assets and goodwill(2) Q1/03 excludes Pershing headcount of 3,913
20032002
Q3Q2 Q4 Q1Q1in USD m
(2)
Slide 19
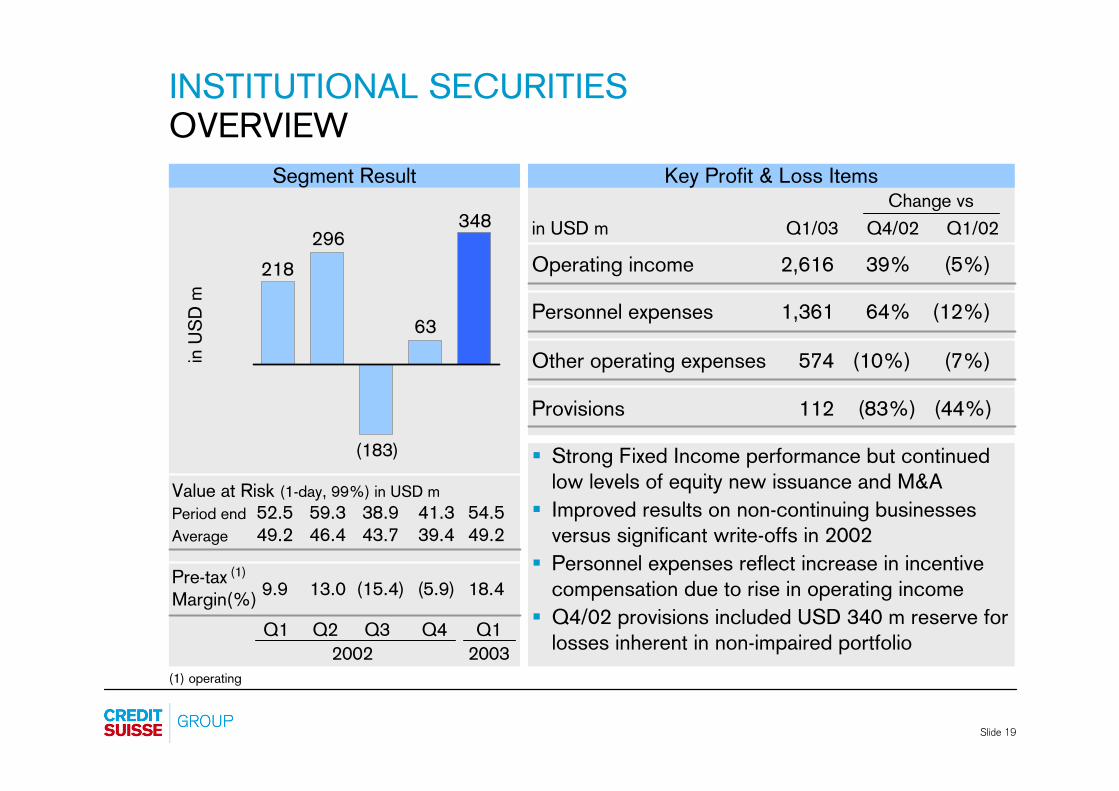
INSTITUTIONAL SECURITIESOVERVIEW
Operating income 2,616 39% (5%)
Segment Result Key Profit & Loss Itemsin
US
D m Personnel expenses 1,361 64% (12%)
Other operating expenses 574 (10%) (7%)
Value at Risk (1-day, 99%) in USD mPeriod endAverage
§ Strong Fixed Income performance but continued low levels of equity new issuance and M&A§ Improved results on non-continuing businesses
versus significant write-offs in 2002§ Personnel expenses reflect increase in incentive
compensation due to rise in operating income§ Q4/02 provisions included USD 340 m reserve for
losses inherent in non-impaired portfolio
Change vsQ4/02 Q1/02in USD m Q1/03
9.9 13.0 (15.4) (5.9) 18.4Pre-tax Margin(%)
63
218296
348
(183)
20032002Q2Q1 Q3 Q1Q4
(1)
Provisions 112 (83%) (44%)
(1) operating
52.5 59.3 38.9 41.3 54.549.2 46.4 43.7 39.4 49.2
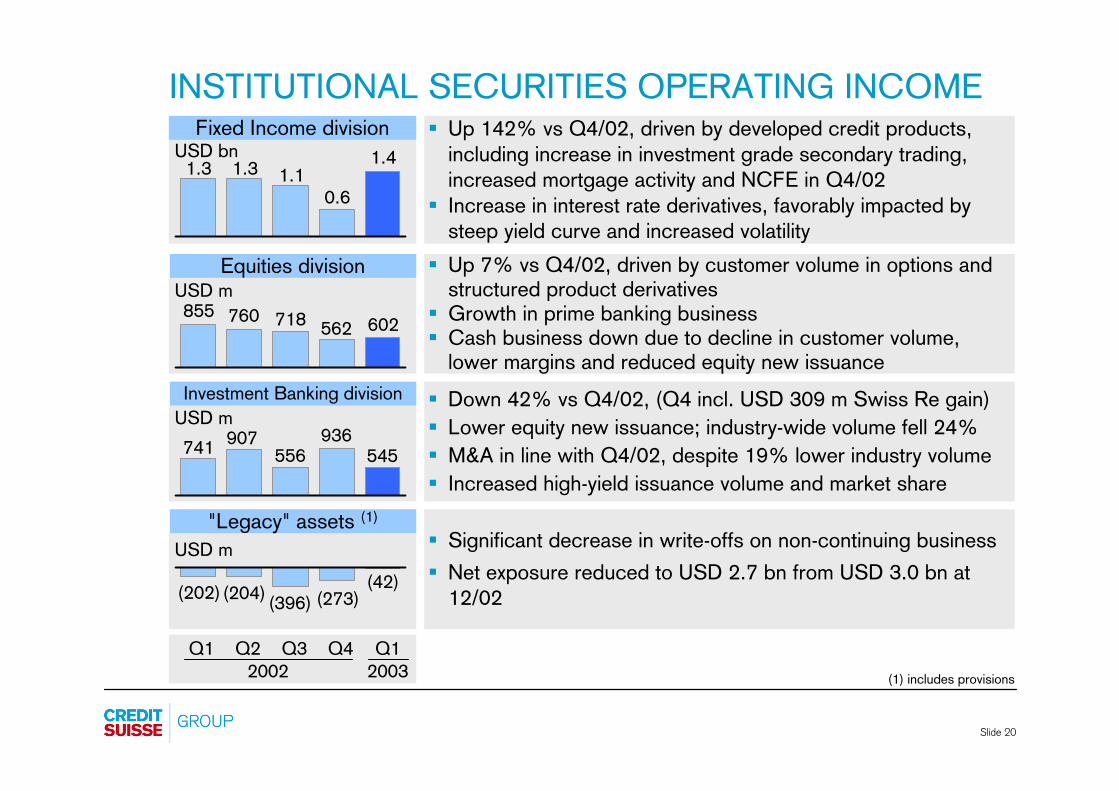
Slide 20
INSTITUTIONAL SECURITIES OPERATING INCOMEFixed Income division
USD m
USD m
§ Up 142% vs Q4/02, driven by developed credit products, including increase in investment grade secondary trading, increased mortgage activity and NCFE in Q4/02§ Increase in interest rate derivatives, favorably impacted by
steep yield curve and increased volatility
§ Up 7% vs Q4/02, driven by customer volume in options and structured product derivatives§ Growth in prime banking business§ Cash business down due to decline in customer volume,
lower margins and reduced equity new issuance
§ Down 42% vs Q4/02, (Q4 incl. USD 309 m Swiss Re gain)§ Lower equity new issuance; industry-wide volume fell 24%§ M&A in line with Q4/02, despite 19% lower industry volume§ Increased high-yield issuance volume and market share
§ Significant decrease in write-offs on non-continuing business§ Net exposure reduced to USD 2.7 bn from USD 3.0 bn at
12/02
"Legacy" assets (1)
(202) (42)(273)(396)(204)
USD m
USD bn
20032002Q3Q2 Q4 Q1Q1
907741 556936
545
760855 718 562 602
(1) includes provisions
1.31.3 1.10.6
1.4
Equities division
Investment Banking division
Slide 21
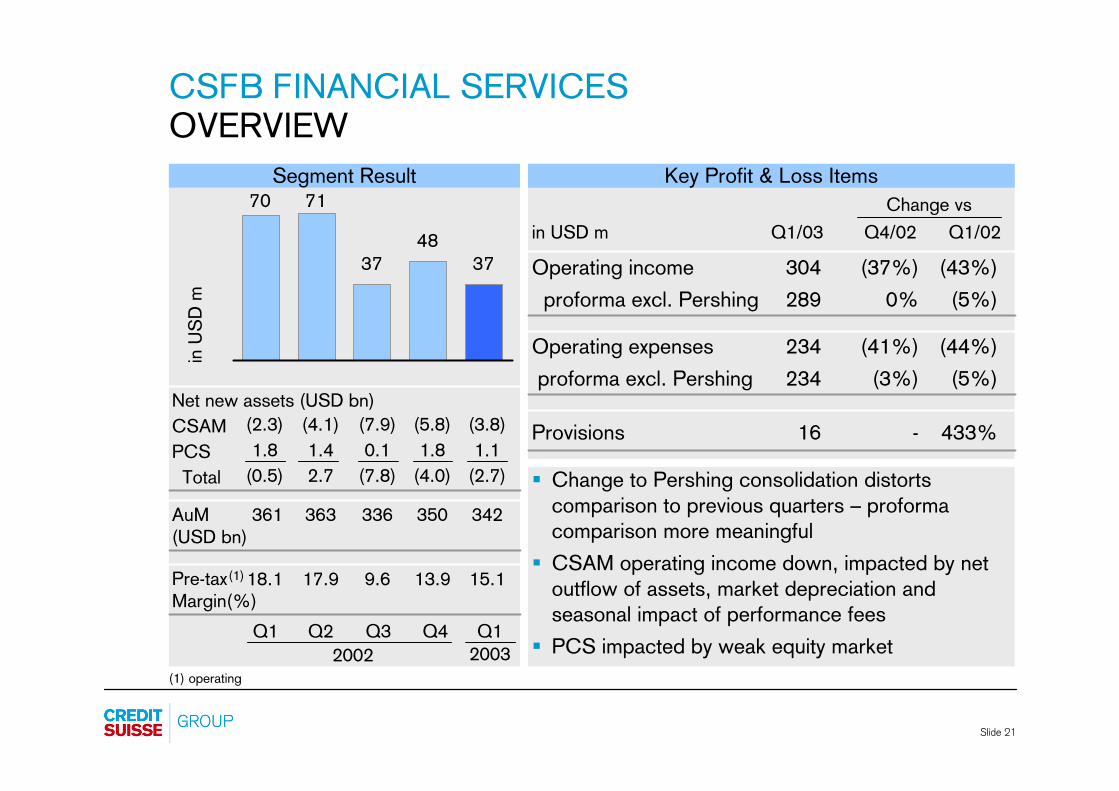
CSFB FINANCIAL SERVICESOVERVIEW
70 71
3748
37 Operating income 304 (37%) (43%)proforma excl. Pershing 289 0% (5%)
Segment Result Key Profit & Loss Itemsin
US
D m
Operating expenses 234 (41%) (44%)proforma excl. Pershing 234 (3%) (5%)
Provisions 16 - 433%
361 363 336 350 342AuM (USD bn)
§ Change to Pershing consolidation distorts comparison to previous quarters – proforma comparison more meaningful§ CSAM operating income down, impacted by net
outflow of assets, market depreciation and seasonal impact of performance fees§ PCS impacted by weak equity market20032002
Q2Q1 Q3 Q1Q4
(1) operating
Change vsQ4/02 Q1/02in USD m Q1/03
18.1 17.9 9.6 13.9 15.1Pre-taxMargin(%)
(1)
(2.3) (4.1) (7.9) (5.8) (3.8)1.8 1.4 0.1 1.8 1.1
(0.5) 2.7 (7.8) (4.0) (2.7)
Net new assets (USD bn)CSAMPCSTotal
Slide 22
§ CONSOLIDATED RESULTS
§ CREDIT SUISSE FINANCIAL SERVICES
§ CREDIT SUISSE FIRST BOSTON
§ SUMMARY
§ CAUTIONARY STATEMENT REGARDINGFORWARD-LOOKING INFORMATION
PRESENTATION
Slide 23
SUMMARY
§ While the level of performance is not yet satisfactory, the Group made progress towards its goal to return to solid profitability in 2003
§ Key priorities for long-term success remain valid
�Continued growth of our client franchise
� Strict cost control
� Sustained profitability
� Strong capital base
§ Given the continued challenging market environment and global uncertainty, Credit Suisse Group remains cautious in its outlook for 2003
Slide 24
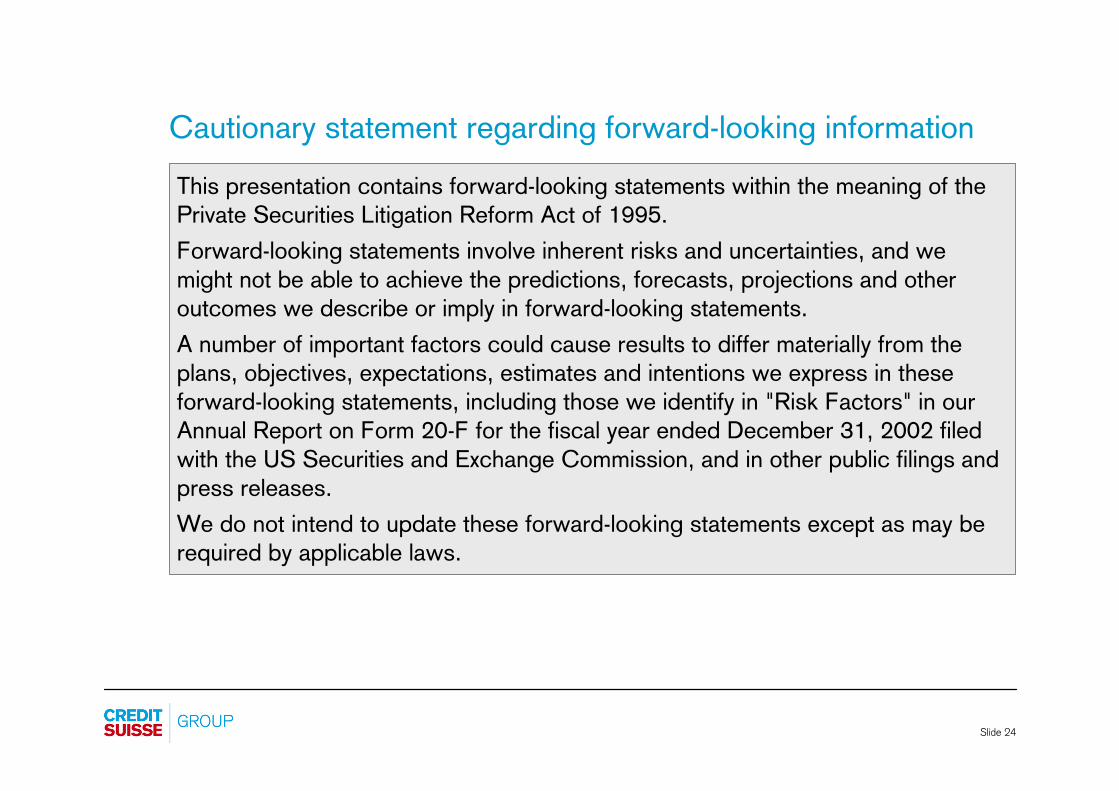
Cautionary statement regarding forward-looking information
This presentation contains forward-looking statements within the meaning of the Private Securities Litigation Reform Act of 1995.Forward-looking statements involve inherent risks and uncertainties, and we might not be able to achieve the predictions, forecasts, projections and other outcomes we describe or imply in forward-looking statements.A number of important factors could cause results to differ materially from the plans, objectives, expectations, estimates and intentions we express in theseforward-looking statements, including those we identify in "Risk Factors" in our Annual Report on Form 20-F for the fiscal year ended December 31, 2002 filed with the US Securities and Exchange Commission, and in other public filings and press releases.We do not intend to update these forward-looking statements except as may be required by applicable laws.