uganda - finclusion.org · the bank of uganda continued to implement regulations and policies...
TRANSCRIPT

UGANDA WAVE 5 REPORTFIFTH ANNUAL FII TRACKER SURVEYConducted July-August 2017
June 2018

PUTTING THE USER FRONT AND CENTER
2
The Financial Inclusion Insights (FII) program responds to the need identified by multiple stakeholders for timely demand-side data and practical insights into digital financial services (DFS), including mobile money, and the potential for their expanded use among the poor.
The FII team implements nationally representative population surveys and qualitative research studies in Bangladesh, India, Indonesia, Kenya, Nigeria, Pakistan, Tanzania and Uganda to:
• Track access to and demand for financial services, especially DFS;
• Measure adoption and use of DFS among key underserved groups (females, poor, rural, etc.);
• Identify drivers and barriers to further adoption of DFS;
• Evaluate the agent experience and the performance of mobile money agents; and
• Produce actionable, forward-looking insights based on rigorous data to support product and service development and delivery.
The FII program is managed by InterMedia. Visit the FII Resource Center to learn more: www.finclusion.org.
UGANDA
By InterMedia

Access to a bank – Counts individuals who use a full-service bank account either registered in their name or held by someone else.
Access to mobile money or an NBFI – Counts individuals who have ever used a mobile money service or a full-service NBFI.
Access & trial – Counts individuals who have a bank account registered in their name or use a bank account that is registered to someone else, or have ever used a mobile money service, or a full-service NBFI.
Active registered user – An individual who has an account registered in their name with a full-service financial institution and has used it in the last 90 days.
Advanced user – An active registered user who has ever used their account for saving, borrowing, insurance, investment, paying bills or receiving wages or government benefits. Buying airtime top-ups is considered an advanced use of a bank account or NBFI account but not a mobile money account.
Airtime – Minutes of talk time available on a mobile phone. Airtime top-up (adding minutes) is a basic mobile money activity, but is considered an advanced bank or NBFI activity.
Basic use – Cash-in (deposit) or cash-out (withdraw), transfer money to another individual, or conduct account maintenance.
Below the poverty line – In this particular study, adults living on less than $2.50 per day in 2005 purchasing power parity U.S. Dollars, as classified by the Poverty Probability Index.
Confidence interval (95%) – The range of values within which the observed value of a statistic will be found in 95 out of 100 repeat measurements.
Cooperative – Typically, a business or other professional organization that is owned and run jointly by its members, who share profits or benefits. Cooperatives may release some of the profits/funds as loans to its members.
Credit-only nonbank financial institutions – Financial institutions that only disburse loans to their customers and are therefore not considered full service.
Customer journey – A series of progressive stages through which individuals become more active users of more sophisticated financial services.
Digital financial inclusion – Counts individuals who have an account in their name with a full-service financial institution that offers digital services (e.g., online account access, debit/ATM card, credit card, electronic cash transfers).
Digital financial services (DFS) – Financial services provided through an electronic platform (e.g., mobile phones, debit or credit electronic cards, internet).
Digital stored-value account – A mobile money account or a full-service bank or NBFI account that offers digital services.
Financial inclusion – Individuals who hold an account with an institution that provides a full suite of financial services and comes under some form of government regulation.
Financial literacy -- Basic knowledge of four fundamental concepts in financial decision making (interest rates, interest compounding, inflation, and risk diversification) as measured by the Standard and Poor’s Rating Service’s Global Financial Literacy Survey.
Full-service financial institutions – Financial institutions that offer loans to their customers and at least one of the following additional services: savings, money transfers, insurance, or investments.
Microfinance institution (MFI) – An organization that offers financial services to low-income populations. Almost all give loans to their members, and many offer insurance, deposit and other services.
Mobile money (MM) – A service that allows a mobile phone to be used for storing and transferring money, and potentially accessing other financial services.
Nonbank financial institution (NBFI) – A financial organization that is not formally licensed as a bank or a mobile money provider, but whose activities are regulated, at least to some extent, by the central bank within the country. Such financial institutions include microfinance institutions (MFIs), cooperatives, Post Office (Savings) Banks and savings and credit cooperatives (SACCOs), etc.
Numeracy -- The ability to use basic math skills, including counting, addition, division, multiplication and computing short- and long-term interest rates.
Post Office (Savings) Bank – A bank that offers savings and money transfers and has branches at local post offices.
Poverty Probability Index (PPI) – A measurement tool wherein a set of country-specific survey questions are used to compute the likelihood that an individual’s income is below a specific threshold.
Registered user – Counts individuals who have a financial account registered in their name or registered jointly in their and someone else’s name.
Savings and credit cooperative (SACCO) – A self-help group owned and managed by its members. Its main purpose is to build up funds through regular contributions by each member, with the aim of providing affordable credit and collective investments.
Unregistered/over-the-counter (OTC) user – An individual who has used a financial service through someone else’s account, including a mobile money agent’s account or the account of a family member or a neighbor.
Urban/rural – Urban and rural persons are defined according to their residence in urban or rural areas as prescribed by the national bureau of statistics.
Value-added services – These are non-core financial services that go beyond the standard services provided by financial institutions.
KEY DEFINITIONS
3
UGANDA

CONTENTS
4
Financial Inclusion Overview 5Customer Journey 20
Nonusers 38
Unregistered Users 43Registered Inactive Users 50
Active Basic Users 52
Advanced Users 56Key Indicators Summary 62
UGANDA


What is financial inclusion?Financial inclusion means that individuals and businesses have access to useful and affordable financial products and services that meet their needs –transactions, payments, savings, credit and insurance – delivered in a responsible and sustainable way (The World Bank). Financially included individuals are those who have an account in their name with a full-service financial institution.
How is it measured?We measure financial inclusion as the percentage of adults (15+ years old) who report having at least one account in their name with an institution that offers a full suite of financial services, and comes under some form of government regulation.
How is it created?Financial inclusion is created through the uptake and use of individual accounts with institutions that offer a full suite of financial services – savings, credit, money transfers, insurance and investment. Full-service financial institutions include banks, mobile money service providers, and nonbank financial institutions, such as deposit-taking microfinance institutions (MFIs)and financial cooperatives.
What institutions and services do not count?Individuals who own accounts with institutions that are not full service, such as credit-only microfinance institutions (MFIs), are not considered financially included. Individuals who do not have their own full-service account or use someone else’s account are not considered financially included. Individuals who only use services such as money guards, savings collectors, and digital recharge cards that are not attached to a bank or MFI account are also considered financially excluded.
UNDERSTANDING FINANCIAL INCLUSION
6
UGANDA

• Fifth survey (Wave 5) conducted from July 5, 2017, to Aug. 10, 2017. Measures trends in financial inclusion since 2013.
• Nationally representative sample of 3,001 adults aged 15+ residing in households.
• Results at national level, and for urban and rural separately.
• Sample designed by InterMedia in collaboration with the Uganda Bureau of Statistics.
• The survey subsampled the 2016/2017 Uganda National Household Survey (UNHS). Stratified multistage sample:
o Stratification by urban/rural within each subregion.
o First stage: Selection of 292 census EAs (81 EAs in urban and 211 EAs in rural).
o Second stage: Selection of 12 households per sampled EA.
o Third stage: Random selection of one adult member per household.
• Face-to-face interviews using smartphones.
• Sampling weights: Design weight based on the probability of selection for each stage of sampling adjusted for non-response at the household and household member levels. Sampling weights normalized at the national level so that the weighted number of cases equals the sample size.
• Weights used to make inferences about the target population (15 years old and over) at the national level and for urban and rural populations separately. Weighted percentages are reported together with unweighted respondent counts.
ABOUT THE SURVEY
7
UGANDA
Demographic characteristics Percentages
Male 48
Female 52
Urban 27
Rural 73
Above the $2.50/day poverty line 43
Below the $2.50/day poverty line 57
Age: 15-24 32
25-34 24
35-44 16
45-54 13
55+ 15
Basic literacy 43
Basic numeracy 96
Source: InterMedia Uganda FII Tracker survey, Wave 5 (N=3,001, 15+), July-August 2017.
2017: National demographics (Shown: Percentage of Uganda adults, N=3,001)
COUNTRY CONTEXT
8
UGANDA
The Bank of Uganda and the Ministry of Finance, Planning and Economic Development launched the National Financial Inclusion Strategy (NFIS) 2017-2022 in October 2017 to promote financial inclusion. The NFIS’s vision is that “all Ugandans have access to, and use, a broad range of quality and affordable financial services.” The NFIS builds on the key successes of the Government’s 2012 financial inclusion program, which included developing and implementing the 2013-2017 strategy for financial literacy in Uganda; issuing financial consumer protection and mobile money guidelines in 2013; amending the 2004 Financial Institutions Act to allow for agency and Islamic banking; and the geospatial mapping of financial points of service across the country. The NFIS’s objectives are to:
• Reduce financial exclusion and barriers to access financial services;
• Develop the credit infrastructure;
• Build digital infrastructure;
• Deepen and broaden formal savings, investments and insurance usage; and,
• Protect and empower individuals with enhanced financial capability.
The growth of Uganda’s economy accelerated in 2017 to 4.8 percent of GDP. Growth is expected to increase in 2018 across manufacturing, construction, and service sectors, boosted by public infrastructure investment. Broad-based economic growth should support growth in employment, wages, and incomes, and provide favorable conditions for expanded financial inclusion and uptake of advanced financial products and services.
In October 2017, the Bank of Uganda reduced its benchmark interest rate to 9.5 percentto support growth in private sector credit and strengthen economic growth. Reducing the cost of credit should support financial inclusion by facilitating borrowing.
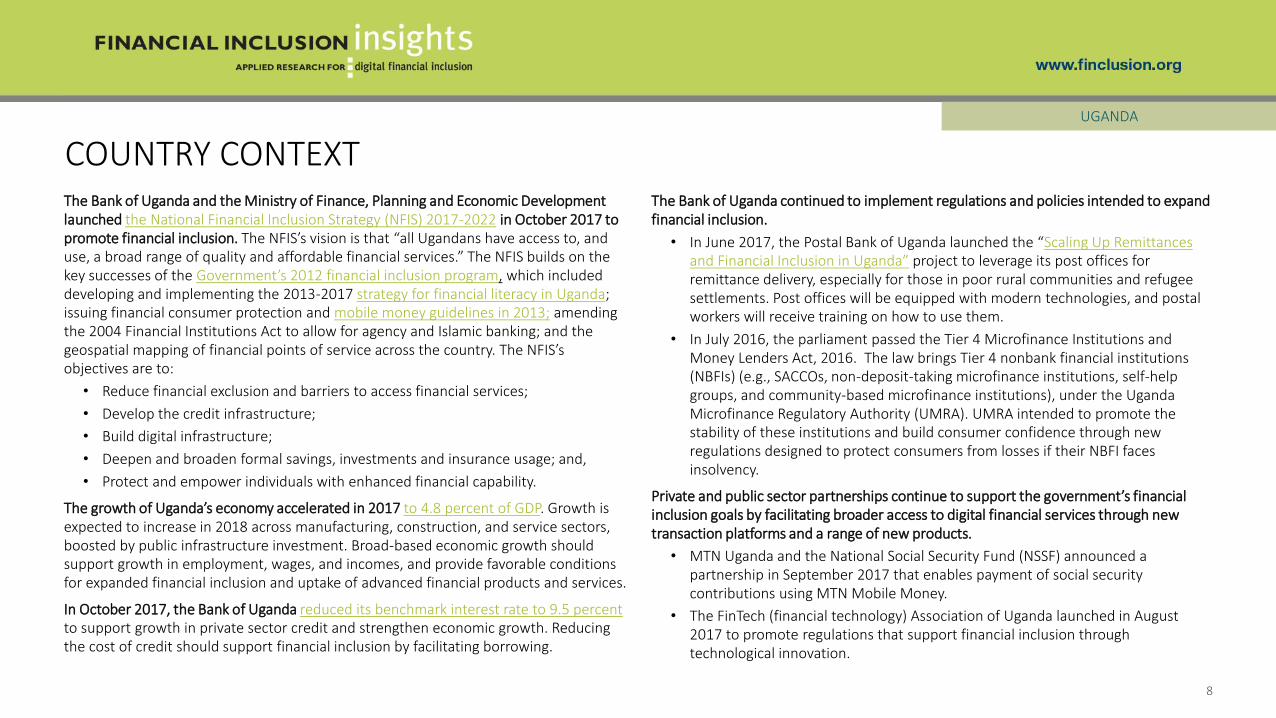
The Bank of Uganda continued to implement regulations and policies intended to expand financial inclusion.
• In June 2017, the Postal Bank of Uganda launched the “Scaling Up Remittances and Financial Inclusion in Uganda” project to leverage its post offices for remittance delivery, especially for those in poor rural communities and refugee settlements. Post offices will be equipped with modern technologies, and postal workers will receive training on how to use them.
• In July 2016, the parliament passed the Tier 4 Microfinance Institutions and Money Lenders Act, 2016. The law brings Tier 4 nonbank financial institutions (NBFIs) (e.g., SACCOs, non-deposit-taking microfinance institutions, self-help groups, and community-based microfinance institutions), under the Uganda Microfinance Regulatory Authority (UMRA). UMRA intended to promote the stability of these institutions and build consumer confidence through new regulations designed to protect consumers from losses if their NBFI faces insolvency.
Private and public sector partnerships continue to support the government’s financial inclusion goals by facilitating broader access to digital financial services through new transaction platforms and a range of new products.
• MTN Uganda and the National Social Security Fund (NSSF) announced a partnership in September 2017 that enables payment of social security contributions using MTN Mobile Money.
• The FinTech (financial technology) Association of Uganda launched in August 2017 to promote regulations that support financial inclusion through technological innovation.

• Growth in financial inclusion accelerated in 2016-2017.
o Close to one-half of adults (46%) were financially included in 2017, mainly via mobile money (43%), followed by banks (11%) and non-bank financial institutions (NBFIs) (7%). Mobile money and NBFI account owners grew by 5 and 3 percentage points, respectively, versus 2016. The proportion of adults who hold bank accounts increased slightly, but the increase was not statistically significant.
o The percentage of adults who accessed financial services increased by 8 percentage points, from 55% in 2016 to 63% in 2017. The growth in access was due to the substantial increase in the proportion of the population that used mobile money, now, at 61%.
o Thirty-eight percent of adults were active users (used their accounts in the 90 days preceding the survey).
o The proportion of the population that took up advanced use cases (beyond basic transfers and cash-in, cash-out) also grew by 5 percentage points to 28% in 2017, compared to 23% in 2016.
• Mobile money continued to drive financial inclusion; 94% of financially included adults had a mobile money account in 2017.
o Additionally, nearly one-fifth (19%) of the adult population were unregistered, over-the-counter (OTC) users of mobile money. Within this unregistered user group, 19% reported using mobile money for “saving,” or safely storing cash in the form of e-money while waiting to cash out with an agent after receiving a transfer. This group of savers is likely to progress to account registration and advanced use.
o Uptake of mobile money continued to surpass that of banks and NBFIs, though commercial banks are expected to benefit from the recent rollout of agency banking, which allows third-party agents to provide banking services outside of bank offices.
o Consumers were more likely to know of a mobile money point of service than any other financial access point.
• Limited phone ownership and lack of digital skills constrain the growth of digital financial inclusion.
o Forty-six percent of adults did not own a mobile phone. Additionally, 45% were not able to send or receive a text, which is a strong proxy indicator of lack of ability to use mobile money.
NOTABLE STATISTICS
9
UGANDA
Source: InterMedia Uganda FII Tracker survey, Wave 5 (N=3,001, 15+), July-August 2017.
7% have a full-service NBFI account
11% have a full-service bank account
43% have a registered mobile money account
46% Financially included
*Overlap representing those who have multiple kinds of financial accounts is not shown.
2017: Financial Inclusion*(Shown: Percentage of Uganda adults, N=3,001)

14 43 477
15 43 47
8
12 47 506
11 53 55
9
12 61 63
Nonbank financial institution Bank Mobile money NBFI, bank, and/or mobile money
2013 (N=3,000) 2014 (N=3,001) 2015 (N=3,000) 2016 (N=3,000) 2017 (N=3,001)
ACCESS & TRIAL OF FINANCIAL SERVICES
10
UGANDA
Access & trial (Shown: Percentage of Uganda adults, by year)
NA
• From 2016 to 2017, the proportion of adults who accessed formal financial services increased 8 percentage points –the largest annual increase ever recorded by the FII surveys in Uganda. This increase accounted for half of the growth in access since 2013, when 47% of the population had access, compared to 63% in 2017.
• Bank and NBFI access showed no growth; the proportion of the adult population who accessed branch banking and NBFI services is statistically unchanged over the survey waves since 2013.
Source: InterMedia Uganda FII Tracker surveys, Wave 1 (N=3,000, 15+), September-October 2013; Wave 2 (N=3,001, 15+), September 2014; Wave 3 (N=3,000, 15+), September 2015; Wave 4 (N=3,000, 15+), August 2016; Wave 5 (N=3,001, 15+), July-August 2017.
95% confidence interval
61% of adults accessed mobile money in 2017.

12 29 335 14 33 386
11 35 394 9 38 407
11 43 46
Nonbank financial institution Bank Mobile money NBFI, bank, and/or mobile money
2013 (N=3,000) 2014 (N=3,001) 2015 (N=3,000) 2016 (N=3,000) 2017 (N=3,001)
REGISTERED USERS (FINANCIAL INCLUSION)
11
UGANDA
Source: InterMedia Uganda FII Tracker surveys, Wave 1 (N=3,000, 15+), September-October 2013; Wave 2 (N=3,001, 15+), September 2014; Wave 3 (N=3,000, 15+), September 2015; Wave 4 (N=3,000, 15+), August 2016; Wave 5 (N=3,001, 15+), July-August 2017.
Registered users(Shown: Percentage of Uganda adults, by year)
• Since 2013, the percentage of adults who have financial accounts with a formal full-service institution has grown from 33% to 46% in 2017. Nearly all registered users have mobile money accounts.
• While registered bank users showed no growth, the proportion of NBFI account holders grew significantly, increasing by 3 percentage points between 2016 and 2017. This finding suggests that the Tier 4 regulatory reforms are working to promote the expansion of NBFI account ownership.
NA
95% confidence interval
43% of adults were registered mobile money users. Since 2013,mobile money has been the main driver of all growth in financial inclusion.

34 4332 4732 4939 54
Female Male
38 39 40 46
Total population
• Financial inclusion in Uganda shows persistent gender, locality, and income gaps; a smaller proportion of adults in the female, rural, and below-poverty demographics are financially included compared to the male, urban, and above-poverty groups. The locality and income gaps have narrowed since 2014 as more rural and below-poverty adults have become financially included, versus little change in the urban and above-poverty groups.
• From 2014 to 2016, financial inclusion among men increased, while inclusion among women showed little change. From 2016 to 2017, however, an additional 7% of women became financially included, compared to 5% of men. Inclusion must accelerate among women for the gender gap to close.
FINANCIAL INCLUSION TREND, BY DEMOGRAPHIC GROUPUGANDA
30 6431 6133 6140 63
Rural Urban
27 6229 6623 6132 65
Below poverty Above poverty
n 2014: Total population (N=3,001); Female (n=1,596); Male (n=1,405); Rural (n=2,221); Urban (n=780); Below poverty (n=2,171); Above poverty (n=830)
n 2015: Total population (N=3,000); Female (n=1,955); Male (n=1,045); Rural (n=2,200); Urban (n=800); Below poverty (n=2,036); Above poverty (n=964)
n 2016: Total population (N=3,000); Female (n=1,942); Male (n=1,058); Rural (n=2,190); Urban (n=810); Below poverty (n=1,680); Above poverty (n=1,320)
n 2017: Total population (N=3,001); Female (n=1,875); Male (n=1,126); Rural (n=2,165); Urban (n=836); Below poverty (n=1,636); Above poverty (n=1,365)
Registered users, by demographic group(Shown: Percentage of each demographic group who are registered users, by year)
Source: InterMedia Uganda FII Tracker surveys, Wave 2 (N=3,001, 15+), September 2014; Wave 3 (N=3,000, 15+), September 2015; Wave 4 (N=3,000, 15+), August 2016; Wave 5 (N=3,001, 15+), July-August 2017.
95% confidence interval
12
10 26 304 11 29 345
9 31 3437
32 335
736 38
Nonbank financial institution Bank Mobile money NBFI, bank, and/or mobile money
2013 (N=3,000) 2014 (N=3,001) 2015 (N=3,000) 2016 (N=3,000) 2017 (N=3,001)
ACTIVE REGISTERED USERS
13
UGANDA
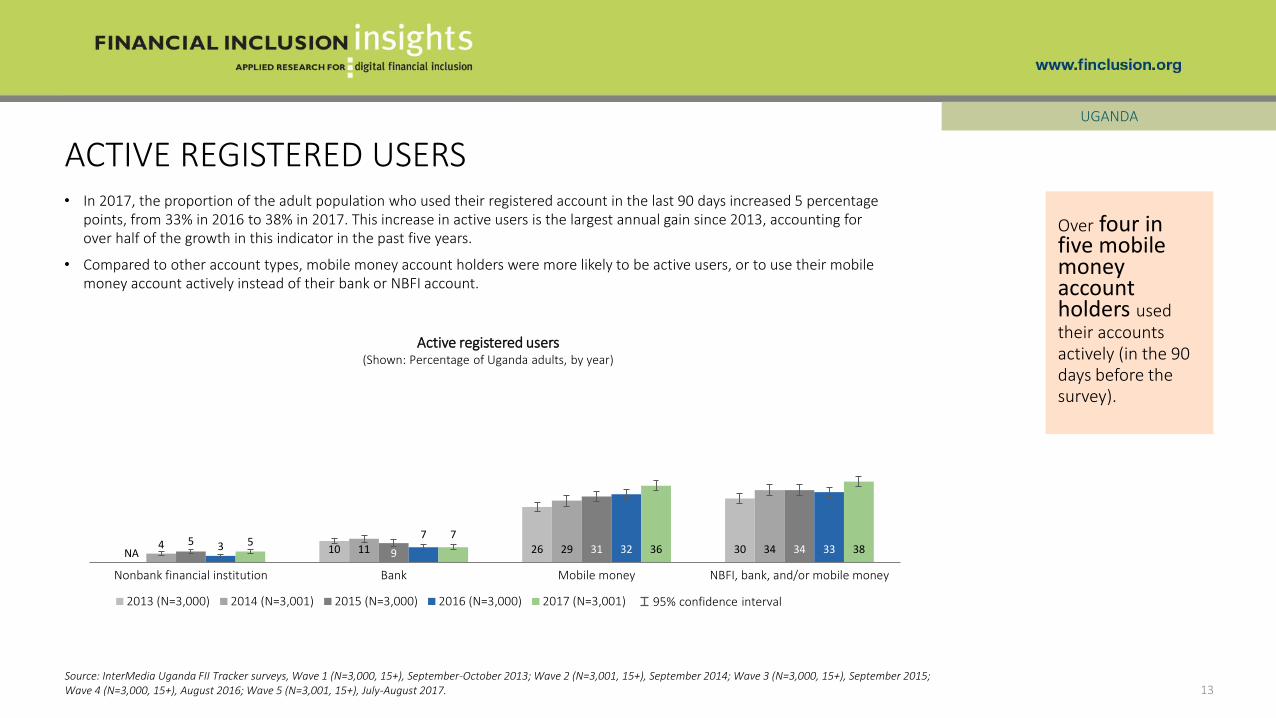
Active registered users(Shown: Percentage of Uganda adults, by year)
NA
Source: InterMedia Uganda FII Tracker surveys, Wave 1 (N=3,000, 15+), September-October 2013; Wave 2 (N=3,001, 15+), September 2014; Wave 3 (N=3,000, 15+), September 2015; Wave 4 (N=3,000, 15+), August 2016; Wave 5 (N=3,001, 15+), July-August 2017.
• In 2017, the proportion of the adult population who used their registered account in the last 90 days increased 5 percentage points, from 33% in 2016 to 38% in 2017. This increase in active users is the largest annual gain since 2013, accounting for over half of the growth in this indicator in the past five years.
• Compared to other account types, mobile money account holders were more likely to be active users, or to use their mobile money account actively instead of their bank or NBFI account.
Over four in five mobile money account holders used their accounts actively (in the 90 days before the survey).
95% confidence interval

410
15 2248
19 243 6
21 2347
25 28
Nonbank financial institution Bank Mobile money NBFI, bank, and/or mobile money
2014 (N=3,001) 2015 (N=3,000) 2016 (N=3,000) 2017 (N=3,001)
ADVANCED USERS
14
UGANDA
Advanced active registered users(Shown: Percentage of Uganda adults, by year*)
Source: InterMedia Uganda FII Tracker surveys, Wave 2 (N=3,001, 15+), September 2014; Wave 3 (N=3,000, 15+), September 2015; Wave 4 (N=3,000, 15+), August 2016; Wave 5 (N=3,001, 15+), July-August 2017.
58% of registered mobile money users used their accounts for an advanced service in the 90 days before the survey.
• An additional 5 percent of the adult population joined the advanced user group (actively used a financial account and accessed an advanced service) from 2016 to 2017. This growth was driven by an increase in users who performed advanced activities – mainly saving and paying bills – using mobile money accounts.
• Advanced NBFI and bank account users are a small proportion of adults – 4% and 7%, respectively. The slight increases in the size of these user groups over 2016 were not statistically significant.
95% confidence interval
*2013 definition of advanced users is not comparable with later years

81
6248 43
18 15 13 11 9
9
16
106
1714
10 10 7
410
10
743
38
17 2722
6 11
3244
2233
6052
62
Any POS MM agent Retail store with MMkiosk
Informalsaving/lending
group
Bank branch ATM SACCO Banking agent MFI/MDI
Less than 1 km from home 1-5 km from home More than 5 km from home Don't know
GEOGRAPHICAL ACCESS TO FINANCIAL SERVICES
15
UGANDA
2017: Proximity to points-of-service (POS) for financial institutions(Shown: Percentage of Uganda adults, N=3,001)
81% of adults lived within one kilometer of a financial point of service.
Source: InterMedia Uganda FII Tracker survey, Wave 5 (N=3,001, 15+), July-August 2017.
• In 2017, 62% of the adult population knew of a mobile money agent within one kilometer of their home. In contrast, only 11% knew of a banking agent, 18% knew of a bank branch, and only 15% knew of an ATM within one kilometer. The rollout of agency banking following the Financial Institutions Act amendments of 2016 should result in increased access to banking services.
• After mobile money, informal savings and lending groups were the most accessible points of service; 43% of adults lived within one kilometer of an informal group.
• SACCOs are the most common type of NBFI in Uganda; 13% of the adult population lived within 1 kilometer of a point-of-service in 2017.

• Limited digital readiness constrains the growth of DFS users in Uganda. While the large majority of adults (81%) have access to a mobile phone, only 59% own a SIM card and 55% have the ability to send or receive text messages – the key proxy indicator of ability to use a mobile money account on a phone. The increases in SIM ownership and ability to text from 2016 to 2017 suggest that digital readiness is increasing.
• Financial literacy increased to 24% in 2017, from 18% in 2016. This increase may reflect successful outcomes of the government’s Strategy for Financial Literacy in Uganda, launched in 2013.
READINESS TO ADOPT DIGITAL FINANCIAL SERVICES
16
UGANDA
2016 89% 78% 54% 48% 18% 97%
2015 83% 85% 58% 47% NA 80%
2014 73% 79% 60% 49% NA 79%
96%
Basic numeracy
81%
Necessary ID
24%
Financial literacy
59%
Own a SIM card
81%
Mobile phone access
(own/borrow)
55%
Ability to send and receive text
messages
2017: Key indicators of readiness to adopt digital financial services (Shown: Percentage of Uganda adults, N=3,001)
Source: InterMedia Uganda FII Tracker surveys, Wave 2 (N=3,001, 15+), September 2014; Wave 3 (N=3,000, 15+), September 2015; Wave 4 (N=3,000, 15+), August 2016; Wave 5 (N=3,001, 15+), July-August 2017.
8 percentage-point drop in the proportion of adults who have the necessary ID for opening an account due to new rulesfor obtaining IDs.

• In 2017, 43% of adults had a mobile money account, and were, therefore, digitally included. An additional 2% of the population was digitally included only via a bank or NBFI account. NBFI accounts are the least likely to have digital features.
• The difficulty of obtaining national identification cards, and strict requirements that all SIM cards are registered using the IDs, have constrained the growth of mobile phone ownership and registered users of mobile money.
DIGITAL FINANCIAL INCLUSION
17
UGANDA
45%
of the population is financially included via a digitally enabled
account
2017: Digital financial inclusion, by service type(Shown: Percentage of Uganda adults, N=3,001)
4
10
43
NBFI
Bank
Mobile money
20 30 9 54
Basic phone
Feature phone
Smartphone Any mobile phone
2017: Mobile phone ownership (Shown: Percentage of Uganda adults, N=3,001)
Source: InterMedia Uganda FII Tracker survey, Wave 5 (N=3,001, 15+), July-August 2017.

• Mobile phone ownership in Uganda remains dominated by relatively privileged groups. Just over half of the adult population owned a phone (54%), and feature phones were the largest category. Phone ownership is more common among adults above the poverty line, men and urban residents than below-poverty, female, and rural adults.
• Among adults who do not own a phone, 81% said they lacked enough money to buy or replace one, and 28% said they don’t know how to use a mobile phone.
MOBILE PHONE OWNERS − DEMOGRAPHICS & ATTITUDES
18
UGANDA
Source: InterMedia Uganda FII Tracker survey, Wave 5 (N=3,001, 15+), July-August 2017.
15
24
28
40
81
No mobile phone networkwhere I live
Don't need to have my ownphone
Don't know how to use amobile phone
Had a phone but it'slost/broken/stopped working
Don't have enough money tobuy a mobile phone
2017: Top reasons for not owning a mobile phone(Shown: Percentage of Uganda adults who do not own a mobile phone reporting
somewhat/strongly agree, n=1,355)
54
Total population(N=3,001)
48 61
Female(n=1,875)
Male(n=1,126)
37 78
Below poverty
(n=1,636)
Above poverty
(n=1,365)
49 70
Rural(n=2,165)
Urban(n=836)
2017: Mobile phone ownership, by demographic(Shown: Percentage of each demographic group who are phone owners)
13 percentage-point gender gap in phone ownership

MOBILE PHONE USE
19
UGANDA
• A large majority of adults (79%) have used a mobile phone to make a call, still less than the 81% of adults who reported having access to a phone. Use of the internet and other data services was much rarer than basic use cases.
• Capability to use phones lags total users, relatively few adults reported “complete ability” to perform mobile phone functions. Limited phone capabilities means that many users depend on others, such as mobile money agents, for assistance using mobile technology.
43% of adults have mobile money accounts but only 21% have complete ability to make a financial transaction.
Source: InterMedia Uganda FII Tracker survey, Wave 5 (N=3,001, 15+), July-August 2017.
2017: Mobile phone functions ever used(Shown: Percentage of Uganda adults, N=3,001)
8
8
11
13
14
14
41
48
79
Used other mobile application
Sent/received photo messages (MMS)
Downloaded music, video or games
Used social networking sites
Used the internet
Took a color picture
Made a financial transaction
Sent or received text messages
Called someone
2017: Phone user capability(Shown: Percentage of Uganda adults, N=3,001)
57
3830
2113
16
19
14
12
6
10
15
11
10
6
1524
40
47
58
1 3 59
16
Make/receive calls Navigate phone menu Send/receive textmessages
Make a financialtransaction
Use internet
Complete ability Some ability Little ability No ability Don't know
CUSTOMER JOURNEY
20
NONUSERSUNREGISTERED
USERSREGISTERED
INACTIVE USERSACTIVE BASIC
USERS ADVANCED
USERS
UGANDA

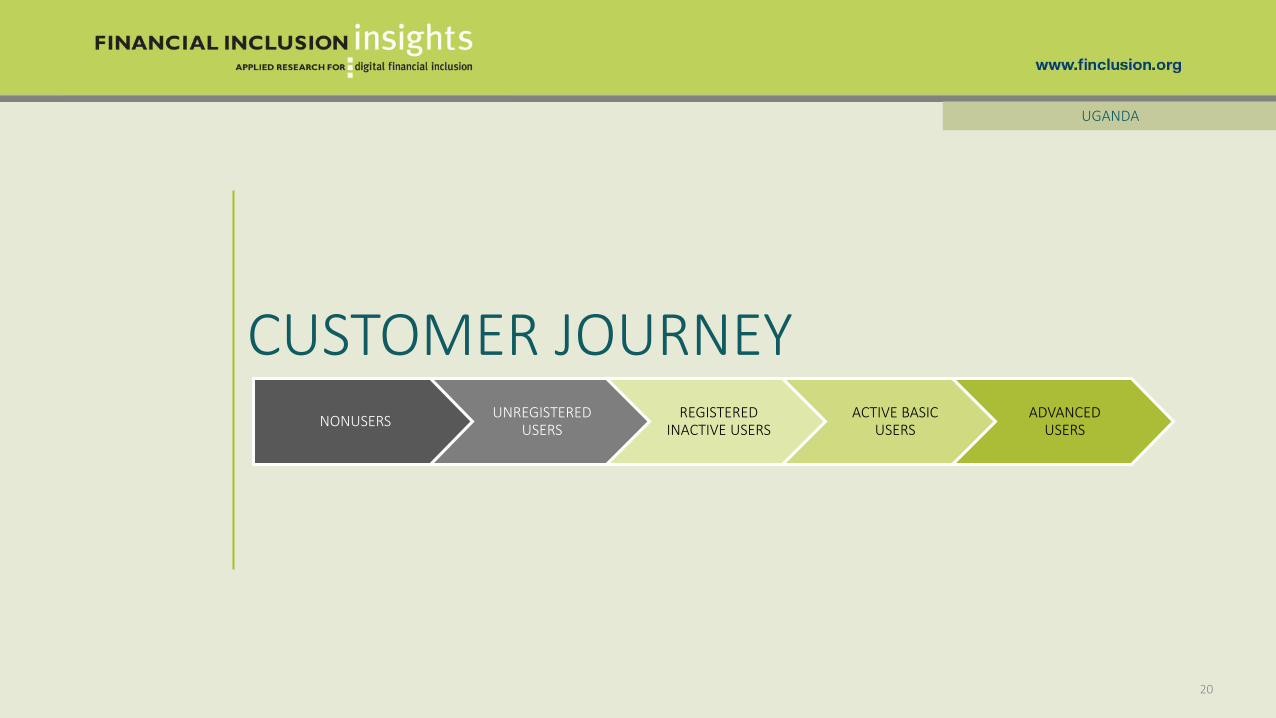
• Financial inclusion may be conceived as a process through which an individual’s needs are met by advancing step-by-step towards increasingly active engagement with a growing range of financial services. The customer journey theory of change posits that advancement on the journey leads to gains in human welfare.
• Understanding how individuals and groups advance on the customer journey is useful for developing strategies and interventions to assist more individuals to become users of the financial services that best meet their needs.
• Five major segments of the population on the customer journey are described below. Each group is mutually exclusive of the others. The population shifts between these groups as more individuals make progress on the customer journey.
CUSTOMER JOURNEY THEORY OF CHANGE
21
UGANDA
Nonusers are adults who have no access to or have never used a full-service financial institution. Nonusers have not started the customer journey.
Unregistered users are adults who do not have an account registered in their name but use a bank, mobile money, and/or NBFI service via another person’s account, especially over-the-counter mobile money services accessed via an agent.
Registered inactive users are adults who have a bank, mobile money, or NBFI account registered in their name but have not used it in the last 90 days.
Active basic users are adults who used their registered bank, NBFI, or mobile money account to transfer money to another person, deposit or withdraw cash, and/or check their balance in the previous 90 days ONLY. Buying airtime using mobile money is also a basic use case.
Advanced users are adults who have used their registered bank, NBFI, or mobile money account in the previous 90 days and have ever used their account for saving, borrowing, investment, insurance, bill payment, merchant payment, receiving wages, and/or receiving government payments.
NONUSERS UNREGISTERED USERS REGISTERED INACTIVE USERS ACTIVE BASIC USERS ADVANCED USERS
Financially excluded (no registered account) Financially included (registered account holders)

53 94
12 2250 124
10 2445 174
10 2337 18 7 10 28
Since 2014, the proportion of the adult population who are nonusers of any formal financial institution decreased as members of this group embarked on the customer journey to financial inclusion. The proportion of unregistered users (nearly all over-the-counter users of mobile money) is trending upward, though growth leveled off between 2016 and 2017. Registered inactive users (did not use their account in the last 90 days) grew significantly from 2016 to 2017, driven by registration of both NBFI and mobile money accounts. The share of active basic users (transfers and cash-in, cash-out only) has been statistically unchanged since 2014, as more of the population converted to advanced use by adopting use cases such as saving (or secure storage of cash as mobile money), and bill pay. Advanced users increased sharply from 23% in 2016, to 25% in 2017, after registering no significant change from 2014 to 2016.
CUSTOMER JOURNEY TREND
22
UGANDA
Change over time in each segment of the customer journey for all financial institutions(Shown: Percentage of Uganda adults, by year)
Source: InterMedia Uganda FII Tracker surveys, Wave 2 (N=3,001, 15+), September 2014; Wave 3 (N=3,000, 15+), September 2015; Wave 4 (N=3,000, 15+), August 2016; Wave 5 (N=3,001, 15+), July-August 2017.
n 2014 (N=3,001) n 2015 (N=3,000) n 2016 (N =3,000) n 2017 (N=3,001) 95% confidence interval
NONUSERS UNREGISTERED USERS REGISTERED INACTIVE USERS ACTIVE BASIC USERS ADVANCED USERS

NONUSERS UNREGISTERED USERS REGISTERED INACTIVE USERS ACTIVE BASIC USERS ADVANCED USERS
More nonusers are women than men. Yet, while both the male and female portions of the nonuser group have decreased since 2013, the decline has been faster among women. More women than men are found in the unregistered user group, but there is effectively no gender disparity in the registered inactive user group. Men were more common among active basic users in 2014, but by 2017 no gender gap was observed in this group. The advanced user group has, however, shown a persistent gender gap since 2014.
CUSTOMER JOURNEY TREND, BY GENDER
23
UGANDA
Change over time in each segment of the customer journey, by gender(Shown: Percentage of Uganda adults, by year and by gender)
Source: InterMedia Uganda FII Tracker surveys, Wave 2 (N=3,001, 15+), September 2014; Wave 3 (N=3,000, 15+), September 2015; Wave 4 (N=3,000, 15+), August 2016; Wave 5 (N=3,001, 15+), July-August 2017.
g Male 2014 (n=1,405), 2015 (n=1,045), 2016 (n=1,058), 2017 (n=1,126)
g Female 2014 (n=1,596), 2015 (n=1,955), 2016 (n=1,942), 2017 (n=1,875)
30 30 2722
22 2018
15
2014 2015 2016 2017
5 7 10 1045
7 8
2014 2015 2016 20172 2 2 32 2 2 4
2014 2015 2016 2017
7 6 5 5
5 4 4 5
2014 2015 2016 2017
9 10 9 11
13 15 1516
2014 2015 2016 2017
Women were more likely than men to be nonusers, and less likely to be advanced users.

NONUSERS UNREGISTERED USERS REGISTERED INACTIVE USERS ACTIVE BASIC USERS ADVANCED USERS
In 2017, 30% of adults were nonusers living below the $2.50/day poverty line. The other 27% of the population that lives below-poverty is distributed across the other customer journey segments; they outnumber above-poverty adults in the unregistered and registered inactive user groups. The share of below-poverty adults in the active basic group has decreased since 2014, reaching parity with the above-poverty share by 2017, as more below-poverty adults joined the advanced user group. A persistent income gap between advanced users has widened as more above-poverty adults joined this group, and more advanced users rose out of poverty between annual surveys.
CUSTOMER JOURNEY TREND, BY POVERTY STATUS
24
UGANDA
Change over time in each segment of the customer journey, by above/below $2.50 (2005 PPP USD) poverty line(Shown: Percentage of Uganda adults, by year and by poverty status)
Source: InterMedia Uganda FII Tracker surveys, Wave 2 (N=3,001, 15+), September 2014; Wave 3 (N=3,000, 15+), September 2015; Wave 4 (N=3,000, 15+), August 2016; Wave 5 (N=3,001, 15+), July-August 2017.
44 4335
30
96
10
7
2014 2015 2016 2017
6 9 9 103
38 8
2014 2015 2016 20172
32
42* 1* 2
3
2014 2015 2016 2017
7 7 4 5
5 3 6 5
2014 2015 2016 2017
9 116 8
13 1318
19
2014 2015 2016 2017
g Above poverty 2014 (n=830), 2015 (n=964), 2016 (n=1,320), 2017 (n=1,365)
g Below poverty 2014 (n=2,171), 2015 (n=2,036), 2016 (n=1,680), 2017 (n=1,636)
*Fewer than 50 observations

NONUSERS UNREGISTERED USERS REGISTERED INACTIVE USERS ACTIVE BASIC USERS ADVANCED USERS
The large majority (73%) of Uganda’s adult population lives in rural areas, and rural adults outnumber their urban counterparts in every stage of the customer journey. Rural adults are particularly prevalent among nonusers, but the proportion of all adults who are rural nonusers has decreased by 14 percentage points since 2014, while there has been little change in the proportion of adults who are urban nonusers. Growth in unregistered users since 2014 was driven mainly by rural residents. Advanced users mainly live in rural areas and increasingly use mobile money for saving or safekeeping.
CUSTOMER JOURNEY TREND, BY LOCALE
25
UGANDA
Change over time in each segment of the customer journey, by urban/rural locale(Shown: Percentage of Uganda adults, by year and by locale)
Source: InterMedia Uganda FII Tracker surveys, Wave 2 (N=3,001, 15+), September 2014; Wave 3 (N=3,000, 15+), September 2015; Wave 4 (N=3,000, 15+), August 2016; Wave 5 (N=3,001, 15+), July-August 2017.
46 43 4032
77
6
5
2014 2015 2016 2017
7 9 13 132 3
4 5
2014 2015 2016 2017
3 3 3 51* 0.8* 1*
2
2014 2015 2016 2017
7 7 7 7
4 3 3 3
2014 2015 2016 2017
12 13 13 16
10 11 1011
2014 2015 2016 2017
g Urban 2014 (n=780), 2015 (n=800), 2016 (n=810), 2017 (n=836)
g Rural 2014 (n=2,221), 2015 (n=2,200), 2016 (n=2,190), 2017 (n=2,165)
*Fewer than 50 observations

NONUSERS(n=1,149)
UNREGISTERED USERS (n=505)
REGISTERED INACTIVE USERS(n=179)
ACTIVE BASIC USERS(n=294)
ADVANCED USERS(n=874)
• Men form the majority of advanced users and registered inactive users, while women outnumber men in the nonuser and unregistered user groups. The active basic user group has nearly equal proportions of men and women.
• Higher income is correlated with advancement on the customer journey. The majority of nonusers, unregistered and registered inactive users live below the poverty line, while most active basic and advanced users live above the poverty line.
• Along the customer journey, the share of urban residents increases, and the share of rural residents decreases in the later segments.
DEMOGRAPHICS OF EACH CUSTOMER SEGMENT
26
UGANDA
2017: Demographic groups, by customer journey segment(Shown: Percentage of Uganda adults in each segment)
Source: InterMedia Uganda FII Tracker survey, Wave 5 (N=3,001, 15+), July-August 2017.
Male 41% 42% 61% 48% 59%
Female 59% 58% 39% 52% 41%
Above poverty 19% 46% 42% 55% 70%
Below poverty 81% 54% 58% 45% 30%
Rural 86% 74% 74% 66% 59%
Urban 14% 26% 26% 34% 41%
DEMOGRAPHICS

3543
22* 24 25
19
25
27 2530
12
13
26* 2120
13
9 16*13*
1521
9 9*17*
10
15-24 years old 25-34 years old 35-44 years old 45-54 years old 55 years and older
NONUSERS(n=1,149)
UNREGISTERED USERS (n=505)
REGISTERED INACTIVE USERS(n=179)
ACTIVE BASIC USERS(n=294)
ADVANCED USERS(n=874)
• The youngest age group (15-24 years old) is the least likely to have a financial account, and therefore makes up a larger share of nonusers and unregistered users relative to the other segments. The oldest (55 and older) age group also makes up a large share of nonusers, relative to the other segments.
• The (later three) financially included segments all show similar age distributions. This finding suggests that age does not impede advancement on the customer journey after registration.
AGE GROUP SEGMENTATION
27
UGANDA
2017: Age groups, by customer journey segment(Shown: Percentage of Uganda adults in each group in each segment)
Source: InterMedia Uganda FII Tracker survey, Wave 5 (N=3,001, 15+), July-August 2017.
*Fewer than 50 observations

2510 9* 7* 4*
63
54 59 57
39
12
34 30* 32
44
1* 2* 3*13
No formal education Primary education Secondary education Higher education
NONUSERS(n=1,149)
UNREGISTERED USERS (n=505)
REGISTERED INACTIVE USERS(n=179)
ACTIVE BASIC USERS(n=294)
ADVANCED USERS(n=874)
• Secondary and higher education is a key driver of progress to the advanced user stage of the customer journey, though 43% of advanced users have only primary education or less.
• Nonusers are the most likely to have no formal education, and only 12 percent have secondary education.
• The three user groups in the middle of the customer journey have approximately equal education characteristics, which suggests that education does not have a great effect on progress through the intermediate stages of financial engagement.
EDUCATION SEGMENTATION
28
UGANDA
2017: Education levels, by customer journey segment(Shown: Percentage of Uganda adults in each group in each segment)
Source: InterMedia Uganda FII Tracker survey, Wave 5 (N=3,001, 15+), July-August 2017.
*Fewer than 50 observations

16 24 18 30 3528 60 60 64 8218 38 77 91 9574 68 94 90 92
Financial literacy Texting ability Phone ownership Necessary ID
In general, indicators of financial inclusion readiness increase as one progresses along the customer journey. Nonusers are the least likely to possess the necessary skills and resources to adopt formal financial services, though a larger proportion of nonusers have the ID necessary to register an account than do unregistered users. Unregistered users are, however, much more likely than nonusers to have the mobile phone skills necessary to use mobile money, which is represented by the ability to send a text message. Registered inactive users are less financially literate than unregistered users, but are much more likely to have an ID and a mobile phone. Active basic users show the highest rate of phone ownership after advanced users, who have the highest levels of readiness overall.
DIGITAL READINESS SEGMENTATION
29
UGANDA
2017: Readiness to adopt digital financial services, by customer journey segment(Shown: Percentage of Uganda adults in each segment)
Source: InterMedia Uganda FII Tracker survey, Wave 5 (N=3,001, 15+), July-August 2017.
NONUSERS(n=1,149)
UNREGISTERED USERS (n=505)
REGISTERED INACTIVE USERS(n=179)
ACTIVE BASIC USERS(n=294)
ADVANCED USERS(n=874)

10 12 20* 14* 2314 15 18* 18* 2917 21 26* 23 37
Have emergency funds to cover unplanned expenses Enough money to pay for living expenses Pay bills on time and in full
• Overall financial health in Uganda is low; most adults live below the $2.50/day poverty line and struggle to meet basic needs. Adults who occupy later stages of the customer journey tend to have higher levels of financial health; advanced user scores on financial health indicators are more than double those of nonusers.
• While advanced users have better financial health compared with those in other segments, nonetheless, only 23% of advanced usersreported having an emergency fund, 29% had enough money to pay for living expenses, and 37% were able to pay bills on time and in full.
FINANCIAL HEALTH SEGMENTATION
30
UGANDA
2017: Financial health, by customer journey segment(Shown: Percentage of Uganda adults in each segment reporting somewhat/strongly agree)
Source: InterMedia Uganda FII Tracker survey, Wave 5 (N=3,001, 15+), July-August 2017.
Only 46% of all adults said they “often” or “almost always” make a plan for how to spend their income.
NONUSERS(n=1,149)
UNREGISTERED USERS (n=505)
REGISTERED INACTIVE USERS(n=179)
ACTIVE BASIC USERS(n=294)
ADVANCED USERS(n=874)
*Fewer than 50 observations

29 30 50 30 4640 46 51 45 6346 62 65 55 70
Friends & family rely on me to help with their finances Confident my income will grow in the future Have the skills & knowledge to manage my finances well
• Progress on the customer journey is associated with a greater financial capacity. Nonusers have the least confidence in their skills, are the least likely to say that their income will grow in the future, and are the least likely to report that friends and family rely on them for financial assistance, while advanced users show the highest frequency of these traits.
• Active basic users show similar levels of financial capacity and financial health (see previous slide) compared to unregistered users. This finding suggests that, rather than financial capacity, lower readiness to adopt DFS and greater dependence on mobile money agents to perform basic transfers prevents unregistered users from progressing on the customer journey.
FINANCIAL CAPACITY SEGMENTATION
31
UGANDA
2017: Financial capacity, by customer journey segment(Shown: Percentage of Uganda adults in each segment reporting somewhat/strongly agree)
Source: InterMedia Uganda FII Tracker survey, Wave 5 (N=3,001, 15+), July-August 2017.
NONUSERS(n=1,149)
UNREGISTERED USERS (n=505)
REGISTERED INACTIVE USERS(n=179)
ACTIVE BASIC USERS(n=294)
ADVANCED USERS(n=874)
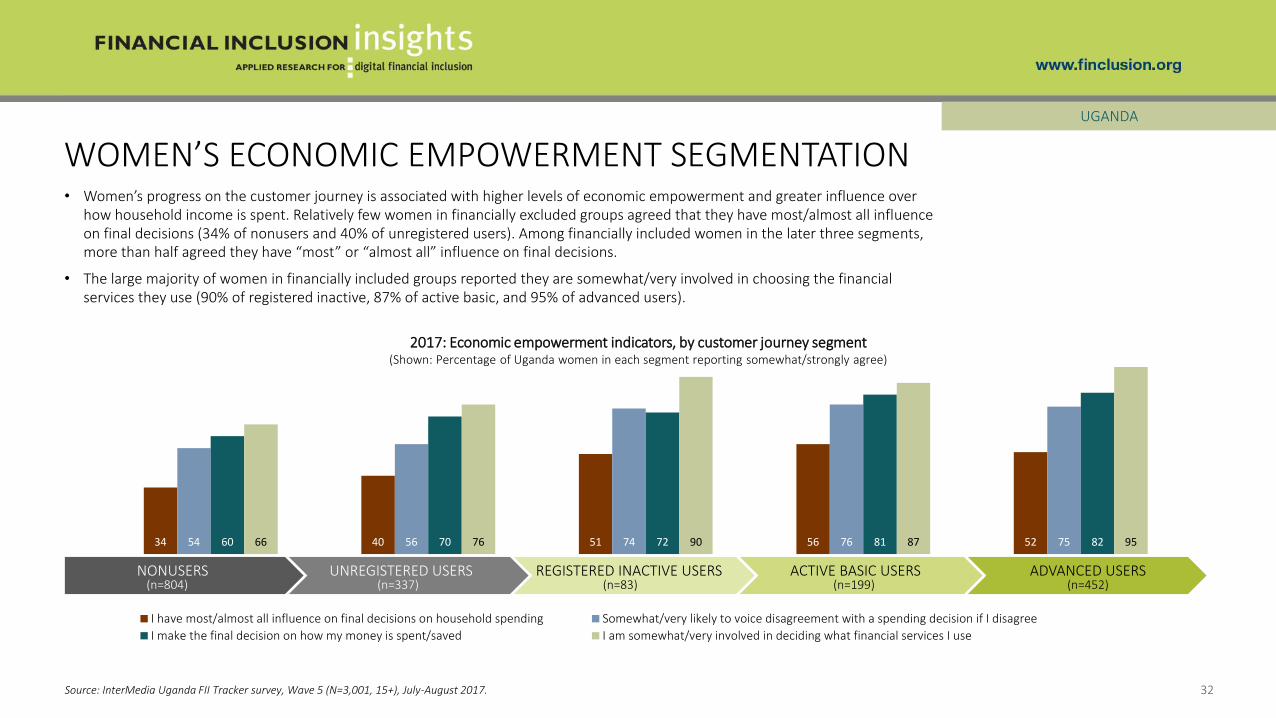
34 40 51 56 5254 56 74 76 7560 70 72 81 8266 76 90 87 95
I have most/almost all influence on final decisions on household spending Somewhat/very likely to voice disagreement with a spending decision if I disagree
I make the final decision on how my money is spent/saved I am somewhat/very involved in deciding what financial services I use
• Women’s progress on the customer journey is associated with higher levels of economic empowerment and greater influence over how household income is spent. Relatively few women in financially excluded groups agreed that they have most/almost all influence on final decisions (34% of nonusers and 40% of unregistered users). Among financially included women in the later three segments, more than half agreed they have “most” or “almost all” influence on final decisions.
• The large majority of women in financially included groups reported they are somewhat/very involved in choosing the financialservices they use (90% of registered inactive, 87% of active basic, and 95% of advanced users).
WOMEN’S ECONOMIC EMPOWERMENT SEGMENTATION
32
UGANDA
2017: Economic empowerment indicators, by customer journey segment(Shown: Percentage of Uganda women in each segment reporting somewhat/strongly agree)
Source: InterMedia Uganda FII Tracker survey, Wave 5 (N=3,001, 15+), July-August 2017.
NONUSERS(n=804)
UNREGISTERED USERS (n=337)
REGISTERED INACTIVE USERS(n=83)
ACTIVE BASIC USERS(n=199)
ADVANCED USERS(n=452)

3* 7* 8* 6* 1914 20 22* 34 3447 38 50 36 28
Salaried Self-employed Irregular/seasonal
INCOME SEGMENTATION
33
UGANDA
2017: Employment income, by customer journey segment(Shown: Percentage of Uganda adults in each segment)
• Irregular or seasonal employment in agriculture is the most common source of income for adults in Uganda, and is the largest income category for all user groups other than advanced users. Advanced users are more likely to be salaried workers than adults in other segments. In the other user groups, less than one in 10 adults are salaried.
• Self-employment is a major source of income for all user groups, but most prevalent among active basic and advanced users. This finding suggests that business use cases for mobile money may be important drivers of active use in Uganda.
Source: InterMedia Uganda FII Tracker survey, Wave 5 (N=3,001, 15+), July-August 2017.
NONUSERS(n=1,149)
UNREGISTERED USERS (n=505)
REGISTERED INACTIVE USERS(n=179)
ACTIVE BASIC USERS(n=294)
ADVANCED USERS(n=874)
71% of all adults earn an income from employment.
*Fewer than 50 observations

51 69 79 60 9421 40 3* 8341 52 62 48 5622 32 37 30 33
Savers Save with formal institution (bank, mobile money, SACCO or MFI/MDI)
Save with cash or property (buying agricultural inputs, livestock, or other assets) Save with informal institution (ASCA/VSLA, ROSCA/merry-go-round, other people)
SAVING SEGMENTATION
34
UGANDA
2017: Saving behavior, by customer journey segment(Shown: Percentage of Uganda adults in each segment)
• Saving, or safekeeping behavior that involves leaving money in the form of digital stored value for a period of time before cashing out, is the use case that separates most advanced users from active basic users of mobile money accounts. Unregistered users engage in this behavior using an agent rather than their own account. Savings products accessed through mobile money accounts are new on the Ugandan market and have seen little uptake so far.
• Individuals at all stages of the customer journey save using informal institutions and at home in cash or property. These methods are the only ones available to nonusers.
Source: InterMedia Uganda FII Tracker survey, Wave 5 (N=3,001, 15+), July-August 2017.
NONUSERS(n=1,149)
UNREGISTERED USERS (n=505)
REGISTERED INACTIVE USERS(n=179)
ACTIVE BASIC USERS(n=294)
ADVANCED USERS(n=874)
In 2017, 69% of all adults reported saving money. The use of mobile money for saving is a key driver of advancement on the customer journey.
*Fewer than 50 observations

42 60 69 57 6628 42 49 37 4226 35 36 29 3312 19 19* 20 32
Borrowed in the last 12 months Borrowed in the past 12 months to pay for emergency expenses
Borrowed in the past 12 months to pay for daily expenses Borrowed in the past 12 months to invest in a business
BORROWING SEGMENTATION
35
UGANDA
2017: Borrowing in the last 12 months, by customer journey segment(Shown: Percentage of Uganda adults in each segment)
• Except for nonusers, the majority of adults in each user group borrowed money in the 12 months prior to the survey. Adults in all groups frequently borrow to pay for daily expenses as well as emergency expenses. Advanced users were most likely to borrow for business investment, though this behavior cuts across all segments of the customer journey.
• These findings illustrate that there is a large potential market for digital credit services, the first of which was launched in August 2016 by MTN Uganda in partnership with the Commercial Bank of Africa (CBA). Uptake has been slow, however, with only 3% of advanced users reporting they had a loan via a mobile money account in 2017.
Source: InterMedia Uganda FII Tracker survey, Wave 5 (N=3,001, 15+), July-August 2017.
NONUSERS(n=1,149)
UNREGISTERED USERS (n=505)
REGISTERED INACTIVE USERS(n=179)
ACTIVE BASIC USERS(n=294)
ADVANCED USERS(n=874)
55% of all adults borrowed money in the 12 months prior to the survey.
*Fewer than 50 observations

75* 9* 10*
6*1618 24 34 44 46
Have insurance Invest in other assets Invest in own business
INSURANCE AND INVESTMENT SEGMENTATION
36
UGANDA
2017: Insurance and investment behavior, by customer journey segment(Shown: Percentage of Uganda adults in each segment)
• Individual investment behavior in Uganda is overwhelmingly directed towards the business interests of the self-employed. Active basic and advanced mobile money users are the most likely to invest in their own business, suggesting that business use cases are important drivers of advancement on the customer journey.
• As the group with the highest proportion of adults living above the poverty line and receiving income from a salary, the advanced users are the most likely to invest in other assets outside of their own business, and to have insurance. Very few individuals in the earlier stages of the customer journey invest in other assets or have insurance.
Source: InterMedia Uganda FII Tracker survey, Wave 5 (N=3,001, 15+), July-August 2017.
NONUSERS(n=1,149)
UNREGISTERED USERS (n=505)
REGISTERED INACTIVE USERS(n=179)
ACTIVE BASIC USERS(n=294)
ADVANCED USERS(n=874)
*Fewer than 50 observations
Very few adults have any type of insurance. All of them were advanced users in 2017.

24 31 44 36 3722 31 39 36 3713 22 34 24 282*5* 3* 5* 8
Belong to informal group(s) Save through informal group(s) Borrow through informal group(s) Invest through informal group(s)
INFORMAL FINANCIAL ACTIVITIES SEGMENTATION
37
UGANDA
2017: Membership and uses of informal financial groups, by customer journey segment(Shown: Percentage of Uganda adults in each segment)
• Adults at all stages of the customer journey use informal groups for borrowing more frequently than they use formal institutions. Belonging to informal financial groups is correlated with inclusion via formal financial institutions; the financially excluded, nonuser and unregistered user customer journey segments are less likely to belong to an informal group than the later three segments. Saving and borrowing through informal groups complements the services provided by formal institutions for over a third of active basic and advanced users.
• Those who save, borrow and/or belong to an informal group are more likely to be registered inactive users than they are to be in any other user segment, which suggests that the services provided by informal groups may reduce the need to actively use an account with a formal institution.
Source: InterMedia Uganda FII Tracker survey, Wave 5 (N=3,001, 15+), July-August 2017.
NONUSERS(n=1,149)
UNREGISTERED USERS (n=505)
REGISTERED INACTIVE USERS(n=179)
ACTIVE BASIC USERS(n=294)
ADVANCED USERS(n=874)
*Fewer than 50 observations

NONUSERS UNREGISTERED USERS
REGISTERED INACTIVE USERS
ACTIVE BASIC USERS
ADVANCED USERS
NONUSERS
38
UGANDA

NONUSERS, BY DEMOGRAPHIC GROUP
39
UGANDA – NONUSERS
Source: InterMedia Uganda FII Tracker survey, Wave 5 (N=3,001, 15+), July-August 2017.
Nearly two in five adults are nonusers of any formal financial services (37%).
• Nonusers are most often rural women who live below the $2.50/day poverty line. Nonusers make up 43% of women, 44% of rural residents, and 53% of those who live below the poverty line.
• Only 20% of the urban population and 16% of the above-poverty population are nonusers.
37
Total population(N=3,001)
43 32
Females(n=1,875)
Males(n=1,126)
53 16
Below poverty(n=1,636)
Above poverty(n=1,365)
44 20
Rural(n=2,165)
Urban(n=836)
2017: Nonusers, by demographic group(Shown: Percentage of each demographic group who are nonusers)
36 39
Youngerthan 35
(n=1,604)
35 yearsand older(n=1,397)

BARRIERS TO ACCESS AND REGISTRATION
40
UGANDA – NONUSERS
• External factors hinder registration of bank accounts and the use of mobile money. Eighty-five percent of bank nonusers and 61% of mobile money nonusers cite lack of money as the reason; 52% of bank nonusers and 35% of mobile money nonusers mentioned lack of official documentation.
• Nonusers of bank accounts perceive account ownership as costly: 69% cited the associated fees and expenses as a constraint to registration.
• Some mobile money nonusers do not see the utility in this service; 39% prefer to use cash. There is also a lack of knowledge about mobile money among 31% of nonusers.
36
49
52
69
85
Do not need one or have never thought of using one
No banks nearby
Lack of official identification or other required documents
Fees and expenses for owning an account are too high
Lack of money to use the account
2017: Top reasons for not registering a bank account(Shown: Percentage of bank nonusers reporting somewhat/strongly agree, n=2,643)
31
35
39
61
Don't know what mobile money is used for
Don't have the required ID or other documents
Prefer to use cash
Don't have enough money to make transactions
2017: Top reasons for not using mobile money(Shown: Percentage of mobile money nonusers reporting somewhat/strongly agree, n=1,197)
Source: InterMedia Uganda FII Tracker survey, Wave 5 (N=3,001, 15+), July-August 2017.

NONUSER SAVING BEHAVIOR
41
UGANDA – NONUSERS
• Just over half of nonusers (51%) report that they have ever saved. Cash is the most common saving mechanism; 37% save using cash. Saving with other assets, such as agricultural inputs or livestock was less common than saving with cash.
• Nonusers of formal financial institutions use various informal associations for saving that are not regulated by the central bank. Rotating savings and credit associations (ROSCAs) and merry-go-rounds were used by 12% of nonusers, and accumulating savings and credit associations (ASCAs) and village savings and loan associations (VSLAs) were used by 8%.
51 37 12 11 84
2*
Savers At home, in cash ROSCA/merry-go-round Agricultural inputs orlivestock
ASCA/VSLA Other people/collectors In-kind assets, such asgold
Source: InterMedia Uganda FII Tracker survey, Wave 5 (N=3,001, 15+), July-August 2017.
2017: Nonuser methods of saving(Shown: Percentage of nonusers, n=1,149)
*Fewer than 50 observations

50
70
34
52
NONUSER ECONOMIC EMPOWERMENT, BY GENDER
42
UGANDA – NONUSERS
• Both male and female nonusers score lower than advanced users on key indicators of economic empowerment. Female nonusers are less likely than male nonusers to voice disagreement with a spending decision and be involved in deciding what financial services to use. The gender gaps between these two indicators are not present among advanced users.
• When it comes to influencing final household spending decisions, women in both segments are at a disadvantage compared with men. There is an 18 percentage-point gender gap among advanced users and a 16 percentage-point gap among nonusers.
Making decisions about personal money is the one area where there is a gender gap between advanced users, but no gap between nonusers.
Source: InterMedia Uganda FII Tracker survey, Wave 5 (N=3,001, 15+), July-August 2017.
n Male (Nonuser n=345, Advanced user n=422) n Female (Nonuser n=804, Advanced user n=452)
2017: Influence, voice, and autonomy on personal and household financial decisions(Shown: Percentage of Uganda adults in each group, by gender)
NonuserAdvanced
user
I have most/almost all influence on final decisions on household spending
59
75
54
75
Somewhat/very likely to voice disagreement with spending decision
70
96
66
95
Somewhat/very involved in deciding what financial services to use
60
86
60
82
I make the final decision on how my money is spent or saved (somewhat/strongly agree)
NonuserAdvanced
user NonuserAdvanced
user NonuserAdvanced
user

UNREGISTERED USERS
UGANDA
43
NONUSERSUNREGISTERED
USERSREGISTERED
INACTIVE USERSACTIVE BASIC
USERS ADVANCED USERS

UNREGISTERED USERS, BY DEMOGRAPHIC GROUP
44
UGANDA – UNREGISTERED USERS
Source: InterMedia Uganda FII Tracker survey, Wave 5 (N=3,001, 15+), July-August 2017.
Almost 1 in 5 adults (19%) were OTC mobile money users in 2017.
2017: Unregistered users, by demographic and service type(Shown: Percentage of each demographic group who are unregistered users of each type of institution)
1* 19 3
Total population(N=3,001)
0.9* 2*21 172* 3*
Females(n=1,875)
Males(n=1,126)
0.8* 3*19 2132*
Rural(n=2,165)
Urban(n=836)
0.5* 3*18 212* 4
Belowpoverty line(n=1,636)
Abovepoverty line(n=1,365)
g Bank g Mobile money g NBFI
• Unregistered users of financial services are predominantly over-the-counter (OTC) users of mobile money. There was minimal use of banks and NBFIs via an account registered to someone else, particularly among bank users.
• A greater proportion of women than men are OTC mobile money users, reflecting lower levels of digital readiness among women for using an account unassisted.
• OTC mobile money users are slightly more common in the urban and above-poverty demographics than the rural and below poverty groups. The lack of substantial income and locality gaps reflects the ease of access to mobile money agents.
*Fewer than 50 observations
2* 0.8*23 152* 4*
Younger than 35(n=1,604)
35 years and older(n=1,397)

Unregistered (OTC) mobile money users(Shown: Percentage of Uganda adults, by year)
14 10 13 17 19
OTC mobile money users
2013 (N=3,000) 2014 (N=3,001) 2015 (N=3,000) 2016 (N=3,000) 2017 (N=3,001)
OVER-THE-COUNTER (OTC) MOBILE MONEY USERS
45
UGANDA – UNREGISTERED USERS
• The uptrend in unregistered (OTC) mobile money users continued in 2017 and unregistered users have nearly doubled as a proportion of the population since 2014. The change from 2016 to 2017 was within the survey margin of error, and growth in registered mobile money users exceeded that of unregistered users over the same period.
• OTC users are overwhelmingly rural residents and younger than 35 years old. The majority are female and slightly more than half have incomes below the poverty line.
2017: Unregistered (OTC) mobile money users, by demographic(Shown: Percentage of unregistered mobile money users, n=534)
Rural 72%
Women 57%
Below $2.50/day poverty line 53% 47% Above $2.50/day poverty line
43% Men
28% Urban
34% 35 and older Younger than 35 66% 95% confidence interval
Source: InterMedia Uganda FII Tracker surveys, Wave 1 (N=3,000, 15+), September-October 2013; Wave 2 (N=3,001, 15+), September 2014; Wave 3 (N=3,000, 15+), September 2015; Wave 4 (N=3,000, 15+), August 2016; Wave 5 (N=3,001, 15+), July-August 2017.

• More than nine in 10 unregistered (OTC) mobile money users (91%) reported that the need to transfer money motivated them to start using mobile money. A majority of this group also reported that saving and storing money securely were reasons to start using mobile money. Bill pay and investment were also significant reasons, suggesting that unregistered users are likely to advance on the customer journey if they can overcome barriers to registration.
• The large majority of unregistered users rated mobile money highly for accessibility, ease of use, cost effectiveness, security and trust, and preferred mobile money over alternative ways of meeting their needs.
BASIC TRANSFERS ARE THE GATEWAY TO ADVANCED USE
46
UGANDA – UNREGISTERED USERS
20
22
24
52
56
91
Make an investment
Make a financial transaction
Pay a bill
Secure place to store money
Save money
Send/receive money
73
75
80
90
90
95
More secure
Greater trust in mobile money
Meets needs better than other options
Cheaper to use
Easier to use mobile money
More accessible
2017: Top reasons to start using mobile money (Shown: Percentage of unregistered mobile money users reporting
somewhat/strongly agree, n=534)
2017: Top reasons to use mobile money over other financial services(Shown: Percentage of unregistered mobile money users reporting
somewhat/strongly agree, n=534)
Source: InterMedia Uganda FII Tracker survey, Wave 5 (N=3,001, 15+), July-August 2017.
ATTITUDES AND EXPERIENCES WITH MOBILE MONEY
47
UGANDA – UNREGISTERED USERS
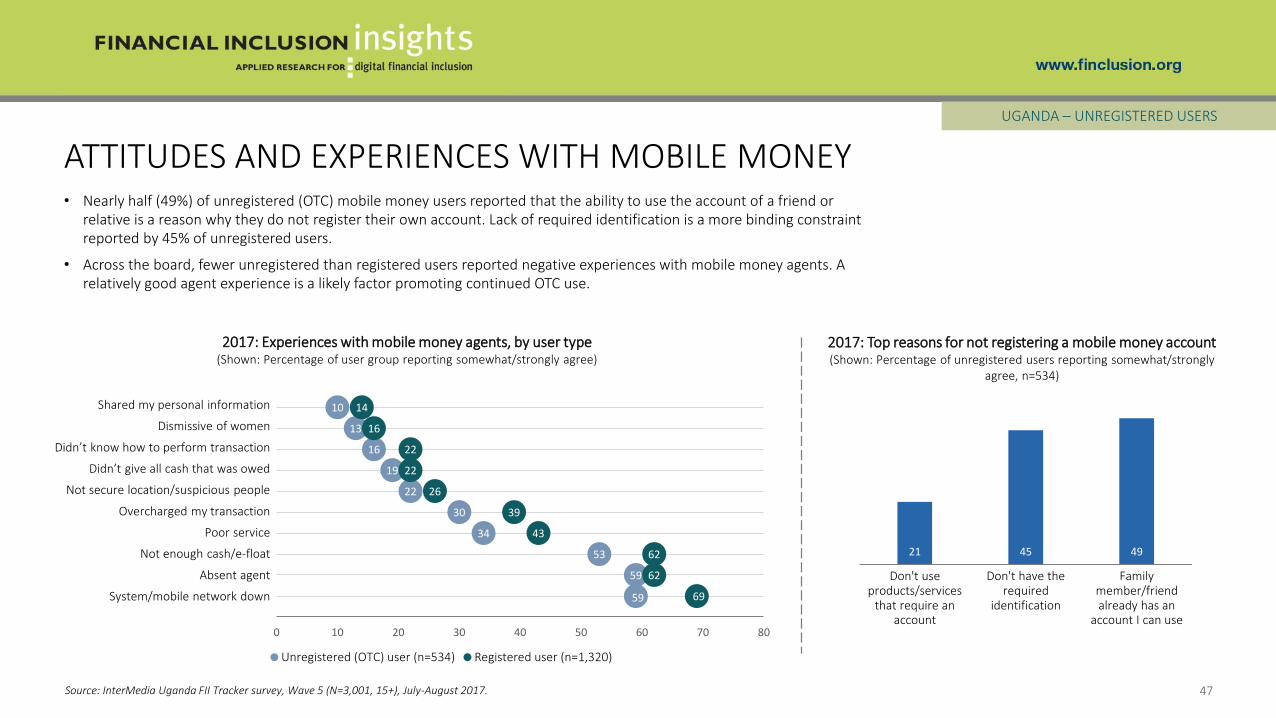
• Nearly half (49%) of unregistered (OTC) mobile money users reported that the ability to use the account of a friend or relative is a reason why they do not register their own account. Lack of required identification is a more binding constraint reported by 45% of unregistered users.
• Across the board, fewer unregistered than registered users reported negative experiences with mobile money agents. A relatively good agent experience is a likely factor promoting continued OTC use.
Source: InterMedia Uganda FII Tracker survey, Wave 5 (N=3,001, 15+), July-August 2017.
2017: Experiences with mobile money agents, by user type (Shown: Percentage of user group reporting somewhat/strongly agree)
Shared my personal information
Dismissive of women
Didn’t know how to perform transaction
Didn’t give all cash that was owed
Not secure location/suspicious people
Overcharged my transaction
Poor service
Not enough cash/e-float
Absent agent
System/mobile network down
10
13
16
19
22
30
34
53
59
59
14
16
22
22
26
39
43
62
62
69
0 10 20 30 40 50 60 70 80
Unregistered (OTC) user (n=534) Registered user (n=1,320)
2017: Top reasons for not registering a mobile money account (Shown: Percentage of unregistered users reporting somewhat/strongly
agree, n=534)
21 45 49
Don't use products/services
that require an account
Don't have the required
identification
Family member/friend already has an
account I can use

UNREGISTERED USER SAVING BEHAVIOR
48
UGANDA – UNREGISTERED USERS
• The unregistered user group uses a variety of savings instruments. Cash dominates; close to half (46%) of unregistered users save in cash in a safe place at home or on themselves.
• About an equal percentage of unregistered users save with mobile money (19%) as with informal ROSCAs and merry-go-rounds (20%). For this group, “saving” using mobile money involves waiting to cash-out e-money with an agent for a period of time after receiving a transfer.
69 46 20 19 15 11 9*
Savers At home, in cash ROSCA/merry-go-round Mobile money Agricultural inputs orlivestock
ASCA/VSLA Other people/collectors
Source: InterMedia Uganda FII Tracker survey, Wave 5 (N=3,001, 15+), July-August 2017.
2017: Methods of saving(Shown: Percentage of unregistered users, n=505)
*Fewer than 50 observations
Despite lacking a mobile money account, nearly 1 in 5 unregistered users consider OTC mobile money services as savings instruments.

UNREGISTERED USER ECONOMIC EMPOWERMENT, BY GENDER
49
UGANDA – UNREGISTERED USERS
• Overall, both male and female unregistered users report lower levels of economic empowerment than advanced users. The gender gap between advanced users is, however, greater than the gap between male and female unregistered users on influence over household spending decisions.
• A small gender gap between unregistered users on having a voice in spending decisions disappears at the advanced user stage.
• A small gender gap on deciding how to spend or save personal money at the unregistered user stage grows to 4 percentage points at the advanced user stage.
Source: InterMedia Uganda FII Tracker survey, Wave 5 (N=3,001, 15+), July-August 2017.
2017: Influence, voice and autonomy on personal and household financial decision making(Shown: Percentage of Uganda adults in each group, by gender)
45
70
40
52
I have most/almost all influence on final decisions on household spending
59
75
56
75
Somewhat/very likely to voice disagreement with spending decision
75
96
76
95
Somewhat/very involved in deciding what financial services to use
72
86
70
82
I make the final decision on how my money is spent or saved (somewhat/strongly agree)
n Male (Unregistered user n=168, Advanced user n=422) n Female (Unregistered user n=337, Advanced user n=452)
Unregistered user
Advanced user
Unregistered user
Advanced user
Unregistered user
Advanced user
Unregistered user
Advanced user

REGISTERED INACTIVE USERS
50
NONUSERSUNREGISTERED
USERSREGISTERED
INACTIVEACTIVE BASIC
USERS ADVANCED
USERS
UGANDA

REGISTERED INACTIVE USERS, BY DEMOGRAPHIC GROUP
51
UGANDA – REGISTERED INACTIVE USERS
Source: InterMedia Uganda FII Tracker survey, Wave 5 (N=3,001, 15+), July-August 2017.
2017: Inactive users of registered financial accounts, by demographic and service type(Shown: Percentage of each demographic group who are registered inactive users of each type of institution)
4 6 2
Total population (N=3,001)
2* 6*4 72* 2*
Females (n=1,875)
Males (n=1,126)
3* 6*6 5*2* 4*
Rural (n=2,165)
Urban (n=836)
2* 55 61* 3*
Below poverty line (n=1,636)
Above poverty line (n=1,365)
g Bank g Mobile money g NBFI
• Mobile money users accounted for the largest number of registered users who did not use their accounts within the 90 days before the survey, followed by bank and NBFI account holders.
• There were almost equal percentages of inactive users of mobile money and bank accounts among those living above the poverty line.
• Larger proportions of men were inactive users of mobile money compared to women.
*Fewer than 50 observations
3* 4*6 51* 4*
Younger than 35(n=1,604)
35 years and older(n=1,397)

ACTIVE BASIC USERS
52
NONUSERSUNREGISTERED
USERSREGISTERED
INACTIVE USERSACTIVE BASIC
USERS ADVANCED
USERS
UGANDA

ACTIVE BASIC USERS, BY DEMOGRAPHIC GROUP
53
UGANDA – ACTIVE BASIC USERS
Source: InterMedia Uganda FII Tracker survey, Wave 5 (N=3,001, 15+), July-August 2017.
2017: Active basic users of mobile money accounts, by demographic(Shown: Percentage of each demographic group who are active basic users of mobile money accounts)
11
Total population (N=3,001)
11 11
Females (n=1,875)
Males (n=1,126)
10 14
Rural (n=2,165)
Urban (n=836)
8 14
Below poverty line (n=1,636)
Above poverty line (n=1,365)
• Nearly all active basic users only have a mobile money account. They used their account in the last 90 days only for basic transfers, and do not use mobile money for savings or other advanced use cases.
• In 2017, there was no gender gap between active basic users. A larger proportion of the urban and above-poverty groups were active basic users compared to the rural and below-poverty groups.
9 13
Younger than 35(n=1,604)
35 years andolder
(n=1,397)

ACTIVE BASIC USER FINANCIAL BEHAVIORS
54
UGANDA – ACTIVE BASIC USERS
• Like the other user groups, a majority of active basic users (60%) have saved. Saving in cash at home is the most frequently reported method of saving; two in five active basic users (41%) save in cash or on themselves. Less than one-fifth of them save with merry-go-rounds/ROSCAs, or other informal financial groups. Active basic users by definition do not use mobile money for saving.
• A small proportion of active basic users reported borrowing via a bank or NBFI account that they did not use in the 90 days before the survey or is registered to someone else. These findings reveal demand for advanced services in this group.
60 41 17 16* 10*
Savers At home, in cash ROSCA/merry-go-round ASCA/VSLA Agricultural inputs orlivestock
Source: InterMedia Uganda FII Tracker survey, Wave 5 (N=3,001, 15+), July-August 2017.
2017: Methods of saving(Shown: Percentage of active basic users, n=294)
3*
3*
10*
NBFI
Bank
Other institution orfinancial service provider
2017: Source of current loan(Shown: Percentage of active basic users, n=294)
*Fewer than 50 observations

ACTIVE BASIC USER ECONOMIC EMPOWERMENT, BY GENDER
55
UGANDA – ACTIVE BASIC USERS
• Relative to users at earlier stages of the customer journey, male and female active basic users are much closer to the levels ofeconomic empowerment observed among advanced users. Active basic users show a narrower gender gap than advanced users on influence on household spending decisions.
• Female active basic users are more likely to voice disagreement with spending decisions and more involved in deciding what financial services to use than male active basic users. These differences are not present at the advanced user stage.
Source: InterMedia Uganda FII Tracker survey, Wave 5 (N=3,001, 15+), July-August 2017.
2017: Influence, voice and autonomy on personal and household financial decision making(Shown: Percentage of Uganda adults in each group, by gender)
61
70
5652
Active user
Advanced user
I have most/almost all influence on final decisions on household spending
707576 75
Somewhat/very likely to voice disagreement with spending decision
81
96
87
95
Somewhat/very involved in deciding what financial services to use
83 86
81 82
I make the final decision on how my money is spent or saved (somewhat/strongly agree)
n Male (Active basic user n=95, Advanced user n=422) n Female (Active basic user n=199, Advanced user n=452)
Active user
Advanced user
Active user
Advanced user
Active user
Advanced user

ADVANCED USERS
56
NONUSERSUNREGISTERED
USERSREGISTERED
INACTIVE USERSACTIVE BASIC
USERS ADVANCED
USERS
UGANDA

ADVANCED USERS, BY DEMOGRAPHIC GROUP
57
UGANDA – ADVANCED USERS
Source: InterMedia Uganda FII Tracker survey, Wave 5 (N=3,001, 15+), July-August 2017.
28 percentage-point income gap;
20 percentage-point locality gap; and
11 percentage-point gender gap between mobile money advanced users.
2017: Advanced users, by demographic(Shown: Percentage of each demographic group who are advanced users of each type of institution)
7 25 4
Total population(N=3,001)
5 920 3135
Females(n=1,875)
Males(n=1,126)
4 1420 4035*
Rural(n=2,165)
Urban(n=836)
2* 1413 411* 7
Below poverty line(n=1,636)
Above poverty line(n=1,365)
g Bank g Mobile money g NBFI
• Across all demographic groups, advanced users used mobile money services more frequently than they did banks or NBFIs.
• Advanced users comprised a larger portion of male, urban, and above-poverty demographic groups than female, rural, and below-poverty demographic groups.
• Compared to gender and locality gaps, the income gap was the largest across all financial institutions.
*Fewer than 50 observations
7 825 2535
Younger than 35(n=1,604)
35 years and older(n=1,397)

• Transfers are the dominant use case that motivated 94% of advanced users to start using mobile money, but 85% also cited saving money as a reason.
• A large majority of advanced users gave mobile money highly positive ratings for ease of access, cost effectiveness, trust and security.
REASONS FOR USING MOBILE MONEY
58
UGANDA – ADVANCED USERS
21
24
29
79
85
94
I was registered by someoneelse
I wanted to make aninvestment
Pay a bill
Secure place to store money
Save money
Send/receive money
72
73
84
88
91
96
Greater trust in mobile money
More secure
Meets needs better than other options
Cheaper to use
Easier to use mobile money
More accessible
2017: Top reasons to start using mobile money (Shown: Percentage of advanced mobile money users reporting somewhat/strongly
agree, n=784)
2017: Reasons to use mobile money over other financial services(Shown: Percentage of advanced mobile money users reporting somewhat/strongly
agree, n=784)
Source: InterMedia Uganda FII Tracker survey, Wave 5 (N=3,001, 15+), July-August 2017.

ADVANCED USER 90-DAY ACCOUNT ACTIVITIES
59
UGANDA – ADVANCED USERS
18 4* 9* 3*0.4* 0.1* 0.5* 2*56 25 13 2* 8 2* 0.7* 1*13 3* 3* 8 3* 3*
Save/set aside money Bill pay Receive wages Loan activity Pay for goods/ services Make investment/buy shares
Insurance activity Receive welfare/pension/ benefit
Bank Mobile money NBFI
NA
2017: Advanced users’ account activities in last 90 days, by activity and institution(Shown: Percentage of advanced users, n=874)
Source: InterMedia Uganda FII Tracker survey, Wave 5 (N=3,001, 15+), July-August 2017.
• Among advanced users, mobile money was the most used saving channel, followed by banks and NBFIs. Additionally, one in four advanced users used mobile money for bill pay in the 90 days before the survey.
• After saving, bank accounts were used most often for receiving wages; 9% of advanced users received wages through a bank account in the 90 days before the survey. Mobile money was, however, used more often for receiving wages than were banks.
• Despite the launch of MoKash in 2016, digital credit products have seen little uptake; only 2% of advanced users reported borrowing through a mobile money account.
NA
*Fewer than 50 observations
56% of advanced users saved actively via a mobile money account in the 90 days prior to the survey.

ADVANCED USER FINANCIAL BEHAVIORS
60
UGANDA – ADVANCED USERS
• The majority of advanced users (72%) reported saving using mobile money, though this behavior is better characterized as secure storage of money in digital form since few advanced users (5%) used MTN’s interest-bearing savings product, MoKash. Keeping money at home in cash was the second most common (46%) saving method among advanced users, followed by banks.
• Loan activity was rare among advanced users; only 11% had a loan with an NBFI, 7% with a bank and 3% with a mobile money service in 2017.
12
12
14
18
21
28
46
72
94
ASCA/VSLA
Other people/collectors
NBFI
ROSCA/merry-go-round
Agricultural inputs or livestock
Banks
At home, in cash
Mobile money
Savers
Source: InterMedia Uganda FII Tracker survey, Wave 5 (N=3,001, 15+), July-August 2017.
2017: Methods of saving(Shown: Percentage of advanced users, n=874)
3*
7
9
11
Mobile money account
Bank
Other institution or financialservice provider
NBFI
2017: Methods of borrowing(Shown: Percentage of advanced users, n=874)
*Fewer than 50 observations

USE OF MOBILE MONEY VALUE-ADDED PRODUCTS
61
UGANDA – ADVANCED USERS
• Compared to the general advanced use cases for mobile money, there has been a more limited uptake of the specific products and services that have so far been launched in Uganda to cater directly to demand for savings, credit, borrowing, bill pay, merchant pay, and other needs. A year after its launch in August 2016, only 5% of advanced users (2% of the total adult population) had ever used MTN’s main savings and loan product, MoKash.
• Launched in March 2017, Wewole, a credit product from Airtel, also had seen limited uptake before the survey went to field. Nearly all of those who accessed MoKash and Wewole used the products actively.
2017: Access and active use of mobile money value-added products(Shown: Percentage of advanced users, n=874)
6 5* 2* 1* 1* 2*4* 5* 2* 1* 1* 1*
Pay school fees/buy goods Mokash Wewole Ready Pay Solar M-Kopa Other
Access/trial users Active users
Mokash: mobile-based saving and loan service offered to Uganda MTN Mobile Money customers in partnership with CBA Bank.
Wewole: micro-credit product for Airtel Money customers that does not offer savings.
Ready Pay Solar: pay-as-you-go solar energy solution; customers can finance and pay for the solar energy system via mobile phone.
M-Kopa: allows customers in Kenya, Tanzania, and Uganda to buy and pay for solar energy systems via mobile phones.
Source: InterMedia Uganda FII Tracker survey, Wave 5 (N=3,001, 15+), July-August 2017.
*Fewer than 50 observations

KEY INDICATORS SUMMARY
62
UGANDA
Source: InterMedia Uganda FII Tracker surveys, Wave 2 (N=3,001, 15+), September 2014; Wave 3 (N=3,000, 15+), September 2015; Wave 4 (N=3,000, 15+), August 2016; Wave 5 (N=3,001, 15+), July-August 2017.
Key Indicators2014 2015 2016 2017 Base
Definition%, Base n %, Base n %, Base n %, Base n
Adults (15+) who have active digital stored-value accounts33% (+/- 2.8%) 33% (+/-2.6%) 33% (+/- 2.1%) 37% (+/- 2.4%)
All adults3,001 3,000 3,000 3,001
Poor adults (15+) who have active digital stored-value accounts22% (+/- 2.6%) 23% (+/- 2.6%) 17% (+/- 2.0%) 22% (+/- 2.4%) All poor
2,171 2,036 1,680 1,636
Poor women (15+) who have active digital stored-value accounts18% (+/- 3.0%) 16% (+/- 2.4%) 13% (+/- 2.1%) 16% (+/- 2.6%) All poor
females1,130 1,314 1,125 1,044
Rural women (15+ ) who have active digital stored-value accounts 22% (+/- 4.0%) 19% (+/- 2.9%) 19% (+/- 2.5%) 23% (+/- 2.8%) All rural
females1,127 1,375 1,395 1,341
Adults (15+) who actively use digital stored-value accounts and have accessed at least one advanced financial service (beyond basic wallet & P2P)
21% (+/- 1.8%) 23% (+/- 2.0%) 23% (+/- 1.7%) 27% (+/- 2.1%)All adults
3,001 3,000 3,000 3,001
Poor adults (15+) who actively use digital stored-value accounts and have accessed at least one advanced financial service (beyond basic wallet & P2P)
12% (+/- 1.4%) 14% (+/- 1.9%) 9% (+/- 1.3%) 14% (+/- 2.1%)All poor
2,171 2,036 1,680 1,636
Poor women (15+) who actively use digital stored-value accounts and have accessed at least one advanced financial service (beyond basic wallet & P2P)
8% (+/- 1.6%) 8% (+/- 1.5%) 6% (+/- 1.3%) 8% (+/- 1.7%) All poor females1,130 1,314 1,125 1,044
Rural women (15+) who actively use digital stored-value accounts and have accessed at least one advanced financial service (beyond basic wallet & P2P)
11% (+/- 2.2%) 11 (+/- 1.7%) 10% (+/- 1.5%) 14% (+/- 2.2%) All rural females1,127 1,375 1,395 1,341
Digital stored-value accounts: accounts in which a monetary value is represented in a digital electronic format and can be retrieved/transferred by the account owner remotely. For this particular study, DSVAs include a bank account or NBFI account with digital access (a card, online access or a mobile phone application) and a mobile money account.
For more information, contact:
Lucy Kaaria, Senior Research Associate, Africa [email protected]
Samuel Schueth, Director of Research [email protected]