ubiquitous emotion-aware computing · 2017-08-28 · ubiquitous emotion-aware computing egon l. van...
TRANSCRIPT
ORIGINAL ARTICLE
Ubiquitous emotion-aware computing
Egon L. van den Broek
Received: 25 February 2011 / Accepted: 17 August 2011 / Published online: 15 October 2011
� The Author(s) 2011. This article is published with open access at Springerlink.com
Abstract Emotions are a crucial element for personal and
ubiquitous computing. What to sense and how to sense it,
however, remain a challenge. This study explores the rare
combination of speech, electrocardiogram, and a revised
Self-Assessment Mannequin to assess people’s emotions.
40 people watched 30 International Affective Picture
System pictures in either an office or a living-room envi-
ronment. Additionally, their personality traits neuroticism
and extroversion and demographic information (i.e., gen-
der, nationality, and level of education) were recorded. The
resulting data were analyzed using both basic emotion
categories and the valence–arousal model, which enabled a
comparison between both representations. The combina-
tion of heart rate variability and three speech measures
(i.e., variability of the fundamental frequency of pitch (F0),
intensity, and energy) explained 90% (p \ .001) of the
participants’ experienced valence–arousal, with 88% for
valence and 99% for arousal (ps \ .001). The six basic
emotions could also be discriminated (p \ .001), although
the explained variance was much lower: 18–20%. Envi-
ronment (or context), the personality trait neuroticism, and
gender proved to be useful when a nuanced assessment of
people’s emotions was needed. Taken together, this study
provides a significant leap toward robust, generic, and
ubiquitous emotion-aware computing.
Keywords Ubiquitous computing � Emotion �Unobtrusive sensing � Speech features � Heart rate
variability � Personality
1 Introduction
It has been 40 years since Skinner [88] said: The appli-
cation of the physical and biological sciences alone will
not solve our problems because the solutions lie in another
field. … It is not enough to ‘‘use technology with a deeper
understanding of human issues,’’ or to ‘‘dedicate technol-
ogy to man’s spiritual needs,’’ or to ‘‘encourage technol-
ogists to look at human problems.’’ … What we need is a
technology of behavior. … But a behavioral technology
comparable in power and precision to physical and bio-
logical technology is lacking … (p. 4–5).
Since Skinner’s words [88], much has changed, but even
more has not. On the one hand, phenomena of private
experience, whether they be characterized as mental or
emotional, conscious or unconscious, are inaccessible to
direct public observation; the actions of living organisms,
on the other hand, can be observed directly and studied in
relation to antecedent conditions in the same way as the
phenomena treated in other sciences (p. 3) [72]. This was
the case four decades ago, and still is the case, despite the
impressive progress of cognitive sciences and neuroscience
[85] (e.g., brain imaging techniques [60, 104] and brain–
computer interfaces [8, 17, 91]). On the other hand, tech-
nologies ranging from biosensors to robots have become
E. L. van den Broek (&)
Human-Centered Computing Consultancy, Vienna, Austria
e-mail: [email protected]
URL: http://www.human-centeredcomputing.com/
E. L. van den Broek
Human Media Interaction (HMI), Faculty of Electrical
Engineering, Mathematics, and Computer Science,
University of Twente, P.O. Box 217, 7500 AE Enschede,
The Netherlands
E. L. van den Broek
Karakter University Center, Radboud University Medical Center
(UMC) Nijmegen, P.O. Box 9101, 6500 HB Nijmegen,
The Netherlands
123
Pers Ubiquit Comput (2013) 17:53–67
DOI 10.1007/s00779-011-0479-9
smaller, even miniaturized [70], and can be integrated into
virtually all products (e.g., clothes [89] or our homes
[101]). Consequently, new branches of science and engi-
neering have emerged, such as personal and ubiquitous
computing (UbiComp) [50], ambient intelligence (AmI)
[20], pervasive computing [12]), wearable computing [2],
and the Internet of Things [34, 48] (also known as physical
computing, haptic computing, and things that think).
The true potential of the emerging branches of science
such as UbiComp and AmI is more than an engineering
paradigm. The envisioned systems can only be realized if
human behavior can also be analyzed automatically. Sub-
sequently, the resulting knowledge can be utilized for the
integration of humans’ inputs and outputs with those of
their media. This yields intuitive computing and brings us
to one of its core notions: (human) emotions. This has long
been accepted by psychologists but has only been
embraced by science and engineering, since Picard’s book
Affective Computing in 1997 [79]. As a result, ambient
sensing of emotions [97], emotion-aware consumer prod-
ucts [96], and affective interaction [31] have been pro-
posed. This is what this article will be about.
Emotions can be transmitted either overtly (e.g., by the
face, the body, or the voice), covertly (e.g., biosignals), or
in a combination of both [26]. On the one hand, the
complex nature of emotion is illustrated by the absence of
an integral model of (human) emotions (cf. [26]). So, it is
still largely unknown what cues humans process in
determining others’ emotional states. On the other hand,
the processing of signals related to emotions has been a
topic of research for more than a century [25, 51, 57].
Until the end of the twentieth century, attention to this
relation, however, was limited and, hence, so was progress
[26] (cf. [24]).
In this article, five issues will be addressed that are
troubling the development of ubiquitous emotion
awareness:
1. A broad range of physiological signals, speech, and
computer vision techniques are employed to determine
people’s state of emotions. Regrettably, despite the
rapid growth of such techniques, these methods are
either obtrusive, sensitive to noise, or both [32, 94].
2. What emotions are, how they can be described, and
how they are expressed remain difficult to define [25,
38, 57, 72].
3. Although it is generally agreed that environment (or
context) is of the utmost importance [7], laboratory
and field research in this field are seldom compared
[39, 53, 99].
4. Personality traits are seldom taken into account (e.g.,
[43, 80, 109]), although widely recognized as being
important [67, 90, 99].
5. Demographic information (e.g., age [63, 83], gender
[49, 104], culture [11, 35, 69], social class [35, 69],
and nationality [68]) and ethnics [11, 87] are known to
possibly influence experienced emotions and their
accompanying physiological responses. Nevertheless,
this basic information is often disregarded.
By addressing the combination of these issues, we
expect to contribute significantly to emotion-aware
technology.
In the next section (Sect. 2), we will briefly introduce
the construct emotion and two models of emotion that are
often used in emotion-aware computing. Next, in Sect. 3,
we will discuss signals of emotion and introduce the hybrid
approach chosen in this research. Subsequently, in Sect. 4,
we will introduce the study conducted. Section 5 will
describe how the different types of signals are processed.
Next, the results and their interpretation will be described
in Sect. 6 We will close, in Sect. 7, with a general
discussion.
2 Emotions
A complete bookstore could easily be filled with books and
articles on emotion and related topics. Reviewing this vast
amount of literature falls beyond the scope of the current
article. Moreover, excellent handbooks (e.g., [25, 57]) and
review articles (e.g., [24, 38]) have already been published
on this topic. So, no overview of emotion theories and their
levels of description will be provided. Instead, we will
work toward a stipulative definition of emotion. This is
necessary as there is still no consensus on a definition of
‘‘emotion,’’ and theorists and researchers use ‘‘emotion’’ in
ways that reflect different meanings and functions (p. 363),
as Izard recently stated [38]. This overview takes up a
special section of the journal Emotion Review as founda-
tion [38].
2.1 On defining emotions
In the search for consensus on what emotion is, Izard [38]
identified six key structures of emotion, namely: (1) neural
systems, (2) response systems, (3) feelings, (4) expressive
behavior, signalling systems, (5) antecedent cognitive
appraisal, and (6) cognitive interpretation of feelings.
Moreover, seven functions of emotions were identified: (1)
facilitates attention and direction of responses, (2) moti-
vates cognition and action and provides emotion informa-
tion [73], (3) alters the salience or value of an event to
facilitate adaptive associations, (4) contributes to emotion
and behavior regulation, well-being, and the safeguarding
of sensitivities and concerns, (5) social signaling and
54 Pers Ubiquit Comput (2013) 17:53–67
123
communication, (6) provides a neural (often conscious)
workspace for assembling solutions, and (7) different
emotions (and their structures) have different functions.
Together, these aspects and functions of emotion provide a
knowledge space we can work with.
Izard [38] concludes by stating that Emotion consists of
neural circuits (that are at least partially dedicated),
response systems, and a feeling state/process that moti-
vates and organizes cognition and action [73]. Emotion
also provides information to the person experiencing it,
and may include antecedent cognitive appraisals and
ongoing cognition including an interpretation of its feeling
state, expressions or social–communicative signals, and
may motivate approach or avoidant behavior, exercise
control/regulation of responses, and be social or relational
in nature. (p. 367) [38]. This does not provide us with a
precise definition of emotion as a unitary concept. How-
ever, it does provide us something to hold on to and work
with. Moreover, more than anything else, it emphasizes
both the complexity of emotions and their ubiquitous
nature.
2.2 Modeling emotion
As we outlined in the previous section, emotions are
complex to untangle. However, there is general consensus
on the neural systems underlying them, which are at least
partly dedicated [38]. This having been said, emotion
recognition remains challenging for both man and machine.
For example, different emotions and different structures of
each emotion have different functions [38], and neural
systems are influenced by much more than solely emotions
(e.g., imagine what happens to your heart rate when you
start walking).
For engineering practice, a workable model of emotion
needs to be adopted. However, there are good arguments to
state that such a model is beyond science’s current reach.
Nevertheless, some model needs to be chosen; otherwise,
signals of emotion cannot be processed and classified and
our endeavor ends prematurely. Psychology distinguishes
two emotion models: (1) discrete emotion categories and
(2) a (2D or 3D) continuous dimensional model of emotion.
The discrete emotion categories originate from Darwin’s
pioneering work on basic emotions. The theory behind this
model assumes that these emotion categories are hard-
coded into our neural system and recognized universally
[19, 28, 56] (cf. the debate on color categories as unveiled
by Berlin and Kay [82]). Although still a topic of debate,
most consensus exists on the six emotion categories hap-
piness, sadness, surprise, fear, anger, and disgust.
The (continuous) dimensional model of emotion
assumes orthogonal unipolar or bipolar dimensions that
together can describe the emotional state a person is in.
Most often Russel’s circumplex or valence–arousal (VA)
model of emotions [18, 27, 33, 66, 84] is adopted. This
distinguishes arousal and valence (i.e., pleasure/displea-
sure) as two orthogonal bipolar factors that describe emo-
tions. The dimensional VA model has frequently been
extended [14, 33]; for example, to enable the incorporation
of mixed emotions [16, 68, 96, 102]. These extensions
often incorporate two unipolar valence dimensions: one for
positive and one for negative valence, instead of one
bipolar valence dimension. Such extended VA models
incorporate three dimensions, instead of two. This
approach was also adopted for the current research.
3 Ubiquitous signals of emotion
As we already mentioned in the introduction, the tech-
niques usually employed to process signals of emotion are
often either obtrusive, sensitive to noise, or both. We will
now discuss each of the three signals: biosignals, computer
vision, and speech and identify their pros and cons. Next,
we will introduce the hybrid approach adopted in the
research described in this article.
Features of physiological signals (or biosignals) are
known to indicate emotions [15, 32, 95]; however, mea-
surement of such signals is often experienced as obtrusive
by participants.; for example, facial electromyography
(EMG) requires sensors to be placed on the face, and
electrodermal activity (EDA; or galvanic skin response,
GSR) requires sensors to be placed on participants’ hands
or alternatively on their foot soles. Not only is their
application obtrusive and do they prevent normal func-
tioning but these sensors also frequently drop off when
used in ambulatory settings. Until recently, this has pre-
vented biosignals being incorporated into consumer prod-
ucts. However, with the progress of wearable computing
and wireless sensing technologies in the last decade, this
problem quickly vanishes [2, 23, 37, 58, 64, 75, 77, 106,
110]. In parallel, biosignal recording, even with a certain
amount of obtrusiveness, is embraced by the general public
in Western societies (e.g., real-time ECG processing to
guide athletes). Hence, the path toward biosignal-based
emotion-aware computing would seem to be paved.
An alternative for biosignals are computer vision tech-
niques. These can be employed both as a static (i.e., image)
and a dynamic technique (i.e., video) [36, 103, 107, 109].
Moreover, one can choose to conduct markerless record-
ings or to use markers, which facilitate processing the
images or videos. Most research on emotion-aware com-
puting incorporates recordings of the face, but body lan-
guage analysis also has been shown to be a rich source of
information (e.g., movements and gestures) [6, 36, 47, 61].
Although appealing, computer vision techniques are only
Pers Ubiquit Comput (2013) 17:53–67 55
123
usable for emotion recognition in very stable environ-
ments; for example, without occlusion, in stable light
sources, and with the users sitting at a desk or on a couch
[99, 103]. Hence, in practice, in ambulatory settings,
computer vision-based emotion-aware computing is not
feasible.
Speech-based emotion-aware computing is probably the
most exhaustively studied technique of this triplet. Its
early studies included humans as classifiers, followed by
advanced statistical procedures, and, subsequently, auto-
mated digital speech signal processing by computers [29,
86, 92, 105, 109]. Speech can be considered as an indirect
biosignal that is very well suited to unveil the emotional
state of a person. Non-speech utterances have also been
shown to be of interest for emotion-aware computing [78];
however, they are relatively unexplored. The audio
recordings used for speech processing suffer from various
types of noise. Therefore, speech-based emotion recogni-
tion is most often conducted in well-controlled (laboratory)
environments. However, advances in source localization
and, subsequent, noise cancelation are promising. Hence,
we anticipate the feasibility of speech-based emotion-
aware computing in the near future.
Signals from the first group (i.e., biosignals) are rarely
combined with signals from the other two groups (i.e.,
computer vision and speech). In contrast, biosignals them-
selves are frequently combined (e.g., [43, 80, 98]). Also,
signals from the speech processing and computer vision
groups are frequently combined [22, 76, 109]. However,
some exceptions exist. Bailenson et al. [5] combined com-
puter vision and physiological measures. Van Drunen et al.
[100] combined physiological measures with eye tracking,
thinking aloud, and user–system interactions (cf. [99]).
The current study combines speech and biosignals for
emotion recognition. To the author’s knowledge, only two
groups have reported on this combination: Kim et al. [41,
42, 44, 45] and the current author and colleagues [97]. A
possible explanation is the lack of knowledge of the
application of this combination of measures. We expected
to extract features from both the speech and the ECG signal
of people’s experienced valence and arousal, as well as on
their basic emotions. Let us now briefly introduce both of
these signals.
The human speech signal can be characterized by vari-
ous features and their accompanying parameters. However,
no consensus has thus far been reached on the features and
parameters of speech that reflect the emotional state of the
speaker. Most evidence exists for the variability (e.g.,
standard deviation; SD) of the fundamental frequency (F0),
the intensity of air pressure (I ), and the energy of speech
(E) [29, 86, 92, 105, 109]. Therefore, we have selected
these speech features in the current research.
The electrocardiogram (ECG) is an autonomic signal
that cannot be controlled easily, as is the case with elec-
trodermal activity [15]. ECG can be measured directly
from the chest. Where Blood Volume Pulse (BVP) can
already be recorded rather unobtrusively for some time, it
would seem that it will also be possible soon for ECG [58,
77]. Previous research identified various features of ECG
as indicators for both experienced valence and arousal [3,
15, 18, 71]. However, most evidence is provided for the
HR variability (HRV) [40]. HRV decreases with an
increase in mental effort, stress, and frustration [15, 100].
Moreover, HRV can be influenced by the valence of an
event, object, or action [3, 71, 81]. On the whole, HRV ,as
can be derived from ECG, is a rich source of information
and has been shown to be a powerful discriminator
between emotions [40]; therefore, HRV was selected as the
ECG’s feature.
4 Method
4.1 Participants
40 volunteers (20 men, 20 women [49]; average age 27.8;
SD 7.6; range 18–49) participated. None of them had
hearing impairments or any known cardiovascular prob-
lems. All had (corrected to) normal vision. The participants
were ignorant of our research goals.
The participants were divided into two groups of 20 each.
One group of participants was assigned to an office envi-
ronment, in which they took place in an office chair. The
other group of participants was assigned to a living-room
environment, in which they sat on a couch. At both locations,
the room was silent and darkened, and a screen was placed in
front of the participant. Although both environments were
controlled, this enabled an operationalization of the concept
context (or environment) and, hence, its influence on ubiq-
uitous emotion-aware computing.
After instructions, the participant signed an informed
consent, and the ECG measurement belt and headset were
positioned. Next, the participant read aloud a non-emo-
tional story to (a) verify by asking whether or not the
participant had understood the instructions, (b) to test the
equipment, and (c) to determine their personal baseline for
both the speech and the ECG signal.
Using a questionnaire, we recorded general demo-
graphic information of the participants: age [55, 63, 93],
level of education, and nationality [87]. This information
was used to control for them as possible sources of influ-
ence [99]. Next, the participants were also asked to fill in a
revised, short scale of the Eysenck Personality Question-
naire (EPQ-RSS) [30]. Two binary indices were derived
56 Pers Ubiquit Comput (2013) 17:53–67
123
from the EPQ-RSS. These indicate the participants’ per-
sonality traits neuroticism and extroversion, which are both
known to influence the emotions experienced [21, 62, 65,
97].
4.2 International Affective Picture System (IAPS)
To elicit an emotional response, the participants looked at
30 pictures from the IAPS [52]; see Table 1 for their
identification numbers. The IAPS set is based on a
dimensional model of emotion [18, 52, 66]; however, as
has been shown, this set also has great potential to reflect
multiple emotion categories [97, 66]. Moreover, this set of
pictures has been thoroughly and repeatedly validated [52,
66] and, as such, serves as a sort of ground truth for
emotion research. The pictures were randomly presented
on a 15.4 inch TFT screen (1280 9 800 pixels, 60 Hz
refresh rate; video card: ATI Mobility Radeon 9700).
Each of the 30 IAPS pictures (see Table 1) were shown
for a duration of 20 s, which is more than sufficient for
emotion assessment [96]. After the presentation of each
picture, the participants had 30 s to describe it, followed by
a resting period of 20 s. During these 50 s, a gray screen
was shown. The experiment started and finished by dis-
playing a gray screen during 50 s.
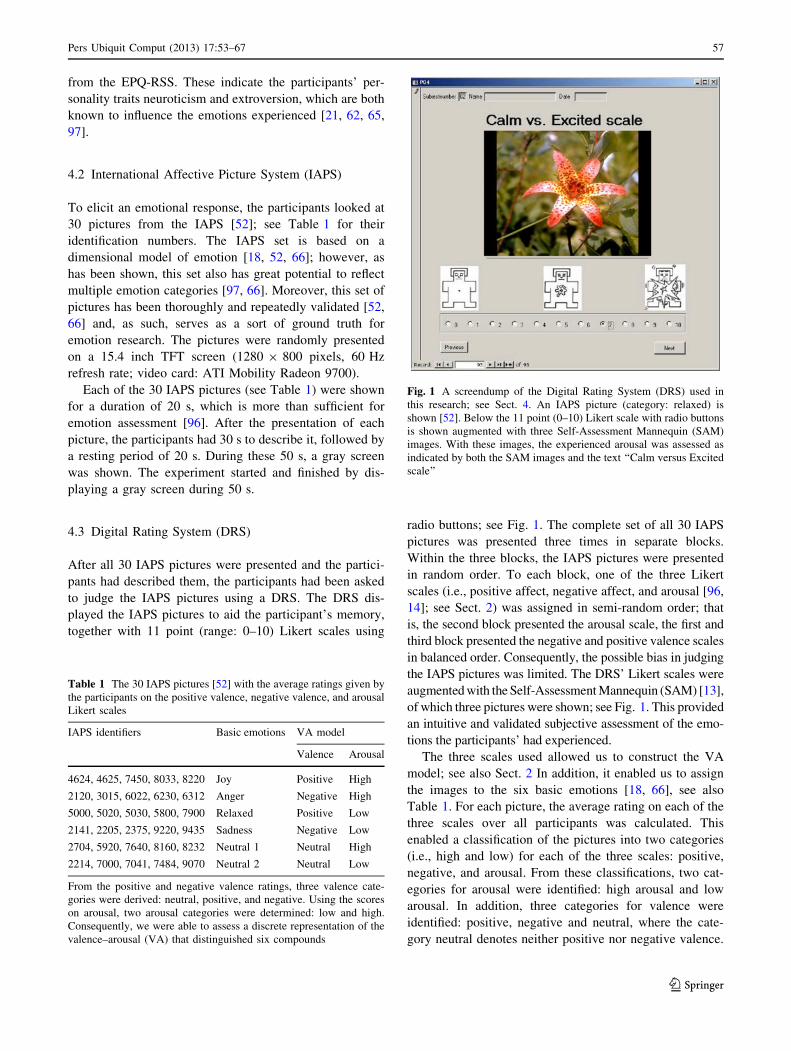
4.3 Digital Rating System (DRS)
After all 30 IAPS pictures were presented and the partici-
pants had described them, the participants had been asked
to judge the IAPS pictures using a DRS. The DRS dis-
played the IAPS pictures to aid the participant’s memory,
together with 11 point (range: 0–10) Likert scales using
radio buttons; see Fig. 1. The complete set of all 30 IAPS
pictures was presented three times in separate blocks.
Within the three blocks, the IAPS pictures were presented
in random order. To each block, one of the three Likert
scales (i.e., positive affect, negative affect, and arousal [96,
14]; see Sect. 2) was assigned in semi-random order; that
is, the second block presented the arousal scale, the first and
third block presented the negative and positive valence scales
in balanced order. Consequently, the possible bias in judging
the IAPS pictures was limited. The DRS’ Likert scales were
augmented with the Self-Assessment Mannequin (SAM) [13],
of which three pictures were shown; see Fig. 1. This provided
an intuitive and validated subjective assessment of the emo-
tions the participants’ had experienced.
The three scales used allowed us to construct the VA
model; see also Sect. 2 In addition, it enabled us to assign
the images to the six basic emotions [18, 66], see also
Table 1. For each picture, the average rating on each of the
three scales over all participants was calculated. This
enabled a classification of the pictures into two categories
(i.e., high and low) for each of the three scales: positive,
negative, and arousal. From these classifications, two cat-
egories for arousal were identified: high arousal and low
arousal. In addition, three categories for valence were
identified: positive, negative and neutral, where the cate-
gory neutral denotes neither positive nor negative valence.
Table 1 The 30 IAPS pictures [52] with the average ratings given by
the participants on the positive valence, negative valence, and arousal
Likert scales
IAPS identifiers Basic emotions VA model
Valence Arousal
4624, 4625, 7450, 8033, 8220 Joy Positive High
2120, 3015, 6022, 6230, 6312 Anger Negative High
5000, 5020, 5030, 5800, 7900 Relaxed Positive Low
2141, 2205, 2375, 9220, 9435 Sadness Negative Low
2704, 5920, 7640, 8160, 8232 Neutral 1 Neutral High
2214, 7000, 7041, 7484, 9070 Neutral 2 Neutral Low
From the positive and negative valence ratings, three valence cate-
gories were derived: neutral, positive, and negative. Using the scores
on arousal, two arousal categories were determined: low and high.
Consequently, we were able to assess a discrete representation of the
valence–arousal (VA) that distinguished six compounds
Fig. 1 A screendump of the Digital Rating System (DRS) used in
this research; see Sect. 4. An IAPS picture (category: relaxed) is
shown [52]. Below the 11 point (0–10) Likert scale with radio buttons
is shown augmented with three Self-Assessment Mannequin (SAM)
images. With these images, the experienced arousal was assessed as
indicated by both the SAM images and the text ‘‘Calm versus Excited
scale’’
Pers Ubiquit Comput (2013) 17:53–67 57
123
Table 1 provides a specification of the emotion categories
and the IAPS images assigned to them.
5 Signal processing
This section describes how all of the data were recorded
and, subsequently, processed. Speech utterances were
recorded continuously by means of a standard Trust mul-
tifunction headset with microphone. The recording was
performed in SoundForge 4.5.278 (sample rate 44.100 Hz;
sample size 16 bit). Parallel with the speech recording, a
continuous recording of the ECG was done through a
modified Polar ECG measurement belt. The Polar ECG belt
was connected to a data acquisition tool (NI USB-6008). Its
output was recorded in a LabVIEW 7.1 program, with a
sample rate of 200 Hz.
5.1 Signal selection
The speech signal of three participants was not recorded
due to technical problems. For one other participant, the
speech signal was too noisy. These four participants were
excluded from further analysis. With four other partici-
pants, either a significant amount of noise was present in
their ECG or the signal was even completely absent. These
participants were omitted from further processing.
Since one of the main aims was to unveil any possible
added value of speech and ECG features to each other, all
data were omitted from analysis of the eight participants
whose ECG or speech signals were not recorded appro-
priately. This resulted in a total of 32 participants (i.e., 16
men and 16 women), whose signals were processed.
Regrettably and surprisingly, the eight participants whose
data was not processed, all participated in the office-like
environment. So, 20 participants participated in this
research in a home-like environment and 12 of participants
sat down in an office-like environment. Conveniently, of
these 32 participants, men and women were equally present
in both environments.
5.2 Speech signal
For each participant, approximately 25 minutes of sound
was recorded during the study. However, since only parts
in which they spoke are of interest, the parts in which the
participants did not speak were omitted from further
processing.
Some preprocessing of the speech signal was required
before the features could actually be extracted from the signal.
We started with the segmentation of the recorded speech
signal in such a way that the speech signal was determined
separately for each picture. Next, the abnormalities in the
speech signals were removed. This resolved all technical
inconveniences, such as: recorded breathing, tapping on the
table, coughing, cleaning the throat, and yawning. This
resulted in a ‘‘clean’’ signal.
After the selection of the appropriate speech signal
segments and their normalization, the feature extraction
was conducted. Several parameters derived from speech
have been investigated in a variety of settings with respect
to their use in the determination of people’s emotional
state. Although no general consensus exists concerning the
parameters to be used, much evidence exists for the SD of
the fundamental frequency of pitch (F0) (SD F0), the
intensity of air pressure (I ), and the energy of speech (E)
[29, 86, 92, 105, 109]. We will limit the set of features to
these, as an extensive comparison of speech features falls
beyond the scope of this study.
For a domain [0, T], the energy ðEÞ is defined as:
1
T
ZT
0
x2ðtÞ dt; ð1Þ
where x(t) is the amplitude or sound pressure of the signal
in Pa (Pascal) [10]. Its discrete equivalent is:
1
N
XN�1
i¼0
x2ðtiÞ; ð2Þ
where N is the number of samples.
For a domain [0, T], intensity ðIÞ is defined as:
10 log10
1
T P20
ZT
0
x2ðtÞ dt; ð3Þ
where P0 = 2 9 10-5 Pa is the auditory threshold [10]. Iis computed over the discrete signal in the following
manner:
10 log10
1
N P20
XN�1
i¼0
x2ðtiÞ: ð4Þ
It is expressed in dB (decibels) relative to P0.
Both the I and the E are directly calculated over the
clean speech signal. To determine the F0 from the clean
speech signal, a fast Fourier transform has to be applied
over the signal. Subsequently, its SD is calculated; see
also (5). For a more detailed description of the processing
scheme, we refer to [9].
5.3 Heart rate variability (HRV) extraction
From the ECG signal, a large number of features can be
derived that are said to relate to the emotional state of people
[3, 39, 40, 95, 97]. This research did, however, not aim to
provide an extensive comparison of ECG features. Instead,
58 Pers Ubiquit Comput (2013) 17:53–67
123
the use of the combination of the ECG signal with the speech
signal was explored. Therefore, one well-known distinctive
feature of the ECG was chosen: the variance of heart rate.
The output of the ECG measurement belt has a constant
(baseline) value during the pause between two heart beats.
Each new heart beat is characterized by a typical slope
consisting of four elements, called: P, Q, R, and S. A heart
beat is said to be characterized by an R-wave, which is an
upward deflection. The HR is calculated from the intervals
between these R-waves (R–R intervals) [3, 39, 95, 97]. The
measurement belt for the ECG signal appeared to be sensi-
tive to movements of the participant. This resulted in four
types of noise that can be distinguished: a heart beat that
differs from the normal PQRS shape, heart beats that succeed
too quickly, missing heart beats in a sequence, and no HR
signal at all. The ECG signal was checked automatically for
all these types of noise and corrected where necessary.
The ECG signal was segmented into separate signals per
stimulus, before it was processed. Next, the intervals
between the R-waves (R–R intervals) of the ECG signal
were determined. Subsequently, the mean R–R interval
was determined. To determine the variability of the heart
rate (HRV) from an ECG, the R–R intervals of the ECG
were determined. Subsequently, two methods were applied
for the calculation of the HRV, namely: the variance (r2):
1
RXR�1
i¼0
ðDi � �DÞ2 ð5Þ
and the mean absolute deviation (MAD):
1
RXR�1
i¼0
Di � �D ð6Þ
of the R–R intervals Di:�D denotes the average R–R inter-
val, andR denotes the number of R–R intervals. The SD of
the R–R intervals is defined as the square root of (5): r.
Note that the r2 as defined in (5) is identical to the total
spectral power. This also explains why comparisons
between frequency and time–domain measures have often
shown that for every band of an HR power spectrum, there
is at least one time–domain correlate [63]. Further, please
note that various other measures were applied for the
determination of the HRV [3, 39, 40, 63, 95, 97]. However,
with these three measures, we expected to have a good
indication of the use of HRV for emotion detection.
5.4 Normalization
To tackle intrapersonal differences in the speech signal
x(t), the feature series f(t) calculated from this signal had to
be normalized. All feature series calculated were normal-
ized by subtracting people’s personal baseline l from the
original feature series f(t) [59]:
~f ðtÞ ¼ f ðtÞ � l; ð7Þ
where ~f ðtÞ denotes the normalized feature series.
The personal baseline l was obtained at the start of the
study, directly after the instructions; see also Sect. 4. This
normalization is a standard correction that is often used in
psychophysiological studies and has repeatedly been
shown to work [15]. The resulting data are often denoted as
delta or reaction score. These scores are known to be both
suitable and reliable for absolute level comparisons.
The ECG signal was processed without normalization. A
normalization of the features derived from the ECG signal
is already included in the calculation of the HRV (cf. 5 and
6 with 7). Note that for many of the other features extracted
from an ECG signal, normalization is required.
6 Results
This section discusses the results obtained in this study.
First, the considerations taken in the analysis will be pre-
sented. Next, in line with the main aims of this study, we
will analyze the combined discriminative power of both the
combination of features (i.e., repeated measures multivar-
iate analysis of variance (MANOVA) (Wilks’ lambda)) and
the features separately (i.e., (univariate) repeated measures
analysis of variance (ANOVA) (Huynh-Feldt)). This is
done for two series of analysis, one to assess the dimen-
sional VA model and one to assess six discrete basic
emotions. The factors included in the analyses are as fol-
lows: environment, the personality traits neuroticism and
extroversion, and gender; see also Table 2.
6.1 Considerations with the analysis
Preliminary analysis of the ECG signal showed that the SD,
the variance, and MAD of the heart rate (see 5, 6) provided
similar results. This is in line with what is reported in the
literature [46, 63]. Since the preliminary analysis did not
reveal significant differences among the three measures for
HRV and this is supported by the literature, we have
Table 2 Legend of the factors included in the analyses presented in
Sect. 6, particular in Tables 3, 4, 5, and 6
Abbreviation Explanation
V Valence
A Arousal
E Environment (or context)
PN Personality trait neuroticism
PE Personality trait extroversion
G Gender
Pers Ubiquit Comput (2013) 17:53–67 59
123
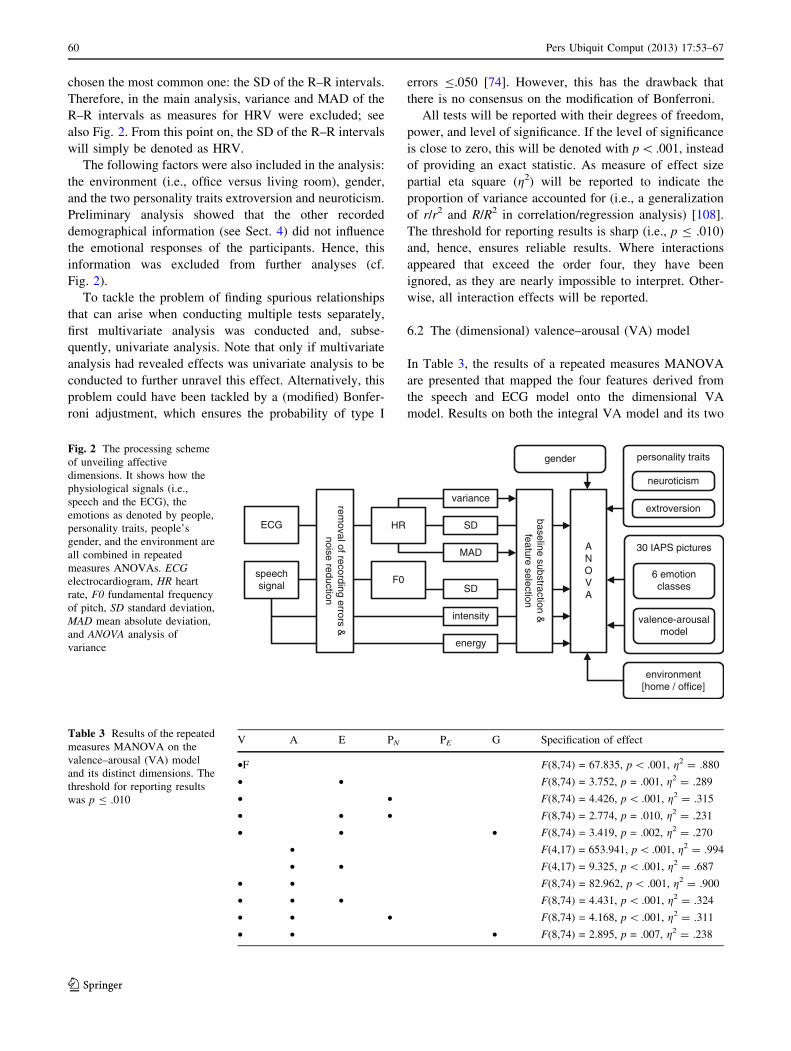
chosen the most common one: the SD of the R–R intervals.
Therefore, in the main analysis, variance and MAD of the
R–R intervals as measures for HRV were excluded; see
also Fig. 2. From this point on, the SD of the R–R intervals
will simply be denoted as HRV.
The following factors were also included in the analysis:
the environment (i.e., office versus living room), gender,
and the two personality traits extroversion and neuroticism.
Preliminary analysis showed that the other recorded
demographical information (see Sect. 4) did not influence
the emotional responses of the participants. Hence, this
information was excluded from further analyses (cf.
Fig. 2).
To tackle the problem of finding spurious relationships
that can arise when conducting multiple tests separately,
first multivariate analysis was conducted and, subse-
quently, univariate analysis. Note that only if multivariate
analysis had revealed effects was univariate analysis to be
conducted to further unravel this effect. Alternatively, this
problem could have been tackled by a (modified) Bonfer-
roni adjustment, which ensures the probability of type I
errors B.050 [74]. However, this has the drawback that
there is no consensus on the modification of Bonferroni.
All tests will be reported with their degrees of freedom,
power, and level of significance. If the level of significance
is close to zero, this will be denoted with p\ .001, instead
of providing an exact statistic. As measure of effect size
partial eta square (g2) will be reported to indicate the
proportion of variance accounted for (i.e., a generalization
of r/r2 and R/R2 in correlation/regression analysis) [108].
The threshold for reporting results is sharp (i.e., p B .010)
and, hence, ensures reliable results. Where interactions
appeared that exceed the order four, they have been
ignored, as they are nearly impossible to interpret. Other-
wise, all interaction effects will be reported.
6.2 The (dimensional) valence–arousal (VA) model
In Table 3, the results of a repeated measures MANOVA
are presented that mapped the four features derived from
the speech and ECG model onto the dimensional VA
model. Results on both the integral VA model and its two
ECG
speechsignal
HR
F0
variance
SD
MAD
SD
intensity
energy
ANOVA
environment[home / office]
valence-arousalmodel
baseline substraction &
feature selection
removal of recording errors &
noise reductiongender
6 emotion classes
30 IAPS pictures
personality traits
neuroticism
extroversion
Fig. 2 The processing scheme
of unveiling affective
dimensions. It shows how the
physiological signals (i.e.,
speech and the ECG), the
emotions as denoted by people,
personality traits, people’s
gender, and the environment are
all combined in repeated
measures ANOVAs. ECGelectrocardiogram, HR heart
rate, F0 fundamental frequency
of pitch, SD standard deviation,
MAD mean absolute deviation,
and ANOVA analysis of
variance
Table 3 Results of the repeated
measures MANOVA on the
valence–arousal (VA) model
and its distinct dimensions. The
threshold for reporting results
was p B .010
V A E PN PE G Specification of effect
•F F(8,74) = 67.835, p \ .001, g2 = .880
• • F(8,74) = 3.752, p = .001, g2 = .289
• • F(8,74) = 4.426, p \ .001, g2 = .315
• • • F(8,74) = 2.774, p = .010, g2 = .231
• • • F(8,74) = 3.419, p = .002, g2 = .270
• F(4,17) = 653.941, p \ .001, g2 = .994
• • F(4,17) = 9.325, p \ .001, g2 = .687
• • F(8,74) = 82.962, p \ .001, g2 = .900
• • • F(8,74) = 4.431, p \ .001, g2 = .324
• • • F(8,74) = 4.168, p \ .001, g2 = .311
• • • F(8,74) = 2.895, p = .007, g2 = .238
60 Pers Ubiquit Comput (2013) 17:53–67
123
dimensions are presented. Table 3 denotes that with the
MANOVA, 90% of the variance of the VA model can be
explained. The results on the distinct dimensions confirm
this result with, respectively, 88 and 99% explained vari-
ance for the valence and arousal dimensions.
When the factors environment, the personality traits
neuroticism and extroversion, and gender were included in
the analysis, good results were obtained as well. However,
the power of the MANOVAs and the explained variance
were much lower than when these factors were ignored; see
Table 3. Taken together, these results confirm the effi-
ciency of the small set of features as compiled for this
research and suggest that brute force processing and
extraction of large numbers of features (e.g., [1,000 [86,
107]) are not required for emotion-aware computing.
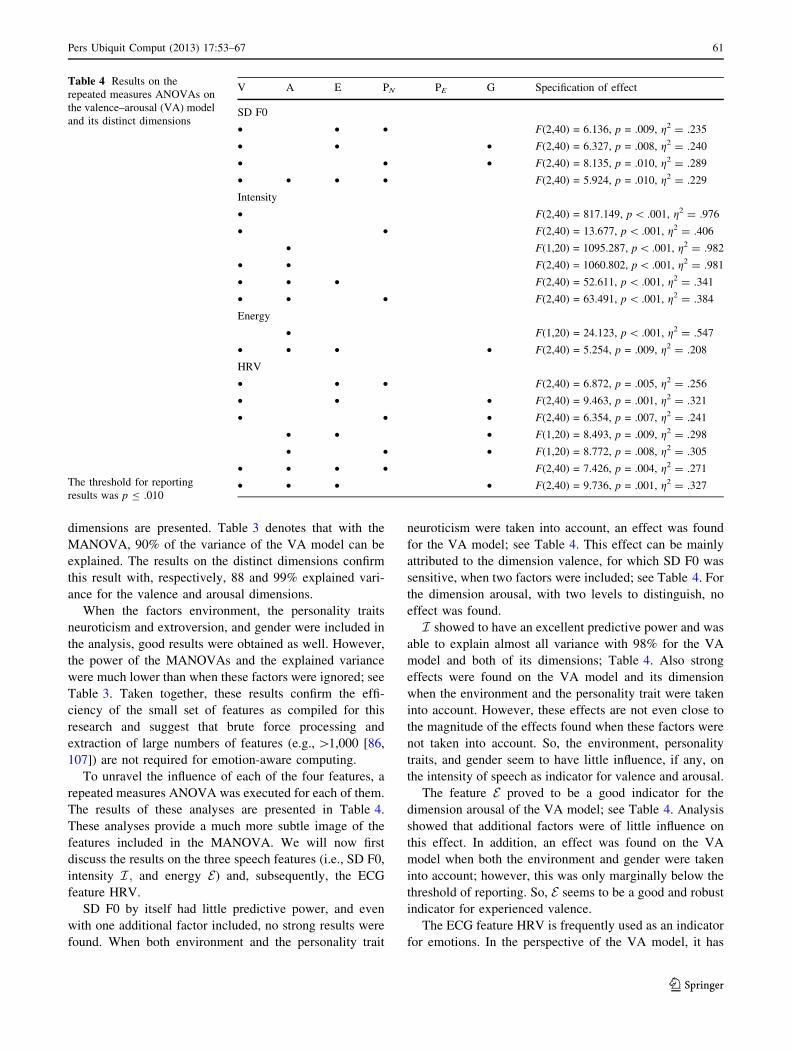
To unravel the influence of each of the four features, a
repeated measures ANOVA was executed for each of them.
The results of these analyses are presented in Table 4.
These analyses provide a much more subtle image of the
features included in the MANOVA. We will now first
discuss the results on the three speech features (i.e., SD F0,
intensity I ; and energy E) and, subsequently, the ECG
feature HRV.
SD F0 by itself had little predictive power, and even
with one additional factor included, no strong results were
found. When both environment and the personality trait
neuroticism were taken into account, an effect was found
for the VA model; see Table 4. This effect can be mainly
attributed to the dimension valence, for which SD F0 was
sensitive, when two factors were included; see Table 4. For
the dimension arousal, with two levels to distinguish, no
effect was found.
I showed to have an excellent predictive power and was
able to explain almost all variance with 98% for the VA
model and both of its dimensions; Table 4. Also strong
effects were found on the VA model and its dimension
when the environment and the personality trait were taken
into account. However, these effects are not even close to
the magnitude of the effects found when these factors were
not taken into account. So, the environment, personality
traits, and gender seem to have little influence, if any, on
the intensity of speech as indicator for valence and arousal.
The feature E proved to be a good indicator for the
dimension arousal of the VA model; see Table 4. Analysis
showed that additional factors were of little influence on
this effect. In addition, an effect was found on the VA
model when both the environment and gender were taken
into account; however, this was only marginally below the
threshold of reporting. So, E seems to be a good and robust
indicator for experienced valence.
The ECG feature HRV is frequently used as an indicator
for emotions. In the perspective of the VA model, it has
Table 4 Results on the
repeated measures ANOVAs on
the valence–arousal (VA) model
and its distinct dimensions
The threshold for reporting
results was p B .010
V A E PN PE G Specification of effect
SD F0
• • • F(2,40) = 6.136, p = .009, g2 = .235
• • • F(2,40) = 6.327, p = .008, g2 = .240
• • • F(2,40) = 8.135, p = .010, g2 = .289
• • • • F(2,40) = 5.924, p = .010, g2 = .229
Intensity
• F(2,40) = 817.149, p \ .001, g2 = .976
• • F(2,40) = 13.677, p \ .001, g2 = .406
• F(1,20) = 1095.287, p \ .001, g2 = .982
• • F(2,40) = 1060.802, p \ .001, g2 = .981
• • • F(2,40) = 52.611, p \ .001, g2 = .341
• • • F(2,40) = 63.491, p \ .001, g2 = .384
Energy
• F(1,20) = 24.123, p \ .001, g2 = .547
• • • • F(2,40) = 5.254, p = .009, g2 = .208
HRV
• • • F(2,40) = 6.872, p = .005, g2 = .256
• • • F(2,40) = 9.463, p = .001, g2 = .321
• • • F(2,40) = 6.354, p = .007, g2 = .241
• • • F(1,20) = 8.493, p = .009, g2 = .298
• • • F(1,20) = 8.772, p = .008, g2 = .305
• • • • F(2,40) = 7.426, p = .004, g2 = .271
• • • • F(2,40) = 9.736, p = .001, g2 = .327
Pers Ubiquit Comput (2013) 17:53–67 61
123
been reported to indicate both the experienced valence and
the experienced arousal. These results are confirmed by the
current study; see Table 4. However, for the VA model, as
well as for its distinct dimensions, the factors environment,
the personality trait neuroticism, and gender proved to be
of influence. In contrast with the speech features, the power
of HRV as indicator for the VA model was only unveiled
when these factors were included in the ANOVA; see
Table 4.
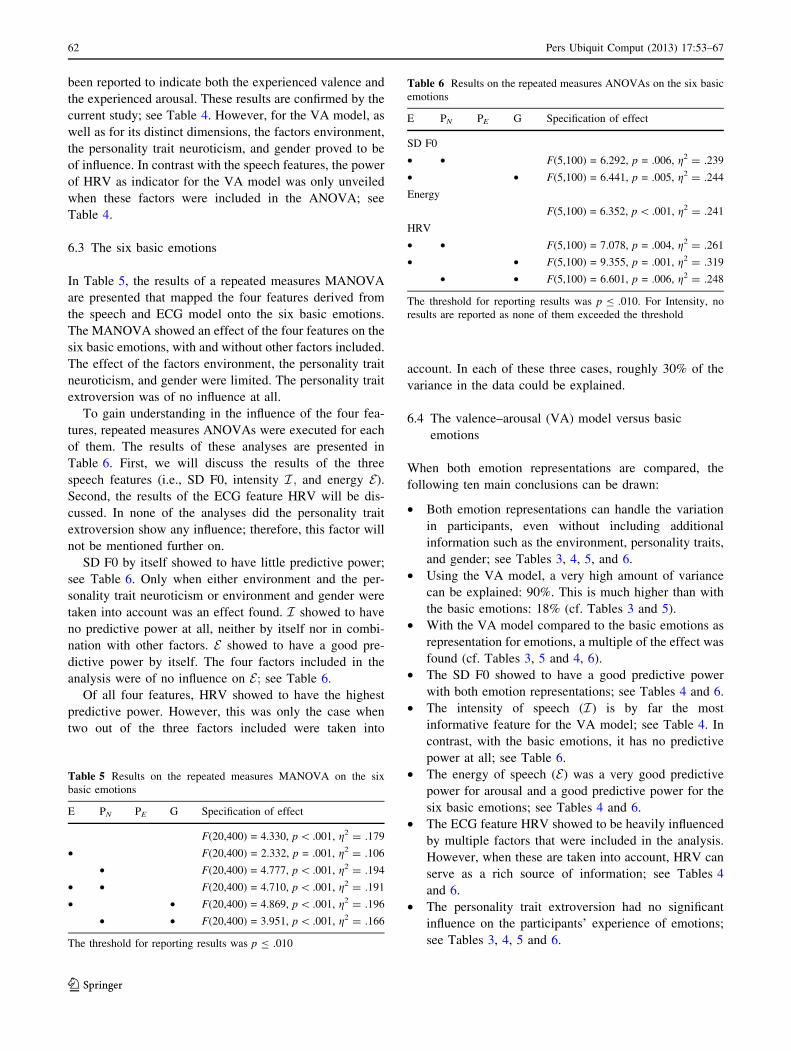
6.3 The six basic emotions
In Table 5, the results of a repeated measures MANOVA
are presented that mapped the four features derived from
the speech and ECG model onto the six basic emotions.
The MANOVA showed an effect of the four features on the
six basic emotions, with and without other factors included.
The effect of the factors environment, the personality trait
neuroticism, and gender were limited. The personality trait
extroversion was of no influence at all.
To gain understanding in the influence of the four fea-
tures, repeated measures ANOVAs were executed for each
of them. The results of these analyses are presented in
Table 6. First, we will discuss the results of the three
speech features (i.e., SD F0, intensity I ; and energy E).
Second, the results of the ECG feature HRV will be dis-
cussed. In none of the analyses did the personality trait
extroversion show any influence; therefore, this factor will
not be mentioned further on.
SD F0 by itself showed to have little predictive power;
see Table 6. Only when either environment and the per-
sonality trait neuroticism or environment and gender were
taken into account was an effect found. I showed to have
no predictive power at all, neither by itself nor in combi-
nation with other factors. E showed to have a good pre-
dictive power by itself. The four factors included in the
analysis were of no influence on E; see Table 6.
Of all four features, HRV showed to have the highest
predictive power. However, this was only the case when
two out of the three factors included were taken into
account. In each of these three cases, roughly 30% of the
variance in the data could be explained.
6.4 The valence–arousal (VA) model versus basic
emotions
When both emotion representations are compared, the
following ten main conclusions can be drawn:
• Both emotion representations can handle the variation
in participants, even without including additional
information such as the environment, personality traits,
and gender; see Tables 3, 4, 5, and 6.
• Using the VA model, a very high amount of variance
can be explained: 90%. This is much higher than with
the basic emotions: 18% (cf. Tables 3 and 5).
• With the VA model compared to the basic emotions as
representation for emotions, a multiple of the effect was
found (cf. Tables 3, 5 and 4, 6).
• The SD F0 showed to have a good predictive power
with both emotion representations; see Tables 4 and 6.
• The intensity of speech (I ) is by far the most
informative feature for the VA model; see Table 4. In
contrast, with the basic emotions, it has no predictive
power at all; see Table 6.
• The energy of speech (E) was a very good predictive
power for arousal and a good predictive power for the
six basic emotions; see Tables 4 and 6.
• The ECG feature HRV showed to be heavily influenced
by multiple factors that were included in the analysis.
However, when these are taken into account, HRV can
serve as a rich source of information; see Tables 4
and 6.
• The personality trait extroversion had no significant
influence on the participants’ experience of emotions;
see Tables 3, 4, 5 and 6.
Table 5 Results on the repeated measures MANOVA on the six
basic emotions
E PN PE G Specification of effect
F(20,400) = 4.330, p \ .001, g2 = .179
• F(20,400) = 2.332, p = .001, g2 = .106
• F(20,400) = 4.777, p \ .001, g2 = .194
• • F(20,400) = 4.710, p \ .001, g2 = .191
• • F(20,400) = 4.869, p \ .001, g2 = .196
• • F(20,400) = 3.951, p \ .001, g2 = .166
The threshold for reporting results was p B .010
Table 6 Results on the repeated measures ANOVAs on the six basic
emotions
E PN PE G Specification of effect
SD F0
• • F(5,100) = 6.292, p = .006, g2 = .239
• • F(5,100) = 6.441, p = .005, g2 = .244
Energy
F(5,100) = 6.352, p \ .001, g2 = .241
HRV
• • F(5,100) = 7.078, p = .004, g2 = .261
• • F(5,100) = 9.355, p = .001, g2 = .319
• • F(5,100) = 6.601, p = .006, g2 = .248
The threshold for reporting results was p B .010. For Intensity, no
results are reported as none of them exceeded the threshold
62 Pers Ubiquit Comput (2013) 17:53–67
123
• Gender has some influence, although limited; see
Tables 4 and 6. For the speech signal, this could be
partly explained by the normalization of the signal.
• Although approached from another angle, both emotion
representations as treated in this article share many
characteristics. This is mainly because a discrete
representation of the VA model was used that can
distinguish six compounds, similar to the six basic
emotions.
As is illustrated by the current study, the representation
of emotions remains a topic of debate; see also Sects. 2 and
3. In practice, both discrete basic emotions and dimen-
sional models are applied [18, 27, 33, 66]. This study
compared these two representations. Data of the current
study suggest that the VA model is most appropriate, as the
explained variance is much higher than with the basic
emotions: 90% versus 18%. As Eerola and Vuoskoski [27]
state, the resolution of the discrete and categorical models
is poorer. Moreover, current results suggest that there is no
such thing as a basic emotion (cf. [33]). The discrepancy in
explained variance of the present analyses (see Tables 3, 4,
5, 6) can be attributed to the variance of the stimuli within
one category of one basic emotion.
With both models of emotion, many interaction effects
have been reported in the accompanying sections, in par-
ticular in relation to HRV. However, even twice as many
effects would have been reported if a less sharp, more loose
threshold for reporting results had been taken; for example,
p B .050. More than anything else, this illustrates the
complexity of people and their emotional state. Moreover,
more than a choice for one of both emotion models, the
current data suggest that a holistic model would be most
appropriate. This also explains the variation in results
reported in the literature, in particular in research that goes
from laboratory to life [99]. Despite its drawbacks, studies
that aim to bridge this gap and take into account multiple
factors should be encouraged. With the current study, such
an attempt has been made; however, as the data illustrate,
many more are needed.
7 Discussion
This section will discuss the results presented in the pre-
vious section further and relate them to the current state-of-
the-art research. As was described in the introduction (Sect.
1), this research features five key issues, namely: (1) hybrid
(i.e., speech ? biosignals) affective computing, (2) mod-
eling emotion, (3) including environment (or context), (4)
taking people’s personality into account, and (5) unveiling
the possible importance of demographic information. Each
of the these key issues will be discussed in this section.
Next, a brief general discussion will be provided. We will
end this article with some conclusions.
7.1 The five issues under investigation
Nowadays, not only speech and computer vision but also
biosignals such as ECG can be applied completely unob-
trusively [2, 23, 37, 58, 64, 75, 77, 106, 110]. Speech and
biosignals are par excellence suitable for personalized and
ubiquitous emotion-aware computing technology. How-
ever, surprisingly, this combination has hardly been
explored; except for the author’s own work [97], the only
work the author is acquainted with that applied this com-
bination is that of Kim et al. [41, 42, 44, 45]. Processing
both signals in parallel can, however, be done conve-
niently, as is illustrated by this study; see also Fig. 2,
and provides a potentially rich source of complementary
information. This was confirmed by the analyses presented
in the previous section; see also Tables 3, 4, 5 and 6. True
bimodal (or hybrid) including biosignals and either speech
or vision-based techniques should be explored more often,
despite the various methodological and technical hurdles
that need to be taken for its execution. Moreover, without
any doubt, trimodal (i.e., biosignals, speech, and vision-
based) affective computing would also be fruitful.
To ensure the correct assessment of the experienced
emotions of people, the IAPS set was used in the current
research [18, 52, 66]. Throughout the years, IAPS has
become a ground truth for emotion research, as it is
repeatedly well validated. Since the representation of
emotions is still a topic of debate, both the dimensional VA
model and the categorical basic emotions were employed,
using the same set of IAPS pictures [52, 66]. This enabled a
one-on-one comparison between both emotion representa-
tions [18, 27, 33, 66, 84]. Although the various represen-
tations of emotions are frequently discussed, it is rare that
two (or more) models are mapped upon affective signals
(cf. [97]). However, par excellence, the setup of the current
research facilitated this. The results, as discussed in the
previous section, support both models. However, more
convincing effects have been found for the dimensional
VA model. Although further studies should be conducted
on the mapping of affective computing techniques upon
models of emotion, the results of the current study provide
a clear indication.
That context plays its role in human functioning (e.g.,
information processing) is generally accepted. However,
how to operationalize such an abstract concept? Moreover,
is context not different for us all (e.g., because it depends
on our memories)? To enable a feasible operationalization
of the concept context, it was brought down to the concept
environment. The same study was conducted in two envi-
ronments. Half of the participants participated in a living-
Pers Ubiquit Comput (2013) 17:53–67 63
123
room setting and half of them participated in an office
setting. This enabled a comparison between both settings.
Both repeated measures MANOVAs (see Tables 3, 5)
showed a (very) sharp decline in power and explained
variance when environment was taken into account as a
factor. This implies that including environment as a factor
introduces noise instead of an additional source of infor-
mation that can explain the variance in the data. However,
the (univariate) ANOVAs, with both emotion representa-
tions (a separate one for each of the four features), provide
another point of view. With these analyses, environment
did help to unveil emotions. This suggests that the com-
bination of features chosen for this study can handle the
influence of the environment (or context) excellently. This
stresses the complementary characteristics of the features
chosen, as was already claimed earlier on in this article. In
parallel, it identifies the influence environments do have on
physiological responses to emotions. Follow-up research
should explore this intriguing finding further.
The personality traits neuroticism and extroversion, both
known to influence the experience of emotions [21, 62, 65,
67, 97], were assessed to determine their relation to the
affective state of the participants. Independent of the
emotion representation chosen, the personality trait extro-
version has shown to be of hardly any influence. This is in
line with an earlier study by the author [97], but deviates
from other literature [21, 62, 65]. In contrast, the person-
ality trait neuroticism has shown to be of influence, with
both emotion representations. However, its influence
depended heavily on the emotion representation chosen.
With the dimensional VA model, the repeated measures
MANOVA (see Table 3) showed a (very) sharp decline in
power and explained variance when environment was
taken into account as a factor. As with the environment,
this implies that including the personality trait neuroticism
as a factor introduces noise instead of an additional source
of information that can explain the variance in the data. In
contrast, with the six basic emotions, the repeated measures
MANOVA (see Table 5) showed a small increase in both
power and explained variance when environment was
taken into account as a factor. The (univariate) ANOVAs,
of both representations (see Tables 4, 6) reveal that the
personality trait neuroticism is of influence on the distinct
features, however, only in combination with either the
environment, gender, or both. So, personality traits seem to
play their role in our emotional experiences and their
reflection in our speech and ECG; however, it is a complex
interplay of factors, which may be expected to be chal-
lenging to unveil.
Various demographic information were gathered on the
participants, namely: level of education, age, nationality,
and gender. The possible effect of these factors was
assessed with preliminary analyses. These analyses have
not been reported for reasons of brevity. The preliminary
analysis showed the absence of an effect due to the level of
education; hence, this factor was excluded from further
analysis. However, this lack of effect can be explained by
the small variance in level of education between the par-
ticipants. Age influenced neither the reported emotions nor
the physiological signals accompanying them. This is in
contrast with some of the literature that states that age is of
importance [49]. This is even specifically shown for car-
diovascular reactivity on psychological stress [55, 93]. This
lack of effect can be explained by the skewed distribution,
as well as by the limited variance of the age of the par-
ticipants; see also Sect. 4. The nationality of the partici-
pants was heavily skewed towards Dutch: 26 of the 32
participants on which the analyses were conducted did
have a Dutch nationality. Therefore, the choice was made
to divide the participants having a Dutch and non-Dutch
nationality. However, this analysis did not reveal any effect
on this factor. Nationality was included as a representation
of both cultural and ethnical factors. Both these factors
have been reported to be of influence on physiological
responses in relation to emotions [87]. More than anything
else, it should be concluded that this research was not
optimized for the assessment of this factor, which explains
the absence of any effect. The gender of the 40 participants
was perfectly balanced; so, in contrast with level of edu-
cation and age, for this factor, a maximal variance was
obtained. In line with the literature, gender was shown to
be of effect [54, 93]. However, this effect was marginal,
and additional research is needed to unveil the exact
influence of gender on the relation between biosignals and
speech and emotions.
7.2 Conclusion
The results of this study show that the three speech mea-
sures (i.e., SD F0, I and E) in combination with only HRV
already provide a reliable, robust, and unobtrusive method
to reflect user’s affective state. Of course, many more
features could be derived from both the speech signal [29,
86, 92, 105, 109] and the ECG [3, 15, 18, 71, 81]. How-
ever, this was not the aim of this study and also appeared to
be unnecessary. The current results are already excellent
with 90% explained variance for the VA model (see Sect.
6), which also challenges the claim that personalized pro-
cessing of such signals is required.
The debate on how to define emotions remains intrigu-
ing, as it is so close to our everyday lives. However, for
personal and ubiquitous computing technology, practical
considerations should also be taken into account. The
processing scheme introduced in this study enables the
unobtrusive assessment of affect. In practice, this can be
achieved through either sensor networks or wearable
64 Pers Ubiquit Comput (2013) 17:53–67
123
sensors; for example, as embedded in electronic textiles
[106, 110]. Both of these branches of engineering have
flourished since the start of the current century. One can
only conclude that this technology is rapidly maturing [2,
23, 64, 75] and, consequently, is applied in a variety of
domains; for example, health monitoring [1, 23, 37, 64, 75,
106, 110]. While the underlying technology is becoming
both more miniaturized and more robust [37, 64, 75],
various probes have been introduced. Generic, ambulatory,
wearable ECG systems [58, 77], empathic chairs [4], and
digital plasters [106] have been introduced. It seems that
sensor networks’ and wearable sensors’ main drawbacks is
that of many wireless applications, such as your laptop:
battery life [1, 37, 64, 106, 110].
All in all, ubiquitous computing, following AI, has to
embrace emotion as an essential element in pursuing its
next level of development. It is surprising that the combi-
nation of speech and biosignals has hardly been used
before to unveil people’s emotions. Par excellence, this
combination of signals has been shown to be suitable for
unobtrusive emotion recognition. This having been said,
the current study provides a significant leap forward in
bringing personal ubiquitous emotion-aware computing to
practice.
Acknowledgments The author gratefully acknowledges the support
of the BrainGain Smart Mix Programme of the Netherlands Ministry
of Economic Affairs and the Netherlands Ministry of Education,
Culture and Science. Marleen H. Schut (formerly Radboud University
Nijmegen, Nijmegen, the Netherlands) is gratefully acknowledged for
her contribution to the research described here. It was of great plea-
sure to work with Marleen. The two anonymous reviewers and two
colleagues, who all provided valuable comments on this article, are
also gratefully acknowledged. Last, the author thanks Lynn Packwood
(Human Media Interation (HMI), University of Twente) for her
careful proofreading.
Open Access This article is distributed under the terms of the
Creative Commons Attribution Noncommercial License which per-
mits any noncommercial use, distribution, and reproduction in any
medium, provided the original author(s) and source are credited.
References
1. Alemdar H, Ersoy C (2010) Wireless sensor networks for
healthcare: a survey. Comput Netw 54(15):2688–2710
2. Amft O, Lukowicz P (2009) From backpacks to smartphones:
past, present, and future of wearable computers. IEEE Pervasive
Comput 8(3):8–13
3. Appelhans BM, Luecken LJ (2006) Heart rate variability as an
index of regulated emotional responding. Rev Gen Psychol
10(3):229–240
4. Arnrich B, Setz C, Marca RL, Troster G, Ehlert U (2010) What
does your chair know about your stress level? IEEE Trans Inf
Technol Biomed 14(2):207–214
5. Bailenson JN, Pontikakis ED, Mauss IB, Gross JJ, Jabon ME,
Hutcherson CA, Nass C, John O (2008) Real-time classification
of evoked emotions using facial feature tracking and physio-
logical responses. Int J Hum Comput Stud 66(5):303–317
6. Barakova EI, Lourens T (2010) Expressing and interpreting
emotional movements in social games with robots. Pers Ubiq-
uitous Comput 14(5):457–467
7. Barrett LF, Kensinger EA (2010) Context is routinely encoded
during emotion perception. Psychol Sci 21(4):595–599
9. Boersma P (1993) Accurate short-term analysis of the funda-
mental frequency and the harmonics-to- noise ratio of a sampled
sound. In: Proceedings of the Institute of Phonetic Sciences,
University of Amsterdam, vol 17, pp 97–110
10. Boersma PPG, Weenink DJM (2006) Praat 4.0.4. URL:
http://www.praat.org [Last accessed on June 22, 2011]
11. Borders A, Liang CTH (2011) Rumination partially mediates the
associations between perceived ethnic discrimination, emotional
distress, and aggression. Cult Divers Ethn Minor Psychol 17(2):
125–133
12. Bose R (2009) Sensor networks motes, smart spaces, and
beyond. IEEE Pervasive Comput 8(3):84–90
13. Bradley MM, Lang PJ (1994) Measuring emotion: the self-
assessment manikin and the semantic differential. J Behav Ther
Exp Psychol 25(1):49–59
14. Cacioppo JT, Berntson GG (1994) Relationship between atti-
tudes and evaluative space: a critical review, with emphasis on
the separability of positive and negative substrates. Psychol Bull
115(3):401–423
15. Cacioppo JT, Tassinary LG, Berntson GG (2007) Handbook of
psychophysiology. 3rd edn. Cambridge University Press, New York
16. Carrera P, Oceja L (2007) Drawing mixed emotions: sequential
or simultaneous experiences?. Cogn Emot 21(2):422–441
17. Casson AJ, Abd SJM, Smith DCY, Rodriguez-Villegas JSDE
(2010) Wearable electroencephalography. IEEE Eng Med Biol
Mag 29(3):44–56
18. Christie IC, Friedman BH (2004) Autonomic specificity of
discrete emotion and dimensions of affective space: a multi-
variate approach. Int J Psychophysiol 51(2):143–153
19. Collet C, Vernet-Maury E, Delhomme G, Dittmar A (1997)
Autonomic nervous system response patterns specificity to basic
emotions. J Auton Nervous Syst 62(1–2):45–57
20. Cook DJ, Augusto JC, Jakkula VR (2009) Ambient intelligence:
technologies, applications, and opportunities. Pervasive Mob
Comput 5(4):277–298
21. Costa PT Jr, McCrae RR (1980) Influence of extraversion and
neuroticism on subjective well-being: happy and unhappy peo-
ple. J Personal Soc Psychol 38(4):668–678
22. Cowie R, Douglas-Cowie E, Tsapatsoulis N, Votsis G, Kollias
S, Fellenz W, Taylor JG (2001) Emotion recognition in human–
computer interaction. IEEE Signal Process Mag 18(1):32–80
23. Cutmore TRH, James DA (2007) Sensors and sensor systems for
psychophysiological monitoring: a review of current trends.
J Psychophysiol 21(1):51–71
24. Dalgleish T, Dunn BD, Mobbs D (2009) Affective neuroscience:
past, present, and future. Emot Rev 1(4):355–368
25. Davidson RJ, Scherer KR, Hill Goldsmith H (2003) Handbook
of affective sciences. Oxford University Press, New York
8. de Berg M, van Kreveld M, Overmars M (2008) Computational
geometry: algorithms and applications. 3rd edn. Springer, Berlin
26. Decety J, Ickes W (2009) The social neuroscience of empathy.
Social neuroscience series. A Bradford Book, The MIT Press,
Cambridge
27. Eerola T, Vuoskoski JK (2011) A comparison of the discrete and
dimensional models of emotion in music. Psychol Music
39(1):18–49
28. Ekman P, Levenson RW, Friesen WV (1983) Autonomic ner-
vous system activity distinguishes between emotions. Science
221(4616):1208–1210
Pers Ubiquit Comput (2013) 17:53–67 65
123
29. El Ayadi M, Kamel MS, Karray F (2011) Survey on speech
emotion recognition: features, classification schemes, and dat-
abases. Patt Recognit 44(3):572–587
30. Eysenck HJ, Eysenck SBG (1991) Manual of the Eysenck per-
sonality scales (EPS adult). Hodder and Stoughton, London
31. Fagerberg P, Stahl A, Hook K (2004) eMoto: emotionally
engaging interaction. Pers Ubiquitous Comput 8(1):377–381
32. Fairclough SH (2009) Fundamentals of physiological comput-
ing. Interact Comput 21(1–2):133–145
33. Fontaine JRJ, Scherer KR, Roesch EB, Ellsworth P (2007) The
world of emotion is not two-dimensional. Psychol Sci
18(12):1050–1057
34. Gershenfeld N, Krikorian R, Cohen D (2004) The Internet of
things. Sci Am 291(4):76–81
35. Grossmann I, Ellsworth PC, Hong Y (2011) Culture, attention,
and emotion. J Exp Psy: General. doi:10.1037/a0023817
36. Gunes H, Piccardi M (2009) Automatic temporal segment
detection and affect recognition from face and body display.
IEEE Trans Syst Man Cybern B Cybern 39(1):64–84
37. Hao Y, Foster R (2008) Wireless body sensor networks for
health-monitoring applications. Physiol Meas 29(11):R27–R56
38. Izard CE et al (2010) Special section: on defining emotion.
Emot Rev 2(4):363–385
39. Kamarck TW, Lovallo WR (2003) Cardiovascular reactivity to
psychological challenge: conceptual and measurement consid-
erations. Psychosom Med 65(1):9–21
40. Keltikangas JK, Jarvinen L (2001) Intraindividual analysis of
instantaneous heart rate variability. Psychophysiology 38(4):
659–668
41. Kim J (2007) Bimodal emotion recognition using speech and
physiological changes, I-Tech Education and Publishing,
Vienna, chap 15, pp 265–280
42. Kim J, Andre E (2006) Emotion recognition using physiological
and speech signal in short-term observation. Lect Notes Comput
Sci (Percept Interact Technol) 4021:53–64
43. Kim J, Andre E (2008) Emotion recognition based on physio-
logical changes in music listening. IEEE Trans Pattern Anal
Mach Intell 30(12):2067–2083
44. Kim J, Andre E, Rehm M, Vogt T, Wagner J (2005) Integrating
information from speech and physiological signals to achieve
emotional sensitivity. In: Proceedings of the 9th European
conference on speech communication and technology, L2F—
Spoken Language Systems Laboratory, Lisboa, pp 809–812
45. Kim J, Andre E, Vogt T (2009) Towards user-independent
classification of multimodal signals. In: Proceedings of the IEEE
3rd international conference on affective computing and intel-
ligent interaction, ACII, IEEE Press, Amsterdam, vol 1,
pp 722–728
46. Kleiger RE, Bigger JT, Bosner MS, Chung MK, Cook JR,
Rolnitzky LM, Steinman R, Fleiss JL (1991) Stability over time
of variables measuring heart rate variability in normal subjects.
Am J Cardiol 68(6):626–630
47. Kleinsmith A, Bianchi-Berthouze N, Steed A (2011) Automatic
recognition of non-acted affective postures. IEEE Trans Syst
Man Cybern B Cybern 41(4):1027–1038
48. Kopetz H (2011) Real-time systems: design principles for dis-
tributed and embedded applications, 2nd edn. Real-Time Sys-
tems Series, Springer Science?Business Media, LCC, New
York
49. Kring AM, Gordon AH (1998) Sex differences in emotion:
expression, experience, and physiology. J Pers Soc Psychol
74(3):686–703
50. Krumm J (2010) Ubiquitous computing fundamentals. Chapman
& Hall, CRC Press, Boca Raton
51. Landis C, Dewick HN (1929) The electrical phenomena of the
skin (psychogalvanic reflex). Psychol Bull 26(2):64–119
52. Lang PJ, Bradley MM, Cuthbert BN (2008) International
affective picture system (IAPS): affective ratings of pictures and
instruction manual. Tech. Rep. A-8, University of Florida,
Gainesville
53. Lemov RM (2005) World as laboratory: experiments with mice,
mazes, and men. Hill and Wang, New York
54. Levenson RW, Ruef AM (1992) Empathy: a physiological
substrate. J Pers Soc Psychol 63(2):234–246
55. Levenson RW, Carstensen LL, Friesen WV, Ekman P (1991)
Emotion, physiology, and expression in old age. Psychol Aging
6(1):28–35
56. Levenson RW, Ekman P, Heider K, Friesen WV (1992) Emo-
tion and the autonomous nervous system activity in the Mina-
ngkabau of West Sumatra. J Pers Soc Psychol 62(6):972–988
57. Lewis M, Haviland-Jones JM, Barrett LF (2008) Handbook of
emotions. 3rd edn. The Guilford Press, New York
58. Liu X, Zheng Y, Phyu M, Zhao B, Je M, Yuan X (2011) Mul-
tiple functional ECG signal is processing for wearable applica-
tions of long-term cardiac monitoring. IEEE Trans Biomed Eng
58(2):380–389
59. Llabre MM, Spitzer SB, Saab PG, Ironson GH, Schneiderman N
(1991) The reliability and specificity of delta versus residualized
change as a measure of cardiovascular reactivity to behavioral
challenges. Psychophysiology 28(6):701–711
60. Logothetis NK (2008) What we can do and what we cannot do
with fMRI. Nature 453(7197):869–878
61. Lourens T, van Berkel R, Barakova E (2010) Communicating
emotions and mental states to robots in a real time parallel
framework using Laban movement analysis. Robot Auton Syst
58(12):1256–1265
62. Lucas RE, Baird BM (2004) Extraversion and emotional reac-
tivity. J Pers Soc Psychol 86(3):473–485
63. Malik M, Camm AJ (1995) Heart rate variability. Futura Pub-
lishing Company, Inc., Armonk, NY, USA
64. Martınez JF, Familiar MS, Corredor I, Garcıa AB, Bravo S,
Lopez L (2011) Composition and deployment of e-Health ser-
vices over Wireless Sensor Networks. Math Comput Model
53(3–4):485–503
65. Matzler K, Faullant R, Renzl B, Leiter V (2005) The relation-
ship between personality traits (extraversion and neuroticism),
emotions and customer self-satisfaction. Innov Mark 1(2):32–39
66. Mikels JA, Fredrickson BL, Larkin GR, Lindberg CM, Maglio
SJ, Reuter-Lorenz PA (2005) Emotional category data on ima-
ges from the international affective picture system. Behav Res
Methods 37(4):626–630
67. Millon T, Lerner MJ (2003) Personality and social psychology,
handbook of psychology. vol 5, Wiley, Hoboken
68. Miyamoto Y, Uchida Y, Ellsworth PC (2001) Culture and mixed
emotions: co-occurrence of positive and negative emotions in
Japan and the United States. Emotions 10(3):404–415
69. Na J, Grossmann I, Varnum MEW, Gonzalez R, Kitayama S,
Nisbett RE (2010) When cultural differences are not reducible to
individual differences. Proc Nat Acad Sci USA 107(14):
6192–6197
70. Nelson BJ, Kaliakatsos IK, Abbott JJ (2010) Microrobots for
minimally invasive medicine. Ann Rev Biomed Eng 12:55–85
71. Neumann SA, Waldsein SR (2001) Similar patterns of cardio-
vascular response during emotional activation as a function of
affective valence and arousal and gender. J Psychosom Res
50(5):245–253
72. Nevin JA, Reynolds GS (1973) The study of behavior: learning,
motivation, emotion, and instinct. Scott, Foresman and Com-
pany, Glenview
73. Niedenthal PM, Augustinova M, Rychlowska M (2010) Body
and mind: Zajonc’s (re)introduction of the motor system to
emotion and cognition. Emot Rev 2(4):340–347
66 Pers Ubiquit Comput (2013) 17:53–67
123
74. Olejnik S, Li J, Supattathum S, Huberty CJ (1997) Multiple
testing and statistical power with modified Bonferroni proce-
dures. J Educ Behav Stat 22(4):389–406
75. Pantelopoulos A, Bourbakis NG (2010) A survey on wearable
sensor-based systems for health monitoring and prognosis. IEEE
Trans Syst Man Cybern C Appl Rev 40(1):1–12
76. Pantic M, Rothkrantz LJM (2003) Toward an affect-sensitive
multimodal human–computer interaction. Proc IEEE 91(9):
1370–1390
77. Pawar T, Anantakrishnan NS, Chaudhuri S, Pawar TD, Du-
ttagupta S (2008) Impact of ambulation in wearable-ECG. Ann
Biomed Eng 36(9):1547–1557
78. Petridis S, Pantic M (2011) Audiovisual discrimination between
speech and laughter: why and when visual information might
help. IEEE Trans Multimed 13(2):216–234
79. Picard RW (1997) Affective computing. MIT Press, Boston
80. Picard RW, Vyzas E, Healey J (2001) Toward machine emo-
tional intelligence: analysis of affective physiological state.
IEEE Trans Pattern Anal Mach Intell 23(10):1175–1191
81. Rainville P, Bechara A, Naqvi N, Damasio AR (2006) Basic
emotions are associated with distinct patterns of cardiorespira-
tory activity. Int J Psychophysiol 61(1):5–18
82. Regier T, Kay P (2009) Language, thought, and color: whorf
was half right. Trends Cogn Sci 13(10):411–454
83. Richter D, Dietzel C, Kunzmann U (2010) Age differences in
emotion recognition: the task matters. J Gerontol Psy Sci
66B(1):48–55
84. Russell JA (2003) Core affect and the psychological construc-
tion of emotion. Psychol Rev 110(1):145–172
85. Rutkowski TM, Tanaka T, Cichocki A, Erickson D, Cao J,
Mandic DP (2011) Interactive component extraction from fEEG,
fNIRS and peripheral biosignals for affective brain-machine
interfacing paradigms. Comput Hum Behav 27(5):1512–1518
86. Schuller B, Batliner A, Steidl S, Seppi D (2011) Recognising
realistic emotions and affect in speech: state of the art and lessons
learnt from the first challenge. Speech Commun 27(5):1512–1518
87. Shen BJ, Stroud LR, Niaura R (2004) Ethnic differences in
cardiovascular responses to laboratory stress: a comparison
between Asian and white Americans. Int J Behav Med 11(3):
181–186
88. Skinner BF (1971) Beyond freedom and dignity. Alfred A.
Knopf Inc., New York
89. Stead L, Goulev P, Evans C, Mamdani E (2004) The emotional
wardrobe. Pers Ubiquitous Comput 8(3–4):282–290
90. Stemmler G, Wacker J (2010) Personality, emotion, and indi-
vidual differences in physiological responses. Biol Psychol
83(3):541–551
91. Tan DS, Nijholt A (2010) Brain-Computer Interfaces: Applying
our minds to human-computer interaction. Human–computer
interaction series. Springer, London
92. Tawari A, Trivedi MM (2010) Speech emotion analysis: explor-
ing the role of context. IEEE Trans MultiMed 12(6):502–509
93. Uchino BN, Uno D, Holt-Lunstad J, Flinders JB (1999) Age-
related differences in cardiovascular reactivity during acute
psychological stress in men and women. J Gerontol Psychol Sci
54B(6):P339–P346
94. van den Broek EL et al (2009/2010/2011) Prerequisites for
Affective signal processing (ASP)—Parts I–V. In: Fred A, Filipe
J, Gamboa H (eds) BioSTEC 2009/2010/2011: Proceedings of
the international joint conference on biomedical engineering
systems and technologies, INSTICC Press, Porto, Portugal,
Valencia, Spain, Rome, Italy
95. van den Broek EL (2010) Robot nannies: future or fiction?.
Interact Stud 11(2):274–282
96. van den Broek EL, Westerink JHDM (2009) Considerations for
emotion-aware consumer products. Appl Ergon 40(6):1055–
1064
97. van den Broek EL, Schut MH, Westerink JHDM, Tuinenbreijer
K (2009) Unobtrusive sensing of emotions (USE). J Ambient
Intell Smart Env 1(3):287–299
98. van den Broek EL, Lisy V, Janssen JH, Westerink JHDM, Schut
MH, Tuinenbreijer K (2010) Affective man–machine interface:
unveiling human emotions through biosignals, communications
in computer and information science, vol 52, Springer, Berlin,
pp 21–47
99. van den Broek EL, Nijholt A, Westerink JHDM (2010)
Unveiling affective signals. In: Barakova E, de Ruyter B, Spink
A (eds) ACM proceedings of measuring behavior 2010: selected
papers from the 7th international conference on methods and
techniques in behavioral research, ACM, New York, Eindhoven,
The Netherlands, Article no. a6
100. van Drunen A, van den Broek EL, Spink AJ, Heffelaar T (2009)
Exploring workload and attention measurements with uLog
mouse data. Behav Res Methods 41(3):868–875
101. Wang L, Gu T, Tao X, Chen H, Lu J (2011) Recognizing multi-
user activities using wearable sensors in a smart home. Perva-
sive Mob Comput 7(3):287–298
102. Weigert AJ (1991) Mixed emotions: certain steps toward
understanding ambivalence. SUNY series in the sociology of
emotions. State University of New York Press, Albany
103. Whitehill J, Littlewort G, Fasel I, Bartlett M, Movellan J (2009)
Towards practical smile detection. IEEE Trans Pattern Anal
Mach Intell 31(11):2106–2111
104. Whittle S, Yucel M, Yap MBH, Allen NB (2011) Sex differ-
ences in the neural correlates of emotion: evidence from neu-
roimaging. Biol Psychol 87(3):319–333
105. Wu S, Falk TH, Chan WY (2011) Automatic speech emotion
recognition using modulation spectral features. Speech Commun
53(5):768–785
106. Xiao S, Dhamdhere A, Sivaraman V, Burdett A (2009) Trans-
mission power control in body area sensor networks for
healthcare monitoring. IEEE J Sel Areas Commun 27(1):37–48
107. Xiao R, Zhao Q, Zhang D, Shi P (2011) Facial expression
recognition on multiple manifolds. Pattern Recognit 44(1):107–
116
108. Young MA (1993) Supplementing tests of statistical signifi-
cance: variation accounted for. J Speech Hear Res 36(4):644–
656
109. Zeng Z, Pantic M, Roisman GI, Huang TS (2009) A survey of
affect recognition methods: Audio, visual, and spontaneous
expressions. IEEE Trans on Pattern Anal and Mach Intell
31(1):39–58
110. Zheng N, Wu Z, Lin M, Yang LT (2010) Enhancing battery
efficiency for pervasive health-monitoring systems based onelectronic textiles. IEEE Trans Inf Technol Biomed 14(2):350–
359
Pers Ubiquit Comput (2013) 17:53–67 67
123