tyndp 2016 scenario development report... · draft methodology to build the top-down scenarios...
TRANSCRIPT

ENTSO-E AISBL • Avenue de Cortenbergh 100 • 1000 Brussels • Belgium • Tel + 32 2 741 09 50 • Fax + 32 2 741 09 51 • [email protected] • www. entsoe.eu
TYNDP 2016 Scenario Development Report
- Final after public consultation -
3 November 2015

TYNDP 2016
Scenario Development Report
ENTSO-E AISBL • Avenue de Cortenbergh 100 • 1000 Brussels • Belgium • Tel + 32 2 741 09 50 • Fax + 32 2 741 09 51 • [email protected] • www. entsoe.eu
2
1 Contents
1 Contents ................................................................................................................................. 2
2 Executive Summary ............................................................................................................... 3
3 Objective of TYNDP scenarios and visions ............................................................................ 4
How does it fit in the overall TYNDP work? ...............................................................................................4
How are these scenarios developed? ............................................................................................................5
How is it linked to the work on adequacy forecasts? ...................................................................................6
How are these scenarios linked with other available scenarios? ..................................................................6
4 Main storyline for the TYNDP2016 scenarios ......................................................................... 8
2020 Best Estimate Scenario of “Expected Progress”................................................................................12
2030 Vision 1 of “Slowest Progress” .........................................................................................................14
2030 Vision 2 of “Constrained Progress” ..................................................................................................15
2030 Vision 3 of “National Green Transition” ...........................................................................................16
2030 Vision 4 of “European Green Revolution” ........................................................................................17
5 Scenario quantification results .............................................................................................. 20
2020 Best Estimate Scenario of “Expected Progress”................................................................................20
2030 Vision 1 of “Slowest Progress” .........................................................................................................23
2030 Vision 2 of “Constrained Progress” ..................................................................................................25
2030 Vision 3 of “National Green Transition” ...........................................................................................27
2030 Vision 4 of “European Green Revolution” ........................................................................................29
General overview .......................................................................................................................................31
6 Methodologies to derive pan-European scenarios ................................................................ 36
7 Data references .................................................................................................................... 41
Fuel and CO2 prices ...................................................................................................................................41
RES capacity factors ..................................................................................................................................41
Reference interconnection capacities .........................................................................................................41
8 Next steps in the TYNDP process ........................................................................................ 42
A. Annex of top-down scenario building methodologies ............................................................ 43
Load profile update ....................................................................................................................................43
RES re-allocation .......................................................................................................................................43
Thermal optimization .................................................................................................................................45
B. Annex - Overview of stakeholder engagement ..................................................................... 46
C. Annex – Background tables .................................................................................................. 49

TYNDP 2016
Scenario Development Report
ENTSO-E AISBL • Avenue de Cortenbergh 100 • 1000 Brussels • Belgium • Tel + 32 2 741 09 50 • Fax + 32 2 741 09 51 • [email protected] • www. entsoe.eu
3
2 Executive Summary
This Scenario Development Report explores possible future situations of load and generation, interacting
with the pan-European electricity system. These scenarios will be the baseline on which TYNDP2016
projects are to be assessed in the coming year.
As in the most recent TYNDP2014, also the next TYNDP will focus on the year 2030. European ambitious
targets as set by the Council in October 2014 on renewables, energy efficiency, decarbonisation and
interconnection targets, give a stronger direction to the studies and resulting recommendations for grid
development up to 2030. It is the ambition of ENTSO-E’s TYNDP to demonstrate the need and the value of
grid infrastructure in this context, to inform decision makers and the general public, and to enable these
targets to be met. For the long-term horizon 2030, four contrasting ‘Visions’ are presented which differ in
terms of energy governance and RES ambitions. In addition a mid-term 2020 ‘best estimate scenario’ is
covered to allow grid infrastructure candidates to be valued at a mid-term horizon as well.
The new TYNDP2016 scenarios show a natural evolution compared to the earlier TYNDP2014 Visions,
taking stock of updates in national scenarios and taking a leap forward in the construction of pan-European
top-down scenarios.
The aim of this report is to provide insight in how ENTSO-E’s scenarios for TYNDP are developed,
highlight how infrastructure needs ‘are linked to choices’ in future energy policies, and to engage on
these topics in a transparent manner.
A draft version of the report was published for consultation in May and June 2015. Other stakeholder
activities guiding the finalization of this report, as well as a summary of the public consultation are
summarized in Annex of this report.
ENTSO-E finalized the TYNDP 2016 Scenario Development report with a re-run of the market models
during the summer.

TYNDP 2016
Scenario Development Report
ENTSO-E AISBL • Avenue de Cortenbergh 100 • 1000 Brussels • Belgium • Tel + 32 2 741 09 50 • Fax + 32 2 741 09 51 • [email protected] • www. entsoe.eu
4
3 Objective of TYNDP scenarios and visions
How does it fit in the overall TYNDP work?
The ENTSO-E TYNDP report provides a comprehensive and transparent overview of projects of pan-
European significance, which are all assessed against several scenarios, based on a common data set, and
with a robust CBA methodology.
During 2014 and early 2015, the work was mainly focused on identifying investment needs (presented in
the Regional Investment Plans 2015), and analysing at the same time new scenarios for project assessments
(given in this report). Based on a consulted final list of projects and scenarios, the actual assessment work
starts after summer 2015 and will be reported in a draft TYNDP report mid-2016.
The development of scenarios and the joint planning exercise performed by ENTSO-E’s members run in
parallel. Both continue from earlier TYNDP2014 work, and both are strongly interlinked; investment needs
are driven by evolutions in generation and load patterns, while a pan-European approach on generation
incentives has to take into account physical grid constraints.
The TYNDP provides four long-term scenarios (‘Visions’) for 2030, and one mid-term scenario for 2020.
The TYNDP 2030 Visions present contrasting scenarios that reflect similar boundary conditions and
storylines for every country, and which differ enough from each other to capture a realistic range of
possible future pathways. All result in different future challenges for the grids which a TYNDP grid
endeavours to accommodate. The mid-term TYNDP 2020 scenario gives a best estimate for this time
frame. The goal of the scenarios is to eventually allow TYNDP projects to be assessed across the same
range of possible futures.
The assessment of all TYNDP projects is done based on a Cost-Benefit Analysis methodology, developed
in line with Regulation (EU) 347/2013, and approved by the European Commission. The CBA approach
will be used for all projects on a mid- and long-term horizon, which are presented in this report. The CBA
methodology applicable for TYNDP2016 is the present approved version. Meanwhile work continues to
improve the methodology for future TYNDPs.
The overall two-year process of all TYNDP activities is summarized in the following graph.
FIGURE 3-1 OVERVIEW OF THE TYNDP 2016 ROADMAP, INDICATING MAIN WORK STREAMS, CONSULTATIONS (BLUE BARS) AND PUBLIC
WORKSHOPS/WEBINARS (RED STARS).

TYNDP 2016
Scenario Development Report
ENTSO-E AISBL • Avenue de Cortenbergh 100 • 1000 Brussels • Belgium • Tel + 32 2 741 09 50 • Fax + 32 2 741 09 51 • [email protected] • www. entsoe.eu
5
How are these scenarios developed?
In general terms scenarios are based on a storyline, assumptions, data collections, quality checks, pan-
European methodologies, and final market simulations to quantify energy outputs.
FIGURE 3-2 SCENARIO DEVELOPMENT PROCESS
A key strength of the ENTSO-E scenarios is that it combines the views of national plans provided via TSO
correspondents, the expertise and large variety of tools of dozens of market modelling experts, and the pan-
European perspective via elaborate scenario development methodologies. Considering a quite close time
horizon (max. 15 years) ENTSO-E scenarios are not developed as starting-from-scratch based on ideal
optimizations, but are strongly linked with both national development plans and pan-European
coordination.
Section 4 explains the storyline on which each scenario is developed. These storylines take into account
binding targets, long-term ambitions, and available technology roadmaps. Still it is important to note that
the scenarios do not aspire to give a forecast of the future, nor is there any probability attached to any of the
2030 Visions. The Visions do not have the pretext to show what some would hope the future to be like, but
rather give the full spectrum of what is considered realistic.
To build up relevant storylines and assumptions, and to finally test the acceptance of the set of scenarios,
continuous engagement with various stakeholders, regulators, policy makers, and all TSOs is essential.
Event Focus Date Material
Public workshop on
Scenario Methodology
for TYNDP 2016
Definition of the overall scenario
framework by the mean of
brainstorming in small groups
16/09/14 Presentations
Inputs from Stakeholders
during the workshop
Network Development
Stakeholder Group
meeting
Discussion of the principles to find
a mid-term best estimate scenario
10/03/15 Presentation and
outcomes
2nd public workshop on
TYNDP 2016 Scenario
Development
Draft methodology to build the top-
down scenarios
Draft results of scenario
quantification (Visions 1 and 3, and
intermediate steps of Vision 4)
11/03/15 Agenda and presentations
3rd public
workshop/webinar on
TYNDP 2016 Scenario
Development
Draft results of scenario
quantification (all scenarios)
11/06/15 Agenda and presentations

TYNDP 2016
Scenario Development Report
ENTSO-E AISBL • Avenue de Cortenbergh 100 • 1000 Brussels • Belgium • Tel + 32 2 741 09 50 • Fax + 32 2 741 09 51 • [email protected] • www. entsoe.eu
6
Public consultation on
the draft TYNDP 2016
Scenario Development
Report
Description of the storyline and
methodologies used to build the
scenarios
Draft scenario quantifications
21/05/15-
22/06/15
The main outcomes are
summarized in Annex.
FIGURE 3-3 SUMMARY OF THE PUBLIC EVENTS ORGANIZED FOR THE TYNDP 2016 SCENARIO BUILDING
How is it linked to the work on adequacy forecasts?
Deployment of grid infrastructure requires a long planning and decision horizon (typically 10 to 15 years).
Such infrastructure is central to the completion of the European Internal Electricity Market, to facilitate
increased renewable energy penetration and, at the same time, ensure pan-European adequacy. The 2030
Visions of TYNDP are used as representative and exploratory scenarios regarding generation, demand and
Pan-EU adequacy of possible futures within certain storylines. These storylines express the fundamental
uncertainty on the evolution of the energy mix and their adequacy assumptions at a long term horizon.
For adequacy studies the uncertainties are mainly related to extreme situations such as high load related to
temperature conditions, either in a present or a future power system. .The most suitable time frame to assess
generation adequacy at national and regional resolution, anticipating possible adequacy issues, is typically 5
years - 10 years (maximum) horizon, as recommended by the Electricity Coordination Group (ECG) –
subgroup on adequacy1. Within this time frame, trustable diagnoses of generation adequacy risks are
possible, by use of a sound, widely accepted and transparent methodology. Scenarios for adequacy are
‘predictive’ and designed to inform about and assess the possible risks the Pan-European system faces
regarding generation adequacy. In that sense, they are fundamentally different than the TYNDP 2030
Visions, which should be understood more as ‘exploratory’ scenarios without focus on extreme events as
cold spells, dry years, bad wind/solar years which are extremely important in the context of adequacy
assessments.
ENTSO-E is mandated to deliver a community wide grid investment plan, including a generation adequacy
assessment. To clarify the different levels of uncertainty at different time horizons, ENTSO-E has
restructured the former TYNDP and SO&AF reports. The next TYNDP2016 report will address the
scenarios used in the TYNDP project assessments (and covered in this report), while the SO&AF report as
of 2015 addresses the scenarios used for generation adequacy. A remaining key link will be the 2020 best
estimate scenario, which is introduced as the mid-term horizon for TYNDP project assessments, and which
is closely related to the bottom-up scenario B in SO&AF (see also the conclusions of the Network
Development Stakeholder Group). In addition, also the methodological elements of the next SO&AF
reports are scheduled to improve, while ENTSO-E still has the ambition to publish the report on annual
basis.
How are these scenarios linked with other available scenarios?
An issue in the use of scenarios for grid development, is the ever possible confusion when comparing
different development plans (in particular national versus pan-European). ACER’s opinion on consistency
of ten-year network development plans2 highlights the different approaches in national plans (e.g. frequency
of updates, time horizon) in which main directions are most often set in perspective of national policies. As
1 “The further ahead one assesses adequacy the greater the uncertainty. There becomes a point where the uncertainty
outweighs any information that might be learnt from the assessment in the first place. It appears from the forecast
periods utilised that this is likely to be in the range of 5 – 10 years” 2 http://www.acer.europa.eu/Official_documents/Acts_of_the_Agency/Opinions/Opinions/ACER%20Opinion%2008-
2014.pdf

TYNDP 2016
Scenario Development Report
ENTSO-E AISBL • Avenue de Cortenbergh 100 • 1000 Brussels • Belgium • Tel + 32 2 741 09 50 • Fax + 32 2 741 09 51 • [email protected] • www. entsoe.eu
7
plans and scenarios continuously evolve there is a challenge to any reader when comparing a pan-European
plan for 2030 published in 2016 with for example a national plan published in 2015 looking at 2025.
The results in section 5 put the draft scenarios in context of the EC trends and IEA world energy outlook. A
comparison of installed generation and electrical demand may be valuable. It is worth noting the different
strengths of each scenario report. On one hand pure energy-models (such as the PRIMES model used in the
EC trends) allow to look forward based on an optimization of all energy components, not purely electricity
but also gas and oil which all interact. On the other hand power-based models (such as the ones used by
ENTSO-E in this report) are based on electricity market simulations which take into account full-year
hourly based profiles of load and climate data, as well as grid constraints. Such power-based model allows
to assess price zone differentials, RES spillage, country balances, etc… and are key in the methodologies
which make the bridge from bottom-up scenarios to top-down scenarios. The scenarios of the gas and
electricity TYNDPs (both published every two years, but in alternating years) of respectively ENTSO-G
and ENTSO-E interact; gas-based generation is an essential input for gas scenarios, while risks of gas
shortages are a continuous topic in electricity adequacy assessments (seasonal outlook reports and System
Outlook & Adequacy Forecast). Both ENTSOs continuously explore further synergies between the two
TYNDPs and their scenarios (storyline and data).
Making an explicit comparison between the 2020 and 2030 scenarios in this report and 2050 outlooks (EC
trends, IEA, electricity-Highways 2050 project) can be done on a qualitative level as it based on roadmap
and progress assumptions. The four 2030 Visions are on track with the recent set targets for 2030, and are
such assumed to also all be on track to meet the ambitious 2050 goal of de-carbonization of the generation
fleet, though at a different pace.

TYNDP 2016
Scenario Development Report
ENTSO-E AISBL • Avenue de Cortenbergh 100 • 1000 Brussels • Belgium • Tel + 32 2 741 09 50 • Fax + 32 2 741 09 51 • [email protected] • www. entsoe.eu
8
4 Main storyline for the TYNDP2016 scenarios
The ENTSO-E Visions encompass a broad range of possible futures that flex European integration and the
achievement of the sustainability goals within the EU 2050 Roadmap. The year 2030 is used as a bridge
between the European energy targets for 2020 and 2050. As it can take more than 10 years to build new
grid connections, the Visions for the TYNDP 2016 look beyond 2020. However, when looking so far ahead
it becomes more difficult to predict the future. Therefore, the objective of the Visions for 2030 is to
construct contrasting Visions that reflect the same boundary conditions for all countries but that differ
enough from each other to capture a realistic range of possible future pathways as well resulting in different
future challenges for the grid. In order to keep the number of long term Visions limited, the choice was
made to work around two main axes that are described later in this text and as a consequence limit the
number of Visions to four. Stakeholders have engaged with the Visions more than ever and we have
received strong positive feedback.
A number of stakeholders have expressed the requirement to understand more and shorter timeframes than
the single 2030 view in the TYNDP 2014. To meet this requirement, for the TYNDP 2016 we are
developing a new scenario to cover the time period of 2016 to 2020. This new scenario is called “Expected
Progress” and covers the period to 2020. This scenario is not directly linked to the 4 2030 Visions but
represents an intermediate stage. It is defined as the last point in time before uncertainties increase to a level
where a broader envelope of potential futures is required.
By the time the TYNDP 2016 is published, the vast majority of investments realized in 2020 will be
determined to a large extent. The potential changes in the power system with regard to transmission and
transmission connected thermal generation between 2016 and 2020 are much less than for a 2030 forecast
due to the relatively short time period between the two points in time compared to development times of
power system infrastructure (“industry inertia”). Construction of transmission connected thermal power
stations and construction of transmission lines usually takes longer than 4 years between planning and
beginning of operation. Beyond 2020, the 4 Visions provide the envelope within which the future is likely
to occur but strictly do not have probability of occurrence attached to them. This does not mean that there
are no uncertainties attached to “Expected Progress”, however it can be considered as a forecast for the year
2020 as the deviation between this scenario and the real system in 2020 should be much less than for a 2030
forecast. “Expected Progress” can serve as a starting point for the scenario envelope, which is expanded by
the 4 Visions as shown below in Figure 4-1.

TYNDP 2016
Scenario Development Report
ENTSO-E AISBL • Avenue de Cortenbergh 100 • 1000 Brussels • Belgium • Tel + 32 2 741 09 50 • Fax + 32 2 741 09 51 • [email protected] • www. entsoe.eu
9
FIGURE 4-1 EXPANDED SCENARIO SPACE
To analyse the 2030 time-horizon, four visions are elaborated based on two axes. A similar approach was
already applied in the visions development of TYNDP2014.
One axis is related to European ambitions and targets to reduce greenhouse gas emissions to 80-95% below
1990 levels by 2050. The axes provides a spectrum of progress, with the goal to assess the impact of
progress/delay in decarbonisation of energy on grid development needs by 2030. The two selected outcomes
are viewed to be extreme enough to result in very different flow patterns on the grid. The first selected
outcome is a state where Europe is very well on track to realize the set objective of energy decarbonisation
by 2050. The second selected outcome is a state where Europe progresses beyond 2020 targets to align with
the recent 2030 targets set for renewables. It is assumed that the 27% target for renewables translates to about
40% of renewable share in electrical energy consumption3.
The second axis relates to perspective of measures for decarbonisation of the energy system. This can be done
firstly in a strong European framework in which national policies will be more effective, but not preventing
3 EC, A policy framework for climate and energy in the period from 2020 to 2030 [COM(2014) 15], http://eur-
lex.europa.eu/legal-content/EN/TXT/PDF/?uri=CELEX:52014DC0015&from=EN

TYNDP 2016
Scenario Development Report
ENTSO-E AISBL • Avenue de Cortenbergh 100 • 1000 Brussels • Belgium • Tel + 32 2 741 09 50 • Fax + 32 2 741 09 51 • [email protected] • www. entsoe.eu
10
Member States developing the options which are most appropriate to their circumstances, or secondly in a
looser European framework effectively resulting in parallel national schemes.
The Figure 4-2 shows how the four Visions relate to the two axes.
FIGURE 4-2 TWO-AXIS OVERVIEW OF THE 4 VISIONS (GENERAL)

TYNDP 2016
Scenario Development Report
ENTSO-E AISBL • Avenue de Cortenbergh 100 • 1000 Brussels • Belgium • Tel + 32 2 741 09 50 • Fax + 32 2 741 09 51 • [email protected] • www. entsoe.eu
11
FIGURE 5-3 CHARACTERISTICS OVERVIEW OF THE 4 VISIONS (MORE DETAILED)

TYNDP 2016
Scenario Development Report
ENTSO-E AISBL • Avenue de Cortenbergh 100 • 1000 Brussels • Belgium • Tel + 32 2 741 09 50 • Fax + 32 2 741 09 51 • [email protected] • www. entsoe.eu
12
2020 Best Estimate Scenario of “Expected Progress”
Overall
perspective
“Expected Progress” can be described as the best estimate of development until 2020,
within the following boundaries.
Demand Development of electricity demand is determined by diverging driving forces. On the
one hand innovations lead to higher efficiencies of consumers and thus to a reduction
of demand. On the other hand, innovation leads to a fuel switch of applications like
electric vehicles, for example. A fuel switch towards electrification increases electric
demand. Demand forecast in the “Expected Progress” scenario is the best national
estimate available, under normal climatic conditions out to 2020. It is estimated
according to technical and economic assumptions, especially on demography and
economic growth.
Renewable
Energy Sources
Binding EU driven national targets exist for the share of renewable energy sources in
the energy mix by 2020. Renewable energy sources covered in this scenario report
include electricity generation from solar, wind power, run-of-river, biomass and other
supply depended renewable sources. The forecast of renewable energy sources in
“Expected Progress” takes into account the current supporting mechanisms for
renewable energy sources in each country and the expected development of support
mechanisms, if changes are under discussion. Including the cost decrease, a realistic
forecast for the year 2020 is derived, even if this means that the targets set by the
National Renewable Energy Action Plans (NREAPs) will not be met.
Hydro Reservoir
and Pumped
Storage
In contrast to run-of-river power plants, hydro reservoir stations can regulate their
electricity generation as long as their reservoir holds water. The creation of a new
water reservoir is an expensive project which may cause high local environmental
impact. Additional hydro generation capacity is only included in this scenario if the
projects are confirmed and under construction4.
Pumped storage hydro stations are easier to build, if the required reservoir already
exists and only the pumping machines have to be added. However, economic
conditions for pumped energy storages are unfavourable, because of the absence of
peak prices due to the high infeed of renewable energy sources. As such, also only
confirmed pumped hydro projects are included.
Conventional
Thermal
Generation
The development of conventional thermal generation follows market mechanisms. As
explained before this scenarios assumes the prices for emission certificates remain
low. Due to coal-gas price spread the general economic conditions are more
favourable for existing coal power stations. The estimated decommissioning of power
stations is based on best available information and trends to TSOs. Regarding new
units, only confirmed thermal power stations are taken into account. Carbon Capture
and Storage (CCS) is assumed not to be an option yet for lignite and coal power
stations by 2020.
Generally, it is assumed that new nuclear power stations that are operational by 2020
need at least a final investment decision today, so that their construction will be
finished by 2020. As a consequence, only confirmed new nuclear power projects are
taken into account in this scenario.
4 This is without prejudice to hydro and pumped storage projects which could be promoted for TYNDP inclusion
during April 2015. Additional hydro storage projects can be included in the scenario used for project assessments.
TYNDP 2016
Scenario Development Report
ENTSO-E AISBL • Avenue de Cortenbergh 100 • 1000 Brussels • Belgium • Tel + 32 2 741 09 50 • Fax + 32 2 741 09 51 • [email protected] • www. entsoe.eu
13
Power plants of the strategic reserve (as defined in some countries) are kept ready to
start-up for emergency periods when secure operation of the system is at risk. They
are not participating in the market. The capacity of power plants belonging to present
strategic reserves have been included, but are in the market simulations distinguished
from generation capacity that participates in the electricity markets. This scenario
gives no specific assumptions about evolutions of strategic reserves or capacity
mechanisms in the coming years.
Adequacy “Expected Progress” should consider adequacy from a Pan-European perspective
without explicitly addressing potential generation adequacy issues in some countries
at present. This scenario does not assume autonomous adequacy of single countries.
Still it is assumed that conventional thermal power stations do not face shortage in
fuel supply, which might be different in a true generation adequacy analysis (see
SO&AF report, as well as the Seasonal Outlooks).
Emission and
Fuel prices
Prices for CO2 emissions are currently low, which has an impact on the type of
generation plant utilised in the electricity market. Under low CO2 prices, coal fired
generation tends to be favoured over gas in the merit order. There is no indication of
change in the short term of prices of emission certificates. Also natural gas prices in
Europe have been relatively stable in recent years. In contrast, prices for import coal
have decreased in previous years. As a consequence, based on primary fuel prices
coal generation is favoured over gas generation. For the 2020 “Expected Progress”
scenarios it is assumed that no major change happens in the boundary conditions for
primary fuels and emission certificates.

TYNDP 2016
Scenario Development Report
ENTSO-E AISBL • Avenue de Cortenbergh 100 • 1000 Brussels • Belgium • Tel + 32 2 741 09 50 • Fax + 32 2 741 09 51 • [email protected] • www. entsoe.eu
14
2030 Vision 1 of “Slowest Progress”
Economy and
Market
The perspective of Vision 1 is a scenario where no common European decision
regarding how to reach the CO2-emission reductions has been reached. Each country
has its own policy and methodology for CO2, RES and system adequacy. Economic
conditions are unfavourable, but there is still modest economic growth. This results
in a limitation on willingness to invest in either high carbon or low carbon emitting
sources due to investment risks, low CO2-prices and lack of aligned support measures.
Consequently older power plants are kept online rather than being replaced if they are
needed in order to maintain adequacy. The situation varies across countries. The
absence of a strong European framework is a barrier to the introduction of
fundamental new market designs that benefit from R&D developments resulting in
parallel, loosely coordinated national R&D expenditure and cost inefficiencies.
Carbon pricing remains at such a level that base-load electricity production based on
hard coal is preferred to gas in the market.
Demand In this Vision there are no major breakthroughs in energy efficiency developments
such as large scale deployment of micro-cogeneration or heat pumps nor minimum
requirements for new appliances and new buildings due to a lack of strong political
and regulatory policy. There are also no major developments of the usage of
electricity for transport such as large scale introduction of electric plug-in vehicles
nor heating/cooling. A modest economic growth brings a modest electricity demand
increase. Also demand response potential that would allow partial shifting of the daily
load in response to the available supply remains largely untapped.
Generation The future generation mix is determined by national policy schemes that are
established without coordination at a European level. Due to a lack of joint framework
and joint decision to reduce emissions, the generation mix in 2030, on a European
level, fail to be on track for the realization of the energy roadmap 2050 and no
additional policies are implemented after 2020 to stimulate the commissioning of
additional RES except locally due to local subsidy schemes.
Adequacy is handled on a National basis. Some countries may require complete
adequacy while others may depend on neighbouring countries.
Very little new thermal capacity will come online except in the case for subsidized
production or adequacy required peak capacity. New CO2-emitters risk to be closed
down after 2030 in order to reach the 2050 target; hence the financial risk is
substantial and old units are kept online instead of replacing them.
Nuclear power is a national issue. In some countries nuclear power is regarded as a
clean and affordable source of electricity and new units are brought online before
2030.

TYNDP 2016
Scenario Development Report
ENTSO-E AISBL • Avenue de Cortenbergh 100 • 1000 Brussels • Belgium • Tel + 32 2 741 09 50 • Fax + 32 2 741 09 51 • [email protected] • www. entsoe.eu
15
2030 Vision 2 of “Constrained Progress”
Economy and
Market
The perspective of Vision 2 is that the economic and financial conditions are more
favourable compared to Vision 1 providing more room to reinforce/enhance existing
energy policies. There is a strong European framework. The economic outlook
facilitates new market implementations, and R&D expense focuses on cost cutting,
increased energy efficiency and energy savings.
On the other hand, there is a limitation on willingness to invest in either high carbon
or low carbon emitting sources due to investment risks, low CO2-prices and lack of
aligned support measures. Carbon pricing remains at such a level that base-load
electricity production based on hard coal is preferred to gas in the market.
Demand The breakthrough in energy efficiency developments (e.g. large scale deployment of
micro-cogeneration or heat pumps as well as minimum requirements for new
appliances and new buildings) and the development of the usage of electricity for
transport (e.g. large scale introduction of electric plug-in vehicles) and
heating/cooling is driven by innovation caused by R&D expenses focused on cost
cutting and energy saving. As a consequence the electricity demand is lower
compared to Vision 1. Furthermore, demand response potential is partially used to
shift the daily load in response to the available supply, as it allows savings in back-
up capacity.
Generation The future generation mix is driven by a strong European Vision which faces still
financial challenges and construction delays due to permitting issues, combined with
a halt in the implementation of additional policies needed for the realization of the
energy roadmap 2050. As a consequence, lifetime extension of existing conventional
thermal power plant is likely. Some additional policies are implemented after 2020 to
stimulate the commissioning of additional RES, causing RES capacity to be higher
than in Vision 1.
Decarbonisation is only driven by carbon pricing (no additional policies are assumed
if carbon prices are too low to ensure a lower usage of coal fired units).
Adequacy is ensured on a European level in order to have the optimized cost for
society. This results in less back-up capacity than for Vision 1.

TYNDP 2016
Scenario Development Report
ENTSO-E AISBL • Avenue de Cortenbergh 100 • 1000 Brussels • Belgium • Tel + 32 2 741 09 50 • Fax + 32 2 741 09 51 • [email protected] • www. entsoe.eu
16
2030 Vision 3 of “National Green Transition”
Economy and
Market
Vision 3 shows economic conditions being more favourable than in Vision 1 and 2.
It results in member states having more financial means to reinforce existing energy
policies. Still a loose European energy governance is a barrier to the introduction of
fundamental new market designs that fully benefit from R&D developments.
Furthermore, opting for parallel national schemes regarding R&D expenses also
results in a situation where major technological breakthroughs suffer from suboptimal
R&D spending.
Energy policies drive carbon pricing (e.g. the EU Emissions Trading System, carbon
taxes or carbon price floors) to levels such that baseload electricity production based
on gas is preferred to hard coal. On the balance gas is likely to push out hard coal for
baseload electricity generation.
Demand Developments in energy efficiency, as well as electrification of transport and
heating/cooling minimize the ecological footprint. On the balance electricity demand
is lower than in Vision 1 on European level. Demand response potential is partially
used to shift the daily load in response to the available supply.
Generation The future generation mix is determined by parallel national policy schemes that are
aiming for the decarbonisation objectives for 2050. Large scale RES expansion drives
the price of RES electricity production to a competitive level.
The cost of the electricity system will be higher than it would be for the case with a
strong European framework, since RES and adequacy is handled on a national basis
without cooperation between the countries. Demand response potential is used,
however, the majority of the additional back-up capacity in 2030 would come from
gas units since additional central hydro storage is not developed due to the lack of a
strong European framework. Only some extra national storage is developed (e,g,
pump storage, decentralized batteries,,,)
Favourable economic conditions in combination with capacity mechanism (if needed)
on a national basis result in conventional power plant investments and additional
backup-capacity. Adequacy is handled on a national basis without cooperation
between the countries. Old units are more likely to be decommissioned.
New nuclear power plant projects become economically unattractive; only projects
with a national acceptance for existing (or with final investment decision already
made) are included in this vision.
Carbon capture and storage are not (yet) economically attractive but are developed
for pilot plants and for full-size demonstration plants.

TYNDP 2016
Scenario Development Report
ENTSO-E AISBL • Avenue de Cortenbergh 100 • 1000 Brussels • Belgium • Tel + 32 2 741 09 50 • Fax + 32 2 741 09 51 • [email protected] • www. entsoe.eu
17
2030 Vision 4 of “European Green Revolution”
Economy and
Market
Vision 4 sees financial conditions that are more favourable than in any of the other
Visions, allowing member states to reinforce existing energy policies. Significant
investments in sustainable energy generation are undertaken. Furthermore, a strong
European framework makes the introduction of fundamental new market designs that
fully benefit from R&D developments more likely. This also allows R&D expenses
to be optimized so that major technological breakthroughs are more likely.
Energy policies drive carbon pricing (e.g. the EU Emissions Trading System, carbon
taxes or carbon price floors) to reach levels such that baseload electricity production
based on gas is preferred to hard coal. Gas is likely to push out hard coal for baseload
electricity generation.
Demand Efforts in energy efficiency developments (e.g. large scale deployment of micro-
cogeneration or heat pumps as well as minimum requirements for new appliances and
new buildings) and further electrification of transport and heating/cooling are
intensified. Furthermore market designs are adapted in such a way that the highest
energy savings coincide with the highest energy substitution to electrical. Electrical
usage still outweighs efficiency savings, giving a net energy increase. These new
usages are intensified through additional national and/or European subsidies.
Furthermore the demand response potential is fully used to shift the daily load in
response to the available supply, because it allows a saving on back-up capacity.
Generation The future generation mix is determined by a strong European Vision that is on clearly
track to realize the decarbonisation objectives for 2050 at least cost. Thanks to a
strong governance approach towards RES, RES is located in Europe in an optimal
way lowering the cost for society. Likewise backup capacity to secure adequacy is
handled on a European level. Large scale RES expansion drives the price of RES
electricity production to a competitive level.
Smart metering and smart grids are fully developed and thus demand response has a
strong take-up. Additional hydro storage is built in centralized manner (focusing
predominantly on Scandinavia, the Alps and the Pyrenees), with the remaining
additional back-up capacity in 2030 coming predominantly from gas units. In this
Vision no generating technology receives specific support and technologies compete
with each other purely on a market basis. Furthermore decarbonisation is driven by
carbon pricing.
New nuclear power plant projects are not economically viable due competitiveness of
RES production and no public acceptance for new projects. Older nuclear power
plants are not considered flexible enough to balance the demand and RES and are
consequently phasing out in areas with high RES production.

TYNDP 2016
Scenario Development Report
ENTSO-E AISBL • Avenue de Cortenbergh 100 • 1000 Brussels • Belgium • Tel + 32 2 741 09 50 • Fax + 32 2 741 09 51 • [email protected] • www. entsoe.eu
18
In order to build the four 2030 Visions matching the storylines mentioned in this section, a set of
parameters was set up to describe with more details these scenarios. Based on these parameters, data were
collected from TSOs for the two bottom-up 2030 Visions (Vision 1 and Vision 3).
TABLE 1 – SUMMMARY OF CHARACTERISTIC ELEMENTS OF 4 VISIONS
Slowest progress Constrained
progress National green
transition European green
revolution
V1 V2 V3 V4
Economic and financial conditions
Least favourable Less favourable More favourable Most favourable
Focus of energy policies
National European National European
Focus of R&D National European National European
CO2 and primary fuel prices
low CO2 price, high fuel price
low CO2 price, high fuel price
high CO2 price, low fuel price
high CO2 price, low fuel price
RES Low national RES (>=
2020 target) Between V1 and V3 High national RES On track to 2050
Electricity demand Increase (stagnation to
small growth)
Decrease compared to 2020 (small growth but higher energy efficiency)
stagnation compared to 2020(
Increase (growth demand)
Demand response (and smart grids)
As today Partially used Partially used Fully used
Electric vehicles
0% 5% 5% 20%
No commercial break through
of electric plug-in vehicles
Electric plug-in vehicles (flexible charging)
Electric plug-in vehicles (flexible charging)
Electric plug-in vehicles (flexible charging and
generating)
Heat pumps 0% 5% 5% 10%
Minimum level Intermediate level Intermediate level Maximum level
Adequacy
1% 5% 5% 9%
National - not autonomous
limited back-up capacity
European - less back-up capacity
than V1
National - autonomous high back-up capacity
European - less back-up capacity
than V3
Merit order Coal before gas Coal before gas Gas before coal Gas before coal
Storage As planned today As planned today Decentralized Centralized

TYNDP 2016
Scenario Development Report
ENTSO-E AISBL • Avenue de Cortenbergh 100 • 1000 Brussels • Belgium • Tel + 32 2 741 09 50 • Fax + 32 2 741 09 51 • [email protected] • www. entsoe.eu
19
INSERT 1 – A CONTINUOUS IMPROVEMENT – BRIEF COMPARISON TO TYNDP 2014 SCENARIOS5
The scenarios of the TYNDP are evolving and improving in each release. The main axis of the four
Vision have been kept as in the TYNDP 2014. However, based on the feedback received from the
Stakeholders on the past scenarios – especially from the September 2014 stakeholder workshop6 – the
parameters used to build the four 2030 Visions were updated.
Demand: One of the main change is related to the overall demand assumed in the four Visions, as well
as how the demand evolve from one Vision to another. In the TYNDP 2014, the demand was increasing
from Vision 1 to Vision 4. In the new scenarios, the demand is the lowest in Vision 2 where the overall
demand is expected to decrease compared to 2020 (small basic growth assumed but out-weighed higher
energy efficiency). On the other side, the highest demand is assumed in Vision 4 were the economic and
financial condition as well as the stronger European framework lead more energy substitution to
electricity (e.g. in transportation and heating).
RES optimization: In the TYNDP2014 a RES optimization was only performed for Vision 4 in order to
reach EU target for 2030. A new methodology for RES optimization has been developed and applied to
Vision 2 and 4. The optimization handles extra RES capacity in the ENTSO-E perimeter, but also re-
allocates the RES over the different countries.
Thermal optimization: In the TYNDP2014 a thermal reduction is performed based on a simple CBA
exercise, resulting in limited reductions. A new methodology for thermal optimization is developed and
applied to Vision 2 and Vision 4. The optimization is based on economic criterion (trade-off between
fixed costs and variable generation costs).
Adequacy level: The adequacy level is explicitly described in the storyline of each Vision. In the Vision
1 it is now possible to count up to 20% of the peak load on neighbouring countries (no longer
autonomous).
5 A comparison of the main figures of TYNDP 2014 and 2016 scenarios was presented during the 3rd Stakeholder
workshop. The material presented can be accessed here. 6 The outcomes of the workshop are summarized in the material of the second workshop here.

TYNDP 2016
Scenario Development Report
ENTSO-E AISBL • Avenue de Cortenbergh 100 • 1000 Brussels • Belgium • Tel + 32 2 741 09 50 • Fax + 32 2 741 09 51 • [email protected] • www. entsoe.eu
20
5 Scenario quantification results
Based on the storyline of the scenarios described in the section 4, and the methodologies summarized in
section 6, market modelling experts within ENTSO-E delivered a draft quantification of the five
TYNDP2016 scenarios in a draft Scenario Development Report published in May 2015. Taking into
account the draft list of TYNDP 2016 candidate projects published in June 2016 and the consultation
feedback on the draft report, these simulations were re-run. .
Quantifications of the final TYNDP2016 scenarios are presented in this section, including annual demand,
installed capacities and annual generation, to illustrate study results stemming from the storyline
assumptions and the described methodologies.
Another update compared to the earlier draft report is that two additional countries (Albania and Cyprus)
were modelled and are now added in the following charts.
The underlying data behind the graphs are also available in the Annex B. The fuel and CO2 prices
assumptions are depicted in the section 7.
2020 Best Estimate Scenario of “Expected Progress”
FIGURE 5-1 2020 EXPECTED PROGRESS - ANNUAL DEMAND
0
100
200
300
400
500
600
AL AT BA BE BG CH CY CZ DE EE ES FI FR GB GR HR HU IE IT LT LU LV MEMK NI NL NO PL PT RO RS SE SI SK
An
nu
al d
eman
d (
TWh
)
TYNDP 2016
Scenario Development Report
ENTSO-E AISBL • Avenue de Cortenbergh 100 • 1000 Brussels • Belgium • Tel + 32 2 741 09 50 • Fax + 32 2 741 09 51 • [email protected] • www. entsoe.eu
21
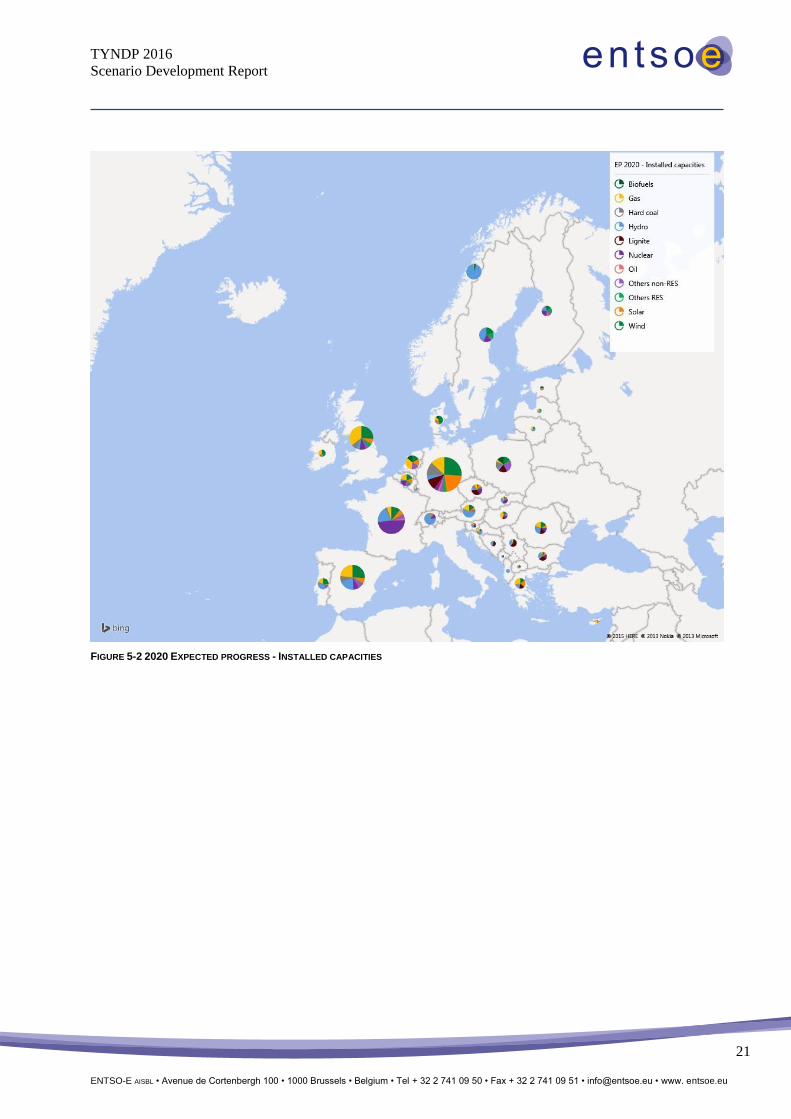
FIGURE 5-2 2020 EXPECTED PROGRESS - INSTALLED CAPACITIES

TYNDP 2016
Scenario Development Report
ENTSO-E AISBL • Avenue de Cortenbergh 100 • 1000 Brussels • Belgium • Tel + 32 2 741 09 50 • Fax + 32 2 741 09 51 • [email protected] • www. entsoe.eu
22
FIGURE 5-3 2020 EXPECTED PROGRESS - ANNUAL GENERATION AND COUNTRY BALANCES

TYNDP 2016
Scenario Development Report
ENTSO-E AISBL • Avenue de Cortenbergh 100 • 1000 Brussels • Belgium • Tel + 32 2 741 09 50 • Fax + 32 2 741 09 51 • [email protected] • www. entsoe.eu
23
2030 Vision 1 of “Slowest Progress”
FIGURE 5-4 2030 VISION 1 - ANNUAL DEMAND
FIGURE 5-5 2030 VISION 1 - INSTALLED CAPACITIES
0
100
200
300
400
500
600A
L
AT
BA BE
BG
CH CY
CZ
DE
DK EE ES FI FR GB
GR
HR
HU IE IT LT LU LV ME
MK NI
NL
NO PL
PT
RO RS SE SI SK
An
nu
al d
eman
d (
TWh
)

TYNDP 2016
Scenario Development Report
ENTSO-E AISBL • Avenue de Cortenbergh 100 • 1000 Brussels • Belgium • Tel + 32 2 741 09 50 • Fax + 32 2 741 09 51 • [email protected] • www. entsoe.eu
24
FIGURE 5-6 2030 VISION 1 - ANNUAL GENERATION AND COUNTRY BALANCES

TYNDP 2016
Scenario Development Report
ENTSO-E AISBL • Avenue de Cortenbergh 100 • 1000 Brussels • Belgium • Tel + 32 2 741 09 50 • Fax + 32 2 741 09 51 • [email protected] • www. entsoe.eu
25
2030 Vision 2 of “Constrained Progress”
FIGURE 5-7 2030 VISION 2 - ANNUAL DEMAND
FIGURE 5-8 2030 VISION 2 - INSTALLED CAPACITIES
0
100
200
300
400
500
600A
L
AT
BA BE
BG
CH CY
CZ
DE
DK EE ES FI FR GB
GR
HR
HU IE IT LT LU LV ME
MK NI
NL
NO PL
PT
RO RS SE SI SK
An
nu
al d
eman
d (
TWh
)
TYNDP 2016
Scenario Development Report
ENTSO-E AISBL • Avenue de Cortenbergh 100 • 1000 Brussels • Belgium • Tel + 32 2 741 09 50 • Fax + 32 2 741 09 51 • [email protected] • www. entsoe.eu
26
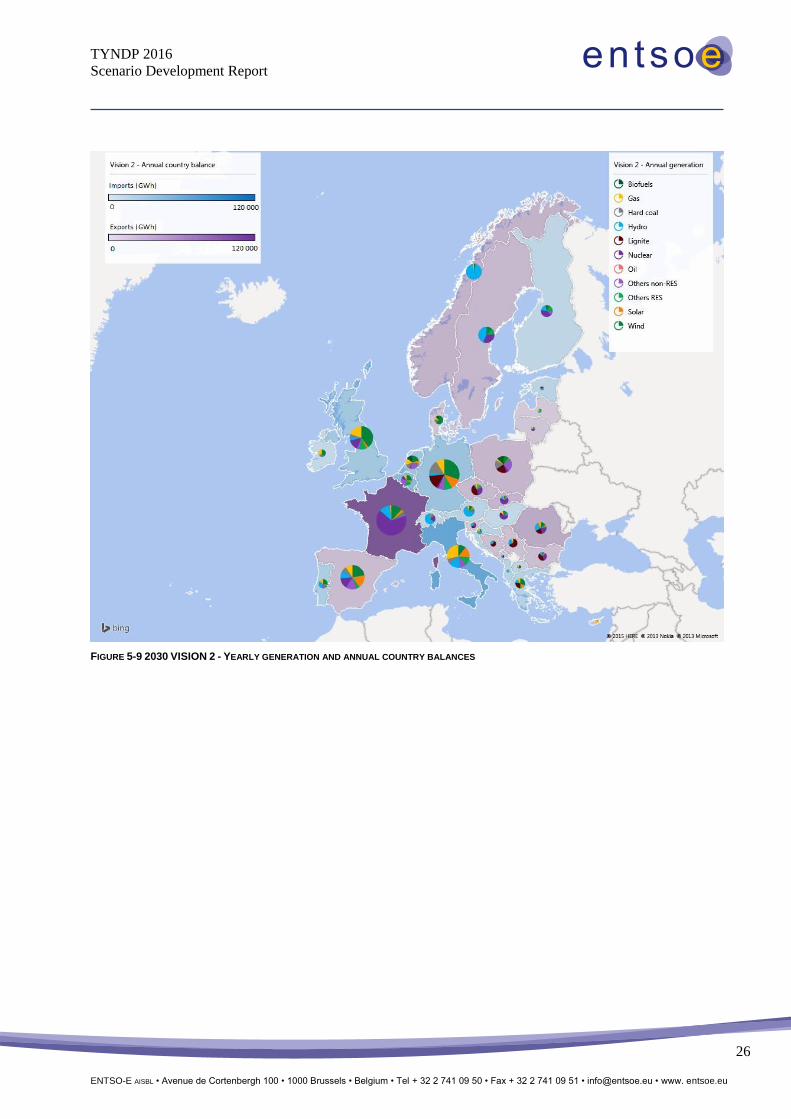
FIGURE 5-9 2030 VISION 2 - YEARLY GENERATION AND ANNUAL COUNTRY BALANCES

TYNDP 2016
Scenario Development Report
ENTSO-E AISBL • Avenue de Cortenbergh 100 • 1000 Brussels • Belgium • Tel + 32 2 741 09 50 • Fax + 32 2 741 09 51 • [email protected] • www. entsoe.eu
27
2030 Vision 3 of “National Green Transition”
FIGURE 5-10 2030 VISION 3 - ANNUAL DEMAND
FIGURE 5-11 2030 VISION 3 - INSTALLED CAPACITIES
0
100
200
300
400
500
600A
L
AT
BA BE
BG
CH CY
CZ
DE
DK EE ES FI FR GB
GR
HR
HU IE IT LT LU LV ME
MK NI
NL
NO PL
PT
RO RS SE SI SK
An
nu
al d
eman
d (
TWh
)

TYNDP 2016
Scenario Development Report
ENTSO-E AISBL • Avenue de Cortenbergh 100 • 1000 Brussels • Belgium • Tel + 32 2 741 09 50 • Fax + 32 2 741 09 51 • [email protected] • www. entsoe.eu
28
FIGURE 5-12 2030 VISION 3 - YEARLY GENERATION AND ANNUAL COUNTRY BALANCES

TYNDP 2016
Scenario Development Report
ENTSO-E AISBL • Avenue de Cortenbergh 100 • 1000 Brussels • Belgium • Tel + 32 2 741 09 50 • Fax + 32 2 741 09 51 • [email protected] • www. entsoe.eu
29
2030 Vision 4 of “European Green Revolution”
FIGURE 5-13 2030 VISION 4 - ANNUAL DEMAND
FIGURE 5-14 2030 VISION 4 - INSTALLED CAPACITIES
0
100
200
300
400
500
600A
L
AT
BA BE
BG
CH CY
CZ
DE
DK EE ES FI FR GB
GR
HR
HU IE IT LT LU LV ME
MK NI
NL
NO PL
PT
RO RS SE SI SK
An
nu
al d
eman
d (
TWh
)
TYNDP 2016
Scenario Development Report
ENTSO-E AISBL • Avenue de Cortenbergh 100 • 1000 Brussels • Belgium • Tel + 32 2 741 09 50 • Fax + 32 2 741 09 51 • [email protected] • www. entsoe.eu
30
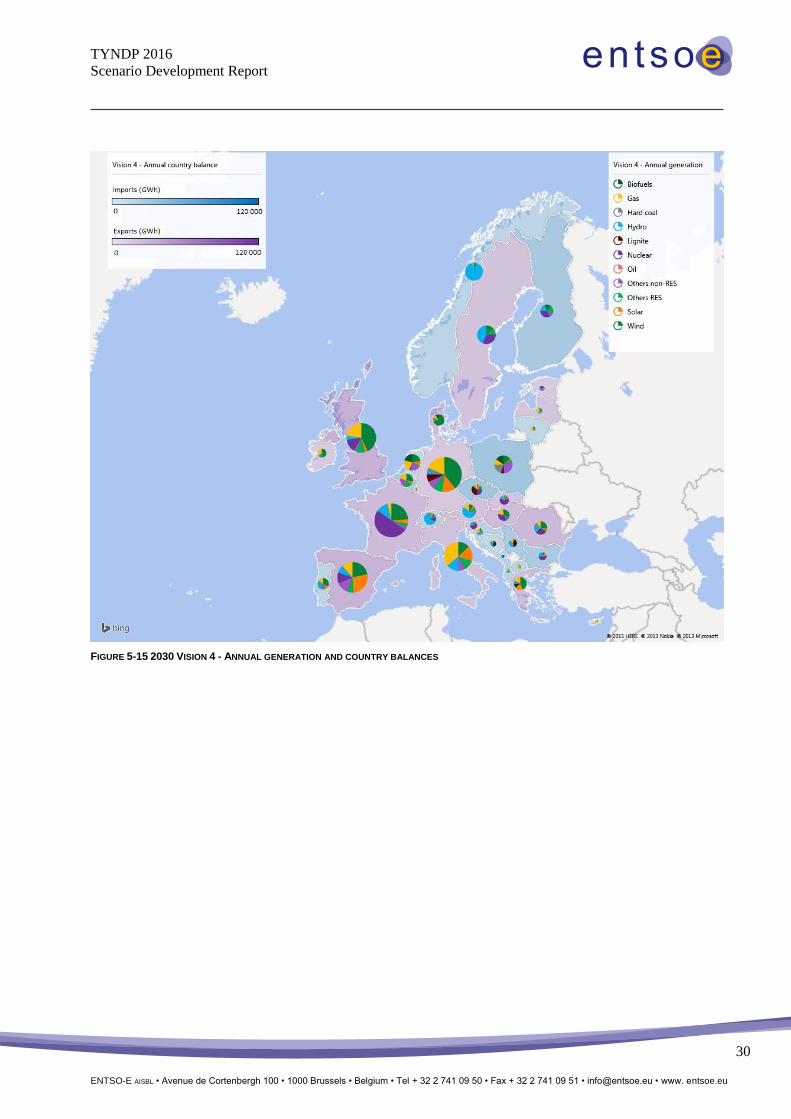
FIGURE 5-15 2030 VISION 4 - ANNUAL GENERATION AND COUNTRY BALANCES

TYNDP 2016
Scenario Development Report
ENTSO-E AISBL • Avenue de Cortenbergh 100 • 1000 Brussels • Belgium • Tel + 32 2 741 09 50 • Fax + 32 2 741 09 51 • [email protected] • www. entsoe.eu
31
General overview
FIGURE 5-16 - COMPARISON OF THE ANNUAL DEMAND AMONG THE FIVE SCENARIOS
The four 2030 Visions show a range of electrical demand from 3318 TWh (Vision 2) to 3680 TWh (Vision
4), in line with the scenario storyline. The 2020 Expected Progress shows a yearly change rate of electricity
demand between 2014 and 2020 of around 1%/year at the level of the ENTSO-E perimeter. Note that the
scenario building uses data collections of 2014; Figure 5-16 shows historical data up to 2014, and scenario
interpolations beyond that year.
FIGURE 5-17 COMPARISON OF INSTALLED CAPACITIES
The installed capacity of wind and solar increases from Vision 3 to Vision 4 in order to cover the increase
of demand from Vision 3 to Vision 4. Thus, Visions 3 and 4 show the same share of the electricity demand
being supplied by wind and solar sources.
Vision 2
Vision 1
Vision 3
Vision 4
Expected Progress
2900
3000
3100
3200
3300
3400
3500
3600
3700
3800
2011 2012 2013 2014 2020 2030
An
nu
al d
eman
d (
TWh
)
0 50 100 150 200 250 300 350 400
Solar
Wind
Installed capacities (GW)
Vision 4
Vision 3
Vision 2
Vision 1
EP2020
2014
TYNDP 2016
Scenario Development Report
ENTSO-E AISBL • Avenue de Cortenbergh 100 • 1000 Brussels • Belgium • Tel + 32 2 741 09 50 • Fax + 32 2 741 09 51 • [email protected] • www. entsoe.eu
32
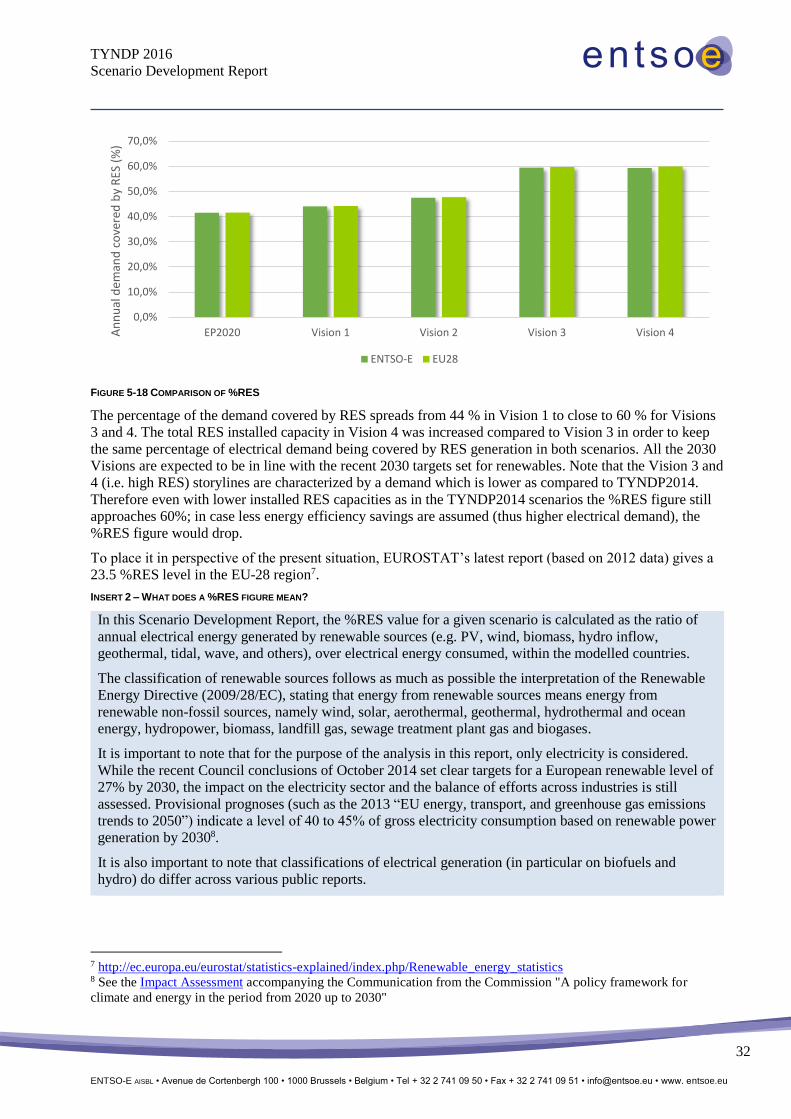
FIGURE 5-18 COMPARISON OF %RES
The percentage of the demand covered by RES spreads from 44 % in Vision 1 to close to 60 % for Visions
3 and 4. The total RES installed capacity in Vision 4 was increased compared to Vision 3 in order to keep
the same percentage of electrical demand being covered by RES generation in both scenarios. All the 2030
Visions are expected to be in line with the recent 2030 targets set for renewables. Note that the Vision 3 and
4 (i.e. high RES) storylines are characterized by a demand which is lower as compared to TYNDP2014.
Therefore even with lower installed RES capacities as in the TYNDP2014 scenarios the %RES figure still
approaches 60%; in case less energy efficiency savings are assumed (thus higher electrical demand), the
%RES figure would drop.
To place it in perspective of the present situation, EUROSTAT’s latest report (based on 2012 data) gives a
23.5 %RES level in the EU-28 region7.
INSERT 2 – WHAT DOES A %RES FIGURE MEAN?
In this Scenario Development Report, the %RES value for a given scenario is calculated as the ratio of
annual electrical energy generated by renewable sources (e.g. PV, wind, biomass, hydro inflow,
geothermal, tidal, wave, and others), over electrical energy consumed, within the modelled countries.
The classification of renewable sources follows as much as possible the interpretation of the Renewable
Energy Directive (2009/28/EC), stating that energy from renewable sources means energy from
renewable non-fossil sources, namely wind, solar, aerothermal, geothermal, hydrothermal and ocean
energy, hydropower, biomass, landfill gas, sewage treatment plant gas and biogases.
It is important to note that for the purpose of the analysis in this report, only electricity is considered.
While the recent Council conclusions of October 2014 set clear targets for a European renewable level of
27% by 2030, the impact on the electricity sector and the balance of efforts across industries is still
assessed. Provisional prognoses (such as the 2013 “EU energy, transport, and greenhouse gas emissions
trends to 2050”) indicate a level of 40 to 45% of gross electricity consumption based on renewable power
generation by 20308.
It is also important to note that classifications of electrical generation (in particular on biofuels and
hydro) do differ across various public reports.
7 http://ec.europa.eu/eurostat/statistics-explained/index.php/Renewable_energy_statistics 8 See the Impact Assessment accompanying the Communication from the Commission "A policy framework for
climate and energy in the period from 2020 up to 2030"
0,0%
10,0%
20,0%
30,0%
40,0%
50,0%
60,0%
70,0%
EP2020 Vision 1 Vision 2 Vision 3 Vision 4An
nu
al d
eman
d c
ove
red
by
RES
(%
)
ENTSO-E EU28

TYNDP 2016
Scenario Development Report
ENTSO-E AISBL • Avenue de Cortenbergh 100 • 1000 Brussels • Belgium • Tel + 32 2 741 09 50 • Fax + 32 2 741 09 51 • [email protected] • www. entsoe.eu
33
In addition the %RES figure is highly impacted by the denominator element in the ratio, referring to
electrical demand, which demonstrates the strong link between both energy efficiency and renewable
targets.
FIGURE 5-19 COMPARISON OF THE CO2 EMISSION INTENSITY IN THE 5 SCENARIOS
0
50
100
150
200
250
300
EP2020 Vision 1 Vision 2 Vision 3 Vision 4
CO
2 e
mis
sio
ns
(to
ns/
GW
h)
ENTSO-E EU28

TYNDP 2016
Scenario Development Report
ENTSO-E AISBL • Avenue de Cortenbergh 100 • 1000 Brussels • Belgium • Tel + 32 2 741 09 50 • Fax + 32 2 741 09 51 • [email protected] • www. entsoe.eu
34
FIGURE 5-20 PV REALLOCATION FROM VISION 3 TO VISION 4
The above picture shows the effects of the RES re-allocation on the PV installed capacities, with the re-
allocation PV among countries between the Vision 3 (bottom-up scenario) and the Vision 4 (top-down
scenario). The similar process was run for the Vision 2 building. More examples of the re-allocation (V4
wind, and V2) can be found in appendix.
INSERT 2 COMPARISON WITH OTHER SCENARIOS (EU 28 PERIMETER)
The following comparison has been performed scaling the ENTSO-E scenarios to the EU 28 perimeter to
match with the EU trends to 2050 and the IEA WEO 2014 EU 28 perimeters. For the EU trends to 2050
and the WEO2014, the snapshot for the year 2030 was used as comparison basis.
In the EU 28 perimeter, the ENTSO-E 2030 Visions annual demand ranges from 3062 (Vision 2) to 3397
TWh (Vision 4). The IEA scenarios from the WEO 2014 ranges from 3362 TWh (“450 Scenario”) to
3798 TWh (“Current policies”).
0
10
20
30
40
50
60
70
AL AT BA BE BG CH CY CZ DE DK EE ES FI FR GB GR HR HU IE IT LT LU LV MEMK NI NL NO PL PT RO RS SE SI SK
Inst
alle
d c
apac
itie
s (G
W)
Vision 3 Vision 4

TYNDP 2016
Scenario Development Report
ENTSO-E AISBL • Avenue de Cortenbergh 100 • 1000 Brussels • Belgium • Tel + 32 2 741 09 50 • Fax + 32 2 741 09 51 • [email protected] • www. entsoe.eu
35
FIGURE 5-21 COMPARISON OF THE ANNUAL DEMAND FOR THE YEAR 2030 (EU 28 PERIMETER)
IEA
: N
ew
Po
licie
s Sc
en
ario
IEA
: 4
50
Sce
nar
ios
IEA
: C
urr
en
t P
olic
ies
TYN
DP
20
16
Vis
ion
3
TYN
DP
20
16
Vis
ion
4
TYN
DP
20
16
Vis
ion
2
TYN
DP
20
16
Vis
ion
1
EU t
ren
ds
to 2
05
0,
refe
ren
ce s
cen
ario
20
13
0
500
1000
1500
2000
2500
3000
3500
4000
An
nu
al d
eman
d (
Twh
)

TYNDP 2016
Scenario Development Report
ENTSO-E AISBL • Avenue de Cortenbergh 100 • 1000 Brussels • Belgium • Tel + 32 2 741 09 50 • Fax + 32 2 741 09 51 • [email protected] • www. entsoe.eu
36
6 Methodologies to derive pan-European scenarios
As highlighted in Section 5, the set of scenarios gives a balance between so-called bottom-up and top-down
scenarios.
Bottom-up scenarios (2020 Expected Progress, and 2030 Visions 1 and 3) are driven by a straightforward
process as depicted in the following graph
Note that “bottom-up” refers to approach to collect national figures to assemble a pan-European scenario.
Still, the data collection is based on a single pan-European storyline (as described in Section 4) with
quantitative and qualitative guidance on specific data sets for national correspondents. Data collected is
next checked for quality and consistency with the storyline, which can result in an update of the bottom-up
data. Also simulation results can still trigger a need for update of data to ensure a credible pan-European
scenario.
Top-down scenarios (2030 Visions 2 and 4) take a bottom-up scenario as starting point (resp. 2030 Vision 1
and 3), and adapt it step by step to simulate and analyse European governance and Member State
coordination.
The following steps are taken in the top-down scenario building methodology, starting from capacities and
load profiles of a bottom-up scenario, and available 2030 grid models. For further insight in the
methodology, please refer to Annex 1.

TYNDP 2016
Scenario Development Report
ENTSO-E AISBL • Avenue de Cortenbergh 100 • 1000 Brussels • Belgium • Tel + 32 2 741 09 50 • Fax + 32 2 741 09 51 • [email protected] • www. entsoe.eu
37
FIGURE 6-1 CONSTRUCTION OF THE TOP-DOWN SCENARIOS FROM THE BOTTOM-SCENARIOS
1. Amendment of load profiles
The load in the top-down scenarios is constructed using a re-scaling of the bottom-up load curves driven by
energy efficiency savings, introduction of electric vehicles, introduction of heat pumps, and additional
peak-shaving. Specific European targets for these demand indicators are assumed (targets are fixed based
on input from stakeholders). The extent to which national load profiles are re-scaled depends on e.g. the
amount of electric vehicles, heat pumps and energy efficiency measures assumed in the relevant top-down
scenario.
2. Re-sizing and re-allocation of hydro
This step is only implemented in the construction of Vision 4, not for Vision 2. The methodology
introduces in Vision 3 an additional amount of hydro generation in each country based on 4% of peak
demand from Vision 3. Next, a distinction is made between hydro and non-hydro countries, based on a
threshold of 15% of national generation capacity. The top-down Vision 4 (with strong European energy
governance) assumes hydro is pooled in hydro countries (e.g. Alpine, Pyrenees and Nordic countries). For
hydro-countries, the amount of hydro is increased until an estimated maximum potential. This total increase
is used to re-scale (i.e. down-scale) the installed capacity in non-hydro countries.
3. RES re-allocation
A key feedback from many stakeholders in the past TYNDP2014 was the request to see a top-down
scenario which optimizes installed RES capacities across Europe, with the aim to concentrate efforts for
RES integration in places which optimizes the benefit for all end-consumers. Rather than performing such
re-allocation based on rule-of-thumbs ENTSO-E developed an optimization strategy to perform such re-
allocation optimization.

TYNDP 2016
Scenario Development Report
ENTSO-E AISBL • Avenue de Cortenbergh 100 • 1000 Brussels • Belgium • Tel + 32 2 741 09 50 • Fax + 32 2 741 09 51 • [email protected] • www. entsoe.eu
38
The objective is to minimize the total system operation cost by re-allocating the RES available (based on
European targets) among all ENTSO-E countries in the most economic and efficient way, taking into
account market potential and limitations of a 2030 grid. The main constraint is to keep the total installed
capacity per RES technology constant in the ENTSO-E perimeter.
The principal variables in the optimization are the revenues per installed MW per technology and per
country (Rx,c). In the theoretical optimal solution, the revenues per installed MW of a particular RES
technology need to be the same in all countries except in case additional constraints are reached (e.g. grid
infrastructure constraints, reserve limits, etc…). The RES technologies optimised are wind onshore, wind
offshore and PV.
The revenue indicators are calculated as follows:
cx
h
cxhch
cxCapacityInst
GenerationLMP
R,
8760
1
,,,
,.
)*( (€/MW)
The main purpose is reaching for each country a Rx,c very close or equal to the weighted average revenue
across all countries (see Figure 7-2).
The term LMP (Locational Marginal cost of Production) refers to the marginal costs computed by mean of
market simulations. The simulations provide hourly values for each modelled node/country.
The revenue indicators are translated into a re-allocation of installed RES of a particular technology across
countries. The two steps of revenue indictor calculations and RES re-allocations are repeated until Rx,c
converges, as does the total system operation cost (see Figure 7-3).
This step-by-step optimization is illustrated in the following example:
FIGURE 6-2 - EXAMPLE OF RES RE-ALLOCATION FOR A SPECIFIC TECHNOLOGY WITH IMPACT ON REVENUE INDICATORS ACROSS EIGHT
COUNTRIES (LEFT)
x = Onshore, Offshore and PV
c = Country
h = Hour

TYNDP 2016
Scenario Development Report
ENTSO-E AISBL • Avenue de Cortenbergh 100 • 1000 Brussels • Belgium • Tel + 32 2 741 09 50 • Fax + 32 2 741 09 51 • [email protected] • www. entsoe.eu
39
FIGURE 6-3 - EXAMPLE OF RES RE-ALLOCATION FOR A SPECIFIC TECHNOLOGY WITH IMPACT ON TOTAL OPERATIONAL
COST WITH FOURTEEN ITERATIONS (RIGHT)
This methodology gives crucial insight in the benefit increase of step-by-step optimal re-allocations, which
could be a role-model for policy initiatives on pan-European energy governance. The optimization steers
new RES investments across Europe based on efficiency (climate data) and substitution of energy
production with high marginal costs. It is acknowledged that the present methodology has some specific
limitations: no overall shift between technologies is considered (e.g. the total installed capacity of PV
remains the same, and is not ‘traded’ for wind), the same installation cost per technology/MW/country is
assumed and only one profile per technology per country is used. The methodology could well be adapted
by for example explore technology shifts, but this would require strong assumptions on subsidies, R&D
concentration, and political drive. As the method allows for RES to be ‘drawn out’ of a country, minimum
constraints for RES capacities per technology are applied in each country; for Vision 2 the 2020 level is
taken as minimum, while for Vision 4 the average of Vision 1 and 3 is taken. No explicit maximum
penetration of RES technology per country is taken as constraint; as the provisional results did not show a
total installed capacity per country going beyond maximum penetration levels identified in RES potential
studies.
The methodology could be used to explore the impact of other pan-European RES targets in case of optimal
European integration of RES capacities.
4. Thermal optimization
The bottom-up scenarios based on national generation adequacy or with limited headroom of pan-European
adequacy margins, potentially underestimate the value of country cooperation and thus over-estimate a
generation portfolio. Also the slight increase of installed RES from V3 to V4 (in the storyline based on
demand increase), could result in need for less thermal generation if pan-European collaboration is
assumed.
To optimize the thermal generation fleet, a principle trade-off between variable generation costs and
investment costs is taken as basis. First, non-dispatchable generation (mostly RES generation with
negligible marginal costs), and hydro storage-based generation (mostly driven by peak price moments) are
subtracted from the demand profile to obtain a ‘residual load’. It is this residual load which is considered to
be a relevant time series for conventional thermal generation.
Figure 7-4 illustrates how a combination of fixed and variable costs per technology indicates how for a
given number of full-load hours one technology becomes preferable over the other. Together with the

TYNDP 2016
Scenario Development Report
ENTSO-E AISBL • Avenue de Cortenbergh 100 • 1000 Brussels • Belgium • Tel + 32 2 741 09 50 • Fax + 32 2 741 09 51 • [email protected] • www. entsoe.eu
40
residual load profile, this is translated to an optimization problem which seeks the thermal fleet with least
total costs. Taking into account potential and limitations of a 2030 grid. Specific reserve margins can be
taken into account. No explicit distinction is made between existing and planned generation for this
optimization exercise. Differentiated cost assumptions could allow to take into account modernization,
mothballing and de-commissioning, as well as presumed new capacity from the bottom-up scenario.
FIGURE 6-4 LINK BETWEEN RESIDUAL COST CURVE AND COST ELEMENTS OF THERMAL GENERATION TYPES, BOTH DRIVING THE THERMAL
GENERATION FLEET OPTIMIZATION

TYNDP 2016
Scenario Development Report
ENTSO-E AISBL • Avenue de Cortenbergh 100 • 1000 Brussels • Belgium • Tel + 32 2 741 09 50 • Fax + 32 2 741 09 51 • [email protected] • www. entsoe.eu
41
7 Data references
ENTSO-E publish together with the final version of this report, a market modelling datasets which includes
the most relevant assumptions and data sources ENTSO-E used to build the 5 TYNDP 2016 scenarios9.
Some of the data sources are also described below.
Fuel and CO2 prices
In order to trigger the merit order that was assumed in the different storylines of the scenarios, different
sources are used. The table gives an overview of the primary fuel prices and CO2 prices used in the
simulations. IEA is used as the main reference, taking into account recent conversion rates. The use of the
IEA WEO as data source was chosen based on the recommendation of the first stakeholder workshop
(September 2014).
Expected Progress 2020 Fuel prices (€/ net GJ)
Vision 1 2030 Fuel prices (€/ net GJ)
Vision 2 2030 Fuel prices (€/ net GJ)
Vision 3 2030 Fuel prices (€/ net GJ)
Vision 4 2030 Fuel prices (€/ net GJ)
Nuclear 0.46 0.46 0.46 0.46 0.46
lignite 1.1 1.1 1.1 1.1 1.1
Hard coal 2.86 3.01 3.01 2.8 2.19
Gas 8.9 9.49 9.49 7.23 7.23
light oil 15.6 17.34 17.34 13.26 13.26
Heavy oil 12.32 13.7 13.7 9.88 9.88
Oil shale 2.3 2.3 2.3 2.3 2.3
CO2 prices (€/ton) 11 17 17 71 76
Source10
lEA "Current Policies"
lEA "Current Policies"
lEA "Current Policies"
lEA "450" except coal price lEA "New Policies"
lEA "450" except CO2 price (UK FES High)
RES capacity factors
With regards to the assumptions of wind and solar hourly generation, ENTSO-E is using a pan-European
Climatic Database (PECD) since TYNDP 2014 which includes correlated hourly capacity factors for PV,
onshore wind and offshore wind for each market node across the ENTSO-E perimeter. It takes into account
technological development of RES technologies, as well as capacity factors based on available (optimal /
sub-optimal) land sites. The data is not made publically available due to contract and confidentiality
restrictions.
Reference interconnection capacities
The reference interconnection capacities assumed for the draft quantification of the scenario consulted
before the summer were derived from the TYNDP 2014. The ones used for the final quantification of the
scenarios, presented in this report, are based on the TYNDP 2016 list of projects. These reference capacities
were consulted during the summer and are included in the TYNDP 2016 Market Modelling dataset
published together with this report9.
9 See TYNDP 2016 Market Modelling dataset available on ENTSO-E website 10 World Energy Outlook 2013

TYNDP 2016
Scenario Development Report
ENTSO-E AISBL • Avenue de Cortenbergh 100 • 1000 Brussels • Belgium • Tel + 32 2 741 09 50 • Fax + 32 2 741 09 51 • [email protected] • www. entsoe.eu
42
8 Next steps in the TYNDP process
ENTSO-E is starting the assessment of all TYNDP 2016 candidate projects based on the Cost Benefit
Analysis methodology. The assessment results and other main findings will feed into a draft TYNDP2016
report published for consultation in summer 2016.

TYNDP 2016
Scenario Development Report
ENTSO-E AISBL • Avenue de Cortenbergh 100 • 1000 Brussels • Belgium • Tel + 32 2 741 09 50 • Fax + 32 2 741 09 51 • [email protected] • www. entsoe.eu
43
A. Annex of top-down scenario building methodologies
Load profile update
The following figure shows the impact of the load adaption from Vision 1 to Vision 2.
FIGURE 8-1 LOAD PROFILE UPDATE FROM VISION 1 TO VISION 2
RES re-allocation
The following figure shows the impact of the wind production re-allocation in Vision 4.
0
100
200
300
400
500
600
AL
AT
BA BE
BG
CH CY
CZ
DE
DK EE ES FI FR GB
GR
HR
HU IE IT LT LU LV ME
MK NI
NL
NO PL
PT
RO RS SE SI SK
An
nu
al d
eman
d (
TWh
)
Vision 1 Vision 2

TYNDP 2016
Scenario Development Report
ENTSO-E AISBL • Avenue de Cortenbergh 100 • 1000 Brussels • Belgium • Tel + 32 2 741 09 50 • Fax + 32 2 741 09 51 • [email protected] • www. entsoe.eu
44
FIGURE 8-2 WIND REALLOCATION FROM VISION 3 TO VISION 4
The following figure shows the impact of the PV re-allocation in Vision 2.
FIGURE 8-3 PV REALLOCATION FROM VISION 1 TO VISION 2
The following figure shows the impact of the wind re-allocation in Vision 2.
0
20
40
60
80
100
120A
L
AT
BA BE
BG
CH CY
CZ
DE
DK EE ES FI FR GB
GR
HR
HU IE IT LT LU LV ME
MK NI
NL
NO PL
PT
RO RS SE SI SK
Inst
alle
d c
apac
itie
s (G
W)
Vision 3 Vision 4
0
10
20
30
40
50
60
70
AL
AT
BA BE
BG
CH CY
CZ
DE
DK EE ES FI FR GB
GR
HR
HU IE IT LT LU LV ME
MK NI
NL
NO PL
PT
RO RS SE SI SK
Inst
alle
d c
apac
itie
s (G
W)
Vision 1 Vision 2

TYNDP 2016
Scenario Development Report
ENTSO-E AISBL • Avenue de Cortenbergh 100 • 1000 Brussels • Belgium • Tel + 32 2 741 09 50 • Fax + 32 2 741 09 51 • [email protected] • www. entsoe.eu
45
FIGURE 8-4 WIND REALLOCATION FROM VISION 1 TO VISION 2
Thermal optimization
The following table shows in which countries the thermal optimization exercise resulted in reduction of
installed capacity going from Vision 3 to Vision 4. For other countries the methodology showed no change
based on the described methodology and Vision 3 starting point.
Country Capacity reduction (MW)
BA 1215
BG 3300
CZ 906
DE 1183
GR 1142
IT 1389
MK 410
RO 3549
RS 4050
SK 223
FIGURE 8-5 EXAMPLE OF THERMAL REDUCTION - FROM VISION 3 TO VISION 4
0
10
20
30
40
50
60
70
80A
L
AT
BA BE
BG
CH CY
CZ
DE
DK EE ES FI FR GB
GR
HR
HU IE IT LT LU LV ME
MK NI
NL
NO PL
PT
RO RS SE SI SK
Inst
alle
d c
apac
itie
s (G
W)
Vision 1 Vision 2

TYNDP 2016
Scenario Development Report
ENTSO-E AISBL • Avenue de Cortenbergh 100 • 1000 Brussels • Belgium • Tel + 32 2 741 09 50 • Fax + 32 2 741 09 51 • [email protected] • www. entsoe.eu
46
B. Annex - Overview of stakeholder engagement
This Scenario Development Report took benefit of on an extensive stakeholder engagement starting
September 2014 with several calls for input. This annex summarizes the main steps and recommendations
given by stakeholders; and how they have been incorporated in the scenario development process. The
process is summarized in the graph below.
FIGURE 8-6 CALL FOR INPUT TO BUILD THE TYNDP 2016 SCENARIOS
Defining the scenario framework (workshop 16/09/14)
The workshop focused on the development of scenario methodology, the identification of scenarios and the
methodology designed to build them being one of the key steps in developing the 2016 version of the
TYNDP. The event was structured as an interactive event where ~50 participants participated in
brainstorming sessions. The participants went through all the scenario related parameters and expressed
their suggestions. All recommendations can be accessed on the ENTSO-E website.
Methodologies and draft results (workshop 11/03/15)
This 2nd workshop concentrated on the visions, assumptions and methodology including consideration of
input from stakeholders, the presentation of draft simulation results and the next scenario steps. The
workshop was a mixture of information sharing and open discussion. The results from the first workshop
were presented, including how ENTSO-E took into account these results in the scenario storyline and
quantification methodologies presented (e.g. in the choice of the sources for the CO2 price, or the choice of
merit order with gas between cheaper or more expensive than coal). The aim of the workshop was to gain
common understanding of the scenarios and the methodology; as well as to collect improvement
suggestions for this and future TYNDPs.
Set of draft results (webinar 10/06/2015)
This webinar was for all interested parties to better understand, discuss and express views on a complete set
of draft scenarios publishes for consultation. The distinction between the scenarios that are used in the
TYNDP and the scenarios used in ENTSO-E's adequacy forecast was also explained. Each of the five
TYNDP 2016 scenario was presented in details, followed by a Q&A session.
First workshop (16/09/14)
• Call for input on the scenario storylines (main trends for demand, generation portofolio, fuel and CO2 prices...)
Second workshop (11/03/2015)
• Presentation of preliminary results
• Discussion on the methodology to build the scenarios (specific focus on the top-down scenarios)
Third workshop/webinar (10/06/2015)
• Draft results for all scenarios and discussion on the results
• Link with adequacy forecast
• Link with CBA assessments
Public Consultation
(05-06/2015)
• Call for input to finalize the TYNDP 2016 scenarios

TYNDP 2016
Scenario Development Report
ENTSO-E AISBL • Avenue de Cortenbergh 100 • 1000 Brussels • Belgium • Tel + 32 2 741 09 50 • Fax + 32 2 741 09 51 • [email protected] • www. entsoe.eu
47
Public consultation on a draft Scenario Development Report (10/05/15 - 22/06/15)
Included in the draft Scenario Development Report in public consultation, a set of seven questions were
presented. The main inputs received for the seven questions are summarized below together with ENTSO-
E’s view how these suggestions are integrated in this work. Most of the comments given their focus on the
methodologies and scenario storyline provide valuable suggestions for next TYNDPs and deserve broader
discussion across stakeholders, but cannot yet be taken into account for the TYNDP 2016 scenarios.
Type Main comments from the public consultation
Suggestions that improved this
final TYNDP 2016 Scenario
Development Report
Clarification of what technologies are included in the storage
category.
Further explanations on the stakeholder engagement set up
for the TYNDP 2016 scenario building.
Clarification on how the sources for CO2 prices where
chosen.
Addition of information on historical demand.
Explicit modelling of Cyprus (not a direct outcome of the
consultation, but requested at other stakeholder events).
Clarification on the data used to estimate RES production
profiles.
Suggestions for the
TYNDP2016 report (draft in
summer 2016)
Countries modelled with higher granularity / more nodes.
ENTSO-E comment: In the project assessments some areas
will be studies with a more detailed model.
Contribution of RES to Security of Supply should be
clarified. ENTSO-E comment: we are exploring how to
enrich the information in the TYNDP report as to provide a
broad view on what SoS means in a well-designed long term
grid.
Look beyond 2030. ENTSO-E comment: These scenario
developments did not (yet) look at longer time frames, though
the Electricity Highways 2050 project does not provide an
intermediate step between the TYNDP scenarios for 2030 and
the 2050 horizon.
Suggestions for TYNDP 2018
or beyond Improve the consistency between countries for the Vision 1
& 3.
Use the scenarios from the IEA and the EC as benchmark (or
reference point) for the long term visions.
Other axes to develop the scenarios could be considered, for
instance: technological development and demand response,
RES and technology development/penetration (European
project GridTech http://www.gridtech.eu), demand level (low
vs. high etc.).
Economic growth and development of climate and energy
policies should be considered separately.

TYNDP 2016
Scenario Development Report
ENTSO-E AISBL • Avenue de Cortenbergh 100 • 1000 Brussels • Belgium • Tel + 32 2 741 09 50 • Fax + 32 2 741 09 51 • [email protected] • www. entsoe.eu
48
Before including new fossil-fired condensing capacity, a cost-
benefit comparison with new interconnection capacity should
be made. Also more demand response would be a cheaper
solution for peaking and reserve needs than new oil-fired
capacity. Only a real optimization (generation in combination
with interconnections) with the help of generation expansion
planning tools will result in good top-down scenarios.
Contribution of renewables to Security of Supply should be
clarified.
Look beyond 2030.
Provide more clarity on how the generation fleet are
constructed in the bottom-up scenarios (one specific
comment is to take into account realistic timing of
construction process of nuclear units (> 10 years) in the
storyline of the scenarios)
Model specific countries with more nodes
Improve modelling of demand response and storages
Consider the emergence of nuclear fusion and the
development of the biomass (ENTSO-E comment: nuclear
fusion is not relevant for 2030 scenarios which represent
possible futures).
Include more countries in the scenario, the following are
suggested: Turkey, Malta, Iceland, Ukraine, and clarify the
assumption used in terms of connection and exchanges with
non-ENTSO-E countries.
Further improve stakeholder engagement so that more inputs
can be taken on board and greater common understanding can
be reached.
In addition to the suggestions raised in the public consultation, ENTSO-E and ACER interacted on the draft
scenarios in context of the overall TYNDP process as well as past discussions and public opinions.
ENTSO-E appreciated many of the comments given, and even if these are informal notes that they
contributed to improved clarity of the final Scenario Development Report.

TYNDP 2016
Scenario Development Report
ENTSO-E AISBL • Avenue de Cortenbergh 100 • 1000 Brussels • Belgium • Tel + 32 2 741 09 50 • Fax + 32 2 741 09 51 • [email protected] • www. entsoe.eu
49
C. Annex – Background tables
The following tables represent the dataset as visualized in Section 6 of this report. Note that and Iceland,
which is at present isolated systems within the ENTSO-E perimeter, has not been included explicitly in
these scenarios. For the purpose of project assessments particular market modelling assumptions are made.
Also Albania and Cyprus are now explicitly modelled.
TABLE 2 ANNUAL DEMAND ACROSS THE SCENARIOS (GWH)
Country Expected progress 2020 2030 Vision 1 2030 Vision 2 2030 Vision 3 2030 Vision 4
AL 9109 11508 10864 10753 11850
AT 72243 74073 69851 70399 74095
BA 13965 15308 14574 15146 15693
BE 91885 93152 87862 86184 93247
BG 38661 40705 38831 35254 40728
CH 64852 69417 65402 63084 69533
CY 4427 5704 5433 4610 6222
CZ 67490 73381 69798 68389 73358
DE 534566 546765 518757 508708 547178
DK 36546 38853 36776 39810 41219
EE 9327 10194 9590 9506 10661
ES 282378 315948 301130 364239 381237
FI 90187 91236 86825 84751 91551
FR 488309 445972 424817 479198 496036
GB 333802 329349 310117 354408 368084
GR 53836 60401 57462 47724 60481
HR 21139 21966 20786 21605 22304
HU 43480 48000 45738 44785 48336
IE 27444 28783 27319 31462 32567
IT 327286 354227 330272 311285 354710
LT 11576 12517 11562 10259 12516
LU 7144 7501 7263 7661 7778
LV 8387 8982 8453 7006 9097
ME 4194 4628 4225 3142 4713
MK 9226 11249 10670 11095 11457
NI 9420 9802 9209 10391 10742
NL 115785 122012 114551 116399 122577
NO 131506 131506 124907 140384 145806
PL 162352 173922 165619 159945 174560
PT 50476 56267 53189 57303 59342
RO 54678 60305 57078 55938 60605
RS 41660 45416 42745 37708 45721
SE 146318 146762 138860 130838 147296
SI 28432 31576 30095 30275 31723
SK 9109 11508 10864 10753 11850
Total 3392602 3496062 3309320 3429374 3680981
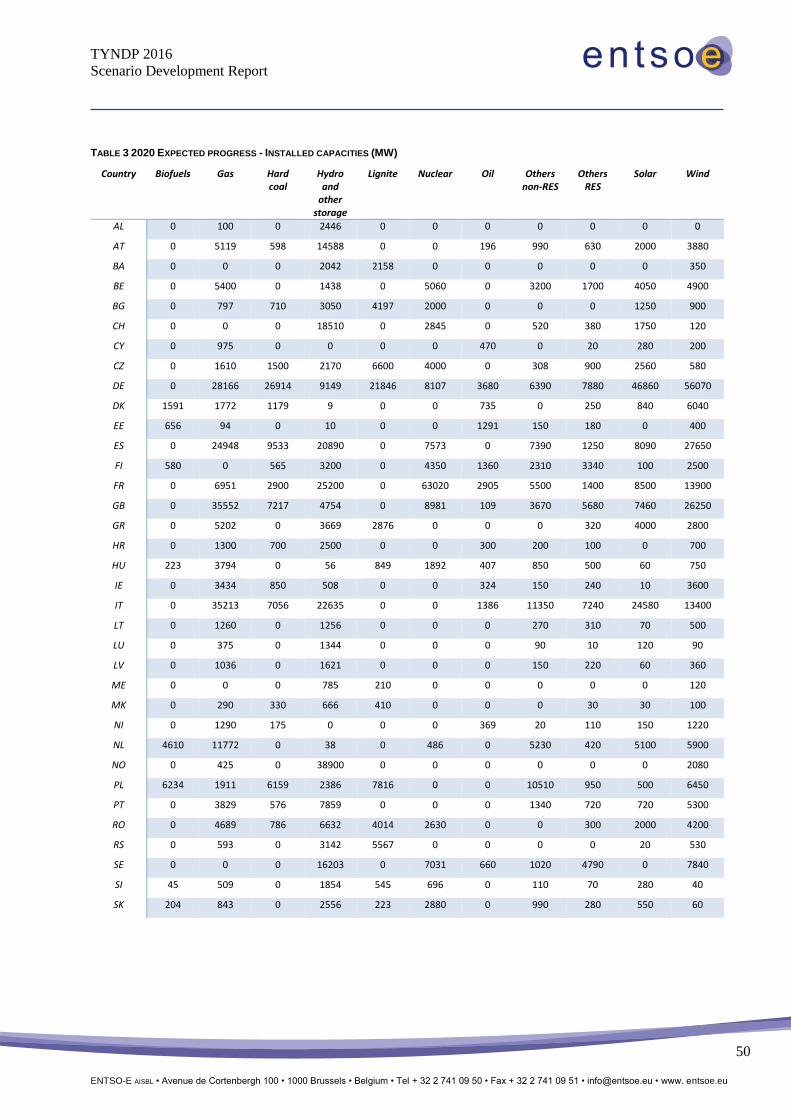
TYNDP 2016
Scenario Development Report
ENTSO-E AISBL • Avenue de Cortenbergh 100 • 1000 Brussels • Belgium • Tel + 32 2 741 09 50 • Fax + 32 2 741 09 51 • [email protected] • www. entsoe.eu
50
TABLE 3 2020 EXPECTED PROGRESS - INSTALLED CAPACITIES (MW)
Country Biofuels Gas Hard coal
Hydro and
other storage
Lignite Nuclear Oil Others non-RES
Others RES
Solar Wind
AL 0 100 0 2446 0 0 0 0 0 0 0
AT 0 5119 598 14588 0 0 196 990 630 2000 3880
BA 0 0 0 2042 2158 0 0 0 0 0 350
BE 0 5400 0 1438 0 5060 0 3200 1700 4050 4900
BG 0 797 710 3050 4197 2000 0 0 0 1250 900
CH 0 0 0 18510 0 2845 0 520 380 1750 120
CY 0 975 0 0 0 0 470 0 20 280 200
CZ 0 1610 1500 2170 6600 4000 0 308 900 2560 580
DE 0 28166 26914 9149 21846 8107 3680 6390 7880 46860 56070
DK 1591 1772 1179 9 0 0 735 0 250 840 6040
EE 656 94 0 10 0 0 1291 150 180 0 400
ES 0 24948 9533 20890 0 7573 0 7390 1250 8090 27650
FI 580 0 565 3200 0 4350 1360 2310 3340 100 2500
FR 0 6951 2900 25200 0 63020 2905 5500 1400 8500 13900
GB 0 35552 7217 4754 0 8981 109 3670 5680 7460 26250
GR 0 5202 0 3669 2876 0 0 0 320 4000 2800
HR 0 1300 700 2500 0 0 300 200 100 0 700
HU 223 3794 0 56 849 1892 407 850 500 60 750
IE 0 3434 850 508 0 0 324 150 240 10 3600
IT 0 35213 7056 22635 0 0 1386 11350 7240 24580 13400
LT 0 1260 0 1256 0 0 0 270 310 70 500
LU 0 375 0 1344 0 0 0 90 10 120 90
LV 0 1036 0 1621 0 0 0 150 220 60 360
ME 0 0 0 785 210 0 0 0 0 0 120
MK 0 290 330 666 410 0 0 0 30 30 100
NI 0 1290 175 0 0 0 369 20 110 150 1220
NL 4610 11772 0 38 0 486 0 5230 420 5100 5900
NO 0 425 0 38900 0 0 0 0 0 0 2080
PL 6234 1911 6159 2386 7816 0 0 10510 950 500 6450
PT 0 3829 576 7859 0 0 0 1340 720 720 5300
RO 0 4689 786 6632 4014 2630 0 0 300 2000 4200
RS 0 593 0 3142 5567 0 0 0 0 20 530
SE 0 0 0 16203 0 7031 660 1020 4790 0 7840
SI 45 509 0 1854 545 696 0 110 70 280 40
SK 204 843 0 2556 223 2880 0 990 280 550 60

TYNDP 2016
Scenario Development Report
ENTSO-E AISBL • Avenue de Cortenbergh 100 • 1000 Brussels • Belgium • Tel + 32 2 741 09 50 • Fax + 32 2 741 09 51 • [email protected] • www. entsoe.eu
51
TABLE 4 2020 EXPECTED PROGRESS - ANNUAL GENERATION (GWH)
Country Biofuels Gas Hard coal
Hydro and
other storage
Lignite Nuclear Oil Others non-RES
Others RES
Solar Wind
AL 0 67 0 3302 0 0 0 0 0 0 0
AT 0 140 2416 41584 0 0 0 4158 3494 2592 6812
BA 0 0 0 4844 15590 0 0 0 0 0 550
BE 0 57 0 434 0 35471 0 18605 10336 4518 13347
BG 0 0 1539 2498 29164 13734 0 0 0 1723 1438
CH 0 0 0 42532 0 20151 0 1957 1406 2339 198
CY 0 3052 0 0 0 0 0 0 96 546 151
CZ 0 393 2569 3090 46348 28124 0 2278 5134 3025 967
DE 0 15466 115563 16627 154248 56549 1338 26650 42693 54282 110431
DK 5467 4948 7714 27 0 0 0 0 1589 833 17013
EE 1716 0 0 70 0 0 2495 460 558 0 805
ES 0 16071 54448 32391 0 53185 0 33556 6556 18912 60291
FI 3682 0 1944 13875 0 32555 27 10752 10752 78 5451
FR 0 81 15268 58560 0 440555 0 12826 6002 10648 29847
GB 0 29693 43716 12582 0 63213 0 9286 29187 7343 79084
GR 0 2950 0 5966 20833 0 0 0 1179 6426 7058
HR 0 206 3438 4996 0 0 0 874 612 0 1123
HU 1423 932 0 248 6081 13322 0 3835 2256 79 1616
IE 0 9301 5142 705 0 0 0 717 1642 10 10416
IT 0 52015 33935 46477 0 0 301 35319 30803 34997 26689
LT 0 327 0 523 0 0 0 547 1082 68 921
LU 0 0 0 131 0 0 0 381 68 131 129
LV 0 2468 0 2956 0 0 0 755 1125 56 686
ME 0 0 0 1880 1475 0 0 0 0 0 188
MK 0 0 1608 1421 2953 0 0 0 131 44 163
NI 0 1174 1131 0 0 0 0 102 707 141 3181
NL 30255 7643 0 105 0 3413 0 24982 2900 5521 13755
NO 0 3244 0 134833 0 0 0 0 0 0 4369
PL 27579 2 31790 2294 55474 0 0 47533 4292 557 11862
PT 0 2590 4357 13254 0 0 0 6090 3282 1130 11563
RO 0 3749 3438 15911 24900 18411 0 0 1446 2693 8822
RS 0 2598 0 9468 39988 0 0 0 0 27 849
SE 0 0 0 66444 0 48527 45 2660 16208 0 16499
SI 267 621 0 4998 3963 5013 0 398 248 380 80
SK 1146 1182 0 4707 1399 22264 0 4065 1464 693 120

TYNDP 2016
Scenario Development Report
ENTSO-E AISBL • Avenue de Cortenbergh 100 • 1000 Brussels • Belgium • Tel + 32 2 741 09 50 • Fax + 32 2 741 09 51 • [email protected] • www. entsoe.eu
52
TABLE 5 2030 VISION 1 - INSTALLED CAPACITIES (MW)
Country Biofuels Gas Hard coal
Hydro and
other storage
Lignite Nuclear Oil Others non-RES
Others RES
Solar Wind
AL 0 500 0 3152 0 0 0 0 0 50 150
AT 0 4271 598 16418 0 0 196 990 800 2500 4000
BA 0 0 0 2107 2158 0 0 300 0 100 640
BE 0 7370 0 1438 0 0 0 3200 1700 4050 4900
BG 0 810 710 3150 4000 2000 0 0 0 1800 1200
CH 0 0 0 18510 0 2115 0 850 600 2550 220
CY 0 1470 0 0 0 0 190 0 30 630 230
CZ 0 2020 310 2170 5330 4140 0 0 1110 3690 880
DE 0 21138 23365 13257 12610 0 1026 8650 6960 57240 74050
DK 1460 2604 410 9 0 0 735 0 260 840 6190
EE 656 94 0 10 0 0 413 160 230 0 400
ES 0 24948 5900 23450 0 7120 0 10480 2400 16800 35750
FI 580 0 805 3400 0 5550 1360 1770 3760 100 2500
FR 0 6051 1740 25200 0 57644 819 5400 1400 12300 21700
GB 0 43327 2897 4754 0 4552 109 4050 5450 8270 21870
GR 0 6252 0 4259 2876 0 0 0 480 4250 6200
HR 0 1700 1200 2700 0 0 200 300 300 200 1300
HU 210 4185 0 56 470 4108 407 720 550 60 750
IE 0 3575 750 508 0 0 260 210 250 200 4420
IT 0 38974 7926 22635 0 0 1394 10160 7240 24580 13400
LT 0 740 0 1265 0 1303 0 270 310 80 650
LU 0 375 0 1344 0 0 0 90 70 150 130
LV 0 1036 0 1621 0 0 0 150 250 10 800
ME 0 0 0 1215 450 0 0 0 0 0 120
MK 0 440 530 716 410 0 0 0 30 30 150
NI 0 1690 0 0 0 0 200 20 110 200 1450
NL 0 8757 4610 38 0 486 0 5080 300 4000 7000
NO 0 425 0 38900 0 0 0 0 0 0 2080
PL 5867 2804 5492 2426 7031 3000 0 7550 1210 1500 8900
PT 0 4156 0 7858 0 0 0 1340 720 720 5300
RO 0 4757 786 7737 4014 2630 0 0 500 2500 5000
RS 0 593 0 4308 4965 0 0 0 0 20 530
SE 0 0 0 16203 0 7992 0 470 5340 0 7840
SI 45 505 0 1929 545 696 0 120 60 290 30
SK 204 843 0 3140 223 4004 0 990 310 610 90
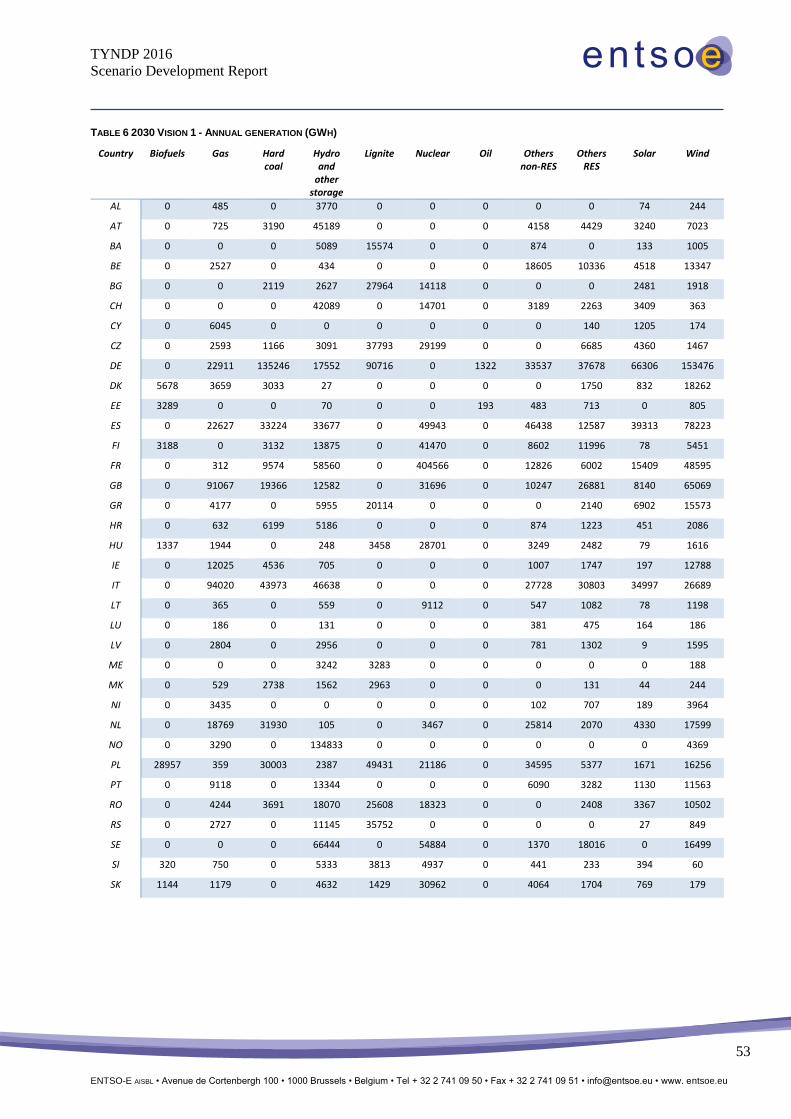
TYNDP 2016
Scenario Development Report
ENTSO-E AISBL • Avenue de Cortenbergh 100 • 1000 Brussels • Belgium • Tel + 32 2 741 09 50 • Fax + 32 2 741 09 51 • [email protected] • www. entsoe.eu
53
TABLE 6 2030 VISION 1 - ANNUAL GENERATION (GWH)
Country Biofuels Gas Hard coal
Hydro and
other storage
Lignite Nuclear Oil Others non-RES
Others RES
Solar Wind
AL 0 485 0 3770 0 0 0 0 0 74 244
AT 0 725 3190 45189 0 0 0 4158 4429 3240 7023
BA 0 0 0 5089 15574 0 0 874 0 133 1005
BE 0 2527 0 434 0 0 0 18605 10336 4518 13347
BG 0 0 2119 2627 27964 14118 0 0 0 2481 1918
CH 0 0 0 42089 0 14701 0 3189 2263 3409 363
CY 0 6045 0 0 0 0 0 0 140 1205 174
CZ 0 2593 1166 3091 37793 29199 0 0 6685 4360 1467
DE 0 22911 135246 17552 90716 0 1322 33537 37678 66306 153476
DK 5678 3659 3033 27 0 0 0 0 1750 832 18262
EE 3289 0 0 70 0 0 193 483 713 0 805
ES 0 22627 33224 33677 0 49943 0 46438 12587 39313 78223
FI 3188 0 3132 13875 0 41470 0 8602 11996 78 5451
FR 0 312 9574 58560 0 404566 0 12826 6002 15409 48595
GB 0 91067 19366 12582 0 31696 0 10247 26881 8140 65069
GR 0 4177 0 5955 20114 0 0 0 2140 6902 15573
HR 0 632 6199 5186 0 0 0 874 1223 451 2086
HU 1337 1944 0 248 3458 28701 0 3249 2482 79 1616
IE 0 12025 4536 705 0 0 0 1007 1747 197 12788
IT 0 94020 43973 46638 0 0 0 27728 30803 34997 26689
LT 0 365 0 559 0 9112 0 547 1082 78 1198
LU 0 186 0 131 0 0 0 381 475 164 186
LV 0 2804 0 2956 0 0 0 781 1302 9 1595
ME 0 0 0 3242 3283 0 0 0 0 0 188
MK 0 529 2738 1562 2963 0 0 0 131 44 244
NI 0 3435 0 0 0 0 0 102 707 189 3964
NL 0 18769 31930 105 0 3467 0 25814 2070 4330 17599
NO 0 3290 0 134833 0 0 0 0 0 0 4369
PL 28957 359 30003 2387 49431 21186 0 34595 5377 1671 16256
PT 0 9118 0 13344 0 0 0 6090 3282 1130 11563
RO 0 4244 3691 18070 25608 18323 0 0 2408 3367 10502
RS 0 2727 0 11145 35752 0 0 0 0 27 849
SE 0 0 0 66444 0 54884 0 1370 18016 0 16499
SI 320 750 0 5333 3813 4937 0 441 233 394 60
SK 1144 1179 0 4632 1429 30962 0 4064 1704 769 179

TYNDP 2016
Scenario Development Report
ENTSO-E AISBL • Avenue de Cortenbergh 100 • 1000 Brussels • Belgium • Tel + 32 2 741 09 50 • Fax + 32 2 741 09 51 • [email protected] • www. entsoe.eu
54
TABLE 7 2030 VISION 2 - INSTALLED CAPACITIES (MW)
Country Biofuels Gas Hard coal
Hydro and
other storage
Lignite Nuclear Oil Others non-RES
Others RES
Solar Wind
AL 0 400 0 3152 0 0 0 0 0 0 0
AT 0 3915 598 16418 0 0 196 990 800 2000 3880
BA 0 0 0 2107 2158 0 0 300 0 0 350
BE 0 7370 0 1438 0 0 0 3200 1700 4050 4900
BG 0 760 710 3150 4000 2000 0 0 0 1250 900
CH 0 0 0 18510 0 2115 0 850 600 1750 120
CY 0 1045 0 0 0 0 190 0 30 590 200
CZ 0 915 310 2170 5330 4140 0 0 1110 2560 580
DE 0 15463 23365 13257 12610 0 1026 8650 6960 46860 61200
DK 1460 2604 410 9 0 0 735 0 260 840 8410
EE 656 94 0 10 0 0 413 160 230 0 400
ES 0 21572 5900 23450 0 7120 0 10480 2400 33150 27650
FI 580 0 805 3400 0 5550 1360 1770 3760 100 2500
FR 0 6051 1740 25200 0 57644 819 5400 1400 8500 13900
GB 0 36736 2897 4754 0 4552 109 4050 5450 7460 57300
GR 0 3111 0 4259 2876 0 0 0 480 4050 4880
HR 0 1200 1200 2700 0 0 200 300 300 100 700
HU 210 2980 0 56 470 4108 407 720 550 60 750
IE 0 3575 750 508 0 0 260 210 250 10 3600
IT 0 34886 7926 22635 0 0 1394 10160 7240 27140 13400
LT 0 740 0 1265 0 1303 0 270 310 70 500
LU 0 375 0 1344 0 0 0 90 70 120 90
LV 0 1036 0 1621 0 0 0 150 250 60 360
ME 0 0 0 1215 450 0 0 0 0 0 120
MK 0 440 530 716 410 0 0 0 30 30 100
NI 0 1142 0 0 0 0 200 20 110 150 1220
NL 0 7776 4610 38 0 486 0 5080 300 5100 6160
NO 0 425 0 38900 0 0 0 0 0 0 2080
PL 5867 2804 5492 2426 7031 3000 0 7550 1210 500 6450
PT 0 3693 0 7858 0 0 0 1340 720 2010 5300
RO 0 3331 786 7737 4014 2630 0 0 500 2000 4200
RS 0 296 0 4308 4965 0 0 0 0 20 530
SE 0 0 0 16203 0 7992 0 470 5340 0 7840
SI 45 505 0 1929 545 696 0 120 60 280 40
SK 204 256 0 3140 223 4004 0 990 310 550 60

TYNDP 2016
Scenario Development Report
ENTSO-E AISBL • Avenue de Cortenbergh 100 • 1000 Brussels • Belgium • Tel + 32 2 741 09 50 • Fax + 32 2 741 09 51 • [email protected] • www. entsoe.eu
55
TABLE 8 2030 VISION 2 - ANNUAL GENERATION (GWH)
Country Biofuels Gas Hard coal
Hydro and
other storage
Lignite Nuclear Oil Others non-RES
Others RES
Solar Wind
AL 0 340 0 3770 0 0 0 0 0 0 0
AT 0 242 2233 45189 0 0 0 4158 4429 2592 6812
BA 0 0 0 5089 15484 0 0 874 0 0 550
BE 0 810 0 434 0 0 0 18605 10336 4518 13347
BG 0 0 1168 4205 26951 13849 0 0 0 1723 1438
CH 0 0 0 42089 0 14918 0 3189 2263 2339 198
CY 0 5568 0 0 0 0 0 0 140 1141 151
CZ 0 1991 745 3091 37075 28603 0 0 6685 3025 967
DE 0 19437 110363 17552 88747 0 1322 33537 37678 54282 128877
DK 5671 3653 2891 27 0 0 0 0 1750 832 26602
EE 2149 0 0 70 0 0 15 483 713 0 805
ES 0 16809 24025 33677 0 49821 0 46438 12587 69870 60291
FI 2421 0 1398 13875 0 40623 7 8602 11996 78 5451
FR 0 63 6978 58560 0 401833 0 12826 6002 10648 29847
GB 0 29787 13928 12582 0 31369 0 10247 26881 7343 160922
GR 0 2717 0 5955 20015 0 0 0 2140 6601 12302
HR 0 215 4945 5186 0 0 0 874 1223 314 1123
HU 1201 420 0 248 3323 28765 0 3249 2482 79 1616
IE 0 9773 3723 705 0 0 0 1007 1747 10 10416
IT 0 57769 36869 46612 0 0 0 27728 30803 38576 26689
LT 0 65 0 561 0 9096 0 547 1082 68 921
LU 0 100 0 131 0 0 0 381 475 131 129
LV 0 2335 0 2956 0 0 0 781 1302 56 686
ME 0 0 0 3242 3045 0 0 0 0 0 188
MK 0 248 2228 1562 2968 0 0 0 131 44 163
NI 0 3236 0 0 0 0 0 102 707 141 3181
NL 0 9710 28836 105 0 3339 0 25814 2070 5521 14663
NO 0 3255 0 136188 0 0 0 0 0 0 4369
PL 23715 7 25836 2387 49169 21047 0 34595 5377 557 11862
PT 0 2363 0 13399 0 0 0 6090 3282 2969 11563
RO 0 4108 3254 18082 23843 18644 0 0 2408 2693 8822
RS 0 2280 0 11151 35444 0 0 0 0 27 849
SE 0 0 0 66444 0 50542 0 1370 18016 0 16499
SI 328 661 0 5333 3765 4928 0 441 233 380 80
SK 1077 1126 0 4776 1444 31052 0 4064 1704 693 120

TYNDP 2016
Scenario Development Report
ENTSO-E AISBL • Avenue de Cortenbergh 100 • 1000 Brussels • Belgium • Tel + 32 2 741 09 50 • Fax + 32 2 741 09 51 • [email protected] • www. entsoe.eu
56
TABLE 9 2030 VISION 3 - INSTALLED CAPACITIES (MW)
Country Biofuels Gas Hard coal
Hydro and
other storage
Lignite Nuclear Oil Others non-RES
Others RES
Solar Wind
AL 0 500 0 3162 0 0 0 0 0 100 200
AT 0 6030 0 18471 0 0 196 990 1200 3500 5500
BA 0 373 0 2317 2158 0 0 0 0 100 900
BE 0 6840 0 2730 0 0 0 3200 2500 5800 8500
BG 0 1500 710 3468 3300 2000 0 0 0 2300 1700
CH 0 0 0 20160 0 1145 0 990 1120 4250 370
CY 0 800 0 0 0 0 285 0 30 600 230
CZ 0 1990 310 2170 5330 1880 0 0 1110 3690 880
DE 0 34429 14940 17637 10209 0 871 10630 9340 60740 100750
DK 1460 3746 410 9 0 0 735 0 260 1970 10750
EE 656 94 0 20 0 0 0 1010 300 100 650
ES 0 29208 4160 25050 0 7120 0 12210 5100 25000 39300
FI 580 970 0 4350 0 3350 2165 1390 4670 2500 5000
FR 0 14051 1740 27200 0 37646 819 5400 4800 24100 36600
GB 0 36616 0 7682 0 9022 75 4110 8420 15560 51090
GR 0 6252 0 4699 2212 0 0 0 650 5300 7800
HR 0 1700 1200 3000 0 0 200 300 300 200 1500
HU 210 4977 0 100 0 3000 407 720 1040 200 1000
IE 0 4270 0 558 0 0 260 710 1200 500 5500
IT 0 37993 7056 23535 0 0 1386 10160 10750 40400 18990
LT 0 923 0 1265 0 0 0 270 330 80 850
LU 0 375 0 1344 0 0 0 140 100 200 180
LV 0 1036 0 1621 0 0 0 150 400 20 1000
ME 0 0 0 1271 450 0 0 0 0 20 190
MK 0 720 330 716 410 0 0 0 30 40 200
NI 0 1590 0 50 0 0 150 180 320 300 1730
NL 4610 9358 0 38 0 486 0 5080 470 15400 12700
NO 0 855 0 40800 0 0 0 0 0 0 2910
PL 5240 1911 5389 3176 6571 0 0 9860 1210 4000 11000
PT 0 3717 0 9717 0 0 0 1560 850 910 6400
RO 0 4757 786 8087 4014 2630 0 0 800 2800 5500
RS 0 593 0 4308 5659 0 0 0 0 50 1000
SE 0 950 0 16203 0 7142 660 0 5340 1000 11400
SI 45 425 0 2005 545 1796 0 130 70 310 70
SK 204 843 0 3266 223 2880 0 810 520 720 260
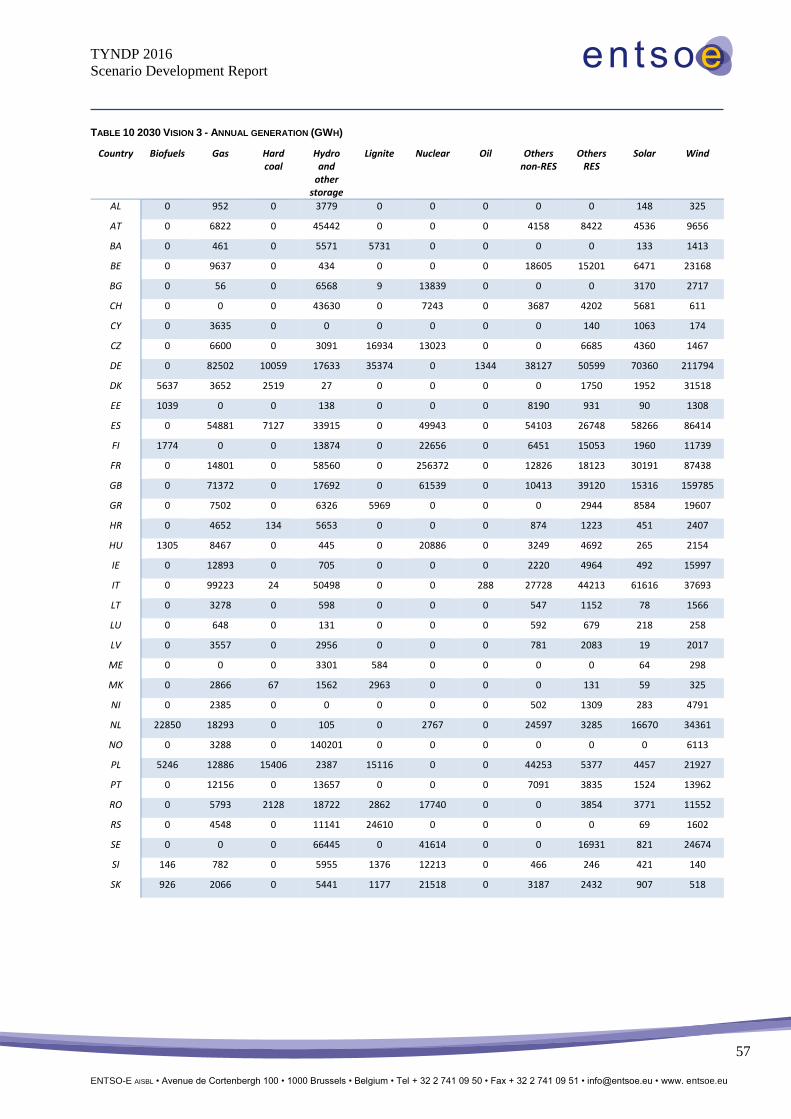
TYNDP 2016
Scenario Development Report
ENTSO-E AISBL • Avenue de Cortenbergh 100 • 1000 Brussels • Belgium • Tel + 32 2 741 09 50 • Fax + 32 2 741 09 51 • [email protected] • www. entsoe.eu
57
TABLE 10 2030 VISION 3 - ANNUAL GENERATION (GWH)
Country Biofuels Gas Hard coal
Hydro and
other storage
Lignite Nuclear Oil Others non-RES
Others RES
Solar Wind
AL 0 952 0 3779 0 0 0 0 0 148 325
AT 0 6822 0 45442 0 0 0 4158 8422 4536 9656
BA 0 461 0 5571 5731 0 0 0 0 133 1413
BE 0 9637 0 434 0 0 0 18605 15201 6471 23168
BG 0 56 0 6568 9 13839 0 0 0 3170 2717
CH 0 0 0 43630 0 7243 0 3687 4202 5681 611
CY 0 3635 0 0 0 0 0 0 140 1063 174
CZ 0 6600 0 3091 16934 13023 0 0 6685 4360 1467
DE 0 82502 10059 17633 35374 0 1344 38127 50599 70360 211794
DK 5637 3652 2519 27 0 0 0 0 1750 1952 31518
EE 1039 0 0 138 0 0 0 8190 931 90 1308
ES 0 54881 7127 33915 0 49943 0 54103 26748 58266 86414
FI 1774 0 0 13874 0 22656 0 6451 15053 1960 11739
FR 0 14801 0 58560 0 256372 0 12826 18123 30191 87438
GB 0 71372 0 17692 0 61539 0 10413 39120 15316 159785
GR 0 7502 0 6326 5969 0 0 0 2944 8584 19607
HR 0 4652 134 5653 0 0 0 874 1223 451 2407
HU 1305 8467 0 445 0 20886 0 3249 4692 265 2154
IE 0 12893 0 705 0 0 0 2220 4964 492 15997
IT 0 99223 24 50498 0 0 288 27728 44213 61616 37693
LT 0 3278 0 598 0 0 0 547 1152 78 1566
LU 0 648 0 131 0 0 0 592 679 218 258
LV 0 3557 0 2956 0 0 0 781 2083 19 2017
ME 0 0 0 3301 584 0 0 0 0 64 298
MK 0 2866 67 1562 2963 0 0 0 131 59 325
NI 0 2385 0 0 0 0 0 502 1309 283 4791
NL 22850 18293 0 105 0 2767 0 24597 3285 16670 34361
NO 0 3288 0 140201 0 0 0 0 0 0 6113
PL 5246 12886 15406 2387 15116 0 0 44253 5377 4457 21927
PT 0 12156 0 13657 0 0 0 7091 3835 1524 13962
RO 0 5793 2128 18722 2862 17740 0 0 3854 3771 11552
RS 0 4548 0 11141 24610 0 0 0 0 69 1602
SE 0 0 0 66445 0 41614 0 0 16931 821 24674
SI 146 782 0 5955 1376 12213 0 466 246 421 140
SK 926 2066 0 5441 1177 21518 0 3187 2432 907 518

TYNDP 2016
Scenario Development Report
ENTSO-E AISBL • Avenue de Cortenbergh 100 • 1000 Brussels • Belgium • Tel + 32 2 741 09 50 • Fax + 32 2 741 09 51 • [email protected] • www. entsoe.eu
58
TABLE 11 2030 VISION 4 - INSTALLED CAPACITIES (MW)
Country Biofuels Gas Hard coal
Hydro and
other storage
Lignite Nuclear Oil Others non-RES
Others RES
Solar Wind
AL 0 500 0 3162 0 0 0 0 0 449 175
AT 0 6030 0 22244 0 0 196 990 1200 3000 4750
BA 0 373 0 2618 943 0 0 0 0 100 770
BE 0 6840 0 2226 0 0 0 3200 2500 4925 7518
BG 0 1500 710 3468 0 2000 0 0 0 2598 1450
CH 0 0 0 20160 0 1145 0 990 1120 3692 295
CY 0 800 0 0 0 0 285 0 30 590 230
CZ 0 1990 310 2170 4424 1880 0 0 1110 3690 880
DE 0 34429 14940 14505 9026 0 871 10630 9340 58990 96967
DK 1460 3746 410 9 0 0 735 0 260 1405 12825
EE 656 94 0 20 0 0 0 1010 300 50 525
ES 0 29208 4160 25635 0 7120 0 12210 5100 54130 40604
FI 580 970 0 3400 0 3350 2165 1390 4670 1300 4057
FR 0 14051 1740 27200 0 37646 819 5400 4800 18200 44851
GB 0 36616 0 5470 0 9022 75 4110 8420 11915 57901
GR 0 6252 0 4366 1070 0 0 0 650 8384 12335
HR 0 1700 1200 3200 0 0 200 300 300 929 1400
HU 210 4977 0 100 0 3000 407 720 1040 339 7114
IE 0 4270 0 558 0 0 260 710 1200 350 5090
IT 0 37993 5667 23535 0 0 1386 10160 10750 42169 23459
LT 0 923 0 1265 0 0 0 270 330 80 750
LU 0 375 0 1344 0 0 0 140 100 175 155
LV 0 1036 0 1621 0 0 0 150 400 15 900
ME 0 0 0 1271 450 0 0 0 0 20 155
MK 0 720 330 716 0 0 0 0 30 736 175
NI 0 1590 0 0 0 0 150 180 320 250 1590
NL 4610 9358 0 38 0 486 0 5080 470 9700 9995
NO 0 855 0 48700 0 0 0 0 0 0 2495
PL 5240 1911 5389 3176 6571 0 0 9860 1210 2750 9950
PT 0 3717 0 9717 0 0 0 1560 850 3280 8572
RO 0 4757 786 8100 465 2630 0 0 800 2650 9371
RS 0 593 0 4308 1609 0 0 0 0 512 765
SE 0 950 0 16203 0 7142 660 0 5340 500 9620
SI 45 425 0 2005 545 1796 0 130 70 444 931
SK 204 843 0 3266 0 2880 0 810 520 665 831

TYNDP 2016
Scenario Development Report
ENTSO-E AISBL • Avenue de Cortenbergh 100 • 1000 Brussels • Belgium • Tel + 32 2 741 09 50 • Fax + 32 2 741 09 51 • [email protected] • www. entsoe.eu
59
TABLE 12 2030 VISION 4 - ANNUAL GENERATION (GWH)
Country Biofuels Gas Hard coal
Hydro and
other storage
Lignite Nuclear Oil Others non-RES
Others RES
Solar Wind
AL 0 1739 0 3779 0 0 0 0 0 665 285
AT 0 11993 0 44958 0 0 0 4158 8422 3888 8339
BA 0 1114 0 6730 6387 0 0 0 0 133 1209
BE 0 15261 0 434 0 0 0 18605 15201 5494 21149
BG 0 582 161 6575 0 13981 0 0 0 3581 2317
CH 0 0 0 43630 0 7931 0 3687 4202 4935 487
CY 0 2585 0 0 0 0 0 0 140 1047 174
CZ 0 3918 12 3091 17913 13012 0 0 6685 4360 1467
DE 0 103125 16412 17633 39628 0 1344 38127 50599 68333 217037
DK 5682 3657 2777 27 0 0 0 0 1750 1392 41273
EE 1433 4 0 138 0 0 0 8190 931 45 1056
ES 0 48169 705 33677 0 47510 0 54103 26748 112707 89032
FI 3918 234 0 13874 0 24768 93 6451 15053 1019 9231
FR 0 17907 811 58561 0 257029 0 12826 18123 22801 121980
GB 0 89141 0 17692 0 57099 0 10413 39120 11728 168886
GR 0 12688 0 6324 5820 0 0 0 2944 13233 31040
HR 0 5940 663 5941 0 0 0 874 1223 1449 2247
HU 1417 10207 0 445 0 21023 0 3249 4692 449 15326
IE 0 11748 0 705 0 0 0 2220 4964 344 14769
IT 0 132368 537 50579 0 0 290 27728 44213 63821 46735
LT 0 5753 0 570 0 0 0 547 1152 78 1382
LU 0 1016 0 131 0 0 0 592 679 191 222
LV 0 5827 0 2956 0 0 0 781 2083 14 1806
ME 0 0 0 3301 991 0 0 0 0 64 243
MK 0 4159 379 1562 0 0 0 0 131 1089 285
NI 0 501 0 0 0 0 0 502 1309 236 4377
NL 25257 27495 0 105 0 3041 0 24597 3285 10500 26487
NO 0 1967 0 135085 0 0 0 0 0 0 5241
PL 22418 14411 26175 2387 7663 0 0 44253 5377 3064 19091
PT 0 8268 0 13702 0 0 0 7091 3835 4874 18701
RO 0 8242 2320 18757 1844 17948 0 0 3854 3569 19682
RS 0 3882 0 11143 11373 0 0 0 0 704 1226
SE 0 258 0 66444 0 49361 50 0 16931 411 20586
SI 163 806 0 5955 814 12243 0 466 246 602 1861
SK 74 1498 0 5567 0 22161 0 3187 2432 838 1657