tyndp 2022 draft scenario report, october 2021
TRANSCRIPT

TYNDP 2022Draft Scenario Report
October 2021


ENTSO-E // ENTSOG TYNDP 2022 Draft Scenario Report // 3
Contents
Foreword 4
1 Executive summary 6
2 Purpose of the Scenario Report 8
3 Scenario descriptions and storylines 10
4 Scenario results 14
4.1 Demand 15
4.2 Supply 24
4.3 Imports 36
4.4 GHG emissions 37
5 The cost of electricity 44
6 Benchmarking 50
6.1 Final energy demand 51
6.2 Final electricity demand 51
6.3 Electricity generation 52
6.4 Gas supply 54
6.5 Biomass supply 56
6.6 Energy imports 57
6.7 Carbon capture and storage 58
7 Stakeholder engagement and how it shaped the scenarios 59
8 Improvements in the TYNDP 2022 scenarios 62
8.1 Proactive and early stakeholder engagement 62
8.2 Even more contrasting scenarios 63
8.3 Enhancements to the sector coupling methodology 63
8.4 Considerations of hydrogen system in the mid-/long term and of a wider range of electrolysis configurations 63
8.5 Vehicle-to-Grid and prosumer modelling 64
8.6 Optimisation of district heating operation 64
9 Next steps 65
10 Glossary 66
Imprint 68

4 // ENTSO-E // ENTSOG TYNDP 2022 Draft Scenario Report
We are happy to present to you the gas and electricity joint Scenario Report, the third report of its kind resulting from the close collaboration of ENTSOG and ENTSO-E to develop scenarios for the whole energy system. Scenario work is the first important step to capture the interactions between the gas and electricity systems and is therefore paramount to deliver the best assessment of the infrastructure from an integrated sys-tem perspective. The joint work also provides a basis to allow assessment for the Euro-pean Commission’s Projects of Common Interest (PCI) list for energy, as ENTSOG and ENTSO-E progress to develop their Ten-Year Network Development Plans (TYNDPs).
The outcomes of the work presented illustrates the unique position of the gas and electricity TSOs to provide quanti-tative and qualitative output while also building upon the synergies and interlinkages between the two sectors: in total almost 80 TSOs, covering more than 35 countries, contributed to this collaborative process. The combined expertise, knowhow and modelling capabilities enabled ENTSOG and ENTSO-E to build a set of ambitious and technically robust scenarios which are fully compliant with the Paris Agreement and with the European ambitions for achieving climate neutrality by 2050. The scenarios aim to provide a quantitative basis for infrastructure investment planning and insights into the evolution of integrated energy system perspective, while remaining both tech-nology- and energy-carrier neutral.
Transparent, inclusive and active stakeholder engagement has been a crucial element in the development of this first step of the TYNDP process and will continue to be in future editions. We have worked closely with numerous stakeholders from a wide range of industries and sectors, NGOs, National Regulatory Authorities and Member States, among others, in order to ensure transparency of processes and data, robust assumptions and inputs, and data compa-rability and availability. Scenario Report builds up on the feedback and recommendations received through multiple stakeholder workshops covering each step of the scenario building process, two extensive public consultations on the scenario assumptions and the scenarios themselves, as well as numerous bilateral exchanges with stakeholders. In addition, the Scenario Report is accompanied by a Scenario Building Guidelines Report offering a detailed description of the underlying assumptions for the scenarios and the modelling process and methodology, and all raw data and individual datasets are published to allow readers/users to scrutinise both individual figures per Member State and combined figures for Europe.
Foreword
Jan Ingwersen General Director ENTSOG
Sonya Twohig Secretary-General ENTSO-E
ENTSO-E // ENTSOG TYNDP 2022 Draft Scenario Report // 5
A core element of ENTSO-E and ENTSOG’s scenario building process has been the use of supply and demand data collected from both gas and electricity TSOs as well as from official EU and Member State data sources and key industry projections to build robust bottom-up scenarios. This approach is used for the National Trends Scenario, the central policy scenario of this report, recognising national and EU climate targets as reflected in the latest Member States’ National Energy and Climate Plans (NECPs). In view of the 1.5 °C target of the Paris Agreement and the EU Climate Law ambition of minimum 55 % GHG emission reductions by 2030 and net zero by 2050, the ENTSOs have also developed the Global Ambition and Distributed Energy Scenarios using a top-down approach with a full-energy perspective. For the first time, the scenarios utilise new sector-coupling methodologies and dedicated modelling tools both to optimise overall system efficiencies and flexibility use as well as to capture better the interactions and new dynamics at the interfaces be-tween various end-use sectors (e. g., vehicle-to-grid and prosumer modelling), at various geographical scales (e. g., district heating) and with other carriers (Power-to-Gas and Power-to-liquid). It is also the first time that the scenarios have modelled hydrogen and electrolysis at pan-European scale.
As ENTSOG and ENTSO-E look to the future, it is evident that energy system integration, and innovation will be key to meeting European energy consumers’ needs, whilst also achieving EU climate neutrality goals by 2050.
A fully integrated energy system can deliver more efficient decarbonisation solutions and enable the European production of gas and electricity to become carbon neutral already by 2050. An integrated approach connecting gas and electricity networks and countries seamlessly will support the uptake of new technologies and foster regional and pan-European economies of scale, while ensuring reliable electricity and gas supplies to consumer throughout the year, including peak demand situations. Hydrogen will be a game changer for both gas
and electricity systems as it will support decarbonisation efforts, interlink the two systems while further unlocking the potentials of renewable electricity sources to deliver system flexibility and energy autonomy at European scale. Moreover, the increasing integration of electricity, methane and hydrogen infrastructures and the efficient use of electrolysis technologies will also support large-scale renewables’ integration and solutions to support system flexibility needs.
Achieving net-zero emissions requires a wide range of actions from all sectors of society, but energy efficiency is key to achieve the EU climate neutrality objectives. The improvement of existing technology options and the active participation of consumers through smart energy use and behavioural adaptations supports the efficient use of renewable and low-carbon technology solutions for cross-sectorial decarbonisation.
Last but not least, the Scenarios show that to achieve net-zero emissions, innovation in new and existing technologies is required to reduce the costs of energy from renewable energy sources, increase the efficiency of user appliances, facilitate demand side response and consumer participation, support renewable and decarbonised gases, develop technologies that will support negative emissions, and reap the benefits of a circular economy, while ensuring long-term sustainability for future generations.
The development of this comprehensive, reliable and contrasted set of possible energy futures, as presented in the Scenario Report, will allow the TYNDPs to perform a sound and comprehensive assessment of European energy infrastructure requirements from a whole energy system perspective and will provide decision makers with better information, as they seek to make informed choices that will benefit all European consumers.
We look forward to working with you again as we follow the next important steps in the TYNDP process.

6 // ENTSO-E // ENTSOG TYNDP 2022 Draft Scenario Report
Executive summary1Building on the previous scenario reports and cooperative work of gas and electricity planning experts across Europe, the draft joint TYNDP 2022 scenario report is more ambitious, more inclusive and more transparent than previous editions. It includes two COP 21-compliant scenarios and ENTSO-E and ENTSOG have gone to great lengths to capture the impact of the fast-moving and fast-paced energy transition on electricity and gas infrastructure. The draft joint TYNDP 2022 scenario report is the building block of the future gas and electricity TYNDPs and contains a series of important highlights for the future of Europe's energy system:
Net-zero can be achieved by 2050 while ensuring the security of energy supply
Both Distributed Energy and Global Ambition scenarios reach –55 % of GHG reduction in 2030 and net-zero in 2050. These targets are achieved with an/the ambitious development of energy efficiency and renewable and
low carbon technology solutions in EU Member States. This achievement requires a wide range of actions whose impact depends on an appropriate political, societal, and economic framework.
Energy efficiency is key to achieve the EU long-term Climate and Energy objectives
The efficiency first principle is key to minimise the chal-lenges of decarbonising the energy supply and requires among others:
- Continued improvement of existing technology options, whilst switching to new and emerging technologies where further efficiency gains can be obtained.
- Active participation of end consumers through smart energy use and behavioural adaptation.
- Direct electrification is key to achieve the decarbon-isation objectives when it can ensure an efficient use of renewable energy. Decarbonising all energy carriers is crucial to ensure a competitive, resilient, and reliable energy system.
- There is a need to rapidly invest in negative emission.

ENTSO-E // ENTSOG TYNDP 2022 Draft Scenario Report // 7
Ambitious development of renewable energy across Europe
All decarbonisation and renewable technologies are need-ed to reach net-zero 2050 and European renewable energy will be essential:
- Long term climatic targets can be achieved through sustained growth and substantial investment in all Eu-ropean renewable energy sources including wind, solar, and biomethane.
- Fostering renewable energy production at consumer level (e. g., prosumers, energy positive buildings …) will contribute to scaling up and embracing clean energy supply.
- Transmission infrastructure is needed to connect areas of high renewable energy potential to the high demand centres.
- Acceptance of energy infrastructure expansion is para-mount to achieve climatic targets
Sector Integration provides efficient decarbonisation solutions
A fully integrated system can deliver efficient decarbonisa-tion solutions and enable the European production of gas and electricity to be carbon neutral by 2040.
- Integration of electricity, methane and hydrogen in-frastructures provides a wide range of opportunities to solve short term and seasonal flexibility needs in a net-zero energy system.
- The development of hydrogen and synthetic fuels by electrolysis will foster further development of wind and solar.
- District heating and urban energy planning can support smarter utility from a broader range and combination of energy sources.
Integrated energy systems: hydrogen is a game changer for gas and electricity systems
- Hydrogen can efficiently contribute to the transition of the current gas system into a carbon neutral and more integrated system.
- Hydrogen can unlock the full potential of renewable electricity resources. It will contribute to reinforcing the security of supply in Europe.
- While reducing import dependence, a European hydro-gen market is an opportunity for the EU to take part to a global clean energy market and import decarbonised energy.
Innovation is key to achieve a sustainable energy future
The scenarios depict several ways in which the European energy system may evolve. They aim to reach climate neutrality; however, it cannot be ignored that there are additional factors and challenges that go beyond what is needed to understand for energy infrastructure planning. Further attention is needed to understand the impact in
the shift towards a sustainable economy including recy-cling and repurposing, enabling stable supply chains, use of land space and scarce resources, training of workforce, financing, and citizen engagement. Innovation goes beyond technical knowhow to ensure the energy system is made sustainable in time for future generations.
The draft joint TYNDP 2022 scenario report comes with enlarged data sets available through a dedicated data visualisation platform. These scenario data sets can be used by stakeholders to do their own studies on possible energy futures. ENTSOG and ENTSO-E have also provided full transparency on how scenarios are built and how each factor influencing the development of gas and electricity in-
frastructure is considered. ENTSOG and ENTSO-E will con-tinue striving to improve their scenario report, engaging as early as possible with stakeholders, increasing transparency and usability. Both associations hope this report will give readers a qualitative insight into the impact of the energy transition on Europe's future gas and electricity networks.
8 // ENTSO-E // ENTSOG TYNDP 2022 Draft Scenario Report
What is the purpose of the scenarios and how should they be used?
As outlined in Regulation (EU) 347/2013, ENTSOG and ENTSO-E are required to use scenarios as the basis for the official Ten-Year Network Development Plans ( created every two years by ENTSOG and ENTSO-E) and for the calculation of the cost-benefit analysis (CBA) used to determine EU funding for electricity and gas infrastruc-ture Projects of Common Interest (PCI). The scenarios are designed specifically for this purpose. Where possible, they have been derived from official EU and Member-State data sources and are intended to provide an impartial quantita-tive basis for infrastructure investment planning.
The scenarios are intended to project the long-term ener-gy demand and supply for the drafting of ENTSOG’s and ENTSO-E’s Ten-Year Network Development Plans within the context of the ongoing energy transition. They are designed in such a way that they specifically explore those
uncertainties which are relevant for gas and electricity infrastructure development. As such, they primarily focus on aspects which determine the infrastructure utilisation. Furthermore, the scenarios draw extensively on the current European political and economic consensus and attempt to follow a logical trajectory to achieve future energy and climate targets.
The scenarios should provide the user with insight into the possible energy system of the future and the role of electricity and gaseous carriers in this energy system as well as the effects of changes in supply and demand on the energy system. The European and global perspectives for these scenarios enable the user to track supply and demand developments geographically as well as temporally and to gain greater insight into the challenges facing ener-gy infrastructure during the energy transition.
Purpose of the Scenario Report2
ENTSO-E // ENTSOG TYNDP 2022 Draft Scenario Report // 9
What is not the purpose of the scenarios?
ENTSOG and ENTSO-E have gone to great lengths to build on previous Scenario Reports and to increase its am-bitions, especially in considering external factors such as the energy transition and the impacts of decarbonisation of the European energy system on energy infrastructure. Nonetheless, it is important to recognise that the scope of these scenarios remains focused on providing sufficient input data to investigate future infrastructure needs.
ENTSOG and ENTSO-E have sought to avoid making polit-ical statements with these scenarios and, as far as possible, to anchor key parameters in widely accepted data and assumptions. The National Trends scenario exists within an input framework provided by official data sets (such as PRIMES) and official energy and climate policies from the EU Member States (the NECPs, hydrogen strategies, etc.). The goal of ENTSOG and ENTSO-E has been to maintain a neutral perspective to these inputs.
While the COP 21-compliant scenarios (Global Ambition and Distributed Energy) have greater room for innovation to meet more ambitious decarbonisation of the energy system up to 2050, it is not the intention of ENTSOG and ENTSO-E to use these scenarios to push political agendas attached to the use or non-use of specific energy carriers or technologies. The main focus of the TYNDP Scenario Report is the long-term development of energy infrastruc-ture. As such, the differences between the two COP 21 compliant scenarios are predominantly related to possible variations in demand and supply patterns.
To this end, all the scenarios in the TYNDP 2022 Scenario Report remain technology and energy-carrier neutral. The energy mix deployed in each of these scenarios has been designed to reflect a broad consensus within the energy industry and correlates to a large extent with official literature – most prominently with the EU’s own Impact Assessment scenarios.
The TYNDP 2022 Scenario Report attempts to reflect the energy transition and the decarbonisation efforts of the European energy system in its scenarios. This is incorpo-rated by the use of the COP 21 Agreement (in the form of a carbon budget calculation) as one of the key input parameters for the COP 21-compliant scenarios. However, it is important to recognise that it is beyond the scope (and indeed the resources) of the scenarios to analyse political, environmental and societal developments on the widest scale.
Above all it is important to recognise the fast-moving nature of the energy transition in Europe. ENTSOG and ENTSO-E recognise that some of the input parameters used in the creation of these scenarios may well need to be adjusted in the months and years to come as the energy policy of the EU and its Member States evolves to meet the challenges of climate change. The TYNDP Scenario Building Process is an iterative process, and it continues to evolve based on external influences. A scenario is a picture of a possible future under certain defined circumstances, not a forecast of what the future will look like. Simulta-neously, it reflects present knowledge and the expected challenges already foreseen today.

10 // ENTSO-E // ENTSOG TYNDP 2022 Draft Scenario Report
Scenarios have to ensure both consistency between successive TYNDP reports and to capture new developments and expectations. For this purpose, initial storylines proposed to stakeholders were derived from the TYNDP 2020 scenarios already taking into account the feedback received during the Q4 2020 public consultation. The final scenario storylines are laid out in the Final Storyline Report published in April 2021. This chapter recaps the most important information of the Storyline Report.
Scenario drivers
Storylines aim to ensure that sufficient differences are made between the scenarios by correctly identifying high-level drivers and quantifying their outcomes. The en-ergy landscape is constantly evolving and scenarios need to keep pace with the main drivers and trends affecting the energy system and in particular the gas and electric-ity infrastructures. A key success factor in understanding these drivers is the ongoing dialogue with stakeholders like NGOs, policy makers and industrial associations. Based on this engagement process ENTSOG and ENTSO-E identified four high level drivers:
Green transition reflects the level of GHG reduction targets and is one of the most important political drivers of energy scenarios. The European Union has ratified the Paris Agreement. This implies a commitment to the long-term goal of keeping the increase in global average temperature to well below 2 °C compared to pre-industrial levels and to pursue efforts to limit the increase to 1.5 °C. The current EU decarbonisation targets consider at least –55 % greenhouse gas reduction in 2030. For 2050 there are non-binding decarbonisation targets (80 to 95 % cuts in GHG emission from 1990 levels). Moreover, ENTSOG
Scenario descriptions and storylines3

ENTSO-E // ENTSOG TYNDP 2022 Draft Scenario Report // 11
and ENTSO-E acknowledge that setting GHG emissions targets for 2030 and 2050 is not sufficient for keeping temperature rise below 1.5 °C. As a result, the scenarios will consider a carbon budget up to 2100 including emis-sions and removals from agriculture and from Land Use, Land Use Change and Forestry (LULUCF)1.
Beyond climate targets, the European energy system will be increasingly shaped by societal decisions and initiatives acting as a driving force of the energy transition. This sce-nario driver translates in the level of (de)centralisation and energy autonomy which both strongly impact the structure of the European energy system and therefore the need of infrastructure. Currently the EU primary energy consump-tion relies strongly on centralised production sources and import from outside Europe. Whether this dependency will remain is rather uncertain. Especially when considering the current uptake of wind and photovoltaic technolo-gies, enabling localised (self-)production and smart use of distributed energy supply. This makes it a relevant driver to be explored in the scenarios.
1 For the assessment of the carbon budget, ENTSOG and ENTSO-E will build upon the work performed together with CAN Europe for the TYNDP 2020 scenarios.
2 The present scenarios only cover technologies having reached some degree of maturity in the early 2020s. Other technologies such as Direct Air Capture or innovative ways to produce synthetic fuel are not considered in the scenarios up to 2050. But it is assumed that these technologies can reach commercial maturity after 2050.
3 As the 2022 time horizon are not used in ENTSO-E TYNDP, the report figures for this year refer to gas TSO data collection without modelling of the electricity system.
Energy intensity is a result of innovation and consumer behaviour and can be a major factor in the transition of the energy system. New appliances and technological innovation reduce specific energy demand or facilitate the participation of consumers in the energy system. On the other side, new technologies can lead to additional energy demand. Moreover, consumers can reduce their consumption by modal shifts, for example using the bike instead of the car for shorter distances or by more shared economy through public transport and vehicle sharing. This also applies to agriculture and industrial sectors, where a drive towards circularity could lower energy demand, but an increase economic activity could at least partly offset the efficiency gains. Assumptions need to be made for each sector and energy application.
Technological progress is a driver for the energy system evolution. It can act both as an enabler of other drivers (e. g. more powerful wind turbine helping to further harvest EU RES potential) and as a trigger (e. g. electrolysis paving the way to a hydrogen economy). Further assumptions are made to define the market shares for different technolo-gies/appliances, for example through technology prices2.
Scenarios will cover different time horizons
For both 20223 and 2025 a “Best Estimate” scenario is developed. For the quantification of this time horizon ENTSOG and ENTSO-E use data collected from the TSOs.
These figures reflect current national and European regu-lations as stated end of 2020.
Figure 1: Scenario framework for TYNDP 2022
2022 2025 205020402030
Best Estimate
TYNDP scenario horizon
Assessment of pathways compliant wit Paris Agreement
National Trends
Distributed Energy
Global AmbitionGlobal Ambition CMYK 80C 20MRGB 0/155/217
CMYK 30C 100YRGB 184/14/128
CMYK 60M 100YRGB 238/125/0
Distributed Energy
National Trends
Global Ambition CMYK 80C 20MRGB 0/155/217
CMYK 30C 100YRGB 184/14/128
CMYK 60M 100YRGB 238/125/0
Distributed Energy
National Trends
Global Ambition CMYK 80C 20MRGB 0/155/217
CMYK 30C 100YRGB 184/14/128
CMYK 60M 100YRGB 238/125/0
Distributed Energy
National Trends

12 // ENTSO-E // ENTSOG TYNDP 2022 Draft Scenario Report
The long-term goals, starting from 2030, will be covered by three different scenarios, reflecting increas-ing uncertainties towards 2050.
4 As most of national material focuses on the path to 2030, extending the National Trends scenario beyond 2040 would require additional assump-tions no longer reflecting national policies and strategies. The expansion model for National Trends for the 2040 time horizon is not run at Draft Scenario report stage. TYNDP 2022 scenario results for National Trends 2040 will be included in the final scenario report. For methane and hydro-gen National Trends figures are provided up to 2040. For gas for power it used a proxy value based on data collected from the TSOs.
– The National Trends scenario is in line with national energy and climate policies (NECPs , national long-term strategies, hydrogen strategies, etc.) derived from the European targets. The electricity and gas datasets for this scenario are based on figures collected from the TSOs translating the latest policy- and market-driven developments as discussed at national level. The quan-tification of National Trends focuses on electricity and gas up to 20404. ENTSOG and ENTSO-E invite stake-holders to refer to the national documents to have a more energy-wide perspective.
– In addition to the National Trends scenario, which is aligned with national policies, ENTSOG and ENTSO-E have developed two COP 21 compliant scenarios. These are built as full energy scenarios (all sectors, all energy carriers) in order to quantify compliance with EU poli-cies and climate ambitions. Both scenarios aim at reach-ing the 1.5 °C target of the Paris Agreement following the carbon budget approach. They are developed on a country-level until 2040 and on an EU27-level until 2050.

ENTSO-E // ENTSOG TYNDP 2022 Draft Scenario Report // 13
Storylines for COP 21 scenarios
ENTSOG and ENTSO-E applied the aforementioned sce-nario drivers and the scenario framework to create two COP 21 compliant scenario storylines:
Distributed Energy (DE) pictures a pathway achieving EU-27 carbon neutrality by 2050 and at least 55 % emission reduction in 2030. The scenario is driven by a willingness of the society to achieve energy autonomy based on widely available indigenous renewable energy sources. It translates into both a way-of-life evolution and a strong decentralised drive towards decarbonisation through local initiatives by citizens, communities and businesses, supported by authorities. This leads to a maximization of renewable energy production in Europe and a strong decrease of energy imports.
Global Ambition (GA) pictures a pathway to achieving car-bon neutrality by 2050 and at least 55 % emission reduction in 2030, driven by a global move towards the Paris Agree-
ment targets. It translates into the development of a wide range of renewable and low-carbon technologies (many being centralised) and the use of global energy trade as a tool to accelerate decarbonisation. Economies of scale lead to significant cost reductions in emerging technologies such as offshore wind, but also imports of decarbonised energy from competitive sources are considered as a viable option.
The final storylines are the product of extensive stake-holder engagements and a public consultation conducted in 2020. Both storylines are designed to explore different pathways with regard to the identified scenario drivers, with the purpose of covering the uncertainty in the possi-ble use of energy infrastructure. This is further elaborated in the Scenario Matrix that was published as part of the Final Storyline Report. Figure 2 provides an overview of the most important storyline assumptions. More informa-tion on the scenario storylines can be found in the Final Storyline Report.
Figure 2: Storylines for the two COP 21 scenarios
Distributed EnergyHigher European autonomy with renewable and decentralised focus
Global AmbitionGlobal economy with centralised low carbon and RES options
Green Transition At least a –55 % reduction in 2030, climate neutral in 2050
Driving force of the energy transition
Transition initiated at a local / national level (prosumers)
Transition initiated at a European / international level
Aims for EU energy autonomy through maximisa-tion of RES and smart sector integration (P2G/L)
High EU RES development supplemented with low carbon energy and imports
Energy intensity
Reduced energy demand through circularity and better energy consumption behaviour
Energy demand also declines, but priority is given to decarbonisation of energy supply
Digitalisation driven by prosumer and variable RES management
Digitalisation and automation reinforce competitiveness of EU business
Technologies
Focus of decentralised technologies (PV, batteries, etc.) and smart charging
Focus on large scale technologies (offshore wind, large storage)
Focus on electric heat pumps and district heating Focus on hybrid heating technology
Higher share of EV, with e-liquids and biofuels supplementing for heavy transport
Wide range of technologies across mobility sectors (electricity, hydrogen and biofuels)
Minimal CCS and nuclear Integration of nuclear and CCS
Global Ambition CMYK 80C 20MRGB 0/155/217
CMYK 30C 100YRGB 184/14/128
CMYK 60M 100YRGB 238/125/0
Distributed Energy
National Trends
Global Ambition CMYK 80C 20MRGB 0/155/217
CMYK 30C 100YRGB 184/14/128
CMYK 60M 100YRGB 238/125/0
Distributed Energy
National Trends

14 // ENTSO-E // ENTSOG TYNDP 2022 Draft Scenario Report
This chapter presents the main quantification of the scenarios for TYNDP 2022. The level of detail provided for each scenario depends on the approach of building the data sets. As Best Estimate and National Trends are based on TSO data, the results are limited to electricity and gas. The final energy demand supplied by other primary fuels, such as oil and coal are not in the focus of these scenarios. Distributed Energy and Global Ambition are developed as full energy scenarios and results are provided for all sectors and energy carriers. The full-energy nature of the quantification also enables the assessment of carbon emissions for the two COP 21 scenarios.
This chapter provides a European overview of the scenario results for demand, supply and emissions at EU-27 level. All figures are expressed in net calorific value. Data per country (including some non-EU countries which were in-cluded in the modelling) can be found on the visualisation platform.
The present report aims first at providing a consistent European picture of possible evolution of the energy system along the pathways defined by the storyline to support the public consultation. Stakeholder feedback will provide the opportunity to further refine these scenarios and better take into account some country specifics in the updated version that will be used as a basis for ENTSOG and ENTSO-E TYNDPs.
Scenario results4

ENTSO-E // ENTSOG TYNDP 2022 Draft Scenario Report // 15
4.1 Demand
4.1.1 Final energy demand
Energy efficiency: the EU can significantly reduce its energy demand by 2050
In both COP 21 scenarios, the overall energy demand of the EU significantly decreases with the combination of energy efficiency measures (renovation of buildings and switch to new or more efficient technologies) and the effect of further system integration.
With further electrification and system integration, the EU can make more efficient use of its renewable electricity production, increase the efficiency of variable renewables and improve security of supply:
- Direct use of renewable electricity and responsive demand can reduce the mismatch between production and demand while avoiding unnecessary conversion losses.
- Variable renewables are more productive since they can produce renewable hydrogen whenever the electricity demand is lower than the available renewable capacity.
- The need for additional renewables and decarbonisa-tion capacities is more limited thanks to the integration of hydrogen from variable renewables into the gas sys-tem and shorter-term battery solutions.
- With significant storage capacities, the gas system can provide flexibility to the electricity system when the electricity demand is higher than the production, especially during seasonal and extreme climatic events. Besides its transportation tasks, the European gas in-frastructure serves as the back-bone for the EU energy system.
Figure 3: Final energy demand per carrier (energy and non-energy use for feedstock) for EU27 (Ambient heat from heat pumps not taken into account.)
In Distributed Energy scenario, in 2050, electricity rep-resents 46 % of the final demand and gaseous hydrogen 17 %. In Global Ambition scenario, electricity and gaseous hydrogen represent respectively 39 % and 20 % of the final energy demand in 2050.
Final energy demand reduction is achieved through a wide range of actions such as, but not limited to:
- Conversion from less efficient to more efficient heating options, e. g., heat pump technologies, such as electric and hybrid heat pumps (electric heat pump associated with condensing gas boiler).
TWh
0
2,000
4,000
6,000
8,000
10,000
12,000
14,000
Reference 2030 2040 2050 Reference 2030 2040 2050Distributed Energy Global Ambition
Others Biomass Solids Liquids Methane Hydrogen Electricity

16 // ENTSO-E // ENTSOG TYNDP 2022 Draft Scenario Report
- Switch from low efficiency transport options to more efficient modes of transport.
- Energy efficiency product standards continuing to deliver energy efficiency gains for end-user appliances.
5 Non-energy uses amount for 1484 TWh in Distributed Energy and 1,834 TWh in Global Ambition
6 Directive (EU 2018/2002) aiming to reduce the final energy consumptions (FEC) for 2030 under 957 Mtoe.
7 For residential and tertiary sectors, the historic values are based on 2018. For the other sectors (industry, agriculture, energy branch, mobility) 2015 values are the most recent with sufficient level of detail.
- In the built environment, thermal insulation reduces demand for heat.
- Behavioural changes where consumers actively reduce demand either by utilizing more public transport or modifying heating and cooling comfort levels.
Figure 4: Energy demand per sector (energy and non-energy use for feedstock) for EU27 (Ambient heat from heat pumps not taken into account.)
The final energy consumption (including electricity losses and excluding non-energy use5) of Distributed Energy and Global Ambition are respectively 906 Mtoe (10,536 TWh) and 927 Mtoe (10,781 TWh) in 2030. As a result both COP
21 scenarios meet the 2030 binding targets set by the EU6 to reduce the final energy consumptions (FEC) for 2030 under 957 Mtoe.
4.1.2 Direct electricity demand
Despite the fact that final energy demand in both scenarios decreases over time, direct electricity demand share grows up to 47 % in Distributed Energy scenario, and 36 % in Global Ambition scenario compared to the reference year7. This is mainly caused by the replacement of fossil fuel powered solutions with electric ones.
Growth in electricity demand can be seen in every sector. However, a strong focus on efficiency gains helps slow this process (e. g., high-efficiency consumer appliances, better thermal insulation of buildings).
Electricity demand from transport sector to rise 8 to 11-fold by 2050 due to uptake of electric vehicles.
The main driver of electricity demand growth is the trans-port sector. The primary energy source for this sector is currently oil. The radical shift to electric transportation does not only eliminate local emissions from vehicles, but also contributes to energy efficiency as electric motors are much more efficient that internal combustion engines (ICE). In both COP 21 compliant scenarios, electricity demand from the transport sector will increase by an order of magnitude of between 8 and 11 until 2050 compared to 2015 (reference year for mobility).
TWh
0
2,000
4,000
6,000
8,000
10,000
12,000
14,000
Reference 2030 2040 2050 Reference 2030 2040 2050Distributed Energy Global Ambition
Others Energy branch Agriculture Industry Transport Tertiary Residential

ENTSO-E // ENTSOG TYNDP 2022 Draft Scenario Report // 17
8 Including plug-in hybrid
Figure 5: Final electricity consumption (excluding transmission and distribution losses) for EU27
As it was described in the TYNDP 2022 Scenarios Final Storyline Report, Electrical Vehicles (EVs) are emblematic of the energy transition and strong growth in sales is evident across Europe. From a demand perspective their develop-ment is driven by air pollution concerns, energy efficiency and CO₂ emission reduction. Passenger vehicles currently account for the highest share in the total transport fleet. To reach the climatic targets, the decarbonisation of the passenger sector will be driven mainly by a fast uptake of EVs.
Electric vehicles are emblematic of efficiency first principle and reduction of air pollution.
Figure 6 shows the TYNDP 2022 scenario assumptions for EVs including battery (BEV)8 and fuel cells (FCEV). For pas-senger cars a strong uptake of EVs is considered in Distribut-ed Energy, reaching almost 90 % share of total fleet in 2050.
Global Ambition considers a wider range of clean mobility technologies with fuel cells as a meaningful option for long distance travel, high usage rate and power requirement, and shows a comparable EVs market share for 2050.
Figure 6: Share of transport technologies for EU27
TWh
ReferenceNational Trends
20302030 2040 2050 2030 2040 2050Distributed Energy Global Ambition
Others Energy branch Agriculture Industry Transport Tertiary Residential
0
500
1,000
1,500
2,000
2,500
3,000
3,500
4,000
%
2030 2050 2030 2050
Passenger carsDE GA
2030 2050 2030 2050DE GA
Heavy trucks
ICE FCEV BEV
0
100
80
60
40
20

18 // ENTSO-E // ENTSOG TYNDP 2022 Draft Scenario Report
For heavy trucks the Distributed Energy scenario also follows a higher electrification rate reaching a 56 % market share in 2050 broken down into 22 % for BEVs and 34 % for FCEVs. Global Ambition scenario achieves a 53 % electrification of heavy trucks in 2050 broken down as 11 % for BEVs and 42 % for FCEVs.
Overall, the uptake of BEVs in the heavy goods transport category is more limited than for passenger cars. This is because BEVs are considered less suitable for transporting heavy loads over long distances.
Beyond road transport, electric engines have a role in shipping and aviation since they can be powered by batteries or hydrogen fuel cells. Furthermore, whatever technology they use (hydrogen or batteries) they can pro-
vide flexibility to the electricity system with Vehicle-to-Grid (V2G) services provided by prosumers’ EVs. Both COP 21 scenarios consider a significant development of all technol-ogies but to a different extent depending on the scenario storyline.
TYNDP 2022 country level market shares for the different technologies and transport categories can be found in the Visualisation Platform.
Both scenarios foreseen an increase in term of final electricity demand with Distributed Energy that will exceed 4,000 TWh in 2050 (a 50 % increase compared to 2018). The average peak will reach 700 GW and 740 GW in 2050 for Global Ambition and Distributed Energy (57 % and 67 % increase compared to 2018).
Figure 7: Evolution of average electricity demand and peak (including transmission and distribution losses) for EU27 (For historical data, Malta is missing)
4.1.3 Gas demand
Methane and Hydrogen: two complementary en-ergy carriers for an efficient use of the resources.
Europe has significant potentials for producing renewable methane (biomethane) and hydrogen. Methane can also be associated with carbon capture and storage (CCS) technologies to be decarbonised and, using steam methane reforming (SMR), pyrolysis or other technology, convert-ed to hydrogen. The analysis of the supply potentials for methane and hydrogen shows that for an efficient decar-bonisation and to limit its dependence on imports, the EU needs to make use of all its sources of renewable energy in both Distributed Energy and Global Ambition scenari-
os. Therefore, for cost and energy efficiency reasons both methane and hydrogen demand coexist in both scenarios, to a different extent and with different evolutions depend-ing on the storylines.
The comparison of National Trends and the COP 21 scenarios shows that, in many countries, current national policies do not always have a long-term vision post 2030 and do not consider yet a shift of the gas demand from methane towards hydrogen, nor do they consider signifi-cant CCU/S capacities.
TWh GW
2016 2017 2018 2025 2030 2040 20500 0
500
1,000
1,000
200
300
400
500
600
700
800
900
100
1,500
2,000
2,500
3,000
3,500
5,000
4,000
4,500
Historical Data [GW] National Trends [GW] Global Ambition [GW] Distributed Energy [GW]
Historical Data [TWh] National Trends [TWh] Global Ambition [TWh] Distributed Energy [TWh]

ENTSO-E // ENTSOG TYNDP 2022 Draft Scenario Report // 19
With electrification, gas demand for power becomes more seasonal and critical.
As electrification increases significantly in Global Ambition and to a greater extent in Distributed Energy, the structure of the gas demand evolves as the demand for electricity becomes more seasonal and variable, requiring more flex-ibility from the gas system. As electrification increases, the seasonality of the gas demand remains significant since the heating demand shift towards electrification is compensat-ed by the increasing seasonality of the electricity demand.
9 “Kalte Dunkelflaute” or just “Dunkelflaute” (German for “cold dark doldrums”) expresses a climate case, where in addition to a 2-week cold spell, variable RES electricity generation is low due to the lack of wind and sunlight.
Furthermore, as the energy system relies on variable re-newables to produce electricity and gas, the gas supply becomes sensitive to climatic events as well as the energy demand. This combined climatic sensitivity increases the need for flexibility. This translates in the scenarios by a higher winter demand for power, especially during climatic events like Dunkelflaute9 when gas demand for power gen-eration increases to compensate for the absence of wind and solar energy during periods of several days.
4.1.3.1 Methane demand
National policies rely more on methane until 2040, whilst hydrogen kicks in after 2030.
At EU level, national policies show a large role for methane as a gas energy carrier with very limited evolution of the demand until 2030. After 2030 however, the methane demand decreases with the implementation of the strate-gy of some Member States which see the uptake of their hydrogen demand.
The development of final methane demand differs from region to region. Due to a high dependence on coal and coal-to-methane switch policies, methane demand for heating rather increases in Central and Eastern Europe, whereas other regions head towards more electrification
in the private heating sector. The country specific values can be seen in the visualisation platform.
COP 21 scenarios: methane demand decreases and decarbonises over time.
Following the evolution of the production capacities, the methane demand decreases as hydrogen develops after 2030. However, in the scenarios, methane remains necessary to cover the EU energy demand until 2050. The demand for methane is generally sustained by the final demand of different biomethane end uses (879 TWh in Distributed Energy 2050) and the indirect demand of abated natural gas for hydrogen production (1,390 TWh in Global Ambition 2050).
Figure 8: Methane demand per sector for EU27
TWh
Reference2025 2030 2040 2030 2040 2050 2030 2040 2050
Distributed EnergyNational Trends Global Ambition
0
500
1,000
1,500
2,000
2,500
3,000
3,500
4,000
Residential & Tertiary Transport Industry Agriculture Consump. Energy Branch Power Generation
20 // ENTSO-E // ENTSOG TYNDP 2022 Draft Scenario Report
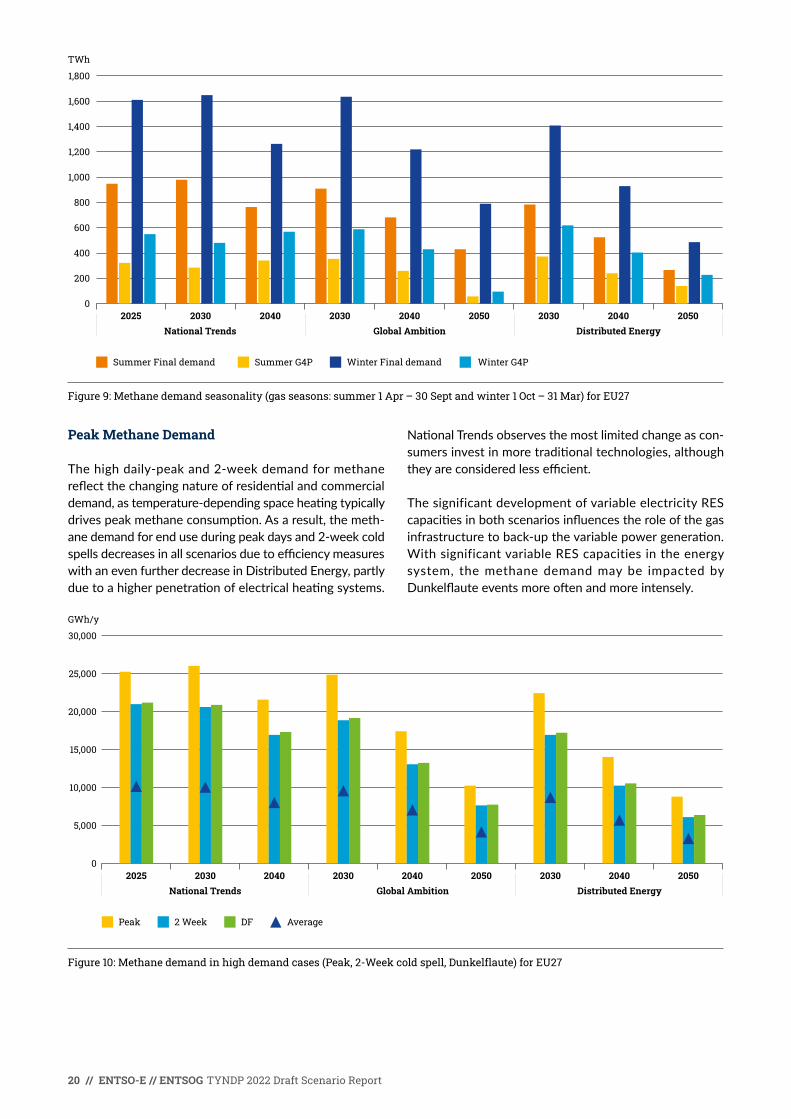
Figure 9: Methane demand seasonality (gas seasons: summer 1 Apr – 30 Sept and winter 1 Oct – 31 Mar) for EU27
Peak Methane Demand
The high daily-peak and 2-week demand for methane reflect the changing nature of residential and commercial demand, as temperature-depending space heating typically drives peak methane consumption. As a result, the meth-ane demand for end use during peak days and 2-week cold spells decreases in all scenarios due to efficiency measures with an even further decrease in Distributed Energy, partly due to a higher penetration of electrical heating systems.
National Trends observes the most limited change as con-sumers invest in more traditional technologies, although they are considered less efficient.
The significant development of variable electricity RES capacities in both scenarios influences the role of the gas infrastructure to back-up the variable power generation. With significant variable RES capacities in the energy system, the methane demand may be impacted by Dunkelflaute events more often and more intensely.
Figure 10: Methane demand in high demand cases (Peak, 2-Week cold spell, Dunkelflaute) for EU27
TWh
0
1,800
1,600
1,400
1,200
1,000
800
600
400
200
National Trends Global Ambition Distributed Energy2025 2030 2040 2030 2040 2050 2030 2040 2050
Summer Final demand Summer G4P Winter Final demand Winter G4P
GWh/y
Peak 2 Week DF Average
0
5,000
10,000
15,000
30,000
25,000
20,000
National Trends Global Ambition Distributed Energy2025 2030 2040 2030 2040 2050 2030 2040 2050

ENTSO-E // ENTSOG TYNDP 2022 Draft Scenario Report // 21
4.1.3.2 Hydrogen demand
10 The hydrogen specific energy content is about 33 kWh/kg NCV
11 Scenarios assume hydrogen production in the UK, Norway, North Africa, Russia and Turkish hub.
12 The hydrogen demand displayed is not considering H2 supplied via by-products.
In all scenarios, the demand for hydrogen develops as of 2030 and hydrogen becomes the main gas energy carrier in both COP 21 scenarios in 2050. Today, hydrogen is mainly used as a feedstock for the industry and quantified in kg or tonnes10. However, as the demand for clean gaseous energy increases to meet the COP 21 and EU climate and energy targets, hydrogen is mainly used for its energy content by 2040 – quantified in TWh – and its use as feedstock becomes more marginal over time.
National Trends reflects contrasted policies across the different Member States.
National Trends considers the different national policies of the EU Member States. Whereas some countries plan for the development of hydrogen to replace natural gas with objectives defined for 2030, some other countries plan for a more stepwise approach to move away from the most carbon intensive fuels, especially in the coal mining regions. Therefore, at EU level, this translates into a slower development of the hydrogen demand which is nevertheless steadily accelerating between 2025 and 2040 at EU level.
Most of the current hydrogen produced locally in the in-dustrial clusters is not included in the figures since they are not connected to any regional or national networks. These figures are shown as methane demand.
Distributed Energy and Global Ambition: Hydro-gen as a key element to reach carbon neutrality.
Both COP 21 scenarios require significant amounts of hydrogen to meet the COP 21 and EU climate and Energy targets and reach carbon neutrality by 2050. Hydrogen can be produced indigenously in the EU to a significant extent and in some extra-EU countries11 have significant poten-tials to produce renewable hydrogen and can be actors of a global clean hydrogen market. In addition, methane decarbonisation solutions (e. g. SMR + CCS) can support the development of the hydrogen demand by securing the supply. Furthermore, applied with biomethane, those decar-bonisation capacities can become carbon negative and help to recover from the carbon budget overshoot after 2050.
In Distributed Energy as well as in Global Ambition, both indigenous production and imports of renewable hydrogen are needed. However, following their storylines, the sce-narios show different evolutions of the hydrogen demand12: Distributed Energy sees a development of the hydrogen demand following the development of production capac-ities in the EU (1,522 TWh in Distributed Energy 2050) while reducing the energy imports and Global Ambition sees a more rapid development of the hydrogen demand supported by the access to an international clean hydro-gen market, in the context of a global energy transition (468 TWh of renewable hydrogen imports in Global Ambi-tion 2050).
Figure 11: Hydrogen demand per sector for EU27 (excluding hydrogen from by-products)
TWh
Reference2025 2030 2040 2030 2040 2050 2030 2040 2050
Distributed EnergyNational Trends Global Ambition
0
500
1,000
1,500
2,000
2,500
Residential & Tertiary Transport Industry Agriculture Consump. Energy Branch Power Generation

22 // ENTSO-E // ENTSOG TYNDP 2022 Draft Scenario Report
Figure 12: Hydrogen demand seasonality (gas seasons: summer 1 Apr – 30 Sept and winter 1 Oct – 31 Mar) for EU27
Hydrogen Peak Demand
In the COP 21 scenarios, the development of hydro-gen-based technologies in the residential and tertiary sectors as well as in the power sector results in increasing
peak and 2-week demand, especially in the Global Ambi-tion scenario.
Figure 13: Hydrogen demand in high demand cases (Peak, 2-Week cold spell, Dunkelflaute) for EU27
TWh
0
1,200
1,000
800
600
400
200
National Trends Global Ambition Distributed Energy2025 2030 2040 2030 2040 2050 2030 2040 2050
Summer Final demand Summer G4P Winter Final demand Winter G4P
GWh/d
Peak 2 Week DF Average
0
2,000
4,000
6,000
8,000
12,000
10,000
16,000
14,000
National Trends Global Ambition Distributed Energy2025 2030 2040 2030 2040 2050 2030 2040 2050
ENTSO-E // ENTSOG TYNDP 2022 Draft Scenario Report // 23
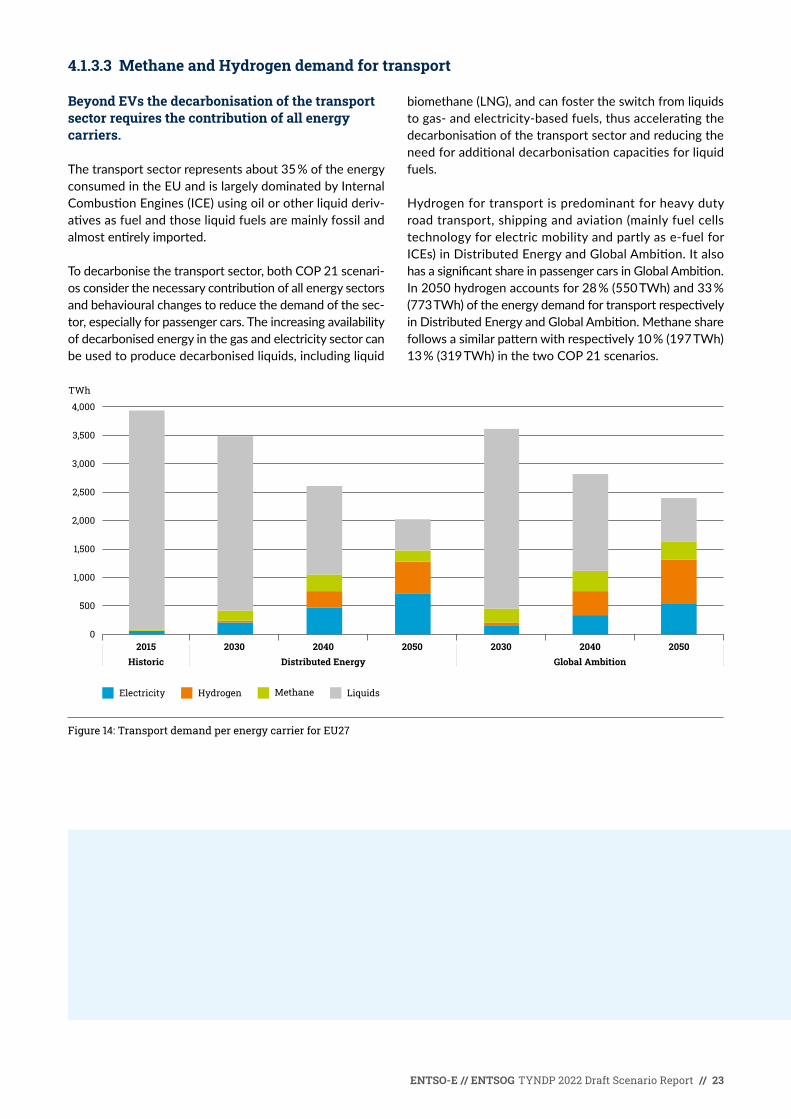
4.1.3.3 Methane and Hydrogen demand for transport
Beyond EVs the decarbonisation of the transport sector requires the contribution of all energy carriers.
The transport sector represents about 35 % of the energy consumed in the EU and is largely dominated by Internal Combustion Engines (ICE) using oil or other liquid deriv-atives as fuel and those liquid fuels are mainly fossil and almost entirely imported.
To decarbonise the transport sector, both COP 21 scenari-os consider the necessary contribution of all energy sectors and behavioural changes to reduce the demand of the sec-tor, especially for passenger cars. The increasing availability of decarbonised energy in the gas and electricity sector can be used to produce decarbonised liquids, including liquid
biomethane (LNG), and can foster the switch from liquids to gas- and electricity-based fuels, thus accelerating the decarbonisation of the transport sector and reducing the need for additional decarbonisation capacities for liquid fuels.
Hydrogen for transport is predominant for heavy duty road transport, shipping and aviation (mainly fuel cells technology for electric mobility and partly as e-fuel for ICEs) in Distributed Energy and Global Ambition. It also has a significant share in passenger cars in Global Ambition. In 2050 hydrogen accounts for 28 % (550 TWh) and 33 % (773 TWh) of the energy demand for transport respectively in Distributed Energy and Global Ambition. Methane share follows a similar pattern with respectively 10 % (197 TWh) 13 % (319 TWh) in the two COP 21 scenarios.
Figure 14: Transport demand per energy carrier for EU27
TWh
2015Historic
2030 2040 2050 2030 2040 2050Distributed Energy Global Ambition
0
500
1,000
1,500
2,000
2,500
4,000
3,000
3,500
Electricity Hydrogen Methane Liquids

24 // ENTSO-E // ENTSOG TYNDP 2022 Draft Scenario Report
4.2 Supply
The scenarios explore contrasted possible evolutions of the energy market in Europe, and outside Europe, which translate into different primary energy mixes.
As COP 21 and Green Deal compliant scenarios, Global Ambition and Distributed Energy take a holistic approach to the European energy system, including all primary en-ergy carriers, allowing the ENTSOs to compute the GHG
emissions of the EU and to assess their compliance with the EU climate and energy targets and to compare them with the carbon budget. National Trends is based on the different national policies and does not allow for a com-prehensive and consistent interpretation of national data for all energy carriers and cannot be entirely assessed in this section.
4.2.1 Primary energy supply
The European energy supply decarbonises with the development of renewable capacities and energy efficiency measures.
Both Distributed Energy and Global Ambition aim at en-ergy efficiency and decarbonisation of the primary energy supply reaching around 15 % and 40 % reduction in primary energy demand in 2030 and 2050 compared to 2015. The
electricity and gas production are fully decarbonised by 2040 and coal as well as oil are completely phased out by 2050. Natural gas supply declines sharply, in particular after 2030. By 2050 only 24 TWh of indigenous abated natural gas production are considered in Global Ambition. Overall, natural gas supply declines with between 89 % and 99 % compared to 2015 level.
Figure 15: Primary energy supply in the two COP 21 scenarios (for energy and non-energy use) for EU27
TWh
2015Historic
2030 2040 2050 2030 2040 2050Distributed Energy Global Ambition
0
2,000
4,000
6,000
8,000
10,000
12,000
18,000
14,000
16,000
Other Wind PV Hydro (excl pumping) Nuclear Biomass
Imported biofuels Imported hydrogen Natural gas Oil Coal

ENTSO-E // ENTSOG TYNDP 2022 Draft Scenario Report // 25
Figure 16: Primary energy supply mix in the COP 21 scenarios (for energy and non-energy us) for EU27
Both scenarios register a significant increase in renewables energy production. The renewable energy (RES) share in Global Ambition reaches 80 % by 2050 and 96 % in Distrib-uted Energy. The vast majority of the energy supply stems from solar PV and wind generation. Renewable electricity production is complemented with biomass and energy
from waste materials. Low carbon sources like nuclear or blue hydrogen imports also contribute to decarbonise the energy system, especially in the Global Ambition scenario, with a market share between 2 % and 14 % of primary energy supply.
Figure 17: Share of fossil, low caron and renewable energy in the primary energy supply mix (including non-energy)
%
2015Historic
2030 2040 2050 2030 2040 2050Distributed Energy Global Ambition
0
100
80
60
40
20
Other Wind PV Hydro (excl pumping) Nuclear Biomass
Imported biofuels Imported hydrogen Natural gas Oil Coal
%
2015Historic
2030 2040 2050 2030 2040 2050Distributed Energy Global Ambition
0
100
80
60
40
20
Renewable Low carbon Fossil fuel

26 // ENTSO-E // ENTSOG TYNDP 2022 Draft Scenario Report
4.2.2 Biomass supply
Both COP 21 scenarios foresee an uptake of biomass supply compared to today’s level. As biomass generally represents a localised supply, the highest growth trajecto-ry is projected in Distributed Energy where biomass also comes from wastes which are locally converted to energy. This is illustrated in Figure 18. Biomass is used for different
purposes in the scenarios. It is directly used for heating and in industrial processes. Furthermore, biomass is used as a feedstock to produce biofuels, biomethane and electricity. As such the biomass is converted to other energy carriers, which are subsequently used in the end use sectors for mobility, heating and other applications.
Figure 18: Biomass utilisation
TWh
Current 2030 2040 2050 Current 2030 2040 2050Distributed Energy Global Ambition
For electricity For biomethane For biofuels Direct use
0
500
1,000
1,500
2,000
2,500
3,000

ENTSO-E // ENTSOG TYNDP 2022 Draft Scenario Report // 27
4.2.3 Electricity supply
13 Assuming a share of renewable methane of 46 % in Distributed Energy and 34 % in Global Ambition in 2040
For electricity to fully play its role in the achievement of carbon neutrality in 2050, it is necessary to decarbonise its generation possibly before this time horizon. This is of particular importance when synthetic fuels (hydrogen, methane and liquids) are produced based on electrolysis.
Sector coupling induces a faster development of power generation as electricity has to supply both direct electri-
fication and electrolysis-based energy (hydrogen, synthetic methane and liquids). While all scenarios anticipate a de-velopment of electrolysis-based fuels, the magnitude of the associated electricity demand depends on the scenario storyline. The generation figures of the present chapter include the power generation for both final electricity demand and electrolysis.
Figure 19: Electricity demand for final use and electrolysis for EU27
In 2050, electricity demand for electrolysis accounts for close to one third of the overall electricity demand.
Both COP 21 scenarios follow the line of an early reach of carbon neutrality of the power generation mix. In 2040, renewable and nuclear power generation amount to around 95 %13 of EU27 electricity supply in Global Ambi-tion and Distributed Energy (including dedicated wind and
solar for electrolysis). In both scenarios, variable renewa-bles (wind and solar) are the major source with respectively 68 % and 75 % of power generation in Global Ambition and Distributed Energy compared to 49 % to 52 % in 2030 and 15 % in 2018. In 2050, the electricity generation is fully decarbonised and amounts to 5,933 and 5,593 TWh for respectively Distributed Energy and Global Ambition.
TWh
Final demand (incl. T&D losses, excl. Storage losses) Demand for electrolyser
0
1,000
2,000
3,000
4,000
5,000
6,000
2018 2025 2030 2030 2040 2050 20402030 2050National TrendsHistoric Global AmbitionDistributed Energy

28 // ENTSO-E // ENTSOG TYNDP 2022 Draft Scenario Report
14 including reservoir, run-of-river and pump storage
15 excluding batteries, DSR and hydro pump storage
16 Assuming a share of renewable methane of 4 % National Trends in 2030
Figure 20: Share of electricity demand covered by low carbon generation in EU27
While wind, solar and nuclear capacity differs between the COP 21 scenarios, these technologies are complemented by a wide range of other renewable energy sources (e. g. hydro, biomass … ) which capacity is the same for all sce-narios based on bottom-up data as strongly influenced by country specifics. Among these other renewable energy sources, hydro is the most prominent. It is currently the largest source of renewable energy, with 342 TWh14 produced in 2018. While its share will reduce with the development of wind and solar, the capacity will continue to increase from 136 GW in 2018 to 169 GW in 2030 and 174 GW in 2040.
A strong increase in wind and solar capacity is constitu-tive of all scenarios, but the magnitude depends on the storyline of each scenario.
In Distributed Energy, a focus on lowering nuclear capacity and energy imports supplement the decarbonisation ob-jective. As a result, investment in wind and solar capacity reaches the highest level in order to meet both direct electri-fication and the need for synthetic fuels to replace imports. From a technology perspective, there is an emphasis on decentralised sources such as onshore wind and solar PV. As they have lower load factors than offshore wind, the need for installed capacity increases sharply. In accordance with more developed prosumer behavior in Distributed Energy, rooftop PV capacity reached 363 GW in 2050 for Distributed Energy in comparison with 325 GW for Global Ambition.
Even if offshore wind is more expensive in this scenario compared to Global Ambition, the renewable electricity
needs are such that this technology sees a significant development.
In Global Ambition, final electricity demand is slightly lower than in Distributed Energy while electricity demand for synthetic fuels is much lower due to the ability to import low-carbon molecules therefore the total electricity supply increases slower. In addition, nuclear capacity will decrease in some extent compared to today (moving from 139 GW in 2018 to 86 GW in 2050) as new nuclear units will partly compensate the decommissioning of existing ones. As a result, the need for wind and solar capacity will be strong but lower than in Distributed Energy (2,087 GW in 2050 to compare with 252 GW in 2018 and 2,497 GW in 2050 for Distributed Energy).
As part of the renewable capacity, offshore wind will be the second source in 2050 with 408 GW generating 1,545 TWh in 2050 (28 % of power generation) shortly after on-shore wind (1,781 TWh).
National Trends, based on national strategies and policies, shows a higher ambition in terms of electricity demand and renewable generation share compared to the TYNDP 2020 edition. It illustrates the integration of the Green Deal am-bition at national level. In 2030, electricity generation15 reaches 3,152 TWh compared to 2,775 TWh in 2018. The share of renewable and nuclear generation reaches 79 %16 (2,550 TWh) with solar and wind accounting respectively for 423 TWh and 989 TWh in 2030. At that time horizon their capacity reaches 352 GW for solar and 349 GW of wind.
%
2025 2030National Trends
2030 2040 2050 2030 2040 2050Distributed Energy Global Ambition
0
100
80
60
40
20
Wind and solar Other RES Nuclear

ENTSO-E // ENTSOG TYNDP 2022 Draft Scenario Report // 29
Figure 21: Capacity mix for EU27 (including prosumer PV, hybrid and dedicated RES for electrolysis)17
Figure 22: Power generation mix for EU27 (including prosumer PV, hybrid and dedicated RES for electrolysis)
17 Thermal capacity in the graph does not fully take into account adequacy needs. A first evaluation on climatic years 1995, 2008 and 2009 shows an additional need of around 80 GW in Distributed Energy and 60 GW in Global Ambition in 2050 to ensure a LOLE below 5 hours in average. The quantification of such capacity will be further investigated in a later stage of the scenario building process. All figures in the report are not taking into account this additional capacity.
In all scenarios, coal and lignite are under pressure of phase-out policies in many countries as well as high CO₂ price. In 2030 beyond small units, they only represent around 170 TWh in Distributed Energy, Global Ambition and National Trends in comparison with 540 TWh in 2018. At European level, the role of these two sources becomes negligible in 2040.
The role of gas in power generation strongly evolves along the time horizon. First there is a need to distinguish methane from hydrogen. In the present scenarios The in-creasing role of hydrogen in final demand translates into a similar evolution for gas-fired power generation replacing progressively part of methane in this sector for the 2040 and 2050 time horizon.
GW
2025 2030National Trends
2030 2040 2050 2030 2040 2050Distributed Energy Global Ambition
0
3,500
3,000
2,500
2,000
1,500
1,000
500
Wind Onshore Wind Offshore Solar Biofuels Small Scale RES Hydro and pumped storage Nuclear
Coal & Other fossil Oil Methane CHP and Small Thermal Hydrogen Battery DSR
TWh
2025 2030National Trends
2030 2040 2050 2030 2040 2050Distributed Energy Global Ambition
0
7,000
6,000
5,000
4,000
3,000
2,000
1,000
Wind Onshore Wind Offshore Solar Biofuels Small Scale RES Hydro and pumped storage Nuclear
Coal & Other fossil Oil Methane CHP and Small Thermal Hydrogen Battery DSR

30 // ENTSO-E // ENTSOG TYNDP 2022 Draft Scenario Report
Secondly methane is progressively decarbonised offering the opportunity of flexible low carbon generation. While methane is now mostly natural gas, the share of biome-thane increases along the time horizon to become fully decarbonised by 2050 in Distributed Energy, as illustrated in Figure 27 on Methane supply.
Finally, the development of variable RES at zero marginal cost has a strong influence on the way that thermal plants are operated (which is also true for nuclear in lower extent).
18 Not taking into account additional units for adequacy.
Gas-fired power generation moves from an electricity to a flexibility source. It is pictured by the path followed by capacity and generation. For Distributed Energy and Global Ambition, capacity increases up to the 2030 – 2040 period (in parallel to coal and nuclear phase-out) before it decreases in 205018 back to present levels while generation decreases by 53 % on the same period. The subsequent reduction of running hours may trigger new challenges in terms of market design which are beyond the remit of the present report.
Figure 23: Evolution of methane and hydrogen fired power capacity and generation for EU27
Figure 24: Evolution of full load hours of methane and hydrogen fired power generation units for EU27
GW
2025 2030National Trends
2030 2040 2050 2030 2040 2050Distributed Energy Global Ambition
0
250
200
150
100
50
TWh
0
500
400
350
450
300
250
200
150
100
50
Capacity (GW) Generation (TWh)
Hours
2025 2030National Trends
2030 2040 2050 2030 2040 2050Distributed Energy Global Ambition
0
2,500
2,000
1,500
1,000
500

ENTSO-E // ENTSOG TYNDP 2022 Draft Scenario Report // 31
When Other Non-Renewables (mainly small-scale CHP) play a lesser role in the European electricity system today, they also need to be decarbonised in order to be able to achieve carbon neutrality. For CHP still using fossil fuels, it means either a switch to low-carbon equivalent or de-commissioning on the long run.
Flexibility need will increase as well as the range of tech-nologies to answer it. The electrification of the heating sector and the development of wind and solar will increase the climate dependency of the electricity system. At the same time, we already observe the impact of global warming on the variability of weather conditions. As a result, the decarbonisation of the electricity mix must go in parallel with the development of flexibility solutions in order to maintain the security of supply. The extent of the flexibility needs and the development of technologies to meet depend on the scenario storylines. The Scenarios will therefore differ in the balance between upstream flexibil-ity (generation side) as today and downstream flexibility (consumer side).
19 Peaking units are to be understood at methane-fired open cycle units and Battery cover utility-scale, prosumer and V2G batteries.
In Distributed Energy, the climatic exposure will be at the highest as a result of heating electrification and maximum wind and solar development. At the same time flexible power generation (including nuclear) will strongly decrease. In addition, the development of prosumer behaviours will result in a high development of battery (being residential or EV) providing shortterm storage solutions. The develop-ment of district heating will also contribute to an optimised use of connected heat pumps enabling to switch them off for a certain duration thanks to alternative heat sources. Finally, the need to produce synthetic fuels to replace imports will also offer the opportunity of seasonal flex-ibility by coupling the electricity and hydrogen systems. Electrolysis and hydrogen storage will then be beneficial to the security of the energy system.
In Global Ambition, the climatic exposure of the electricity system will increase relatively slower both on the demand and supply side. The commissioning of new nuclear units will also provide some degree of flexibility. The develop-ment of flexible demand (EV, demand-side response …) will be less critical.
Figure 25: Main flexibility sources for adequacy for EU27 19
TWh
2025 2030National Trends
2030 2040 2050 2030 2040 2050Distributed Energy Global Ambition
0
70
60
50
40
30
20
10
Peaking units DSR Battery

32 // ENTSO-E // ENTSOG TYNDP 2022 Draft Scenario Report
4.2.4 Gas supply
20 For steam methane reforming an efficiency factor of 77 % is used. For CCS processes a conservative capture rate of 90 % is considered, to account for the part of the CO� that cannot be captured in the process and that is therefore released in the atmosphere.
21 Also known as bio-energy carbon capture and sequestration (BECCS).
All renewable and decarbonisation technologies are needed to meet the EU energy and climate objectives.
The decarbonisation of the gas supply can be done in many ways. Gas can either be produced from renewable energy such as biomass producing biomethane or wind and solar energy producing hydrogen. Furthermore, decarbonised hydrogen can be produced with natural gas with different technologies such as steam methane reforming associated with carbon capture and storage technologies20.
Both COP 21 scenarios consider all types of technologies to a greater or lesser extent following their storyline. Each technology comes with its level of decarbonisation that is considered in the computation of the GHG emissions of each scenario to keep track of their carbon budget expens-es. For instance, biomethane can be considered as carbon neutral or carbon negative if associated with CCS21.
The EU gas production can decarbonise by 2040 in both COP 21 scenarios.
With the development of renewable hydrogen, biomethane and decarbonisation technologies, the EU can decarbonise its gas production by 2030 in Global Ambition and by 2040 in Distributed Energy. The EU indigenous production is largely decarbonised in 2040 in National Trends but not entirely with 100 TWh of remaining unabated Natural gas.
Distributed Energy shows the highest development of indigenous production capacities (2,400 TWh produced in 2050) and a higher role for biomethane and hydrogen since local production is prioritised. In Global Ambition, the indigenous production of methane and hydrogen also significantly increases (roughly 2,000 TWh produced in 2050) but to a lesser extent compared to Distributed Energy.
Figure 26: EU27 annual gas production per scenario
The contrasted approach towards the supply configura-tions is essential when assessing the infrastructure for the next twenty years since it directly impacts the energy flows and way the European gas system is used. Distrib-uted Energy represents an evolution of the energy system towards more autonomy with shorter flow distribution with more frequent changes and higher variations in the
flow patterns. Whereas Global Ambition represents an evolution of the energy system towards more integration in the global transition with large scale solutions with longer destinations but more steady flow patterns.
TWh
2025 2030National TrendsCurrent
2030 2040 2050 2030 2040 2050Distributed Energy Global Ambition
0
2,500
2,000
1,500
1,000
500
Natural gas (unabated) Natural gas (decarbonised) Biomethane Hydrogen (P2H2)

ENTSO-E // ENTSOG TYNDP 2022 Draft Scenario Report // 33
4.2.4.1 Methane supply
Figure 27 provides an overview of the methane supply in all three TYNDP 2022 scenarios. All scenarios consider similar decrease of the conventional indigenous natural gas production. The indigenous renewable methane pro-duction, such as biomethane and synthetic methane, differ across the scenarios in accordance with the storylines.
National Trends shows an increase of biomethane produc-tion over time and the production of synthetic methane through electrolysis is rather limited. The overall produc-tion of renewable gases is enough to compensate for the decline in conventional natural gas, in order to maintain current EU gas production. However, as the reduction in the methane demand starts later than in the other scenar-ios, National Trends shows the highest import dependence on methane until 204022.
Biomethane: an essential source of renewable methane.
Biomethane plays a major role in the decarbonisation of the methane supply and is the main source of decarbon-isation of the gas supply in both COP 21 scenarios until 2035. Synthetic methane and renewable imports are key to complement the supply needs and reach carbon neutrality by 2050.
22 As the GHG emissions are not assessed for National Trends, the production means of the imported methane (fossil, low carbon, renewable) is not specified.
Import levels are reduced and decarbonised by 2050 in both COP 21 scenarios.
As a scenario focusing on energy autonomy, Distributed Energy considers a high level of indigenous production of renewable and decarbonised methane. With around 902 TWh in 2050, Distributed Energy projects the highest biomethane production of all scenarios. The same accounts for the production of synthetic methane, with an amount of 130 TWh in 2050. On the other side, imports are reduced from 75 % to 11 % between 2020 and 2050, accounting for3,125 TWh in 2040, and 971 TWh in 2050. The level of imports in Distributed Energy is the lowest of all three scenarios and does not consider any natural gas in 2050.
As a scenario focusing on the integration of the EU into the global energy transition, Global Ambition combines both high decarbonisation levels and access to global and diversified markets for renewable methane (1,010 TWh in 2050). Furthermore, thanks to energy efficiency measures, methane imports decrease from 76 % to 26 % by 2050 compared to current levels (9,159 TWh) and natural gas imports are reduced to 892 TWh, essentially to be decar-bonised to produce hydrogen.
Figure 27: Methane supply for EU27
TWh
2030 2040National TrendsCurrent
2030 2040 2050 2030 2040 2050Distributed Energy Global Ambition
0
4,000
3,000
3,500
1,500
2,500
1,000
2,000
500
Natural gas (Domestic)
Natural gas (Import)
Biomethane (Domestic) Synthetic methane (Domestic)
Biomethane (Import) Synthetic methane (Import)

34 // ENTSO-E // ENTSOG TYNDP 2022 Draft Scenario Report
4.2.4.2 Hydrogen supply
A game changer.
Today the EU-27 hydrogen supply is a domestic produc-tion of about 350 TWh, mainly used as a feedstock. About 75 % is produced with SMR, the remaining volumes are by-products from other industrial processes23. However, both COP 21 scenarios consider the hydrogen market will
23 As part of the hydrogen supply is produced with natural gas, methane and hydrogen demand should not be summed.
undergo a complete transformation over the next 30 years and be traded mainly as an energy carrier to become the main gas energy carrier by 2050 with a marginal role for its demand as feedstock. The main drivers of this trans-formation of the hydrogen market are the significant EU and global potentials for producing hydrogen from variable renewable electricity and water, including sea water. Figure 28 provides an overview of the hydrogen supply in the three TYNDP 2022 scenarios.
Figure 28: Hydrogen supply for EU27
National Trends considers a limited uptake of hydrogen production.
National Policies generally reflect various and shorter-term visions of the EU Member States. And most policies have not been significantly updated since the National Energy and Climate plans were published in 2019. Therefore, the role of hydrogen to meet the 2050 objectives is not fully captured by the National Trends scenario (for some countries this also applies for Distributed Energy and Global Ambition) and only an incomplete picture of the hydrogen supply can be provided. Most of the current hydrogen produced locally in the industrial clusters is not included in the figures since they are not connected to any regional or national networks. These figures are shown as methane demand.
COP 21 scenarios: the key role of hydrogen to decarbonise the energy system.
Both Distributed Energy and Global Ambition integrate all sectors to provide a holistic vision of the European energy system.
Distributed Energy, as a decentralised scenario with high energy autonomy, considers a high level of domestic production of renewable hydrogen – similar to the high domestic methane production. Since both decarbonisa-tion and a higher self-sufficiency are the main drivers of the Distributed Energy Scenario, it requires a significant increase in renewable electricity generation to meet the P2G demand (1,521 TWh in 2050). The uptake of hydrogen imports is limited (241 TWh renewable hydrogen in 2050), with an import share of 13 %.
Global Ambition, as a scenario considering larger scale solutions and the EU as an actor of the global energy transition, combines both high decarbonisation levels with access to a global and diversified clean hydrogen market. Hydrogen produced from renewables in the EU play an important role in the supply mix (1,366 TWh) and clean hydrogen imports are key to ensure the supply and demand adequacy of the EU, providing 936 TWh of decarbonised and renewable hydrogen, resulting in an import share of 37 %.
TWh
2025 2030National TrendsCurrent
2030 2040 2050 2030 2040 2050Distributed Energy Global Ambition
0
2,500
1,500
1,000
2,000
500
Unspecified
Renewable import
By-products SMR SMR & CCS
Low carbon import P2G for H2 P2G for P2L

ENTSO-E // ENTSOG TYNDP 2022 Draft Scenario Report // 35
Figure 29: Electrolyser capacity for EU27
Figure 30: Origin of the electrolyser supply for EU27 (Hybrid renewables are connected to both the electricity grid as well as to an electrolyser.)
All unabated production of hydrogen is decom-missioned by 2030.
These scenarios have in common that until 2030, all SMR without carbon capture and storage will be either decom-missioned, retrofitted with CCS or replaced by SMR with CSS. In Distributed Energy low carbon hydrogen plays an
important role in the early stage of the transition when supply must be secured while renewable capacities devel-op. In the longer term SMR will be decreased. In Global Ambition the supply of low carbon hydrogen remains im-portant for decarbonising energy supply in the longterm, SMR capacity remaining constant over time.
GW
2030 2030National Trends
2040 2050 2030 2040 2050Distributed Energy Global Ambition
0
350
250
200
150
300
100
50
TWh
2030 2030National Trends
2040 2050 2030 2040 2050Distributed Energy Global Ambition
0
1,600
1,400
1,200
1,800
1,000
800
600
400
200
Electricity from the market
Dedicated Onshore wind
Hybrid PV Hybrid Onshore wind Hybrid offshore wind
Dedicated PV Dedicated offshore wind
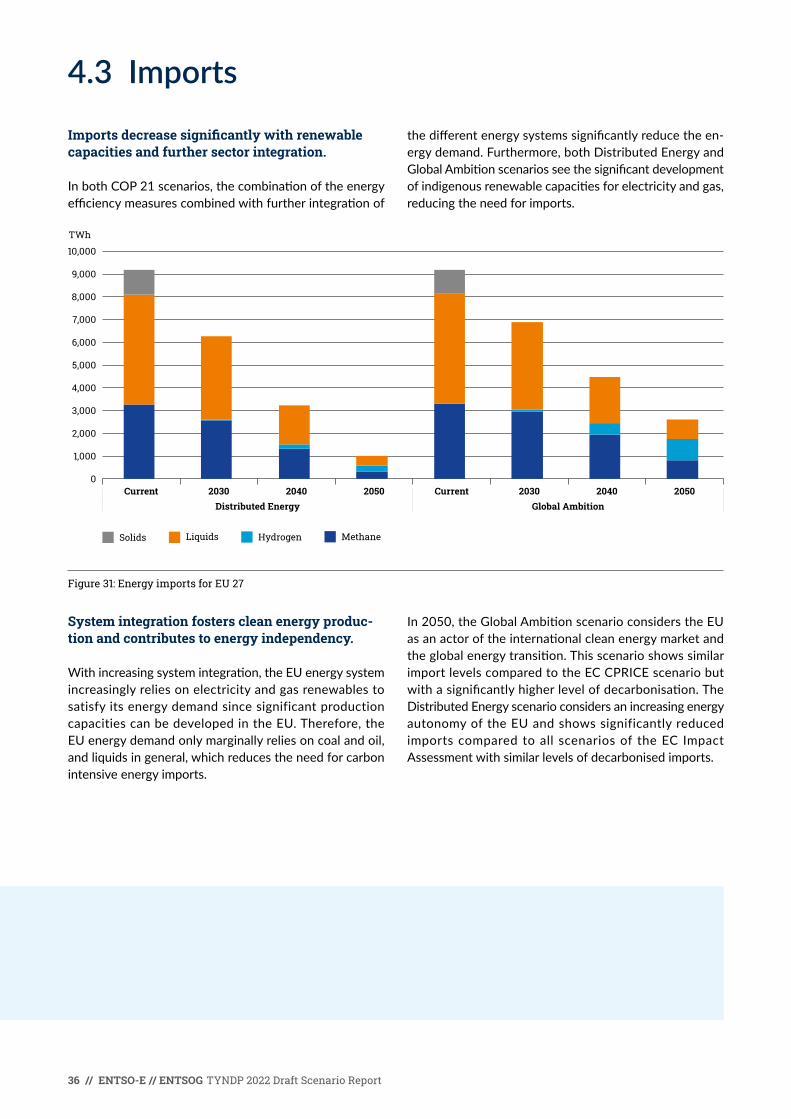
36 // ENTSO-E // ENTSOG TYNDP 2022 Draft Scenario Report
4.3 Imports
Imports decrease significantly with renewable capacities and further sector integration.
In both COP 21 scenarios, the combination of the energy efficiency measures combined with further integration of
the different energy systems significantly reduce the en-ergy demand. Furthermore, both Distributed Energy and Global Ambition scenarios see the significant development of indigenous renewable capacities for electricity and gas, reducing the need for imports.
Figure 31: Energy imports for EU 27
System integration fosters clean energy produc-tion and contributes to energy independency.
With increasing system integration, the EU energy system increasingly relies on electricity and gas renewables to satisfy its energy demand since significant production capacities can be developed in the EU. Therefore, the EU energy demand only marginally relies on coal and oil, and liquids in general, which reduces the need for carbon intensive energy imports.
In 2050, the Global Ambition scenario considers the EU as an actor of the international clean energy market and the global energy transition. This scenario shows similar import levels compared to the EC CPRICE scenario but with a significantly higher level of decarbonisation. The Distributed Energy scenario considers an increasing energy autonomy of the EU and shows significantly reduced imports compared to all scenarios of the EC Impact Assessment with similar levels of decarbonised imports.
TWh
Current Current2030 2040 2050 2030 2040 2050Distributed Energy Global Ambition
0
9,000
8,000
7,000
6,000
5,000
4,000
3,000
2,000
1,000
10,000
Solids Liquids Hydrogen Methane

ENTSO-E // ENTSOG TYNDP 2022 Draft Scenario Report // 37
4.4 GHG emissions
24 Non-CO� emissions for 2030 are also taken from the Impact Assessment (MIX-non-CO� scenario). The Impact Assessment does not provide appropriate non-CO� emissions for 2050. Therefore the post 2030 figures were taken from the EC Long Term Strategy and consider consumer preference changes and technical mitigation.
25 Figures are based on the LULUCF+ scenario for 2030 and the Net-zero GHG scenario for 2050.
Distributed Energy and Global Ambition: designed for integrated infrastructure planning assessment and to meet the EU Climate and Energy objectives.
Both COP 21 scenarios, Distributed Energy and Global Ambition, are built considering the possible interactions with all different sectors and designed along contrasted storylines making them capable for assessing in which con-trasting ways the EU energy infrastructure can support the transition towards net-zero 2050, meeting the EU climate and energy objectives.
A carbon tracker to compare the scenarios with the Green Deal and COP 21 objectives.
While they are designed to meet the EU objectives, the COP 21 scenarios are fully fledged scenarios taking a holis-tic approach to the European energy system, capturing all interdependences across the different sectors and there-fore allowing to track the carbon emissions. The carbon budget was firstly introduced in TYNDP 2020 and allows to monitor the evolution of the carbon budget left to meet the EU climate targets with each new TYNDP.
Energy efficiency first: reducing the energy demand is the most efficient way to reduce GHG emissions.
Both COP 21 Scenarios consider the development of en-ergy efficiency measures like renovation of buildings and increasing efficiency of developing technologies. A signif-icant decrease in primary energy demand combined with increasing shares of renewables and decarbonised energy in the EU supply mix is a necessary condition of meeting the EU climate and energy objectives.
Renewable and decarbonisation capacities need significant increase.
Whereas electricity generation has already undergone some level of transition (1,300 TWh produced from hydro, wind and solar in 2019), the EU needs a significant increase in renewable and decarbonised capacities including for hydrogen and methane to decarbonise the whole energy system. Just for wind and solar generation, this represents an increase from 400 TWh produced in 2019 to 2,500 or 3,000 TWh in 2050 in Global Ambition and Distributed Energy respectively.
4.4.1 Role of non-energy sectors
All sectors need to decarbonise.
The fully integrated COP 21 scenarios confirm that reach-ing a net-zero economy by 2050 requires the contribution of non-energy related sectors, such as the decarbonisation of agriculture and meat production, and requires further af-forestation. It should be noted, that for non-CO₂ emissions (methane, N₂O, F-gases) and LULUCF, the TYNDP 2022
scenarios rely on data provided in the Impact Assessment and Long-Term Strategy of the European Commission. As-sociated assumptions are the same for both Distributed Energy and Global Ambition. Non-CO₂ emissions reduce in both scenarios from 627 Mt in 2022 to 288 Mt in 205024. This is also illustrated in Figure 32. Negative emissions from LULUCF increase from 264 Mt in 2018 to 425 in 205025, as shown in Figure 33.

38 // ENTSO-E // ENTSOG TYNDP 2022 Draft Scenario Report
26 This study assumes up to 7.6 Gt of carbon capture by 2050 globally. For TYNDP 2022 it was assumed that 10 % of the global CCS is accounted for by the EU-27. This assumption is based on the current share of the EU-27 in the global GHG emissions. IEA also foresees the application of direct air capture (DAC), but these negative emissions are not considered in the calculations.
Figure 32: Non-CO� emission assumptions
Figure 33: Emissions and negative emissions from LULUCF
The TYNDP 2020 scenario building exercise has already shown that to decarbonise all sectors as well as all fuel types, additional measures such as CCU/S are needed, also in combination with bioenergy. The TYNDP 2022 scenario assumptions for CCS are summarised in Figure 34. The
Global Ambition scenario shows an increased application of carbon capture and storage (CCS), with up to 662 Mt per year by 2050. This assumption was based on the Net Zero by 2050 study from IEA26. Distributed Energy foresees some limited use of CCS (up to 64 Mt).
Mt
F-gases
0
300
200
100
400
500
600
700
N2O Methane
Current 2025 2030 20502040
Mt
Other
− 500
− 200
− 300
− 400
− 100
0
100
200
Agriculture Land Forest Land Net LULUCF sink
2018 20502040

ENTSO-E // ENTSOG TYNDP 2022 Draft Scenario Report // 39
Figure 34: Carbon capture and storage assumptions
4.4.2 Compliance with the EU Climate and Energy objectives
Both Distributed Energy and Global Ambition comply with the European climate and energy objectives, in particular the greenhouse gas reduction targets. On 11 December 2019 the European Commission has announced the Euro-pean Green Deal and since then published several policy strategies, among others the Energy System Integration strategy (ESI) and EU Hydrogen strategy for the European
Union. On 17 September 2020 the European Commission reconfirmed its proposal of reducing GHG emission by at least – 55 % by 2030 and reach climate neutrality by 2050. This was accompanied by a supporting impact assessment.
COP 21 scenarios meet the 2030 targets and reach carbon neutrality by 2050.
Figure 35: GHG emissions in Distributed Energy and Global Ambition
Mt
Current 2030 2040 2050 Current 2030 2040 20500
200
100
300
400
500
600
700
Distributed Energy Global Ambition
Post-combustive Pre-combustive
Mt
0
1,000
500
1,500
2,000
2,500
3,500
4,000
3,000
5,000
4,500
Distributed EnergyHistoric Global Ambition
1990 1995 2000 2005 2010 2015 2020 2025 2030 2035 2040 2045 2050
Target
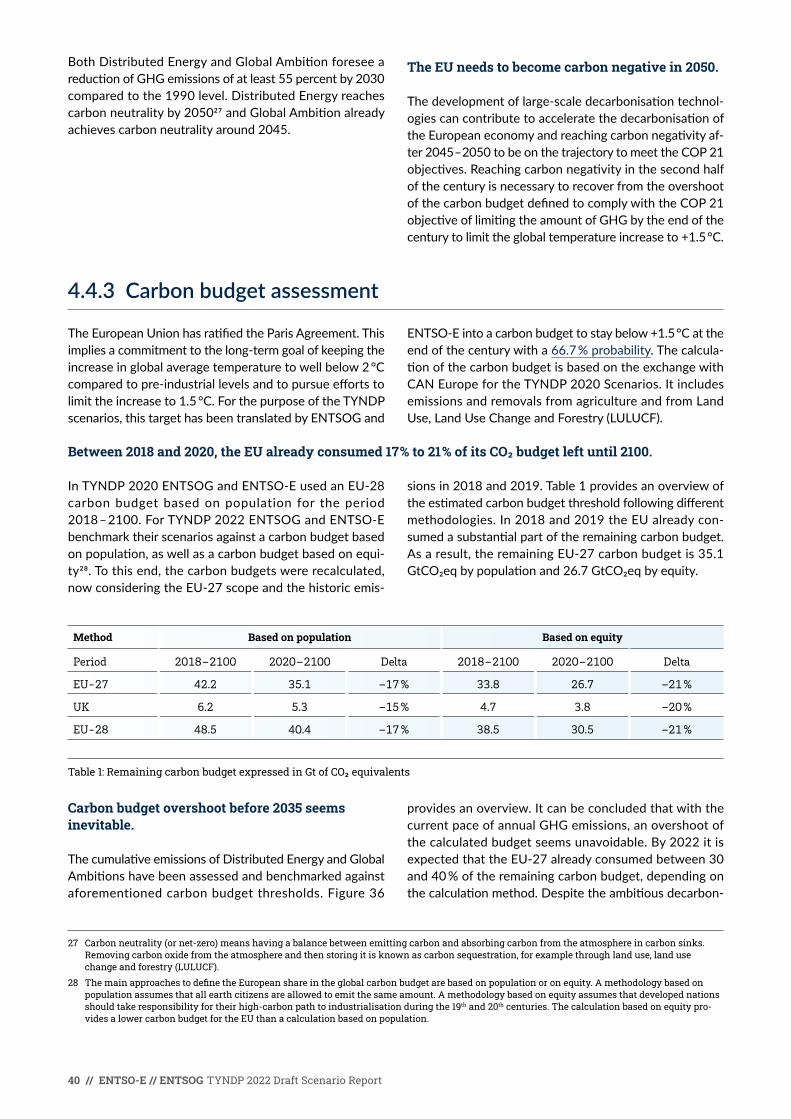
40 // ENTSO-E // ENTSOG TYNDP 2022 Draft Scenario Report
Both Distributed Energy and Global Ambition foresee a reduction of GHG emissions of at least 55 percent by 2030 compared to the 1990 level. Distributed Energy reaches carbon neutrality by 205027 and Global Ambition already achieves carbon neutrality around 2045.
27 Carbon neutrality (or net-zero) means having a balance between emitting carbon and absorbing carbon from the atmosphere in carbon sinks. Removing carbon oxide from the atmosphere and then storing it is known as carbon sequestration, for example through land use, land use change and forestry (LULUCF).
28 The main approaches to define the European share in the global carbon budget are based on population or on equity. A methodology based on population assumes that all earth citizens are allowed to emit the same amount. A methodology based on equity assumes that developed nations should take responsibility for their high-carbon path to industrialisation during the 19th and 20th centuries. The calculation based on equity pro-vides a lower carbon budget for the EU than a calculation based on population.
The EU needs to become carbon negative in 2050.
The development of large-scale decarbonisation technol-ogies can contribute to accelerate the decarbonisation of the European economy and reaching carbon negativity af-ter 2045 – 2050 to be on the trajectory to meet the COP 21 objectives. Reaching carbon negativity in the second half of the century is necessary to recover from the overshoot of the carbon budget defined to comply with the COP 21 objective of limiting the amount of GHG by the end of the century to limit the global temperature increase to +1.5 °C.
4.4.3 Carbon budget assessment
The European Union has ratified the Paris Agreement. This implies a commitment to the long-term goal of keeping the increase in global average temperature to well below 2 °C compared to pre-industrial levels and to pursue efforts to limit the increase to 1.5 °C. For the purpose of the TYNDP scenarios, this target has been translated by ENTSOG and
ENTSO-E into a carbon budget to stay below +1.5 °C at the end of the century with a 66.7 % probability. The calcula-tion of the carbon budget is based on the exchange with CAN Europe for the TYNDP 2020 Scenarios. It includes emissions and removals from agriculture and from Land Use, Land Use Change and Forestry (LULUCF).
Between 2018 and 2020, the EU already consumed 17 % to 21 % of its CO� budget left until 2100.
In TYNDP 2020 ENTSOG and ENTSO-E used an EU-28 carbon budget based on population for the period 2018 – 2100. For TYNDP 2022 ENTSOG and ENTSO-E benchmark their scenarios against a carbon budget based on population, as well as a carbon budget based on equi-ty28. To this end, the carbon budgets were recalculated, now considering the EU-27 scope and the historic emis-
sions in 2018 and 2019. Table 1 provides an overview of the estimated carbon budget threshold following different methodologies. In 2018 and 2019 the EU already con-sumed a substantial part of the remaining carbon budget. As a result, the remaining EU-27 carbon budget is 35.1 GtCO2eq by population and 26.7 GtCO2eq by equity.
Method Based on population Based on equity
Period 2018 – 2100 2020 – 2100 Delta 2018 – 2100 2020 – 2100 Delta
EU-27 42.2 35.1 –17 % 33.8 26.7 –21 %
UK 6.2 5.3 –15 % 4.7 3.8 –20 %
EU-28 48.5 40.4 –17 % 38.5 30.5 –21 %
Table 1: Remaining carbon budget expressed in Gt of CO� equivalents
Carbon budget overshoot before 2035 seems inevitable.
The cumulative emissions of Distributed Energy and Global Ambitions have been assessed and benchmarked against aforementioned carbon budget thresholds. Figure 36
provides an overview. It can be concluded that with the current pace of annual GHG emissions, an overshoot of the calculated budget seems unavoidable. By 2022 it is expected that the EU-27 already consumed between 30 and 40 % of the remaining carbon budget, depending on the calculation method. Despite the ambitious decarbon-

ENTSO-E // ENTSOG TYNDP 2022 Draft Scenario Report // 41
isation trajectories set in both the scenarios, the carbon budget based on population is reached around 2032. The budget based on equity is reached around 2027.
Technologies to achieve negative emissions are essential to meet the COP 21 objectives.
In Global Ambition the net cumulative emissions peaks around 2045. Renewable energy combined with CCS contributes to bending the curve and recovering from the
carbon budget overshoot. Total cumulative emissions add up to 45.4 Gt by 2050, which means an overshoot of 10.2 Gt based on population and 18.6 Gt based on equity. Dis-tributed Energy shows slightly higher cumulative emissions of 50.0 Gt, which represents an overshoot of between 14.9 and 22.2 Gt. This means that in both scenarios net negative emissions have to be achieved after 2050 to reach the 1.5 °C target by 2100, with CCS on bio-energy (BECCS) or direct air capture (DAC) technologies for example.
Figure 36: Cumulative emissions in the COP 21 scenarios
Mt Cumulative GHG emissions Distributed Energy (Mt)
Mt Cumulative GHG emissions Global Ambition (Mt)
2020 2022 2024 2026 2028 2030 2032 2034 2036 2038 2040 2042 2044 2046 2048 2050
0
70,000
60,000
50,000
40,000
30,000
20,000
10,000
−10,000
−20,000
2020 2022 2024 2026 2028 2030 2032 2034 2036 2038 2040 2042 2044 2046 2048 2050
0
70,000
60,000
50,000
40,000
30,000
20,000
10,000
−10,000
−20,000
CO2 emissions Non-CO2 emission LULUCF CCS Net emissions Population budget Equity budget

42 // ENTSO-E // ENTSOG TYNDP 2022 Draft Scenario Report
4.4.4 Carbon footprint of energy
Electricity generation
Aiming at an earlier decarbonisation, emissions of the electricity sectors already strongly decrease to reach be-tween 157 and 230 Mt/CO₂ in 2030 which is a decrease of at least 85 % and 71 % compared respectively to 1990 and 2018. In 2040 emissions of the COP 21 scenario only represent 63 Mt/CO₂ for Distributed Energy and 67 Mt/CO₂ for Global Ambition.
The decarbonisation of flexible thermal power generation necessary to the reliability of the system is ensured by a switch from natural gas, coal and oil to biomethane and synthetic methane. Such an approach is more economic than capital intensive investments in CCU/S for power generation due to the decreasing number of running hours.
Figure 37: Emission of electricity generation for EU27
It has to be noticed that such decrease occurs in parallel to a fast-growing power generation supporting both direct electrification and electrolysis-based fuels. As an illustra-
tion carbon intensity is divided by a factor 4 between 2030 and 2040 moving from 46 to 12 tCO₂/MWh) for Distributed Energy, the most electrified scenario.
Figure 38: Carbon intensity of power generation for EU27
MtCO2
1990 2025 2030 20402030 2050 2030 2040 20500
400
200
600
800
1,000
1,200
1,400
1,600
National TrendsHistoric Distributed Energy Global Ambition
tCO2/MWh
1990 2025 2030 20402030 2050 2030 2040 20500
100
200
300
400
500
600
National TrendsHistoric Distributed Energy Global Ambition
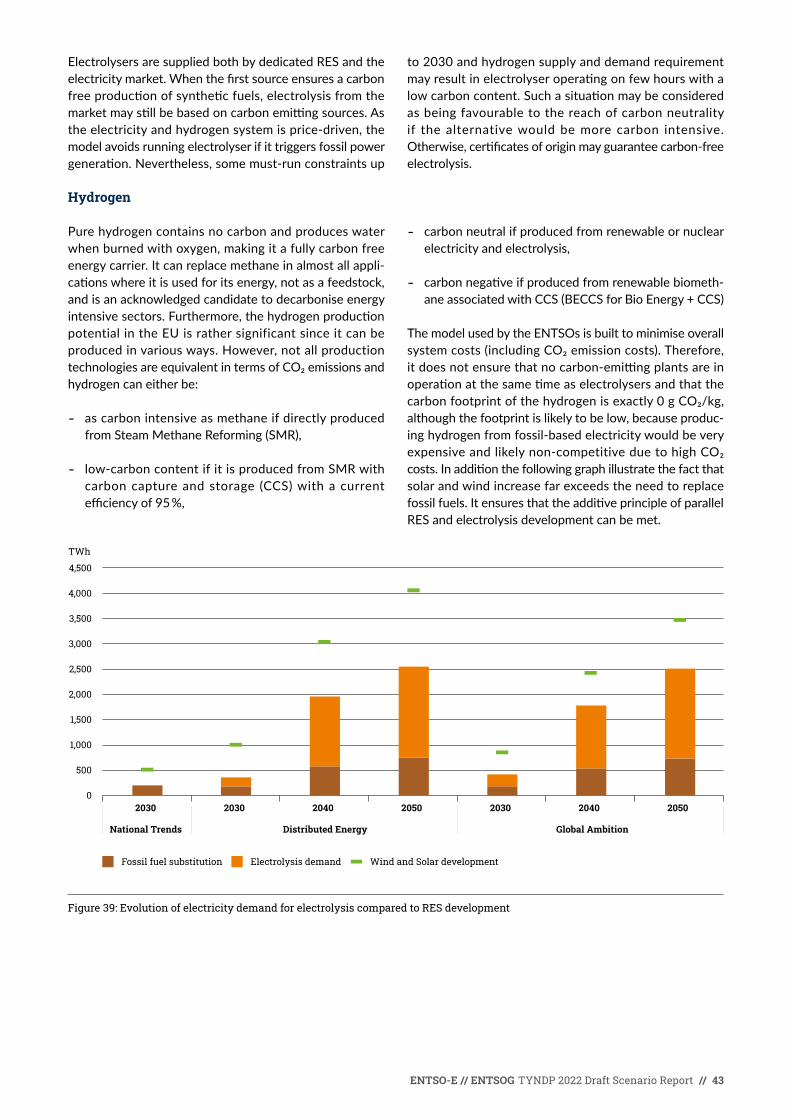
ENTSO-E // ENTSOG TYNDP 2022 Draft Scenario Report // 43
Electrolysers are supplied both by dedicated RES and the electricity market. When the first source ensures a carbon free production of synthetic fuels, electrolysis from the market may still be based on carbon emitting sources. As the electricity and hydrogen system is price-driven, the model avoids running electrolyser if it triggers fossil power generation. Nevertheless, some must-run constraints up
to 2030 and hydrogen supply and demand requirement may result in electrolyser operating on few hours with a low carbon content. Such a situation may be considered as being favourable to the reach of carbon neutrality if the alternative would be more carbon intensive. Otherwise, certificates of origin may guarantee carbon-free electrolysis.
Hydrogen
Pure hydrogen contains no carbon and produces water when burned with oxygen, making it a fully carbon free energy carrier. It can replace methane in almost all appli-cations where it is used for its energy, not as a feedstock, and is an acknowledged candidate to decarbonise energy intensive sectors. Furthermore, the hydrogen production potential in the EU is rather significant since it can be produced in various ways. However, not all production technologies are equivalent in terms of CO₂ emissions and hydrogen can either be:
- as carbon intensive as methane if directly produced from Steam Methane Reforming (SMR),
- low-carbon content if it is produced from SMR with carbon capture and storage (CCS) with a current efficiency of 95 %,
- carbon neutral if produced from renewable or nuclear electricity and electrolysis,
- carbon negative if produced from renewable biometh-ane associated with CCS (BECCS for Bio Energy + CCS)
The model used by the ENTSOs is built to minimise overall system costs (including CO₂ emission costs). Therefore, it does not ensure that no carbon-emitting plants are in operation at the same time as electrolysers and that the carbon footprint of the hydrogen is exactly 0 g CO₂/kg, although the footprint is likely to be low, because produc-ing hydrogen from fossil-based electricity would be very expensive and likely non-competitive due to high CO₂ costs. In addition the following graph illustrate the fact that solar and wind increase far exceeds the need to replace fossil fuels. It ensures that the additive principle of parallel RES and electrolysis development can be met.
Figure 39: Evolution of electricity demand for electrolysis compared to RES development
TWh
2030 2030 2050 20402040 2030 20500
1,500
2,000
1,000
500
2,500
3,000
3,500
4,500
4,000
National Trends Global AmbitionDistributed Energy
Fossil fuel substitution Electrolysis demand Wind and Solar development

44 // ENTSO-E // ENTSOG TYNDP 2022 Draft Scenario Report
The cost of electricity covers different concepts:
– the short run marginal price at a given time step (usually one hour or less) pictures the balance between demand and production. It represents the price of the last unit to be activated in the merit order at that time in a particular bidding zone;
– the levelised costs of electricity (LCOE) covering the overall system costs (CAPEX and OPEX as well as fuel and CO� prices).
The energy transition will impact both due to the building of significant wind and solar capacity forming the bulk of future electricity generation and the strong increase of CO₂ price impacting remaining fossil thermal generation. The definition of TYNDP scenarios is based on a system perspective looking at the minimisation of the overall sys-tem cost. The evolution of wind, solar and thermal capacity follows an energy only approach.
Marginal prices
Today marginal price is set by thermal units for most of the hours of the year. Prices range according to a merit
order based on the efficiency, fuel cost and carbon price of power generation. Compared to previous edition, a higher CO₂ cost assumption has induced a rise in marginal prices of all scenarios. In some markets, zero or negative mar-ginal prices may appear due to oversupply that cannot be stored or transported to another markets. By offering new and flexible opportunity to use electricity, sector coupling reduces the occurrence of such price situations.
With the expected development of wind and solar, the shape of the marginal price curve across the year is likely to change with more hours at very low prices induced by RES either directly or through storage discharge. When residual
The cost of electricity5

ENTSO-E // ENTSOG TYNDP 2022 Draft Scenario Report // 45
demand (final electricity demand reduced by variable RES production) will remain high, marginal prices are likely to increase compared to nowadays as fuel and CO₂ prices will be higher. As a result, the volatility of marginal electricity price throughout the year may will be higher than today.
The development of electrolysis for the production of synthetic fuels (hydrogen, e-gas and e-liquids) will link the price of electricity with those of other sources of mole-cules. At the same time the increase of marginal prices triggered by electrolysis demand will create an incentive for the development of additional RES capacity.
Figure 40: Marginal price in the electricity market (EU27 marginal price is built as the weighted average of hourly marginal price for each hour and bidding zone based using hourly electricity generation as a weight).
Levelised cost of electricity
The concept of LCOE has been used for many years to compare the cost between electricity sources. It enables an easy comparison of unit costs between technologies by combining CAPEX, OPEX and load factor on the economic lifetime of the asset.
In a system where most of the generation is ensured by flexible thermal units, LCOE is a meaningful criterion as the integration of wind and solar does not trigger massive adaptation of the system to accommodate their variability. In fact, such technologies continue to develop despite de-creasing incentive schemes as they are becoming mature. In many cases their LCOE are already significantly lower compared to low carbon equivalent (e. g., CCGTs with CCS) and soon with unabated fossil thermal units due to an in-creasing CO₂ price.
When building scenarios aiming at climate neutrality in 2050, the very high penetration rate reached by wind and solar beyond 2030 changes the operation of the electricity system. Flexibility and other services offered today by ther-mal units will have to be provided by other technologies in order to ensure a reliable operation of the system every
hour of the year. As a result, LCOE becomes a less rele-vant criteria to compare renewable and other investment options of very different nature as generation, flexibility and grid. For this reason, the investment model used to build Distributed Energy and Global Ambition scenarios relies on all CAPEX and OPEX of investment candidates together with fuel and CO₂ prices for a reliable electricity system. It ensures that the CAPEX and fixed costs of a technology are recovered over the economic/technical life-time of the investment also taking into account the value of lost load. The Draft 2022 Scenario Building Guidelines provide an overview of the investment CAPEX and fixed cost assumptions for each of the technologies considered by the scenario building process.
The investment model selects the investment candidates ensuring the minimisation of the overall system cost for the whole geographic perimeter. It also prevents over-investment in a particular technology, such as solar PV, as their similar generation profiles reduce the marginal price on sunny hours, so that further investment is not economically viable. Flexibility options such as batteries and interconnection benefit from higher marginal price by delivering later (through storage) or in another bidding zone (through interconnection).
€/MWh
2025 2030 2030 2040 2050 2030 2040 20500
20
10
30
40
50
60
70
National Trends Distributed Energy Global Ambition

46 // ENTSO-E // ENTSOG TYNDP 2022 Draft Scenario Report
Figure 41: Solar PV load factor for the Climatic year 2009 – Distributed Energy 2040
Figure 42: Onshore wind load factor for the Climatic year 2009 – Distributed Energy 2040
%
0
20
15
10
5
MT0
0ES
00PT
00CY
00IT
SAIT
S1IT
SIGR
03BG
00IT
CSGR
00IT
CNRO
00IT
N1
FR00
HU
00SI
00EU
27H
R00
AT00
SK00
CZ00
BE00
DKE1
PL00
NL0
0DK
W1
SE04
SE03
LT00
IE00
LV00
EE00
SE02
FI00
SE01
DE00
%
0
30
25
20
15
10
5
35
40
45
LT00
IE00
SE04
GR03
FI00
HU
00DK
E1SE
03SE
02CZ
00DK
W1
PL00
BE00
FR00
SE01
AT00
EU27
HR0
0DE
00RO
00N
L00
PT00
BG00
ES00
ITS1
LV00
ITSA
EE00
LUG1
ITCN ITSI
ITCS
MT0
0IT
CAGR
00SK
00CY
00IT
N1
SI00

ENTSO-E // ENTSOG TYNDP 2022 Draft Scenario Report // 47
Figure 43: Offshore wind load factor for the Climatic year 2009 – Distributed Energy
While LCOE may no longer fit the purpose of comparing investment candidates within a wide range of technologies, it is still useful to compare the location for a given technol-ogy as it takes into account resource availability both in a geographical and climatic sense.
The cost of technology for residential PV is stable across Europe however its load factor is wholly dependent on the geographical location. For example, solar PV average load factor is 18 % in Spain and only 10 % in Finland. Based on cost assumption for Distributed Energy in 2050, it results in a LCOE of ~14 €/MWh in Spain compared to ~26 €/MWh in Finland.
With competitive RES, the decision on building new conventional thermal plants will be increasingly driven by the flexibility need of the electricity system rather than delivering energy across the year. Their role will be to meet the residual demand and ensure national and regional security of supply through interconnections. The choice between cheaper units (e. g., OCGT) and more sophisticat-ed, expensive and efficient units (e. g. CCGT) will depend on the number of running hours required to balance the system and the price of low carbon equivalent to present
fossil fuels. These technologies will also need to compete against other forms of flexibility, such as interconnectors, demand side response, batteries and hydrogen storage.
Nuclear is a specific technology as the choice to build new units not only depends on the economics of the facility but also on political and industrial decision considering the overall value chain. As a result, the development of new capacity is an input to the scenarios with no new units in Distributed Energy while Global Ambition follows a trend set by high trajectories from the relevant TSOs of countries anticipating new nuclear. Therefore, nuclear generation is only influencing the marginal prices of the scenarios.
As a result, the comparison of economic competitiveness of new power generation units could be clustered in two groups:
- Wind and solar as the main electricity source in terms of energy delivered on annual basis;
- Thermal generation as a source of flexibility on the gen-eration side (in competition with other flexibility tools such as batteries, DSM or interconnections).
%
IE00
DKW
1
DE00
ES00
NL0
0
EU27
SE04
BE00
LV00
SE03
PL00
FR00
EE00
LT00
DKE1
SE02
GR00
PT00
FI00
ITSA ITSI
ITS1
BG00
ITN
1
ITCN
0
30
20
10
40
50
60

48 // ENTSO-E // ENTSOG TYNDP 2022 Draft Scenario Report
Figure 44: LCOE of wind and solar under different configurations – Distributed Energy 2040
Figure 45: LCOE of wind and solar in different configurations – Global Ambition 2040
€/MWh
Market-connected
Decicated to electrolysis
Decicated to electrolysis
Decicated to electrolysis
Market-connected
Market-connected
Prosumer0
10
20
30
40
60
50
Wind onshore Solar PV Farm Solar PV RooftopWind offshore
Market-connected
Decicated to electrolysis
Decicated to electrolysis
Decicated to electrolysis
Market-connected
Market-connected
Prosumer0
10
20
30
40
60
50
Wind onshore Solar PV Farm Solar PV RooftopWind offshore
€/MWh

ENTSO-E // ENTSOG TYNDP 2022 Draft Scenario Report // 49
Figure 46: LCOE of flexible methane generation under different load factors – Distributed Energy 2040 Fuel cost is based on a 57 %/30 %/13 % mix between natural gas, biomethane and synthetic methane with a CO� cost of 123 €/tCO�. LCOE are very similar for Global Ambition.)
The previous graphs illustrate the cost assumed for wind and solar in each scenario based on their driver and the grid connection saving for RES dedicated to electrolysis. As a comparison with National Trends, the cost decrease focuses on:
- Solar PV and onshore wind in Distributed Energy is linked to the development of prosumer behaviour and decentralised focus;
- Wind offshore in Global Ambition linked to the devel-opment of large-scale RES solution.
The graphs also show the impact of running hours on the choice of flexible thermal generation. The increasing cost of fuels and CO₂ result in a premium for most efficient units with OCGT becoming competitive against CCGT for load factors between 10 % and 30 %.
€/MWh
80 % 50 % 30 % 10 %0
100
150
50
200
OCGTCCGT

50 // ENTSO-E // ENTSOG TYNDP 2022 Draft Scenario Report
While developing the TYNDP 2022 scenarios, ENTSOG and ENTSO-E make use and benchmark against relevant external studies as captured in the technologies ranges of the Final Storyline Report published in April 2021. The purpose of the exercise is to understand whether or not the input assumptions and methodologies that ENTSOG and ENTSO-E employ result in credible and plausible outcomes compared to other expert opinion and methods.
29 Comparisons are made with REG and CPRICE, which are the scenarios with the lowest and highest energy demand respectively.
30 TYNDP 2020 covered the EU-28 perimeter. In order to make a proper comparison with TYNDP 2022 and Impact Assessment, UK was excluded from the TYNDP 2020 results
As part of their internal quality process for scenario build-ing, ENTSOG and ENTSO-E have compared the TYNDP 2022 Scenarios to the European Commission’s Impact Assessment Scenarios “Stepping up Europe’s 2030 climate ambition” published in September 202029. Such comparison is key to ensure that the selection of Project of Common Interest is built upon scenarios consistent with European Commission policy scenarios. Furthermore, the TYNDP 2022 scenarios are compared with the previous TYNDP
2020. This chapter provides comparisons for a variety of topics and parameters. All comparisons consider EU-2730 results by sector and energy vector for 2050.
TYNDP 2022 and EC Impact Assessment scenarios refer to EU27 and take into account the shipping sector and ambient heat. TYNDP 2020 scenarios have been scaled to a scope enabling a consistent comparison with the new scenarios.
Benchmarking6

ENTSO-E // ENTSOG TYNDP 2022 Draft Scenario Report // 51
6.1 Final energy demand
2050 final energy demand (excluding non-energy use) from TYNDP 2022 COP 21 scenarios is compared with the previous TYNDP 2020 scenarios and with the EC Impact Assessment CPRICE and REG scenarios.
For the benchmark with the EC Impact Assessment sce-narios the COP 21 TYNDP 2022 scenarios include inter-national transport and ambient heat demand. Whereas
Agriculture and Other demand is included in Residential & Tertiary category.
Global Ambition and Distributed Energy show a strong alignment in Final energy demand with EC Impact Assess-ment in 2050. Differences between Global Ambition and CPRICE and between Distributed Energy and REG scenar-ios are lower than 4 %.
Figure 47: Final energy demand benchmark for EU27
As final demand of TYNDP 2020 scenarios did not take into account shipping and ambient heat (from heat pumps) while covering transmission and distribution losses and United-Kingdom, it has been necessary to use a consistent scope for comparison with TYNDP 2022 scenarios.
Global Ambition scenarios show almost the same final en-ergy demand, and TYNDP 2022 Distributed Energy shows 3.5 % less final energy demand than TYNDP 2020.
6.2 Final electricity demand
Final electricity demand from TYNDP 2022 COP 21 scenarios is compared with the previous TYNDP 2020 scenarios and with the EC Impact Assessment CPRICE and REG scenarios.
TYNDP 2022 Global Ambition scenario is aligned with the Commission’s CPRICE scenario, showing both almost 40 %
share. Shares are calculated as the electricity final demand over the overall final demand (including international trans-port and ambient heat). TYNDP 2022 Distributed Energy scenario is a bit more ambitious than the Commission’s REG scenario (45 % vs 42 % share).
TWh
GA DE CPRICE REG0
2,000
1,000
3,000
4,000
5,000
7,000
8,000
6,000
10,000
9,000
IndustryTransport Tertiary Residential
TYNDP 2022 Impact Assessment

52 // ENTSO-E // ENTSOG TYNDP 2022 Draft Scenario Report
Figure 48: Benchmark electricity demand in 2050 for EU27
Both TYNDP 2022 scenarios show higher electricity demand than those of TYNDP 2020. Distributed Energy scenario has a higher electricity consumption than the
Commission’s scenarios (10 % higher than REG) and Global Ambition scenario remains aligned with the Commission’s CPRICE scenario (lower than 5 % difference).
6.3 Electricity generation
In 2050, COP 21 scenarios consider a strong increase of both final electricity demand and electrolysis. By that time horizon, there will be no more fossil-based power genera-
tion. It means a redesign of the power generation mix with scenario dependent options being among wind and solar technologies or nuclear.
Figure 49: Benchmark of RES technologies in 2050 for EU27
TWh
GA DE CPRICE REG GA DE0
500
1,000
1,500
2,000
3,000
3,500
2,500
4,000
IndustryAggregated Transport R&T
TYNDP 2022 Impact Assessment TYNDP 2020
GW
DE GA
CPri
ce
REG
Stor
ylin
e M
inSt
oryl
ine
Max DE GA
CPri
ce
REG
Stor
ylin
e M
inSt
oryl
ine
Max DE GA
CPri
ce
REG
Stor
ylin
e M
inSt
oryl
ine
Max
0
500
1,000
1,500
2,000
Onshore wind Offshore wind Solar

ENTSO-E // ENTSOG TYNDP 2022 Draft Scenario Report // 53
Figure 50: Benchmark of the overall level of wind and Solar PV capacity in 2050 for EU27
Distributed Energy reaches the ambitious RES targets for onshore wind as set in the Final Storyline Report based on public consultation. It also exceeds the wind and solar capacity of the most ambitious EC Impact Assessment scenario (CPRICE). Nevertheless, it does not use the extended solar trajectory as following the storyline public consultation. Such behaviour certainly derives from the priority given to onshore wind due to lower CAPEX and higher load factor.
Global Ambition shows a higher offshore wind develop-ment compared to EC Impact Assessment scenarios follow-ing its narrative focusing on centralised technology. Solar and onshore wind capacity is below EC Impact Assessment level as the scenario requires less power generation due to the import of part of hydrogen and synthetic fuel demand when they are all produced in n Europe in European Commission scenarios.
TWh
DE GA CPRICE REG Storyline Min Storyline Max0
500
1,000
1,500
2,000
3,000
3,500
2,500

54 // ENTSO-E // ENTSOG TYNDP 2022 Draft Scenario Report
6.4 Gas supply
6.4.1 Methane supply
A more limited and more decarbonised methane supply.
In 2050, the COP 21 scenarios consider an increasing hydrogen demand and as methane decarbonisation is not the main source of hydrogen production, both Distributed Energy and Global Ambition show a reduction in the over-all methane supply in TYNDP 2022 compared to TYNDP 2020 and substantially lower quantities than the EC Impact Assessment (between –500 TWh and –1,200 TWh).
In Distributed Energy natural gas is completely phased out by 2050 and Global Ambition considers about 350 TWh of natural gas supply, which is primarily imported. The quan-tities of renewable methane in TYNDP 2022 scenarios are quite comparable with the EC Impact Assessment scenar-ios. These levels are slightly higher than in the previous TYNDP 2020, especially in Global Ambition.
Figure 51: Methane supply benchmark for EU27
6.4.2 Hydrogen supply
Hydrogen supply transformation: from carbon emitting feedstock to fully decarbonised energy carrier.
By 2050, both COP 21 scenarios consider exclusively re-newable or decarbonised hydrogen supply. Methane con-version into low carbon hydrogen through SMR combined with CCS has a minor role in Global Ambition and has fully disappeared in Distributed Energy. It leaves the possibility to use decarbonisation technologies with renewable meth-ane to produce carbon negative hydrogen.
Global Ambition considers hydrogen supply levels compa-rable to the EC Impact Assessment and Distributed Energy rather lower levels as a consequence of higher electrifica-tion and reduced final energy demand due to higher energy efficiency assumptions. However, both scenarios consider a need for imports to complement the EU production to satisfy the demand and the hydrogen supply mix differs from the EC scenarios. In Distributed Energy the hydrogen
TWh
DE GA REG CPRICE DE GA DE GA
BiomethaneSynthetic methane Natural gas
0
500
1,000
1,500
2,000
2,500
3,000
TYNDP 2022 Impact Assessment TYNDP 2022 TYNDP 2020
Including shipping Excluding shipping

ENTSO-E // ENTSOG TYNDP 2022 Draft Scenario Report // 55
produced from electrolysis is quite comparable with the Impact Assessment but hydrogen for e-gas and e-liquids is lower in Distributed Energy. Global Ambition considers
an access to a global clean hydrogen market and shows a higher contribution of imports to the hydrogen supply and a lower production from electrolysis.
Figure 52: Hydrogen supply benchmark for EU27
With regard to hydrogen supply, the range observed in the TYNDP 2022 is quite comparable to TYNDP 2020. Howev-er, TYNDP 2022 shows a higher hydrogen supply for direct us whereas TYNDP 2020 shows hydrogen feedstock for
e-gas and e-liquids production, especially in Distributed Energy.
TWh
DE GA REG CPRICE DE GA DE GA
Electrolysis for H�Electrolysis for e-gasElectrolysis for e-liquid Imports SMR
0
500
1,000
1,500
2,000
2,500
3,000
TYNDP 2022 Impact Assessment TYNDP 2022 TYNDP 2020
Including shipping Excluding shipping

56 // ENTSO-E // ENTSOG TYNDP 2022 Draft Scenario Report
6.5 Biomass supply
As discussed in chapter 4.2.2, the TYNDP 2022 scenarios foresee the use of biomass for several applications, e. g. in power generation or in biomethane production. In order to ensure that the scenarios do not overestimate the bi-omass potential available to these applications, ENTSOG and ENTSO-E benchmark the biomass supply against other studies.
Figure 53 provides a comparison of the TYNDP 2022 biomass supply assumptions against the EC Impact As-sessment, EC Long Term Strategy and the previous TYNDP 2020. The biomass supply levels are quite similar to the assumptions in the Final TYNDP 2020 scenarios. However,
the new Distributed Energy scenario foresees the highest biomass supply compared to Global Ambition, consistent with the energy autonomy storyline. The biomass supply level observed in Distributed Energy is comparable but slightly lower than the assumptions in the EC Impact As-sessment scenarios.
ENTSOG and ENTSO-E acknowledge however that Impact Assessment scenarios do not necessary explore the lower end of the range for biomass. That is why Global Ambi-tion explores a lower level, which is quite similar to the 1.5 LIFE-LB (low biomass) scenario in the EC Long Term Strategy.
Figure 53: Biomass supply benchmark for EU27
TWh
DE GA REG CPRICE DE GA DE GA0
500
1,000
1,500
2,000
2,500
3,000
TYNDP 2022 Impact Assessment TYNDP 2022 TYNDP 2020
Including shipping Excluding shipping
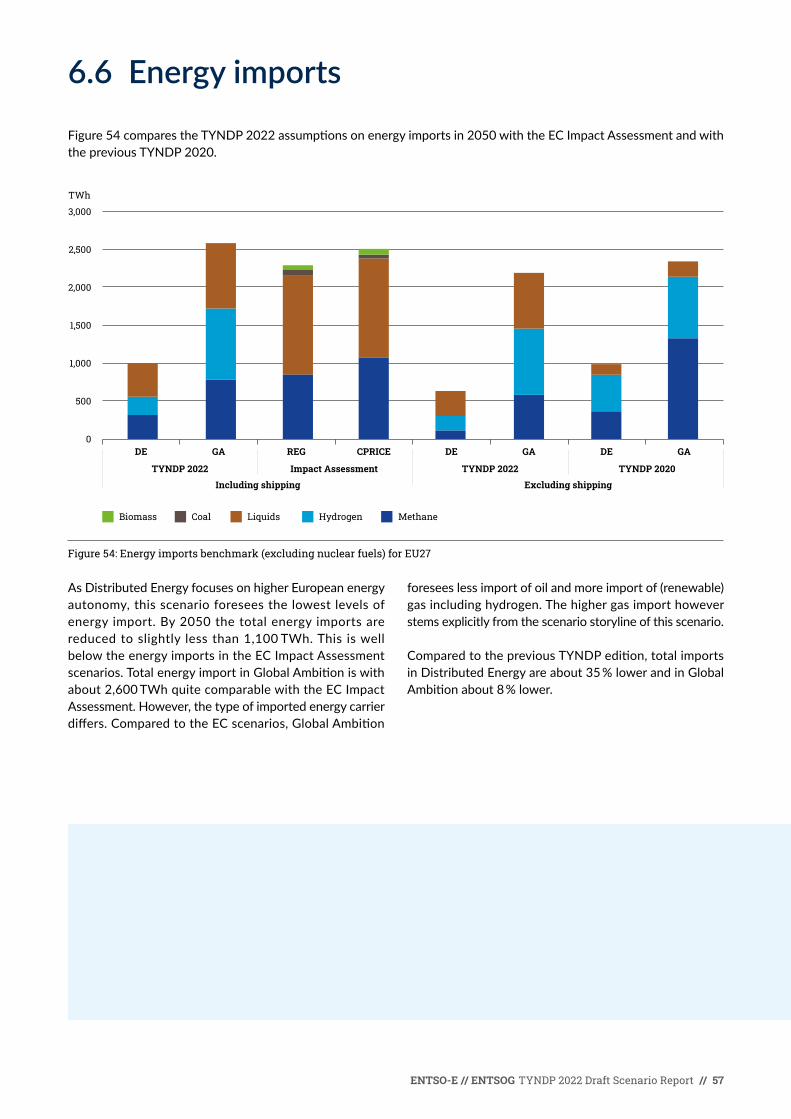
ENTSO-E // ENTSOG TYNDP 2022 Draft Scenario Report // 57
6.6 Energy imports
Figure 54 compares the TYNDP 2022 assumptions on energy imports in 2050 with the EC Impact Assessment and with the previous TYNDP 2020.
Figure 54: Energy imports benchmark (excluding nuclear fuels) for EU27
As Distributed Energy focuses on higher European energy autonomy, this scenario foresees the lowest levels of energy import. By 2050 the total energy imports are reduced to slightly less than 1,100 TWh. This is well below the energy imports in the EC Impact Assessment scenarios. Total energy import in Global Ambition is with about 2,600 TWh quite comparable with the EC Impact Assessment. However, the type of imported energy carrier differs. Compared to the EC scenarios, Global Ambition
foresees less import of oil and more import of (renewable) gas including hydrogen. The higher gas import however stems explicitly from the scenario storyline of this scenario.
Compared to the previous TYNDP edition, total imports in Distributed Energy are about 35 % lower and in Global Ambition about 8 % lower.
TWh
DE GA REG CPRICE DE GA DE GA
Biomass Coal Liquids Hydrogen Methane
0
500
1,000
1,500
2,000
2,500
3,000
TYNDP 2022 Impact Assessment TYNDP 2022 TYNDP 2020
Including shipping Excluding shipping

58 // ENTSO-E // ENTSOG TYNDP 2022 Draft Scenario Report
6.7 Carbon capture and storage
The EC Impact Assessment does not provide any figures for CCS. That is why the TYNDP 2022 scenario assumptions where benchmarked against some other studies. Table 2 provides an overview. The following studies were used:
- ENTSOG and ENTSO-E TYNDP 2020
- European Commission (2018), Long Term Strategy (2018)
- IEA (2020), Net Zero by 2050
- Hydrogen for EU (2020), Charting pathways to enable net-zero
Distributed Energy assumes up to 64 Mt of CCS in 2050. This means a reduction compared to the previous TYNDP edition, where for Distributed Energy up to 130 Mt was assumed. Furthermore, the CCS level in the Distributed Energy scenario for TYNDP 2022 is comparable to the lower scenarios in the LTS. Global Ambition assumes up to 761 Mt of carbon capture and storage, based on IEA. This is more than the assumption in TYNDP 2020 and also exceeds the figures in the Long-Term Strategy from a few years ago. It is however still well below the CCS levels reached in the Hydrogen for EU study that was released recently.
Study Scenario CCS in 2050 (Mt/y)
TYNDP 2020Global Ambition 463
Distributed Energy 130
IEA Net Zero 2050 662
Hydrogen for EUTechnology Diversification 1,505
Renewable Push 1,325
EC Long Term Strategy
ELEC 65
H2 63
P2X 77
EE 65
CIRC 52
COMBO 67
1.5TECH 373
1.5LIFE 130
1.5LIFE-LB 152
TYNDP 2022Global Ambition 662
64
Table 2: Benchmark of carbon capture and storage assumptions

ENTSO-E // ENTSOG TYNDP 2022 Draft Scenario Report // 59
Three core principles/values for stakeholder Engagement
Transparency
Developing three scenarios that project energy demand and supply until 2040 and 2050 is a highly complicated process. ENTSOG and ENTSO-E recognise that it is not sufficient to merely publicise the results of scenario mod-elling or to provide only a general overview of the meth-odologies used. Therefore, the TYNDP scenarios aim to
provide full transparency for all stakeholders. This entails delivering a full explanation of all assumptions that have been made and making all raw data fully accessible via the dedicated website. Our goal is to create scenarios that could be replicated plausibly by third parties.
Inclusiveness
Due to the significance of the TYNDP scenarios for EU infrastructure planning, it is important to ensure that the scenarios reflect the general opinions of EU citizens both in their scope and in their goals. ENTSOG and ENTSO-E believes that any organisation or individual who wishes to share their views on the scenario building process should
be offered sufficient opportunities to do so. This is made possible through the organisation of multiple fully public stakeholder events (such as consultation workshops and subject-specific webinars) and two written stakeholder consultations.
Efficiency
The energy transition is dynamic and fast-paced. New technologies and new developments are constantly influ-encing the long-term outlook for the energy system of the future. ENTSOG and ENTSO-E recognises that thorough stakeholder engagement is necessary to ensure that the
most up-to-date data and assumptions are utilised in the TYNDP scenarios. Interacting with stakeholders offers us the chance to learn from their experiences and to test our methodologies against real world conditions. An efficient scenario building process relies on stakeholder input.
Stakeholder engagement and how it shaped the scenarios7

60 // ENTSO-E // ENTSOG TYNDP 2022 Draft Scenario Report
What did we learn from the last process?
The transparency and stakeholder interaction in the TYNDP 2020 Scenario Report was deeper and more de-tailed than in any previous process. Stakeholder feedback played a key role in shaping the scenarios from the outset and the results and the publication of full final data sets as well as a detailed Scenario Methodology Report allowed stakeholders deeper insight into the development process and the subsequent results.
External feedback on the 2020 cycle showed that the following elements of the process were well-received:
- The Scenario Methodology Report offering a detailed description of the condition the underlying assumptions for the scenarios and modelling process.
- The publication of datasets on the TYNDP Scenario website allowing all users to scrutinise individual figures and break down results to a Member-State level.
- The two public consultations (one on the storylines and one on the scenarios) giving all interested parties two occasions to offer input on the scenario building process.
- The multiple stakeholder workshops providing regu-lar updates on the process, detailed presentations of specific issues and offering all users a platform to ask questions and share opinions.
These elements have therefore served as the basis for further expansion of the stakeholder engagement in the TYNDP 2022 scenario building cycle. However, the lack of information on the determination of certain key pa-rameters was criticised as untransparent. In particular, the qualitative parameters used in the Storyline Report in June 2019 were considered too vague to provide a sound as-sessment basis. In addition, stakeholders requested greater transparency regarding publication of consultation results.
For the 2022 scenario building cycle the Scenario Building Team have increased their ambition on stakeholder en-gagement as a key topic building upon the valuable lessons learned from the TYNDP 2020 Scenario Report. In order to ensure the credibility and integrity of the Scenario Report, the Scenario Building Team has focused on further enhanc-ing transparency and stakeholder engagement.
In the development of the TYNDP 2022, the Scenario Building Team set four principal goals for the stakeholder engagement process.
Stakeholder engagement from Day One
In the 2022 Scenario Report-cycle, the Scenario Building Team agreed to include stakeholders from the very begin-ning. This began at the kick-off meeting for the process on 3 July 2020, where stakeholder questions were document-ed (via an interactive Q & A app used during the event), answered and subsequently published on the 2022 TYNDP Storyline Report website.
During the public consultation of the draft storylines, we received about 30 responses from a variety of stakeholder (including NGOs, associations, energy companies and research institutes). At the Draft Storyline Consultation Workshop on 2 December 2020, more than 60 partici-pants were in attendance and 46 questions were received.
As with the kick-off meeting, the questions received at this event or otherwise have been answered by the Scenario Building Team and published as part of the Final Storyline Report. This stakeholder engagement has continued since completion of the Storyline Report.
In May 2021, ENTSOG and ENTSO-E hosted a dedicated workshop on extra-EU supply potentials, with the goal of sharing their own assumptions and receiving stakehold-er feedback. After the publication of the Draft Scenario Report, stakeholders will once again be offered to the opportunity to share their views, both in written form (via a six-week public consultation) and via a public workshop.
ENTSO-E // ENTSOG TYNDP 2022 Draft Scenario Report // 61
Input on key parameters
During the 2020 scenario building process, ENTSOG and ENTSO-E engaged with the NGO CAN Europe to calculate a carbon budget for the two COP 21 compliant scenarios. This approach gave the carbon budget more credibility and provided ENTSOG and ENTSO-E with important insights from external experts that enhanced the final scenarios. After the success of this cooperation in the TYNDP 2020 Scenario Report, ENTSOG and ENTSO-E decided to ex-pand their interaction with external organisations.
In order to provide greater transparency on key data parameters and assumptions used throughout the scenario building process, the Scenario Building Team decided to document and publish all interactions via bilateral meet-ings conducted with external stakeholders (e. g. research institutions, industry organisations etc.). After publishing an initial list of bilateral meetings as part of the Storyline Report, this list has been updated for the publication of the Draft Scenario Report and made available on the TYNDP Scenarios website. This documentation provides greater transparency and shows clearly the wide range of organi-sations that have contributed to the creation of the report.
Consultation on hard data – not just concepts
After criticism of the qualitative “storyline matrix” pro-duced for the 2020 Storyline Report, the Scenario Build-ing Team chose to completely revise this element of the scenario building process. For the 2022 Storyline Report, the Scenario Building Team included not only qualitative questions in their public consultation, but also quantitative
ranges on key parameters (e. g. development trajectories for important technologies or energy carriers) based on data from reputable external studies. This gave stakehold-ers the opportunity to directly influence the underlying assumptions for the scenarios.
Transparent documentation of feedback and interactions
In order to ensure stakeholders that their consultation responses have been considered as part of the scenario building process, the scenario building team decided to publish all consultation feedback received in the storyline consultation of November – December 2020.
The scenario building team often receives feedback from external stakeholders outside of the planned consultation windows. While the team has always made every effort to respond to this feedback and answer any questions, it was decided that this correspondence should also be published as part of the 2022 cycle. This information is available on the TYNDP Scenarios website. This publication enhances transparency and provides further insight into the process.

62 // ENTSO-E // ENTSOG TYNDP 2022 Draft Scenario Report
Both ENTSOG and ENTSO-E consistently work to improve their data, tools and method-ologies between each TYNDP scenario release. As such, the TYNDP 2022 scenarios have built upon the lessons learned from each of the previous editions. Improvements for TYNDP 2022 scenarios were prioritised based on the stakeholder feedback received in previous TYNDP scenario consultations. Some of the key improvements for the TYNDP 2022 scenarios are described in this chapter. The methodologies used by both ENTSOs to produce the scenarios are presented in detail in the Draft TYNDP 2022 Sce-nario Building Guidelines report, which is published separately.
8.1 Proactive and early stakeholder engagement
To ensure transparency, inclusiveness and efficiency, ENTSOG and ENTSO-E have included stakeholders from the very beginning of the TYNDP 2022 scenario building process, through most notably organising three workshops
and one public consultation on the scenario storylines. In addition, ENTSOG and ENTSO-E also bilaterally engaged with key stakeholders to factor in further expert knowl-edge.
Improvements in the TYNDP 2022 scenarios8

ENTSO-E // ENTSOG TYNDP 2022 Draft Scenario Report // 63
8.2 Even more contrasting scenarios
During the public consultation of the TYNDP 2020 scenar-io report several stakeholders perceived a lack of differen-tiation between the scenarios. Although this concern was addressed in the updated TYNDP 2020 scenario report published in June 2020, ENTSOG and ENTSO-E aim to further improve this for the TYNDP 2022 edition. To this end, ENTSOG and ENTSO-E extensively analysed the main scenario drivers to be explored in the storylines in order to ensure appropriate differentiation between the TYNDP 2022 scenarios. A list of main drivers for the scenario build-
ing was proposed in the draft TYNDP 2022 Storyline Re-port which was released on 3 November 2020. These main drivers where publicly consulted with stakeholders as part of the draft storylines consultation. Based on stakeholder feedback the main drivers were adapted, in particular for example with regard to the energy intensity assumptions, which were considered to show too much variation. The final list of main drivers used in the TYNDP 2022 scenario building was released together with the Final Storyline Report in on 26 April 2021.
8.3 Enhancements to the sector coupling methodology
Today the energy system is very much built along a linear value chain from primary energy to final use. Interaction between energy carriers is restricted to power generation and consuming sectors are barely involved in the design and operation of the energy system.
Such a system is easy to understand but it prevents taking advantage of new synergies between energy carriers and sectors. With the energy transition, it is necessary to build new bridges enabling a more efficient use of primary ener-gy and providing flexibility to an energy system dominated by solar and wind energy.
While electricity and gas transmission systems are likely to stay a major component of the European energy system, it is necessary to capture the possible new dynamics at their interface with other energy consuming sectors (e. g., mobility), at various geographical scales (e. g., district heat-
ing) and with other carriers (e. g. P2G and P2L). In order to better picture these new interfaces and their role in the energy transition, ENTSOG and ENTSO-E have established a wider and closer cooperation with the representatives of other sectors with in particular:
- District heating with EuroHeat & Power;
- E-mobility and prosumers with DSO associations (CEDEC, E.DSO, Eurelectric, Eurogas, GEODE);
- Hydrogen and Power-to-Gas with Hydrogen Europe.
It has paved the way for new and innovative joint analysis and the sector coupling modelling improvements imple-mented in this edition that would not have been possible without the constructive mind-set and inputs of such partners.
8.4 Considerations of hydrogen system in the mid-/long term and of a wider range of electrolysis configurations
The TYNDP 2020 Scenario report brought valuable infor-mation about the amount of RES capacity to be developed to supply a growing hydrogen demand through electrolysis. It was expected that following editions will further investi-gate the interactions between energy carriers.
Taking into account the development of hydrogen, from a strategy and industrial perspective, and the growing need for flexibility, the improvement of hydrogen and electroly-sis modelling has been considered as a priority by ENTSOG and ENTSO-E. Such improvements have materialised by the definition of a wide range of electrolysis configurations and the development of a hydrogen system on the medium and long term.
The different configurations intend to capture the different uses of hydrogen (e. g., end-use and further transformation into synthetic fuels) and the evolution of the European hydrogen system. Electrolysers will operate differently de-pending on their combination with other hydrogen sources and/or flexibility tools. As a result, the scenarios bring original information on the interaction, mostly synergies, between electricity and hydrogen systems.
From a wider perspective, scenarios also provide new insights on the other sources of hydrogen such as prices, type (renewable or low carbon) and geographical perspec-tive. It brings transparency on the level of integration of Europe in its surroundings in line both with national strat-egies of non-EU countries (e. g. Morocco and Norway) and the EU Hydrogen Strategy (e. g. 40 GW of electrolysis to be installed in surrounding regions).

64 // ENTSO-E // ENTSOG TYNDP 2022 Draft Scenario Report
8.5 Vehicle-to-Grid and prosumer modelling
The development of e-mobility, residential batteries and solar panels provides new opportunity for citizens to in-teract with the overall electricity system.
In the previous edition of the scenario report (TYNDP 2020), such interactions were defined as static inputs to the electricity system modelling. This approach was meaningful to capture smart charging but was not fully taking into account some more integrated strategies such as Vehicle-to-Grid.
In addition, PV and battery capacities did not distinguish infrastructures directly connected to the electricity mar-
ket and those installed by prosumers, meaning that their development and operation were optimised at European system level. This did not reflect more specific and local drivers such as the willingness of prosumers to reduce their dependence from the grid.
For this edition, passenger cars and prosumers have been explicitly modelled as specific components of the electric-ity system. As a result, it is possible to capture their evolu-tion according to hybrid signals: the wholesale electricity market price on one hand and specific drivers such as the reduction of connection cost or mobility needs.
8.6 Optimisation of district heating operation
In previous editions, the air and water heating market was split between a wide range of technologies being installed at end-user facility or as part of a district heating network. However, each technology was modelled as if individually installed. This hindered the ability to take into account the optimisation potential offered by district heating in combining different heat sources together with flexibility options (network inertia or dedicated thermal storage).
For this edition, a specific modelling step has been intro-duced prior to the electricity system modelling. The aim is to define the capacity and electricity load profiles of heat pumps installed on district heating networks. With the combination of heat technologies partly taken into account, the design and load factor of heat pumps have been optimised compared to their equivalent installed at end-user level.
At this stage the optimisation is run independently from the dispatch of the electricity system and focuses on climatic parameters. Future editions will provide the op-portunity to investigate the reactiveness of district heating to electricity price in a wider context.

ENTSO-E // ENTSOG TYNDP 2022 Draft Scenario Report // 65
In this report ENTSOG and ENTSO-E propose the draft scenarios for TYNDP 2022. The publication of this draft scenario report marks the start of the official scenario consul-tation. The next steps are the following:
- With the publication of this draft scenario report an online public consultation is launched. Stakeholders are invited to share their opinion and give feedback on the proposals within this report. Stakeholder comments are greatly welcomed and are considered an essential part of the scenario development process.
- The completion of electricity market modelling for the National Trends scenario for the 2040 time horizon enabling the quantification of coupling between the electricity, methane and hydrogen systems.
- Upon receiving the stakeholder feedback, ENTSOG and ENTSO-E will update and finalise the scenario report and submit it to ACER for its opinion. This updated scenario report for ACER submission is expected to be published in early 2022.
- The updated scenarios’ report feed into the TYNDP 2022 development process. The electricity and gas draft TYNDPs are expected to be published in Q3 2022 for public consultation.
- Further to receiving the public consultation feedback as well as ACER’s opinion, ENTSOG and ENTSO-E will publish their respective TYNDPs.
- Both TYNDPs will support the 6th PCI selection process.
In the meantime, ENTSOG and ENTSO-E are currently working together on the further development of their Interlinked Model for the identification of projects worth a dual assessment on both gas and electricity systems.
Next steps9

66 // ENTSO-E // ENTSOG TYNDP 2022 Draft Scenario Report
Biomethane Gaseous renewable energy source derived from agricultural biomass (dedicated crops, by-products and agricultural waste and animal waste), agro-industrial (waste from the food processing chain) and the Organic Fraction Municipal Solid Waste (OFMSW).
BEV Battery electric vehicle
Carbon budget This is the amount of carbon dioxide the world can emit while still having a likely chance of limiting average global temperature rise to 1.5 °C above pre-indus-trial levels, an internationally agreed-upon target.
CBA Cost Benefit Analysis carried out to define to what extent a project is worthwhile from a social perspective.
CCS Carbon Capture and Storage. Process of sequestrating CO₂ and storing it in such a way that it won’t enter the atmosphere.
CHP Combined heat and power
COP 21 Legally binding international treaty on climate change, adopted by 196 Parties at COP 21 in Paris on 12 December 2015. In this report it also refers to the COP 21 scenario building approach which enables full energy scenario development and carbon emission assessment.
Direct electrification Electricity demand for direct use in the final demand sectors (residential, tertiary, industry etc). Electricity which is converted to other energy carriers through power to gas or power to liquids is referred to as indirect electrification.
DSR Demand Side Response. Consumers have an active role in the balancing of energy supply and demand by changing their energy consumption according to the ener-gy price and availability. For example, by softening demand peaks in case of congestions, or by increasing energy use during surplus supply.
EC European Commission
EV Electric vehicle
FCEV Fuel cell electric vehicle
Glossary10

ENTSO-E // ENTSOG TYNDP 2022 Draft Scenario Report // 67
GHG Greenhouse gas
Hybrid Heat Pump heating system that combines an elec-tric heat pump with a gas condensing boiler to optimise energy efficiency.
IA Impact Assessment released by the European Commission on 17 September 2020: Communication COM/2020/562: Stepping up Europe’s 2030 climate am-bition Investing in a climate-neutral future for the benefit of our people
ICE Internal combustion engine
IEA World Energy Outlook
LNG Liquefied natural gas
IPCC Intergovernmental Panel on Climate Change
LTS Long Term Strategy released by the European Com-mission on 28 November 2018: A Clean Planet for all. A European strategic long-term vision for a prosperous, modern, competitive and climate neutral economy.
LULUCF Land Use, Land Use Change and Forestry. Sink of CO₂ made possible by the fact that atmospheric CO₂ can accumulate as carbon in vegetation and soils in terrestrial ecosystems.
NECPs National Energy and Climate Plans are the new framework within which EU Member States have to plan, in an integrated manner, their climate and energy ob-jectives, targets, policies and measures to the European Commission. Countries will have to develop NECPs on a ten-year rolling basis, with an update halfway through the implementation period. The NECPs covering the first period from 2021 to 2030 will have to ensure that the Union’s 2030 targets for greenhouse gas emission reduc-tions, renewable energy, energy efficiency and electricity interconnection are met.
NGO Non-governmental Organisation
P2G Power to gas. Technology that uses electricity to pro-duce hydrogen (Power to Hydrogen – P2H₂) by splitting water into oxygen and hydrogen (electrolysis). The hydro-gen produced can then either be used directly or indirectly to produce other fuels, where it is combined with CO₂ to obtain synthetic methane (Power to Methane – P2CH4) or can be converted to other energy carriers like for example synthetic ammonia (P2NH3).
P2L Power to liquids. Combination of hydrogen from elec-trolysis and Fischer-Tropsch process to obtain synthetic liquid fuels.
PCI Project of Common Interest
Power-to-Hydrogen/P2Hydrogen Hydrogen obtained from P2H₂
Power-to-Methane/P2Methane Renewable methane, could be biomethane or synthetic methane produced by renewable energy sources only.
RES Renewable energy source
SMR Steam methane reforming, an industrial process to produce hydrogen with natural gas. Can be outfitted with carbon capture technologies
Synthetic fuel Fuel (gas or liquid) that is produces from renewable or low carbon electrical energy
TEN-E Trans-European Networks for Energy, EU policy fo-cused on linking the energy infrastructure of EU countries
TSO Transmission System Operator
TYNDP Ten-Year Network Development Plan

68 // ENTSO-E // ENTSOG TYNDP 2022 Draft Scenario Report
ImprintIJoint-Publishers
ENTSOG
European Network of Transmission System Operators for Gas
Avenue de Cortenbergh 100 1000 Brussels, Belgium
www.entsog.eu
ENTSO-E
European Network of Transmission System Operators for Electricity
Rue de Spa, 8 1000 Brussels, Belgium
www.entsoe.eu
Co-authors
Alexander Kättlitz Maria Chiara Cavarretta Nalan Buyuk Olivier Lebois Pieter Boersma
Sub-Team leads of the Joint WG Scenario Building
Joint WG Scenario Building
ENTSOG WG Scenarios
ENTSO-E Regional Groups
Design
DreiDreizehn GmbH, Berlin | www.313.de Cover artwork: ZN Consulting, Brussels | www.znconsulting.com
Pictures
p. 6: courtesy of GASCADE p. 8: courtesy of Gas Connect Austria/Monika Aigner p. 10: courtesy of Gas Connect Austria p. 12: courtesy of TenneT/©siemens_ag_ulrich_wirrwa p. 14/59: courtesy of National Grid p. 26: courtesy of Gasgrid Finland p. 44: courtesy of PSE Operator p. 49/53: courtesy of RWE p. 50: courtesy of GRTgaz p. 55: ©iStockphoto.com/petmal p. 61: courtesy of TAP p. 62: courtesy of ONTRAS/petereichler.com p. 65: ©aerogondo – stock.adobe.com p. 66: courtesy of Elia
Publishing date
October 2021