tx e-95-r final report - revised - texas parks and ... · completion of the final report and...
TRANSCRIPT

FINAL REPORT
(REVISED)
As Required by
THE ENDANGERED SPECIES PROGRAM
TEXAS
Grant No. TX E-95-R
Endangered and Threatened Species Conservation
A Survey of Upper Texas Coast Critical Habitats for Migratory and Wintering Piping Plover and Associated “sand” plovers
Prepared by:
John Arvin
Carter Smith Executive Director
Clay Brewer Acting Division Director, Wildlife
2 February 2010

Traditional Section 6 Project Final Report REVISED 2010
Page 2 of 25
FINAL REPORT - REVISED
STATE: ____Texas_______________ GRANT NUMBER: ___ TX E-95-R___ GRANT TITLE: A Survey of Upper Texas Coast Critical Habitats for Migratory and Wintering Piping Plover and Associated Resident “sand” plovers REPORTING PERIOD: ____6 Sep 07 to 28 Feb 10_ OBJECTIVE(S): To quantify the population of Piping Plover (Charadrius melodus) on the upper coast of Texas throughout the 2007-2008 season to determine population size of wintering plovers and factors which influence their differential use of habitat. Segment Objectives:
1. A complete survey of the defined coastline will be conducted twice each month between November 1, 2007 and October 31, 2008.
2. Observers will attempt to systematically count all age and sex classes of Piping Plover,
Snowy Plover, and Wilson’s Plover per unit of linear coastline. The location of marked birds will be recorded using GPS and mapped.
3. Statistical analysis will be used to measure habitat usage against a variety of variables
including human disturbance, presence of potential competitors, tidal exposure of habitats, and ambient as well as synoptic weather patterns.
4. Selected areas will be surveyed bi-weekly through the field season for comparisons of
Piping Plover use of highly disturbed versus relatively undisturbed beach habitat.
Significant Deviation: None. Summary of Progress: Please see Attachment A (supplementary GIS material will be sent by regular mail). Location: Jefferson, Galveston, Brazoria, and Matagorda Counties, Texas. Cost: ___Costs were not available at time of this report; they will be available upon completion of the Final Report and conclusion of the project.__

Traditional Section 6 Project Final Report REVISED 2010
Page 3 of 25
Prepared by: _Craig Farquhar_____________ Date: 2 Feb 2010 Approved by: ______________________________ Date:_____2 Feb 2010_____ C. Craig Farquhar

ATTACHMENT A
A Survey of Wintering Piping Plovers on the Upper Texas Coast; Their distribution and Aspects of their Ecology
Grant Manager: Cecilia M. Riley Executive Director
Gulf Coast Bird Observatory 103 W. Hwy 332
Lake Jackson TX 77566 Office: 979-480-0999
Principle Investigator: John C. Arvin Gulf Coast Bird Observatory, 103 W. Hwy 332
Lake Jackson, TX 77566 Telephone (979) 480-0999
Survey Period: January 2008 – February 15, 2009
This report consists of two parts, a narrative summary of the entire project (this document) and a GIS component in which the results are displayed graphically. Due to its
size the GIS data was mailed separately.

Traditional Section 6 Project Final Report REVISED 2010
Page 5 of 25
Abstract We surveyed the upper Texas coastline from the mouth of the Sabine River to the mouth of the Colorado River, a straight-line distance of about 200 km., between January 2008 and January 2009. We recorded 1131encounters with Piping Plovers at 748 locations marked by GPS coordinates. We noted any observed interactions between Piping and Snowy and Wilson’s Plovers which share the same coastline and recorded color marked Piping Plovers so we could observe the movements of uniquely marked birds. We compared our GIS data with published Designated Critical Habitat areas for the species. We attempted to measure human disturbance as a factor in Piping Plover wintering distribution by comparing our survey results between a moderately heavily used beach with an adjacent beach with little or no human disturbance. Our study was seriously interrupted by landfall of Hurricane Ike at approximately the mid-point of our study area in mid September. The storm affected the distribution of Piping and other small “sand plovers” and we attempted to document the movements of plovers in response to the severe habitat alteration caused by it. Finally, based on a year of observation of Piping Plover distribution we attempted to assess any imminent threats to the areas where relatively high numbers of Piping Plovers were consistently encountered.
Introduction
The Piping Plover, Charadrius melodus, has three disjunct breeding populations in North America. These inhabit the northeast Atlantic coast from North Carolina to the Canadian Maritime Provinces, the area around the Great Lakes, and the prairie states and provinces from Nebraska to Saskatchewan (Elliott-Smith and Haig, 2004). The eastern and western breeding populations are ranked as Threatened and the Great Lakes population is ranked Endangered by the U.S. Fish & Wildlife Service (50 CFR 17.11). All three populations winter on the Atlantic and Gulf of Mexico coastlines from North Carolina through Texas and eastern Mexico sparingly as far south as Yucatan, and locally scattered through the Greater Antilles (Elliott-Smith and Haig, 2004; Nicholls and Baldassarre, 1990b). All Piping Plovers are rated Threatened on the wintering grounds as different populations cannot be distinguished in the field unless uniquely marked birds are involved. The coast of Texas is known to be one of the major wintering areas for the species (White and Elliott, 1999; Drake, et al. 2001). However, most previous studies of the wintering distribution and ecology of Piping Plovers on the Texas coast have been carried out along the lower and middle Texas coast (Mabee, et al., 2001; White and Elliott, 1999); Zdravkovic, 2004). Few data are available from the upper coast. These are from one day counts of selected coastal units known to host relatively high numbers of wintering plovers (Elliott-Smith, et al., 2009) and distribution, abundance, and ecological work at three sites - Bolivar Flats, “Big Reef”, and San Luis Pass (Zonick, 2000). The present project was aimed at providing more detailed information about Piping Plovers on the upper Texas coast throughout the annual cycle. We also collected population size data for two other species of “small sand plovers”, Snowy Plover Charadrius alexandrinus, and Wilson’s Plover, Charadrius wilsonia, and attempted to assess their interactions, if any, with migrating and wintering Piping Plovers. Snowy Plover is considered “Threatened” by the USFWS (50 CFR, ibid) for

Traditional Section 6 Project Final Report REVISED 2010
Page 6 of 25
details, and Wilson’s Plover has a world population estimated to be only 5000 pairs, although no significant decline in population size has been noted (Corbat and Bergstrom, 2000). Both species use the same heavily populated Gulf coast as does Piping Plover. Our survey of Piping Plovers on the upper Texas coast throughout a calendar year was seriously disrupted by Hurricane Ike, which made landfall at approximately the midpoint of the study area on September 13, 2008 (Figure 1). The ensuing damage made access to parts of the study area impossible for weeks and seriously altered habitat that previous visits had identified as moderate to high use, causing plovers to disperse to other parts of the coast. Thus the survey is necessarily divided into two, non-comparable datasets. However, the storm did provide a unique opportunity to focus on the adaptability of the species to periodic major perturbations in the environment.
Hurricane Ike Track,September 13, 2008
Figure 1: Hurricane Ike landfall in relation to plover survey units.
Objective To quantify the population of Piping Plover (Charadrius melodus), an endangered shorebird that winters on the Texas coast and is present from approximately August through early May, on the upper coast of Texas throughout 2008 season to determine population size of wintering plovers and factors which influence their differential use of habitat.
Methods and Materials
Benjamin Wardwell was the primary field investigator with occasional help by the Principle Investigator and several volunteers. We surveyed Piping and other “sand plovers”on the upper Texas coast, defined as the coastlines of Jefferson, Galveston,

Traditional Section 6 Project Final Report REVISED 2010
Page 7 of 25
Brazoria, and part of Matagorda Counties. The latter terminated on its southern end at the mouth of the Colorado River. We designated these areas as follows: Jefferson County was designated “McFaddin Beach” (36.4 km.) because the McFadden NWR extended almost the entire length of that coastline. Galveston County was separated into “Bolivar Peninsula” (39.5 km.), and “Bolivar Flats”(0 km.), a small, very rich shorebird location just north of the entrance to Galveston Bay and the Houston/Galveston ship channel at the northern base of the jetty protecting the channel entrance, “Apfel Park” (0 km.) on the northern tip of Galveston Island (a portion of “Big Reef”), and “West Galveston Island”(2.0 km.), limited to the beaches and tidal inlet at and near San Luis Pass, the southern outlet of Galveston Bay. Brazoria County was separated into “Follett’s Island” (22.2 km.), that stretch of coastline from San Luis Pass southwestward to Surfside, at the entrance to the Port of Freeport (site of the former Brazos River mouth), “Quintana/Bryan Beach” (10.2 km.) south of the entrance to the port of Freeport and terminating at the present Brazos River mouth, and “Wolf Island” (12.9 km.) south of the mouth of the Brazos to near the Matagorda County line. The opening of the San Bernard River mouth in June 2008 limited our ability to survey beyond the river mouth. In Matagorda County, “Sargent Beach” (9.7 km.) is the segment from the community of Sargent northeastward to an extensive shallow lagoon system with dangerous beach driving conditions, and “Matagorda North” (27.0 km.) from the mouth of the Colorado River north to “Brown Cedar Cut”, a manmade channel into the marsh-lined lagoon lying behind the beach.
Figure 2. Coastal Units Surveyed During 2008. Our goal was to survey the Gulf beaches and tidal inlets twice each month during 2008. We conducted surveys using automobiles with four wheel drive, all-terrain vehicle (ATV), bicycle, and on foot, depending on circumstances. All Piping Plovers encountered were recorded and their locations were marked by GPS coordinates. The coordinates represent the closest location to the plovers being observed that they would tolerate the observer without flushing, or the closest point that the physical situation

Traditional Section 6 Project Final Report REVISED 2010
Page 8 of 25
would permit. Thus a point may represent multiple birds. Plovers were examined by telescope (Swarovski ST-80 with 20 X 60 zoom eyepiece) in an effort to determine gender and age, and to ascertain the color combinations of bands and flags on marked birds. After landfall of Hurricane Ike we compared the amount of Piping Plover use of each coastal unit with that measured before the hurricane. We standardized the raw data by calculating birds per unit of effort, defined as hours spent censusing birds along each coastal unit by a single party, regardless of the number of observers in that party. The latter varied from one (over 90% of the surveys) to four. Effort varied widely among coastal units after the hurricane due to some survey units being inaccessible for an extended period of time. We felt that the effort metric more accurately reflected the real population changes than measuring birds per linear coastline unit surveyed, since the distance metric of each segment remained static throughout the project while the amount of effort (measured as party hours) varied widely among survey segments. We recorded the numbers of Snowy and Wilson’s Plovers and their observed interactions, if any, with Piping Plovers. We did not mark locations of these species by GPS coordinates, but we did record total numbers of each for each survey of a coastal segment. For each coastal transect unit we recorded the date, starting and ending times, sky condition, wind speed and direction, air temperature, and relative tide level. We also recorded observed plover activity (foraging, resting/roosting) and in what microhabitat each activity was taking place (intertidal foreshore, backshore, rear dune pools and lagoons, exposed tidal flats, etc.). To attempt to assess the effects of human disturbance on the distribution of plovers in the study area we chose to examine two adjacent beach segments using the methods of Amos (1995). Quintana/Bryan Beach on the north bank of the Brazos River is relatively heavily used by humans. On the south bank of the Brazos, just .5 km. away, Wolf Island is accessible only by boat and is rarely visited by humans. Piping Plovers used both these beaches. It should be noted that as a condition of providing permission to operate a non-street legal vehicles (ATV) on the beaches, we were required to refrain from performing surveys on weekends and holidays. This biased our human disturbance observations by limiting surveys to those periods of relatively low human beach use.
Results and Discussion: Before Hurricane Ike
The GPS coordinates of each Piping Plover located were mapped using ArcGIS 9.1. Various attributes of the points may be displayed graphically. These data are included in the GIS portion of this report and some important maps were made as figures for this document. We recorded 1131 Piping Plover encounters at 748 GPS locations during the study. Of these we recorded 691 before landfall of Hurricane Ike and 440 afterward. The GIS data includes Piping Plover locations by coastal unit as well as absolute location, number of individuals by date and season, whether marked, and population changes

Traditional Section 6 Project Final Report REVISED 2010
Page 9 of 25
throughout the annual cycle, and changes in numbers and location of Piping Plovers after the Hurricane. During the same period, we recorded 401 Snowy Plover encounters and 291 encounters of Wilson’s Plovers. These were counted by coastal unit surveyed but were not mapped.

Traditional Section 6 Project Final Report REVISED 2010
Page 10 of 25
Interactions Among and Between Piping and Other Plover Species Our goal was to survey the distribution and abundance of Piping Plovers on the upper Texas coast throughout an annual cycle. However, we did make observations incidental to this goal on the behavior of Piping and other small plovers as fulfillment of our goal permitted. Our observations indicate that there is intra- and interspecific competition among most small shorebirds. Piping, Snowy, and Wilson’s Plovers show both types of competition, but the strongest aggression is seen during conspecific encounters. This seems to be due to food resource competition between individuals. This hypothesis is further supported by noted incidents when food was abundant, as with exceptionally low tides exposing prey items rarely available, plovers suspended exclusionary behavior. Under these conditions individuals tolerated closer conspecific competitors. This suggests that Piping Plovers maintain individual feeding territories that are variable in size depending on the abundance of the resources. Plovers are gregarious in resting/roosting situations and these groups may contain all three species with no observed interaction other than association.
Wilson’s Plover No interspecific competition was noted between Piping and Wilson’s Plovers when the two on the upper Texas coast. The phenology of the two species in the region is essentially reversed, with only a limited period of overlap in the spring and again in late summer (Figure 3). Wilson’s Plovers were observed to utilize larger prey, primarily insects and crustaceans such as ghost crabs and fiddler crabs. This prey base is predicted by the much heavier and longer beaks of Wilson’s Plover. These prey items were obtained landward of the intertidal zone where Piping Plovers forage. Wilson’s Plovers carry on most of their activities in areas behind the narrow dune line after the young hatch. Adults and unfledged juveniles spend two to three weeks feeding primarily on crabs (Zdravkovic 2004). Most Wilson’s Plovers were off the survey transect during the early summer (Figure 3). This may be seen by the lower detection levels in June. After the juveniles fledge and become independent, both adults and juveniles appear on the Gulf beaches for a relatively short period prior to an early departure from the breeding grounds. Thus the detection rate shows a strong spike in July and August (Figure 3). Post-breeding withdrawal is near complete, although a few birds do occasionally winter at rich foraging sites (e.g. Bolivar Flats). We recorded only a single Wilson’s Plover after Hurricane Ike, but this is partially due to the necessary suspension of surveys for several weeks from mid September through mid October due to access and travel problems (Figure 3). Some areas, such as Bryan Beach in Brazoria County, have shallow lagoon areas behind the dune line that offer habitat to many shorebirds including Piping, Snowy, and Wilson’s Plovers when water levels are appropriate. These areas are ephemeral in nature and during the abnormally dry summer of 2008 dried up completely. Most shorebirds were forced to disperse to other areas. Virtually none of the migrant and/or wintering population of Piping Plovers was present during the earlier part of that season, but

Traditional Section 6 Project Final Report REVISED 2010
Page 11 of 25
migrants began arriving in numbers in August. Due to the dry conditions these birds were forced to use the Gulf beaches exclusively.
Snowy Plover We observed the ecological overlap between Snowy and Piping Plovers to be less sharply demarcated. In terms of temporal occurrence, the phenology of the two species is similar (Figure 3.). Although Snowy Plovers nest in moderate numbers on parts of the Texas coast, only two pair exhibited breeding behavior in our study area, one pair on McFaddin Beach and the other near Bolivar Flats at the southern end of Bolivar Peninsula. Both Snowy and Piping Plovers were observed feeding in the intertidal zones at times (Zonick, 2000). However, Snowy Plovers fed more often on flies, midges, and coleopterans on the higher backshore and on dry to wet (but exposed) sand and algal flats well behind the dune line (Page et al., 2005; pers. ob.). These latter habitats are quite limited and ephemeral in the study area, however. We observed no instances of aggressive interactions between Piping and Snowy Plovers All three species formed mixed flocks, sometimes with Sanderlings Calidris alba, and used the backshore for resting and roosting. This was especially prevalent when tides were high, covering the foreshore areas. Birds rested in small hollows in the sand or behind driftwood and other beach debris to shelter from windblown sand.
0
20
40
60
80
100
120
140
160
180
Janu
ary
Febru
ary
March
April
MayJu
ne July
Augus
t
Septem
ber
Octobe
r
Novembe
r
Decembe
r
Num
ber o
f bird
s
Snowy Plover
Wilson's Plover
Piping Plover
Figure 3. Comparative abundance through the year of three species of plovers on the upper Texas coast.
Piping Plover Heavy Use Areas in 2008 vs. Designated Critical Habitat

Traditional Section 6 Project Final Report REVISED 2010
Page 12 of 25
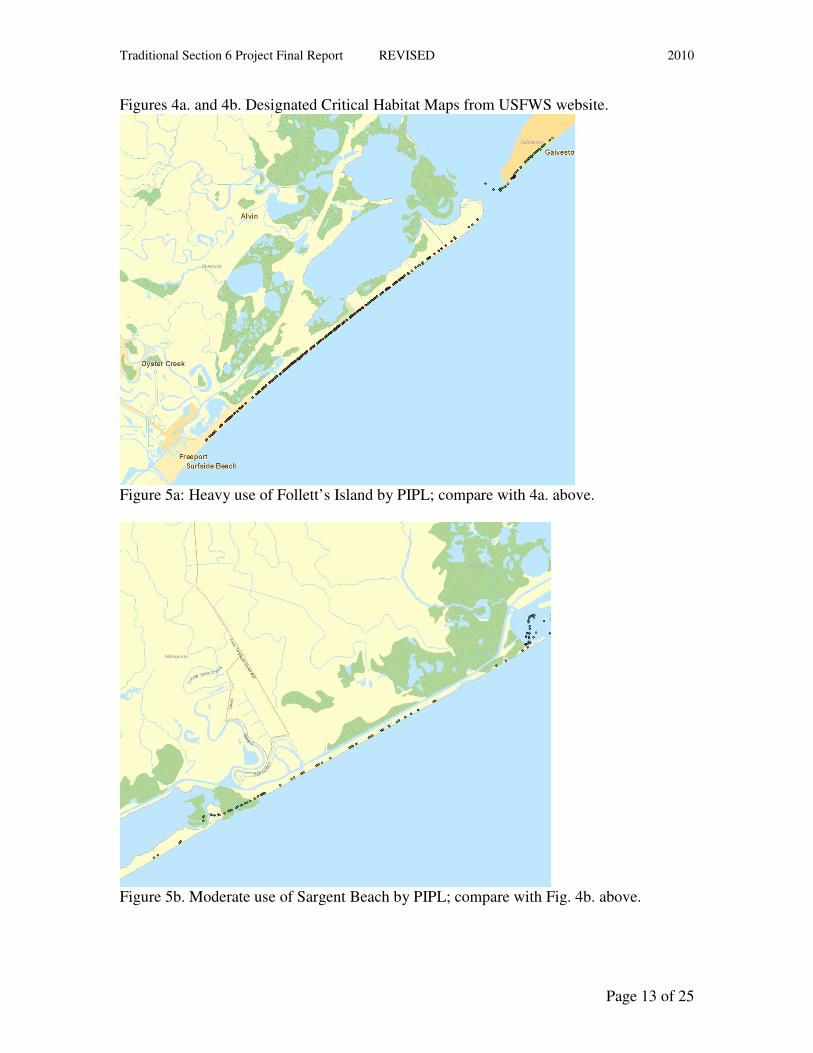
Most of the areas we identified as heavy use by Piping Plovers corresponded with USFWS Critical Winter Habitat as published. (USFWS, 2009). Significant deviations in our results from designated areas include Wolf Island (Unit TX 32) which had light plover presence before Hurricane Ike. Plover usage did greatly increase after the hurricane leading us to speculate that birds displaced from coastal areas that were severely impacted might be forced to utilize marginal habitats on less affected parts of the coast. We made no Piping Plover detections at Apfel Park (Unit TX 35, “Big Reef”, in part in Designated Critical Habitat maps) before the storm. Use increased after the storm but the sample size was still very small. Conversely we consistently recorded high numbers of plovers on Follett’s Island, not designated Critical Habitat except for the Brazoria County side of San Luis Pass (Unit TX 34 in part). Moderately high numbers used Sargent Beach, likewise not Designated Critical Habitat, especially during migration periods (Figures 5a. and 5b.) Comparing the results from our GIS data with the currently designated Critical Habitat, one (50 CSR part 17, 2001) can see that the latter areas need to be expanded to include heavily used habitat identified in this study (Figures 5a and 5b.). GIS display of our results indicates that major areas of Piping Plover concentration are the mouths of rivers, particularly the Brazos River mouth at Bryan beach and the Colorado River mouth at Matagorda Bay Nature Park, or passes, natural or manmade, into major bay systems. These habitats exist at Bolivar Flats at the northern entrance to Galveston Bay, and San Luis pass at the southern entrance (Nicholls and Baldarassare, 1990). We found that plovers were not equally distributed on both sides of tidal inlets but tended to cluster on the north sides. Our initial hypothesis to explain this phenomenon was derived from a statement in Britton and Morton (1989) that the net effect of currents and winds was to cause the organic rich detritus issuing from tidal inlets to accumulate on “northeastern” shores of the inlet. A more careful reading indicates that Britton and Morton were referring to northeastern facing shores, which in fact are the southwestern shores of the inlet. This leaves the observed phenomenon of consistent concentrations of plovers on the north sides of tidal inlets unexplained.
Traditional Section 6 Project Final Report REVISED 2010
Page 13 of 25
Figures 4a. and 4b. Designated Critical Habitat Maps from USFWS website.
Figure 5a: Heavy use of Follett’s Island by PIPL; compare with 4a. above.
Figure 5b. Moderate use of Sargent Beach by PIPL; compare with Fig. 4b. above.

Traditional Section 6 Project Final Report REVISED 2010
Page 14 of 25
Figure 6. Piping Plovers tended to cluster at tidal inlets and river mouths, especially on the north sides. Many of the beaches along the entire survey transect are bordered on their landward sides by salt and brackish marshes dominated by Spartina. alterniflora, which offer little or no habitat used by Piping Plovers. Tidal inlets were characterized by sand substrates around their entrances extending suitable habitat for plovers a short distance into the marsh-lined lagoons behind the Gulf beaches. The broad exposed algal flats heavily used by wintering Piping Plovers on the lower Texas coast (Mabee et al., 2001) are almost entirely absent on the upper coast. Beach washover areas, also a heavily used habitat on parts of the Texas coast, primarily for roosting (Elliot and Zonick, 1998; Zonick, 2000), were also virtually lacking from most of the study area northeast of Matagorda Peninsula before Hurricane Ike. Apparently these do not form in the absence of a lagoon system behind a beach as in a barrier island situation. Washovers became numerous after the hurricane but were almost uniformly scoured of sand and most contained water through the remainder of the study. They may become suitable for Piping Plovers as they revert to unvegetated sandy washes over time.
Human Disturbance . We compared two adjacent coastline segments - Quintana/Bryan Beach in Brazoria County, with relatively high human traffic seasonally, but low levels of development on or just behind the beach - with an area of entirely undeveloped beach of approximately the same length, Wolf Island, with almost no human activity. Wolf Island is between the

Traditional Section 6 Project Final Report REVISED 2010
Page 15 of 25
mouths of the Brazos and San Bernard Rivers, separated from the mainland by the Intracoastal Waterway, and is accessible only by boat. Piping Plovers were considerably more numerous on the Quintana/Bryan Beach side (the north side of the river mouth and the area more heavily used by humans), than on the inaccessible Wolf Island side of the river mouth. Before landfall of Hurricane Ike the northeastern side of the mouth of the Brazos River had 103 Piping Plover detections compared with only 18 detections on the southwestern, Wolf Island side...
Sargent Beach
Mouth of Brazos River
Figure 7. Comparative Piping Plover use of Wolf Island, an isolated, seldom-visited coastline segment with Quintana/Bryan Beach, a moderately heavily used recreational beach. Our prediction was that Piping Plovers would be more abundant on the undisturbed beach than they were on the adjacent beach more heavily used by humans (Amos, 2005). We were surprised to find that the reverse was true in our surveys. In this specific instance, our comparison between a relatively heavily used beach with that of an adjacent, isolated and essentially unused adjacent beach may be invalid. Human disturbance may be less significant as an influence on plover use than is the suitability of the habitats on the adjacent beaches to support the food base for plovers. Effluent from the Brazos River is picked up by longshore currents which flow southwestward, parallel to the Wolf Island beach (Britton and Morton, 1989).This current deposits copious amounts of debris, especially driftwood and sediment, on the Wolf Island side (pers. ob). The constant accumulation of sediments on this section of beach may tend to limit the intertidal fauna that forms the food base for Piping Plovers. Amos (2005) surveyed adjacent beaches that are separated by a man-made ship channel with little fresh water inflow from streams carrying sediment.

Traditional Section 6 Project Final Report REVISED 2010
Page 16 of 25
Otherwise our plover interactions with human beach goers were limited to observations made during the process of surveying. Piping Plover are present in significant numbers on the upper Texas coast during months when human beach use is low overall. Representative human use in winter was measured in February 2008 by counting all automobiles on each survey segment. The results expressed in vehicles per kilometer were: McFaddin Beach 0.14, Bolivar Peninsula 0.59, Bolivar Flats 0, Apfel Park 0, West Galveston Island 1.0, Follett’s Island 0.59, Quintana/Bryan Beach 0.88, Wolf Island (not surveyed in February but there is no vehicle access) 0, Sargent Beach 0.41, and Matagorda North 0.15. Although Burger (1994) found that Piping Plovers spent significantly less time foraging when people were present and more time being alert, we did not find general human presence on beaches with high plover use to be a major factor in Piping Plover distribution or behavior on the upper Texas coast (contra Elliot 1996). The differences are possibly due to the fact that Burger’s work was done in a breeding context rather than a wintering situation... Recreational use of the beaches at the levels we recorded in February does not seem to provide any significant deterrent to plovers using the beach on the upper Texas coast during winter. Most of the recreational use of beaches during the period when Piping Plovers are present in the study area in significant numbers is by fishermen, which Burger et al. (2007) found to have the least negative impact on foraging plovers among various categories of beach users. It should also be noted that we were constrained from conducting surveys on weekends and holidays when recreational use is highest as a condition for allowing us to use a non street-legal vehicle (All Terrain Vehicle) on the beaches of the entire study area. Thus, all of our detections were during weekdays when human use is relatively light compared to that on weekends and holidays at any season... Our observations incidental to censusing birds indicated that foraging Piping Plovers tended to ignore automobile traffic unless it actually threatened them. Most automobile traffic was well above the swash zone where Piping Plovers foraged. Resting/roosting congregations were more subject to traffic disturbance than were foraging birds because they occurred on the upper beach where automobile traffic was heavier. Pedestrian traffic causes minor disruption to foraging birds. Piping Plovers may relocate short distances to avoid pedestrian traffic, but they generally return as soon as pedestrians are past. Pedestrians with dogs that chase plovers and other shorebirds, however, do cause plovers to depart the area (Burger, et al. 2007; pers. ob.) although no quantification was attempted for dog/plover interactions. Housing or retail developments that front directly on the beach and back dune areas did negatively affect beach use by Piping Plovers. In all sections surveyed, detections were low in areas with significant beach development (e.g., areas of intensive residential development bordering the beaches on Galveston Island and sections of the Bolivar peninsula) (Ledee, 2005). Since the housing/business development doesn’t actually occupy space normally used by Piping Plovers during the winter the reasons why it seems to impact negatively on their use of adjacent areas remain unclear. Narrowing of the

Traditional Section 6 Project Final Report REVISED 2010
Page 17 of 25
beach corridor and the increased year-round presence of pedestrians, dogs and free ranging cats may have a discouraging effect on plovers.
II. Plover Response to Hurricane Ike Due to personal safety and access issues, and the disruption of the normal functioning of the Observatory for a period of several weeks, we were unable to observe the direct effects of the storm on those plovers which had already arrived in their fall migration at the time of landfall, so we have no data on any direct mortality that may or may not have occurred due to direct effects of the hurricane.. It should be noted, however, that shorelines in the study area had been flooded by higher than average tides dating from the landfall of Hurricane Gustav approximately 200 km. east of the study area on September 1, 2008. Tides remained unusually high until water levels rose still more ahead of Hurricane Ike. The shorelines used by plovers became deeply inundated by high tides for several days prior to actual landfall of Hurricane Ike, beginning September 10. Many of the plovers that had arrived were probably forced to relocate before the most violent weather arrived in the study area. For tide data between September 1 and 13 see (http://co-ops.nos.noaa.gov/data_menu.shtml?bdate=20080901&edate=20080913&unit=0&shift=d&mins=60&datum=6&stn=8771510+Galveston+Pleasure+Pier%2C+TX&type=Tide+Predictions&format=View+Data. 28 Sept. 2009). Exactly where Piping Plovers and other shorebirds relocate to avoid the widespread coastal flooding and violent weather associated with tropical storms is not known. Some of the Piping Plover response to the indirect effects primarily due to severe habitat alteration can be seen in the results of surveys conducted from October 2008 through January 2009 in the GIS data that accompanies this document. Figure 5a, 5b, and 5c. show the relative distribution of Piping Plover encounters before and after the storm. The spike in birds per hour from West Galveston Island and adjacent coastal segments would imply that birds moved from heavily impacted coastal areas at and east of landfall, but did not move farther than necessary. Wolf Island and Apfel Park show dramatic spikes in plover numbers after the storm which may imply that displaced birds were forced to use lower quality habitat that had not been used at all, or used very lightly, before the storm. However the sample size is low, especially for Apfel Park. Prior to Hurricane Ike Wolf Island beaches had been heavily littered with driftwood, including large trees. After the storm the beach was swept clean of driftwood. The storm surge carried it well inland (>0.5 km.) where it was deposited in large piles. The beach retained a mantle of sand after the storm with the underlying clay layer visible in only a few spots, possibly because of thicker deposits due to effluent from the Brazos River.

Traditional Section 6 Project Final Report REVISED 2010
Page 18 of 25
Figure 7. PIPL per survey hour before and after Hurricane Ike.
Figure 9a. Distribution of Piping Plover encounters in 2008 before Hurricane Ike. Notice that plovers tend to concentrate at specific sites. Most of these sites are at the mouths of tidal inlets.

Traditional Section 6 Project Final Report REVISED 2010
Page 19 of 25
Figure 9b. Distribution of Piping Plovers in 2008 after Hurricane Ike. Notice that plovers disappeared completely from Bolivar Peninsula northward and that plovers that formerly congregated at specific sites are much more widely dispersed. The relatively large number of Piping Plovers (Figure 9a) mapped near the mouth of the Sabine River on Texas Point N.W.R. property represent a single roost assemblage of 23 birds censused from one GPS point. This makes up a significant fraction of the total of 94 birds counted on the McFaddin Beach survey unit for the months prior to Hurricane Ike. Most of the remainder were on sandy beach in the vicinity of the (closed) Sea Rim State Park and the McFaddin N. W. R. headquarters area (since abandoned to be rebuilt 50 km. inland). Beach erosion prior to Hurricane Ike had rendered much of the coastline between Sea Rim and the Galveston County line (southern end of McFaddin Beach) unsuitable for most shorebirds due to large stretches of exposed clay subsoil. A low clay bluff (~1 m.high) marked the inland edge of the beach and the shoreward edge of the coastal prairie. A backshore was lacking.
Color-marked Piping Plovers
During this year-long project we sighted 61 individual color-marked Piping Plovers well enough to be reasonably confident of our correct interpretation of the marking patterns. See Appendix A for full information on the uniquely color-marked plovers encountered during the survey.

Traditional Section 6 Project Final Report REVISED 2010
Page 20 of 25
During the winter/migration season of Piping Plover prior to hurricane passage uniquely marked birds that were resighted were very sedentary and were relocated at or very near the site of the original sighting, often multiple times. Once observations established this sedentary pattern no further notations were made of repeated encountered birds during the winter and spring of 2008. Of the uniquely marked plovers that were recorded during the fall of 2008, seven were relocated after Hurricane Ike, two of these twice. Of the seven relocated birds, five had been initially recorded during the winter and early spring of the preceding season and only two in fall and early winter of the following wintering season. Not only had the five birds survived the migration to and from the breeding grounds, but had also survived Hurricane Ike and it’s after effects. However, all but one had relocated to a coastline segment southwest of their location where initially sighted. The individual that had not relocated was found both seasons on Follett’s Island, one of the lesser impacted shoreline segments. The relocation of marked birds from areas that were heavily impacted indicates a degree of adaptability to negative habitat changes.
Short Term Risk Assessment of Piping Plover Habitat on the Upper Texas Coast
During the months between January and September, 2008, we learned of no specific new projects or other activities that would, in the next five or so years, pose a new major threat to the various segments of the upper Texas coastline that we surveyed. Our sources of information were direct observation and regular attention to the both the local print and electronic media as well as word-of-mouth communication with colleagues in the conservation community. There remain several inactive projects that have been proposed in the past, but which have not yet been approved that would affect certain areas in major ways if enacted (e.g. a causeway bridge to connect Galveston Island to Bolivar Peninsula). At the moment such projects lie dormant, but have not been abandoned as future possibilities. There is on-going gradual man-created Piping Plover habitat degradation in virtually every segment surveyed, with the exception of Wolf Island, although it is not entirely secure from future development schemes. The mouth of the San Bernard River silted in and ceased to function as an active outlet during the 1990s. In June 2008 the mouth was dredged open by the US Army Corps of Engineers. There had been several plans to establish development projects on Wolf Island that were abandoned during the period that the river mouth was closed. Now that it is again open some of these may be revived. Elsewhere housing and recreational pressure increases constantly along the coast and this, plus the incremental occupation of small sites by human activity continually erode the quality of the upper Texas coastline as Piping Plover wintering habitat. Since the termination of the project there has been a beach renourishment effort along some of the most heavily impacted shorelines. Sand from offshore dredging has been placed in piles of ~1 m. about 20 m. apart along the backshore roughly at the position of the former dune line. This sand is allowed to be redistributed by winds and water. This has been helpful in the short term, restoring a layer of sand over some of the exposed clay

Traditional Section 6 Project Final Report REVISED 2010
Page 21 of 25
subsoil. However, a series of strong cold fronts arriving in November 2009 removed replaced sand in some areas (The Facts, 22 November 2009). The upper Texas coast has undergone subsidence and serious beach erosion for decades due to petroleum products extraction, reduction in sediment deposition due to restricted stream flows by dams, human altered patterns of currents, and a series of tropical storms and hurricanes. Beach renourishment schemes are stop-gap measures at best, and seem unlikely to be effective in the long term. More recently a much more disturbing plan has been proposed. Its final details are not yet solidified and it may never be implemented. This proposal would erect a levee 4-5 m. high along most of the low-lying coast that was inundated by the storm surge from Ike (the “Ike Dike”). The ecological consequences of such a plan are tremendous and would alter the region in ways difficult to predict but overwhelmingly negative in nature. The Houston Chronicle (8 April 2009) reported the following on this proposal:
Hurricane Impacts on the Coastal Environment For the short term, natural forces in the form of Hurricane Ike impacted the entire study area, the northern half of it severely. The most severely damaged areas were from the point of landfall northeastward to the Sabine River and beyond (Figure 1). This is in addition to the erosion and subsidence that have been experienced by most of that shoreline for decades. Ike caused massive beach erosion from Bolivar Peninsula northward to the mouth of the Sabine River and literally removed the entire sand layer exposing the stiff clay subsoil in these areas and locally in other areas. The geologic origin of the latter is old coastal marsh bottom sediment that formerly lay well inland of the Gulf beach (Britton and Morton, 1989). The sand layer has now been eroded completely away (Figure 10).
Figure 10. Beach stripped of sand, upper Bolivar Peninsula. It is not suitable for Piping or other species of plovers and none were recorded from northern Bolivar Peninsula to the Sabine River after Hurricane Ike. Most man-made structures from the southern terminus of Bolivar Peninsula northward were destroyed. This not only impacted the shoreline but also our ability to survey it. Access was difficult

Traditional Section 6 Project Final Report REVISED 2010
Page 22 of 25
to impossible and support infrastructure was eliminated causing surveys of this area after Hurricane Ike to be limited to two. Massive cleanup efforts on Bolivar Peninsula that began in January 2009 further impacted what shorebird habitat remained. Coastal segments less affected included West Galveston Island southwestward through the northern Matagorda Peninsula. Beach erosion was moderate to locally heavy on Follett’s Island and Quintana/Bryan Beach. Wolf Island southwestward to the mouth of the Colorado River suffered minimal erosion and other negative impacts.
Acknowledgements The Texas Parks and Wildlife Department funded this study through its Traditional Section 6 Grant. The Trull Foundation, Palacios, Texas, generously provided matching funds. Many additional persons and agencies provided in-kind support. This project could not have been completed without the generous assistance from many individuals and organizations. John Huffman (USFWS) provided the loan of a travel trailer for lodging for our field biologist, Benjamin Wardwell. Shane Kasson, manager of San Bernard NWR allowed us to locate the trailer on the refuge for the duration of the project. Jennifer Wilson, refuge biologist for the Texas Mid-Coast National Wildlife Refuge Complex provided digital orthographic maps of the Matagorda and Brazoria County coastlines. Jennifer Sanchez, Project Leader, Texas Mid-Coast NWR Complex provided permission to survey those areas of the coastline that were within the refuge complex. Dean Bossert, manager of McFaddin NWR extended many kindnesses to Ben Wardwell including lodging, access, and permission to use an ATV on refuge beaches. Robyn Cobb, wildlife biologist, USFWS Ecological Services Field Office, Corpus Christi, provided copious background literature and periodic suggestions which greatly improved the end product. Dick Barrett provided valuable assistance organizing our GIS data into a manageable system. George Des Hotels, Matagorda County Commissioner, Precinct 2; Donald “Dude” Payne, Brazoria County Commissioner, Precinct 1; and Pat Doyle, Galveston County Commissioner, Precinct 1 kindly provided permission for use of an ATV on the coasts of their respective counties. Warren Pruess, Gardner Campbell, Ray Jordan, and Jim Renfro helped survey certain coastal segments, and Joseph Kennedy kindly provided his photographic record of marked Piping Plovers. Karen Barrett, Cecilia Riley, and Susan Heath kindly reviewed earlier versions of this document and made many valuable improvements. Cullen Hanks previewed the GIS data and made constructive comments that resulted in its improvement. He also constructed some of the figures used in this document. Melissa Schlothan helped prepare certain maps. To all these persons we extend our thanks for their contributions.
Literature Cited: Amos, A. 2005. Wintering Piping Plovers in South Texas: comparing remote and managed barrier island Gulf beaches. Proceedings of the Symposium on the Wintering Ecology and Conservation of Wintering Piping Plovers. Marine Science Institute, University of Texas, TX. Britton, J. C., and B. Morton. 1989. Shore ecology of the Gulf of Mexico. Univ. of Texas Press, Austin, 387 p.

Traditional Section 6 Project Final Report REVISED 2010
Page 23 of 25
Burger, J. 1994. The effect of human disturbance on foraging behavior and habitat use by Piping Plover (Chradrius melodus), Estuaries 17:3, pp. 695 – 701.
Burger, J., S. A. Carlucci, C. W. Jeitner, and L. Niles. 2007. Habitat choice, disturbance, and management of Foraging shorebirds and gulls at a migratory stopover, J. of Coastal Research 23:5, pp. 1159-1166. Code of Federal Regulations, vol. 50, section no. 17.11. Endangered and Threatened Wildlife and Plants; Final Determinations of Critical Habitat for Wintering Piping Plovers; Final Rule. Corbat, C. A., and P. W. Bergstrom. 2000. Wilson’s Plover (Charadrius wilsonia), Birds of North American Online (A. Poole, Ed.). Ithaca: Cornell Lab of Ornithology; Retrieved from Birds of North America Online http://bna.birds.cornell.edu/bna/species/516doi:10.2173/bna.516 Drake, K. R., J. E. Thompson, K. L. Drake, and C. Zonick. 2001. Movements, habitat use, and survival of nonbreeding Piping Plovers. Condor, 103:2, pp. 259 – 267.
Elliot, Lee F. 1996. Effects of human Disturbance on threatened wintering shorebirds. Final report to Texas Parks & Wildlife Department, Endangered Species Act, Section 6, Grant Number E-1-8, Project 53: Effects of Human Disturbance on Threatened Wintering Shorebirds. Elliot, L., and C. Zonick. 1998. Characterization of Key Information Gaps associated with the ecology of Piping Plovers and Snowy Plovers along the Texas Gulf Coast. The Endangered Species Program, Grant No. E-1-9. Texas Parks & Wildlife Dept. Elliott-Smith, E. and S. Haig. 2004. Piping Plover (Charadrius melodus), The Birds of North America Online (A. Poole, Ed.). Ithaca: Cornell Lab of Ornithology; Retrieved from The Birds of North America Online: http://bna.birds.cornell.edu/bna/species/002. Elliott-Smith, E., Haig, S.M., and Powers, B.M. 2009. Data from the 2006 International Piping Plover Census: U.S. Geological Survey Data Series 426. 332 pp. Flemming, S. P., R. D. Chiasson, P. C. Smith, and R. P. Bancroft. 1988. Piping Plover status in Nova Scotia related to its reproductive and behavioral responses to human disturbance. J. Field Ornithology, 59:4, pp. 321 – 330. Gratto-Trevor, C., D. Amirault-Langlais, D. Catlin, F. Cuthbert, J. Fraser, S. Maddock, E. Roche, and F. Shaffer. 2009. Winter distribution of four different piping plover breeding populations. Report to U.S. Fish and Wildlife Service. 11 pp. Ledee, O. E. 2005. Distribution of Piping Plovers on the US Gulf of Mexico: analysis of habitat characteristics at major wintering sites. MS thesis, U. of Minnesota. 56 p.

Traditional Section 6 Project Final Report REVISED 2010
Page 24 of 25
Mabee, T. J., J. H. Plissner, S. M. Haig, and J. P. Goossen. 2001. Winter distributions of North American plovers in the Laguna Madre regions of Tamaulipas, Mexico, and Texas, USA. International Wader Study Group Bulletin, #94. Nicholls, J. L., and G. A. Baldassarre. 1990. Habitat associations of Piping Plovers wintering in the United States. Wilson Bull. 102:4, pp. 581-590. Nicholls, J. L., and G. A. Baldassarre. 1990b. Winter distribution of Piping Plovers on the Atlantic and Gulf coasts of the United States. Wilson Bull., 102:3, pp. 400-412 Page, G. W., J. S. Warriner, J. C. Warriner, and P. W. Paton. 1995. Snowy Plover (Charadrius alexandrinus), The Birds of America Online (A. Poole, Ed.). Ithaca. Cornell Lab of Ornithology; Retrieved from The Birds of America Online http://bna.birds.cornell.edu/bna/species154doi:10.2073.bna.154 USFWS. 2009. Revised designation of critical habitat for the wintering population of the piping plover (Charadrius melodus) in Texas. Federal Register 74:23476-23524. White, T. L., and L. Elliot. 1999. Atlas of Piping Plover sightings along the Texas Gulf Coast (1992 – 1998). Report to: Texas Parks & Wildlife Department. Zonick, C. A. 2000. The winter ecology of Piping Plovers (Charadrius melodus) along the Texas gulf coast. PhD dissertation, Univ. of Missouri-Columbia. 169 p. Zdravkovic, M. 2004. 2004 Coastal Texas breeding Snowy and Wilson’s Plover census and report. Coastal Bird Conservation Program, National Audubon Society. New York. 40 pp.
Significant Deviations An attempt was made to visit each of these coastline segments a minimum of twice each month between January 2008 and February 2009. This goal was attained for some of the coastal segments named above and not for others. Some segments were inaccessible for varying periods of time following landfall of Hurricane Ike on 13 September, 2008, and others were not surveyed for various reasons at certain other times (e.g. a boat was not acquired until April so Wolf Island could not be surveyed until that month).
Sections of the City of Galveston were excluded from the survey because of lack of vehicular access and high levels of pedestrian traffic year round. The area unsurveyed extends from approximately two miles northeast of San Luis Pass to Apfel Park on the northern end of the island. That portion of the beach essentially consists of the City of Galveston behind the seawall and a smaller area of intensive development west of the

Traditional Section 6 Project Final Report REVISED 2010
Page 25 of 25
western terminus of the seawall. Preliminary visits to the area indicated that the beach is too narrow and heavily developed in this area to support plovers in any significant numbers (cf. Ledee, 2005). Also, the language of the “Location” section of the proposal is unclear on one point. It states that “the upper Texas coast is defined for the purposes of this study as extending from the mouth of the Sabine River in Jefferson County to the tip of the Matagorda Peninsula in Matagorda County”. It should read “to the base of Matagorda Peninsula in Matagorda County”. The Matagorda Peninsula actually consists of upper and lower peninsulas. The base of the Upper Peninsula is at the mouth of the Colorado River. South of the Colorado River the lower peninsula is extremely remote. There is no practical access to this part of the coastline with the resources that were available to us.

APPENDIX A All color banded Piping Plovers Sighted During the Project
Date Loc Upper Left Lower Left Upper Right Lower Right Sex Resighted Loc Banded
1/23 FI ? ? NA Orange/Green F 1/23 FI NA Green/Red NA Orange F 1/23 FI NA Red/Green NA Green/Metal M 1/23 FI NA Black NA Red/Red M FI-ll/12 1/23 FI NA Orange/Blue NA Black F 2/1 SB Yellow Blue/Black NA Metal/Red F
2/11 QB ? Black/White White/ Green Metal M
2/11 FI ? Black/Green Green Flag Green/Red U FI-11/12 SB-11/24 Ponca NE 5/30/06
2/11 FI ? Green ? Red/Green U
2/11 FI Black Flag Lght Green/Black ? White/Black U
2/12 FI NA Green/Metal NA Black F 2/12 FI Green Flag Green/Green Orange Green/Green M 3/5 FI Metal Red/Yellow Green Flag Black/White U Yankton SD 2006 3/5 FI Metal NA White Flag Yellow/Dark Green U Big Quill Lake SK 2003
3/20 MF Black Flag Red/Light Green Metal Light Blue M BP-1021 Dryboro Lake SK 2004 4/6 MF Black Flag Light Blue Metal Dark Blue/Orange M WI-1114 Big Quill Lake SK 2005
4/6 MF Black Flag Red/Blue Metal Light Blue U FI-11/12 FI-11/25 Big Quill Lake SK 2005
6/30 QB NA Silver/Light Blue Black Orange/Blue M 7/29 BF Black Flag Red/Light Blue Metal Blue U 7/29 BF Metal Blue Yellow Flag Orange/Black U 7/29 BF NA Red/White Green Flag White/Metal U 7/29 BF Black Flag White/White NA Red/Metal U 7/29 BF NA Metal White/Yellow NA U 7/29 BF Green Flag Metal/Yellow NA Orange/Green U 9/2 FI Green Flag Black/Red NA NA U Yankton SD 7/17/05
10/10 WI Green Flag NA NA Blue/Blue U Myron Grove SD 7/06/06
10/20 MN Green Flag Red NA Red/White U 10/20 MN Green Flag ? ? ? U 10/20 MN Green Flag ? ? ? U

10/21 BF Green Flag Black/Green NA Red/White U Vermillion SD 6/7/08 10/21 BF Metal Light Blue Orange NA M 10/24 FI NA Black Flag NA Metal M 10/24 FI Black Flag Blue Metal White U 10/24 GI Black Flag Orange/Yellow NA Yellow/Green M 10/29 SB White Metal Blue Orange M
10/29 SB Green Flag Red/Yellow NA Red/Black M SB-12/17 Lewis/Clark Lake 7/7/08
10/31 SB Metal Orange Black Flag Red/Blue M 10/31 SB Green Flag Red/Green NA Red/Black M Vermillion SD 7/6/08 10/31 SB Metal Green/Blue Green Flag NA U 10/31 SB Green Flag Yellow/Black NA Red/Black U Vermillion SD 7/12/08
10/31 SB Black Flag Blue/Blue Metal Yellow M Lake DieFenbaker SK 2004
10/31 SB Metal Pink/Red White Flag Pink M 10/31 SB Metal Light Green White Flag Red/Pink M
11/4 WI Metal White/Pink Green Red/Orange F 11/4 WI NA NA Black/White White/Green/Metal M 11/7 FI Metal Green/Red White Flag Pink M
11/12 FI NA Metal Orange White M 11/12 FI NA Black/Green Green Flag Green/Red M 11/12 FI Black Flag Light Blue/Blue Metal Yellow U FI-12/09 11/12 FI Metal Orange Black Flag Green/Green M 11/12 GI Black Flag Orange/Metal NA Yellow/Green U 11/13 AP Black Flag Dark Blue Metal Dark Blue/Orange M 11/14 WI Metal NA NA Black/White/Green/Red F
11/14 WI NA NA Dark Green Flag Black/Pink/Silver U
11/24 FI White Metal Light Blue Orange M 11/25 FI Black Flag NA Metal NA M 11/25 FI Metal NA White Flag Red/Red M 11/25 FI Metal Dark Green White Flag Red/Light Green M
11/25 FI Light Green Flag Black/Red Metal NA U
11/25 FI Metal D Green/D Green
Light Green Flag D Green/D Green U
1/22 FI Metal Orange/Orange Black Flag Red/ D Blue U