two populations of corticothalamic and interareal corticocortical cells ... · two populations of...
TRANSCRIPT
Two Populations of Corticothalamic and InterarealCorticocortical Cells in the Subgranular Layers of theMouse Primary Sensory Cortices
Iraklis Petrof,* Angela N. Viaene, and S. Murray Sherman
Department of Neurobiology, University of Chicago, Abbott J-117, Chicago, Illinois 60637
ABSTRACTThe subgranular layers (layers 5 and 6) of primary sen-
sory cortex provide corticofugal output to thalamus and
they also project to the appropriate secondary sensory
cortices. Here we injected two combinations of differ-
ent color retrograde fluorescent markers in the thalamic
and cortical targets of these layers from the three pri-
mary sensory cortices (somatosensory, auditory, and
visual) in mice to examine the degree of overlap
between corticothalamic and interareal corticocortical
cells in the subgranular layers. We found that, for all
three primary sensory cortices, double-labeled cells
were extremely rare, indicating that corticothalamic and
interareal corticocortical cells in the subgranular layers
represent largely independent populations. J. Comp.
Neurol. 520:1678–1686, 2012.
VC 2011 Wiley Periodicals, Inc
INDEXING TERMS: corticothalamic; corticocortical; fluorescence; retrograde labeling; corticofugal
Primary sensory cortices, such as the primary somato-
sensory, visual, or auditory cortex, receive information
from their respective peripheral organs via the thalamus.
They then feed this information both to secondary cortical
areas as well as back to the thalamus itself. Corticocorti-
cal communication between primary and secondary corti-
ces arise from virtually all cortical layers and it is recipro-
cal (Felleman and Van Essen, 1991; Covic and Sherman,
2011). Corticothalamic projections of primary sensory
cortices, however, arise only from the subgranular layers.
More specifically, those from layer 6 mainly target their
afferent, first-order thalamic nuclei and are thus organ-
ized in a largely feedback manner. On the other hand,
layer 5 projections of a primary sensory cortical area in-
nervate higher-order thalamic nuclei (among other sub-
cortical targets), which project to secondary sensory cor-
tices and are thus organized in a feedforward manner
(Ojima, 1994; Bourassa et al., 1995; see also Guillery,
1995, for a review). A question that emerges from this an-
atomical configuration is whether the corticothalamic and
interareal corticocortical projections of the subgranular
layers emerge as branches of single axons or originate
from separate cell populations.
Existing evidence from studies in the developing sec-
ondary somatosensory cortex (S2) of the rat suggests
that layer 6 cells that project to the thalamus and layer 6
cells that project intracortically emerge at different times
in development (Arimatsu and Ishida, 2002). In addition,
during embryonic and postnatal development only corti-
cocortical cells express latexin, a carboxypeptidase-A
inhibitor that is absent in corticothalamic cells (Arimatsu
et al., 1999). This evidence suggests that there is perhaps
a trend for segregation between corticothalamic and cor-
ticocortical cells that could also apply to primary somato-
sensory cortex (S1). Evidence from S1 itself also supports
such a segregation. In a single-axon tracing study, Zhang
and Deschenes (1997) used juxtacellular biocytin labeling
of a small number of layer 6 cells in rat S1 to show that
there was no overlap between the identified corticothala-
mic and corticocortical projecting cells. Moreover, these
two populations of cells appeared to possess different
morphological and physiological features (see also Mol-
nar and Cheung, 2006; Hattox and Nelson, 2007).
Here we sought to examine how much overlap, if any,
there is between corticothalamic and corticocortical cells
Grant sponsor: National Institute on Deafness and OtherCommunication Disorders; Grant number: DC008794 (to S.M.S.); Grantsponsor: National Institute of General Medical Sciences Medical ScientistNational Research Service Award; Grant number: 5 T32 GM07281 (toA.N.V.).
*CORRESPONDENCE TO: Iraklis Petrof, Department of Neurobiology,University of Chicago, Abbott J-117, 947 E. 58th St., Chicago, IL, 60637.E-mail: [email protected]
VC 2011 Wiley Periodicals, Inc.
Received August 29, 2011; Revised November 3, 2011; AcceptedNovember 20, 2011
DOI 10.1002/cne.23006
Published online November 25, 2011 in Wiley Online Library(wileyonlinelibrary.com)
1678 The Journal of Comparative Neurology | Research in Systems Neuroscience 520:1678–1686 (2012)
RESEARCH ARTICLE
of primary sensory cortices. Instead of being limited to
layer 6 of S1, we chose to investigate the above question
in both layers 5 and 6 of three primary sensory cortices;
the primary visual cortex (V1), the primary auditory cortex
(A1), and S1. By injecting different color retrograde fluo-
rescent markers in the thalamic and cortical afferents of
these cortices, we show that, with extremely rare excep-
tions, corticothalamic and interareal corticortical cells
constitute independent populations.
MATERIALS AND METHODS
Surgical injection of fluorescent tracersAll procedures used in this study were in accordance
with the guidelines of the Institutional Animal Care and
Use Committee at the University of Chicago. BALB/c
mice (age 20–50 days) of both sexes were anesthetized
with a ketamine (100 mg/kg) / xylazine (3 mg/kg) mix-
ture and were placed in a stereotaxic apparatus (Kopf,
Tujunga, CA). Depth of anesthesia was monitored fre-
quently by tail and toe pinching and maintenance doses
were administered as necessary. Special care was taken
to maintain aseptic conditions throughout the surgical
procedures. Each animal received a unilateral cortical
injection (in the second somatosensory area, S2, the ven-
tral portion of the secondary auditory cortex, A2v, or the
medial or lateral portion of the secondary visual cortex,
V2) and a large unilateral injection on the same side of an
appropriate thalamic region: an area covering the ventral
posterior medial and lateral nuclei plus the posterior
medial nucleus paired with S2 injections; the medial
geniculate body paired with A2v injections; and an area
that includes the lateral geniculate nucleus and the
lateral posterior nucleus paired with V2 injections. The
V2 areas we directed our injections to correspond
approximately to areas PM, LM, P, MM, AL, RL, and A as
described in Wang and Burkhalter (2007) or areas 18a
and 18b described in Caviness (1975) and Wagor et al.
(1980). In each case different color fluorescent tracers
were used for the cortical and thalamic injections. We
used two combinations of fluorescent tracers; either red
and green Retrobeads IX (Lumafluor, Naples, FL) or
Fluoro-Gold and Fluoro-Ruby (Fluoroschrome, Denver,
CO). The color of the fluorescent tracer used for the
thalamic and cortical injections of each animal was
counterbalanced within each sensory system, meaning
that roughly half the animals received green Retrobeads
in thalamus and red Retrobeads in cortex, while the other
half received red Retrobeads in thalamus and green
Retrobeads in cortex, and the same counterbalancing
applied to Fluoro-Gold and Fluoro-Ruby injections. A few
animals also received injections of a 50:50 mixture of red
and green Retrobeads or Fluoro-Gold and Fluoro-Ruby.
Pressure injections were performed using a 1-ll Hamil-
ton syringe (Reno, NV) and the volumes per injection var-
ied between 250 and 800 nl. The stereotaxic coordinates
of the injections were determined using the Franklin and
Paxinos (2008) mouse brain atlas (all distances are mm
from bregma, unless stated otherwise): injections of the
ventral posterior medial, ventral posterior lateral, and pos-
terior medial nuclei (AP: �2.05, ML: 6 1.5, DV: �3.3);
medial geniculate body injections (AP: �3.3, ML: 6 2.1,
DV: �3.4); lateral geniculate and lateral posterior nuclei
injections (AP: �1.8, ML: 6 1.7, DV: �2.5); medial V2
injections (AP: �2.5, ML: 6 1.7, DV: �0.5); and lateral V2
injections (AP:�2.5, ML:6 3.1, DV:�1.1). For the S2 and
A2v injections, the head of the animal had to be rotated
90� on the anterior–posterior axis to allow an easier needle
insertion that would also minimize the potential spread of
the fluorescent tracers in undesired areas of cortex. Prior
to rotating the head, we used bregma as the landmark to
determine the anterior–posterior and medial–lateral coor-
dinates and marked the location on the skull where we
would drill. After rotating the head we used the surface of
the brain to determine the depth of the injection: S2 injec-
tions (from bregma: AP: �0.1, ML: 6 4.1; from brain sur-
face: DV: �0.5); A2v injections (from bregma: AP: �2.1,
ML: 6 4.4; from brain surface: DV: �0.5). All injections
were performed at a rate of 7–15 nl per minute. Following
an injection the needle was left in place for 10–15 minutes
and was retracted 0.7 mm every 10–15 minutes to mini-
mize the upward suction of the fluorescent tracer. Follow-
ing the injections, animals were treated locally with Lido-
caine Hydrochloride jelly (Akorn, Buffalo Grove, IL) and
Vetropolycin antibiotic ointment (Dechra, Overland Park,
KS), and were allowed to recover for 3–5 days. During that
period, animals received analgesic doses (0.1 mg/kg) of
Buprenex (Reckitt Benckiser Healthcare, Hull, UK) every
12 hours.
Tissue processingFollowing the recovery period, animals were transcardially
perfused with phosphate-buffered saline (PBS) (pH 7.4)
followed by 4% paraformaldehyde in PBS. The brains were
then placed in 10% and subsequently 30% sucrose-parafor-
maldehyde solution until saturated. Next, brains were placed
in a sliding microtome for sectioning. Thirty-five-lm-thicksections were cut and then mounted onto gelatin-coated
slides. Finally, the sections were dehydrated and cover-
slipped. Due to the light sensitivity of the fluorescent tracers,
special care was taken not to expose the slices to light,
unless necessary.
Cell countingBrain sections were examined under a microscope
using a 100W mercury lamp with fluorescence optics
Corticothalamic and corticocortical cells
The Journal of Comparative Neurology | Research in Systems Neuroscience 1679

(Leica Microsystems, Wetzlar, Germany) and photomicro-
graphs of the areas of interest were taken at various mag-
nifications using a Retiga 2000 monochrome CCD cam-
era and Q Capture Pro software (QImaging, Surrey, BC).
Leica TX2 filter cubes (excitation 560 nm, emission 645
nm, dichroic 595 nm) were used to visualize red Retro-
beads and Fluoro-Ruby, Leica L5 filter cubes (excitation
480 nm, emission 527 nm, dichroic 505 nm) were used
to visualize green Retrobeads, and Leica E4 filter cubes
(excitation 436 nm, emission 470 nm, dichroic 455 nm)
were used to visualize Fluoro-Gold labeling. Q Capture
Pro software was used to adjust brightness and contrast
of individual photos and to overlay images of the red and
green Retrobead (or Fluoro-Gold and -Ruby) labeling to
create the overlaid (double-labeled) images.
Photomicrographs used for counting the labeled neu-
rons were taken at 20� magnification and were focused
exclusively on areas of overlap between the two tracers,
areas that were selected by visual inspection. After a pho-
tomicrograph was taken for the purpose of cell counting,
identified patterns of labeled neurons at the edges of the
photomicrograph were used as landmarks for transition-
ing to directly adjacent areas within the region of interest
before the next photomicrograph was taken, ensuring
that labeled neurons did not appear in multiple photomi-
crographs. AxioVision software (Carl Zeiss Instruments)
was used to analyze the overlaid images and count the
number of single- and double-labeled neurons. CorelDraw
(Corel, Ottawa, ON) was used for the production of
figures.
Nissl-stained sections were used to aid in the identifi-
cation of boundaries between cortical layers and areas.
These sections, acquired from two, age-matched animals,
were dehydrated in descending gradients of alcohol, rehy-
drated in distilled water, stained for 2 minutes in cresyl
violet (1.25 g of cresyl violet acetate, 0.75 ml of glacial
acetic acid, and 250 cc of warm water), quenched in dis-
tilled water, dehydrated in ascending gradients of alcohol,
and finally rinsed with Histoclear (National Diagnostics,
Charlotte, NC) for 5 minutes before coverslipped. We
used anatomical landmarks and established cytoarchitec-
tonic features to identify specific cortical or thalamic
areas and assess the accuracy of our injections.
Due to the proximity of primary and secondary sensory
cortical areas in all three sensory systems, it was of par-
ticular importance to ensure that no primary sensory cort-
ical area received a direct injection of tracers. S2 injec-
tions were directed on an area adjacent to the easily
identifiable barrel field of S1, which allowed us to assess
the containment of our injections and reject any animals
with tracers spread into S1. A1 was distinguished from
A2 on the basis of its greater cell density and better-
defined laminar organization (see Covic and Sherman,
2011). Finally, V1 was distinguished from V2 on the basis
of its more prominent layer 4 and considerably narrower
layers 2/3 (Caviness, 1975). The identification of the tha-
lamic nuclei is a considerably more straightforward pro-
cess and was carried out with the help of the Franklin and
Paxinos (2008) mouse brain atlas.
RESULTS
In total, we injected 30 animals. We injected green and
red Retrobeads in 20 animals: five in the somatosensory
system, six in the auditory system, six in the visual sys-
tem, and in addition we injected a 50:50 mixture of green
and red Retrobeads to one animal for each sensory sys-
tem (these injections were done either in cortex or thala-
mus). Ten animals were injected with Fluoro-Gold and Flu-
oro-Ruby; three animals were used for each sensory
system and an additional animal was injected with a
50:50 mixture of Fluoro-Gold and Fluoro-Ruby in V1.
Only animals with injection sites of sufficient size and
with no, or very little, spread to nontarget areas were
included in the analyses (for examples, see Figs. 1D,E,
2D,E, 3D,E). Inspection of the images taken under the
appropriate filters revealed that cortical injections
resulted in retrograde labeling in virtually all layers of S1,
A1, or V1 (Figs. 1A, 2A, 3A), while thalamic injections
resulted in retrograde labeling only in layers 5 and 6 of
S1, A1, or V1 (Figs. 1B, 2B, 3B). We counted �250 cells
per layer per animal, focusing in regions of overlap
between cells retrogradely labeled from thalamic and
cortical injections; these regions were restricted to layers
5 and 6, because only these layers have cells projecting
subcortically. Within these regions we saw a considerably
larger proportion of retrogradely labeled cells in layer 5 of
A1 following thalamic injections compared to cortical
injections. These values are (mean 6 SE): thalamic,
73.86% 6 2.95%; cortical, 24.99% 6 2.52% (Bonferroni-
adjusted Mann–Whitney test, P < 0.001). On the other
hand, within these regions of overlap cortical injections
produced more retrogradely labeled cells in layer 5 of S1
than did thalamic injections: cortical, 57.4%6 3.03%; tha-
lamic, 41.73%6 3.13% (P< 0.05). For layer 5 of V1 these
proportions were relatively balanced: thalamic, 47.46% 6
10.42%; cortical, 51.23% 6 10.41% (P > 0.05; see Fig. 4,
left panel).
Regarding retrograde labeling in layer 6, thalamic injec-
tions produced approximately twice as many retrogradely
labeled cells within the areas of overlap compared with
cortical injections in all three systems. For the auditory
system the values are: thalamic, 66.62% 6 1.64%, and
cortical, 32.45%6 1.83% (P < 0.001); for the somatosen-
sory system, thalamic, 68.4% 6 6.61%, and cortical,
30.67% 6 6.85% (P < 0.05); for the visual system,
Petrof et al.
1680 The Journal of Comparative Neurology |Research in Systems Neuroscience
thalamic, 66.67% 6 5.05%), and cortical, 32.35% 6
4.74% (P < 0.01; see Fig. 4, right panel). These propor-
tions were the same for both types (or colors) of fluores-
cent tracer injected in thalamus or cortex.
As is apparent from the above, thalamic injections
resulted in significantly different percentages of retro-
gradely labeled cells in layer 5 of the three sensory sys-
tems (Kruskal–Wallis test, P < 0.05). Following thalamic
injections of tracers, the percentage of retrogradely la-
beled cells in layer 5 of A1 was significantly larger than
that in layer 5 of S1 (Bonferroni-adjusted Mann–Whitney
test, P < 0.01) but not in V1 (P > 0.05). The percentage
of retrogradely labeled cells in layer 5 of S1 and V1 fol-
lowing thalamic injections did not differ (P > 0.05)
Similarly, cortical injections resulted in significantly dif-
ferent percentages of retrogradely labeled cells in layer 5
of the three sensory systems: Kruskal–Wallis: P < 0.01.
Following cortical injections of tracers, the percentage of
retrogradely labeled cells in layer 5 of A1 was significantly
smaller than that in layer 5 of S1 (Bonferroni-adjusted
Mann–Whitney test, P < 0.01) and V1 (P < 0.05). The
percentage of retrogradely labeled cells in layer 5 of S1
and V1 following cortical injections did not differ (P >
0.05).
With regard to layer 6, the percentage of retrogradely
labeled cells was similar for all three sensory systems,
both after thalamic injections (Kruskal–Wallis, P > 0.05)
and after cortical injections (P> 0.05).
For any given slice, overlaying the images captured
under the two filters (Figs. 1C, 2C, 3C) revealed that,
while there was an extensive overlap in the regions where
retrogradely labeled cells from the thalamus and cortex
could be found, double-labeled cells were extremely rare
(see Fig. 2Ci) or, for the majority of the slices, completely
nonexistent. More specifically, for both layer 5 and layer 6,
the cumulative percentage of double-labeled cells for each
sensory system amounted to less than 1% (see Fig. 4 for
details).
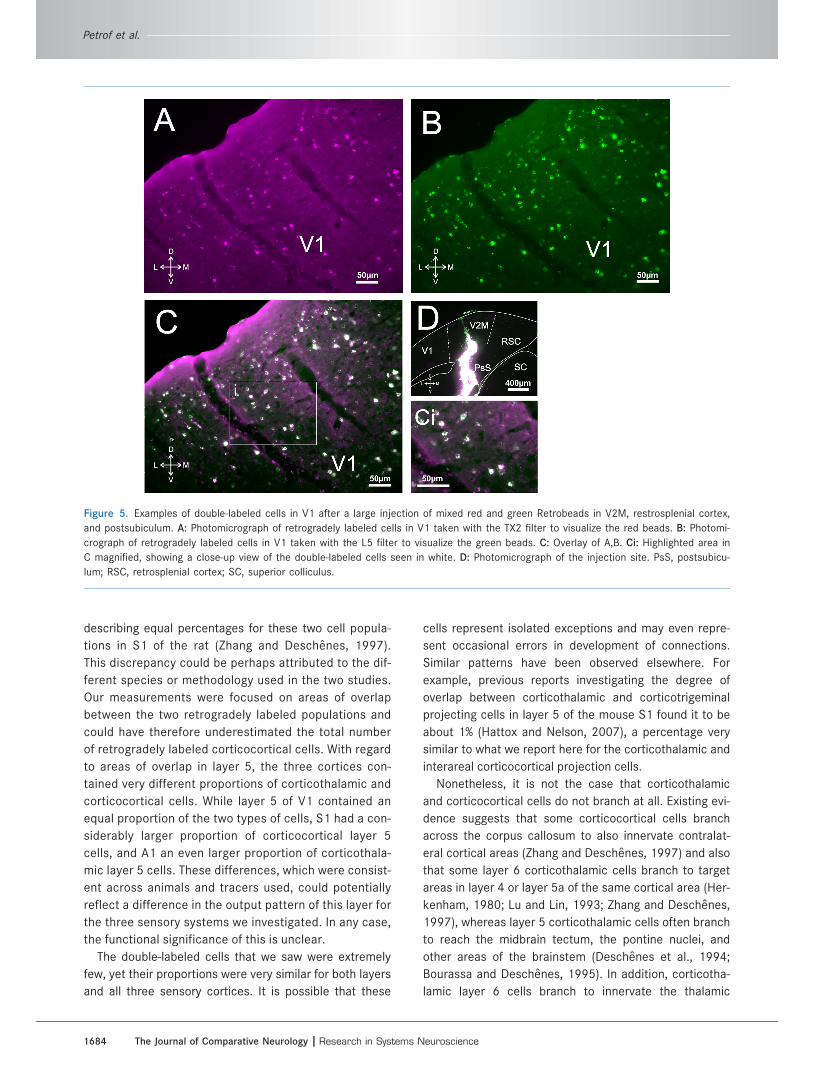
Finally, to demonstrate that retrograde double labeling
was possible in the pathways that we examined with the
fluorescent tracers that we used, we performed injections
of mixed-color tracers. Injections of the 50:50 mixture of
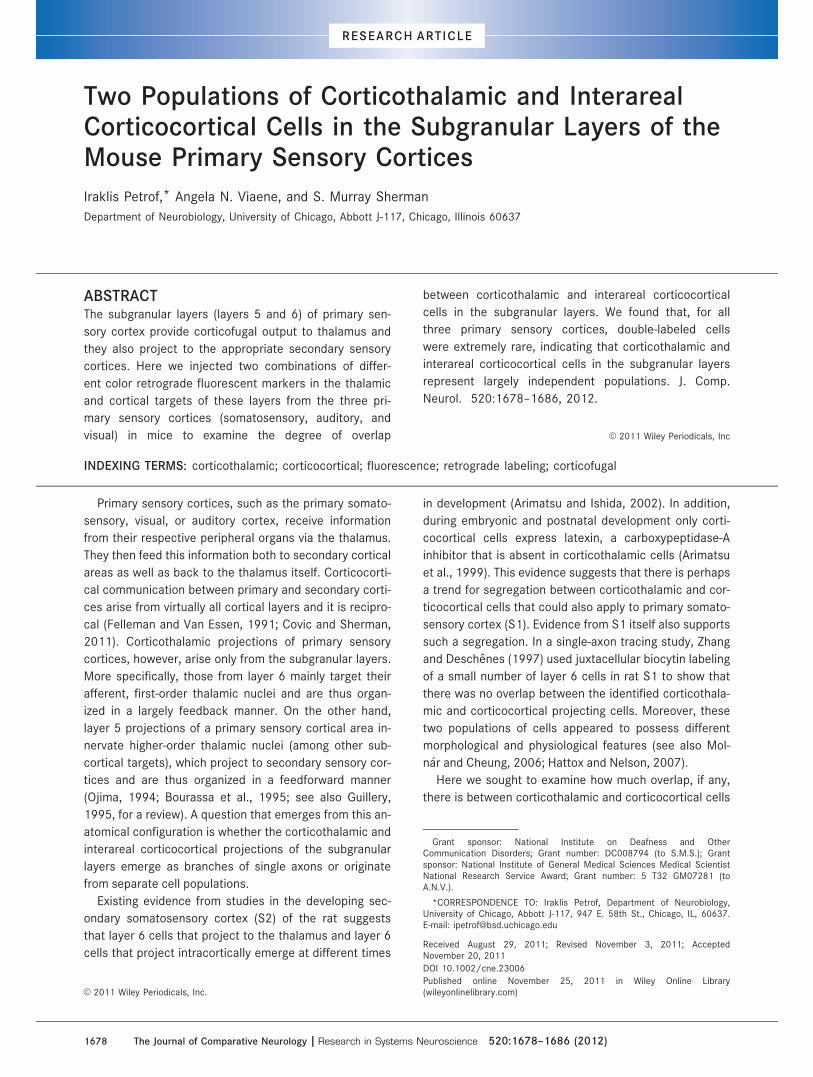
Figure 1. Corticothalamic and corticocortical cells in S1. A: Photomicrograph of retrogradely labeled cells in S1 following injections of red
Retrobeads in S2 (all red Retrobeads here and elsewhere are shown in magenta). B: Photomicrograph of retrogradely labeled cells in S1
following injections of green Retrobeads in somatosensory thalamus. C: Overlay of A,B. Ci: Highlighted area in C magnified showing the
lack of double-labeled cells. D,E: Photomicrographs of injection sites in S2 and POm/VPM, respectively.
Corticothalamic and corticocortical cells
The Journal of Comparative Neurology | Research in Systems Neuroscience 1681
red and green Retrobeads or Fluoro-Gold and Fluoro-
Ruby in thalamus or a secondary sensory cortical area
resulted in the double-labeling of the vast majority of ret-
rogradely labeled cells in a primary sensory cortical area
(Fig. 5). More specifically, injections of mixed tracers in
thalamus resulted in double-labeling in 95.9% of retro-
gradely labeled cells in the subgranular layers of a pri-
mary sensory cortical area, while injections of mixed trac-
ers in a secondary sensory cortical area resulted in
double-labeling in 86.9% of retrogradely labeled cells in a
primary sensory cortical area.
DISCUSSION
For each sensory system that we examined (somato-
sensory, auditory, and visual), we found that, following
the injection of different color retrograde tracers in the
thalamic and secondary sensory cortical targets of a pri-
mary sensory cortical area, double-labeled cells in that
area were extremely rare. These results were confirmed
using two combinations of different color fluorescent
tracers. Our findings suggest that in layers 5 and 6 of a
mouse primary sensory cortical area, cells that project to
a secondary sensory area and cells that project to thala-
mus effectively represent separate cell populations and
that there is virtually no branching of their axons to tha-
lamic and interareal cortical targets, respectively. These
data confirm and extend existing evidence that postu-
lated a segregation between interareal or callosal cortico-
cortical cells of the subgranular layers and corticofugal
cells in these layers that innervate subcortical targets
(Fries et al., 1985; Hubener and Bolz, 1988; Kasper et al.,
1994; Zhang and Deschenes, 1997; Hallman et al., 1998;
Mercer et al., 2005; Molnar and Cheung, 2006; West
et al., 2006; Hattox and Nelson, 2007; Brown and Hestrin,
2009; also see Thomson, 2010, for a review).
Despite the differences in their internal organization
(see Woolsey, 1967; Smith and Populin, 2001; Kaas and
Collins, 2001; Linden and Schreineer, 2003; Anderson
et al., 2009), it is worth noting that the primary cortices
of the three sensory systems were very similar with
regard to the amount of double-labeled cells in layers 5
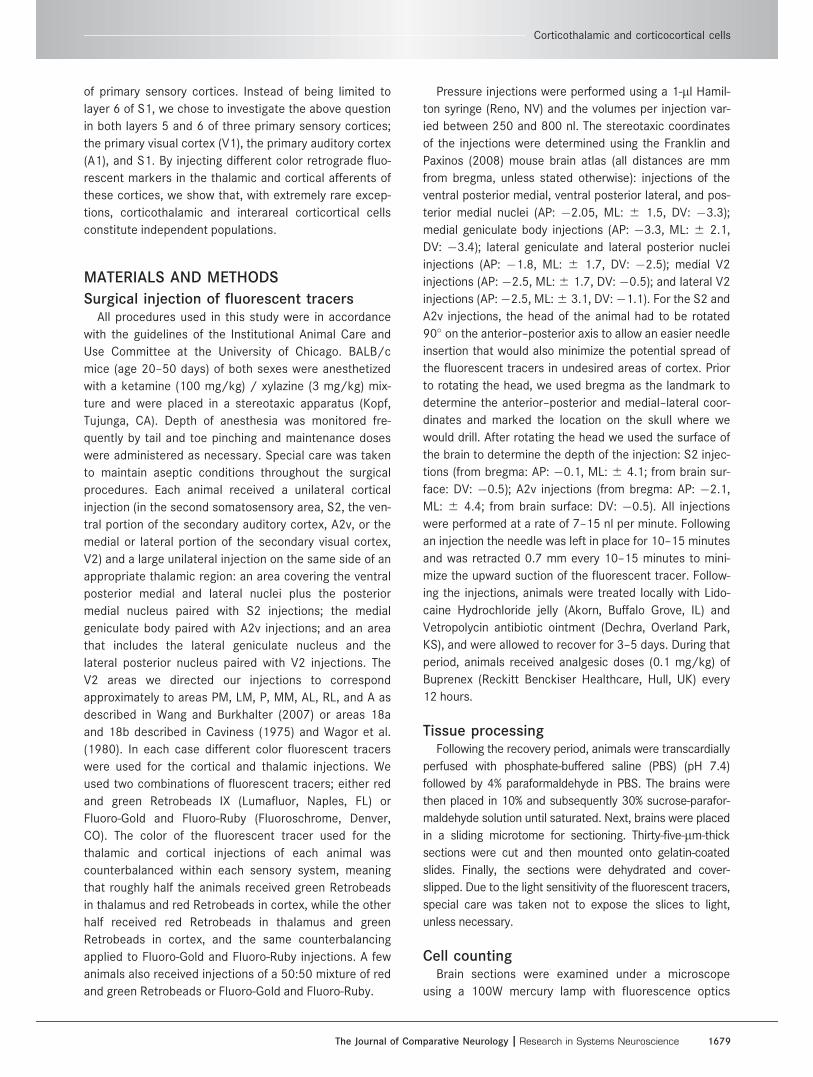
Figure 2. Corticothalamic and corticocortical cells in A1. A: Photomicrograph of retrogradely labeled cells in A1 following injections of red
Retrobeads in A2v. B: Photomicrograph of retrogradely labeled cells in A1 following injections of green Retrobeads in auditory thalamus.
C: Overlay of A,B. Ci: Highlighted area in C magnified showing an example of a double-labeled cell in focus, seen in white (arrow). Two
more double-labeled cells are also visible but outside the plane of focus. D,E: Photomicrographs of injection sites in A2v and MGB, respec-
tively. MGBv, ventral medial geniculate body; MGBd, dorsal medial geniculate body; Hipp, hippocampus.
Petrof et al.
1682 The Journal of Comparative Neurology |Research in Systems Neuroscience
and 6 and also the overall proportions of layer 6 cells that
were labeled with the different color fluorescent tracers
following the thalamic and cortical injections. We thus
found that the number of corticothalamic cells was
almost twice that of corticocortical cells in layer 6 of all
three cortices, which contrasts with previous reports
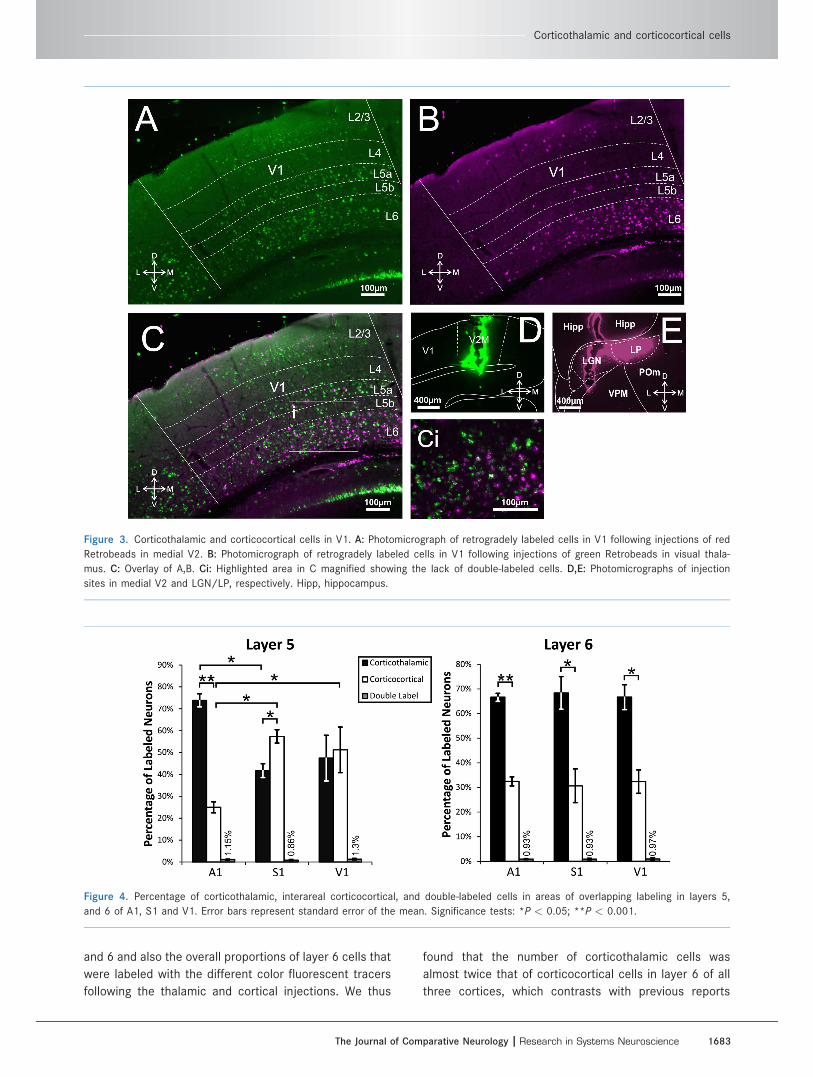
Figure 3. Corticothalamic and corticocortical cells in V1. A: Photomicrograph of retrogradely labeled cells in V1 following injections of red
Retrobeads in medial V2. B: Photomicrograph of retrogradely labeled cells in V1 following injections of green Retrobeads in visual thala-
mus. C: Overlay of A,B. Ci: Highlighted area in C magnified showing the lack of double-labeled cells. D,E: Photomicrographs of injection
sites in medial V2 and LGN/LP, respectively. Hipp, hippocampus.
Figure 4. Percentage of corticothalamic, interareal corticocortical, and double-labeled cells in areas of overlapping labeling in layers 5,
and 6 of A1, S1 and V1. Error bars represent standard error of the mean. Significance tests: *P < 0.05; **P < 0.001.
Corticothalamic and corticocortical cells
The Journal of Comparative Neurology | Research in Systems Neuroscience 1683
describing equal percentages for these two cell popula-
tions in S1 of the rat (Zhang and Deschenes, 1997).
This discrepancy could be perhaps attributed to the dif-
ferent species or methodology used in the two studies.
Our measurements were focused on areas of overlap
between the two retrogradely labeled populations and
could have therefore underestimated the total number
of retrogradely labeled corticocortical cells. With regard
to areas of overlap in layer 5, the three cortices con-
tained very different proportions of corticothalamic and
corticocortical cells. While layer 5 of V1 contained an
equal proportion of the two types of cells, S1 had a con-
siderably larger proportion of corticocortical layer 5
cells, and A1 an even larger proportion of corticothala-
mic layer 5 cells. These differences, which were consist-
ent across animals and tracers used, could potentially
reflect a difference in the output pattern of this layer for
the three sensory systems we investigated. In any case,
the functional significance of this is unclear.
The double-labeled cells that we saw were extremely
few, yet their proportions were very similar for both layers
and all three sensory cortices. It is possible that these
cells represent isolated exceptions and may even repre-
sent occasional errors in development of connections.
Similar patterns have been observed elsewhere. For
example, previous reports investigating the degree of
overlap between corticothalamic and corticotrigeminal
projecting cells in layer 5 of the mouse S1 found it to be
about 1% (Hattox and Nelson, 2007), a percentage very
similar to what we report here for the corticothalamic and
interareal corticocortical projection cells.
Nonetheless, it is not the case that corticothalamic
and corticocortical cells do not branch at all. Existing evi-
dence suggests that some corticocortical cells branch
across the corpus callosum to also innervate contralat-
eral cortical areas (Zhang and Deschenes, 1997) and also
that some layer 6 corticothalamic cells branch to target
areas in layer 4 or layer 5a of the same cortical area (Her-
kenham, 1980; Lu and Lin, 1993; Zhang and Deschenes,
1997), whereas layer 5 corticothalamic cells often branch
to reach the midbrain tectum, the pontine nuclei, and
other areas of the brainstem (Deschenes et al., 1994;
Bourassa and Deschenes, 1995). In addition, corticotha-
lamic layer 6 cells branch to innervate the thalamic
Figure 5. Examples of double-labeled cells in V1 after a large injection of mixed red and green Retrobeads in V2M, restrosplenial cortex,
and postsubiculum. A: Photomicrograph of retrogradely labeled cells in V1 taken with the TX2 filter to visualize the red beads. B: Photomi-
crograph of retrogradely labeled cells in V1 taken with the L5 filter to visualize the green beads. C: Overlay of A,B. Ci: Highlighted area in
C magnified, showing a close-up view of the double-labeled cells seen in white. D: Photomicrograph of the injection site. PsS, postsubicu-
lum; RSC, retrosplenial cortex; SC, superior colliculus.
Petrof et al.
1684 The Journal of Comparative Neurology |Research in Systems Neuroscience
reticular nucleus and a dorsal thalamic target (Bourassa
and Deschenes, 1995).
Corticothalamic projections originating in layers 5 and
6 possess different synaptic features and have thus been
associated with different functional properties. More spe-
cifically, layer 5 inputs to thalamus exhibit paired-pulse
depression, an all-or-none ability to generate excitatory
postsynaptic potentials (EPSPs) and do not activate
metabotropic glutamate receptors, all features of a
‘‘driver’’ pathway; that is, an information-carrying pathway
(Sherman and Guillery, 2006). On the other hand, layer 6
inputs to thalamus show paired-pulse facilitation, a
graded EPSP generation pattern (they produce EPSP
whose amplitude is monotonically related to the amount
of stimulation current), and can activate metabotropic
glutamate receptors (Li et al., 2003; Reichova and
Sherman, 2004). These synaptic features have been
associated with a modulatory pathway, which is not
involved in information transfer but can alter various
properties of a thalamic relay (Sherman and Guillery,
2006). Similarly, interareal corticocortical projections
vary in their synaptic profile depending on the layer of ori-
gin and layer of termination. For example, in A1 layers 5b
and 6 projections to layers 2/3 of A2v exhibit synaptic
properties equivalent to those of a driver pathway, while
their projections to layers 4 and 6 exhibit synaptic proper-
ties equivalent to these of a modulator pathway (Covic
and Sherman, 2011). Given the heterogeneity of the
corticocortical projections of layers 5 and 6 one would
assume that they also originate from separate popula-
tions of cells within each layer, even though the existence
of individual cells with branching axons of differing synap-
tic properties (driver vs. modulator) could not be
excluded (Reyes et al., 1998).
In conclusion, our anatomical data support the idea
that the subcortical and interareal corticocortical projec-
tions of layers 5 and 6 of sensory cortex in the mouse rep-
resent relatively independent output circuits. However,
we cannot rule out that, via local collaterals, axons of
these corticofugal systems contribute indirectly (transy-
naptically) to interareal corticocortical processing. The
outputs from layer 5 are particularly interesting, because
recent evidence suggests that communication between
S1 and S2 takes place not only directly via corticocortical
projections but also indirectly via a cortico-thalamo-corti-
cal pathway that starts in layer 5 of S1 and is relayed
through the posterior medial thalamic nucleus to S2
(Theyel et al., 2010). A similar transthalamic pathway
from layer 5 of V1 and A1 is thought to innervate V2 and
A2v, respectively (Sherman and Guillery, 2006). It
appears that these two parallel routes of corticocortical
communication are substantially independent of each
other.
LITERATURE CITEDAnderson LA, Christianson GB, Linden JF. 2009. Mouse audi-
tory cortex differs from visual and somatosensory corticesin the laminar distribution of cytochrome oxidase and ace-tylcholinesterase. Brain Res 1252:130–142.
Arimatsu Y, Ishida M. 2002. Distinct neuronal populationsspecified to form corticocortical and corticothalamic pro-jections from layer VI of developing cerebral cortex. Neuro-science 114:1033–1045.
Arimatsu Y, Ishida M, Sato M, Kojima M. 1999. Corticocorticalassociative neurons expressing latexin: specific corticalconnectivity formed in vivo and in vitro. Cereb Cortex 9:569–976.
Bourassa J, Deschenes M. 1995. Corticothalamic projectionsfrom the primary visual cortex in rats: a single fiber studyusing biocytin as an anterograde tracer. Neuroscience 66:253–263.
Bourassa J, Pinault D, Deschenes M. 1995. Corticothalamicprojections from the cortical barrel field to the somatosen-sory thalamus in rats: a single-fibre study using biocytin asan anterograde tracer. Eur J Neurosci 7:19–30.
Brown SP, Hestrin S. 2009. Intracortical circuits of pyramidalneurons reflect their long-range axonal targets. Nat Lett457:1133–1137.
Caviness VS. 1975. Architectonic map of neocortex of thenormal mouse. J Comp Neurol 164:247–263.
Covic EN, Sherman SM. 2011. Synaptic properties of connec-tions between the primary and secondary auditory corticesin mice. Cereb Cortex 21:2425–2441.
Deschenes M, Bourassa J, Pinault D. 1994. Corticothalamicprojections from layer V cells in rat are collaterals of long-range corticofugal axons. Brain Res 664:215–219.
Felleman DJ, Van Essen DC. 1991. Distributed hierarchicalprocessing in the primate cerebral cortex. Cereb Cortex 1:1–47.
Franklin KBJ, Paxinos G. 2008. The mouse brain in stereotaxiccoordinates. San Diego: Academic Press.
Fries W, Keizer K, Kuypers HGJM. 1985. Large layer VI cellsin macaque striate cortex (Meynert cells) project to bothsuperior colliculus and prestriate visual area V5. Exp BrainRes 58:613–616.
Guillery RW. 1995. Anatomical evidence concerning the roleof the thalamus in corticocortical communication: a briefreview. J Anat 187:583–592.
Hallman LE, Schofield BR, Lin CS. 1998. Dendritic morphologyand axon collaterals of corticotectal, corticopontine, andcallosal neurons in layer V of primary visual cortex of thehooded rat. J Comp Neurol 272:149–160.
Hattox AM, Nelson SB. 2007. Layer V neurons in mouse cor-tex projecting to different targets have distinct physiologi-cal properties. J Neurophysiol 98:3330–3340.
Herkenham M. 1980. Laminar organization of thalamic projec-tions to the rat neocortex. Science 207:532–535.
Hubener M, Bolz J. 1988. Morphology of identified projectionneurons in layer 5 of rat visual cortex. Neurosci Lett 94:76–81.
Kaas JH, Collins CE. 2001. The organization of sensory cortex.Curr Opin Neurobiol 11:498–504.
Kasper EM, Larkman AU, Lubke J, Blakemore C. 1994. Pyrami-dal neurons in layer 5 of the rat visual cortex. I. Correla-tion among cell morphology, intrinsic electrophysiologicalproperties, and axon targets. J Comp Neurol 339:459–474.
Li J, Guido W, Bickford ME. 2003. Two distinct types of corti-cothalamic EPSPs and their contribution to short-term syn-aptic plasticity. J Neurophysiol 90:3429–3440.
Linden JF, Schreiner CE. 2003. Columnar transformations inauditory cortex? A comparison to visual and somatosen-sory cortices. Cereb Cortex 13:83–89.
Corticothalamic and corticocortical cells
The Journal of Comparative Neurology | Research in Systems Neuroscience 1685
Lu SM, Lin RC. 1993. Thalamic afferents of the rat barrel cor-tex: a light- and electron-microscopic study using Phaseo-lus vulgaris leucoagglutinin as an anterograde tracer.Somatosens Mot Res 10:1–16.
Mercer A, West DC, Morris OT, Kirchhecker S, Kerkhoff JE,Thomson A. 2005. Excitatory connections made by presyn-aptic cortico-cortical pyramidal cells in layer 6 of the neo-cortex. Cereb Cortex 15:1485–1496.
Molnar Z, Cheung AF. 2006. Towards the classification of sub-populations of layer V pyramidal projection neurons. Neu-rosci Res 55:105–115.
Ojima H. 1994. Terminal morphology and distribution of corti-cothalamic fibers originating from layers 5 and 6 of cat pri-mary auditory cortex. Cereb Cortex 4:646–663.
Reichova I, Sherman SM. 2004. Somatosensory corticothala-mic projections: distinguishing drivers from modulators.J Neurophysiol 92:2185–2197.
Reyes A, Lujan R, Rozov R, Burnashev N, Somogyi P, Sak-mann B. 1998. Target-cell-specific facilitation and depres-sion in neocortical circuits. Nat Neurosci 1:279–285.
Sherman SM, Guillery RW. 2006. Exploring the thalamus.Cambridge, MA: MIT Press.
Smith PH, Populin LC. 2001. Fundamental differences betweenthe thalamocortical recipient layers of the cat auditory andvisual cortices. J Comp Neurol 436:508–519.
Theyel BB, Llano DA, Sherman SM. 2010. The corticothalamo-cortical circuit drives higher-order cortex in the mouse.Nat Neurosci 13:84–88.
Thomson AM. 2010. Neocortical layer 6, a review. Front Neu-roanat 4:1–14.
Wagor E, Mangini NJ, Pearlman AL. 1980. Retinotopic organi-zation of striate and extrastriate visual cortex in themouse. J Comp Neurol 193:187–202.
Wang Q, Burkhalter AH. 2007. Area map of mouse visual cor-tex. J Comp Neurol 502:339–357.
West DC, Mercer A, Kirchhecker S, Morris OT, Thomson A.2006. Layer 6 cortico-thalamic pyramidal cells preferen-tially innervate interneurons and generate facilitatingEPSPs. Cereb Cortex 16:200–211.
Woolsey TA. 1967. Somatosensory, auditory and visual corti-cal areas of the mouse. Johns Hopkins Med J 121:91–112.
Zhang ZW, Deschenes M. 1997. Intracortical axonal projec-tions of lamina VI cells of the primary somatosensory cor-tex in the rat: a single-cell labeling study. J Neurosci 17:6365–6379.
Petrof et al.
1686 The Journal of Comparative Neurology |Research in Systems Neuroscience