modeling the visual cortex area 1(v1) for pattern …scc/seminars/neuro_atanendu_s_mandal... ·...
TRANSCRIPT

Modeling the Visual Cortex Area 1(V1) for Pattern Recognition
ByAtanendu Sekhar MandalIC Design GroupCentral Electronics Engineering Research InstitutePilani – 333031Rajasthan.Email : [email protected]
• Introduction
• Development of Corticocortical Lateral Connections
• Simulation Results
• Role of Lateral Connections
• Axon Growth Model
• Conclusion and Future Works
• Pattern Recognition
Order of Presentation

Neuro Vision : Introduction
Bhagabhan Buddha

Neuro Vision : Introduction
The Visual System

Neuro Vision : Introduction
A Simplified Model of the Visual Pathway

Neuro Vision : Introduction
Receptive Fields

Neuro Vision : Introduction
Visual Information Processing

Neuro Vision : Introduction
Cell organizations

Neuro Vision : Introduction
Characteristics of Cortical Cells of V1
1. Orientation Specificity
2. Orientation Tuning
φ

Neuro Vision : Introduction LC
The Orientation Map (Bosking et. al, 1997)

Neuro Vision : Introduction
Characteristics of Horizontal Connections
1. Orientation Specificity
2. Axial Specificity

Neuro Vision : Introduction
Importance of Horizontal Connections
1. Elongated Receptive Fields of Layer 6 Simple Cells
2. Integration of Information by a Neuronal Cell
3. Receptive Field Surround Effects
4. Cortical Plasticity

Neuro Vision : Introduction
Our Objective :
1. Development of Orientations Maps
2. Development of Horizontal Connections
3. Study of Horizontal Connections in the Development Orientation Tuning

Neuro Vision
Developed Orientation Map :
(200 – 700)

The Model
(Development of Horizontal Connections)

Modeling the Horizontal Connections
• The Three Layer Model of the Visual System
Cortex : 50x50
RF : 13x13
LGN : 42x42
VS : 195x195
Modeling the Horizontal Connections
• The Model
- Initial Response Generation : Three Layer Model
- Cortical Weight development : One Layer Model
- Cortical Response Generation : Three Layer Model

Modeling the Horizontal Connections
• The Model
- Initial Response Generation :
( ) ( )( ) ( )( )( )( )
∑ ∑ ∑∈ Γ∈ ∈
+−+−=i
fi i i
fjFt j Ft
Pf
jijijf
iii RttWtttu )1(εη
( ) ( )2expexp ⎥⎦
⎤⎢⎣
⎡⎟⎟⎠
⎞⎜⎜⎝
⎛ Δ−−−⎟⎟
⎠
⎞⎜⎜⎝
⎛ Δ−−=
s
ax
m
ax
ijsssττ
ε
( )
where
( )3exp ⎟⎠⎞
⎜⎝⎛−−=
τϑη ssi
EPSP
t

Modeling the Horizontal Connections
• The Models
- Cortical Weight Development : Model1
.
( )( ) ( ) ( )3,exp21
2
1' jifWYYWWW distR
ijTT
ijj
ji⎟⎟⎠
⎞⎜⎜⎝
⎛
−
−−
−−=φφ
γγ
- Cortical Weight Development : Model2
( )( ) ( ) ( )4,21'jidistij
TTij OOjifWYYWWW −−= γγ
• Bhaumik B. and Mandal A.S. (2003) An Integrated Feedforward and Recurrent Model for layer 4 Cortical Cells in the Visual Cortex, Proceedings International Symposium: Building the Brain, NBRC, Manesar, Dec. 15-17.

Modeling the Horizontal Connections
• The Model
- Cortical Response Generation :
( ) ( )( ) ( )( )( )( )
( )( )( )( ) ( )
( )∑ ∑
∑∑ ∑ ∑
Γ∈ ∈
Γ∈∈ Γ∈ ∈
+−
+−+−+−=
i jf
j
iif
i i jf
j
j Ftp
fjij
ciij
i
j
fjij
ceij
e
Ft j Ft
fjij
lij
lfiii
RttW
ttWttWtttu
72
21
εβ
εβεβη
where( ) functionrefractoryti :η
potentialrestingRp :

Simulation Results1. Development of Horizontal Connections :
2. An Individual Cell : (20, 25)
3. Lateral Connections
4. Role of Lateral Connections
- Scatter Plot : hwhh
- Tuning Plots
• Improvement : Inhibition Excitation LGN
• Deterioration : Inhibition
- Locations : Inh Exc LGN
- Contextual Effects
5. Result Discussions

Simulation Results
Movie


B
C
D
Effect of Receptive Field Overlap on Lateral Connections
Reference Cell
Target Cell
Target Cell
Target Cell
o37.21=Φi
Cell (30,17)
Cell (9,41),Edist=31.9, wij =0.471
o24.21=Φ j
Cell (18,36), Edist=22.5, wij=0.132
o7.20=Φ j
Cell (45,19), Edist=15.1,wij=0.124
o3.109=Φ j

Scatter Plots : Tuning Half Widths
(a) (b)
(c)
(a) : LGN Contribution only
(b) : LGN + Lateral Contributions

Role of Lateral Connections
• Simulation Results
- Improvement due to Inhibition

Role of Lateral Connections
• Simulation Results
- Improvement due to Excitation

Role of Lateral Connections
• Simulation Results
- Improvement due to LGN

Role of Lateral Connections
• Simulation Results
- Deterioration due to Inhibition
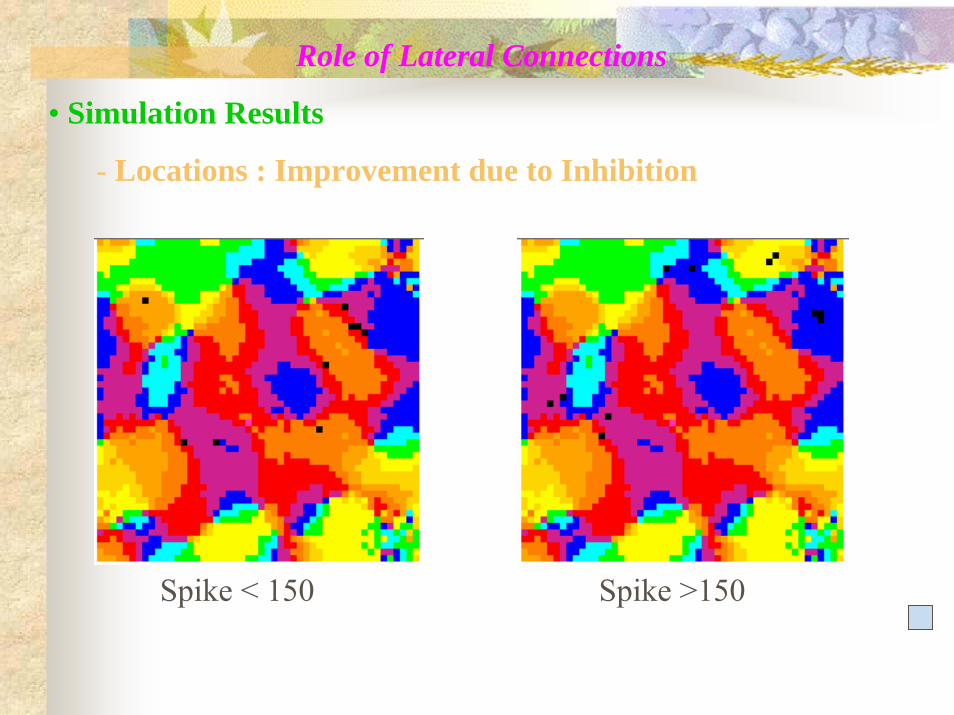
Role of Lateral Connections
• Simulation Results
- Locations : Improvement due to Inhibition
Spike < 150 Spike >150

Role of Lateral Connections
• Simulation Results
- Locations : Improvement due to Excitation

Role of Lateral Connections
• Simulation Results
- Locations : Improvement due to LGN

Role of Lateral Connections
• Lesion Experiment
50x50
RF : 13x13
LGN : 42x42
RF-VS : 79x79
VS : 195x195
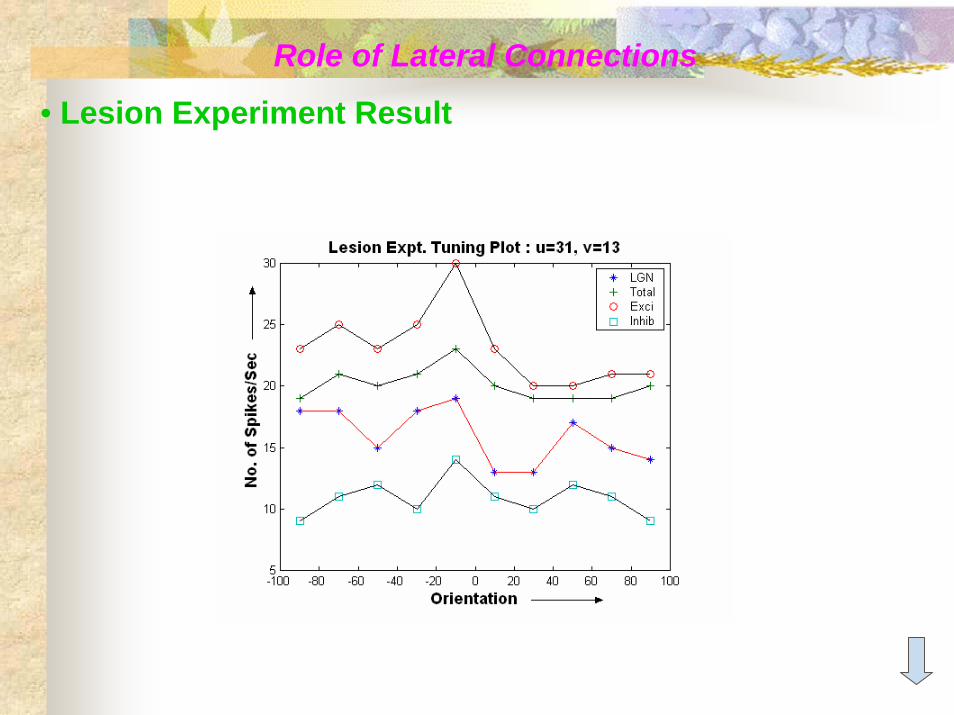
Role of Lateral Connections
• Lesion Experiment Result

Role of Lateral Connections
• Determination of RF by Reverse Correlation Technique
(Jones and Pakmer, 1978a)
(a) (b)
RF of a cortical cell shown (a) as a set a set of LGN weights(b) as obtained through reverse correlation technique

Role of Lateral Connections
• Contextual Effects Experiment Results
(b)
(a)
Cell : (31,13)Location : Boundary between
two zones
Cell : (40,25)Location : Pinwheel

Development of Lateral Connections : Result Discussions
• Characteristics of the Developed Horizontal Connections are Similar to the Experimental Findings
• Improvement in Tuning of Cortical Cells are due toVarious Mechanisms rather than one single mechanism
• Various Mechanisms Correspond to Various Locations in the Orientation Map
• Context Dependent Modulation of Cortical Cell Responseis dependent upon the Location of the cell in the Orientation Map

Axon Growth Model
• The Model
- Axon Growth
- Cell Connectivity to the Axonal Branches
- Modeling the Optimization Process
• Results
• Force Directed Partitioning
• Bhaumik B., and Mandal A.S. (2004) A computational model for the development of lateral connections among cells inthe visual cortex : A simulation study, International Conference on Molecular Biology, IIT Kanpur.

Modeling the Axon Growth
• The Model – Axon Growth
Location of the Growth Cone at Time t :
( ) ( ) ( )11 LAtAtA Δ+−=
where
( )
( )⎩⎨⎧ >
=
−∗=Δ
otherwisekif
kU
MMUaAiadistdisti
:00:1
_

Modeling the Axon Growth
• The Model – Cell Connectivity to the Axonal Branches
Number of Cells Connected at Time t :
( ) ( ) NtNtN Δ+−= 1
where
( ) ( ) ( ) ( )( )( )
∑∑= =
−−∗∗−∗=ΔrN
i
tM
jpdistdistijiji i
MMUdhdlUpUN1 1
max
( ) ( )⎩⎨⎧ Φ=Φ
=otherwise
pifpU i
i :0:1

Modeling the Axon Growth
• The Model – Cell Connectivity to the Axonal Branches
( )⎩⎨⎧
=otherwise
dfordh ij
ij :0
min:1
otherwiseM
lMl
lMl
l
dist
pdist
pdist
i
i
:exp
:
maxmax
maxmax
max⎪⎩
⎪⎨
⎧
⎟⎟⎠
⎞⎜⎜⎝
⎛ −−∗
≤
= −
−

Modeling the Axon Growth
• The Model – Optimization Process (Jaydeva & Bhaumik, 1994)
( ) ( )∑ ∑∑= = =
+ +=M
i
N
i
M
jijijii dhdxxdistE
1 1 11,,2
where( ) ( )
( ) ( )( )( )( )∑
=
++
−
−=
==
M
lij
ijij
jiijiiii
td
tddh
xpdistdxxxxdist
1
22
22
211
/exp
/exp
,,2,,,,2
β
β
Dynamic Equation( )( )
( )( )
( ) ( )
( ) ( ) ( ) ( )( )∑
∑
=
=
−
−
+
+
−−+
−∗+
−+
−=
∂∂
−=
N
kkikikjij
ki
ijkjki
N
k
ii
ii
ii
ii
ijij
dhdht
px
dxp
dh
xxdistxx
xxdistxx
xEx
12
1
1
1
1
1'
11
,,2,,2
β
(a) (b) (c)

Modeling the axon Growth
• Results : Neural Optimization : Features Incorporated
1. Curves of Various Shapes
2. Importance of Merging Partitions
3. Number of Curve Points Added
4. Direction of Curve Opening
5. Algorithm Used for Partition
• Mandal A.S. and Bhaumik B. (2003), Techniques for improving the neural optimization method, Progress in VLSI Design & Test, Bangalore, 270-277.

Modeling the Axon Growth
• Simulation Result
• Axon Growth: Movie • Optimization Process : Movie

Modeling the Axon Growth
• Results : Axon Growth

Modeling the Axon Growth
• Results : Axon Growth

Modeling the Axon Growth
• Results : Axon Growth

Modeling the Axon Growth
• Results : Axon Growth

Modeling the Axon Growth
• Results : Axon Growth

Modeling the Axon Growth
• Results : Axon Growth

Modeling the Axon Growth
• Results : Axon Growth

Modeling the Axon Growth
• Results : Axon Growth

Modeling the Axon Growth
• Results : Axon Growth

Modeling the Axon Growth
• Results : Axon Growth

Modeling the Axon Growth
• Results : Axon Growth
• Optimization Process : Movie

Modeling the Axon Growth
• Results : Optimization

Modeling the Axon Growth
• Results : Optimization

Modeling the Axon Growth
• Results : Optimization
Modeling the Axon Growth
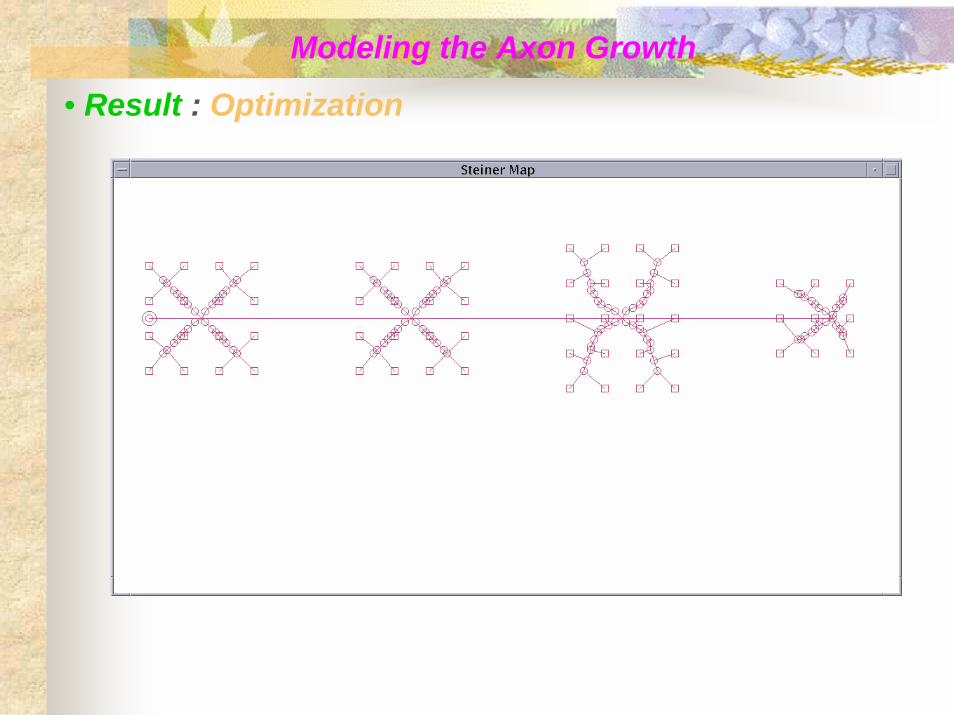
• Result : Optimization

Modeling the Axon Growth
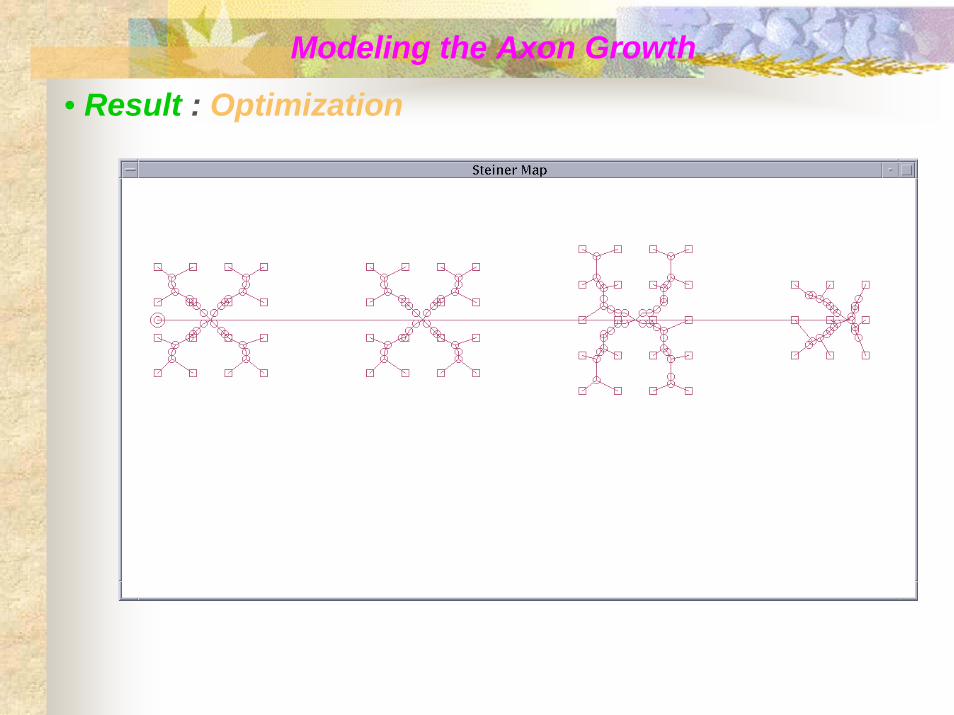
• Result : Optimization
Modeling the Axon Growth
• Result : Optimization

Modeling the Axon Growth
• Result : Optimization

Force Directed Partitioning
( )( )
∑=
∗=rn
jj
iji pU
rF
12
1
where
( ) ( )⎩⎨⎧ Φ=Φ
=otherwise
pifpU j
j :0
:1

Modeling the Axon Growth
• Result : Force Directed Axon Growth : Movie

Modeling the Axon Growth
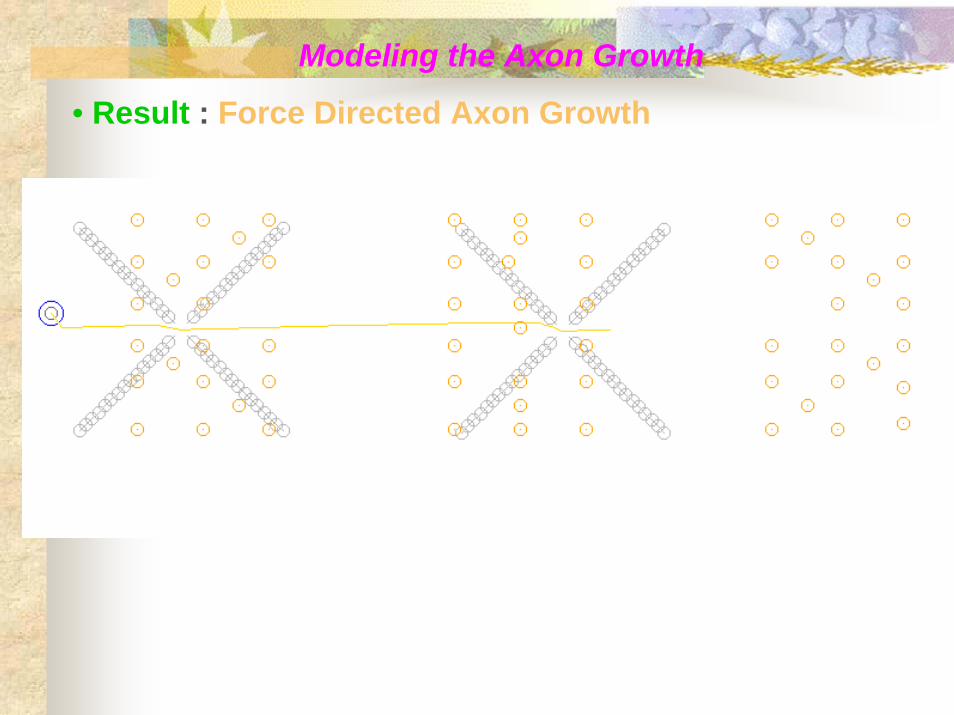
• Result : Force Directed Axon Growth

Modeling the Axon Growth
• Result : Force Directed Axon Growth

Modeling the Axon Growth
• Result : Force Directed Axon Growth
Modeling the Axon Growth
• Result : Force Directed Axon Growth

Modeling the Axon Growth
• Result : Force Directed Axon Growth

Modeling the Axon Growth
• Result : Force Directed Axon Growth

Modeling the Axon Growth
• Result : Force Directed Axon Growth

Modeling the Axon Growth
• Force directed partitioning of a displaced point set.

Force Directed Axon Growth
Axon Growth on Ferret Orientation Map
IC-Design Group, CEERI, Pilani

Principal contributions
• Tuning improvements of cortical cells are due to multiple mechanisms
• Cortical Excitation is also one of the mechanisms .
• Effects of lateral connections on orientation tuning of cortical cells are location dependent.
• Contextual Effects are also location dependent
•Force directed mechanism can be a natural mechanism for the movement of growth-cones.
• An optimization based neural network approach with force directedmechanism is used to model the growth of long-range horizontalconnections.

Future and Present Activities
• Integration of Short-Range and Long-Range Model
• Development of an Event Driven Simulator
• Use of the Model as a Pattern Recognition System
•VLSI Implementation

Some of the Important References• Bhaumik B, Mathur M (2003), A cooperation and competition based simple cell receptive field model and study of feed-forward linear and nonlinear contributions to orientation selectivity. J. Comp. Neurosci. 14:211-217.
• Buzás P, Eysel UT, Kisvárdy ZF (1998), Functional topography of single cortical cells: an intracellular approach combined with optical imaging. Brain Research Protocol, 3: 199-208.
• Callaway EM, Katz LC (1990), Emergence and refinement of clustered horizontal connections in cat striate cortex.J. Neuroscience, 10: 1134–1153.
• Changizi MA (2005), Scaling the brain and its connections. In Evolution of Nervous Systems, (ed.) Kaas JH, Elsevier.
• Jayadeva and Basabi Bhaumik, (1994), A Neural Network for the Steiner Minimal Tree Problem. Biological Cybernetics, 70:485-494.
• Kandler K (2004), Activity-dependent organization of inhibitory circuits: lessons from the auditory system. Current Opinion in Neurobiology, 14:96 – 104.
• Kisvárday ZF, Toth E, Rausch M, and Eysel UT (1997), Orientation-Specific Relationship Between Populations of Excitatory and Inhibitory Lateral Connections in the Visual Cortex of the Cat. Cerebral Cortex, 7(7):605-618
• Knierim JJ, Van Essen DC (1992), Neuronal Responses to Static Texture Patterns in Area V1 of the Alert Macaque Monkey, J. Physiology, 67:961-980.
• Mariño J, Schummers J, Lyon DC, Schwabe L, Beck O, Wiesing P (2005), Invariant computations in local cortical networks with balanced excitation and inhibition. Nature Neuroscience, 8(2):194 – 201.
• Roerig B, and Chen B (2002), Relationship of Local Inhibitory and Excitatory Circuitry to Orientation Preference Maps in Ferret Visual Cortex. Cereb. Cortex, 12:187-198.
• Yousef T, Toth E, Rausch M, Eysel UT, and Kisvarday ZF (2001), Topography of Orientation Center Connections in Primary Visual Cortex of the Cat. Neuro Report, 12(8):1693-1699.

Neuro Vision :Pattern Recognition

Neuro Vision : Pattern Recognition
Rupasi Bangla of Jivananda Das

Neuro Vision : Pattern Recognition
CONTROLLER
Post
Proc
essi
ng
Pre
Proc
essi
ng
INPUT

Neuro Vision : Future Work
VLSI Implementation of a Neuro ChipColour PerceptionDepth PerceptionMotion PerceptionFeature PerceptionTexture PerceptionLearning Memory
