tsx: pd nyse: pds 1s2.q4cdn.com/639056707/files/precision-drilling-corporation... · presentation...
TRANSCRIPT

1
Investor
Presentation
December 2017
*Rig 580, Oklahoma SCOOPTSX: PD NYSE: PDS

2
Forward-looking statements
Certain statements contained in this report, including statements that contain words such as "could", "should", "can", "anticipate", "estimate", "intend", "plan",
"expect", "believe", "will", "may", "continue", "project", "potential" and similar expressions and statements relating to matters that are not historical facts
constitute "forward-looking information" within the meaning of applicable Canadian securities legislation and "forward-looking statements" within the meaning of
the "safe harbor" provisions of the United States Private Securities Litigation Reform Act of 1995 (collectively, "forward-looking information and statements").
In particular, forward looking information and statements include, but are not limited to, the following: our strategic priorities for 2017; our capital expenditure
plans for 2017; anticipated activity levels in 2017 and our scheduled infrastructure projects; anticipated demand for Tier 1 rigs; the average number of term
contracts in place for 2017.
These forward-looking information and statements are based on certain assumptions and analysis made by Precision in light of our experience and our
perception of historical trends, current conditions, expected future developments and other factors we believe are appropriate under the circumstances. These
include, among other things: the fluctuation in oil prices may pressure customers into reducing or limiting their drilling budgets; the status of current negotiations
with our customers and vendors; customer focus on safety performance; existing term contracts are neither renewed nor terminated prematurely; our ability to
deliver rigs to customers on a timely basis; and the general stability of the economic and political environments in the jurisdictions where we operate.
Undue reliance should not be placed on forward-looking information and statements. Whether actual results, performance or achievements will conform to our
expectations and predictions is subject to a number of known and unknown risks and uncertainties which could cause actual results to differ materially from our
expectations. Such risks and uncertainties include, but are not limited to: volatility in the price and demand for oil and natural gas; fluctuations in the demand for
contract drilling, well servicing and ancillary oilfield services; our customers’ inability to obtain adequate credit or financing to support their drilling and production
activity; changes in drilling and well servicing technology which could reduce demand for certain rigs or put us at a competitive disadvantage; shortages, delays
and interruptions in the delivery of equipment supplies and other key inputs; the effects of seasonal and weather conditions on operations and facilities; the
availability of qualified personnel and management; a decline in our safety performance which could result in lower demand for our services; changes in
environmental laws and regulations such as increased regulation of hydraulic fracturing or restrictions on the burning of fossil fuels and greenhouse gas
emissions, which could have an adverse impact on the demand for oil and gas; terrorism, social, civil and political unrest in the foreign jurisdictions where we
operate; fluctuations in foreign exchange, interest rates and tax rates; and other unforeseen conditions which could impact the use of services supplied by
Precision and Precision’s ability to respond to such conditions.
Readers are cautioned that the forgoing list of risk factors is not exhaustive. Additional information on these and other factors that could affect our business,
operations or financial results are included in reports on file with applicable securities regulatory authorities, including but not limited to Precision’s Annual
Information Form for the year ended December 31, 2016, which may be accessed on Precision’s SEDAR profile at www.sedar.com or under Precision’s
EDGAR profile at www.sec.gov. The forward-looking information and statements contained in this news release are made as of the date hereof and Precision
undertakes no obligation to update publicly or revise any forward-looking statements or information, whether as a results of new information, future events or
otherwise, except as required by law.

3
▪ Provide Land Drilling Services for Oil and Gas Industry
▪ Fleet of 256 Drilling Rigs: Canada (136), U.S. (103) and International (17)
▪ Fleet of 210 Service Rigs: Canada (202) and U.S. (8)
▪ Provide Complementary Services including Camps & Catering and Rentals
▪ Reputation for Safe and High Performance Operations
▪ Diversified Geographic Exposure
Precision at a Glance - High Performance Land Driller

4
0
100
200
300
400
500
600
700
800
January
Febru
ary
Marc
h
April
May
June
July
August
Septe
mber
Oct
ober
Novem
ber
Dece
mber
2012-2016 Range
2014
2016
2017
Historical North American Drilling Activity – Improving in 2017
200
400
600
800
1,000
1,200
1,400
1,600
1,800
2,000
2018
2007
2017
2008
2009
2016
2015
2014
2013
2012
2011
2010
+132%increase
since May lows
U.S. Land Rig Count10 Year History
Canadian Land Rig Count5 Year History
Source: Baker Hughes land rig count as of November 22nd, 2017
4862016 Average Active Rigs
1282016 Average
Active Rigs
9432015 Average Active Rigs
3782014 Average
Active Rigs
1,8042014 Average Active Rigs

5
Precision’s 2017 Strategic Priorities
Commercialize rig automation and efficiency-driven technologies across our Super Series fleet
Maintain strict financial discipline in pursuing growth opportunities with a focus on free cash flow and debt reduction
Deliver High Performance, High Valueservice offerings in an improving demand environment while demonstrating fixed cost leverage

6
Precision’s 2017 Strategic Priorities
Commercialize rig automation and efficiency-driven technologies across our Super Series fleet
Maintain strict financial discipline in pursuing growth opportunities with a focus on free cash flow and debt reduction
Deliver High Performance, High Valueservice offerings in an improving demand environment while demonstrating fixed cost leverage

7
Precision’s High Performance Foundation
Super Series RigsPrecision Systems Precision Crews

8
Systems + Scale Driving Operational Excellence and Lower Costs
Technical Support
Centres
Supply Chain
Management
IT Infrastructure
and ERP
Manufacturing +
Capital Projects

9
Precision Employee Recruiting and Development Program
127,224Applications processed
2013-2016
(30,700 Applications YTD1)
1,200 – 1,400 Screened candidates in the
system
100+ drilling rigs reactivated from Q2/16 lows, 2000+ positions filled
Leadership
Development
Programs
Career Path
Management
Structured Promotion
Programs
Long-term
Compensation Programs
Field Training
Investments
Permanent Training
Facilities with Fully
Functioning Rigs
Tier 1 Assets
Structured
Competency
StandardsWorld-Class Safety
Culture and
Processes
1. As of 9/30/2017

10
120Tier 1 Rigs
Added
Precision’s High Performance Super Series Rigs
75
114 119 125 128
43
7279
88101 103
2
2
8
2015
International
2016
129 Canada
U.S.
6
5
2013 20142011
2
2012
1) Excludes 16 upgrade candidates, 99 newbuild rigs (one commissioned in Q1/17) and 21 major upgrades.2) Decommissioned 36 legacy rigs in 2011, 52 rigs in 2012, 29 rigs in 2014 and 79 rigs in 2015 – total of 196 rigs.3) Peak based on Baker Hughes U.S. Land Rig Count average of 1,872 in November, 2014.4) Peers A, B, and C operate in Canada and the U.S. Peer D operates only in the U.S.5) For M&A occurring over time period, combined company data in 2014 and 2017 was used in calculations.
1,2
▪ ~$3.0 Billion in Drilling Expansion and Upgrade Capital Investment from 2011 – 2017E
120Tier 1 Rigs
Added
75
114 119 125 128
43
7279
88101 103
Canada
U.S.
International6
2014
5
2016
129
8
2015
2
2013
2
2012
2
2011
63%
53% 55% 52%
68%
50%
291
Lower 48
290 1,872
Peer D
72101
PD
192
Peer CPeer A Peer B
2014 Peak Month Avg. Rig Count
Peak 2017 U.S. Rig Count as % of 2014 Peak Month Average 3,4,5

11
High Performance – Precision Super Triple Efficiency
Rig 576, Drilling in West Texas (Permian Basin)
+46%
2017 YTD*
80%
2016
79%
2015
53%
2014
29%
2013
24%
2012
12%U.S
. S
up
er
Tri
ple
Pa
d
Rig
Op
. D
ays a
s %
of
To
tal
1.73% 1.65% 1.58%
0.90%1.11%
-8%
1H/1720162015
1.39%
201420132012
U.S
. T
ota
lD
ow
nti
me
✓ Reducing well cost
✓ Improving performance and efficiency
✓ Providing value to customers – increasing market share
2.101.72
1.47
0.771.06
1.43
1H/1720162015201420132012
-7%
Re
co
rda
ble
Fre
qu
en
cy
* As of 8/15/2017

12
Precision’s 2017 Strategic Priorities
Commercialize rig automation and efficiency-driven technologies across our Super Series fleet
Maintain strict financial discipline in pursuing growth opportunities with a focus on free cash flow and debt reduction
Deliver High Performance, High Valueservice offerings in an improving demand environment while demonstrating fixed cost leverage

13
Canada – Focused on Cash Flow, Leading Market Share
$92
2015
$156
2014
$252
2013 Total
$1,649
2016
$269
2012
$321
2011
$318
2010
$242
Cash Flow 1(in $ millions)
Since 2010
▪ Generated $1.7 billion in cash flow1
▪ Invested $765 million in growth capital
▪ Delivered 70+ newbuild and upgraded rigs
▪ Fleet now consists of 96% Tier 1 rigs
1) Cash flow calculated using reported daily margins multiplied by drilling utilization days plus C&P EBITDA, less maintenance capital expenditure.2) Based on well count provided by industry sources and internal analysis.* Dots on map representative of areas where Precision has had operations in 2015, 2016 & 2017 (09/2017)
Leading Market Position
▪ Typically operate over 25% of rigs in market
with 136 drilling rig fleet
▪ Leading market share2 in Montney (30%),
Duvernay (38%) and Heavy Oil (33%)

14
United States – Focused on Market Share Growth, Cash Flow
Market Share Growth in Key Plays since 2010
▪ Permian and Woodford (SCOOP/STACK) – targeted growth in most active areas
▪ Marcellus – maintained strong market share from 2013-2016
▪ DJ-Niobrara – approaching leading market position
▪ Eagle Ford – activity outlook improving
▪ Upside for other regions with higher commodity prices
0%
5%
10%
15%
20%
Permian MarcellusWoodford DJ-Niobrara
2010
2016
Precision U.S. Market Share1
1) Market share calculated based on drilling days * Dots on map representative of areas where Precision has had operations in 2015, 2016 & 2017 (09/2017)
Reputation and Scale Drives Growth
▪ Proven Super Series fleet of 103 rigs
▪ Ability to respond to customer demand across U.S.
▪ Established and growing premium customer base

15
International Markets – Stable Cash Flow in the Low Cost Region
Established Scale in the Middle East Region
▪ 8 rigs currently under contract
▪ No contract renewals in 2017
▪ Deployed five new build rigs to Kuwait since 2014 including two in Q4/16
▪ Ability to leverage fixed costs with additional deployments
▪ Targeting IOC’s and NOC’s that value Safety and Performance
▪ Fleet of 17 rigs (12 ME Region, 5 Mexico)
Rig 904, drilling in Kuwait
16
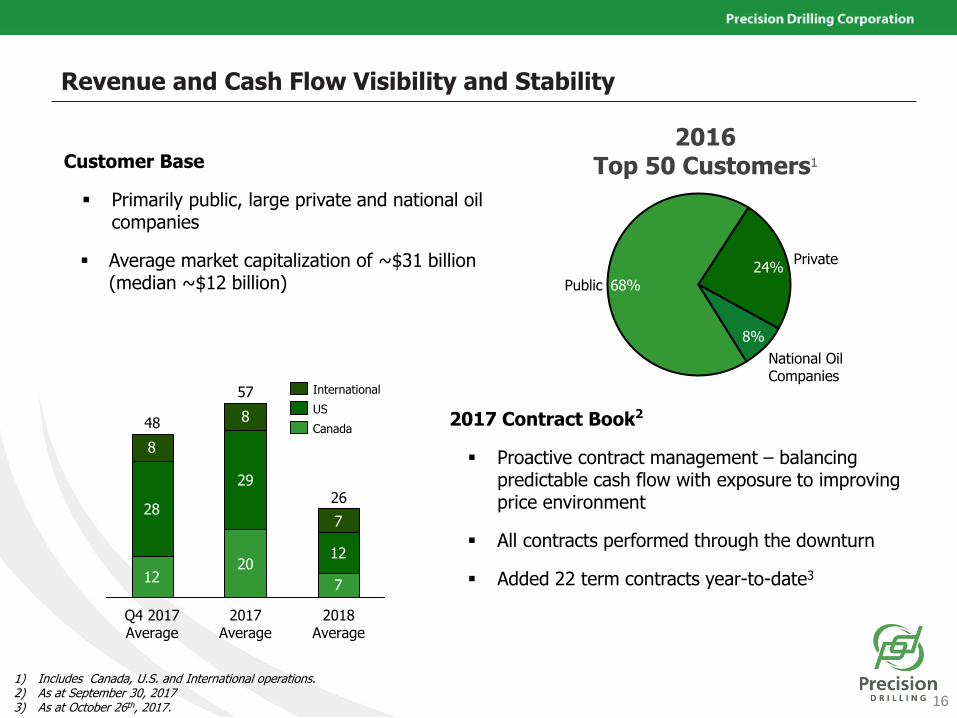
Revenue and Cash Flow Visibility and Stability
$187
$721
1220
28
29
12
8
8
7
7
2018Average
26
2017Average
Q4 2017 Average
48
57US
Canada
International
2017 Contract Book2
▪ Proactive contract management – balancing predictable cash flow with exposure to improving price environment
▪ All contracts performed through the downturn
▪ Added 22 term contracts year-to-date3
Private
National OilCompanies
8%
24%
68%Public
2016 Top 50 Customers1Customer Base
▪ Primarily public, large private and national oil companies
▪ Average market capitalization of ~$31 billion (median ~$12 billion)
1) Includes Canada, U.S. and International operations.2) As at September 30, 20173) As at October 26th, 2017.
17
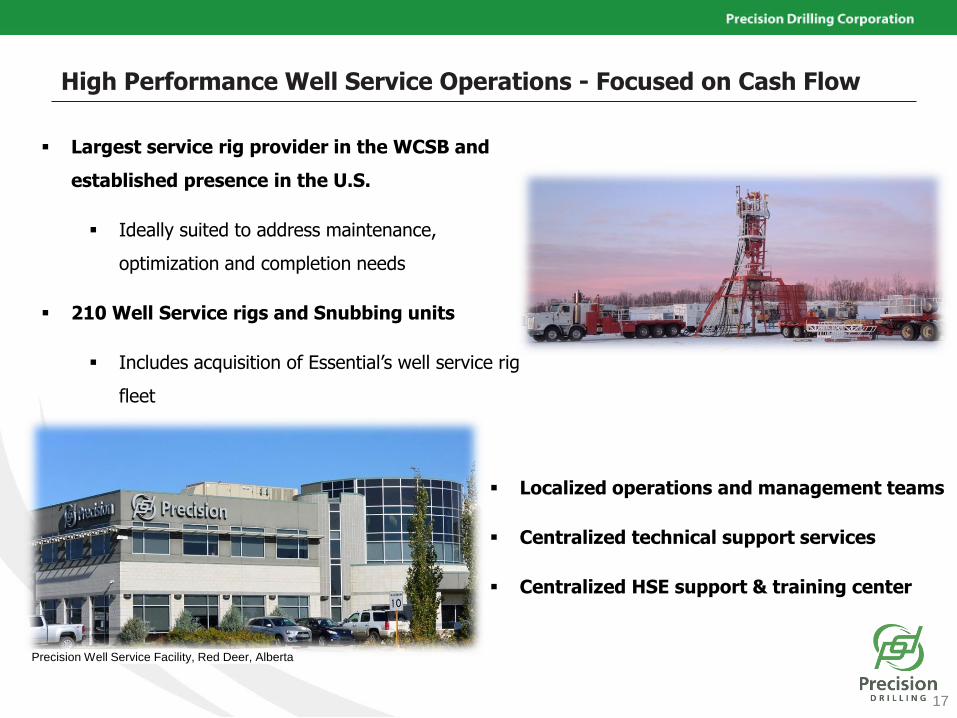
High Performance Well Service Operations - Focused on Cash Flow
▪ Largest service rig provider in the WCSB and
established presence in the U.S.
▪ Ideally suited to address maintenance,
optimization and completion needs
▪ 210 Well Service rigs and Snubbing units
▪ Includes acquisition of Essential’s well service rig
fleet
▪ Localized operations and management teams
▪ Centralized technical support services
▪ Centralized HSE support & training center
Precision Well Service Facility, Red Deer, Alberta

18
2018 Capital Plan – Strict Financial Discipline
$187
$62
$32
Maintenance & Infrastructure
Expansion & Upgrade
▪ $62 million for Maintenance and Infrastructure
▪ Fleet well maintained throughout the downturn, minimal catch-up maintenance required
▪ Remaining spend related to ERP system upgrade
▪ Increase operating efficiencies, improve fixed cost leverage and position organization to better handle increased data flows
▪ $32 million for Upgrades
▪ Plans to upgrade ~10-20 Tier 1 rigs to industry leading rig specifications
▪ Additions of walking systems
▪ Increased pumping and racking capacities
▪ Rig automation systems
▪ Spending contingent on firm customer contract commitments that meet internal return thresholds
Planned 2018 Capex
Total: $94 million
▪ 2017 Capital Plan held at $104 million

19
Financial Performance and Pro Forma Liquidity Position
Pro Forma Liquidity as of 09/30/2017 1
(in $ millions)
$696
$69
$765
Cash2
Revolver/ Operating Facilities1
(Matures November, 2021)
1) Calculated as undrawn portion of revolver (adjusted for LCs outstanding) and cash using CAD/USD exchange rate and balance sheet numbers as at 9/30/2017.2) Pro forma cash balance calculated as 9/30/2017 cash balance less US$50 million using CAD/USD exchange rate as at 9/30/2017
Resilient Margins Through Downturn
▪ Aggressive cost management
▪ Rig contract performance
(in $ millions) 2017 2016
Revenue $315 $214 $951 $1,556
EBITDA $72 $41 $228 $474
Margin 23% 19% 24% 30%
ended Sept. 30Fiscal
2015
Fiscal
2016
Three months
Strong Liquidity Position
▪ Sizeable cash balance
▪ Full access to revolving credit facility
▪ Asset based poised for free cash flow generation
Revolving Credit Facility Recently Amended
▪ 2.5 year maturity extension to November 2021
▪ Revised set of covenants which improves financial and operating flexibility.
▪ Reduction in size from US$525 million to US$500 million

20
Recent High Yield Note Offering Summary & Pro Forma Debt Profile
Current Debt Maturity Schedule Pro Forma Debt Maturity Schedule
▪ Objective: extend and smooth debt maturity profile and decrease leverage while maintaining substantial liquidity
▪ Raised US$400 million in HY senior unsecured notes due 2026
▪ Used proceeds from offering and ~US$50 million in cash on hand to tender/call US$372 million of 2020 notes and
US$70 million of 2021 notes tendered
▪ Average tenor of debt grows from ~62 months today to ~80 months pro forma refinancing
▪ HY transaction and early tender offers closed on 11/22/17 and redemption of outstanding 2020 notes expected to
close early-December
$465
$399
$438 $500
$0
$100
$200
$300
$400
$500
$600
2017E 2018E 2019E 2020E 2021E 2022E 2023E 2024E 2025E 2026E$311
$438 $500
$500
$0
$100
$200
$300
$400
$500
$600
2017E 2018E 2019E 2020E 2021E 2022E 2023E 2024E 2025E 2026E
No debt maturities until December 2021

21
Precision’s 2017 Strategic Priorities
Commercialize rig automation and efficiency-driven technologies across our Super Series fleet
Maintain strict financial discipline in pursuing growth opportunities with a focus on free cash flow and debt reduction
Deliver High Performance, High Valueservice offerings in an improving demand environment while demonstrating fixed cost leverage
22
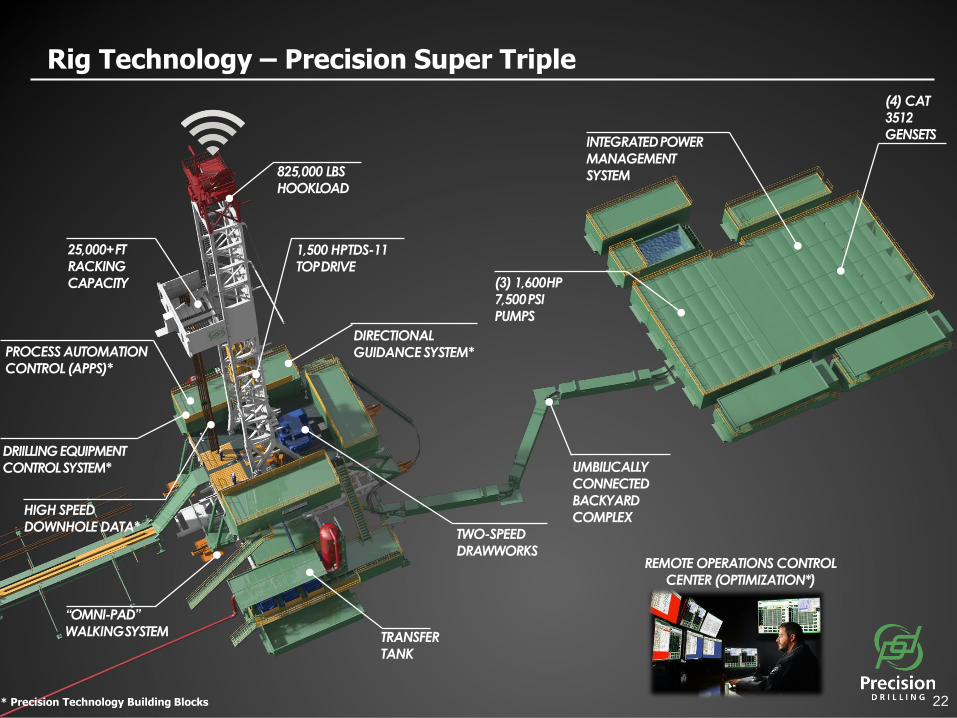
“OMNI-PAD” WALKINGSYSTEM
825,000 LBS HOOKLOAD
25,000+FT RACKING CAPACITY
1,500 HPTDS-11 TOPDRIVE
(3) 1,600HP7,500PSI PUMPS
(4) CAT 3512 GENSETS
TWO-SPEED DRAWWORKS
UMBILICALLY CONNECTED BACKYARD COMPLEX
INTEGRATEDPOWER MANAGEMENT SYSTEM
Rig Technology – Precision Super Triple
22
TRANSFER TANK
DIRECTIONAL GUIDANCE SYSTEM*PROCESS AUTOMATION
CONTROL (APPS)*
REMOTE OPERATIONS CONTROL CENTER (OPTIMIZATION*)
HIGH SPEED DOWNHOLE DATA*
* Precision Technology Building Blocks
DRIILLING EQUIPMENT CONTROL SYSTEM*

23
Precision Technology Building Blocks
2424

25
Process Automation Control – Consistent, Predictable, Repeatable
▪ Consistent results eliminates human variance▪ Allows driller to focus on the wellbore and crew
performance
Experienced Driller Process Automation Control
NOV controlled testing
Experienced Driller
Process Automation Control
Connection 1 Connection 2 Connection 3 Connection 4 Connection 5
Connection 1 Connection 2 Connection 3 Connection 4 Connection 5
Min
ute
sM
inu
tes
▪ More efficient operations by eliminating operator induced process delays
Precision data from Rig 601 field trials
26
▪ Drilling Equipment Control System: largest installed fleet of AMPHION control systems
▪ Process Automation Control: 20 rigs installed with NOVOS and drilled >70 wells YTD
▪ Directional Guidance System: 124 wells (30 YTD) and 1.5 million feet drilled
▪ High Speed Downhole Data Communication: 404 thousand feet drilled representing more than 96% of the total footage drilled on land to date utilizing wired drill pipe
Precision’s Progress1
Rig 609
1) As of September 30, 2017

27
Technology Commercialization – Revenue Potential
Pull through on existing rigs and
directional drilling service
Each technology is a service sold to
customers as bolt on to our existing
rigs
New technologies will strengthen
competitive advantage and
provide a platform for future
technology revenue streams
RevenueImpact
FleetPull Through
Reinforced Competitive Advantage
Fixed daily chargeIncreased utilization
and dayrateMarket share
TechnologyDaily EBITDA
Impact EstimateAvailable
FleetEst. % of Active
Rigs (2018 – 2019)
PAC $1,500 100+ rigs 80%-100%
DGS $1,000 256 rigs 20%-50%
High SpeedDownhole Data1
$2,500 100+ rigs 20%
Apps2 $250-$1,000 100+ rigs 80%-100%1) Assumes rental model2) Assumes 1 to 4 apps at $250 per app

28
Investment Merits
North American driller with demonstrated market share growth
High Performance Tier 1 fleet and focus on automation
technology commercialization to reduce drilling costs
Strong balance sheet with $765 million of liquidity1
Attractive contract position and customer base
Scale supports improved service delivery and financial returns through cost leverage
Focus on free cash flow, fixed cost leverage and capital
discipline
TSX: PD NYSE: PDS1) Pro forma liquidity as at 9/30/2017

29
800, 525-8th Avenue S.W.
Calgary, Alberta, Canada T2P 1G1
Telephone: 403.716.4500
Facsimile: 403.264.0251
www.precisiondrilling.com