truck tyre wear assessment and predictionroad-transport-technology.org/proceedings/7 - ishvwd//truck...
TRANSCRIPT
H.A. Lupker
F. Montanaro
D. Donadio
E. Gelosa
M.A. Vis
7th International Symposium on Heavv Vehicle Weights & Dimensions
Delft, The Netherlands, June 16 - 20, 2002
TRUCK TYRE WEAR ASSESSMENT AND PREDICTION
TNO Automotive, P.O. Box 6033, 2600 lA Delft, The Netherlands
PirelH Settore Pneumatici, Viale Sarca 222, 1-20126 Milano, Italy
Pirelli Settore Pneumatici, Viale Sarca 222, 1-20126 Milano, Italy
PirelH Settore Pneumatici, Viale Sarca 222, 1-20126 Milano, Italy
TNO Automotive, P.O. Box 6033, 2600 lA Delft, The Netherlands
ABSTRACT
Tyre wear is a complex phenomenon. It depends non-linearly on numerous parameters, like tyre compound and
design, vehicle type and usage, road conditions and road sUliace characteristics, environmental conditions (e.g.,
temperature) and many others. Yet, tyre wear has many economic and ecological implications. The possibility to
predict tyre wear is therefore of major importance to tyre manufacturers, fleet owners and governments.
Analogous observations can be made for road wear prediction due to the high road maintenance costs and traffic
safety implications. Tyre and road wear are strongly related; the energy that wears the road is the energv that
wears the tyre. There is therefore much to gain from an integrated approach to studying the mechanisms behind
both wear phenomena.
Based on these observations, in 2000 we started the three-year 5th framework EU project TROWS (Tyre and
ROad Wear and Slip assessment). The results include tools to analyse tyre wear and road polishing. These will be
combined in a suitable wear prediction environment.
This paper focuses on the followed methods and results sofar of TROWS for truck tyre wear. Several types of tests
were peiformed to obtain insight in the mechanisms behind the truck tyre wear phenomenon. These include
material tests on tyre compounds, carousel tests with truck tyres, and tests with an articulated MAN truck on a
public road course in Italy. Truck tyre wear mechanisms are presented and explained in relation to results from
the peiformed tyre wear tests. Some modelling activities are discussed, as well as the wear prediction environment
(Prolinx) that was developed to integrate the vast amount of test and modelling results from partners working at
different locations with different tools. The relation between tyre and road wear is briefly touched upon. A
discussion on the remaining challenges in predicting tyre wear concludes this paper.
INTRODUCTION
Any project on tread wear that includes modelling can be conceived as a two-part program. In the first part the
forces and moments transferred in the tyre contact patch, the tyre-road contact area, are determined for selected
operational and vehicle conditions. The second part is modelling what happens in the contact patch in terms of
friction and tread wear behaviour due to the tyre loads that result from the selected operational conditions.
Part one may be complex but part two is significantly more difficult than part one. The main reason for this is that
the tyre has to perform under a wide range of external world conditions. One does not have a controlled
environment to conduct any model validation. Different pavements, different vehicle operations, different seasonal
conditions (temperature, rainfall), different tread rubber compounds, all are responsible for this complexity of
friction and wear behaviour in the contact patch.
An attempt to set up any mechanical model by running a simple road test after model building is bound to fail
under more general applications. It may validate nicely for the situation at hand but at may fail to give any
confirmation when run at a later time for a road test under different conditions. Unless the model is based on sound
physical considerations on how external conditions influence the phenomena in the contact patch, it cannot predict
tread wear given the wide range of operational conditions a tyre is subjected to during its live span.
The challenge is therefore to attempt to understand, as best as possible, the complexity of the phenomena involved;
how do various tyre factors acting under a range of external factors influence tread wear. One of the demonstrated
issues is the interaction of tyre factors with external factors. The outcome of the action of two or more factors is
not a simple additive effect. The effect of any factor is a function of what other factors are operating and at what
levels.
275
The EC 5th framework project TROWS (Tyre and ROad Wear and Slip assessment) aims to gain insight into tyre
wear and road polishing and the effects thereof on slip characteristics. Simulation models and test procedures are
being developed that should allow tyre manufacturers to further improve the balance between tyre wear and other
design factors, along with providing road manufacturers with improved design rules and maintenance plans for
road surfaces.
The specific objective of the project is to make a significant step forwards in the prediction of tyre wear and road
polishing, and to facilitate the wear prediction process using an integrated software environment for processing
experimental and simulation results.
Veith ([ 1]) distinguishes several different kinds of (tire) wear mechanisms:
• adhesive wear - removal of material caused by high transient adhesion ('welding')
• abrasive wear - caused by cutting-rupture action of sharp angular asperities on the sliding counterface or as
third bodies (particles)
• erosive wear - cutting-rupture action of particles in a liquid (fluid) stream
• corrosi ve wear - from direct chemical surface attack
• fatigue wear - caused by rapid or gradual material property changes that give rise to cracks and with their
growth, a loss of material
Grosch ([2]) states that the wear of rubber is largely caused by fatigue.
One of the wear mechanisms studied in TROWS is that of truck tyres. This paper discusses the set-up and results
of truck tyre wear tests in TROWS, and shows what tools are developed to be able to use the results in the
prediction of truck tyre wear.
WEAR ASSESSMENT AND PREDICTION IN THE TROWS EC PROJECT
This section first gives a brief overview of the activities undertaken in the TROWS project, related to tyre wear.
Next, the way tyre wear is assessed, is presented in greater detail. This is followed by an explanation of how the
wear assessment results are used for the prediction of tyre wear, and how a truck model is essential to this
prediction. The section ends with an introduction to the software application that was developed to manage test
results and models for usage in the wear prediction process.
TROWS project summary
In TROWS, tyre wear is studied experimentally both under well-controlled laboratory test conditions and under
real-life test conditions. Experiments are performed on three levels:
• Compound level. Three different tread compounds are tested on three different wear machines.
• Tyre level. One type of truck tyre is tested under controlled loading and road surface conditions on a so-called
'carousel' .
• Vehicle level. A truck-trailer combination and two passenger cars are driven on a well-characterised track of
public roads in Italy.
Developed numerical models include vehicle models, models for the tyre structural behaviour and models to
predict the (sliding) behaviour in the tyre-road contact area.
In the study of road polishing a similar subdivision is used for the experimental work: laboratory asphalt
compound tests, carousel tests (with the road as main subject), and monitoring of the Italy public road track (i.e.,
collection of data on road lay-out, road surface changes, traffic density, etc.).
The results of TROWS will include experimental and numerical tools to analyse tyre wear and road polishing.
These will be combined in a suitable software environment for wear prediction allowing tyre manufacturers to
study more design alternatives at lower costs and thus to come closer to the most optimal compromise. Vehicle
manufacturers will be able to improve their suspension design for tyre wear reduction for new vehicles by
analysing changes in tyre loading due to changes in suspension compliance for a given vehicle usage profile. Road
pavement and policy experts will be able to find a better compromise between skid resistance and other road
characteristics (e.g. noise and traffic polishing effect) through better road layers techniques.
Overall approach to tyre wear assessment and prediction
A complex range of modelling and testing activities is covered in the project. This paper focuses on truck tyre
wear, thus excluding the car tyre wear and road polishing aspects of TROWS.
276
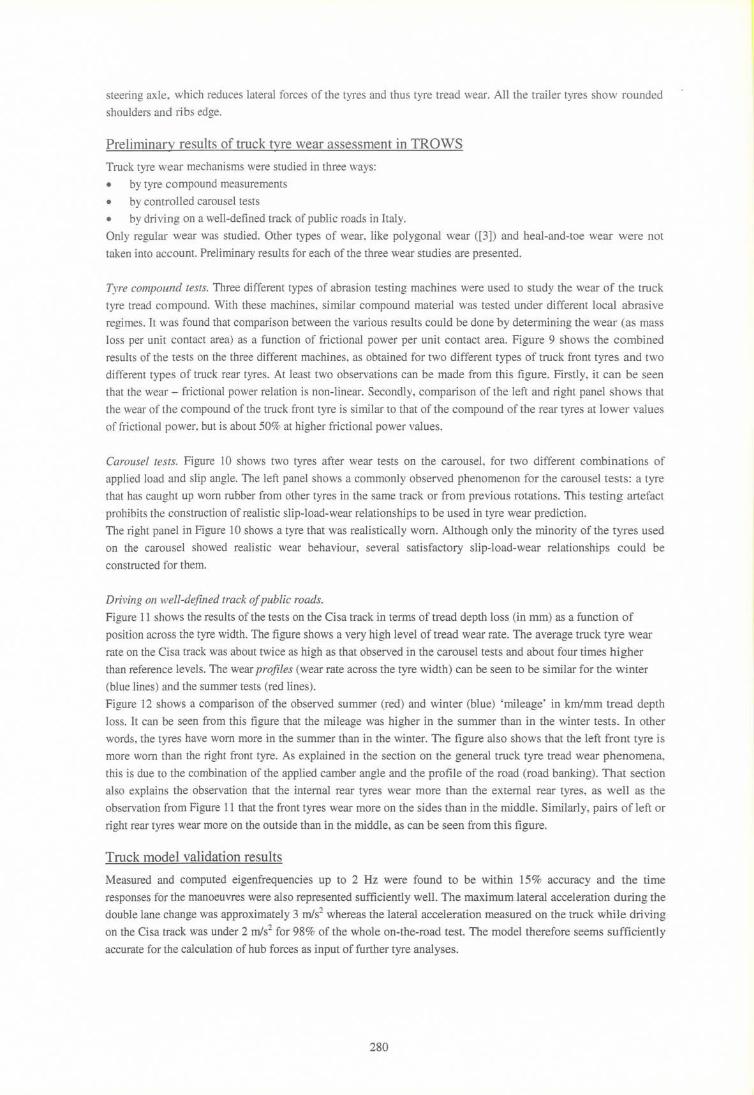
Figure 1 shows the basic tyre wear approach adopted in TROWS. The left half of the figure shows the model
based approach, the right half the experiment-based approach. In both cases, vehicle usage profiles are necessary
to characterise the typical usage of a vehicle, e.g. a passenger car in Northern Europe for shopping purposes is
used differently than a truck in Southern Europe for professional freight transport. If sufficient data and knowledge
is available, a tyre and vehicle model could be build to perform analyses of important manoeuvres leading to
information on slip, stresses and deformations in the contact patch. Using these in a suitable wear law should give
a wear rate for a specific manoeuvre and, in combination with the vehicle usage profile, a reasonable estimation of
the total driven distance for a given minimum tread profile depth. On the other hand, if a vehicle is driven over a
specific suitable reference course and the tyre wear is measured, this could be compared with the wear of a known
tyre and than "scaled" to obtain a similar distance estimation for a given usage profile.
Obviously, both approaches have their pros and cons, allowing a more effective approach by combining them. The
tyre wear prediction process requires the use of complex models, the handling of vast amounts of data, and the use
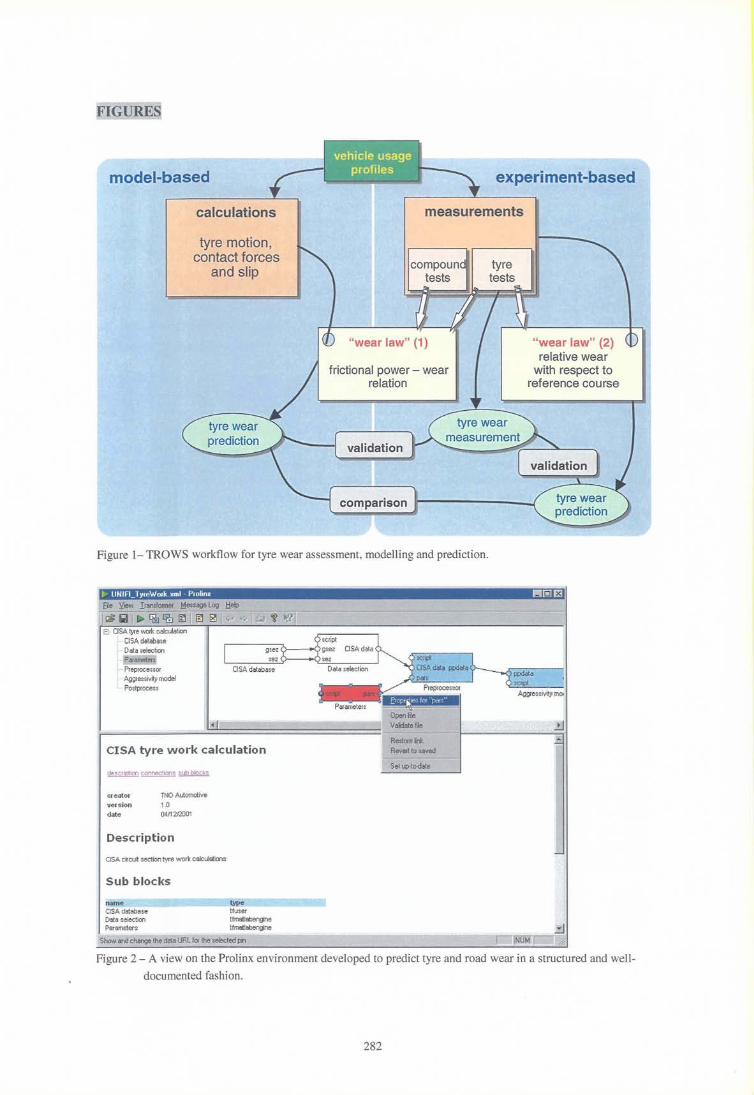
of different kinds of software possibly running on different platforms. To manage and facilitate such a process, an
efficient software environment has been developed (see Figure 2).
Tyre wear assessment
Tyre compound tests
Tyre compound tests were performed by rolling or sliding truck tyre tread compound specimen over road or road
like surfaces under laboratory conditions. For this, three different types of abrasion testing machines are used.
These include two machines where specimen wheels are worn by rolling either over the side or over the outside of
a disk of road material. A linear sliding machine is used to study the wear of a block of tread compound material
sliding over a piece of material with road surface properties. To illustrate this laborious task an example of tests on
one of the machines is given in Figure 3. The figure shows the well-known LA TlOO abrasion tester, on which
tread compound specimen wheels were tested, rolling a distance of 11,500 m at 23 kmlh on two different surface
types, at one slip angle (20), and at loads varying from 80 to 140 N. The used surface types were chosen such that
one of them was comparable to the road surface used in the carousel tests. For comparison, the other surface type
was chosen well outside the range of surface types used in the carousel tests.
Carousel tests
Well-controlled carousel tests were performed, where eight truck tyres were mounted in total on a four-arm
carousel (Figure 4). The main purpose of the carousel tests was to study road polishing. Yet, the mounted tyres
could also be studied for tyre tread wear. For each of the tyres, load and slip angle were set within a range of 30 to
37.5 kN and -4 to +7°, respectively. The carousel radius at the wheel position was 19 m. Two tests of 200,000
rotations were completed at 6.5 rotations per minute for the first 10,000 rotations and at 10 rotations per minute for
the next 190,000 rotations. Tread depth was measured before the tests and tyre wear was studied after 10,000,
30,000, 50,000, 100,000, 180,000, and 200,000 rotations. Before the last 20,000 rotations the loading was
increased significantly to increase the road polishing effects. This was done using a different set of tyres, because
this severe testing ruins the tyres completely. Three different road surfaces were tested, where two surfaces were
tested simultaneously by dividing the circular test track in two concentric parts.
Vehicle-on-the-road tests
Truck tyre wear under realistic conditions was studied by actually driving around on public road. This required
hundreds of hours driving, especially for long lasting truck tyres. To obtain a suitable result with a reasonable
effort a quite aggressive road course in Italy has been chosen. The selected road course, termed the Cisa course, is
shown in Figure 5.
The Cisa testing track was chosen to represent typical European roads and traffic situations as well as several
different types of road surfaces. The total length of the route, which is close to Parma, is 134 km and the estimated
lap time was about 2 hours. Test series of 25,000 km were performed, one in the winter and one in the summer.
The Cisa track has been used for both the passenger car testing (two Peugeot 406 cars driving as a platoon) and the
truck testing (see Figure 6). Tyre wear rates and wear patterns (i.e., wear rate across the tyre width) were
monitored by measuring tread depths across the tyre width after each 5,000 km of driving. Figure 7 shows that, for
truck rear (middle panel) and front tyres (right panel), tread depths were measured at six and four positions across
277

the tyre width , respectively. Tread depths at each position across the tyre were averaged for four positions along
the tyre circumference (left panel).
The track was di vided in eight sections for pavement characterisation and location referencing ([4 D. It was
characterised on a microtexture level (height < 0,2 mm, length < 0,5 mm), a macrotexture level (0,1 < height < 20
mm, 0,6 < length < 60 mm), and on a megatexture and unevenness level. Measurements included laboratory tests
on asphalt compounds and road measurements using the SCRIM (micro/macrotexture), RUGO (macrotexture) and
ARAN (Ruts, Curves, Unevenness, Slopes, Video) methods.
Wear prediction
Tyre wear prediction takes place on different levels. On the most detailed level, local rubber wear in the contact
patch is calculated. This is done by calculating frictional power dissipated in the contact area and then determining
the corresponding local wear by applying a frictional power-wear relation for the tread compound. The frictional
power-wear law is determined experimentally from tread compound measurements. Frictional power in the contact
area for different manoeuvres is calculated with a detailed FEM-like tyre model.
On a less detailed level, tyre wear for a complete tyre mounted on a truck, driving a particular route is calculated
by assuming that tyre wear is proportional to the work done by the contact forces. Each section of a particular
route can be assigned an 'wear agressivity' value, where agressivity is defined as the work per unit length and unit
weight, averaged over that particular road segment. It must be noted that the agressivity depends on vehicle type
(total weight and weight distribution), type of wheel (drive or carried wheel , left or right wheel), road class
(vehicles speed, minimal value of the bend's radius), and type of road element (straight section, bends, transitions).
This means that, in order to calculate the agressivity, a sufficiently detailed vehicle model is required. To be able
to determine the corresponding wear value, an agressivity-wear relationship has to be determined.
Truck modelling
The articulated MAN F2000 truck has been modelled using the multi-body simulation package ADAMS. The
main modelling attention was on the front , rear and trailer suspensions. The front suspension comprises the rigid
axle, the roll-bar and the steering system. Some truck testing has been done on a well-defined track for validation
of the multi-body model. Two test series were performed: one with the traction unit alone and one with the trailer
attached. The manoeuvres included acceleration and braking on a straight lane, circle tests (R=44 m, 60 km/h) and
a double lane change, also at 60 kmIh.
The Prolinx wear prediction environment
The wear prediction process consists of a combination of performing experiments, data processing, modelling,
simulation and reporting. These tasks are performed by different partners all over Europe. Apart from the technical
details, managing and executing the different steps in this project' s technical process is quite a challenge. To be
able to manage and reproduce the tyre and road wear prediction processes, a clear view is necessary on the
following issues:
Responsibility: who performs which process (e.g. measurements, calculations, simulations etc.)?
Integration: how can we link and execute the various processes in a manageable way?
Datajlow: which data is transferred between different processes?
Data consistency: is the generated or received data valid?
Reproducibility: can all results be reproduced unambiguously using a well-defined starting point?
Transferability: can the knowledge about a process be transferred efficiently to different people?
Prolinx was developed by TNO Automotive to facilitate defining and implementing the solutions to these
questions. See Figure 2 for a glance on Prolinx' user interface. Using Prolinx, the partners can keep track of their
sub-process, its related documentation, and the processes on which they depend. Prolinx displays the hierarchy and
data flow of the wear prediction process, keeps track of the validity of exchanged data, and performs the necessary
calculations to generate valid results, e.g. by calling programs like Matlab/Simulink or ADAMS. Prolinx has a
generic set-up, so it can also be used for mathematical processes other than tyre or road wear prediction.
The software application thus serves as a guideline for the TROWS partners. Each partner knows exactly which
steps to perform to generate their contribution to the wear prediction process. Once implemented in Prolinx, the
wear prediction process can be reproduced unambiguously at any time using different parameters, conditions,
278
usage patterns, measurement data et cetera to perform wear prediction calculations for different types of tyres and
road surfaces.
TRUCK TYRE WEAR MECHANISMS AND PRELIMINARY RESULTS
The objectives o f the TROWS project for tyre wear prediction are limited to regular wear. Other types of wear,
like polygonal wear ([3]) and heal-and-toe wear are considered out of the scope of the models constructed in
TROWS. In thi s section, first a brief general overview is given of truck tyre wear phenomena. Next, preliminary
results of the tests will be presented and, finally, it will be shown how the truck model is used in the prediction of
tyre wear.
General truck tyre tread wear phenomena
Truck-type vehicles can be subdivided into several categories or segments for which the related tyre wear varies
from low to severe. The lowest tread wear can be observed on long-distance transport vehicles on motorways or
major roads. The most severe tread wear is found on vehicles used in extreme off-road conditions on all types of
terrain (loose surfaces, unpaved roads, mud, grass, and sand). This typically holds for vehicles for military use.
The truck-trailer combination studied in the TROWS project falls in the long haulage segment, which is close to
the first category.
In general, the vehicles are used at maximum transport capacity, so that truck tyres always work at the maximum
load. Figure 8 shows the load distribution on the axles of a typical 40-ton truck-trailer combination, the
combination used in the TROWS project for the study of truck tyre wear. Note that the load is approximately
equally distributed over the combined tractor and trailer axles (each 20 ton).
The studied truck typically operates on a motorway surface type. The tyres are usually fitted in the autumn and are
used for one year. Typical wear rates for the front and rear axles of the truck are:
• front axle: from 30,000 km/mm tread depth loss to 15,000 km/mm tread depth loss
• rear axle: from 15,000 km/mm tread depth loss to 10,000 km/mm tread depth loss
Besides the difference in front (steered) and rear (driven) axle, wear strongly depends on axle load.
The following paragraphs present the general characteristics relevant to tyre wear for the different types of axles
on the typical truck shown in Figure 8.
Front axle characteristics. The front axle is a free rolling steered axle, where only braking torques and slip forces
are applied. The lateral acceleration is zero for most of the truck mileage. The outer shoulders of the front axle
tyres wear significantly more than the inner shoulders. This is due to the positive camber angle of 0.6 to 0.7
degrees that is applied to both of the front axle tyres. The tread pattern is always formed by longitudinal grooves.
The ribs are quite often covered by transversal narrow sipes to ensure a more even wear distribution. The left front
axle tyre wears faster than the right front axle tyre, due to the combination of the applied camber angle and the
profile of the road (road banking).
Rear axle characteristics. The rear (truck) axle is the driven axle. The wear of the rear axle tyres is higher than that
of the front axle tyres, because of high accelerating and braking forces applied. Due to the flexion of the rear axle,
the inner shoulders of the inner tyres on both sides wear significantly more than the inner shoulders of the outer
tyres. The tread pattern is formed by blocks with deep longitudinal and transversal grooves. This leads to a better
traction performance. The use of braking systems like retarders can apply a constant braking couple, thus
improving the mileage in km/mm tread depth loss. Due to slippage of the backward part of the tread blocks, the
rear axle tyres typically show so-called heel-and-toe wear effects. This means that the backward side of tread
blocks is more worn than the forward part.
Trailer axle characteristrics. The three axles on the trailer have a different behaviour depending on the type of the
trailer settings. Yet, all three axles are generally subjected to a high level of lateral forces. On some trailers, the
first axle can be lifted, which explains why the tyres on these axles can show less wear then those on the other
trailer axles . The tyres on the second axle wear significantly less than those on the first and third axles. This is due
to the fact that the second, central axle spins around its centre, and therefore lower lateral forces act on these tyres
than on the tyres of the first and third axles. Due to the possibly high lateral forces, the tyres of the first and third
trailer axle show a higher degree of chipping and chunking of the tyre rubber. The third axle of the trailer may be a
279
steering axle, which reduces lateral forces of the tyres and thus tyre tread wear. All the trailer tyres show rounded
shoulders and ri bs edge.
Preliminary results of truck tyre wear assessment in TROWS
Truck tyre wear mechanisms were studied in three ways:
• by tyre compound measurements
• by controlled carousel tests
• by driving on a well-defined track of public roads in Italy.
Only regular wear was studied. Other types of wear, like polygonal wear ([3]) and heal-and-toe wear were not
taken into account. Preliminary results for each of the three wear studies are presented.
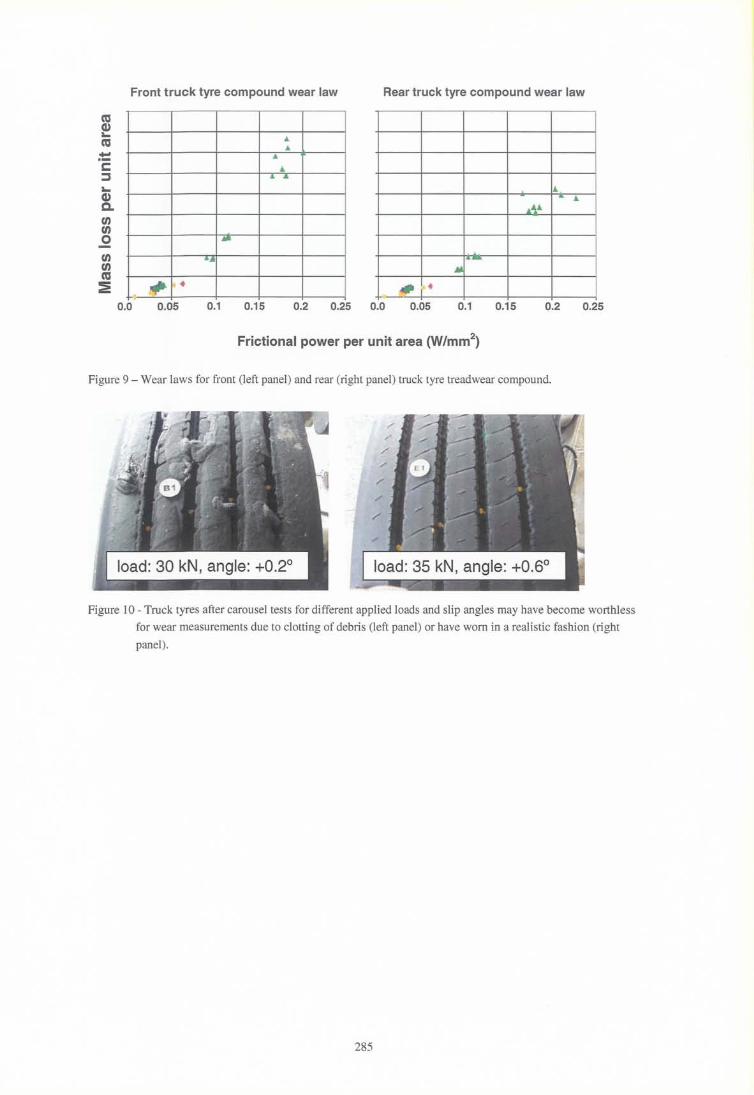
Tyre compound tests. Three different types of abrasion testing machines were used to study the wear of the truck
tyre tread compound. With these machines, similar compound material was tested under different local abrasive
regimes. It was found that comparison between the various results could be done by determining the wear (as mass
loss per unit contact area) as a function of frictional power per unit contact area. Figure 9 shows the combined
results of the tests on the three different machines, as obtained for two different types of truck front tyres and two
different types of truck rear tyres . At least two observations can be made from this figure. Firstly, it can be seen
that the wear - frictional power relation is non-linear. Secondly, comparison of the left and right panel shows that
the wear of the compound of the truck front tyre is similar to that of the compound of the rear tyres at lower values
of frictional power, but is about 50% at higher frictional power values.
Carousel tests. Figure 10 shows two tyres after wear tests on the carousel , for two different combinations of
applied load and slip angle. The left panel shows a commonly observed phenomenon for the carousel tests: a tyre
that has caught up worn rubber from other tyres in the same track or from previous rotations. This testing artefact
prohibits the construction of realistic slip-load-wear relationships to be used in tyre wear prediction.
The right panel in Figure 10 shows a tyre that was realistically worn. Although only the minority of the tyres used
on the carousel showed realistic wear behaviour, several satisfactory slip-load-wear relationships could be
constructed for them.
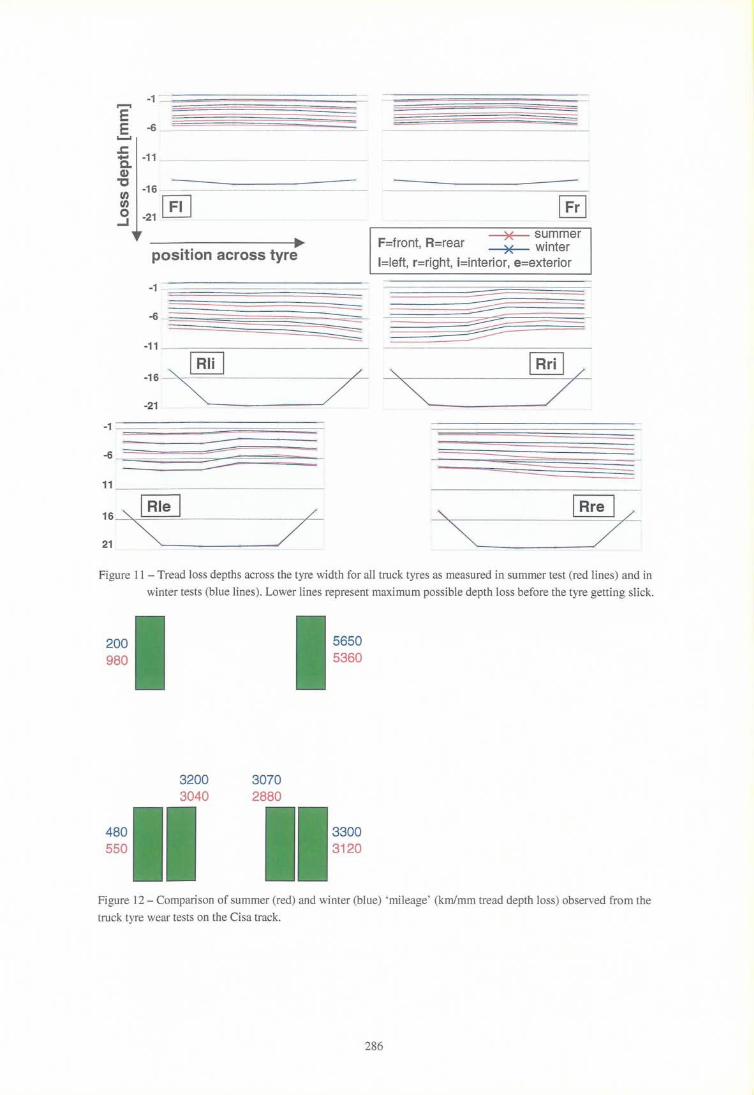
Driving on well-defined track of public roads.
Figure 11 shows the results of the tests on the Cisa track in terms of tread depth loss (in mm) as a function of
position across the tyre width. The figure shows a very high level of tread wear rate. The average truck tyre wear
rate on the Cisa track was about twice as high as that observed in the carousel tests and about four times higher
than reference levels. The wear profiles (wear rate across the tyre width) can be seen to be similar for the winter
(blue lines) and the summer tests (red lines).
Figure 12 shows a comparison of the observed summer (red) and winter (blue) 'mileage' in kmlmm tread depth
loss. It can be seen from this figure that the mileage was higher in the summer than in the winter tests. In other
words, the tyres have worn more in the summer than in the winter. The figure also shows that the left front tyre is
more worn than the right front tyre. As explained in the section on the general truck tyre tread wear phenomena,
this is due to the combination of the applied camber angle and the profile of the road (road banking). That section
also explains the observation that the internal rear tyres wear more than the external rear tyres, as well as the
observation from Figure 11 that the front tyres wear more on the sides than in the middle. Similarly, pairs of left or
right rear tyres wear more on the outside than in the middle, as can be seen from this figure.
Truck model validation results
Measured and computed eigenfrequencies up to 2 Hz were found to be within 15% accuracy and the time
responses for the manoeuvres were also represented sufficiently well. The maximum lateral acceleration during the
double lane change was approximately 3 mls2 whereas the lateral acceleration measured on the truck while driving
on the Cisa track was under 2 mls2 for 98% of the whole on-the-road test. The model therefore seems sufficiently
accurate for the calculation of hub forces as input of further tyre analyses.
280

CONCLUDING REMARKS AND FUTURE WORK
One of the goals of the TROWS project is to be able to predict tyre tread wear. The approach has been presented in
this paper as well as some measurements on truck tyres and their tread compounds. Also the vehicle modelling has
been touched upon briefly.
The tests on the Cisa track showed very high wear rates compared to the wear rates found in the carousel tests and
those found in reference tests. This means that the Cisa track can be regarded as much more aggressive to the tyres
than the average track to be expected in Italy. This is corroborated by the results of the passenger car tyre tests on
the Cisa track. They also showed much higher tread wear rates than found on average public roads.
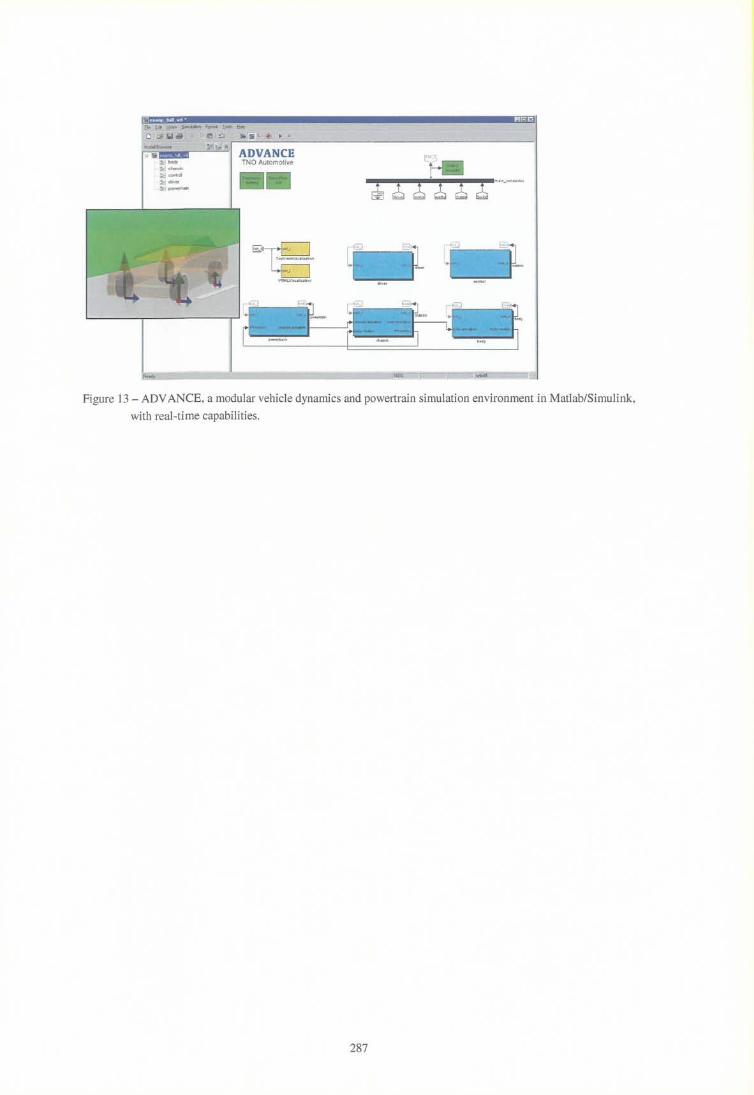
The usage of the current multi-body vehicle models built in ADAMS require a large computer time. By using the
TNO Automotive tool ADVANCE this computation time can be reduced significantly. ADVANCE is a tool
especially developed to assist in the design of vehicle intelligent systems and even contains capabilities for real
time simulations (see Figure 13). It is a tool box built on top of Matlab/Simulink, allowing full Matlab/Simulink
functionality, and contains predefined powertrain and chassis component models, controllers and driver models.
The chassis module contains among others wheel suspension models, steering system and tyre models. The
modelling capabilities are therefore sufficient to build efficient truck and passenger car models that fits perfectly in
the Prolinx environment.
The tyre modelling activities undertake in TROWS have not been presented in this paper. The current status is that
suitable models for the dynamic tyre behaviour as well as a contact patch discretisation have been realised and
validated as far as possible. The current attention is on the physical laws to be used in the contact patch analyses. A
crucial law is the compound wear law. In this paper some first results for a potentially promising relation between
frictional power and mass loss per unit area has been shown. The main focus of the last project year will be to
bring all models and data together to relate the various aspects efficiently in the Prolinx environment. This will
allow an effective evaluation of the different concept laws for the different experiments performed. If a reasonable
correlation is found, the Prolinx environment will be used for a further fine-tuning of the different building blocks
of the wear prediction process.
REFERENCES
[1] Veith, AG. A Review ofImportant Factors Affecting Treadwear, Rubber Reviews, 65 ,601 -658, 1992.
[2] Grosch, K.A, Abrasion of rubber and its relation to tire wear, Rubber chemistry and Technology, 65, 78-106,
March-April, 78-106,1992.
[3] Sueoka, A., Ryu, T., Kondou, T., Togashi, M., Fujimoto, T., Polygonal Wear of Automobile Tire, Trans. Jpn.
Soc. Mech. Eng., 62(600), 3145 - 3152,1997.
[4] Halen, I., Sainio, P., Lehtonen, T. , Assessment and monitoring of tyre wear testing, proceedings of the
FISITA 2002, Helsinki, June 2002.
ACKNOWLEDGEMENTS
The authors of this paper would like to thank the TROWS project partners for their contributions to this work. The
TROWS partners are: Centre d'Etudes Techniques de l'Equipement Lyon, France, Helsinki University of
Technology, Finland, Nokian Tyres P.l.c.,Nokian, Finland, Pirelli Settore Pneumatici, Milan, Italy, Politecnico di
Milano, Dipartimento di Meccanica, Milan, Italy, PSA Peugeot Citroen, France, University of Florence,
Department of Civil Engineering, Florence, Italy, VIAGROUP, Switzerland and the project coordinator TNO
Automotive, Delft, The Netherlands. The project falls under the European Union 5th framework, subprogramme
area Competitive and Sustainable Growth, and runs from 2000 till 2003. The authors would also like to
acknowledge dr. AG. Veith. Part of the introduction is taken from e-mail communication with him .
• Polimi
CETELyon ~ ~ HELS[t-llI.llIHI' EP..sln OFTECHUOl.OC\
Laboraton of Automot!\C" EnelneenI1[;
281
PSA PEUGEOT CITROEN
Viagroup
FIGURES
model-based
calculations
tyre motion, contact forces
and slip
experiment-based
measurements
compound tests
tyre tests
"wear law" (2) relative wear
with respect to reference course
Figure 1- TROWS workflow for tyre wear assessment, modelling and prediction.
' ~ UNIFI_TyreWorkll-;;;'':-Prolinll ------ -~------------------ ------- ---- I!lIilEJ file :::!iew Iransformer Message Log lielp
~liiiI l . ~%~ ~ ~~ 1 El- CISA tyre work calculation
j. Cl SA database , .. - Data selection
. Parameters , .... Preprocessor , . Aggressivity model ... Postprocess
CISA tyre work calculation
creator
version
date
TNO Automotive 1 .0 041'1212001
Description
CISA circu~ section tyre work calculations
Sub blocks
name CISA database Data selection Parameters
type tfuser tfmatlabengine tfmatlabengine
Show and change the data URL for the selected pin
Restore ink
Revert to saved
S et up-to-date
Figure 2 - A view on the Prolinx environment developed to predict tyre and road wear in a structured and weIl
documented fashion.
282
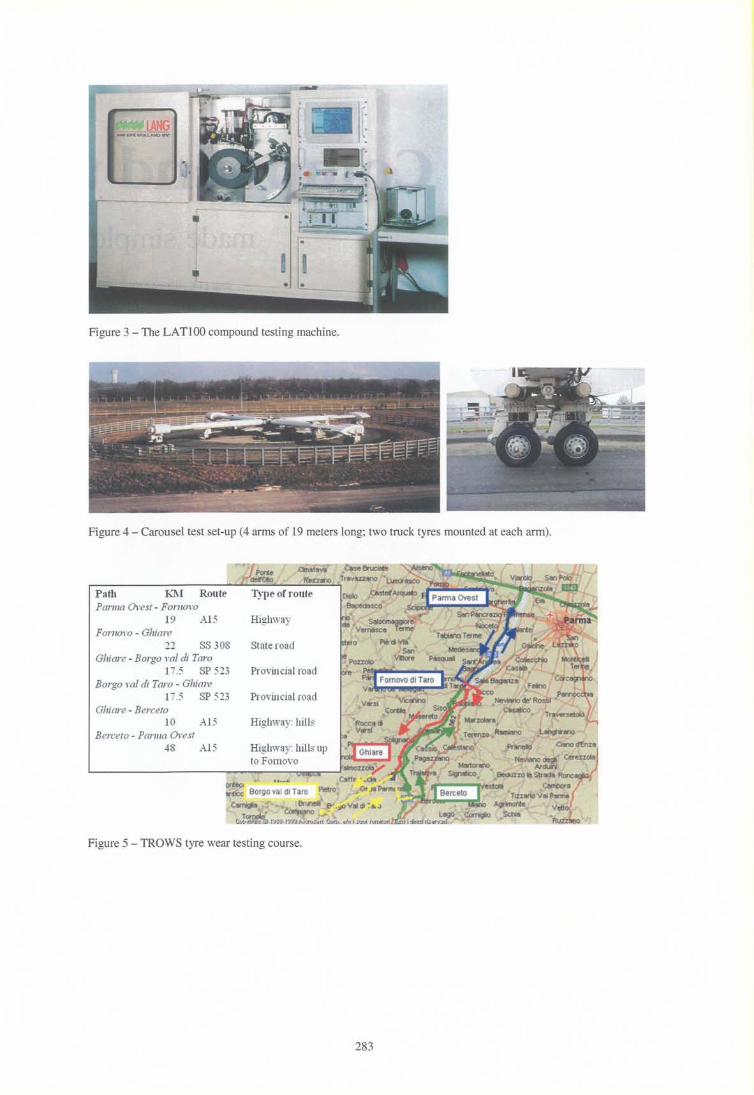
Figure 3 - The LA T1 00 compound testing machine.
Figure 4 - Carousel test set-up (4 arms of 19 meters long; two truck tyres mounted at each arm).
Path KM Route POJ1lla O,.es! - Fonlol'o
19 A 15 Fomol"O - Ghiore
22 SS 308 Ghiare - Borgo 1"01 di Toro
1 .5 SP 523 Borgo ml di Taro - Ghio1"e
17.5 SP 523 Ghiare - Berceto
10 A15 Berceto - Pcu·11Ia Orest
-1-8 A1 5
Type of route
Highway
State road
Provincial road
Provincial road
Highway: hills
Highway: hills lip to FOl1lovo
prt~ ......... Borgo val dl Taro
Figure 5 - TROWS tyre wear testing course.
283
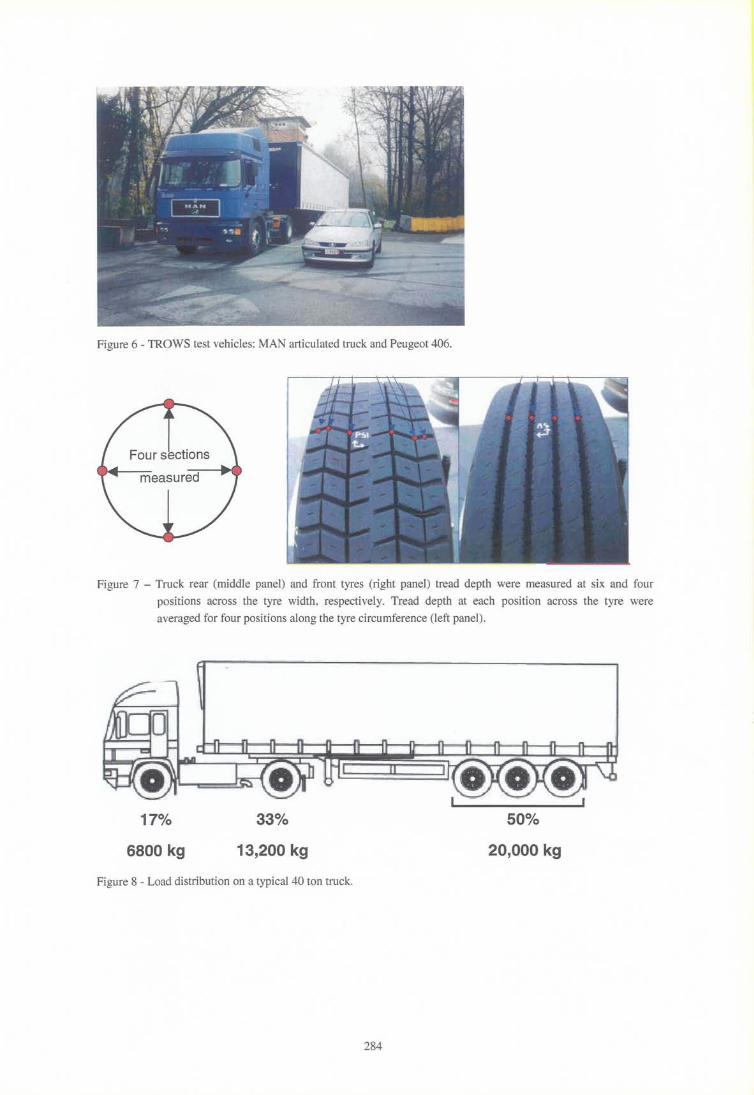
Figure 6 - TROWS test vehicles: MAN articulated truck and Peugeot 406.
Four sections
measured
Figure 7 - Truck rear (middle panel) and front tyres (right panel) tread depth were measured at six and four
positions across the tyre width, respectively. Tread depth at each position across the tyre were
averaged for four positions along the tyre circumference (left panel).
170/0 33% 500/0
6800 kg 13,200 kg 20,000 kg
Figure 8 - Load distribution on a typical 40 ton truck.
284
Front truck tyre compound wear law Rear truck tyre compound wear law
.. .. .. .. & .& ..
... i..
.. ~i..
-.... I--M .,. •
: 4' I ·
0.0 0.05 0.1 0.15 0.2 0.25 0.0 0.05 0.1 0.15 0.2 0.25
Frictional power per unit area (W/mm2)
Figure 9 - Wear laws for front (left panel) and rear (right panel) truck tyre tread wear compound.
Figure 10 - Truck tyres after carousel tests for different applied loads and slip angles may have become worthless
for wear measurements due to clotting of debris (left panel) or have worn in a realistic fashion (right
panel).
285
E-1~~~ E -6~ ........
..c: ~ -11 ____________________________ _
Cl) "C o -16 -----------------------------
~ -21 [ill
position across tyre
-11
-16
-21
"-[BIT] ~
/ ~--7~
-1~~~~~~~~~ ~--~----------~' ----~----
-6~~~~==-- - -------11 ____________________________ _
::~'__=e:1 ========-7-----/-/-
~summer F=front, R=rear )( winter
1=left, r=right, i=interior, e=exterior
~ ____ 7
. ,7 ---- -----------------.
Figure 11 - Tread loss depths across the tyre width for all truck tyres as measured in summer test (red lines) and in
winter tests (blue lines). Lower lines represent maximum possible depth loss before the tyre getting slick.
200 980
480 550
3200 3040
3070 2880
5650 5360
3300 3120
Figure 12 - Comparison of summer (red) and winter (blue) 'mileage' (km/mm tread depth loss) observed from the
truck tyre wear tests on the Cisa track.
286
2 Ji1 ;!tj bocjy t!:I chMm ~ COf'lI;,oI
;ltj dlw.. ~ powertroer.
TNO Automotive
~_J
- T opVit.WI.I!suallYtlol'l
onJ
V RML.Visu . U:Jtio n
Figure 13 - ADV ANCE, a modular vehicle dynamics and powertrain simulation environment in Matlab/Simulink,
with real-time capabilities.
287

288