trigger monitoring at atlas l2sv rod rod rod ~4 gb/s 120 gb/s calo/mu trigdet other detectors 1 pb/s...
TRANSCRIPT

ATL
-DA
Q-S
LID
E-20
09-2
9630
Sept
embe
r20
09
Trigger Monitoring
at ATLAS
Antonio SidotiHumboldt Universität zu Berlin
on behalf of the ATLAS TDAQ Collaboration
ICATPP09Como
Outline:
The ATLAS Trigger system and DAQ
The Online Monitoring Framework
First experience with real data

06/10/2009 ICATPP-Como09 2
The ATLAS Trigger System
75 kHz
~2 kHz
~200 Hz
40 MHz
2.5 µ s
~300 MB/sEvent Size ~1.5 MB
Pipelines
EF Acc.
RoI
R
RoI data requests
Highly Distributed System
In 2009:27 Racks for L2 and EF~800 nodes (8 cores/node)1/3 of full system
Muon Trigger
CaloTrigger
CTP
LVL1
H
L
T Event FilterEFP
EFPEFP
LVL2
L2PL2NL2P
L2P
L2SVRoIB
ROD ROD ROD
~4 GB/s
120 GB/s
Calo/Mu TrigDet Other detectors
1 PB/s
EFN
EB
Event Builder
ROB ROB ROB
ROS
LVL2 Acc.
LVL1 Acc.
• Level 1– Hardware based– Coarse granularity calorimeter and
muons – Identifies Region of Interest (RoI)
• High Level Trigger (HLT)– Level 2 and Event Filter PC farm– Algorithms reconstruct physical
quantities– Monitored physics reconstructed
variables– Trigger chains organized in
“physics slices”• Level 2 (L2)
– Full detector granularity in RoIs– Special fast algorithms
• Event Filter (EF) – Full event available– Full detector granularity– Offline-quality algorithms
cf K.Kordas' talk

06/10/2009 ICATPP-Como09 3
Data
Flo
w/L
VL1/H
LT
Event Analysis Frameworks
Information Service (IS/OH)
Data QualityMonitoring Framework
Archiving Service
Visualization Tools
Web Service
Online Monitoring Framework
Increase data taking efficiencyprevent/understand conditions that stop data takingMaximize: ATLAS Recording time/LHC beam time
Increase physics efficiencyRecorded data good for physics?Maximize: ATLAS events good for physics/ATLAS recorded events
Display, Monitor and Analyze:Operational Data from TDAQ componentsEvent content and histograms produced
Monitoring during TDAQ Commissioning (now and first weeks of collisions)
06/10/2009 ICATPP-Como09 4
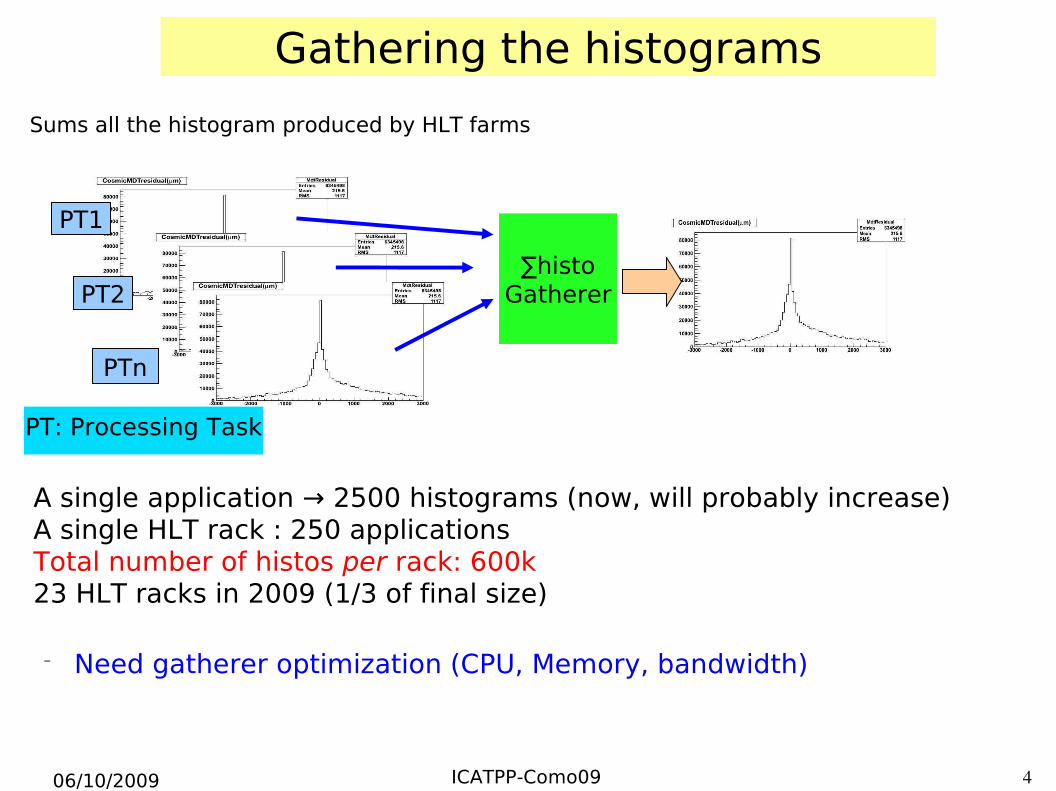
A single application 2500 histograms (now, will probably increase)→A single HLT rack : 250 applicationsTotal number of histos per rack: 600k23 HLT racks in 2009 (1/3 of final size)
− Need gatherer optimization (CPU, Memory, bandwidth)
PT1
PT2
PTn
∑histoGatherer
PT: Processing Task
Gathering the histograms
Sums all the histogram produced by HLT farms

06/10/2009 ICATPP-Como09 5
Graphical Applications Online Histogram Presenter: Interactive presenter displaying histograms stored in IS/OH:
Large number of histograms to display
Possible to interact with histograms (zoom,
fit, log/lin scale, etc...)
Minimize network traffic via a subscription
mechanism: process is informed when the
histogram is published or updated
Sophisticated cache mechanism
Manage reference histograms
Configurable with XML
“visual check” by Atlas Control Room shifters (main shifter tool)Histograms are organized in Physical Slices (electron/gamma, muon, jets,...)
(

06/10/2009 ICATPP-Como09 6
OHP
40k Histos Received
Supports hierarchy of tabs which contains predefined set of histogramsReference histograms can be displayed as wellSub-systems have several tabs with most important histos which have to be watched
Shifter Oriented Tool
Trigger chains of common interest regrouped in slices

06/10/2009 ICATPP-Como09 7
Operational Monitoring Display Displays quantities in IS in time series, bar charts, tables or distributionsCalculate basic statistics (sum, thresholds, averages, ...)Publishes back in OHPConfigurable via Drag'n Drop approach
→ RunTime Mostly used to monitor L2 and EF farms
Two possibile display levels:Expert and User
06/10/2009 ICATPP-Como09 8
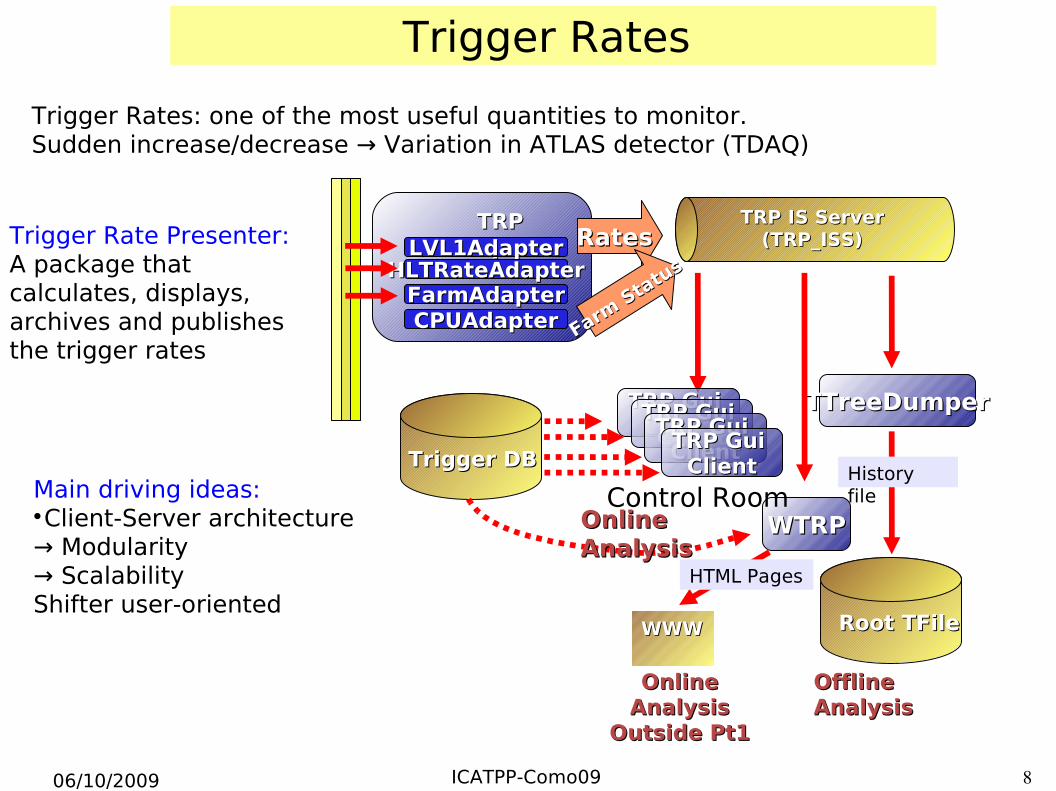
Trigger Rates
Trigger Rate Presenter:A package that calculates, displays, archives and publishes the trigger rates
TRP TRP AdaptersAdaptersLVL1AdapterLVL1Adapter
HLTRateAdapterHLTRateAdapterFarmAdapterFarmAdapterCPUAdapterCPUAdapter
Trigger DBTrigger DB
TTreeDumperTTreeDumper
WTRPWTRP
TRP IS Server TRP IS Server (TRP_ISS)(TRP_ISS)RatesRates
Farm Sta
tus
Farm Sta
tus
Control Room
TRP Gui TRP Gui ClientClientTRP Gui TRP Gui
ClientClientTRP Gui TRP Gui ClientClientTRP Gui TRP Gui
ClientClient
Root TFileRoot TFile
History file
Online Online AnalysisAnalysis
Offline Offline AnalysisAnalysis
WWWWWW
HTML Pages
Online Online AnalysisAnalysis
Outside Pt1Outside Pt1
Trigger Rates: one of the most useful quantities to monitor.Sudden increase/decrease Variation in ATLAS detector (TDAQ)→
Main driving ideas:Client-Server architecture
→ Modularity → Scalability
Shifter user-oriented

06/10/2009 ICATPP-Como09 9
Servers perform CPU intensive rate calculation
Trigger Rate Presenter
Level1 Tab
Level1
Ite
ms
Rates
Prescales
Clients:GUI showing timetrends and values in tablesArchiver tool (in Root file)Web factory for html pages

06/10/2009 ICATPP-Como09 10
Data Quality Monitoring Framework
Automatic checks on produced histogramsMany predefined algorithms for checks (e.g. non empty histograms, mean and RMS values, fitted parameters, KS test wrt reference histograms)
→ Also user defined checksOutput: A Data Quality flag: available in realtime to the shifter recorded in the Conditions DB

06/10/2009 ICATPP-Como09 11
Data Quality DisplayGeneral ATLAS tool Trigger specific “tab”→Results of checks build Data Quality Flags for Trigger
One flag per Trigger sliceConfiguration based on XML filesDifferent configuration for different Run conditions (Cosmics, Beam, Single Beam, Early Beam) Color code indicates the status of each slice:
okok, , warningwarning, , badbad, , undefined, undefined, disableddisabledDQMF duplicated in Tier0 and specific farms for quick offline monitoring

06/10/2009 ICATPP-Como09 12
ATLAS Remote Monitoring
RM User RM Technology
Public community Web Monitoring Interface
Remote shifters Copy monitoring data in quasi real-time mode from ATLAS network to dedicated machines in CERN GPN
ATLAS_Mirror Partition
Remote experts Secure log-in by request of Shift Leader

06/10/2009 ICATPP-Como09 13
Web Monitoring Interface Periodically generates HTML
pages with monitoring information.
− Information shown is fixed and coded in the plugin
→ non-expert oriented tool
3 plug-ins are currently used at P1:
Run Status Data Quality Trigger Rates (from
TRP)− Referenced from the
ATLAS Operation page:• http://pcatdwww.cern
.ch/atlas-point1/operation.php

06/10/2009 ICATPP-Como09 14
Links to other pages (same on all pages)
Global rates (on all pages)
Time stamps of latestTRP update (all pages)
T
Rate history forlast 24 hours
Rate history forlast ½ hour
Status History
Log
06/10/2009 ICATPP-Como09 15
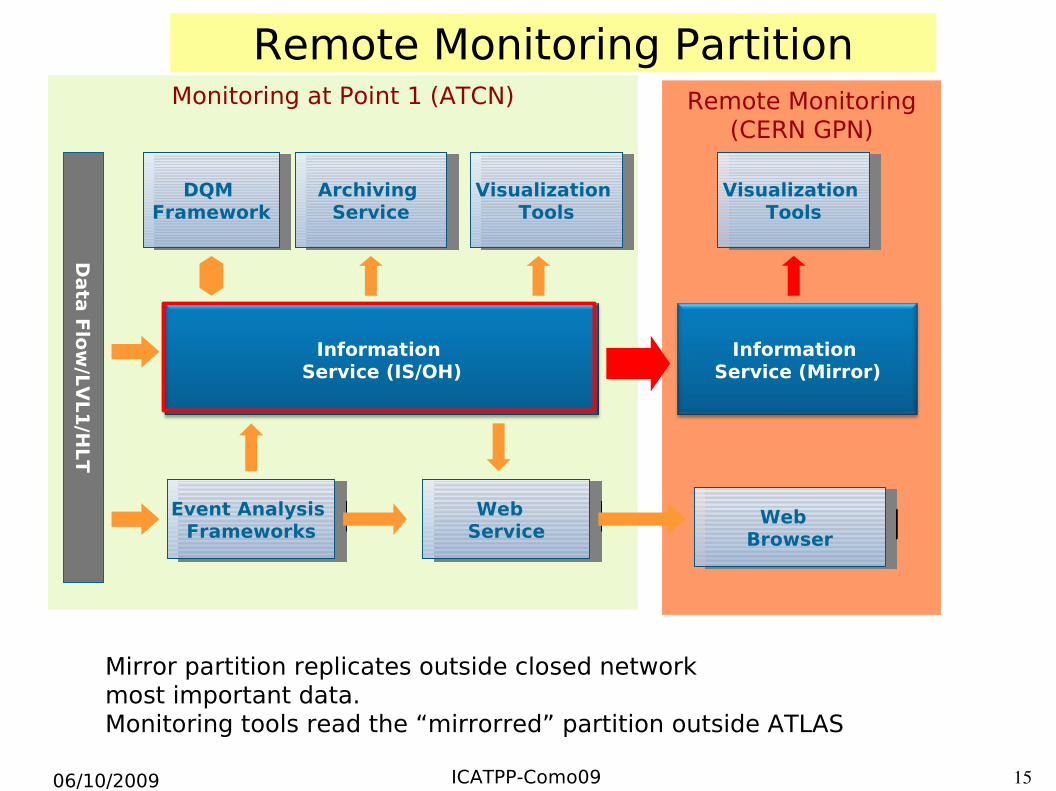
Remote Monitoring PartitionMonitoring at Point 1 (ATCN)
Data
Flo
w/L
VL1/H
LT
Event Analysis Frameworks
Information Service (IS/OH)
DQM Framework
Archiving Service
Visualization Tools
Web Service
Remote Monitoring(CERN GPN)
Information Service (Mirror)
Visualization Tools
Web Browser
Mirror partition replicates outside closed network most important data.Monitoring tools read the “mirrorred” partition outside ATLAS
06/10/2009 ICATPP-Como09 16
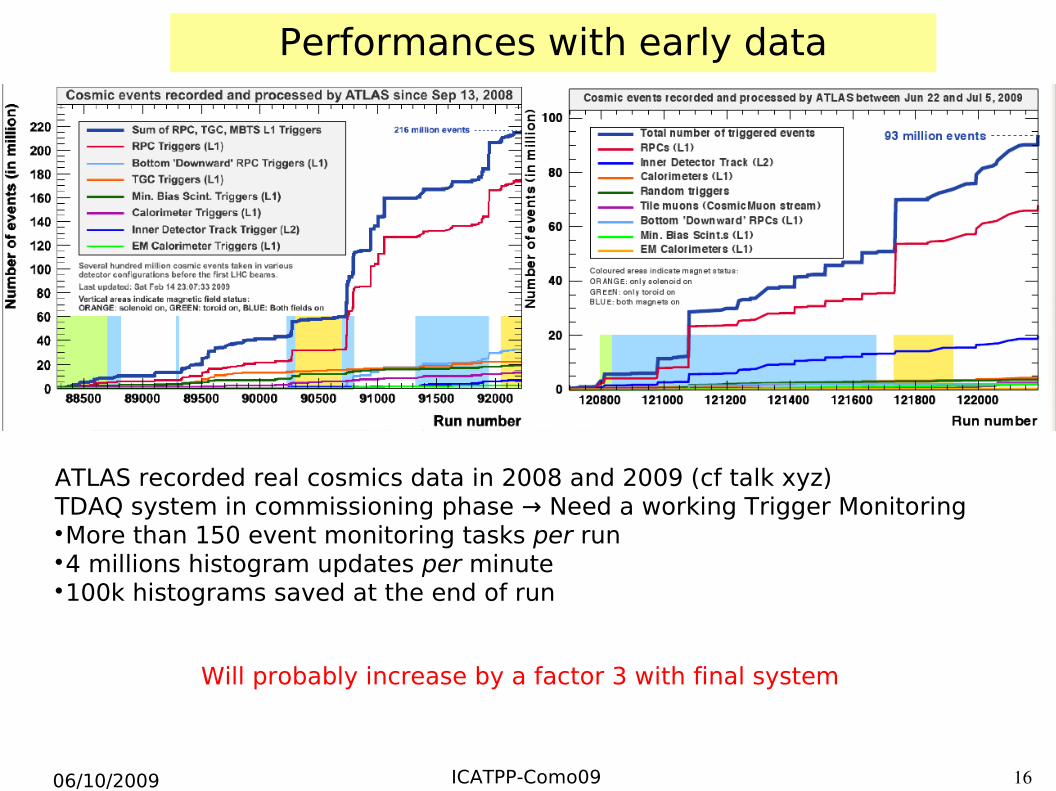
Performances with early data
ATLAS recorded real cosmics data in 2008 and 2009 (cf talk xyz)TDAQ system in commissioning phase Need a working Trigger Monitoring→More than 150 event monitoring tasks per run4 millions histogram updates per minute100k histograms saved at the end of run
Will probably increase by a factor 3 with final system
06/10/2009 ICATPP-Como09 17
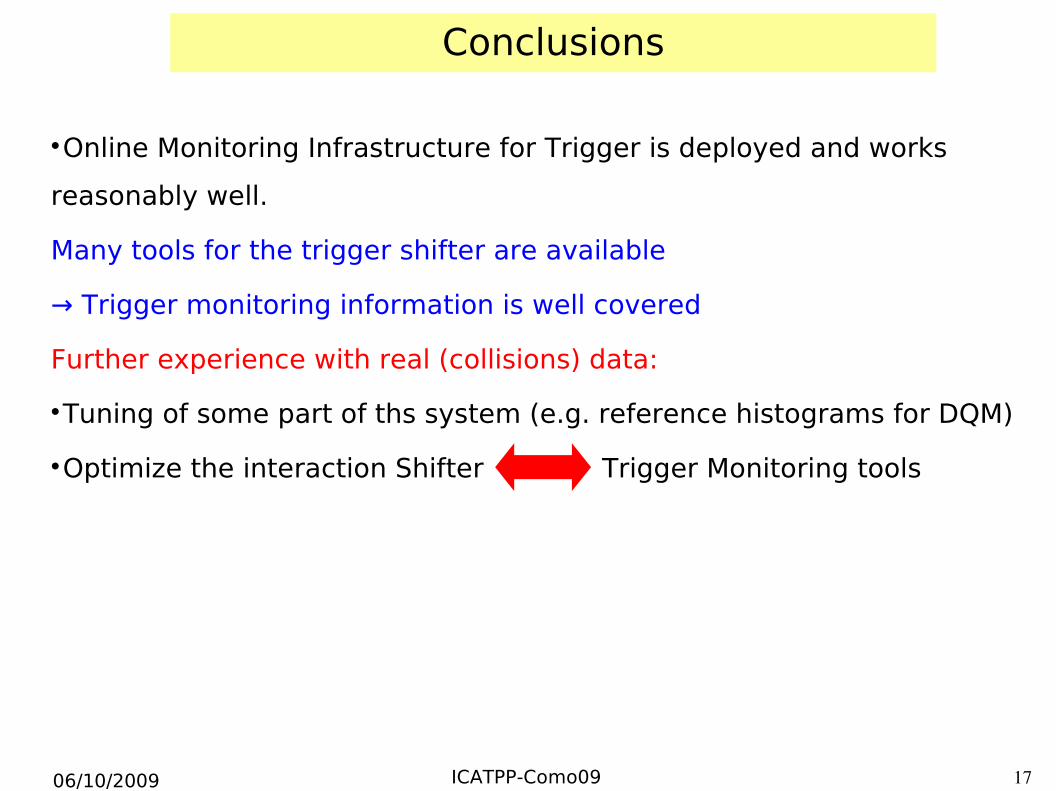
Conclusions
Online Monitoring Infrastructure for Trigger is deployed and works
reasonably well.
Many tools for the trigger shifter are available
→ Trigger monitoring information is well covered
Further experience with real (collisions) data:
Tuning of some part of ths system (e.g. reference histograms for DQM)
Optimize the interaction Shifter Trigger Monitoring tools
06/10/2009 ICATPP-Como09 18
BackUp

06/10/2009 ICATPP-Como09 19
The ATLAS Detector at LHC

06/10/2009 ICATPP-Como09 20
Level-1Trigger: Provided by Calorimeters (EM and HAD) and Muon Spectrometer (RPC and TGC). Coarse grained granularity. Selects Regions of Interests (RoI) and identifies Bunch Crossing (BC)
Level-2 Trigger: Access data in selected RoI.Fine grained granularity. Combination with other subdetectors, (e.g. ID Tracker)
Event Filter: Access full event with full granularity
The ATLAS Trigger System

06/10/2009 ICATPP-Como09 21
Offline Trigger Monitoring-CAF
CAF is a pool of reserved (ATLAS trigger) PCs (8 multicore) in the lxbatch systemAccess to several castor pools with dedicated disk servers (also RAW data)Run users' jobs.
As soon as data will start to flow less idle time on CAF→
2 weeks of cosmics data taking June-July
06/10/2009 ICATPP-Como09 22
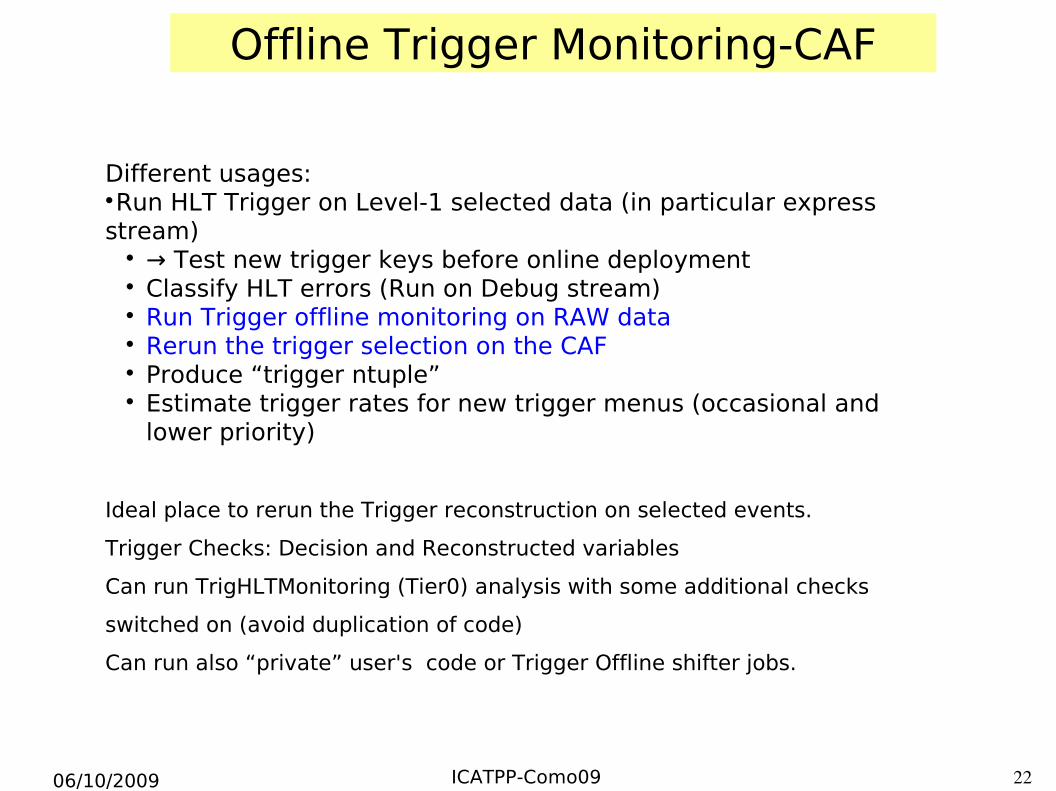
Offline Trigger Monitoring-CAF
Different usages:Run HLT Trigger on Level-1 selected data (in particular express stream)
→ Test new trigger keys before online deployment Classify HLT errors (Run on Debug stream) Run Trigger offline monitoring on RAW data Rerun the trigger selection on the CAF Produce “trigger ntuple” Estimate trigger rates for new trigger menus (occasional and
lower priority)
Ideal place to rerun the Trigger reconstruction on selected events.
Trigger Checks: Decision and Reconstructed variables
Can run TrigHLTMonitoring (Tier0) analysis with some additional checks
switched on (avoid duplication of code)
Can run also “private” user's code or Trigger Offline shifter jobs.

06/10/2009 ICATPP-Como09 23
OHP Architecture Details

06/10/2009 ICATPP-Como09 24
OHP

06/10/2009 ICATPP-Como09 25
Monitoring Tools in ATLAS TDAQ
Reelaborate inserting L2 and IS

06/10/2009 ICATPP-Como09 26
Remote Monitoring approach TDAQ Monitoring Working Group proposed and evaluated the following solution:
− Run mirroring copy of the basic configuration and monitoring infrastructure services outside P1
− Remote users can run the standard ATLAS Control Room X sessions on some dedicated machines outside P1
26
ATCN
ATLAS Partition
CERN GPN
Mirror Partition
CERN GPN
Remote X sessions
Remote Site
06/10/2009 ICATPP-Como09 27
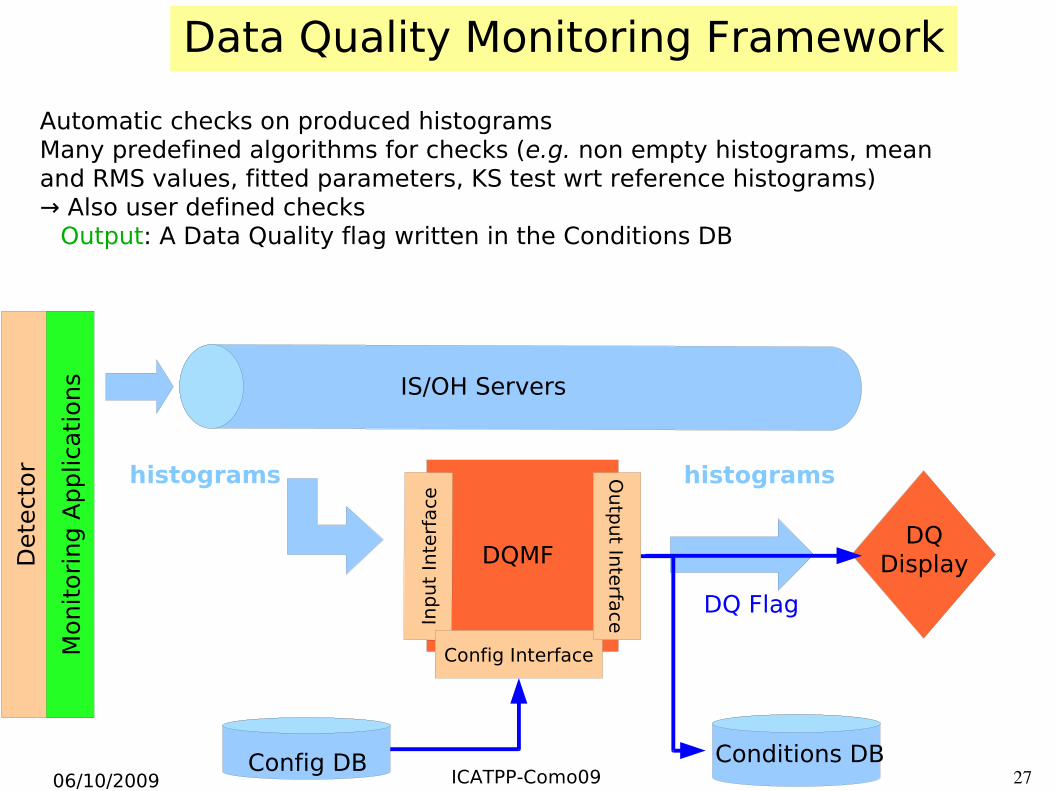
Data Quality Monitoring Framework
Automatic checks on produced histogramsMany predefined algorithms for checks (e.g. non empty histograms, mean and RMS values, fitted parameters, KS test wrt reference histograms)
→ Also user defined checksOutput: A Data Quality flag written in the Conditions DB
Dete
ctor
Monit
ori
ng A
pplic
ati
ons
histograms
IS/OH Servers
Inp
ut
Inte
rface
Config Interface
Ou
tput In
terfa
ce
DQMF
Config DB Conditions DB
DQ Flag
DQDisplay
histograms