transportation trends in manitoba 2001 - university of manitoba
TRANSCRIPT

TRANSPORTATION TRENDS IN MANITOBA
University of Manitoba Transport Institute
Dr. Barry E. Prentice J. Jurgens Bekker Meyer D. Lapkin
July 2001

i
INTRODUCTION Large amounts of data are collected with regard to transportation. Like the nature of the industry, it has been quite spread out in all manner of publication. Our purpose is to create a comprehensive Manitoba transportation data set. Decision makers would then have all statistics specifically dealing with Manitoba's transport industry in one place for easy reference. Cutbacks at the federal level of government have forced the aggregation of data for the three Prairie Provinces. As Alberta's economy has grown this tendency has caused a distortion in the merged provincial data. Where possible we have addressed this issue, but in some cases it is impossible to do so. This is the Transport Institute’s initial effort to publish an all-encompassing report on transportation in Manitoba. The database that forms the foundation of this report was initiated and developed by the Transport Institute in 1996 and has been updated annually. The potential value of a regularly updated database to the Manitoba transport and related industries was acknowledged by The Manitoba Government Department of Transportation and Government Services and prompted the publication of this first report. The data generally spans a 15-year time horizon. Over this period some of the data series were adjusted in the primary source and consequently in the database. Readily available explanations of recent changes in data collection techniques or presentation of data is explained where possible. Hence, some data changes in earlier years were not always explained and might limit the comparability of time series data. In general, and wherever possible, data series that were altered by the source agency were updated as far back as 1995. The objective of this report is to create a valuable resource that can act as a reference source to the Manitoba transport sector. In pursuance of this objective this report also serves to identify gaps in data series or in the presentation of data that limits its value. Stakeholders range from provincial and local administrations involved with infrastructure planning of all modes to operators involved in specific modes of transport only. It is an ambitious project to address the interests of an entire sector. Inevitably the value of each section of the report will vary for different users. No previous editions of this or any similar report could be used as a benchmark to guide compilation. This report should be seen as a “work in progress”. Suggestions to enhance its value as a reference source are invited. Future editions could benefit greatly from feedback by readers and we invite your comments.
ii
EXECUTIVE SUMMARY Manitoba’s Economy The Manitoba economy grew from $19.6 billion in 1984 to $25.2 billion in 1999. At the same time the Canadian national economy grew from $508 billion to $753 billion (values are in 1992 constant dollars). This represents average annual provincial and national growth rates of 1.7 percent and 2.7 percent respectively over this period. This period of slow growth was not as severe on a national basis as it was for Manitoba. Consequently, the contribution by Manitoba to the Canadian gross domestic product (GDP) has declined substantially over this period, although some turnaround is evident in recent years, notably 1996 and 1997. In Manitoba the transportation and storage industry (1999: $1.7 billion) is significantly larger than the transportation and equipment industry (1999: $651.3 million) and has a less volatile growth rate, but both industries had more volatile growth rates than the total provincial economy. During 1999 the Manitoba transportation equipment industry grew by 6.1 percent and the transportation and storage industry by 3.0 percent. In relative terms the Manitoba economy is more concentrated in the transportation and storage industry than is the Canadian economy as a whole. Manitoba total export earnings grew significantly from $3.0 billion in 1990 to $8.0 billion in 1999. In 1999 vehicles, aircraft and associated transport equipment replaced vegetable products as the top export earner. Manitoba total payment for imports increased from $3.2 billion in 1990 to $8.2 billion in 1999. Machinery, mechanical and electrical appliances and equipment was the largest import category. In 1999 the manufacturing industry was the largest contributor to export earnings at $5.3 billion, followed by agriculture at $1.5 billion, mining at $540.1 million and the electric power industry at $343.0 million. The leading importing industry by value for 1999 was manufacturing at $7.8 billion followed by agriculture at $222.5 million. Surface Transport Data on the surface movement of commodities indicates steady growth in total tonnes and tonne-km in the southbound movement of commodities by for-hire trucking in Canada-USA trade since 1992. A sharp rise in the northbound movement of goods from the USA to Canada by for-hire trucking is noted for 1999. The bulk of southbound goods by rail from Manitoba to the US moved to the North-central US region. In 1998, 3.3 million tonnes or 78 percent were moved from Manitoba to the US North-central region from a total of 4.3 million tonnes that were moved to all regions. The northbound movement of goods by rail from US regions of origin to Manitoba reached nearly 1 million tonnes in 1998. The relative share of northbound

iii
goods from the North-central region declined over the review period, while the share of other regions increased. For the larger part of the review period the greatest share of total railway freight from Manitoba to provincial destinations consisted of marine exports. Marine exports, however, have been declining over time and by 1994 railway freight to Ontario as the final provincial destination surpassed the marine exports category. By 1998 the total railway freight from Manitoba to destinations were 7.9 million tonnes. The US was the only destination that showed an annual increase in 1998. In 1998, 4.4 million tonnes of freight were railed to Manitoba from provincial origins. The highest growth rates in latter years were recorded in the US by rail category, which grew 147 percent from 1996 (328,000 tonnes) to 1998 (811,000 tonnes). In 1997 an estimated 68 top for-hire carriers of freight in Canada had an annual operating income in excess of $25 million, 2,031 medium and large carriers had annual operating incomes ranging from $1 million to $25 million, and 7,745 small carriers as well as 40,221 owner operators had an annual operating income of less than $1 million dollars. Medium and large carriers were the category operating the most equipment at 138,847 units followed by owner operators with 89,182 units. Semi-trailers were the most abundant equipment type at 188,665 units, followed by road tractors at 94,878 units. The 226 Manitoba small for-hire carriers of freight reporting in 1997 utilised 1,237 units of equipment and their operating ratio was 96 percent. The 2,002 Manitoba owner operators reporting in 1997 utilized 4,219 units of equipment and their operating ratio was 93 percent. Prior to 1994, semi-trailers and full-trailers made up the bulk of equipment. After 1994 the bulk of equipment was made up of approximately equal amounts of semi- and full-trailers as well as road tractors. Three weight groups dominate tonne-km estimates for medium to top for-hire carriers in Canada. Over the period under review either the 20,000 to 29,999 kg or the 30,000 to 44,999 kg category ranked highest. Only in 1989 did the 10,000 to 19,999 kg weight group manage to surpass the 30,000 to 44,999 kg category for second place behind the 20,000 to 29,999 kg weight group. The 226 carriers reporting in Manitoba in 1997 had 1,365 persons employed with small for-hire carriers and 118 as owner operators. Also, the Manitoba labour markets in small (Level III) for-hire carriers as well as the owner operator sectors were more volatile than the equivalent parameters for Canada. During the period 1986 to 1999 total employment in Manitoba grew by 44,000 from 499,000 to 543,000; an increase of 8.8 percent. National total employment grew 2.6 million from 11.9 million to 14.5 million, or 21.3 percent for the same period. The trend in Manitoba employment as a share of total Canadian employment declined, as did for-hire trucking employment as a share of total Manitoba employment. In Manitoba the bulk of vehicles are registered for non-commercial use. The total number of non-commercial vehicles declined. Commercial registered vehicles increased for the

iv
review period. The overall increase from 1986 to 1999 in total registered commercial vehicles in Manitoba after cancellations was 23,643 units or 61 percent. Public Transit Winnipeg Transit System revenue vehicle kilometres in 1999 were 22.2 million, regular service passenger trips were 38,553, total operating cost was $80.5 million, total revenue was $47.6 million and regular service passenger revenue was $44.7 million. Operating revenue was 97 percent of total revenue and the share of non-regular service passenger revenue has increased. Non-operating revenue implicitly grew at higher rates than operating revenue. The strongest growth of the decade in intercity bus travel is noted for the category Canadian residents from USA to Manitoba by bus. The number of travelers increased by 153 percent (1991: 45,100; 2000: 114,200). In the year 2000 a total of 1.41 million Canadian passengers traveled from the USA by bus. The numbers of USA bus travelers to Canada and Manitoba display different trends than those noted for Canadian residents. The number of USA passengers to Canada by bus rose 37 percent for the decade from 1.4 million in 1991 to 1.9 million in 2000. The share or proportion for the category of Canadian bus travelers from USA to Manitoba as a percentage of total Canadian travelers from USA to Manitoba (i.e. all modes) shows an increase of 352 percent (1991: 2.1 %; 2000: 9.5 %). This is a larger increase than the growth in absolute number of Canadian residents from the USA to Manitoba by bus. The share of Canadian travelers from the USA to Canada by bus increased from 1.7 percent in 1991 to 3.3 percent in 2000. This share increase of 91 percent once again is larger than the growth in absolute numbers. Air Transport In 1997 3.4 million passengers enplaned/ deplaned in Manitoba. Domestic enplaned/ deplaned passengers formed the largest category with 3.0 million passengers or 88 percent. The lowest number of 2.05 million domestic passengers (88 % share of total) occurred in 1991, but the lowest share of 84 percent domestic passengers (2.11 million passengers) happened in 1994. Major scheduled services remained the predominant service type throughout the review period. Major scheduled services increased by 15.1 percent whilst regional and local scheduled services declined by 21.8 percent over this same period. Trends over the review period suggest that discounted airfare was expanding at the expense of business and economy classes. In the year 2000 a total of 2.4 million domestic passengers enplaned/ deplaned at Winnipeg International Airport, the same total as for 1999. However, in 2000, charters comprised a larger share of domestic passengers at 4.4 percent as opposed to the 1.1 percent for 1999. Passenger movement by charters spiked in 1996 and 1997 to 185 percent and 327 percent over the preceding high of 200,200 passengers in 1995. In the year 2000 a total of 156,000 aircraft movements occurred. The period 1993 to 2000 reveals some interesting observations such as decreasing local aircraft movements and increasing itinerant aircraft movements.

v
In 1999 a total of 168,470 passengers were moved at 22 northern Manitoba airports under provincial authority. Throughout the entire review period Island Lake was the busiest airport in terms of passenger movement. As of 1994 Island Lake showed strong growth in cargo movement and distinguished itself as the first ranked northern Manitoba provincial airport in cargo movement. Pipelines In Manitoba pipelines are used for transmission and distribution. Gathering is not a pipeline function in Manitoba. Both transmission and distribution lines increased approximately 40 percent over the review period. Most of this expansion occurred during the latter half of the 1990’s. In 1999 4,200 kilometres of transmission lines and 6,000 kilometres of distribution lines were in place in Manitoba. The increase in total gas exports to the USA from Manitoba has increased phenomenally from 4.2 billion cubic metres in 1986 to 13.9 billion cubic metres in 1999, a more than 3 fold increase. More than 99 percent of gas exports to the USA were piped along the Emerson line.

vi
TABLE OF CONTENTS Page INTRODUCTION
i
EXECUTIVE SUMMARY
ii
TABLE OF CONTENTS
vi
LIST OF TABLES
vii
LIST OF FIGURES
xi
LIST OF APPENDICES
xiv
ACKNOWLEDGEMENTS
xv
CHAPTER 1: TRADE AND COMMODITY MOVEMENTS
1
1.1 GROSS DOMESTIC PRODUCT, EXPORTS AND IMPORTS 1 1.2 SURFACE COMMODITY MOVEMENTS 21
1.2.1 Truck 1.2.2 Rail
21 34
CHAPTER 2: HIGHWAY TRANSPORTATION
51
CHAPTER 3: RAILWAY TRANSPORTATION
88
CHAPTER 4: URBAN AND INTERCITY TRANSPORTATION
95
4.1 URBAN TRANSPORTATION 95 4.1.1 Public Transportation 4.1.2 Taxi Industry 4.1.3 School Bus Transport
95 119 123
4.2 INTERCITY TRANSPORTATION
125
CHAPTER 5: AIR TRANSPORTATION
130
CHAPTER 6: PIPELINES
159
APPENDIX I 171 APPENDIX II 174 APPENDIX III 184

vii
LIST OF TABLES CHAPTER 1 Table 1.1 Manitoba and Canada Real Gross Domestic Product at Factor Cost. Table 1.2 Manitoba Exports by Section and Chapter. Table 1.3 Manitoba Imports by Section and Chapter. Table 1.4 Manitoba Exports by Industry. Table 1.5 Manitoba Imports by Industry. Table 1.6 Manitoba Agricultural Exports by Regions and Major Countries. Table 1.7 Manitoba Non-Agricultural Exports by Regions and Major Countries. Table 1.8 Manitoba Total Exports by Regions and Major Countries. Table 1.9 Manitoba Total Imports by Regions and Major Countries. Table 1.10 For-hire Trucking, Estimated Transport Revenues, Tonnage, Tonne-
Kilometres and Number of Shipments on the Movement of Goods from Province or Territory of Origin to Manitoba.
Table 1.11 For-hire Trucking, Estimated Transport Revenues, Tonnage, Tonne-Kilometres and Number of Shipments on the Movement of Goods from Manitoba to Province or Territory of Destination.
Table 1.12 For-hire Trucking, Southbound Movement of Goods from Manitoba to US Regions.
Table 1.13 For-hire Trucking, Southbound Movements of the Top Five Commodities from Manitoba to USA.
Table 1.14 For-hire Trucking, Estimated Shares of Canadian and American Carriers for Southbound and Northbound Traffic (Manitoba).
Table 1.15 For-hire Trucking, Northbound Movement of Goods from US Regions to Manitoba.
Table 1.16 Rail Commodity Southbound Movement of Goods to US Region of Destination from Gateway Province.
Table 1.17 Rail Commodity Northbound Movement of Goods from US Region of Origin to Gateway Province.
Table 1.18 Railway Commodity Origin and Destination of the Major Commodities in Terms of Tonnage for the Southbound Movements of Goods from Manitoba to US Region of Destination.
Table 1.19 Railway Commodity Origin and Destination of the Major Commodities in Terms of Tonnage for the Northbound Movements of Goods from US Region of Origin to Manitoba.
Table 1.20 Railway Freight Origin and Destination from Manitoba to Provincial Destinations.
Table 1.21 Railway Freight Origin and Destination from Provincial Origins to Manitoba.
Table 1.22 Railway Freight Origin and Destination, Tonnage of Marine Exports from Manitoba to Canadian Provinces.

viii
Table 1.23 Railway Freight Origin and Destination, Tonnage of Marine Imports to Manitoba from Canadian Provinces.
CHAPTER 2 Table 2.1 Motor Carriers of Freight in Canada, Summary Statistics by Size, For-hire
Carriers, 1997. Table 2.2 Manitoba Motor Carriers of Freight, Summary Statistics, Small For-hire. Table 2.3 Manitoba Motor Carriers of Freight, Summary Statistics, Owner Operator. Table 2.4 Canada Motor Carriers of Freight, Summary Statistics, Small For-hire. Table 2.5 Canada Motor Carriers of Freight, Summary Statistics, Owner Operator. Table 2.6 Canada Motor Carriers of Freight, Summary Statistics, Medium to Top
For-hire. Table 2.7 Manitoba Owner Operators Estimated Annual Distance Traveled by
Vehicle Type; Fuel Consumption and Cost Survey. Table 2.8 Manitoba Small For-hire Carriers Estimated Annual Distance Traveled by
Vehicle Type; Fuel Consumption and Cost Survey. Table 2.9 Canada Private Carriers Estimated Annual Distance Traveled by Vehicle
Type; Fuel Consumption and Cost Survey. Table 2.10 Manitoba For-hire Carriers: Breakdown of Selected Estimates by Weight
Group. Table 2.11 Canada Medium to Top For-hire Carriers: Breakdown of Selected
Estimates by Weight Group. Table 2.12 For-hire, Owner Operator, and Private Carriers: Equipment Operated. Table 2.13 Manitoba and Canada Small (Level III) For-hire Carriers: Number of
Employees and Type. Table 2.14 Manitoba and Canada Employment (both sexes, 15 years and over,
average for year) and Wages and Salaries. Table 2.15 Manitoba Registered Non-Commercial Vehicles. Table 2.16 Manitoba Registered Commercial Vehicles. Table 2.17 Manitoba Provincial Trunk Highways (1999): Kilometres by Surface
Type, January 2001. Table 2.18 Manitoba Provincial Trunk Highways: Traffic Volume and Percentage of
Truck Activity. CHAPTER 3 Table 3.1 Railway Freight: Revenue and Tonnes for Movement of Goods from
Manitoba to Province or Territory of Destination. Table 3.2 Revenue Freight: Receiving Initial or Final Haul in Manitoba, 1986-1990. Table 3.3 Canada Intermodal Tonnages, CN and CP, 1988-1993. Table 3.4 Manitoba Marine Container Traffic in (TEU s); (Rail and Truck
Combined). Table 3.5 Fuel Taxes by Province and Mode of Transportation (1999). Table 3.6 Fuel Consumption: Diesel Oil Consumed in Manitoba by Class I
Railways.

ix
Table 3.7 Manitoba Railway Employment: Rail Transport and Related Services. CHAPTER 4 Table 4.1 Winnipeg Transit System: Operating Data. Table 4.2 Winnipeg Transit Performance Indicators. Table 4.3 Winnipeg Handi-Transit Statistics. Table 4.4 Public Transit Metropolitan Performance Comparisons. Table 4.5 Public Transit Metropolitan Comparison: Adult Cash Fare Statistics,
Selected Cities. Table 4.6 Brandon Transit Systems – Operating Data. Table 4.7 Brandon Transit Performance Indicators. Table 4.8 Individual Urban Transit Employment and Vehicle Data. Table 4.9 Winnipeg Transit System Fare Structure Chronology. Table 4.10 Brandon Transit System Cash Fare Structure Chronology. Table 4.11 Manitoba Urban Transit Annual Statistics. Table 4.12 Canada Urban Transit Annual Statistics. Table 4.13 Winnipeg Taxi Industry: Number of Vehicles. Table 4.14 The Structure of Winnipeg Taxi Industry: A Breakdown of Industry
Owners by Company and Drivers. Table 4.15 Winnipeg Taxicab Gross Earnings: Driver and Operator. Table 4.16 Application for Taxicab Meter Rate Increase. Table 4.17 Taxicab Fees Regulation. Table 4.18 New Metered Taxicab Fares. Table 4.19 Comparison of Rated Across Selected Cities in Canada. Table 4.20 Winnipeg Taxicab Industry – Summary of Licenses Issued. Table 4.21 Manitoba School Bus Statistics: Regular Operational Expenditures. Table 4.22 Manitoba School Bus Regular Operational Expenditures: Urban and Rural
Divisions. Table 4.23 Travel to Canada by Bus. Table 4.24 Travel to Manitoba by Bus. Table 4.25 Canada Interurban and Rural Bus Transportation: Operating Revenues and
Expenses. Table 4.26 Canada Interurban and Rural Bus Transportation: Employment, Large
Companies. Table 4.27 Interurban and Rural Bus Transportation in Canada: Passengers Carried
and Kilometres Traveled. CHAPTER 5 Table 5.1 Manitoba Air Passenger Movement. Table 5.2 Manitoba Air Cargo Movement. Table 5.3 Winnipeg International Airport Passenger Movement. Table 5.4 Winnipeg International Airport Air Cargo Movement. Table 5.5 Winnipeg International Airport Aircraft Movement. Table 5.6 Winnipeg International Airport – Itinerant Aircraft Movements.

x
Table 5.7 Northern Manitoba Airports Passenger Movements. Table 5.8 Northern Manitoba Airports Cargo Movements. Table 5.9 Northern Manitoba Airports Aircraft Movements. Table 5.10 Transport Canada Northern Airports Passenger Movements – Total
Enplaned/ Deplaned. Table 5.11 Transport Canada Northern Airports Aircraft Movements. Table 5.12 Manitoba Air Transport Employment and Wages & Salaries (excludes
military). Table 5.13 Manitoba Indirect Air Transportation Tax. Table 5.14 Aircraft Gasoline Sales, Fuel Tax and Gasoline Price Index. Table 5.15 Manitoba Income Statement for Canadian Air Carriers Levels IB-IV. Table 5.16 Manitoba Passenger and Goods Revenue for Canadian Air Carriers Levels
I-IV. CHAPTER 6 Table 6.1 Natural Gas Industry: National Revenues, Expenses and Annual Operating
Ratios. Table 6.2 Manitoba Pipelines in Place. Table 6.3 Manitoba Pipeline Distance (Km) by Size of Pipe: Transmission, All
Systems, Outside Diameter (mm). Table 6.4 Manitoba Pipeline Distance (Km) by Size of Pipe: Distribution, All
Systems, Outside Diameter (mm). Table 6.5 Provincial Compressor Stations Operated by Gas Utilities; Natural Gas
Transport System (as of December 31). Table 6.6 Manitoba Natural Gas Inflows. Table 6.7 Manitoba Natural Gas Outflows. Table 6.8 Manitoba Gas Sales by Category of Service (Residential). Table 6.9 Manitoba Gas Sales by Category of Service (Commercial). Table 6.10 Manitoba Gas Sales by Category of Service (Industrial). Table 6.11 Manitoba Gas Sales by Category of Service (Total). Table 6.12 Canada Gas Sales by Category of Service (Total). Table 6.13 Manitoba Natural Gas Exports to the United States.
xi
LIST OF FIGURES CHAPTER 1 Figure 1.1 Total GDP. Figure 1.2 Transportation Equipment and Storage GDP. Figure 1.3 Manitoba Exports by Section and Chapter. Figure 1.4 Manitoba Imports by Section and Chapter. Figure 1.5 Manitoba Exports by Industry. Figure 1.6 Manitoba Imports by Industry. Figure 1.7 Manitoba Total Exports by Region. Figure 1.8 Manitoba Total Imports by Region. Figure 1.9 For-hire Trucking, Southbound Movement of Goods from Manitoba to US
Regions (Tonnes). Figure 1.10 For-hire Trucking, Southbound Movement of Goods from Manitoba to US
Regions (Tonne-Kilometres). Figure 1.11 For-hire Trucking, Southbound Movements of Top Five Commodities
from Manitoba to USA. Figure 1.12 For-hire Trucking, Northbound Movement of Goods from US Regions to
Manitoba (Tonnes). Figure 1.13 For-hire Trucking, Northbound Movement of Goods from US Regions to
Manitoba (Tonne-Kilometres). Figure 1.14 Rail Commodity Southbound Movement of Goods to the US Region of
Destination from Gateway Province. Figure 1.15 Rail Commodity Northbound Movement of Goods from US Region of
Origin to Gateway Province. Figure 1.16 Railway Freight Origin and Destination. Manitoba to Provincial
Destinations. Figure 1.17 Railway Freight Origin and Destination. Provincial Origins to Manitoba. CHAPTER 2 Figure 2.1 Equipment Type by Carrier (actual): Motor Carriers of Freight, Summary
Statistics, Canada 1997. Figure 2.2 Carrier by Equipment Type (actual): Motor Carriers of Freight, Summary
Statistics, Canada 1997. Figure 2.3 Carrier by Equipment Type (actual): Motor Carriers of Freight, Summary
Statistics, Canada 1997. Figure 2.4 Canada Medium to Top For-hire Carriers: Tonne-Kilometres by Weight
Group. Figure 2.5 Equipment Operated: Manitoba Small For-hire and Owner Operator. Figure 2.6 Number of Employees and Type for Manitoba Small For-hire Carriers. Figure 2.7 Number of Employees and Type for Canada Small For-hire Carriers.

xii
Figure 2.8 Manitoba and Canada Employment. Figure 2.9 Manitoba and Canada Employment and Wages and Salaries. Figure 2.10 Manitoba Registered Vehicles. Figure 2.11 Manitoba Registered Non-Commercial Vehicles before Cancellations. Figure 2.12 Manitoba Registered Commercial Vehicles before Cancellations. CHAPTER 3 Figure 3.1 Railway Freight: Movement of Goods from Manitoba to Destination. Figure 3.2 Fuel Taxes by Province and Mode of Transportation (1999). Figure 3.3 Fuel Consumption: Diesel Oil Consumed in Manitoba by Class I
Railways. Figure 3.4 Manitoba Railway Employment: Rail Transport and Related Services. CHAPTER 4 Figure 4.1 Winnipeg Transit System: Operating Data (Total). Figure 4.2 Winnipeg Transit System: Operating Data (Direct). Figure 4.3 Winnipeg Transit System: Operating Data (Direct). Figure 4.4 Winnipeg Transit Performance Indicators. Figure 4.5 Winnipeg Transit Performance Indicators. Figure 4.6 Public Transit Metropolitan Performance Comparisons: Revenue/Cost
Ratio. Figure 4.7 Public Transit Metropolitan Performance Comparisons: Cost
Effectiveness. Figure 4.8 Public Transit Metropolitan Performance Comparisons: Cost Efficiency. Figure 4.9 Public Transit Metropolitan Comparison: Adult Cash Fare. Figure 4.10 Manitoba Urban Transit Annual Statistics. Figure 4.11 Manitoba Urban Transit Annual Statistics. Figure 4.12 Canada Urban Transit Annual Statistics. Figure 4.13 Canada Urban Transit Annual Statistics. Figure 4.14 Manitoba and Canada Urban Transit Annual Statistics: Total Operating
Revenue to Total Direct Regular Passenger Service Operating Cost. Figure 4.15 Travel to Canada and Manitoba by Bus. Figure 4.16 Travel to Canada and Manitoba by Bus. CHAPTER 5 Figure 5.1 Manitoba Air Passenger Movement. Enplaned/Deplaned. Figure 5.2 Manitoba Air Passenger Movement. Service Type. Figure 5.3 Manitoba Air Passenger Movement. Domestic Passenger Distribution by
Fare Type. Figure 5.4 Winnipeg International Airport Passenger Movement by Sector. Figure 5.5 Winnipeg International Airport Passenger Movement by Service Type. Figure 5.6 Winnipeg International Airport Aircraft Movements.

xiii
Figure 5.7 Winnipeg International Airport Itinerant Aircraft Movements: Major Carriers.
Figure 5.8 Northern Manitoba Airports Passenger Movement: Selected Airports. Figure 5.9 Northern Manitoba Airports Cargo Movement: Selected Airports. Figure 5.10 Northern Manitoba Airports Aircraft Movements: Selected Airports. Figure 5.11 Manitoba Air Transport Employment and Wages & Salaries (excludes
military). Figure 5.12 Manitoba Air Transport Employment and Wages & Salaries (excludes
military). Figure 5.13 Manitoba Income Statement for Canadian Air Carriers Levels IB-IV. Figure 5.14 Manitoba Passenger and Goods Revenue for Canadian Air Carriers Levels
I-IV. Figure 5.15 Manitoba Passenger and Goods Revenue: Three Year Simple Moving
Average. CHAPTER 6 Figure 6.1 Natural Gas Industry: National Revenues, Expenses and Annual Operating
Ratios. Figure 6.2 Pipelines in Manitoba. Figure 6.3 Manitoba Natural Gas Outflows. Figure 6.4 Manitoba Natural Gas Exports to the USA.

xiv
LIST OF APPENDICES APPENDIX I: MANITOBA TRANSPORTATION COURIER SERVICES
SURVEY APPENDIX II: TRANSPORTATION EQUIPMENT MANUFACTURING APPENDIX III: GOVERNMENT EMPLOYMENT

xv
ACKNOWLEDGEMENTS This report was financially supported by the Manitoba Government Department of Transportation and Government Services. The assistance rendered by Statistics Canada and the Manitoba Bureau of Statistics is acknowledged with gratitude. Institutional contributions to data were provided by various Branches within the Manitoba Government Department of Transportation and Government Services, as well as the Department of Finance Taxation Management and Research Branch and the Department of Education and Training Schools Finance Branch. The City of Winnipeg Transit System generously contributed data on public transport. The Winnipeg Airports Authority provided recent data on the Winnipeg International Airport. Many personnel members of the Transport Institute contributed in various ways to this report. The database on which this report is based was developed over a long period of time. Some previous contributors to the database are no longer associated with the Institute, yet deserve acknowledgement of their efforts.
1
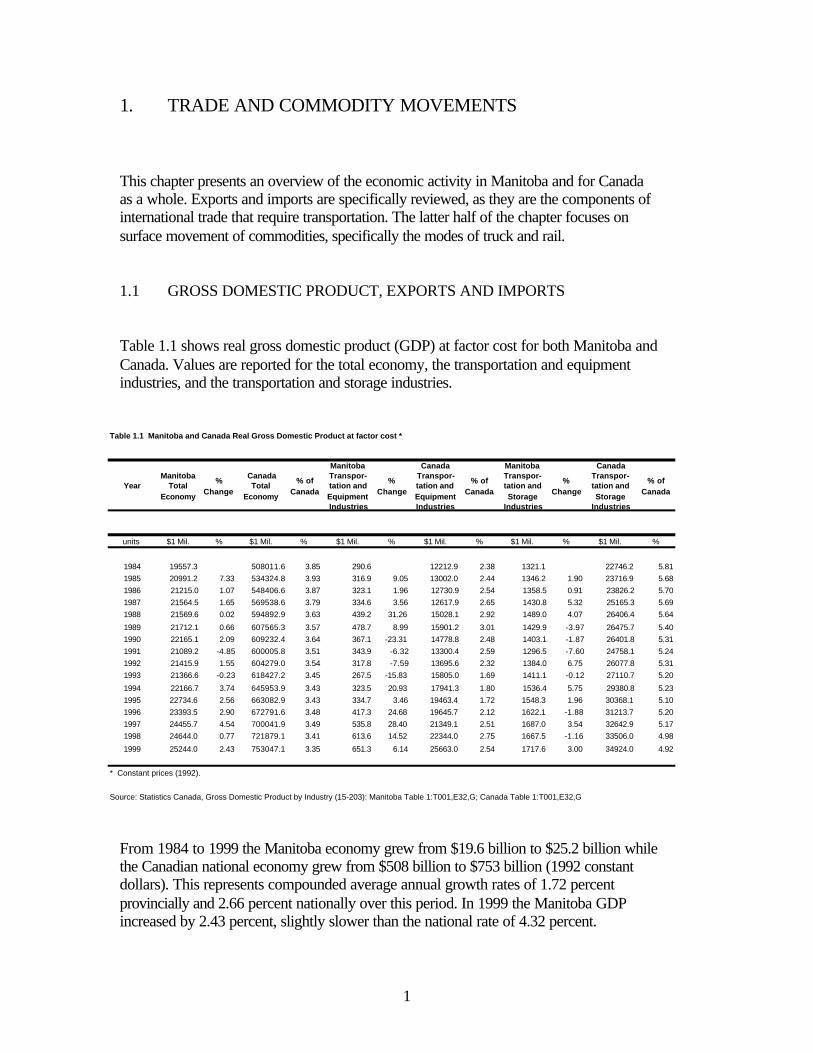
1. TRADE AND COMMODITY MOVEMENTS This chapter presents an overview of the economic activity in Manitoba and for Canada as a whole. Exports and imports are specifically reviewed, as they are the components of international trade that require transportation. The latter half of the chapter focuses on surface movement of commodities, specifically the modes of truck and rail. 1.1 GROSS DOMESTIC PRODUCT, EXPORTS AND IMPORTS Table 1.1 shows real gross domestic product (GDP) at factor cost for both Manitoba and Canada. Values are reported for the total economy, the transportation and equipment industries, and the transportation and storage industries.
From 1984 to 1999 the Manitoba economy grew from $19.6 billion to $25.2 billion while the Canadian national economy grew from $508 billion to $753 billion (1992 constant dollars). This represents compounded average annual growth rates of 1.72 percent provincially and 2.66 percent nationally over this period. In 1999 the Manitoba GDP increased by 2.43 percent, slightly slower than the national rate of 4.32 percent.
Table 1.1 Manitoba and Canada Real Gross Domestic Product at factor cost *
YearManitoba
Total Economy
% Change
Canada Total
Economy
% of Canada
Manitoba Transpor-tation and Equipment Industries
% Change
Canada Transpor-tation and Equipment Industries
% of Canada
Manitoba Transpor-tation and Storage
Industries
% Change
Canada Transpor-tation and Storage
Industries
% of Canada
units $1 Mil. % $1 Mil. % $1 Mil. % $1 Mil. % $1 Mil. % $1 Mil. %
1984 19557.3 508011.6 3.85 290.6 12212.9 2.38 1321.1 22746.2 5.811985 20991.2 7.33 534324.8 3.93 316.9 9.05 13002.0 2.44 1346.2 1.90 23716.9 5.681986 21215.0 1.07 548406.6 3.87 323.1 1.96 12730.9 2.54 1358.5 0.91 23826.2 5.701987 21564.5 1.65 569538.6 3.79 334.6 3.56 12617.9 2.65 1430.8 5.32 25165.3 5.691988 21569.6 0.02 594892.9 3.63 439.2 31.26 15028.1 2.92 1489.0 4.07 26406.4 5.64
1989 21712.1 0.66 607565.3 3.57 478.7 8.99 15901.2 3.01 1429.9 -3.97 26475.7 5.401990 22165.1 2.09 609232.4 3.64 367.1 -23.31 14778.8 2.48 1403.1 -1.87 26401.8 5.311991 21089.2 -4.85 600005.8 3.51 343.9 -6.32 13300.4 2.59 1296.5 -7.60 24758.1 5.241992 21415.9 1.55 604279.0 3.54 317.8 -7.59 13695.6 2.32 1384.0 6.75 26077.8 5.311993 21366.6 -0.23 618427.2 3.45 267.5 -15.83 15805.0 1.69 1411.1 -0.12 27110.7 5.20
1994 22166.7 3.74 645953.9 3.43 323.5 20.93 17941.3 1.80 1536.4 5.75 29380.8 5.231995 22734.6 2.56 663082.9 3.43 334.7 3.46 19463.4 1.72 1548.3 1.96 30368.1 5.101996 23393.5 2.90 672791.6 3.48 417.3 24.68 19645.7 2.12 1622.1 -1.88 31213.7 5.201997 24455.7 4.54 700041.9 3.49 535.8 28.40 21349.1 2.51 1687.0 3.54 32642.9 5.171998 24644.0 0.77 721879.1 3.41 613.6 14.52 22344.0 2.75 1667.5 -1.16 33506.0 4.98
1999 25244.0 2.43 753047.1 3.35 651.3 6.14 25663.0 2.54 1717.6 3.00 34924.0 4.92
* Constant prices (1992).
Source: Statistics Canada, Gross Domestic Product by Industry (15-203): Manitoba Table 1:T001,E32,G; Canada Table 1:T001,E32,G

2
Figure 1.1 charts the total GDP for Manitoba and Canada. It is evident that during the mid 1980’s the Manitoba economy grew correspondingly to the national average. In the second half of the decade the Manitoba economy grew at a slower rate and even showed negative growth during the early 1990’s. Only in 1994 did the economy again approach equivalent levels to 1990. Since 1994 figures for Manitoba generally showed a more stable growth rate.
Figure 1.1 Total GDP
0
5,000
10,000
15,000
20,000
25,000
30,000
1984
1985
1986
1987
1988
1989
1990
1991
1992
1993
1994
1995
1996
1997
1998
1999
Year
Man
ito
ba
$ m
illio
n
0
100,000
200,000
300,000
400,000
500,000
600,000
700,000
800,000
Can
ada
$ m
illio
n
ManitobaTotalEconomy
CanadaTotalEconomy
Manitoba’s contribution as a percentage of the Canadian GDP has declined substantially over this period, although some turnarounds are evident in recent years, most notably in 1996 and 1997. At 3.35 percent, 1999 saw the lowest comparative contribution by Manitoba to the Canadian economy for the period. Figure 1.2 shows the GDPs for the transportation equipment industry and the transportation storage industry for Manitoba and Canada. In Manitoba the transportation and storage industry (1999: $1.72 billion) is significantly larger than the transportation and equipment industry (1999: $651.3 million). The growth rate of the larger storage industry is more volatile than the total provincial economy, but less so than the equipment industry. The extreme positive and negative growth rates over this period for the transportation and equipment industry in Manitoba are 31.3 percent (1988) and –23.3 percent (1990) respectively. For the transportation and storage industry in Manitoba the equivalent figures are 6.75 percent (1992) and –7.60 percent (1991). During 1999, the more sensitive Manitoba transportation equipment industry grew by 6.14 percent and the transportation and storage industry by 3.00 percent.

3
In the Canadian economy, as is the case in the Manitoba economy, the transportation and storage industry (1999: $34,92 billion) is also larger than the transportation and equipment industry (1999: $25.7 billion). In relative terms, this illustrates that the Manitoba economy is more concentrated in the transportation and storage industry than is the Canadian economy. However, in recent years Manitoba has managed to increase its relative contribution to the Canadian transportation and equipment industries (1999: 2.54 %), whereas the contribution to national transportation and storage industries (1999: 4.92 %) actually declined. The close correlation in performance of the total economy and the transportation sector is notable. The flattening in the GDP growth rates for Manitoba in 1999 is closely reflected in the provincial transportation equipment and storage industries.
Figure 1.2 Transportation Equipment and Storage GDP
0
200
400
600
800
1000
1200
1400
1600
1800
2000
1984
1985
1986
1987
1988
1989
1990
1991
1992
1993
1994
1995
1996
1997
1998
1999
Year
Man
ito
ba
$ m
illio
n
0
5000
10000
15000
20000
25000
30000
35000
40000
Can
ada
$ m
illio
n
ManitobaTranspor-tation andEquipmentIndustries
ManitobaTranspor-tation andStorageIndustries
CanadaTranspor-tation andEquipmentIndustries
Canada Transpor-tation andStorageIndustries

4
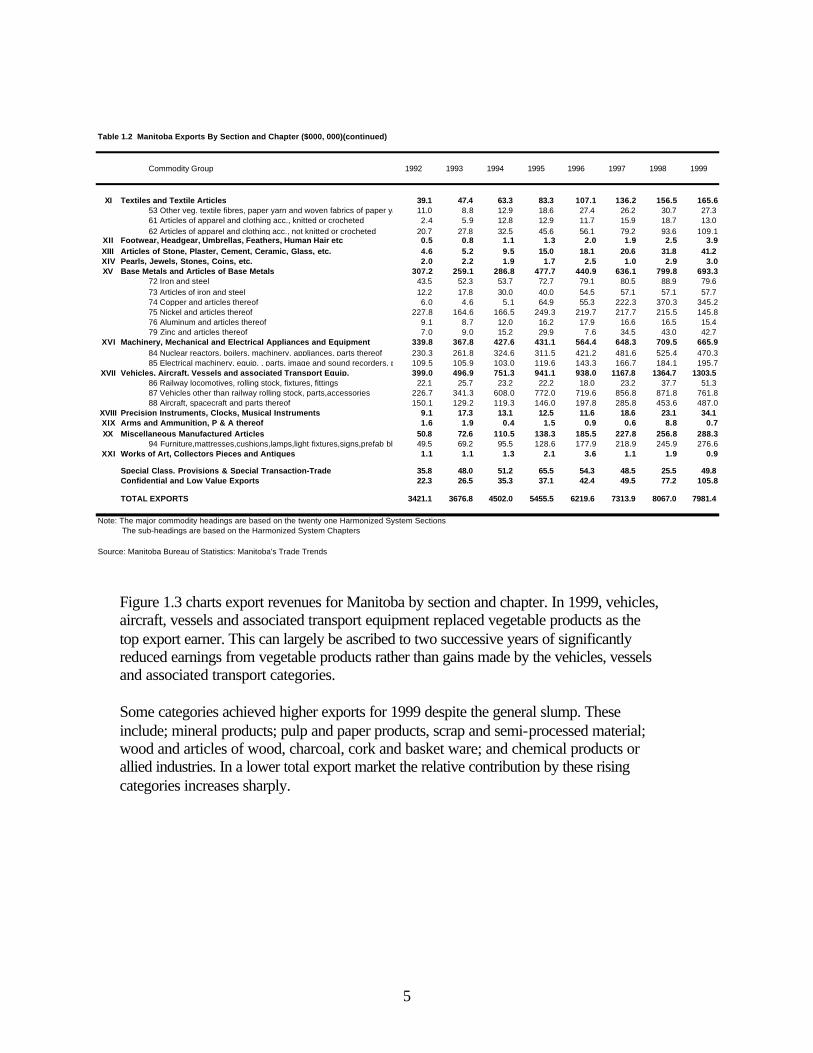
The nominal value (not deflated) of Manitoba export revenues by section and chapter are shown in Table 1.2. Total export earnings grew significantly from $2,969.0 million in 1990 to $7,981.4 million in 1999. This is an increase of 169 percent over the ten-year period. However, exports peaked in 1998 with $8,067.0 million. The drop in export earnings for 1999 was the first annual drop over the cited period. Despite the slump in total export earnings some categories achieved higher exports (see Figure 1.3).
Table1.2 Manitoba Exports By Section and Chapter ($000, 000)
Commodity Group 1992 1993 1994 1995 1996 1997 1998 1999
I Live Animals, Animal Products 322.5 357.4 322.5 368.3 496.2 618.4 673.3 667.601 Live Animals 222.3 234.0 187.0 224.3 356.5 405.1 414.3 362.602 Meat and edible meat offal 43.8 71.1 87.3 85.8 83.0 156.7 192.5 228.603 Fish and crustaceans, molluscs and other aquatic invertebrates 42.3 33.1 34.6 38.0 39.0 37.7 43.9 46.904 Dairy produce, eggs, honey, edible products of animal origin, nes 12.1 17.9 12.1 19.3 14.7 16.4 19.4 23.6
II Vegetable Products 1062.1 992.9 1131.2 1282.6 1418.7 1664.4 1403.3 1238.007 Edible vegetables and certain roots and tubers 68.9 72.9 118.6 90.0 94.3 115.6 100.2 124.510 Cereals 764.7 594.4 548.2 625.2 845.1 991.9 574.2 532.111 Products of the milling industry, malt, starches, inulin, wheat gluten 20.0 21.4 40.2 39.3 44.6 48.7 47.1 55.612 Oil seeds and oleaginous fruits, misc. grains, seeds and fruit, straw 207.3 300.4 417.2 515.8 422.3 500.1 673.7 518.9
III Animal and Vegetable Fats, Oils, and Waxes 94.1 66.9 64.8 110.3 227.3 210.0 497.3 212.5IV Prepared Foodstuffs, Beverage, Spirits and Tobacco 64.7 80.3 90.7 89.9 128.6 191.8 239.9 234.2
17 Sugar and sugar confectionary 19.7 12.5 29.6 13.2 6.3 1.4 0.8 0.619 Preparations of cereals, flour, starch or milk, pastrycooks' products 0.5 0.6 0.5 1.6 5.2 7.1 10.5 9.920 Preparations of vegetables, fruits, nuts and other parts of plants 1.0 8.1 2.8 10.7 35.9 87.5 140.5 143.623 Residue and waste from food ind., prepared animal fodder 38.7 53.5 52.4 57.6 77.2 89.6 73.5 55.4
V Mineral Products 306.0 412.4 606.4 736.0 884.7 872.6 774.1 976.425 Salt, sulphur, earths and stone, plaster, lime and cement 8.5 7.5 12.3 10.1 8.2 11.4 12.0 11.726 Ores, slag and ash 6.4 5.2 19.4 6.2 12.9 8.0 11.8 11.227 Mineral fuels, oils, and products of their distillation, bituminous subs. 291.0 399.7 574.6 719.7 863.6 853.2 750.3 935.5
VI Chemical Products or Allied Industries 92.1 95.6 94.5 69.5 120.1 129.1 221.3 336.328 Inorganic chems., organic/inorg. compounds of precious metals 62.2 59.9 50.3 10.2 34.0 55.7 74.4 65.729 Organic chemicals 0.0 0.2 1.4 0.1 0.1 3.2 37.8 39.230 Pharmaceutical products 0.1 1.1 6.9 9.8 33.3 29.2 55.1 148.331 Fertilizers 19.9 23.3 23.5 31.4 37.3 26.9 34.8 54.0
VII Plastics, Rubber, and Articles Thereof 49.4 58.8 80.2 95.4 111.2 139.2 185.9 215.7VIII Raw Hides and Skins, Leather, Furskins, and articles thereof 35.2 35.7 49.8 47.5 45.3 44.0 42.3 41.6IX Wood and articles of wood, Charcoal, Cork, Basketware 74.8 120.0 125.5 138.2 135.1 182.8 239.6 360.5X Pulp and Paper Products, Scrap and Semi-processed Materials 107.3 110.2 183.1 309.6 281.4 303.4 329.1 342.8
48 Paper and paperboard, articles of paper pulp 87.4 88.3 137.9 264.5 236.7 237.8 236.3 240.249 Printed books, newspapers, pictures etc., manuscripts, and plans 14.5 20.9 30.3 40.8 41.9 60.7 87.7 95.8
5
Figure 1.3 charts export revenues for Manitoba by section and chapter. In 1999, vehicles, aircraft, vessels and associated transport equipment replaced vegetable products as the top export earner. This can largely be ascribed to two successive years of significantly reduced earnings from vegetable products rather than gains made by the vehicles, vessels and associated transport categories. Some categories achieved higher exports for 1999 despite the general slump. These include; mineral products; pulp and paper products, scrap and semi-processed material; wood and articles of wood, charcoal, cork and basket ware; and chemical products or allied industries. In a lower total export market the relative contribution by these rising categories increases sharply.
Table 1.2 Manitoba Exports By Section and Chapter ($000, 000)(continued)
Commodity Group 1992 1993 1994 1995 1996 1997 1998 1999
XI Textiles and Textile Articles 39.1 47.4 63.3 83.3 107.1 136.2 156.5 165.653 Other veg. textile fibres, paper yarn and woven fabrics of paper yarn 11.0 8.8 12.9 18.6 27.4 26.2 30.7 27.361 Articles of apparel and clothing acc., knitted or crocheted 2.4 5.9 12.8 12.9 11.7 15.9 18.7 13.062 Articles of apparel and clothing acc., not knitted or crocheted 20.7 27.8 32.5 45.6 56.1 79.2 93.6 109.1
XII Footwear, Headgear, Umbrellas, Feathers, Human Hair etc 0.5 0.8 1.1 1.3 2.0 1.9 2.5 3.9XIII Articles of Stone, Plaster, Cement, Ceramic, Glass, etc. 4.6 5.2 9.5 15.0 18.1 20.6 31.8 41.2XIV Pearls, Jewels, Stones, Coins, etc. 2.0 2.2 1.9 1.7 2.5 1.0 2.9 3.0XV Base Metals and Articles of Base Metals 307.2 259.1 286.8 477.7 440.9 636.1 799.8 693.3
72 Iron and steel 43.5 52.3 53.7 72.7 79.1 80.5 88.9 79.673 Articles of iron and steel 12.2 17.8 30.0 40.0 54.5 57.1 57.1 57.774 Copper and articles thereof 6.0 4.6 5.1 64.9 55.3 222.3 370.3 345.275 Nickel and articles thereof 227.8 164.6 166.5 249.3 219.7 217.7 215.5 145.876 Aluminum and articles thereof 9.1 8.7 12.0 16.2 17.9 16.6 16.5 15.479 Zinc and articles thereof 7.0 9.0 15.2 29.9 7.6 34.5 43.0 42.7
XVI Machinery, Mechanical and Electrical Appliances and Equipment 339.8 367.8 427.6 431.1 564.4 648.3 709.5 665.984 Nuclear reactors, boilers, machinery, appliances, parts thereof 230.3 261.8 324.6 311.5 421.2 481.6 525.4 470.385 Electrical machinery, equip. , parts, image and sound recorders, parts 109.5 105.9 103.0 119.6 143.3 166.7 184.1 195.7
XVII Vehicles, Aircraft, Vessels and associated Transport Equip. 399.0 496.9 751.3 941.1 938.0 1167.8 1364.7 1303.586 Railway locomotives, rolling stock, fixtures, fittings 22.1 25.7 23.2 22.2 18.0 23.2 37.7 51.387 Vehicles other than railway rolling stock, parts,accessories 226.7 341.3 608.0 772.0 719.6 856.8 871.8 761.888 Aircraft, spacecraft and parts thereof 150.1 129.2 119.3 146.0 197.8 285.8 453.6 487.0
XVIII Precision Instruments, Clocks, Musical Instruments 9.1 17.3 13.1 12.5 11.6 18.6 23.1 34.1XIX Arms and Ammunition, P & A thereof 1.6 1.9 0.4 1.5 0.9 0.6 8.8 0.7XX Miscellaneous Manufactured Articles 50.8 72.6 110.5 138.3 185.5 227.8 256.8 288.3
94 Furniture,mattresses,cushions,lamps,light fixtures,signs,prefab bldgs. 49.5 69.2 95.5 128.6 177.9 218.9 245.9 276.6XXI Works of Art, Collectors Pieces and Antiques 1.1 1.1 1.3 2.1 3.6 1.1 1.9 0.9
Special Class. Provisions & Special Transaction-Trade 35.8 48.0 51.2 65.5 54.3 48.5 25.5 49.8Confidential and Low Value Exports 22.3 26.5 35.3 37.1 42.4 49.5 77.2 105.8
TOTAL EXPORTS 3421.1 3676.8 4502.0 5455.5 6219.6 7313.9 8067.0 7981.4
Note: The major commodity headings are based on the twenty one Harmonized System Sections The sub-headings are based on the Harmonized System Chapters
Source: Manitoba Bureau of Statistics: Manitoba's Trade Trends

6
Figure 1.3 Manitoba Exports by Section and Chapter
0
200
400
600
800
1000
1200
1400
1600
1800
1990
1991
1992
1993
1994
1995
1996
1997
1998
1999
Year
Sec
tio
n a
nd
Ch
apte
r $'
000,
000
0
1000
2000
3000
4000
5000
6000
7000
8000
9000
Tota
l $'0
00,0
00
Live Animals, AnimalProducts
Vegetable Products
Animal and VegetableFats, Oils, and Waxes
Mineral Products
Chemical Products orAllied Industries
Wood and articles ofwood, Charcoal, Cork,Basketware
Pulp and PaperProducts, Scrap andSemi-processedMaterialsBase Metals andArticles of BaseMetals
Machinery,Mechanical andElectrical Appliancesand EquipmentVehicles, Aircraft,Vessels andassociated TransportEquip.TOTAL EXPORTS
7
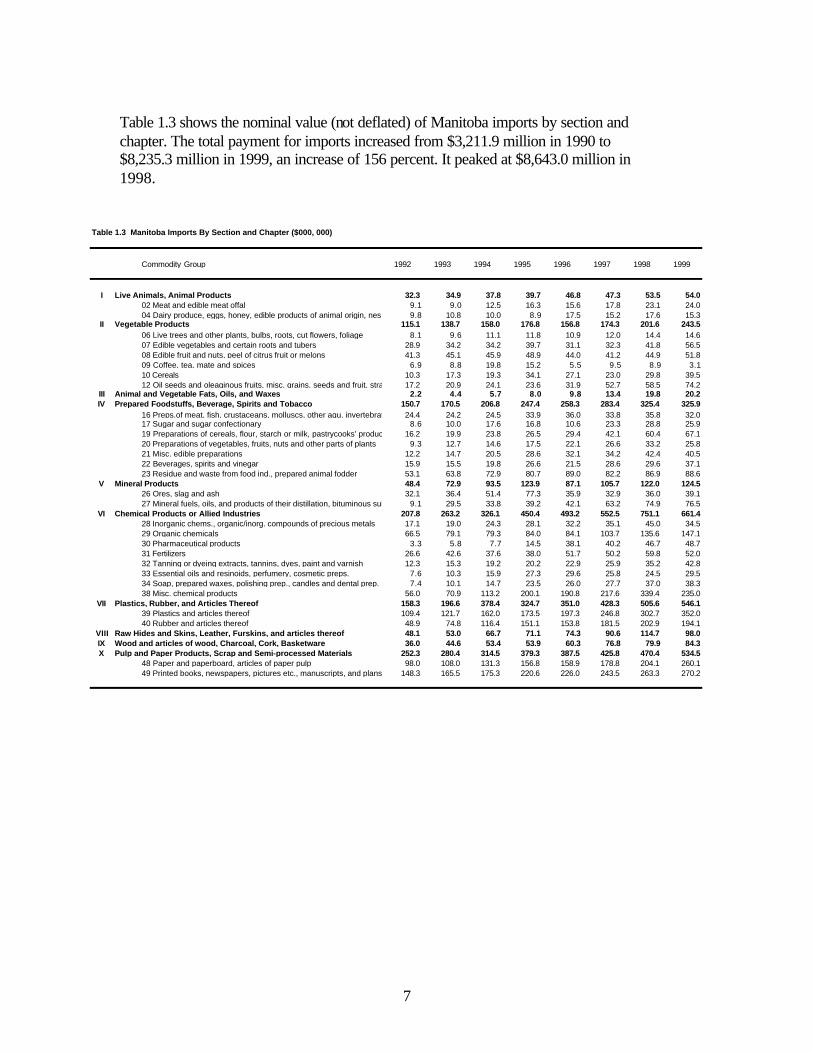
Table 1.3 shows the nominal value (not deflated) of Manitoba imports by section and chapter. The total payment for imports increased from $3,211.9 million in 1990 to $8,235.3 million in 1999, an increase of 156 percent. It peaked at $8,643.0 million in 1998.
Table 1.3 Manitoba Imports By Section and Chapter ($000, 000)
Commodity Group 1992 1993 1994 1995 1996 1997 1998 1999
I Live Animals, Animal Products 32.3 34.9 37.8 39.7 46.8 47.3 53.5 54.002 Meat and edible meat offal 9.1 9.0 12.5 16.3 15.6 17.8 23.1 24.004 Dairy produce, eggs, honey, edible products of animal origin, nes 9.8 10.8 10.0 8.9 17.5 15.2 17.6 15.3
II Vegetable Products 115.1 138.7 158.0 176.8 156.8 174.3 201.6 243.506 Live trees and other plants, bulbs, roots, cut flowers, foliage 8.1 9.6 11.1 11.8 10.9 12.0 14.4 14.607 Edible vegetables and certain roots and tubers 28.9 34.2 34.2 39.7 31.1 32.3 41.8 56.508 Edible fruit and nuts, peel of citrus fruit or melons 41.3 45.1 45.9 48.9 44.0 41.2 44.9 51.809 Coffee, tea, mate and spices 6.9 8.8 19.8 15.2 5.5 9.5 8.9 3.110 Cereals 10.3 17.3 19.3 34.1 27.1 23.0 29.8 39.512 Oil seeds and oleaginous fruits, misc. grains, seeds and fruit, straw 17.2 20.9 24.1 23.6 31.9 52.7 58.5 74.2
III Animal and Vegetable Fats, Oils, and Waxes 2.2 4.4 5.7 8.0 9.8 13.4 19.8 20.2IV Prepared Foodstuffs, Beverage, Spirits and Tobacco 150.7 170.5 206.8 247.4 258.3 283.4 325.4 325.9
16 Preps.of meat, fish, crustaceans, molluscs, other aqu. invertebrates 24.4 24.2 24.5 33.9 36.0 33.8 35.8 32.017 Sugar and sugar confectionary 8.6 10.0 17.6 16.8 10.6 23.3 28.8 25.919 Preparations of cereals, flour, starch or milk, pastrycooks' products 16.2 19.9 23.8 26.5 29.4 42.1 60.4 67.120 Preparations of vegetables, fruits, nuts and other parts of plants 9.3 12.7 14.6 17.5 22.1 26.6 33.2 25.821 Misc. edible preparations 12.2 14.7 20.5 28.6 32.1 34.2 42.4 40.522 Beverages, spirits and vinegar 15.9 15.5 19.8 26.6 21.5 28.6 29.6 37.123 Residue and waste from food ind., prepared animal fodder 53.1 63.8 72.9 80.7 89.0 82.2 86.9 88.6
V Mineral Products 48.4 72.9 93.5 123.9 87.1 105.7 122.0 124.526 Ores, slag and ash 32.1 36.4 51.4 77.3 35.9 32.9 36.0 39.127 Mineral fuels, oils, and products of their distillation, bituminous subs. 9.1 29.5 33.8 39.2 42.1 63.2 74.9 76.5
VI Chemical Products or Allied Industries 207.8 263.2 326.1 450.4 493.2 552.5 751.1 661.428 Inorganic chems., organic/inorg. compounds of precious metals 17.1 19.0 24.3 28.1 32.2 35.1 45.0 34.529 Organic chemicals 66.5 79.1 79.3 84.0 84.1 103.7 135.6 147.130 Pharmaceutical products 3.3 5.8 7.7 14.5 38.1 40.2 46.7 48.731 Fertilizers 26.6 42.6 37.6 38.0 51.7 50.2 59.8 52.032 Tanning or dyeing extracts, tannins, dyes, paint and varnish 12.3 15.3 19.2 20.2 22.9 25.9 35.2 42.833 Essential oils and resinoids, perfumery, cosmetic preps. 7.6 10.3 15.9 27.3 29.6 25.8 24.5 29.534 Soap, prepared waxes, polishing prep., candles and dental prep. 7.4 10.1 14.7 23.5 26.0 27.7 37.0 38.338 Misc. chemical products 56.0 70.9 113.2 200.1 190.8 217.6 339.4 235.0
VII Plastics, Rubber, and Articles Thereof 158.3 196.6 378.4 324.7 351.0 428.3 505.6 546.139 Plastics and articles thereof 109.4 121.7 162.0 173.5 197.3 246.8 302.7 352.040 Rubber and articles thereof 48.9 74.8 116.4 151.1 153.8 181.5 202.9 194.1
VIII Raw Hides and Skins, Leather, Furskins, and articles thereof 48.1 53.0 66.7 71.1 74.3 90.6 114.7 98.0IX Wood and articles of wood, Charcoal, Cork, Basketware 36.0 44.6 53.4 53.9 60.3 76.8 79.9 84.3X Pulp and Paper Products, Scrap and Semi-processed Materials 252.3 280.4 314.5 379.3 387.5 425.8 470.4 534.5
48 Paper and paperboard, articles of paper pulp 98.0 108.0 131.3 156.8 158.9 178.8 204.1 260.149 Printed books, newspapers, pictures etc., manuscripts, and plans 148.3 165.5 175.3 220.6 226.0 243.5 263.3 270.2

8
Figure 1.4 shows the nominal values of imports for Manitoba. Machinery, mechanical and electrical appliances and equipment is the largest import category followed by the vehicles, aircraft, vessels and associated transport equipment category. Despite the decline in total import payments in 1999, some categories showed positive movement. These include: Plastics, rubber, and articles thereof; pulp and paper products, scrap and semi-processed materials; textiles and textile articles; and prepared foodstuffs.
Table 1.3 Manitoba Imports By Section and Chapter ($000, 000)(continued)
Commodity Group 1992 1993 1994 1995 1996 1997 1998 1999
XI Textiles and Textile Articles 162.5 174.4 194.6 229.8 244.6 286.4 341.1 360.152 Cotton 11.1 14.8 16.7 23.6 26.3 25.6 34.2 40.354 Man made filaments 9.6 10.2 12.7 16.2 17.5 29.7 29.0 26.056 Wadding, felt, nonwovens, special yarn, twine, cordage, rope, cable 8.5 9.3 8.1 11.0 10.9 16.4 16.1 17.857 Carpets and other textile floor coverings 19.5 18.9 17.3 18.7 31.1 46.3 67.7 73.659 Impregnated, coated, covered, laminated textile fabrics 4.6 7.8 10.6 9.2 11.9 12.6 18.4 18.561 Articles of apparel and clothing acc., knitted or crocheted 25.7 29.7 33.4 38.5 32.2 35.3 43.8 50.062 Articles of apparel and clothing acc., not knitted or crocheted 49.9 46.0 54.1 63.7 70.1 71.0 87.1 85.5
XII Footwear, Headgear, Umbrellas, Feathers, Human Hair etc 7.0 9.7 12.2 11.4 11.3 17.0 19.2 26.8XIII Articles of Stone, Plaster, Cement, Ceramic, Glass, etc. 35.3 39.3 43.3 46.9 53.6 69.9 87.4 101.2XIV Pearls, Jewels, Stones, Coins, etc. 4.4 4.7 5.3 5.8 6.8 10.0 10.2 11.4XV Base Metals and Articles of Base Metal 181.8 238.1 306.2 358.2 406.3 514.1 629.2 539.5
72 Iron and steel 37.0 51.5 61.9 71.0 64.3 91.6 91.3 89.973 Articles of iron and steel 86.0 112.2 152.7 159.0 190.8 251.7 296.8 223.774 Copper and articles thereof 5.5 6.3 9.0 14.1 9.7 29.8 67.4 43.376 Aluminum and articles thereof 22.1 30.3 31.8 48.6 42.6 52.3 64.9 57.582 Tools, Implements, spoons, forks of base metal, parts thereof 13.1 16.9 20.3 28.2 27.9 36.8 41.2 41.283 Misc. articles of base metal 14.8 18.7 25.8 27.1 29.5 35.2 50.1 69.8
XVI Machinery, Mechanical and Electrical Appliances and Equipment 975.8 1232.3 1516.9 1702.8 1887.1 2299.2 2684.0 2505.784 Nuclear reactors, boilers, machinery, appliances, parts thereof 776.8 1003.6 1261.8 1402.0 1551.0 1886.5 2199.3 2010.885 Electrical machinery, equip. , parts, image and sound recorders, parts 199.0 228.7 255.1 300.8 336.2 412.6 484.7 494.9
XVII Vehicles, Aircraft, Vessels and associated Transport Equip. 665.3 851.4 1194.4 1368.3 1250.1 1670.1 1653.5 1370.786 Railway locomotives, rolling stock, fixtures, fittings 31.0 44.7 49.9 54.2 38.6 53.5 108.2 85.487 Vehicles other than railway rolling stock, parts,accessories 547.3 744.4 1077.5 1232.0 1125.4 1432.5 1344.6 1094.388 Aircraft, spacecraft and parts thereof 76.7 49.3 46.0 62.7 71.7 169.7 181.3 171.5
XVIII Precision Instruments, Clocks, Musical Instruments 69.7 79.6 86.2 84.0 107.3 140.7 224.8 269.0XIX Arms and Ammunition, P & A thereof 7.5 7.8 6.6 7.1 4.9 5.6 8.2 5.5XX Miscellaneous Manufactured Articles 99.3 135.8 173.9 175.8 151.1 190.7 236.8 247.8
94 Furniture,mattresses,cushions,lamps,light fixtures,signs,prefab bldgs. 62.9 81.6 107.8 94.2 84.8 115.8 156.5 148.595 Toys, games and sport requisites, p & a thereof 32.3 49.3 59.8 75.4 59.9 66.7 69.6 87.3
XXI Works of Art, Collectors Pieces and Antiques 2.7 1.8 1.7 2.4 1.8 1.9 2.3 1.2
Special Class. Provisions & Special Transaction-Trade 11.4 11.2 13.2 15.4 17.2 24.2 25.7 25.9Confidential and Low Value Imports 166.7 120.2 134.1 132.8 168.6 112.6 76.7 78.1
TOTAL IMPORTS 3440.3 4165.3 5229.4 6015.6 6235.7 7540.5 8643.0 8235.3
Note: The major commodity headings are based on the twenty one Harmonized System Sections The sub-headings are based on the Harmonized System Chapters
Source: Manitoba Bureau of Statistics: Manitoba's Trade Trends

9
Figure 1.4 Manitoba Imports by Section ans Chapter
0
500
1000
1500
2000
2500
3000
1990 1991 1992 1993 1994 1995 1996 1997 1998 1999
Year
Cha
pter
and
Sec
tion
$'00
0,00
0
0
1000
2000
3000
4000
5000
6000
7000
8000
9000
10000
Tota
l $'0
00,0
00
Prepared Foodstuffs,Beverage, Spirits andTobacco
Chemical Products orAllied Industries
Plastics, Rubber, andArticles Thereof
Pulp and PaperProducts, Scrap andSemi-processedMaterialsTextiles and TextileArticles
Base Metals andArticles of Base Metal
Machinery, Mechanicaland ElectricalAppliances andEquipmentVehicles, Aircraft,Vessels andassociated TransportEquip.TOTAL IMPORTS

10
Table 1.4 illustrates total export revenue for goods (1999: $7,981.4 million) by industry. In 1999 the manufacturing industry was the largest contributor to export earnings at $5,312.7 million, followed by agriculture at $1,552.2 million, mining at $540.1 million and the electric power industry at $343.0 million. Data on service exports are not available. This is unfortunate because transportation services are a significant source of export earnings for Manitoba.
Table 1.4 Manitoba Exports by Industry ($'000,000)
Industry 1989 1990 1991 1992 1993 1994 1995 1996 1997 1998 1999
Agriculture 850.2 1120.3 1190.3 1266.8 1205.6 1274.0 1463.5 1723.6 2019.1 1773.7 1552.2Forestry 0.5 0.5 0.2 0.2 0.2 0.3 0.2 0.1 0.2 0.6 0.9Fishing, Hunting and Trapping 11.2 9.4 9.0 6.9 5.8 6.6 7.2 6.5 6.8 6.1 9.5Mining 72.7 105.1 90.9 124.0 138.0 270.5 395.5 527.9 472.2 347.6 540.1
Metal Mines 12.5 14.4 10.2 6.4 5.2 19.3 6.1 12.4 7.0 10.9 10.4Mineral Fuels 32.1 83.9 60.2 91.3 106.8 222.8 369.0 494.4 438.5 311.2 505.1Non-Metal Mines 27.7 5.6 19.1 25.6 25.4 27.0 19.8 20.5 25.7 24.7 24.0Quarries and Sandpits 0.3 1.2 1.3 0.7 0.6 1.7 0.4 0.6 1.1 0.9 0.6
Manufacturing Industry 1710.6 1467.1 1517.8 1859.2 2041.4 2565.1 3158.3 3513.9 4343.2 5404.9 5312.7Food Industries 209.2 215.2 223.4 274.8 287.3 328.0 380.9 544.6 665.0 1040.5 799.3Beverage Industries 8.7 0.7 1.3 3.2 4.0 4.3 4.3 2.4 0.9 2.5 4.3Tobacco Products Industries 0.1 0.0 0.2 0.8 0.7 0.1 0.0 0.0 0.0 0.0 0.0Rubber Products Industries 1.0 0.9 1.0 0.9 2.0 2.6 2.6 3.8 5.5 6.1 6.3Plastics Products Industries 42.9 39.5 39.7 45.5 52.8 73.9 87.4 98.7 109.8 137.4 170.0Leather and Allied Products 7.0 15.6 15.9 24.4 20.9 34.2 36.8 33.7 31.6 25.8 27.0Primary Textile Industries 0.6 0.9 1.5 3.6 3.1 3.3 3.6 4.4 8.3 7.4 5.1Textile Products Industries 2.2 1.7 1.0 1.6 1.8 1.9 2.7 7.1 7.2 9.9 22.2Clothing Industries 5.9 9.6 10.5 26.6 41.6 54.1 64.1 73.8 101.5 119.2 130.4Wood Industry 81.4 87.4 76.5 89.3 139.1 157.8 184.6 207.1 266.8 351.8 505.6Furniture and Fixtures Industries 17.2 16.7 20.1 34.7 48.3 59.8 79.9 102.7 132.1 131.1 128.0Paper and Allied Products 145.5 123.9 100.2 93.1 91.1 153.2 265.1 235.1 237.4 236.2 240.9Printing and Publishing Industries 14.3 12.5 14.9 15.5 22.3 33.0 44.1 46.5 65.3 92.9 101.4Primary Metal Industries 344.0 154.8 143.8 278.9 226.6 239.2 412.9 358.6 551.5 716.0 608.1Fabricated Metals Industries 21.7 25.7 25.5 15.9 21.2 32.3 42.8 57.8 63.8 76.6 72.0Machinery Industries 261.6 194.4 157.4 168.9 280.9 497.0 627.2 625.2 766.1 718.4 503.9Transport Equipment Industries 274.0 280.5 293.8 359.8 393.0 497.6 569.3 636.2 749.7 1048.1 1229.6Electric and Electronic Products 177.6 111.2 222.3 209.1 194.9 181.1 170.5 232.4 296.5 303.7 235.7Non-Metallic Mineral Products 7.7 8.8 4.8 5.2 5.0 12.4 18.1 22.3 24.5 34.6 44.5Refined Petroleum and Coal Industries 44.5 82.0 69.7 83.7 69.1 50.0 55.9 67.4 85.9 65.3 88.5Chemical and Products Industries 35.9 57.0 66.7 88.3 93.4 92.3 65.7 116.3 131.1 232.0 333.6Miscellaneous Manufacturing Industries 7.3 28.1 27.6 35.4 42.2 56.9 39.7 37.7 42.6 49.3 56.4
Electric Power Industry 24.5 33.9 57.3 96.2 203.9 280.7 279.9 284.8 309.8 356.2 343.0Trade 36.3 39.3 38.1 32.8 33.3 43.9 59.1 74.6 72.2 75.7 66.7
Wholesale Trade 36.2 39.3 38.0 30.1 28.8 41.9 57.2 72.0 70.9 75.7 66.7Retail Trade 0.0 0.0 0.1 2.6 4.5 2.0 2.0 2.5 1.3 0.1 0.0
Miscellaneous Industries 24.5 7.9 13.1 12.7 22.0 25.3 54.8 45.9 40.9 25.0 50.5Confidential and Low Value Exports 199.1 185.5 162.3 22.3 26.5 35.3 37.1 42.3 49.5 77.2 105.7
Total Exports 2929.6 2969.0 3079.1 3421.1 3676.8 4502.2 5455.5 6219.6 7313.9 8067.0 7981.4
Source: Manitoba Bureau of Statistics: Manitoba's Trade Trends

11
Trends in export revenues by industry are shown in Figure 1.5. Only mining showed an annual increase in 1999. Agriculture showed the sharpest decline from a high of $2,019.1 million in 1997 to $1,552.2 in 1999, a 23 percent decrease.
Figure 1.5 Manitoba Exports by Industry
0
1000
2000
3000
4000
5000
6000
1989 1990 1991 1992 1993 1994 1995 1996 1997 1998 1999
Year
Indu
stry
$'0
00,0
00
0
1000
2000
3000
4000
5000
6000
7000
8000
9000
Tota
l $'0
00,0
00
AgricultureMining
Manufacturing IndustryElectric Power IndustryTotal Exports

12
Table 1.5 illustrates the total import payments for Manitoba (1999: $8,235.3 million) by industry. The leading importing industry by value for 1999 was manufacturing at $7,770.6 (1998: $8,220.4 million), followed by agriculture at $222.5 million (1998: $182.0 million).
As of 1992 imports rose sharply, notably in the manufacturing industry category. Total imports peaked in 1998 with a total value of $8,643.0 million.
Table 1.5 Manitoba Imports by Industry ($'000,000)
Industry 1989 1990 1991 1992 1993 1994 1995 1996 1997 1998 1999
Agriculture 104.3 98.3 108.0 129.0 144.4 160.3 135.1 136.0 182.0 222.5Forestry 2.0 1.8 0.5 1.2 2.5 2.4 1.0 0.6 4.1 5.9Fishing, Hunting and Trapping 10.4 4.1 7.0 7.7 11.4 10.8 13.1 14.4 26.3 12.8Mining 27.7 45.6 36.0 41.0 55.4 78.5 37.2 36.8 43.5 47.6
Metal Mines 24.6 43.4 31.9 36.2 51.1 74.0 32.8 30.1 32.9 36.7Mineral Fuels 0.9 0.1 0.2 1.6 0.5 1.1 0.4 1.8 4.2 4.2Non-Metal Mines 1.4 1.5 3.0 2.2 2.4 2.1 2.3 2.8 3.7 4.2Quarries and Sandpits 0.8 0.6 0.9 1.0 1.4 1.3 1.6 2.1 2.7 2.5
Manufacturing Industry 2919.8 2800.0 3093.2 3814.9 4831.2 5577.6 5822.2 7170.8 8220.4 7770.6Food Industries 169.0 163.3 178.0 208.7 256.1 297.6 327.6 383.3 411.3 408.3Beverage Industries 14.3 13.7 15.4 15.5 17.7 23.2 18.2 20.0 22.2 26.9Tobacco Products Industries 2.8 4.2 4.6 5.4 9.6 10.8 11.4 4.6 0.6 1.1Rubber Products Industries 50.3 37.9 47.3 73.7 116.0 150.3 153.6 179.8 202.3 193.4Plastics Products Industries 69.7 63.8 68.3 78.4 104.7 122.6 134.8 180.5 175.3 195.3Leather and Allied Products 15.8 20.8 28.2 28.6 34.7 42.6 42.5 58.3 80.9 82.4Primary Textile Industries 29.5 33.0 44.7 49.9 59.2 77.1 72.8 83.5 90.4 92.3Textile Products Industries 22.4 30.1 39.3 43.5 43.4 48.1 61.7 89.3 107.8 119.7Clothing Industries 79.1 67.6 87.7 87.4 97.3 107.7 108.2 113.3 136.6 142.5Wood Industry 37.1 35.0 43.1 52.3 60.4 47.8 57.3 74.9 73.2 77.4Furniture and Fixtures Industries 25.1 35.8 41.0 56.9 76.5 74.0 66.4 89.7 121.9 118Paper and Allied Products 87.0 89.8 103.6 115.5 140.7 157.7 157.2 174.3 199.8 254.3Printing and Publishing Industries 121.0 136.3 152.6 169.8 180.4 227.3 233.1 252.6 274.9 282.7Primary Metal Industries 82.1 70.1 68.7 84.3 109.4 143.0 145.4 215.9 271.1 180.5Fabricated Metals Industries 124.2 133.9 138.7 182.5 227.9 251.4 302.0 362.0 555.4 515.1Machinery Industries 671.8 575.6 652.9 851.6 1088.8 1235.0 1362.1 1731.6 1839.5 1594.4Transport Equipment Industries 570.8 563.4 614.1 763.2 1145.7 1343.8 1228.0 1584.2 1681.5 1481.5Electric and Electronic Products 305.3 310.1 334.2 405.4 407.9 420.3 477.7 547.7 680.4 727.9Non-Metallic Mineral Products 35.2 35.2 42.7 47.1 51.1 51.8 62.2 80.6 105.4 110.4Refined Petroleum and Coal Industries 6.2 7.9 8.9 18.4 30.8 36.9 38.0 61.3 42.6 44Chemical and Products Industries 297.6 259.3 232.3 292.5 360.4 482.0 538.0 612.9 834.9 773.8Miscellaneous Manufacturing Industries 103.4 113.1 146.8 184.4 212.6 226.4 223.9 270.4 312.4 348.8
Electric Power Industry 13.8 3.5 0.1 9.7 2.6 1.3 4.1 1.1 29.3 29.5Trade 11.2 9.3 15.3 28.8 32.7 34.5 36.0 43.4 32.6 41.3
Wholesale Trade 11.0 9.1 14.8 28.4 32.4 34.2 35.8 43.0 32.6 41.2Retail Trade 0.2 0.2 0.5 0.4 0.3 0.3 0.2 0.5 0.0 0.1
Miscellaneous Industries 15.2 21.3 24.9 42.7 61.9 64.4 76.5 85.3 86.4 90.8Confidential and Low Value Imports 107.5 132.3 155.4 90.2 87.1 85.9 110.6 52.0 18.4 14.4
Total Imports 3194.3 3082.5 3410.4 4116.7 5162.5 6015.6 6235.7 7540.5 8643.0 8235.3
Source: Manitoba Bureau of Statistics: Manitoba's Trade Trends
13
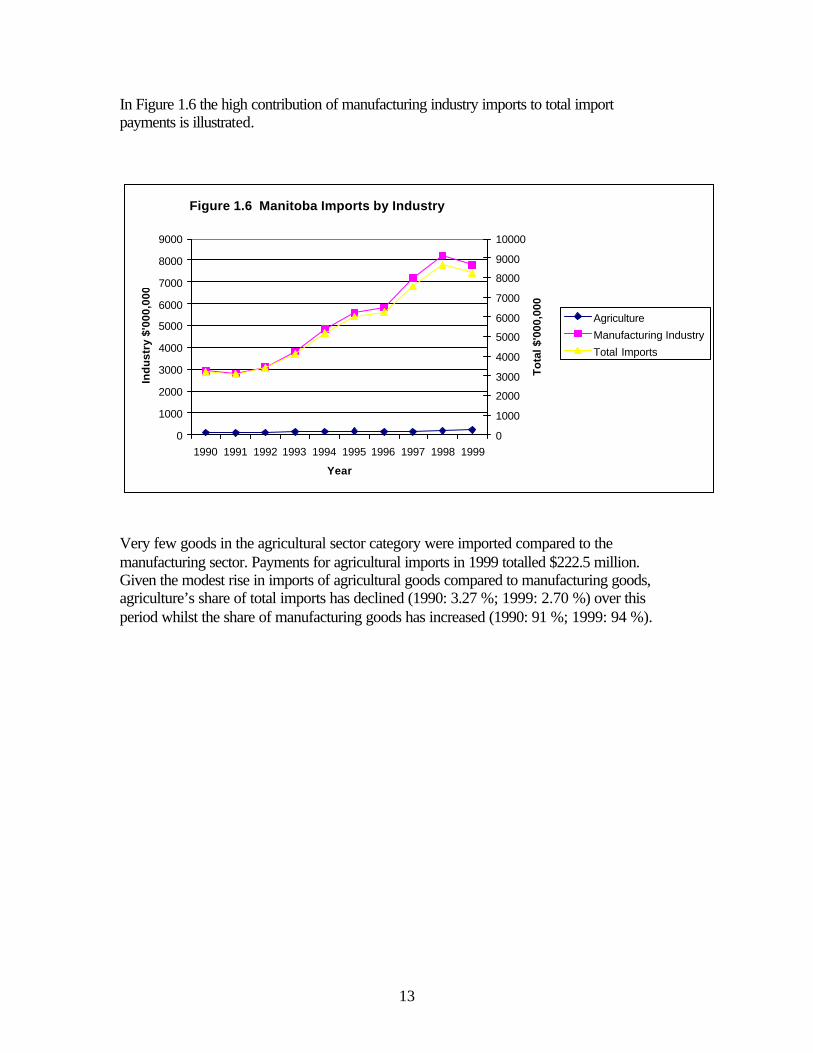
In Figure 1.6 the high contribution of manufacturing industry imports to total import payments is illustrated.
Very few goods in the agricultural sector category were imported compared to the manufacturing sector. Payments for agricultural imports in 1999 totalled $222.5 million. Given the modest rise in imports of agricultural goods compared to manufacturing goods, agriculture’s share of total imports has declined (1990: 3.27 %; 1999: 2.70 %) over this period whilst the share of manufacturing goods has increased (1990: 91 %; 1999: 94 %).
Figure 1.6 Manitoba Imports by Industry
0
1000
2000
3000
4000
5000
6000
7000
8000
9000
1990 1991 1992 1993 1994 1995 1996 1997 1998 1999
Year
Indu
stry
$'0
00,0
00
0
1000
2000
3000
4000
5000
6000
7000
8000
9000
10000
Tota
l $'0
00,0
00
AgricultureManufacturing IndustryTotal Imports

14
Table 1.6 shows the value of agricultural exports from Manitoba by region and country.
Table 1.6 Manitoba Agricultural Exports By Regions and Major Countries ($'000,000)
Region/Country 1985 1986 1987 1988 1989 1990 1991 1992 1993 1994 1995 1996 1997 1998 1999
Total 850.4 793.4 834.4 1039.4 850.2 1120.3 1190.3 1266.8 1205.6 1274.0 1463.5 1720.0 1987.7 1764.3 1552.2
N. America 146.4 107.8 119.7 169.5 161.6 266.8 261.9 340.0 400.6 394.8 435.9 618.7 735.7 698.6 704.4W. Europe 121.9 129.6 138.2 154.6 124.8 92.8 83.6 99.6 147.8 229.7 236.5 186.6 222.8 226.5 NAE. Europe 207.3 166.3 110.4 131.4 83.5 154.8 228.1 152.5 36.3 2.5 0.7 4.7 3.0 5.8 NAMid. East 46.9 50.4 69.7 62.5 99.7 82.8 65.2 52.2 53.2 63.9 72.1 87.6 168.3 51.4 NAAfrica 18.5 14.6 15.5 25.8 16.9 49.8 31.3 32.9 29.4 30.2 46.5 33.3 80.3 73.2 NAAsia 237.8 237.2 286.7 432.1 306.7 411.1 425.2 468.7 402.6 415.9 533.0 557.0 534.7 480.1 NAOceania 0.4 0.0 0.0 0.1 0.2 0.6 0.4 0.7 1.2 1.9 1.7 3.1 13.8 3.6 NAS. America 41.6 35.6 42.6 23.0 21.2 38.9 64.7 84.5 82.1 74.4 66.6 148.1 125.5 95.8 NAC. America 29.4 51.8 51.6 40.4 35.8 22.7 24.8 35.7 52.3 60.5 68.6 81.0 103.5 129.5 NA
USA 146.4 107.8 119.7 169.5 161.6 266.8 261.9 340.0 400.6 394.8 435.9 618.7 735.7 698.6 NABelgium 9.5 12.7 19.5 26.1 60.0 29.2 30.4 33.5 59.5 87.4 102.6 71.2 84.4 68.5 NANetherlands 21.4 24.3 35.7 NASpain 16.0 43.2 32.4 NAIran 0.0 0.0 15.6 15.9 31.9 33.4 40.1 42.1 21.2 48.2 63.1 59.9 112.8 27.6 NAUK 28.7 24.4 20.0 23.8 17.9 15.7 13.5 9.8 13.0 14.1 16.0 15.9 19.0 24.1 NAItaly 5.9 9.6 10.2 11.2 15.2 13.4 9.4 11.0 8.3 8.5 14.3 18.6 24.2 23.0 NAGermany 72.9 62.9 48.0 60.1 12.8 13.2 6.5 8.7 14.3 26.7 31.0 30.1 17.6 18.2 NAAlgeria 11.5 4.8 10.1 17.1 7.9 18.2 11.1 13.2 11.0 18.9 18.4 14.7 35.5 14.6 NASaudi Arabia 8.4 14.7 25.7 12.3 23.9 20.0 13.9 4.2 18.4 4.3 2.4 15.1 21.1 1.6 NAUSSR/Russia 185.2 139.5 96.0 126.8 75.9 151.4 222.3 151.5 15.0 0.0 0.0 0.0 1.8 0.0 NA
Table 1.6 Manitoba Agricultural Exports By Regions and Major Countries ($'000,000)(Continued)
Region/Country 1985 1986 1987 1988 1989 1990 1991 1992 1993 1994 1995 1996 1997 1998 1999
Japan 155.8 141.0 128.1 157.8 190.3 186.3 166.4 175.6 208.0 177.9 263.2 247.4 286.8 236.3 NAChina 55.4 59.7 104.8 241.0 69.4 167.7 180.9 207.9 88.5 104.9 216.8 178.0 71.7 155.0 NAS. Korea 2.4 14.3 23.1 1.9 3.6 5.4 24.3 14.6 66.9 77.2 8.7 35.6 38.2 6.9 NABangladesh 7.8 8.6 12.6 9.3 6.9 12.6 9.2 7.3 0.4 19.2 1.7 6.0 8.0 5.1 NAIndonesia 8.1 5.6 3.3 8.0 12.0 9.4 12.9 23.9 21.3 16.6 17.7 61.5 61.2 41.1 NABrazil 23.4 22.6 19.7 0.2 8.6 11.7 29.2 40.8 43.7 37.2 32.1 53.7 33.9 18.1 NAVenezuela 17.6 4.3 7.6 13.3 4.9 13.2 18.7 12.1 6.9 6.0 10.0 26.7 23.0 21.8 NAColumbia NA NA NA NA NA 9.7 7.6 14.1 14.0 10.3 13.2 31.4 28.1 26.7 NAChile 24.5 10.0 3.9 NACuba 21.8 36.6 29.0 21.7 15.6 13.5 10.2 4.7 4.8 4.6 7.2 2.3 12.8 9.4 NAMexico 3.6 11.2 18.5 15.0 12.6 2.5 7.0 23.1 38.3 49.0 58.4 69.9 78.5 101.1 NA
Sources: Manitoba Bureau of Statistics: Manitoba's Foreign Trade, Table 1, 7.

15
Table 1.7 shows non-agricultural export values from Manitoba by region and country.
Table 1.7 Manitoba Non-Agricultural Exports by Regions and Major Countries ($'000,000)
Region/Country 1985 1986 1987 1988 1989 1990 1991 1992 1993 1994 1995 1996 1997 1998 1999
Total 1440.2 1441.5 1773.6 1978.8 2079.3 1848.7 1888.8 2154.3 2471.2 3228.2 3991.3 4496.0 5294.0 6211.9 6429.2
N. America 1215.0 1202.3 1393.6 1632.5 1711.4 1509.4 1584.0 1775.1 2105.6 2863.3 3522.1 3889.4 4627.1 5364.1 5883.9W. Europe 50.0 78.2 104.7 142.9 176.4 150.2 126.1 156.9 136.4 126.1 171.0 187.2 181.6 211.0 NAE. Europe 9.1 0.5 0.9 0.3 2.4 4.2 3.7 3.0 2.8 4.9 2.9 3.2 2.1 5.5 NAMis. East 11.3 3.4 2.4 9.7 4.8 8.4 4.4 11.7 12.6 4.8 11.9 9.2 10.2 12.6 NAAfrica 11.5 1.9 4.7 5.5 6.0 3.9 4.7 12.4 7.1 7.6 10.4 37.8 42.9 8.5 NAAsia 71.8 52.2 68.5 141.6 124.3 138.9 136.6 170.3 161.1 187.1 226.0 320.0 381.0 539.6 NAOceania 21.5 7.2 4.5 13.9 19.3 9.1 5.0 5.3 6.9 8.3 10.3 10.9 19.8 24.8 NAS. America 7.1 4.6 8.6 17.0 13.3 6.6 11.3 25.1 13.3 8.2 12.4 12.7 7.9 10.9 NAC. America 11.6 17.5 9.8 15.3 21.5 17.9 13.0 14.6 25.3 17.9 24.3 25.6 21.4 34.8 NA
USA 1215.2 1202.7 1393.7 1632.5 1711.4 1509.4 1584.0 1775.1 2105.6 2862.9 3521.2 3889.2 4627.0 5364.0 NAUK 24.8 27.5 19.4 34.3 19.1 38.2 32.8 48.2 32.3 24.0 30.3 70.0 59.3 86.8 NABelgium 1.6 0.7 1.3 49.8 72.4 64.8 52.3 56.1 50.7 45.1 77.7 57.9 64.0 55.4 NAFrance 8.1 15.0 15.2 12.9 12.6 11.9 10.9 13.8 10.2 7.9 20.2 14.0 11.2 19.0 NANetherlands 3.8 9.5 18.9 NAGermany 6.4 17.4 27.6 14.7 19.4 15.7 13.6 10.1 11.1 15.2 12.4 7.2 18.9 9.9 NAUSSR/Russia 0.0 0.0 0.0 0.0 0.9 2.5 0.2 0.9 1.3 1.3 1.1 1.8 0.5 0.6 NASaudi Arabia 4.5 0.5 0.3 0.2 0.4 1.0 0.5 0.4 0.9 0.2 3.8 3.4 1.1 0.7 NAIran 0.0 0.0 0.0 0.0 0.0 3.6 0.8 1.0 1.2 2.0 2.0 2.1 0.9 0.0 NAAlgeria 9.9 0.0 0.9 1.6 0.9 0.9 2.7 2.6 2.2 2.3 0.0 0.0 0.0 0.2 NA
Table 1.7 Manitoba Non-Agricultural Exports by Regions and Major Countries ($'000,000)(Continued)
Region/Country 1985 1986 1987 1988 1989 1990 1991 1992 1993 1994 1995 1996 1997 1998 1999
Japan 29.4 33.1 37.5 50.9 53.6 58.9 52.4 64.3 66.1 77.3 88.7 116.8 148.4 139.8 NAHongkong 6.5 8.6 24.6 15.8 20.0 14.6 30.8 26.7 181.5 NATaiwan 35.8 30.2 40.7 29.7 27.6 34.0 45.7 45.8 64.0 NAChina 1.1 1.6 6.4 9.2 4.3 0.1 1.7 2.1 8.4 20.2 27.8 65.8 75.3 55.7 NAS. Korea 1.9 1.5 2.3 9.7 13.9 11.8 10.9 11.9 11.6 13.0 19.3 17.8 42.2 11.9 NAIndonesia 14.8 0.5 3.5 4.2 2.6 4.7 3.3 4.5 4.6 9.9 0.3 NAAustralia 10.1 18.2 20.8 NASouth Africa 9.6 4.8 2.0 NAIndia 30.5 9.6 0.4 16.4 0.7 2.2 2.3 2.3 6.0 1.0 2.8 7.3 6.7 15.5 NABrazil 5.1 2.2 6.4 11.5 6.6 1.0 5.5 8.1 4.2 1.7 2.6 6.5 1.5 2.3 NAMexico 6.5 8.1 1.9 7.3 11.9 10.6 8.5 9.2 13.5 11.4 12.9 17.3 14.2 21.4 NAVenezuela 2.6 2.5 2.2 NAChile 0.7 0.9 1.8 NAColumbia 0.9 0.9 1.0 NA
Sources: Manitoba Bureau of Statistics: Manitoba's Foreign Trade, Table 2, 7.

16
Table 1.8 shows Manitoba’s total export value by region and country. Notwithstanding lower total exports in 1999 ($7,981.4 million) compared to 1998 ($8,067.0 million), exports increased to two regions. The North American region posted a 6.85 percent or $415.6 million increase in exports from Manitoba for 1999 to reach $6,484.2 million. Exports to the Middle East rose an astounding 82 percent or $49.1 million to reach $108.6 million in 1999.
Countries from the North American and Mid East regions with reported increased exports from Manitoba in 1999 were the USA ($6,484.0 million) and Iran ($64.9 million). The 1999 increase in exports to the USA of $415.5 million accounts for 99.98 percent of
Table 1.8 Manitoba Total Exports by Regions and Major Countries($000'000)
Region/Country 1985 1986 1987 1988 1989 1990 1991 1992 1993 1994 1995 1996 1997 1998 1999
Total Exports 2290.6 2234.9 2603.0 3018.2 2929.6 2969.0 3079.1 3421.1 3676.8 4502.2 5455.5 6219.6 7313.9 8067.0 7981.4
N. America 1361.5 1310.5 1513.4 1802.1 1872.9 1776.2 1851.0 2095.1 2506.3 3258.1 3957.8 4508.9 5381.6 6068.6 6484.2W. Europe 172.0 207.7 242.9 297.5 301.2 243.0 209.7 256.4 284.2 355.9 409.1 376.5 407.8 424.7 303.8E. Europe 216.4 166.8 111.3 131.7 85.8 159.0 231.9 155.5 39.1 7.4 3.6 7.9 5.1 11.1 4.0Mid. East 58.3 53.7 72.1 72.3 104.4 91.2 69.6 63.9 65.9 68.7 84.0 96.9 180.9 59.5 108.6Africa 30.1 16.6 20.2 31.3 23.0 53.7 36.1 45.3 36.5 37.8 57.0 71.0 124.1 68.9 43.0Asia 309.6 289.4 355.2 573.6 430.9 550.1 561.7 639.1 563.7 603.0 759.0 877.0 919.5 1126.6 778.5Oceania 21.9 7.2 4.5 14.0 19.5 9.7 5.4 6.0 8.2 10.2 12.1 14.0 33.7 28.4 25.8S. America 48.8 40.3 51.2 40.0 34.5 45.5 76.0 109.5 95.4 82.6 79.4 160.7 135.4 98.5 82.7C. America 41.0 69.3 61.4 55.7 57.3 40.6 37.7 50.3 77.6 78.4 92.8 106.5 125.7 180.9 150.6
USA 1361.4 1310.1 1513.2 1802.1 1872.9 1775.2 1851.0 2095.1 2506.2 3257.7 3957.0 4508.7 5381.5 6068.5 6484.0Belgium 11.1 13.3 20.8 75.9 132.5 94.0 82.7 89.7 110.2 132.5 181.6 129.6 149.5 119.1 87.6UK 53.4 51.9 39.4 58.0 65.3 53.9 46.2 58.0 45.3 38.2 46.2 85.9 78.6 108.7 66.7Netherlands 12.3 14.1 21.4 23.7 30.2 36.8 27.2 33.9 52.1 30.8Spain 3.6 5.1 18.7 30.9 44.2 25.9 17.8 43.8 33.1 28.8Germany 79.3 80.3 75.7 74.9 32.2 27.5 20.1 18.7 25.4 41.9 43.7 37.2 38.5 27.4 23.6France 11.8 18.8 19.2 16.6 16.6 15.5 14.9 17.2 23.2 32.9 31.8 16.6 12.0 20.3 19.5Italy 7.3 11.2 12.9 13.6 19.4 15.2 11.5 12.6 10.3 9.6 16.1 20.2 25.3 23.3 15.2USSR/Russia 185.2 139.5 96.0 126.8 76.8 153.9 222.5 152.4 16.3 1.3 1.1 1.8 2.3 0.6 0.4Saudi Arabia 12.9 15.2 26.0 12.5 24.3 21.1 14.4 4.6 19.3 4.5 6.1 18.7 22.2 2.3 1.1Iran 0.0 0.0 15.6 15.9 31.9 37.0 40.9 43.1 22.4 50.2 65.1 62.1 115.7 24.8 64.9Algeria 21.4 4.8 11.0 18.7 8.7 19.2 13.8 15.8 13.3 21.1 18.4 14.7 35.8 13.8 10.9
Table 1.8 Manitoba Total Exports by Regions and Major Countries($000'000)(Continued)
Region/Country 1985 1986 1987 1988 1989 1990 1991 1992 1993 1994 1995 1996 1997 1998 1999
Japan 185.2 174.1 165.5 208.7 243.9 245.1 218.7 239.8 274.1 255.2 351.9 364.2 435.9 403.5 378.1China 56.5 61.3 111.2 250.2 73.7 167.8 182.6 210.0 96.9 125.1 244.7 243.8 147.6 228.3 171.8Hongkong 7.3 9.9 25.1 16.2 20.4 14.9 31.3 26.9 231.8 47.6Taiwan 42.1 35.0 45.3 30.7 29.0 37.5 47.9 47.4 64.4 33.7S. Korea 4.4 15.8 25.3 11.6 17.4 17.3 35.2 26.5 78.5 90.1 28.1 53.3 80.9 21.2 21.0Indonesia 8.4 6.7 6.8 22.9 12.5 12.9 17.2 26.5 26.0 19.8 22.2 66.2 71.9 37.2 19.9India 32.1 10.4 1.7 18.4 1.7 3.7 3.7 22.3 10.7 10.2 4.2 7.3 22.3 16.8 21.8Brazil 28.5 24.8 26.0 11.7 15.2 12.7 34.7 49.0 47.9 38.8 34.7 60.1 35.7 19.0 11.7Venezuela 18.4 4.9 9.5 14.5 6.2 14.3 20.9 14.4 8.6 8.0 13.4 29.3 25.5 22.3 25.5Columbia 11.2 8.7 15.8 14.7 11.1 15.5 32.4 29.6 25.3 19.0Chile 1.1 3.0 5.5 7.1 9.5 8.8 25.2 11.0 5.3 7.2Cuba 22.0 38.9 29.1 22.1 15.9 13.8 10.5 5.9 11.8 5.0 7.4 2.9 13.4 11.0 20.0Mexico 10.1 19.3 20.4 22.3 24.4 13.1 15.5 32.3 51.8 60.4 71.1 87.2 93.3 141.1 104.3
Source: Manitoba Bureau of Statistics: Manitoba's Trade Trends

17
increased exports to the North American region. The 1999 increase in exports to Iran of $40.1 million represents 82 percent of increased exports to the Middle East. Table 1.9 shows Manitoba’s total import value by region and country. Again, notwithstanding lower total imports in 1999 ($8,235.3 million) compared to 1998 ($8,643.0 million), three distinct regions showed an increase in trade; Asia, Oceania and South America.
For the most part, the reduction of imports from the North American region totalling $306.7 million or 4.12 percent in 1999 was the main source of decline. According to these figures the USA wholly accounts for the reduced imports from North America as a
Table 1.9 Manitoba Total Imports by Regions and Major Countries($'000,000)
Region/Country 1990 1991 1992 1993 1994 1995 1996 1997 1998 1999
Total 3211.9 3116.0 3440.3 4165.3 5229.4 6015.6 6235.7 7540.5 8643.0 8235.3
N. America 2762.6 2648.8 2941.6 3642.3 4592.6 5247.4 5397.7 6415.0 7447.4 7140.7W. Europe 183.3 206.9 205.9 209.4 256.5 358.6 429.9 435.0 553.2 462.4E. Europe 1.7 2.5 5.0 6.4 8.0 8.4 8.7 13.1 11.9 7.7Mid. East 2.9 2.3 2.4 2.5 3.2 5.4 6.1 4.2 8.6 7.0Africa 0.4 0.3 0.8 1.1 4.7 3.5 3.8 6.7 8.0 7.9Asia 220.5 212.3 228.2 237.1 269.1 276.8 282.3 355.0 406.7 413.6Oceania 3.9 2.9 6.4 8.9 9.5 11.0 11.7 9.2 23.4 25.9S. America 16.1 24.5 29.5 30.2 52.1 60.8 40.8 57.4 57.3 58.5C. America 20.7 15.6 20.4 27.2 33.7 43.6 54.6 244.8 126.7 111.7
USA 2762.6 2648.8 2941.6 3642.3 4592.6 5247.4 5397.6 6415.0 7447.4 7140.7UK 51.9 71.2 62.6 64.3 76.5 96.0 95.1 114.0 188.2 115.4Germany 45.2 48.6 47.8 52.8 73.3 103.6 134.5 107.4 104.4 100.1Italy 19.8 17.6 20.8 22.0 28.9 59.2 95.2 53.7 87.4 82.6France 31.7 39.2 44.4 25.6 19.6 21.6 27.1 72.3 66.4 41.9Belgium 1.5 1.5 4.0 3.9 4.7 7.3 9.3 7.8 15.0 11.3Netherlands 7.1 7.4 6.5 9.7 7.8 14.6 16.4 14.6 14.0 22.4Spain 1.6 1.8 2.5 3.1 3.6 4.8 4.8 6.8 12.0 8.8South Africa 0.1 0.1 0.2 0.7 2.2 2.8 3.2 4.0 6.0 6.7Israel 0.5 0.4 0.7 0.8 0.5 2.4 3.6 2.1 5.1 4.6USSR/Russia 0.1 0.4 1.5 0.7 0.5 1.4 1.7 1.6 1.2 1.0
Table 1.9 Manitoba Total Imports by Regions and Major Countries($'000,000)(Continued)
Region/Country 1990 1991 1992 1993 1994 1995 1996 1997 1998 1999
Japan 98.6 79.7 82.0 85.1 85.2 71.8 84.6 107.5 100.2 90.4China 20.8 21.3 31.0 33.3 46.6 52.9 58.7 84.4 116.1 130.4Hongkong 15.0 19.9 24.2 25.1 24.8 27.0 22.5 22.2 24.1 21.7Taiwan 27.8 34.4 35.6 36.2 38.9 44.1 38.7 44.5 52.1 53.1S. Korea 38.7 30.5 32.6 29.6 30.1 29.2 24.4 24.8 26.7 29.5Indonesia 2.5 2.0 2.0 4.9 6.2 6.7 5.3 6.1 8.9 12.8India 0.9 1.4 2.1 1.5 2.5 6.7 9.9 9.8 14.4 17.7Brazil 4.4 5.8 9.0 8.6 18.4 24.6 6.2 7.7 7.4 13.1Venezuela 0.0 0.0 0.3 0.0 0.1 0.1 0.5 8.9 0.7 1.2Columbia 3.6 4.1 6.9 9.4 17.0 15.7 11.2 14.4 15.7 10.0Chile 3.8 3.8 3.3 3.8 3.9 3.7 4.3 3.8 4.4 6.6Mexico 15.6 12.7 16.0 20.7 22.8 32.0 47.7 234.8 117.4 104.4Singapore 1.4 8.6 2.5 1.6 8.3 10.5 11.7 16.2 18.4 8.1Australia 2.3 1.6 3.4 6.3 6.7 7.4 8.4 5.0 19.4 20.6
Source: Manitoba Bureau of Statistics: Manitoba's Trade Trends

18
region. The USA also accounts for 75 percent of the total decline in imports of $407.7 million in 1999. Countries from which Manitoba did in fact import more in 1999 compared to the previous year were The Netherlands (1998: $14.0 million; 1999: $22.4 million), South Africa (1998: $6.0 million; 1999: $6.7 million), China (1998: $116.1 million; 1999: $130.4 million), Taiwan (1998: $52.1 million; 1999: $53.1 million), South Korea (1998: $26.7 million; 1999: $29.5 million), Indonesia (1998: $8.9 million; 1999: 12.8 million), India (1998: $14.4 million; 1999: $17.7 million), Brazil (1998: $7.4 million; 1999: $13.1 million), Venezuela (1998: $0.7 million; 1999: 1.2 million), Chile (1998: $4.4 million; 1999: $6.6 million) and Australia (1998: $19.4 million; 1999: $20.6 million).

19
Figures 1.7 and 1.8 illustrate the dominant and growing importance of North American (mostly the United States) trade for Manitoba.
Figure 1.7 Manitoba Total Exports by Region
0
1000
2000
3000
4000
5000
6000
7000
8000
9000
1985 1986 1987 1988 1989 1990 1991 1992 1993 1994 1995 1996 1997 1998 1999
Year
$'00
0,00
0
C. AmericaS. America
OceaniaAsia
AfricaMid. EastE. Europe
W. EuropeN. America
Figure 1.8 Manitoba Total Imports by Region
0
1000
2000
3000
4000
5000
6000
7000
8000
9000
10000
1990 1991 1992 1993 1994 1995 1996 1997 1998 1999
Year
$'00
0,00
0
C. AmericaS. America
OceaniaAsia
AfricaMid. EastE. Europe
W. EuropeN. America

20
The tapering of imports from North America (exclusively the USA) in 1999, yet sustained growth of exports to North America (predominantly the USA) is worth noting. The interpretation of these developments should take cognisance, amongst others, of the affects of monetary policy on the terms of trade. Trends in trade with Asia are also of interest. Second to North America, Asia holds the largest share of exports from Manitoba (1999: $778.5 million). Japan is the major importer of Manitoba goods (1999: $378.1 million) at 49 percent of Asian imports and 4.73 percent of total Manitoban exports. On the import side, Asia (1999: $413.6 million) holds third place after North America (1999: $7140.7 million) and Western Europe (1999: $462.4 million). However, whereas the value of goods imported from Western Europe declined in 1999 compared to 1998, imports from Asia increased by 1.70 percent. This makes Asia the primary region of growth of imports to Manitoba in 1999. China leads imports to Manitoba (1999: $ 130.4 million) with a share of 32 percent of Asian imports to Manitoba and 1.58 percent of total imports to Manitoba in 1999. Imports from China increased 12.3 percent ($14.3 million) in 1999.

21
1.2 SURFACE COMMODITY MOVEMENTS 1.2.1 Truck Table 1.10 shows the movement of goods from province or territory of origin to Manitoba by for-hire trucking.
Table 1.10 For-hire Trucking, Estimated Transport Revenues, Tonnage, Tonne-Kilometers and Number of Shipments on the Movement of Goods from Province or Territory of Origin to Manitoba*
Origin Nfld* PEI NS NB QUE ONT MAN SASK ALTA BC* Yukon NWT TOTAL
Revenue ($'000)
1986 31 20 1735 1044 22440 60842 67833 19998 32528 23590 174 536 2307731987 69 30 1623 958 24448 71442 69047 18279 32837 24484 24 26 2432681988 64 42 1037 867 17068 67328 63763 19594 33967 23121 6 294 2271501989 112 79 827 384 18284 72003 63288 18451 30951 21704 21 255 2263601990 381 36 385 383 17646 66766 56783 19085 35307 24001 43 32 2208471991 21 16996 60837 62855 17239 32960 24906 32 2173291992 373 28 503 716 20556 57830 59389 18824 33367 26481 15 37 2181191993 281 12 1353 1015 16455 65781 65770 17214 33335 24966 33 23 2262381994 13 15 1211 1087 18974 74476 72579 14962 40823 27869 0 22 2520311995 514 10 1250 1176 21406 84040 74184 19719 50186 24148 23 142 2767981996 459 55 851 1877 22358 101018 84758 31811 47929 30073 47 72 3213081997 9066 - - - 89810 383145 1081140 - - 196901 - - 17600621998 8438 - - - 83772 361689 1068889 - - 206212 - - 17289991999 10793 - - - 91186 383606 1200098 - - 185167 - - 1870851
Tonnes ('000)
1986 6 1 101 381 4779 866 625 191 3 69551987 2 2 117 441 4286 586 605 225 62651988 1 2 91 477 4189 729 658 245 64011989 1 3 1 89 494 4187 617 435 165 59921990 1 95 471 4085 727 548 245 61711991 87 393 3576 479 446 187 51721992 2 0 0 2 82 358 2914 594 477 185 0 0 46141993 0 0 3 3 64 387 2453 504 473 197 0 0 40841994 0 0 3 5 83 453 2566 492 612 184 0 0 43981995 11 0 1 2 104 543 3429 545 731 210 0 0 55761996 1 0 1 12 145 728 3547 1000 681 261 0 0 63761997 17 - - - 361 1820 33701 - - 2733 - - 386331998 16 - - - 349 1731 42457 - - 2951 - - 475041999 27 - - - 407 1883 46431 - - 2586 - - 51335
Tonne-Kilometers ('000)
1986 69 100 21046 3720 236175 681795 1002438 596664 755638 414856 487 6541 37195311987 340 436 6856 6235 282821 833164 1033822 299609 746235 513543 117 77 37232561988 249 119 3155 5740 218163 822367 941535 324066 805419 568168 32 260 36892321989 333 2630 9344 3016 211748 898612 712550 288538 558463 370081 56 420 30557931990 822 99 1420 4024 225187 849606 667179 302837 707468 487390 125 77 32462341991 65 206149 723017 588384 245507 589846 415777 70 42 27784721992 8522 82 1581 5096 196641 713635 564903 277503 616612 419945 41 61 28046221993 451 35 11961 9414 152810 751429 646763 262451 607889 454916 488 37 28986441994 27 133 11746 15557 197877 900145 630307 271514 796512 431582 0 64 32554641995 54995 39 4979 5386 252635 1064187 614507 248910 972765 488621 89 171 37072841996 2673 949 4369 38037 347748 1439164 645283 605210 914202 608868 66 366 46069351997 71726 - - - 1134536 4989021 11635301 - - 2809711 - - 206402951998 74391 - - - 1121926 4731479 15614302 - - 3041331 - - 245834301999 129021 - - - 1322427 5160384 14591293 - - 2709782 - - 23912907

22
The interpretation of data is confounded by the aggregation of data for Manitoba, Saskatchewan and Alberta as of 1997.
Table 1.10 For-hire Trucking, Estimated Transport Revenues, Tonnage, Tonne-Kilometers and Number of Shipments on the Movement of Goods from Province or Territory of Origin to Manitoba*
Origin Nfld* PEI NS NB QUE ONT MAN SASK ALTA BC* Yukon NWT TOTAL
Number of Shipments ('000)
1986 0.3 1.0 1.3 88.8 244.4 653.2 87.2 102.0 60.8 0.1 0.5 1239.41987 0.3 0.1 1.5 1.5 92.1 281.0 578.6 69.3 97.4 60.3 0.2 0.2 1182.51988 0.1 0.1 1.0 1.0 79.4 251.4 605.1 67.9 93.4 57.5 0.0 0.3 1157.31989 0.2 0.3 1.1 1.1 80.7 248.4 600.2 69.9 85.7 58.1 0.0 0.1 1145.61990 0.1 0.1 0.9 0.9 67.8 217.4 539.2 78.7 98.3 55.9 0.5 0.2 1060.01991 0.0 61.0 193.9 579.8 66.8 94.0 62.5 0.0 0.0 1060.11992 0.5 0.0 0.6 1.0 50.6 175.1 522.8 69.5 90.8 64.8 0.0 0.2 975.91993 0.1 0.0 2.3 2.1 41.7 174.2 468.0 59.9 93.5 52.5 0.0 0.0 894.31994 0.0 0.0 1.0 1.1 39.0 158.3 508.8 56.5 99.4 52.3 0.0 0.1 916.51995 0.5 0.0 1.0 0.9 49.3 177.7 577.4 63.3 107.1 45.4 0.0 0.1 1022.71996 0.2 0.1 0.8 3.1 49.6 234.8 655.2 88.3 117.2 58.9 0.3 0.3 1208.81997 13.4 - - - 179.8 805.3 4779.1 - - 532.9 - - 6310.51998 9.9 - - - 184.0 796.2 4411.6 - - 609.1 - - 6010.81999 11.3 - - - 182.2 773.8 5018.9 - - 552.9 - - 6539.0
* As of 1997: Nfld = Atalntic Provinces; Man = Manitoba, Saskatchewan, Alberta; BC = British Columbia, Yukon, NWT.
Sources: Statistics Canada, Trucking in Canada (53-222): Table 3.6(1998-1999); Table 3.4(1997). For the years 1992 through 1996 data was obtained on a special run from Statistics Canada.

23
Table 1.11 shows the movement of goods from Manitoba to province or territory of destination by for-hire trucking.
Table 1.11 For-hire Trucking, Estimated Transport Revenues, Tonnage, Tonne-Kilometers and Number of Shipments on the Movement of Goods from Manitoba to Province or Territory of Destination*
Destination Nfld* PEI NS NB QUE ONT MAN SASK ALTA BC* Yukon NWT TOTAL
Revenue ($'000)
1986 218 45 3848 2291 14038 55581 67833 34886 32217 18724 396 1195 2312731987 1470 70 3232 1929 16717 62210 69047 40328 33515 21913 152 505 2510891988 826 115 2485 824 15692 64536 63763 34552 32046 25902 619 693 2420531989 459 102 4125 1433 14487 60833 63288 30201 34784 27755 184 1393 2390461990 456 93 2538 1389 14535 59813 56783 34611 31999 21200 172 330 2239201991 1662 1190 14553 53412 62855 32210 34784 24493 2279921992 525 51 2471 1694 12775 54046 59389 32257 28578 25707 154 397 2180441993 330 39 1720 597 12077 64452 65770 31824 31968 25242 299 227 2345451994 221 35 2313 1197 11620 59562 72579 31942 39603 33463 359 161 2530551995 155 182 2104 2633 14985 59280 74184 33733 41665 36565 65 323 2658741996 195 30 2173 523 14744 65499 84758 40524 44017 40842 84 434 2938231997 15299 - - - 45322 155150 1081140 - - 340951 - - 16378621998 14955 - - - 42715 147547 1068889 - - 334490 - - 16085961999 18305 - - - 45245 161417 1200098 - - 309069 - - 1734135
Tonnes ('000)
1986 16 6 115 541 4779 463 331 117 1 2 63711987 5 10 5 120 975 4286 625 328 117 1 64721988 1 10 3 111 707 4189 630 373 178 1 1 60241989 1 11 4 101 631 4187 393 369 155 5 58601990 1 1 6 3 112 645 4085 682 401 125 1 60621991 98 633 3576 353 354 134 51651992 1 1 4 3 76 573 2914 380 243 148 0 1 43441993 0 0 5 1 74 656 2453 369 301 137 0 0 39961994 0 0 8 3 89 747 2566 391 377 172 0 1 43541995 0 1 7 12 120 700 3429 503 452 234 0 1 54591996 0 0 6 1 131 842 3547 565 396 273 1 1 57631997 34 - - - 303 1266 33701 - - 3822 - - 391271998 37 - - - 302 1177 42457 - - 4045 - - 480181999 45 - - - 322 1370 46431 - - 3946 - - 52114
Tonne-Kilometers ('000)
1986 1251 268 56310 18165 265094 713769 1002438 269786 435143 271533 1883 5894 30415331987 24551 879 35822 17223 290962 1840400 1033822 391210 463284 279158 715 2001 43800281988 4040 693 37005 8505 270615 1058860 941535 330719 497400 416286 4431 1334 35714221989 3909 835 41460 13026 244557 926425 712550 233252 490949 363790 1487 12506 30447461990 6434 3235 21484 9568 276307 929532 667179 360062 543328 292850 795 1869 31126441991 243037 820887 588384 221148 480968 312325 27300201992 4501 183 13892 9782 187318 765092 564903 238587 322582 344084 426 2493 24538431993 1026 94 19118 4644 181698 933823 646763 233290 402117 321402 1496 836 27463071994 832 93 29426 8543 224067 1006194 630307 238444 494933 404459 1246 1960 30405041995 1095 1716 25834 38948 308243 907647 614507 302932 587895 550656 233 1737 33414431996 948 135 22250 3938 324913 985865 645283 346724 525000 644814 1884 2061 35038151997 156655 - - - 954133 2426728 11635301 - - 3870562 - - 190433731998 162808 - - - 955636 2352858 15614302 - - 3929516 - - 230151201999 202338 - - - 982967 2754945 14591293 - - 3784696 - - 22316237

24
The interpretation of data is confounded by the aggregation of data for Manitoba, Saskatchewan and Alberta as of 1997. Table 1.12 shows the Southbound movement of goods from Manitoba to US regions by for-hire trucking. Estimated revenues, tonnes, tonne-kilometres and shipments are reported.
Table 1.12 For-hire Trucking, Southbound Movements of Goods, Manitoba to US RegionsOrigin Destination 1990 1991 1992 1993 1994 1995 1996 1997 1998 1999
Estimated Revenue($'000)MB Northeast 4292 4699 3455 5253 7782 7539 9811 23884 22616 30255MB North 16630 14561 17048 21682 24217 33910 41343 121772 129958 138822MB South 2971 4129 4657 8090 11930 13479 16878 69599 71696 92708MB West 3649 3303 2718 4416 7322 9742 14692 104788 96077 119416MB USA 27541 26692 27878 39441 51251 64670 82724 320043 320347 381201CANADA USA 828076 857717 1071323 1333234 1679255 1930782 2130532 2441336 2668475 3296405MB MEX 12CANADA MEX 647 5199 6858
Estimated Tonne('000)MB Northeast 36 32 25 35 91 38 59 145 126 163MB North 309 284 366 393 622 591 708 1593 1952 1890MB South 27 39 43 66 98 94 121 404 444 516MB West 37 30 27 49 69 68 118 1149 1034 1273MB USA 409 385 462 543 880 790 1006 3291 3556 3842CANADA USA 15000 14513 16657 20389 24637 26884 29203 33376 34172 41126MB MEX 19CANADA MEX 4751 21637 23042
Table 1.11 For-hire Trucking, Estimated Transport Revenues, Tonnage, Tonne-Kilometers and Number of Shipments on the Movement of Goods from Manitoba to Province or Territory of Destination*
Destination Nfld* PEI NS NB QUE ONT MAN SASK ALTA BC* Yukon NWT TOTAL
Number of Shipments ('000)
1986 1.1 0.2 4.6 2.9 41.6 329.8 653.2 258.4 130.2 52.4 1.1 2.2 1477.81987 2.9 0.9 5.4 4.0 46.1 289.5 578.6 254.5 130.3 58.9 0.7 0.9 1372.71988 1.5 0.3 4.6 3.3 38.1 266.0 605.1 219.5 118.8 61.6 0.8 1.1 1320.71989 1.8 0.4 5.5 4.2 37.7 270.6 600.2 221.7 123.3 64.7 1.2 1.5 1333.01990 1.0 0.5 3.7 4.0 31.6 1.0 539.2 233.4 114.4 54.9 1.1 1.3 1263.11991 3.1 3.4 30.3 257.4 579.8 217.3 113.2 55.7 1264.11992 0.6 0.4 2.0 1.9 24.9 248.9 522.8 208.6 96.6 52.5 0.3 1.5 1161.01993 0.9 0.3 3.0 1.6 19.1 219.8 468.0 194.6 91.4 52.0 0.6 0.6 1051.91994 0.7 0.1 3.8 2.0 23.8 216.8 508.8 164.6 92.0 49.2 0.6 0.4 1062.81995 0.7 0.1 1.9 2.5 26.1 199.5 577.4 165.5 100.3 52.5 0.4 0.5 1127.41996 0.7 0.1 2.3 2.0 28.6 223.8 655.2 230.1 120.1 71.2 0.4 1.4 1335.91997 13.9 - - - 56.8 361.8 4779.1 - - 842.7 - - 6054.31998 13.6 - - - 58.0 326.7 4411.6 - - 801.7 - - 5611.71999 15.1 - - - 64.0 339.2 5018.9 - - 802.6 - - 6239.8
* As of 1997: Nfld = Atalntic Provinces; Man = Manitoba, Saskatchewan, Alberta; BC = British Columbia, Yukon, NWT.
Sources: Statistics Canada, Trucking in Canada (53-222): Table 3.6(1998-1999); Table 3.4(1997). For the years 1992 through 1996 data was obtained on a special run from Statistics Canada.
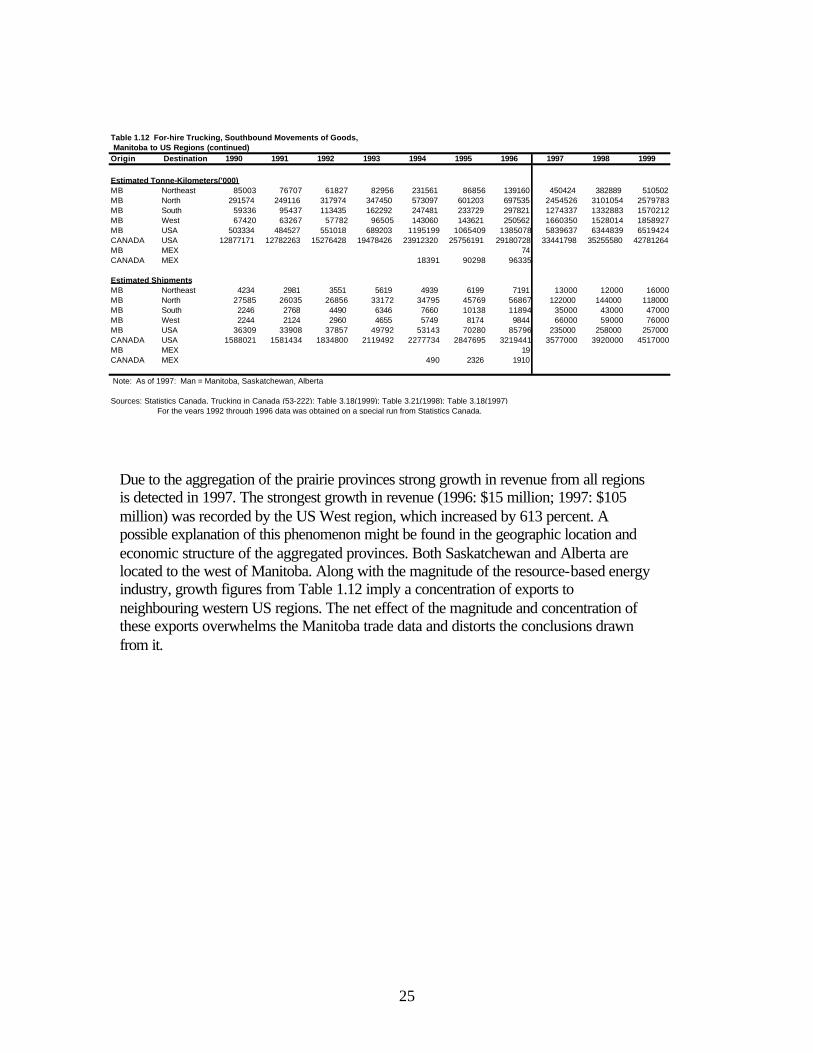
25
Due to the aggregation of the prairie provinces strong growth in revenue from all regions is detected in 1997. The strongest growth in revenue (1996: $15 million; 1997: $105 million) was recorded by the US West region, which increased by 613 percent. A possible explanation of this phenomenon might be found in the geographic location and economic structure of the aggregated provinces. Both Saskatchewan and Alberta are located to the west of Manitoba. Along with the magnitude of the resource-based energy industry, growth figures from Table 1.12 imply a concentration of exports to neighbouring western US regions. The net effect of the magnitude and concentration of these exports overwhelms the Manitoba trade data and distorts the conclusions drawn from it.
Table 1.12 For-hire Trucking, Southbound Movements of Goods, Manitoba to US Regions (continued)Origin Destination 1990 1991 1992 1993 1994 1995 1996 1997 1998 1999
Estimated Tonne-Kilometers('000)MB Northeast 85003 76707 61827 82956 231561 86856 139160 450424 382889 510502MB North 291574 249116 317974 347450 573097 601203 697535 2454526 3101054 2579783MB South 59336 95437 113435 162292 247481 233729 297821 1274337 1332883 1570212MB West 67420 63267 57782 96505 143060 143621 250562 1660350 1528014 1858927MB USA 503334 484527 551018 689203 1195199 1065409 1385078 5839637 6344839 6519424CANADA USA 12877171 12782263 15276428 19478426 23912320 25756191 29180728 33441798 35255580 42781264MB MEX 74CANADA MEX 18391 90298 96335
Estimated ShipmentsMB Northeast 4234 2981 3551 5619 4939 6199 7191 13000 12000 16000MB North 27585 26035 26856 33172 34795 45769 56867 122000 144000 118000MB South 2246 2768 4490 6346 7660 10138 11894 35000 43000 47000MB West 2244 2124 2960 4655 5749 8174 9844 66000 59000 76000MB USA 36309 33908 37857 49792 53143 70280 85796 235000 258000 257000CANADA USA 1588021 1581434 1834800 2119492 2277734 2847695 3219441 3577000 3920000 4517000MB MEX 19CANADA MEX 490 2326 1910
Note: As of 1997: Man = Manitoba, Saskatchewan, Alberta
Sources: Statistics Canada, Trucking in Canada (53-222): Table 3.18(1999); Table 3.21(1998); Table 3.18(1997) For the years 1992 through 1996 data was obtained on a special run from Statistics Canada.

26
MB = Manitoba; SK = Saskatchewan; AB = Alberta
MB = Manitoba; SK = Saskatchewan; AB = Alberta Figures 1.9 and 1.10 respectively indicate the tonnes and tonne-kilometres for the Southbound movement of goods from Manitoba to US regions by for-hire trucking.
Figure 1.10 For-Hire Trucking, Southbound Movement of Goods, Manitoba to US Regions
0
1000000
2000000
3000000
4000000
5000000
6000000
7000000
198719881989 199019911992199319941995 1996199719981999
Year
MB
to U
S R
egio
n To
nne-
Km
0
5000000
10000000
15000000
20000000
25000000
30000000
35000000
40000000
45000000C
anad
a to
US
A T
onne
-Km
MB NortheastMB NorthMB SouthMB WestMB USACANADA USA
MB+SK+AB
Figure 1.9 For-Hire Trucking, Southbound Movement of Goods, Manitoba to US Regions
0
500
1000
1500
2000
2500
3000
3500
4000
4500
1987198819891990199119921993199419951996199719981999
Year
MB
to
US
Reg
ion
Tonn
e ('0
00)
0
5000
10000
15000
20000
25000
30000
35000
40000
45000
Can
ada
US
A T
onne
('00
0)
MB NortheastMB NorthMB SouthMB WestMB USACANADA USA
MB+SK+AB

27
Both charts indicate the steady growth in total tonnes and tonne-km for Canada-USA trade since 1992. The strong growth of trade to the US West region is also evident from these parameters and is explained as above.

28
Table 1.13 shows the Southbound movement of the top five commodities from Manitoba to the USA by for-hire trucking. Looking closer it can be seen how Manitoba’s economy has changed over the ten-year period. It can also be seen how the addition of Alberta has shifted our commodity mix and increased our revenue by almost 290 percent and tonnage shipped by 227 percent.
Table 1.13 For-hire Trucking, Southbound Movements of The Top Five CommoditiesFrom Manitoba to USA
Commodity Group 1990 1991 1992 1993 1994 1995 1996 1997 1998 1999
Estimated Revenues ($'000)
01 Meat and Meat Preparations 2151 26352 2381701 Live animals and live fish 28355 25439 2311303 Fish 1252 207605 Meat, Fish, Seafood and Preparations 4984214 Other Foods, Food Materials 244121 Crude Veg. Prod., inedible 2312 2530 2742 7361 641826 Wood Products 2806533 Wood Fabricated Materials 1435 1900 25959 3120133 Articles of base metal 2247535 Paper and Paperboard 3607 2548 4002 3288 5948 2646642 Chemicals and Related Prods 1558 2940 1867 258642 Miscellaneous transported products 4209743 Petroleum and Coal Prods.44 Iron, Steel and Alloys 2020 1990 1578 3260 4473 3936 518345 Non-Ferrous Metals 288474 Furniture and Fixtures 1372 6055 825496 Remaining End-products Classified by material 1984599 General and Unclassified Freight 8737 3824 5222 6907 19619 24265Sub-total 11342 10702 11327 18205 16509 25862 32710 126751 124567 165592Other commodities 16199 15991 16551 21236 34742 38808 50014 193291 195780 215610Total 27541 26692 27878 39441 51251 64670 82724 320043 320347 381201
Table 1.13 For-hire Trucking, Southbound Movements of The Top Five CommoditiesFrom Manitoba to USA
Commodity Group 1990 1991 1992 1993 1994 1995 1996 1997 1998 1999
Estimated Tonnage ('000)
01 Meat and Meat Preparations 23 215 18001 Live animals and live fish n/a 289 26103 Fish 7 905 Meat, Fish, Seafood and Preparations 38514 Other Foods, Food Materials 1721 Crude Veg. Prod., inedible 32 37 49 109 9526 Wood Products 33433 Wood Fabricated Materials 41 36 350 38233 Articles of base metal 14235 Paper and Paperboard 51 38 70 70 94 39642 Chemicals and Related Prods 6 55 56 7442 Miscellaneous transported products 38943 Petroleum and Coal Prods.44 Iron, Steel and Alloys 27 26 18 32 79 41 6545 Non-Ferrous Metals 3674 Furniture and Fixtures 13 28 2596 Remaining End-products Classified by material 61299 General and Unclassified Freight 141 69 94 70 182 224Sub-total 140 117 196 282 308 344 349 1143 1687 1511Other commodities 269 268 265 262 573 446 657 1808 1869 2330Total 409 385 462 543 880 790 1006 3291 3556 3842

29
Table 1.13 For-hire Trucking, Southbound Movements of The Top Five CommoditiesFrom Manitoba to USA
Commodity Group 1990 1991 1992 1993 1994 1995 1996 1997 1998 1999
Estimated Tonne-Kilometers ('000)
01 Meat and Meat Preparations 40482 499534 43321701 Live animals and live fish 425388 425141 40845203 Fish 14197 1754505 Meat, Fish, Seafood and Preparations 85103814 Other Foods, Food Materials 3231721 Crude Veg. Prod., inedible 46182 64047 57650 177670 15026226 Wood Products 68544133 Wood Fabricated Materials 55428 43956 694727 73263133 Articles of base metal 30147535 Paper and Paperboard 77311 57047 121260 81327 138877 72606242 Chemicals and Related Prods 11028 49804 50599 14859742 Miscellaneous transported products 69861043 Petroleum and Coal Prods.44 Iron, Steel and Alloys 45012 49032 30680 57058 128731 67650 10925245 Non-Ferrous Metals 7949474 Furniture and Fixtures 13114 51776 5442396 Remaining End-products Classified by material 106640899 General and Unclassified Freight 176288 87708 112186 94228 316568 415106Sub-total 223184 198699 270286 360218 502180 490609 547042 2662279 3072503 2945016Other commodities 280149 285827 280731 328986 693019 574800 838036 3177358 3272336 3574409Total 503334 484527 551017 689204 1195199 1065409 1385078 5839637 6344839 6519424
Table 1.13 For-hire Trucking, Southbound Movements of The Top Five CommoditiesFrom Manitoba to USA
Commodity Group 1990 1991 1992 1993 1994 1995 1996 1997 1998 1999
Estimated Shipments
01 Meat and Meat Preparations 1397 12000 1000001 Live animals and live fish 14000 11000 1100003 Fish 421 73205 Meat, Fish, Seafood and Preparations 2200014 Other Foods, Food Materials 128521 Crude Veg. Prod., inedible 1803 2215 2517 5385 502426 Wood Products 1600033 Wood Fabricated Materials 1802 2339 17000 1800033 Articles of base metal 1600035 Paper and Paperboard 2673 1991 3462 3667 5106 2600042 Chemicals and Related Prods 4168 5087 2065 394742 Miscellaneous transported products 3700043 Petroleum and Coal Prods.44 Iron, Steel and Alloys 1657 1784 1611 3158 3907 3729 453245 Non-Ferrous Metals 160974 Furniture and Fixtures 1641 4053 466796 remaining End-products Classified by material 4600099 General and Unclassified Freight 10806 5088 9430 9845 20000 27000Sub-total 7951 10890 13603 19653 17068 26264 29174 89000 112000 102000Other commodities 28353 23021 24254 30139 36075 44016 56622 146000 146000 154000Total 36304 33911 37857 49792 53143 70280 85796 235000 258000 257000
Note: The top five ranking is based on the estimated revenues of the top five commodities. Note: As of 1997: Man = Manitoba, Saskatchewan, Alberta
Sources: Statistics Canada, Trucking in Canada (53-222): Table 3.20(1999); Table 3.23(1998); Table 3.20(1997) For the years 1992 through 1996 data was obtained on a special run from Statistics Canada.

30
Figure 1.11 charts the Southbound movement of the top five and other commodities from Manitoba to the USA by for-hire trucking.
MB = Manitoba; SK = Saskatchewan; AB = Alberta The aggregation of prairie data as of 1997 confounds results for Manitoba. But it can be seen that even before Alberta and Saskatchewan were added in, Total Tonnage and Total Tonne-Kilometres were rising steadily.
Figure 1.11 For-hire Trucking, Southbound Movement of Top Five and Other Commodities from Manitoba to USA
0
500
1000
1500
2000
2500
3000
3500
4000
4500
1990 1991 1992 1993 1994 1995 1996 1997 1998 1999
Year
'000
Ton
nes
0
1,000,000
2,000,000
3,000,000
4,000,000
5,000,000
6,000,000
7,000,000
'000
Ton
ne-K
m
Tonnage Sub-total
Tonnage Othercommodities
Tonnage Total
Tonne-KilometersSub-total
Tonne-KilometersOthercommoditiesTonne-KilometersTotal
MB+SK+A

31
Table 1.14 indicates the estimated share of Canadian and American carriers for Southbound movement from Manitoba and Northbound movement to Manitoba by for-hire trucking.
Table 1.14 For-hire Trucking, Estimated Shares of Canadian and American Carriers For Southbound and Northbound Traffic (Manitoba)
Year 1987 1988 1989 1990 1991
Southbound (Manitoba to The United States)
Estimated Revenue ($'000)Direct Shipment 21615 30704 25018 25878 25135Interline Shipment 2956 4255 2939 3736 4220
Canadian Carrier 1787 2193 1548 1930 1760American Carrier 1170 2062 1390 1806 2460
Estimated TonnageDirect Shipment 359829 532194 451002 397147 376484Interline Shipment 13096 13122 12440 22542 20333
Canadian Carrier 13096 13122 12440 22542 20333American Carrier 13096 13122 12440 22542 20333
Estimated Tonne-kilometers ('000)Direct Shipment 337503 606612 448641 482565 472319Interline Shipment 22987 29508 25452 55760 49618
Canadian Carrier 16661 14549 14042 28526 21463American Carrier 6326 20080 11410 27233 28155
Average DistanceDirect Shipment 1136 1227 1164 1270 1318Interline Shipment 1736 1991 1946 1947 1905
Canadian Carrier 753 869 921 1100 802American Carrier 983 1122 1025 847 1103
Northbound (United States to Manitoba)
Estimated Revenue ($'000) Direct Shipment 23552 22834 19647 31286 22767Interline Shipment 4553 4256 3177 3501 5902
Canadian Carrier 2370 2313 1433 1511 2776American Carrier 2183 1943 1743 1990 3126
Estimated TonnageDirect Shipment 277431 309253 200609 323973 223838Interline Shipment 13965 8673 5546 5732 15294
Canadian Carrier 13965 8673 5546 5732 15294American Carrier 13965 8673 5546 5732 15294
Estimated Tonne-kilometers ('000)Direct Shipment 335420 398287 286542 482191 319031Interline Shipment 26908 14045 10284 9922 29266
Canadian Carrier 14780 12111 5356 4700 15888American Carrier 12127 1934 4928 5223 13378
Average DistanceDirect Shipment 1446 1291 1449 1472 1501Interline Shipment 1875 1856 1859 1872 1855
Canadian Carrier 1124 837 830 886 938American Carrier 755 1019 1029 986 917
Sources: Statistics Canada, Trucking in Canada (53-222).

32
Table 1.15 shows Northbound movements of goods from US regions to Manitoba by for-hire trucking. Again, the aggregation of prairie data confounds the provincial results after 1997.
Table 1.15 For-hire Trucking, Northbound Movements of Goods, from US Regions to ManitobaOrigin Destination 1990 1991 1992 1993 1994 1995 1996 1997 1998 1999
Estimated Revenue ($'000)
Northeast MB 3089 1994 3345 2610 3826 3830 4477 18243 24206 25998North MB 16815 14315 14704 17852 25959 26109 28974 119326 148975 164900South MB 5903 3456 5781 5433 6192 9128 10390 83010 80072 98316West MB 6590 4973 3437 5266 5626 7935 10110 79318 83148 82223USA MB 32397 24738 27267 31161 41603 47002 53951 299897 336401 371437USA CANADA 757171 786730 947170 1178314 1484216 1589797 1657988 1878941 1973522 2537053MEX MB 6 7 20MEX CANADA 148 1761 2760
Estimated Tonne
Northeast MB 10972 10436 18624 23827 28635 27434 23244 69000 90000 99000North MB 209299 163670 155878 241269 623987 322538 366774 953000 1510000 1206000South MB 44637 17602 32117 36993 61612 45694 61832 372000 319000 418000West MB 63658 42662 26987 40620 55984 53796 66964 754000 761000 822000USA MB 328566 234370 233606 342709 770218 449462 518814 2148000 2680000 2545000USA CANADA 9271217 9199418 9726321 12629193 16028263 16603298 17825628 21693000 21638000 29465000MEX MB 4 4 31MEX CANADA 123 8503 7686
Table 1.15 For-hire Trucking, Northbound Movements of Goods, from US Regions to ManitobaOrigin Destination 1990 1991 1992 1993 1994 1995 1996 1997 1998 1999
Estimated Tonne-Kilometers ('000)
Northeast MB 25050 25187 46758 61454 70986 70568 54615 229952 292801 312270North MB 214982 167206 155507 259801 569666 335535 398116 1729403 2928952 2018856South MB 104536 43688 73971 84728 145285 107579 139479 1154034 1003067 1324160West MB 142056 95237 62188 102707 120900 125541 156973 1244652 1293522 1338351USA MB 486624 331318 338424 508690 906837 639223 749183 4358041 5518342 4993637USA CANADA 9197152 9355692 9913525 13157397 17727997 18320154 20316681 24148837 25427051 32708970MEX MB 17 18 130MEX CANADA 516 38048 33528
Estimated Shipments
Northeast MB 3911 3464 4446 6064 4184 3341 5030 14000 20000 28000North MB 32203 27604 26985 34863 41865 31803 37348 110000 180000 154000South MB 4779 4620 6457 7173 6113 7511 8740 50000 56000 65000West MB 4368 3733 3690 5075 4661 6029 7674 63000 62000 66000USA MB 45261 39421 41578 53175 56823 48684 58792 237000 318000 313000USA CANADA 1513067 1612590 1759230 2064539 2164740 2411815 2542525 2599000 2692000 3339000MEX MB 9 9 8MEX CANADA 84 872 834
Note: As of 1997: Man = Manitoba, Saskatchewan, Alberta
Sources: Statistics Canada, Trucking in Canada (53-222): Table 3.21(1999); Table 3.24(1998); Table 3.21(1997) For the years 1992 through 1996 data was obtained on a special run from Statistics Canada.

33
Figures 1.12 and 1.13 respectively indicate the tonnes and tonne-kilometres of Northbound movement of goods from US regions to Manitoba.
MB = Manitoba; SK = Saskatchewan; AB = Alberta
MB = Manitoba; SK = Saskatchewan; AB = Alberta A steady increase in the movement of goods from the USA to Canada by for-hire trucking is noted for the entire period, this type of truck movement has been increasing by 15.1 percent per year since 1991, as reported by Transport Canada.
Figure 1.12 For-hire Trucking, Northbound Movement of Goods from US Regions to Manitoba
0
500,000
1,000,000
1,500,000
2,000,000
2,500,000
3,000,000
1987 1988 1989 1990 1991 1992 1993 1994 1995 1996 1997 1998 1999
Year
Reg
ion
s to
MB
To
nn
es
0
5,000,000
10,000,000
15,000,000
20,000,000
25,000,000
30,000,000
35,000,000
US
A C
anad
a To
nnes Northeast MB
North MBSouth MBWest MBUSA MBUSA CANADA
MB+SK+A
Figure 1.13 For-Hire Trucking, Northbound Movement of Goods, from US Regions to Manitoba
0
1,000,000
2,000,000
3,000,000
4,000,000
5,000,000
6,000,000
1987 1988 1989 1990 1991 1992 1993 1994 1995 1996 1997 1998 1999
Year
Reg
ions
to M
B T
onne
-Km
0
5,000,000
10,000,000
15,000,000
20,000,000
25,000,000
30,000,000
35,000,000
US
A C
anad
a T
on
ne-
km Northeast MBNorth MBSouth MBWest MBUSA MBUSA CANADA
MB+SK+AB

34
1.2.2 Rail Table 1.16 shows the Southbound movement of goods by rail to US region of destination from gateway province. The North-Central area receives the largest proportion of goods from Manitoba, followed by the Southern portion of the United States. There is a high probability that at least some of these goods are destined for Mexico and are being trans-shipped through the Southern US.
Table 1.16 Rail Commodity Southbound Movements of Goodsto US Region of Destination, from Gateway Province (Thousand Tonnes)
Canadian US DestinationOrigin North-east North-central South West Total
Canada
1988 6509 14400 5856 2817 295811989 6084 14584 6189 3002 298591990 6081 15098 6269 3057 305051991 5931 15035 6794 3518 312781992 7074 17360 7606 3751 357921993 8025 19813 8086 4222 401461994 8514 20864 9446 6010 448351995 7938 21731 10866 5981 465161996 8293 23394 9123 5248 460581997 9111 26297 9861 6762 520311998 8783 24808 12879 8518 54988
Manitoba1988 70 2883 593 43 35891989 97 2683 613 22 34151990 86 2866 579 35 35661991 42 2327 509 65 29431992 19 2085 410 65 25801993 31 2387 268 93 27791994 7 911 184 97 11991995 - 1118 7 70 11951996 7 2826 302 56 31911997 12 4026 348 111 44971998 109 3300 671 165 4245
Atlantic1988 189 - - - 1891989 303 - 1 - 3041990 349 - - - 3491991 372 - - - 3721992 447 - - - 4471993 391 - - - 3911994 507 925 170 1 16041995 84 38 153 - 2761996 150 - 11 - 1611997 104 7 1 - 1121998 79 - - - 79

35
Table 1.16 Rail Commodity Southbound Movements of Goodsto US Region of Destination, from Gateway Province (Thousand Tonnes)
Canadian US DestinationOrigin North-east North-central South West Total
Quebec
1988 4067 4 312 - 43831989 3509 4 356 - 38691990 3559 8 344 - 39111991 3431 5 368 1 38051992 3712 46 422 4 41841993 4042 21 510 665 52381994 3559 71 694 6 43301995 3320 1563 768 13 56641996 3568 69 644 - 42811997 4659 119 1052 4 58341998 4682 91 1182 26 5981
Ontario1988 1832 8851 4549 396 156281989 1854 9148 4897 431 163301990 1956 9026 5019 496 164981991 1925 9129 5029 557 166401992 2694 11034 5586 664 199781993 3436 12897 6253 665 232511994 3963 15201 7519 857 275401995 4244 18855 9871 1131 341011996 4451 14523 7614 1199 277871997 4255 15563 7925 1363 291061998 3790 15953 8814 1451 30008
Alberta1988 - 10 - 566 5761989 - 31 1 414 4471990 - 91 16 530 6381991 29 83 34 696 8421992 0 80 115 740 9341993 5 71 58 1022 11571994 84 904 65 894 19471995 6 118 48 1385 15561996 1 66 7 1012 10861997 5 94 25 1250 13741998 5 107 128 1463 1703

36
Table 1.16 Rail Commodity Southbound Movements of Goodsto US Region of Destination, from Gateway Province (Thousand Tonnes)
Canadian US DestinationOrigin North-east North-central South West Total
Saskatchewan
1988 75 2645 393 7 31201989 43 2714 318 6 30801990 29 3101 300 5 34351991 78 3487 830 - 43951992 172 4103 1060 2 53371993 71 4430 983 9 54941994 42 41 41 - 1241995 - - 2 - 21996 116 5873 538 7 65341997 69 6467 485 23 70441998 118 5347 2061 30 7556
British Columbia
1988 276 8 8 1805 20961989 278 4 4 2130 24151990 101 6 10 1991 21081991 53 5 24 2198 22801992 30 11 13 2275 23301993 49 5 14 2430 24981994 353 2809 774 4155 80911995 284 39 16 3382 37211996 - 37 7 2974 30181997 7 21 25 4011 40641998 - 10 23 5383 5416
Sources: Statistics Canada, Rail In Canada (52-216): Table 7.4.

37
Figure 1.14 shows the southbound movement of goods by rail from gateway province Manitoba to the US. The bulk of goods were moved to the North-Central US region. In 1998 3.3 million tonnes or 78 percent were moved from Manitoba to the US North-Central region from a total of 4.3 million tonnes that were moved to all regions. During the late 1980’s to the mid 1990’s the southbound movement of goods declined. The sharpest reduction occurred in 1994 when 1.2 million tonnes were moved as opposed to 2.8 million tons in 1993, a reduction of 57 percent in one year. By 1995 almost all goods were moved exclusively to the North-Central region, accounting for 94 percent of the total.
The increased share is also evident from the declining trend to all regions except for the North-Central region, which showed an increase in the number of tonnes received from Manitoba. As of the bottom-out in 1995, movement to all regions increased. During 1996, strong growth was reported in the southbound movement of total goods (3.2 million tonnes), notably to the US North-Central region (2.8 million tonnes), which accounted for 89 percent of the total. The major sources of this increased trade was a combination of oil-seed meals and wood for construction purposes. The total of goods moved Southbound peaked in 1997 at 4.5 million tonnes. The Northeast, South and West regions increased their combined share to 22.3 percent of the 1998 total of 4.2 million tonnes, that is 935,000 tonnes.
Figure 1.14 Rail Commodity Southbound Movement of Goods to the US Region of Destination from Gateway Province Manitoba
0
500
1000
1500
2000
2500
3000
3500
4000
4500
5000
1988 1989 1990 1991 1992 1993 1994 1995 1996 1997 1998
Year
'000
Ton
nes North-east
North-centralSouthWestTotal
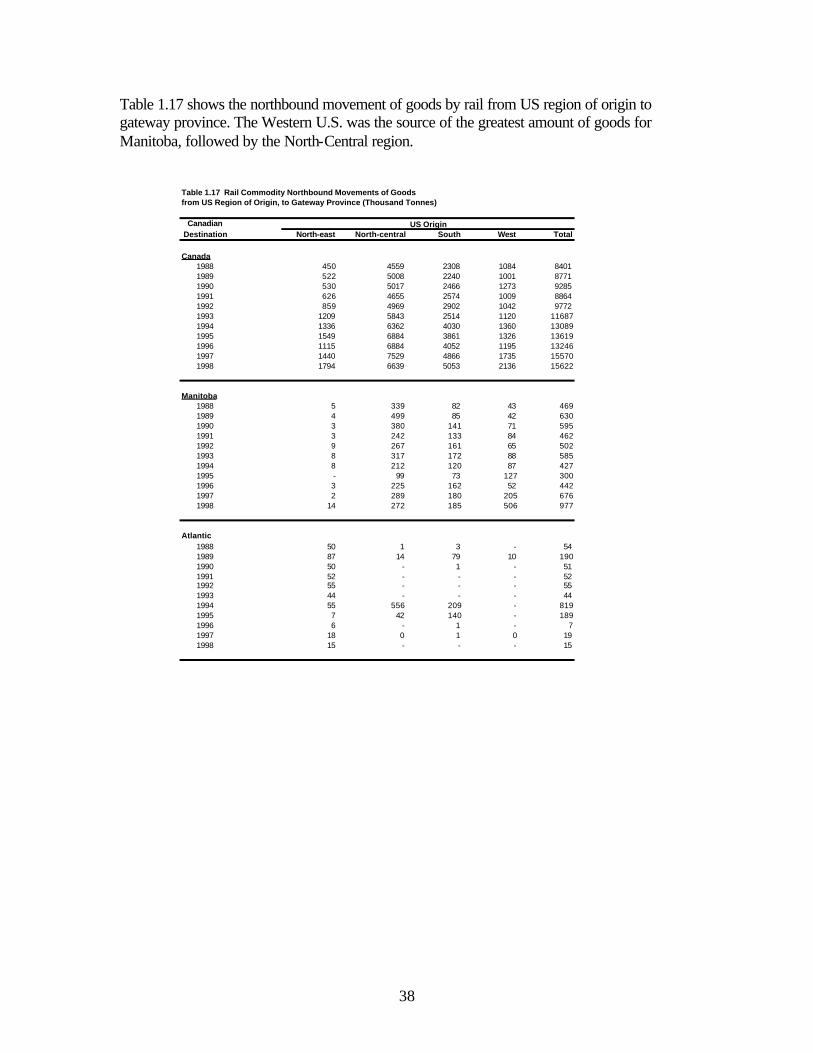
38
Table 1.17 shows the northbound movement of goods by rail from US region of origin to gateway province. The Western U.S. was the source of the greatest amount of goods for Manitoba, followed by the North-Central region.
Table 1.17 Rail Commodity Northbound Movements of Goods from US Region of Origin, to Gateway Province (Thousand Tonnes)
Canadian US OriginDestination North-east North-central South West Total
Canada1988 450 4559 2308 1084 84011989 522 5008 2240 1001 87711990 530 5017 2466 1273 92851991 626 4655 2574 1009 88641992 859 4969 2902 1042 97721993 1209 5843 2514 1120 116871994 1336 6362 4030 1360 130891995 1549 6884 3861 1326 136191996 1115 6884 4052 1195 132461997 1440 7529 4866 1735 155701998 1794 6639 5053 2136 15622
Manitoba1988 5 339 82 43 4691989 4 499 85 42 6301990 3 380 141 71 5951991 3 242 133 84 4621992 9 267 161 65 5021993 8 317 172 88 5851994 8 212 120 87 4271995 - 99 73 127 3001996 3 225 162 52 4421997 2 289 180 205 6761998 14 272 185 506 977
Atlantic1988 50 1 3 - 541989 87 14 79 10 1901990 50 - 1 - 511991 52 - - - 521992 55 - - - 551993 44 - - - 441994 55 556 209 - 8191995 7 42 140 - 1891996 6 - 1 - 71997 18 0 1 0 191998 15 - - - 15

39
Table 1.17 Rail Commodity Northbound Movements of Goods from US Region of Origin, to Gateway Province (Thousand Tonnes)
Canadian US OriginDestination North-east North-central South West Total
Quebec1988 159 388 154 - 7011989 182 16 53 -- 2511990 224 3 82 -- 3091991 308 4 223 - 5351992 394 41 192 -- 6261993 555 114 293 2 9641994 345 77 83 -- 5061995 579 1212 115 36 19411996 390 60 231 1 6821997 535 72 260 3 8701998 1014 29 328 7 1378
Ontario1988 220 3565 1995 522 63021989 236 4154 2034 536 69601990 244 4124 2138 491 69961991 253 3850 2087 399 65901992 392 4108 2396 497 73931993 590 4648 2790 466 84951994 916 4817 3330 465 95281995 951 5463 3449 535 103971996 709 5953 3301 651 106141997 880 6360 3915 777 119321998 737 5355 4176 872 11140
Alberta1988 - 9 2 97 1081989 - 11 4 127 1421990 - 14 12 194 2201991 - 6 53 194 2531992 1 4 46 166 2171993 - 21 53 211 2851994 - 48 38 229 3151995 - 15 43 316 3731996 - 5 36 210 2511997 0 21 89 318 4281998 - 29 64 319 412

40
Table 1.17 Rail Commodity Northbound Movements of Goods from US Region of Origin, to Gateway Province (Thousand Tonnes)
Canadian US OriginDestination North-east North-central South West Total
Saskatchewan1988 3 252 65 2 3221989 3 312 50 -- 3651990 4 489 69 -- 5631991 6 545 63 15 6301992 7 542 89 54 6921993 10 731 181 49 9691994 9 90 49 2 1491995 - - - - -1996 6 626 306 16 9541997 5 782 384 83 12541998 14 938 283 12 1247
British Columbia1988 11 6 7 418 4421989 9 17 12 295 3231990 5 7 24 516 5521991 3 8 15 316 3431992 1 7 17 261 2861993 2 13 25 304 3441994 4 562 202 577 13451995 11 53 41 312 4181996 1 15 15 265 2961997 0 5 37 349 3911998 - 16 17 420 453
Sources: Statistics Canada, Rail in Canada (52-216): Table 7.1.

41
Figure 1.15 depicts the northbound movement of goods by rail from US regions of origin to gateway province Manitoba. The declining trend in total movement of goods during the early 1990’s coincides with a similar trend on the southbound movement of goods (see Figure 1.14). After bottoming-out in 1995, strong growth was experienced in the total northbound movement of goods and reached nearly 1 million tonnes in 1998.
The relative share of the North-Central region declined over the review period, whilst the share of other regions increased. In 1998 the North-Central region represented 28 percent of total goods moved Northbound. Goods received from the US West region increased in share from 11.8 percent in 1996 to 52 percent in 1998. This is the largest increase in the share of total northbound movement of goods by rail of all regions over this period. This growth is mainly due to increased imports of bituminous coal from the North-western United States. In 1998 the US South and Northeast regions respectively had an 18.9 and 1.43 percentage share of the total.
Figure 1.15 Rail Commodity Northbound Movement of Goods from US Region of Origin to Gateway Province Manitoba
0
200
400
600
800
1000
1200
1988 1989 1990 1991 1992 1993 1994 1995 1996 1997 1998
Year
'000
Ton
nes North-east
North-centralSouthWestTotal

42
Table 1.18 shows the southbound movement by rail of major commodities in terms of tonnage from Manitoba to US regions of destinations. Wheat and oats are now the dominant commodities being shipped south, but as of 1996, data was being reported for the combined region of Manitoba, Saskatchewan, Alberta, and North West Territories. Oats, vegetable oils, and wood building boards are the three commodities where Manitoba is the major supplier.
Table 1.18 Railway Commodity Origin and Destination of the Major Commodities in Terms of Tonnage for the Southbound Movements of Goods from Manitoba to US Regions of Destination
Commodity Group 1991 1992 1993 1994 1995 1996 1997 1998
Total US
034 Wheat 250762 487021 597820028 Oats 123701 300078 336442 335670370 Vegetable Oils and Fats nes 60351 49602 113515 150928 132842 179536322 Wood building boards, n.e.s. 161920324 Millwork (woodwork) 129130024 Barley 112417 116353136 Oil seed meals 125400 144970334 Newsprint paper 64824 78538 69457 71384 80130450 Refined and Manufactured gases, fuel type 97774 101110 109670 88405 78935308 Lumber 49234 58618 62223286 Common salt, nes 34907 49921418 Fertilizers and fertilizer materials, nes 51638 36879228 Iron and steel scrap 38986394 Metallic salts and proxy salts of inorganic acids, nes 27191342 Wrapping 52552330 Wood pulp 34579200 Vegetable and man-made textile fibre except. cottonOther commodities 283234 167528 222955 401903 482958 610109 694978 683510Total 567870 486356 527181 719833 941462 1549694 1896766 2103426
Tonnes
Table 1.18 Railway Commodity Origin and Destination of the Major Commodities in Terms of Tonnage for the Southbound Movements of Goods from Manitoba to US Regions of Destination
Commodity Group 1991 1992 1993 1994 1995 1996 1997 1998
North-East
034 Wheat 24619 49369 160889028 Oats 39 278 64 364370 Vegetable Oils and Fats nes 16372 22142 20927 22233 13624 13434322 Wood building boards, n.e.s. 71324 Millwork (woodwork)024 Barley 1353 189136 Oil seed meals 7737 22334 Newsprint paper 1411 1289 525450 Refined and Manufactured gases, fuel type 490 308 Lumber 1527 2222 1022286 Common salt, nes 418 Fertilizers and fertilizer materials, nes 93228 Iron and steel scrap 394 Metallic salts and proxy salts of inorganic acids, nes 342 Wrapping 976330 Wood pulp 12658200 Vegetable and man-made textile fibre except. cottonOther commodities 30883 6739 49502 28615 24119 17125 32658 24069Total 45928 24493 51519 52979 46632 73345 95904 198849
Tonnes

43
Table 1.18 Railway Commodity Origin and Destination of the Major Commodities in Terms of Tonnage for the Southbound Movements of Goods from Manitoba to US Regions of Destination
Commodity Group 1991 1992 1993 1994 1995 1996 1997 1998
Central
034 Wheat 203471 396387 345059028 Oats 292718 335269 334621370 Vegetable Oils and Fats nes 124561 108301 84435322 Wood building boards, n.e.s. 59080324 Millwork (woodwork) 41313024 Barley 97283 116004136 Oil seed meals 61587 23897334 Newsprint paper 34991 34199 36536 23157 27543450 Refined and Manufactured gases, fuel type 97714 101110 109180 88405 76672308 Lumber 32683 39412 38475286 Common salt, nes 17101 15272418 Fertilizers and fertilizer materials, nes 38674 29275228 Iron and steel scrap 27400394 Metallic salts and proxy salts of inorganic acids, nes 4116342 Wrapping 14347330 Wood pulp 19425200 Vegetable and man-made textile fibre except. cottonOther commodities 194541 120888 130878 258667 321811 377575 417278 450991Total 378119 340356 365952 430922 620060 1157195 1414552 1298083
Tonnes
Table 1.18 Railway Commodity Origin and Destination of the Major Commodities in Terms of Tonnage for the Southbound Movements of Goods from Manitoba to US Regions of Destination
Commodity Group 1991 1992 1993 1994 1995 1996 1997 1998
South
034 Wheat 22672 41265 91872028 Oats 6508 1109 311370 Vegetable Oils and Fats nes - - 62645322 Wood building boards, n.e.s. 508324 Millwork (woodwork) 172024 Barley 388 -136 Oil seed meals 129 1939334 Newsprint paper 4125 3579 8304 6257 6598450 Refined and Manufactured gases, fuel type 2263308 Lumber 14951 16668 22481286 Common salt, nes 17713 34649418 Fertilizers and fertilizer materials, nes 90228 Iron and steel scrap 11586394 Metallic salts and proxy salts of inorganic acids, nes 23075342 Wrapping 15719330 Wood pulp 2496200 Vegetable and man-made textile fibre except. cottonOther commodities 39059 33104 35460 57597 94614 73202 99906 130134Total 79112 59826 70391 132940 179026 102899 142452 287409
Tonnes
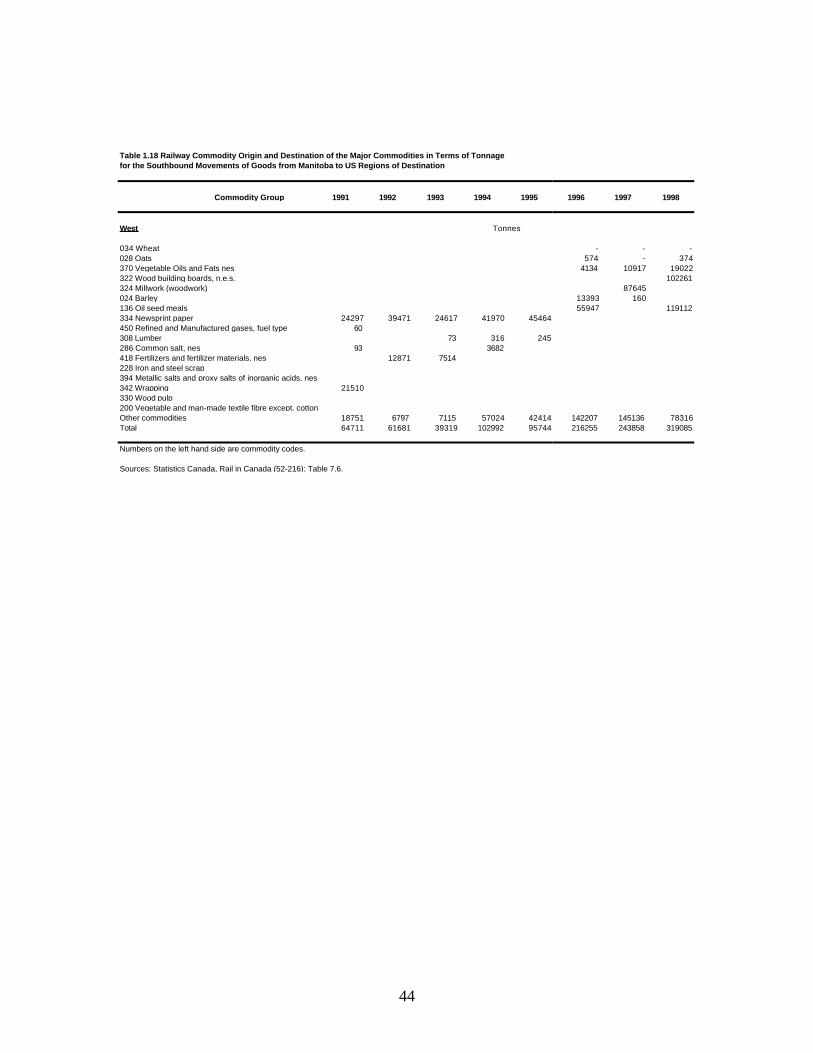
44
Table 1.18 Railway Commodity Origin and Destination of the Major Commodities in Terms of Tonnage for the Southbound Movements of Goods from Manitoba to US Regions of Destination
Commodity Group 1991 1992 1993 1994 1995 1996 1997 1998
West
034 Wheat - - -028 Oats 574 - 374370 Vegetable Oils and Fats nes 4134 10917 19022322 Wood building boards, n.e.s. 102261324 Millwork (woodwork) 87645024 Barley 13393 160136 Oil seed meals 55947 119112334 Newsprint paper 24297 39471 24617 41970 45464450 Refined and Manufactured gases, fuel type 60 308 Lumber 73 316 245286 Common salt, nes 93 3682418 Fertilizers and fertilizer materials, nes 12871 7514228 Iron and steel scrap 394 Metallic salts and proxy salts of inorganic acids, nes 342 Wrapping 21510330 Wood pulp 200 Vegetable and man-made textile fibre except. cottonOther commodities 18751 6797 7115 57024 42414 142207 145136 78316Total 64711 61681 39319 102992 95744 216255 243858 319085
Numbers on the left hand side are commodity codes.
Sources: Statistics Canada, Rail in Canada (52-216): Table 7.6.
Tonnes

45
Table 1.19 shows the northbound movement by rail of major commodities in terms of tonnage from US regions of origin to Manitoba.
Table 1.19 Railway Commodity Origin and Destination of the Major Commodities in Terms of Tonnage for the Northbound Movements of Goods from US Regions of Origin to Manitoba
Commodity Group 1991 1992 1993 1994 1995 1996 1997 1998
Total US
238 Bituminous coal 223722 474791296 Paper waste 32738 49889 25979418 Fertilizers and fertilizer materials 12423 11846 14167 19747 40338 45490 61402204 Copper ores and concentrates 58775 40664 58173 55026 97145 33652 34991 28101558 Road motor vehicles, n.e.s. 24018516 Portland cement, standard 27019 23505 28306228 Iron and steel scrap 52278 77664 56218 97928414 Ammonium phosphates 10322 27991 81739 48270 40649 26233624 Mixed carload freight 26663 29950 25802 28642442 Fuel oil 26110552 Railway rolling stock 9067474 Pipes and tubes, iron and steel554 Passenger automobiles and chassisOther commodities 118327 72924 90933 125634 108323 133249 169100 140335Total 235577 235653 348478 339900 390811 289715 551498 754626
Tonnes
Table 1.19 Railway Commodity Origin and Destination of the Major Commodities in Terms of Tonnage for the Northbound Movements of Goods from US Regions of Origin to Manitoba
Commodity Group 1991 1992 1993 1994 1995 1996 1997 1998
North-East
238 Bituminous coal - -296 Paper waste 271 - -418 Fertilizers and fertilizer materials - - -204 Copper ores and concentrates - - - -558 Road motor vehicles, n.e.s. -516 Portland cement, standard 83 - -228 Iron and steel scrap 48 117 -414 Ammonium phosphates - -624 Mixed carload freight 372 474 794 2104442 Fuel oil 552 Railway rolling stock 2963474 Pipes and tubes, iron and steel554 Passenger automobiles and chassisOther commodities 4067 1838 2787 2282 4436 2613 3241 14225Total 7402 2312 3629 4503 4519 2884 3241 14225
Tonnes

46
Table 1.19 Railway Commodity Origin and Destination of the Major Commodities in Terms of Tonnage for the Northbound Movements of Goods from US Regions of Origin to Manitoba
Commodity Group 1991 1992 1993 1994 1995 1996 1997 1998
Central
238 Bituminous coal - -296 Paper waste 31507 48598 24275418 Fertilizers and fertilizer materials 181 5890 8494 9039204 Copper ores and concentrates 91100 9539 848 64558 Road motor vehicles, n.e.s. 22083516 Portland cement, standard 26936 23505 28306228 Iron and steel scrap 52278 77486 56023 -414 Ammonium phosphates 4529 17994 14691 21439 10845 11315624 Mixed carload freight 21285 20596 17347 19940442 Fuel oil 26049552 Railway rolling stock 5677474 Pipes and tubes, iron and steel554 Passenger automobiles and chassisOther commodities 74670 44981 60052 59705 80945 85503 126596 78004Total 106161 136238 173426 189534 210007 167259 212842 133465
Tonnes
Table 1.19 Railway Commodity Origin and Destination of the Major Commodities in Terms of Tonnage for the Northbound Movements of Goods from US Regions of Origin to Manitoba
Commodity Group 1991 1992 1993 1994 1995 1996 1997 1998
South
238 Bituminous coal - -296 Paper waste 907 1291 1704418 Fertilizers and fertilizer materials 10350 25764 19889 40899204 Copper ores and concentrates - - 3455 882558 Road motor vehicles, n.e.s. 1935516 Portland cement, standard - - -228 Iron and steel scrap 130 74414 Ammonium phosphates 5703 9112 66245 26831 25376 3961624 Mixed carload freight 4169 7627 7431 6366 442 Fuel oil 61552 Railway rolling stock 427474 Pipes and tubes, iron and steel554 Passenger automobiles and chassisOther commodities 28073 23886 15125 20503 18153 16866 26583 33921Total 39192 40625 90205 53761 53953 47498 51218 79341
Tonnes

47
Table 1.19 Railway Commodity Origin and Destination of the Major Commodities in Terms of Tonnage for the Northbound Movements of Goods from US Regions of Origin to Manitoba
Commodity Group 1991 1992 1993 1994 1995 1996 1997 1998
West
238 Bituminous coal 223722 474791296 Paper waste 53 - -418 Fertilizers and fertilizer materials 9216 8684 17107 11464204 Copper ores and concentrates 6045 24113 30688 27155558 Road motor vehicles, n.e.s. -516 Portland cement, standard - - -228 Iron and steel scrap 78 97854414 Ammonium phosphates 90 885 803 4428 10657624 Mixed carload freight 837 1253 230 232442 Fuel oil 552 Railway rolling stock 474 Pipes and tubes, iron and steel554 Passenger automobiles and chassisOther commodities 11517 2219 12969 43144 4789 28267 12680 14185Total 82822 56478 81218 92102 122332 72074 284197 527595
Sources: Statistics Canada, Rail in Canada (52-216): Table 7.3.
Tonnes

48
Table 1.20 and Figure 1.16 show the railway freight originating from Manitoba to Provincial destinations. As can be seen in this figure, more goods are being shipped to Ontario than to the entire U.S.
For most of the period under review the largest share of total railway freight from Manitoba to provincial destinations consisted of marine exports. Hence, the trend in total freight closely resembles the marine export trend. Marine exports, however, have been declining and was surpassed in 1994 by Ontario as the major provincial destination of railway freight. By 1998 both Ontario (2.8 million tonnes) and the US by rail category (2.4 million tonnes) had higher shares (36 and 30 % respectively) than marine exports
Table 1.20 Railway Freight Origin and Destination; from Manitoba to Provincial Destinations ('000 tonnes)
MarineDestination ATL QUE ONT MAN SASK ALTA BC US by rail Exports Total
1987 104 414 1203 892 572 198 197 452 5817 98491988 99 393 1170 754 469 188 180 532 4444 82291989 71 296 941 564 385 180 122 527 3326 64131990 72 325 909 691 351 168 127 534 4988 81651991 70 444 1063 578 267 168 143 568 6223 95241992 70 525 1110 380 205 158 131 709 5290 85771993 97 555 1203 437 208 226 148 801 4662 83361994 92 558 2990 364 166 169 160 930 2463 78931995 75 420 3133 329 163 172 256 1199 1971 77181996 57 470 1865 485 189 150 379 1839 2405 78381997 63 540 2141 391 224 287 302 2224 3272 94441998 50 495 2833 120 224 243 480 2380 1046 7871
Sources: Statistics Canada, Rail in Canada (52-216): Table 6.2.
Figure 1.16 Railway Freight Origin and Destination. Manitoba to Provincial Destinations
0
2000
4000
6000
8000
10000
12000
1987 1988 1989 1990 1991 1992 1993 1994 1995 1996 1997 1998
Year
'000
To
nn
es
ATLQUEONTMANSASKALTABC
US by railMarineTotal

49
(1.0 million tonnes or 13.3 %) of the total railway freight from Manitoba (7.9 million tonnes). Table 1.21 and Figure 1.17 show railway freight from provincial origins to Manitoba. Trade with Alberta has gone from being third from the last on the export side to being the largest importer of lately for Manitoba. As Ontario has lost their market share, Alberta has been the province that has taken it over.
During the late 1980’s and early 1990’s, total railway freight from provincial origins to Manitoba declined unabatedly. The rest of the decade saw steady annual increases to recover most of the earlier losses. In 1998 4.4 million tonnes of freight were railed to
Table 1.21 Railway Freight Origin and Destination; from Provincial Origins to Manitoba ('000 tonnes)
MarineOrigin ATL QUE ONT MAN SASK ALTA BC US by rail Imports Total
1987 30 236 1042 892 948 740 265 197 80 44291988 28 238 1032 754 1344 720 256 193 68 46541989 28 233 1017 564 876 680 242 232 58 39301990 32 199 890 691 762 611 237 248 52 37221991 25 181 828 578 630 716 206 235 46 34461992 26 184 817 380 716 750 181 325 44 34221993 34 209 928 437 744 781 238 420 45 38361994 37 237 982 364 741 879 211 411 67 39301995 28 203 962 329 752 877 219 472 55 38971996 33 231 881 485 925 898 196 328 50 40271997 62 234 942 391 822 1002 213 605 76 43461998 71 224 963 120 832 1088 211 811 82 4402
Sources: Statistics Canada, Rail in Canada (52-216): Table 6.2.
Figure 1.17 Railway Freight Origin and Destination. Provincial Origins to Manitoba
0
500
1000
1500
2000
2500
3000
3500
4000
4500
5000
1987 1988 1989 1990 1991 1992 1993 1994 1995 1996 1997 1998
Year
'000
To
nn
es
ATL
QUE
ONT
MAN
SASK
ALTA
BC
US by rail
Marine
Total

50
Manitoba from provincial origins (1987: 4.4 million tonnes). The highest growth rates in latter years were recorded in the US by rail category, which grew 147 percent from 1996 (328,000 tonnes) to 1998 (811,000 tonnes). Table 1.22 shows the tonnage of marine exports by rail from Manitoba to Canadian Provinces. The two main ports of exit for Manitoban agricultural goods has always been The Port of Vancouver on the one side and The Port of Thunder Bay on the other. It is for this reason that B.C. and Ontario ship 95 percent of Manitoban Marine Exports.
Table 1.23 shows the tonnage of marine imports by rail to Manitoba from Canadian Provinces.
Table 1.22 Railway Freight Origin and Destination; Tonnes of Marine Exportsfrom Manitoba to Canadian Provinces ('000 tonnes)
Destination ALT QUE ONT MAN SASK ALTA BC US by rail Total
1987 104 414 1203 892 572 198 197 452 98491988 99 393 1170 754 469 188 180 532 82291989 71 296 941 564 385 180 122 527 64131990 72 325 909 691 351 168 127 534 81651991 70 444 1063 578 267 168 143 568 95241992 10 63 3401 55 1761 52901993 5 52 2035 58 2512 46621994 6 42 1158 92 1166 24631995 6 31 454 76 - - 1405 - 19711996 4 35 1415 - - - 951 - 24051997 6 38 1723 - - - 1505 - 32721998 6 43 513 - - - 484 - 1046
Sources: Statistics Canada, Rail in Canada ( 52-216): Table 6.5.
Table 1.23 Railway Freight Origin and Destination; Tonnes of Marine Importsto Manitoba from Canadian Provinces ('000 tonnes)
Origin ALT QUE ONT MAN SASK ALTA BC US by rail Total
1987 30 236 1042 892 948 740 265 197 44291988 28 238 1032 754 1344 720 256 193 46541989 28 233 1017 564 876 680 242 232 39301990 32 199 890 691 762 611 237 248 37221991 25 181 828 578 630 716 206 235 34461992 26 184 817 380 716 750 181 325 34221993 34 209 928 437 744 781 238 420 38361994 9 31 1 25 671995 10 25 - - - - 20 - 551996 9 26 - - - - 14 - 491997 13 32 - - - - 31 - 761998 16 33 - - - - 33 - 82
Sources: Statistics Canada, Rail in Canada (52-216): Table 6.4.

51
2. HIGHWAY TRANSPORTATION This chapter analyzes the statistics on highway transportation. The predominant use of highways is by intercity truck haulage and, to a lesser extent, passenger vehicles including intercity bus passengers. In accordance with general assertions on the importance of different vehicle types and their uses for highway transportation, this chapter focuses on trucking, or alternatively motor carriers of freight. Some reference is also made of non-commercial vehicle registrations. Intercity passenger transport by bus lines is not discussed in this chapter, but included in the chapter on urban transportation. Motor carriers of freight are considered in the categories of for-hire carriers, private carriers and owner operators. All types of data are not necessarily available for all categories of carriers, but are limited to readily available sources. This implies limited comparisons between the same and/or different categories in or across regions. Also, please note that there are cautionary clauses on data limitations in the original sources as well. Table 2.1 shows summary statistics for Canadian for-hire motor carriers of freight by size. In 1997 an estimated 68 top for-hire carriers in Canada had an annual operating income in excess of $25 million, 2,031 medium and large carriers had annual operating incomes ranging from $1 million to $25 million, and 7,745 small carriers as well as 40,221 owner operators had an annual operating income of less than 1 million dollars. Total operating revenues across all sized carriers were estimated at $22.1 billion and total operating expenses at $20.1 billion. It can also be seen that the medium and large carriers supply 56 percent of the employment in this industry and for-hire as a category accounts for 65 percent of the trucking jobs versus the owner operator classification.

52
Figures 2.1, 2.2 and 2.3 show a breakdown of the equipment type operated by carrier in 1997. Medium and large carriers were the category operating the most equipment at 138,847 units followed by owner operators with 89,182 units (Figure 2.1). Semi-trailers were the most abundant equipment type at 188,665 units, followed by road tractors at 94,878 units (Figure 2.2).
Table 2 .1 Motor Carr ie rs o f Fre ight in Canada , Summary Sta t is t ics by S ize , For -h i re car r ie rs , 1997
Top Car r ie rsM e d i u m &
L a r g e Carr iers
Smal l Carr iers
For -h i re Tota l
O w n e r O p e r a t o r Tota l
Uni ts >$25 mi l l ion$1 to 25 mi l l ion
$ 2 5 0 0 0 - $ 1 mi l l ion
Es t ima ted Car r i e rs N o 68 2031 7745 9844 40221 50065Opera t i ng Revenue $ '000,000 4497 9727 2017 16241 5823 22064Opera t i ng Expenses $ '000,000 4233 8991 1776 15000 5113 20113Operat ing Rat io 0 . 9 4 0 . 9 2 … … …N u m b e r o f E m p l o y e e s N o 25416 66238 25624 117278 64242 181520E q u i p m e n t O p e r a t e d N o 54758 138847 43870 237475 89182 326657
St ra igh t T rucks " 1397 6465 7093 14955 16375 31330R o a d T r a c t o r s " 10329 31410 13596 55335 39543 94878
Semi- t ra i lor " 41884 98826 18807 159517 29148 188665O t h e r " 1148 2146 4374 7668 4116 11784
Es t ima ted Car r i e rs % o f T o t a l 0 4 15 20 80 1 0 0Opera t i ng Revenue % o f T o t a l 20 44 9 74 26 1 0 0Opera t i ng Expenses % o f T o t a l 21 45 9 75 25 1 0 0
N u m b e r o f E m p l o y e e s % o f T o t a l 14 36 14 65 35 1 0 0E q u i p m e n t O p e r a t e d 17 43 13 73 27 1 0 0
St ra igh t T rucks % o f T o t a l 4 21 23 48 52 1 0 0R o a d T r a c t o r s % o f T o t a l 11 33 14 58 42 1 0 0
Semi- t ra i lor % o f T o t a l 22 52 10 85 15 1 0 0O t h e r % o f T o t a l 10 18 37 65 35 1 0 0
… not appropr ia te or no t app l icab leTo ta ls may no t add due to round ing .
Sources : S ta t i s t i cs Canada , Sur face and Mar ine T ranspor t (50 -002) :Vo l .16 ,No .1 :Summary Tab le , Tab les 8 , 9 , 11 .

53
Figure 2.1 Equipment Type by Carrier (actual): Motor Carriers of Freight, Summary Statistics, Canada 1997
0
20,000
40,000
60,000
80,000
100,000
120,000
140,000
160,000
Top Carriers Medium & LargeCarriers
Small Carriers Owner Operator
Carrier Category
Nu
mb
er o
f Un
its
OtherSemi-trailorRoad TractorsStraight Trucks
Figure 2.2 Carrier by Equipment Type (actual): Motor Carriers of Freight, Summary Statistics, Canada 1997
0
20,000
40,000
60,00080,000
100,000
120,000
140,000
160,000180,000
200,000
Straight Trucks Road Tractors Semi-trailor Other
Equipment Type
Nu
mb
er o
f Un
its
Owner Operator
Small Carriers
Medium & Large Carriers
Top Carriers

54
Medium and large carriers had the largest fleet of semi-trailers at 98,826 units, followed by top for-hire carriers at 41,884 units and owner operators at 29,148 (Figure 2.3). Owner operators predominantly utilized road tractor equipment and the number of road tractors operated by owner operators (39,543 units) exceeded the number of semi-trailers (29,148 units). Note that even though top for-hire carriers operated fewer semi-trailers than large and medium for-hire carriers, they still operated more semi-trailers than owner operators did road tractors.
Figure 2.3 Carrier by Equipment Type (actual): Motor Carriers of Freight, Summary Statistics, Canada 1997
0
20,000
40,000
60,000
80,000
100,000
120,000
Straight Trucks Road Tractors Semi-trailor Other
Equipment Type
Nu
mb
er o
f Un
its
Top CarriersMedium & Large CarriersSmall CarriersOwner Operator
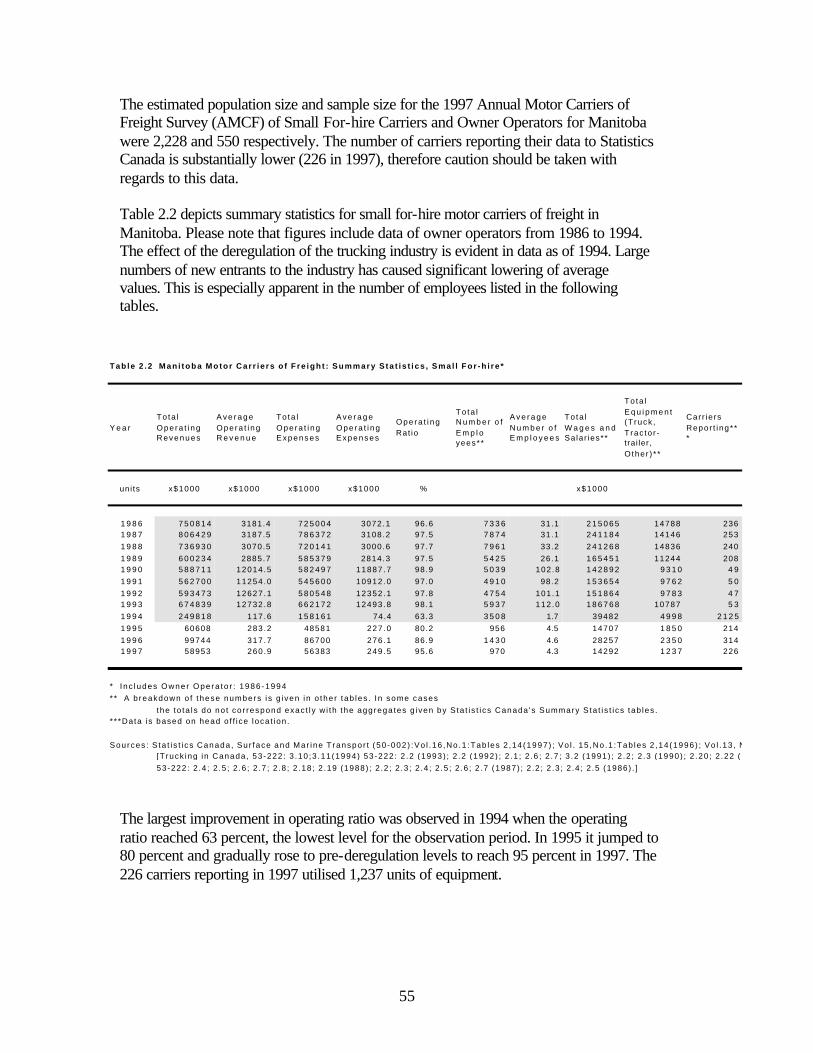
55
The estimated population size and sample size for the 1997 Annual Motor Carriers of Freight Survey (AMCF) of Small For-hire Carriers and Owner Operators for Manitoba were 2,228 and 550 respectively. The number of carriers reporting their data to Statistics Canada is substantially lower (226 in 1997), therefore caution should be taken with regards to this data. Table 2.2 depicts summary statistics for small for-hire motor carriers of freight in Manitoba. Please note that figures include data of owner operators from 1986 to 1994. The effect of the deregulation of the trucking industry is evident in data as of 1994. Large numbers of new entrants to the industry has caused significant lowering of average values. This is especially apparent in the number of employees listed in the following tables.
The largest improvement in operating ratio was observed in 1994 when the operating ratio reached 63 percent, the lowest level for the observation period. In 1995 it jumped to 80 percent and gradually rose to pre-deregulation levels to reach 95 percent in 1997. The 226 carriers reporting in 1997 utilised 1,237 units of equipment.
Tab le 2 .2 Man i toba Motor Car r i e rs o f F re igh t : Summary S ta t i s t i cs , Sma l l For -h i re *
Y e a rTo ta l Ope ra t i ng R e v e n u e s
A v e r a g e Ope ra t i ng R e v e n u e
To ta l Ope ra t i ng Expenses
A v e r a g e Ope ra t i ng Expenses
Ope ra t i ng Rat io
To ta l N u m b e r o f E m p l o yees**
A v e r a g e N u m b e r o f E m p l o y e e s
To ta l W a g e s a n d Salar ies**
To ta l E q u i p m e n t (T ruck , T rac to r - trai ler, O ther ) * *
Car r ie rs Repor t ing* **
uni ts x$1000 x$1000 x$1000 x$1000 % x$1000
1 9 8 6 7 5 0 8 1 4 3181.4 7 2 5 0 0 4 3072.1 96.6 7 3 3 6 31.1 2 1 5 0 6 5 14788 2361 9 8 7 8 0 6 4 2 9 3187.5 7 8 6 3 7 2 3108.2 97.5 7 8 7 4 31.1 2 4 1 1 8 4 14146 2531 9 8 8 7 3 6 9 3 0 3070.5 7 2 0 1 4 1 3000.6 97.7 7 9 6 1 33.2 2 4 1 2 6 8 14836 2401 9 8 9 6 0 0 2 3 4 2885.7 5 8 5 3 7 9 2814.3 97.5 5 4 2 5 26.1 1 6 5 4 5 1 11244 2081 9 9 0 5 8 8 7 1 1 12014 .5 5 8 2 4 9 7 11887 .7 98.9 5 0 3 9 102.8 1 4 2 8 9 2 9 3 1 0 4 91 9 9 1 5 6 2 7 0 0 11254 .0 5 4 5 6 0 0 10912 .0 97.0 4 9 1 0 98.2 1 5 3 6 5 4 9 7 6 2 5 01 9 9 2 5 9 3 4 7 3 12627 .1 5 8 0 5 4 8 12352 .1 97.8 4 7 5 4 101.1 1 5 1 8 6 4 9 7 8 3 4 71 9 9 3 6 7 4 8 3 9 12732 .8 6 6 2 1 7 2 12493 .8 98.1 5 9 3 7 112.0 1 8 6 7 6 8 10787 5 31 9 9 4 2 4 9 8 1 8 117.6 1 5 8 1 6 1 74.4 63.3 3 5 0 8 1.7 39482 4 9 9 8 2 1 2 51 9 9 5 60608 283.2 48581 227.0 80.2 956 4.5 14707 1 8 5 0 2141 9 9 6 99744 317.7 86700 276.1 86.9 1 4 3 0 4.6 28257 2 3 5 0 3141 9 9 7 58953 260.9 56383 249.5 95.6 970 4.3 14292 1 2 3 7 226
* I nc ludes Owner Ope ra to r : 1986 -1994* * A b reakdown o f these numbers i s g i ven in o the r tab les . I n some cases
the to ta ls do no t co r respond exac t l y w i th the aggrega tes g iven by S ta t i s t i cs Canada 's Summary S ta t i s t i cs tab les .* * *Data is based on head o f f i ce loca t ion .
Sources : S ta t i s t i cs Canada , Sur face and Mar ine T ranspor t (50 -002) :Vo l .16 ,No .1 :Tab les 2 ,14 (1997) ; Vo l . 15 ,No .1 :Tab les 2 ,14 (1996) ; Vo l .13 , No .6 : Tab les 1 , 13 (1995) ; [T ruck ing in Canada , 53 -222 : 3 .10 ;3 .11(1994) 53 -222 : 2 .2 (1993) ; 2 .2 (1992) ; 2 .1 ; 2 .6 ; 2 .7 ; 3 .2 (1991) ; 2 .2 ; 2 .3 (1990) ; 2 .20 ; 2 .22 (1989) ;53-222: 2 .4 ; 2 .5 ; 2 .6 ; 2 .7 ; 2 .8 ; 2 .18 ; 2 .19 (1988) ; 2 .2 ; 2 .3 ; 2 .4 ; 2 .5 ; 2 .6 ; 2 .7 (1987) ; 2 .2 ; 2 .3 ; 2 .4 ; 2 .5 (1986) . ]

56
Table 2.3 shows summary statistics for owner operator motor carriers of freight in Manitoba. Please note that figures include data of small for-hire carriers from 1986 to 1994. Again, the effect of the deregulation of the trucking industry is evident in data as of 1994. The entry of new players in large numbers has caused significant lowering in average values.
In 1995 the operating ratio was 72 percent and gradually increased to reach 93 percent in 1997. The 2,002 owner operators reporting in 1997 utilized 4,219 units of equipment.
Table 2.3 Manitoba Motor Carriers of Freight: Summary Statistics, Owner Operator*
YearTotal Operating Revenues
Average Operating Revenue
Total Operating Expenses
Average Operating Expenses
Operating Rat io
Total Number of Emplo yees**
Average Number of Employees
Total Wages and Salaries**
Total Equipment (Truck, Tractor- trailer, Other)**
Carriers Reporting***
units x$1000 x$1000 x$1000 x$1000 % x$1000
1986 750814 3181.4 725004 3072.1 96.6 7336 31.1 215065 14788 2361987 806429 3187.5 786372 3108.2 97.5 7874 31.1 241184 14146 2531988 736930 3070.5 720141 3000.6 97.7 7961 33.2 241268 14836 2401989 600234 2885.7 585379 2814.3 97.5 5425 26.1 165451 11244 2081990 588711 12014.5 582497 11887.7 98.9 5039 102.8 142892 9310 491991 562700 11254.0 545600 10912.0 97.0 4910 98.2 153654 9762 501992 593473 12627.1 580548 12352.1 97.8 4754 101.1 151864 9783 471993 674839 12732.8 662172 12493.8 98.1 5937 112.0 186768 10787 531994 249818 117.6 158161 74.4 63.3 3508 1.7 39482 4998 21251995 328527 163.4 236849 117.8 72.1 3368 1.7 63083 5258 20101996 277130 136.9 196469 97.1 70.9 3430 1.7 41126 5216 20241997 291525 145.6 269253 134.5 92.4 2882 1.4 53912 4219 2002
* Includes Small For-hire: 1986-1994** A breakdown of these numbers is given in other tables. In some cases
the totals do not correspond exactly with the aggregates given by Statistics Canada's Summary Statistics tables.***Data is based on head off ice location.
Sources: Statistics Canada, Surface and Marine Transport (50-002):Vol.16,No.1:Tables 8,11,14(1997); Vol. 15,No.1:Table 8,11, 14(1996); Vol.13, No.6: Tables 8,13 (1995); [Trucking in Canada, 53-222: 3.10;3.11(1994) 53-222: 2.2 (1993); 2.2 (1992); 2.1; 2.6; 2.7; 3.2 (1991); 2.2; 2.3 (1990); 2.20; 2.22 (1989);53-222: 2.4; 2.5; 2.6; 2.7; 2.8; 2.18; 2.19 (1988); 2.2; 2.3; 2.4; 2.5; 2.6; 2.7 (1987); 2.2; 2.3; 2.4; 2.5 (1986).]

57
Table 2.4 shows summary statistics for Canadian small for-hire motor carriers of freight. The trend for the operating ratio was upwards from 80 percent in 1995 to 88 percent in 1997. The 7,745 carriers reporting in 1997 operated 43,870 units of equipment.
Summary statistics for Canadian owner operator motor carriers of freight are shown in Table 2.5.
The operating ratio for Canadian owner operators in 1995 was 75 percent. In 1997 the ratio had risen to 88 percent. The 40,221 carriers reporting operated 94,742 equipment units.
Table 2.4 Canada Motor Carriers of Freight: Summary Statistics, Small For-hire
YearTotal Operating Revenues
Average Operating Revenue
Total Operating Expenses
Average Operating Expenses
Operating Ratio
Total Number of Emplo- yees**
Average Number of Employees
Total Wages and Salaries**
Total Equipment (Truck, Tractor- trailer, Other)**
Carriers Reporting***
units x$1000 x$1000 x$1000 x$1000 % x$1000
1995 2113416 264.7 1697501 212.6 80.3 22588 2.8 525889 41053 79851996 2127077 261.3 1771672 217.7 83.3 26353 3.2 530753 40756 81401997 2016998 260.4 1776189 229.3 88.1 25624 3.3 465782 43870 7745
** A breakdown of these numbers is given in other tables. In some casesthe totals do not correspond exactly with the aggregates given by Statistics Canada's Summary Statistics tables.
***Data is based on head office location.
Sources: Statistics Canada, Surface and Marine Transport (50-002):Vol.16,No.1:Tables 2,14(1997); Vol. 15,No.1:Tables 2,14(1996); Vol.13, No.6: Tables 1, 13(1995); Trucking in Canada, 53-222: 3.10;3.11(1994) 53-222: 2.2 (1993); 2.2 (1992); 2.1; 2.6; 2.7; 3.2 (1991); 2.2; 2.3 (1990); 2.20; 2.22 (1989);53-222: 2.4; 2.5; 2.6; 2.7; 2.8; 2.18; 2.19 (1988); 2.2; 2.3; 2.4; 2.5; 2.6; 2.7 (1987); 2.2; 2.3; 2.4; 2.5 (1986).
Table 2.5 Canada Motor Carriers of Freight: Summary Statistics, Owner Operator
YearTotal Operating Revenues
Average Operating Revenue
Total Operating Expenses
Average Operating Expenses
Operating Ratio
Total Number of Emplo- yees**
Average Number of Employees
Total Wages and Salaries**
Total Equipment (Truck, Tractor- trailer, Other)**
Carriers Reporting***
units x$1000 x$1000 x$1000 x$1000 % x$1000
1995 5263543 133.2 3950416 99.9 75.1 57335 1.5 871288 95229 395301996 5228344 130.4 3853481 96.1 73.7 61377 1.5 790610 102528 400901997 5822897 144.8 5113198 127.1 87.8 64242 1.6 963056 94742 40221
** A breakdown of these numbers is given in other tables. In some casesthe totals do not correspond exactly with the aggregates given by Statistics Canada's Summary Statistics tables.
***Data is based on head office location.
Sources: Statistics Canada, Surface and Marine Transport (50-002):Vol.16,No.1:Tables 8,11,14(1997); Vol. 15,No.1:Table 8,11, 14(1996); Vol.13, No.6: Tables 8,13 (1995); Trucking in Canada, 53-222: 3.10;3.11(1994) 53-222: 2.2 (1993); 2.2 (1992); 2.1; 2.6; 2.7; 3.2 (1991); 2.2; 2.3 (1990); 2.20; 2.22 (1989);53-222: 2.4; 2.5; 2.6; 2.7; 2.8; 2.18; 2.19 (1988); 2.2; 2.3; 2.4; 2.5; 2.6; 2.7 (1987); 2.2; 2.3; 2.4; 2.5 (1986).

58
Table 2.6 shows summary statistics for medium to top for-hire motor carriers of freight in Canada.
Although the effects of deregulation of the industry was not equivalently significant on operating ratio for medium to top for-hire carriers as it was for small-for hire and owner operators, it appears to have trickled through to the larger carriers. The operating ratio in 1994 of 92 percent was the lowest of the entire review period. The 2,523 medium to large carriers reporting in 1999 operated 160,047 units of equipment.
Table 2.6 Canada Motor Carriers of Freight: Summary Statistics, Medium to Top For-hire
YearTotal
Operating Revenues
Average Operating Revenue
Total Operating Expenses
Average Operating Expenses
Operating Ratio
Total Number of Emplo-
yees**
Average Number of Employees
Total Wages and Salaries**
Total Equipment *
**
Carriers Reporting***
units x$1Mil. x$1000 x$1Mil. x$1000 % x$1Mil.
1986 8628.0 1389.1 8208.6 1321.6 95.1 96518 15.5 2724.8 158573 62111987 9344.8 1388.7 8936.6 1328.1 95.6 101004 15.0 2909.3 166232 67291988 9611.7 1638.3 9212.8 1570.3 95.8 97237 16.6 2978.9 165739 58671989 10224.4 1863.7 9872.2 1799.5 96.6 97396 17.8 3140.0 168009 54861990 8423.6 6239.7 8177.5 6057.4 97.1 73716 54.6 2179.1 138333 13501991 8098.0 5631.4 7891.0 5487.5 97.4 72617 50.5 2565.0 138919 14381992 8362.5 6668.7 8073.0 6437.8 96.5 71909 57.3 2642.3 138504 12541993 8949.7 5872.5 8560.0 5616.8 95.6 72728 47.7 2522.4 143878 15241994 10976.2 7332.1 10145.6 6777.3 92.4 77221 51.6 3115.2 113232 14971995 12127.5 5656.5 11569.1 5396.0 95.4 90286 42.1 3576.4 131239 21441996 13102.6 5963.9 12682.1 5772.5 96.8 89015 40.5 3472.1 132861 21971997 14271.2 6075.4 13587.2 5784.2 95.2 91654 39.0 3750.7 144004 23491998 14888.1 6268.7 14074.9 5926.3 94.5 92423.5 38.9 3963.0 149702 23751999 16180.7 6413.3 15413.9 6109.4 95.3 102637 40.7 4374.6 160047 2523
* Up to 1993, this total included straight trucks, road tractors, semi trailers and full trailers, and other equipment. 1994 and after, this total includes van/semi trailer temperature controlled, van/semi trailer non-temperature controlled, flat deck, full trailers, dump trailers, container chassis, tank (liquid bulk), and other equipment.** A breakdown of these numbers is given in other tables. In some cases
the totals do not correspond exactly with the aggregates given by Statistics Canada's Summary Statistics tables.***Data is based on head office location.Note: As of 1994, the Total Wages and Salaries includes employee benefits.
Sources: Statistics Canada, Trucking in Canada (53-222):Tables 2.1,2.5,2.11 (1999); Tables 2.1,2.5,2.11(1998); Tables 2.1,2.4,2.6,2.10(1997); Tables 2.1,2.9 (1996);53-222: Tables 2.1; 2.9(1995) ;3.10; 3.11 (1994); 2.2 (1993); 2.2 (1992); 2.1; 2.6; 2.7; 3.2 (1991); 2.2; 2.3 (1990); 2.20; 2.22 (1989);53-222: 2.4; 2.5; 2.6; 2.7; 2.8; 2.18; 2.19 (1988); 2.2; 2.3; 2.4; 2.5; 2.6; 2.7 (1987); 2.2; 2.3; 2.4; 2.5 (1986).

59
Tables 2.7, 2.8 and 2.9 depict the results of a fuel consumption and cost survey on Manitoba motor carriers of freight. Distances traveled by vehicle type, fuel consumption and cost are reported. Table 2.7 shows results for owner operators. Care must be taken forming any conclusions based on this data due to the large change in the number of carriers that returned surveys to Statistics Canada.
Table 2.7 Manitoba Owner Operators: Estimated Annual Distance Traveledby Vehicle Type; Fuel Consumption and Cost Survey*
Year 1990 1991 1992 1993 1994*** 1995 1996 1997
Total Distance** x1000km 473000 454753 500605 588756 77280 419321 328939 332914Straight Truck: Total '' 12248 16268 13336 27737 7011 15094 19971 21031 Owned & Leased '' 9657 11476 11411 19317 5932 - Owner-Operator Operated '' 2591 4792 1925 8420 1078 -Road Tractors: Total '' 460752 438486 487269 561019 70270 404227 308968 311883 Owned & Leased '' 225825 235961 282805 317386 45183 - Owner-Operator Operated '' 234927 202525 204464 243633 25087 -
Carriers Surveyed No. 49 50 47 53 215 2010 2024 2002
Total Fuel Consumed x1000l 119232 121572 136866 152884 24992 189522 150560 149702
Fuel Consumed per 100 km **** l/100 km 50.6 49.1 46.5 45.4 48.9 45.2 45.8 45.0Fuel Consumed per Carrier x1000l 2433.3 2431.4 2912.0 2884.6 116.2 94.3 74.4 74.8Total Cost x$1000 47463 49214 57138 62503 11005 80788 70270 67501Total Cost per Carrier '' 968.6 984.3 1215.7 1179.3 51.2 40.2 34.7 33.7Average Cost/Litre dollars 0.40 0.40 0.42 0.41 0.44 0.43 0.47 0.45
Average distance travelled per vehicle, Owner OperatorStraight TrucksOwner Operator x1000km 35 41 42Road TractorsOwner Operator x1000km 164 133 147
* Includes Small For-hire: 1986-1994** Totals may not add due to rounding*** Caution is required since these data are for level-III for-hire carriers only**** This number is for owned & leased equipment only. After 1995 it includes all equipment
Sources: Statistics Canada, Surface and Marine Transport, 50-002:Vol.16,No.1:Tables 12,13,15(1997); Vol. 15, No.1:Tables 12,13,15(1996); Vol.13, No.6:Tables 11,12,14 (1995). Trucking in Canada, 53-222: 3.6; 3.7 (1994); 2.8; 2.10 (1993); 2.8; 2.10 (1992); 2.8; 2.9 (1991); 2.8; 2.9 (1990); 2.30; 2.31 (1989); 2.21; 2.23 (1988); 2.21; 2.23 (1987); 2.21; 2.23 (1986).

60
Table 2.8 shows the results of the survey on Manitoba small for-hire carriers. It can be seen that as fuel is becoming more expensive, the trucking community is taking care to both drive more efficiently and to purchase more fuel efficient tractors. The average fuel consumed per 100 km has decreased by approximately 28 percent, from 50.6 litres to 36.4 litres.
Table 2.8 Manitoba Small For-Hire Carriers: Estimated Annual Distance Traveledby Vehicle Type; Fuel Consumption and Cost Survey*
Year 1990 1991 1992 1993 1994*** 1995 1996 1997
Total Distance** x1000km 473000 454753 500605 588756 77280 70334 113932 68708Straight Truck: Total '' 12248 16268 13336 27737 7011 7538 20125 8918 Owned & Leased '' 9657 11476 11411 19317 5932 6635 20125 7275 Owner-Operator Operated '' 2591 4792 1925 8420 1078 902 - 1643Road Tractors: Total '' 460752 438486 487269 561019 70270 62796 93807 59790 Owned & Leased '' 225825 235961 282805 317386 45183 54725 77874 47160 Owner-Operator Operated '' 234927 202525 204464 243633 25087 8072 15933 12630
Carriers Surveyed No. 49 50 47 53 215 214 314 226
Total Fuel Consumed x1000l 119232 121572 136866 152884 24992 24883 44360 25031
Fuel Consumed per 100 km **** l/100 km 50.6 49.1 46.5 45.4 48.9 35.4 38.9 36.4Fuel Consumed per Carrier x1000l 2433.3 2431.4 2912.0 2884.6 116.2 116.3 141.3 110.8Total Cost x$1000 47463 49214 57138 62503 11005 11713 21623 11583Total Cost per Carrier '' 968.6 984.3 1215.7 1179.3 51.2 54.7 68.9 51.3Average Cost/Litre dollars 0.40 0.40 0.42 0.41 0.44 0.47 0.49 0.46
Average distance travelled per vehicle, Small For-hireStraight TrucksOwned and Leased x1000km 26 52 54Road TractorsOwned and Leased x1000km 94 110 105
* Includes Owner Operator: 1986-1994** Totals may not add due to rounding*** Caution is required since these data are for level-III for-hire carriers only**** This number is for owned & leased equipment only. After 1995 it includes all equipment
Sources: Statistics Canada, Surface and Marine Transport, 50-002:Vol.16,No.1:Tables 5, 6, 15 (1997);Vol. 15, No.1:Tables 5,6,15(1996); Vol.13, No.6:Tables 5,6,13(1995). Trucking in Canada, 53-222: 3.6; 3.7 (1994); 2.8; 2.10 (1993); 2.8; 2.10 (1992); 2.8; 2.9 (1991); 2.8; 2.9 (1990); 2.30; 2.31 (1989); 2.21; 2.23 (1988); 2.21; 2.23 (1987); 2.21; 2.23 (1986).

61
Table 2.9 shows the survey results for Canada private carriers.
Table 2.9 Canada Private Carriers: Estimated Annual Distance Traveledby Vehicle Type; Fuel Consumption and Cost Survey
Year 1990 1991 1992 1993 1994** 1995 1996 1997 1998
Total Distance* x1000km 5496095 5655399 5942724 6574804 1951132 945048 949004 783966 567955Straight Truck: total '' 361446 435410 429603 455558 394371 382084 315590 299448 133842 Owned & Leased '' 301614 346077 341978 337640 375769 382084 315590 299448 133842 Owner-Operator Operated '' 59832 89333 87625 117918 18601 - - - -
Road Tractors: Total '' 5134649 5219989 5513120 6119247 1556761 562964 633414 484518 434113 Owned & Leased '' 2607039 2939515 3119465 3508912 1325413 562964 633414 484518 434113 Owner-Operator Operated '' 2527610 2280473 2393655 2610355 231349 - - - -
Carriers Surveyed No. 1350 1427 1460 1580 7901 442 456 422 396
Total Fuel Consumed x1000l 1618149 1635170 1689360 1853025 865122 369565 370949 337171 368939Fuel Consumed per 100 km *** l/100 km 55.63 49.767896 48.8 48.2 50.9 39.1 39.1 43.0 65.0Fuel Consumed per Carrier x1000l 1198.63 1145.8795 1157.1 1172.8 109.5 836 813 799 932Total Cost x$1000 635207 676753 704946 761975 405102 166345 172671 150869 161579Total Cost per Carrier '' 470.52 474.24877 482.8 482.3 51.3 376.3 378.7 357.5 408.0Average Cost/Litre dollars 0.39 0.4138732 0.42 0.41 0.47 0.45 0.47 0.45 0.44
Average distance travelled per vehicle, Private TruckingStraight TrucksOwned and Leased x1000km 38500 36950 37648 20328.00Owner Operator x1000km - - - -Road TractorsOwned and Leased x1000km 110200 108815 98942 88540.00Owner Operator x1000km - - - -
Sources: Statistics Canada, Trucking in Canada (53-222):Tables 4.4,4.5(1998); 4.5,4.6 (1997); 4.5;4.6 (1996); 4.5;4.6 (1995) 3.6; 3.7 (1994); 2.8; 2.10 (1993); 2.8; 2.10 (1992); 2.8; 2.9 (1991); 2.8; 2.9 (1990); 2.30; 2.31 (1989); 2.21; 2.23 (1988); 2.21; 2.23 (1987); 2.21; 2.23 (1986).
* Totals may not add due to rounding.** Caution is required since these data are for level-III for-hire carriers only.*** This number is for owned & leased equipment only. After 1995 it is for all equipment.

62
Table 2.10 Manitoba For-Hire Carriers: Breakdown of Selected Estimates by Weight Group
1986 1987 1988 1989 1990 1991 1992 1993 1994
Revenue (x$1000):
total 231272 251089 242053 239047 223919 227993 169838 175570 N.A.up to 100 kg 15487 13085 11587 12349 12663 12163 11305 10192 ''100-999 kg 40354 41361 36303 40582 39047 41151 41148 36682 ''1000-1999 kg 20676 18880 16821 19840 17244 23848 20570 20559 ''2000-4999 kg 23751 25376 31126 24560 23589 19942 18031* 19547* ''5000-9999 kg 21735 24691 19099 19265 19455 23357 29825* 39156* ''10000-19999 kg 49539 61265 60401 59854 48599 36293 30205 44841 ''20000-29999 kg 30774 31988 35616 41029 38290 40260 40635 36262 ''30000-44999 kg 26878 33395 29042 18448 23023 27895 22722 22804 ''45000-64999 kg 1158 952 2005 3120 1938 2871 3253 4230 ''65000 kg and over 920 96 53 N.A. 71 213 N.A. N.A. ''
Tonnes (x1000):
total 6370 6472 6204 5860 6062 5166 3919 3537 N.A.up to 100 kg 25 21 19 20 19 19 17 15 ''100-999 kg 175 169 161 165 150 158 150 137 ''1000-1999 kg 134 118 117 106 83 138 119 118 ''2000-4999 kg 166 184 232 166 166 137 112* 116* ''5000-9999 kg 208 218 202 219 198 220 264* 306* ''10000-19999 kg 831 956 952 1122 987 593 503 666 ''20000-29999 kg 1482 1009 1048 1336 1937 1325 1322 1024 ''30000-44999 kg 2771 3720 3301 2598 2379 2376 1602 1277 ''45000-64999 kg 177 64 167 128 139 174 206 300 ''65000 kg and over 401 13 5 N.A. 4 26 N.A. N.A. ''
*Caution is required since these data use weight classes: 2000-4499 kg and 4500-9999 kg
Sources: Statistics Canada, Trucking in Canada, 53-222: 3.17 (1993); 4.19 (1992); 4.15 (1991); 4.15 (1990); 4.16 (1989); 4.16 (1988); 4.19 (1987); 3.20 (1986).
Table 2.10 Manitoba For-Hire Carriers: Breakdown of Selected Estimates by Weight Group (Continued)
1986 1987 1988 1989 1990 1991 1992 1993 1994
Tonne-km (x1000)
Total 3041534 4380029 3571422 3044746 3112643 2730018 2060840 2253312 N.A.up to 100 kg 19686 20758 16204 17679 17121 15357 13307 12924 "100-999 kg 139363 156775 141358 154249 142276 145855 137931 119027 ''1000-1999 kg 90112 94619 79836 101391 82268 103090 84274 91106 ''2000-4999 kg 150383 163566 195365 158381 154391 128680 101652* 107122* ''5000-9999 kg 203408 249091 185726 209191 220008 233114 279163* 369221* ''10000-19999 kg 888307 1073506 1104367 1063446 992735 606225 451152 653156 ''20000-29999 kg 578278 698248 717446 786728 758761 797610 816652 680019 ''30000-44999 kg 899198 1900661 1056864 503999 684924 610126 481661 556526 ''45000-64999 kg 26881 19117 70584 49682 57514 80632 75863 140554 ''65000 kg and over 45918 3688 3672 N.A. 2645 9329 N.A. N.A. ''
Shipments (x1000)
total 1497 1537 1388 1340 1324 1270.3 1094 975 N.A.up to 100 kg 570 473 450 462 454 447 410 348 ''100-999 kg 549 526 502 517 467 483 458 411 ''1000-1999 kg 99 81 80 78 59 103 89 87 ''2000-4999 kg 52 57 78 51 51 44 37* 38* ''5000-9999 kg 28 30 27 30 26 28 36* 41* ''10000-19999 kg 51 60 58 68 61 39 33 45 ''20000-29999 kg 63 44 45 56 84 55 54 43 ''30000-44999 kg 76 102 81 75 66 67 46 35 ''45000-64999 kg 4 1 4 3 3 4 4 6 ''65000 kg and over 5 163 63 N.A. 53 0.3 N.A. N.A. ''
*Caution is required since these data use weight classes: 2000-4499 kg and 4500-9999 kg
Sources: Statistics Canada, Trucking in Canada, 53-222: 3.17 (1993); 4.19 (1992); 4.15 (1991); 4.15 (1990); 4.16 (1989); 4.16 (1988); 4.19 (1987); 3.20 (1986).
Table 2.10 gives a breakdown of selected estimates for for-hire carriers in Manitoba by weight group. 1993 was the final year that this data was reported in this manner.

63
Table 2.11 gives a breakdown of selected estimates for medium to top for-hire carriers in Canada by weight group. In 1998 the total revenue across all weight groups was $6.4 billion. The largest share of revenue was earned in the 10,000 to 19,999 kilogram weight group ($1.2 billion), followed by 20,000 to 29,999 kilogram weight group ($1.1 billion). An estimated total of 178 million tonnes were transported in 1998. The largest share of 68 million tonnes was transported in the 30,000 to 44,999 kilogram weight group, followed by the 20,000 to 29,999 kilogram weight group with 49 million tonnes.
Table 2.11 Canada Medium to Top For-Hire Carriers: Breakdown of Selected Estimates by Weight Group
1990 1991 1992 1993 1994 1995 1996 1997 1998
Revenue (x$1000)
total 4976164 4730195 4703074 5050111 5617772 5905544 6284166 6377075 6401169up to 100 kg 294432 277279 271364 259564 254732 272942 266535 252365 259389100-999 kg 782319 797714 783568 794257 849049 810540 444321 906993 8934171000-1999 kg 416628 466619 451927 416815 453315 432325 483058 483996 5188882000-4999 kg 435432 414470 461406* 411546* 459364* 454087 483058 496615 4913345000-9999 kg 406020 426189 447518* 541712* 635117* 640903 685647 682928 69534610000-19999 kg 985036 817030 764860 924813 1050564 1125145 1200286 1224884 123969420000-29999 kg 810347 733004 729994 842771 959511 1091694 1152119 1159021 112592930000-44999 kg 764760 722974 721115 771881 853615 963741 1024302 1045511 103161745000-64999 kg 66470 62608 56032 68804 81946 92776 106119 106961 12064365000 kg and over 14720 12308 15290 17948 20560 21391 23482 17800 24911
Tonnes (x1000)
total 149325 126453 123109 140374 154890 167334 181863 167763 177830up to 100 kg 352 333 307 283 288 294 319 251 261100-999 kg 2769 2837 2665 2707 2918 2900 3304 3131 32111000-1999 kg 3201 3318 2971 2689 2917 2912 2957 3217 35422000-4999 kg 3467 3318 3338* 2803* 3057* 3180 3607 3503 35515000-9999 kg 5661 5587 5737* 6384* 7265* 7253 8032 7556 902510000-19999 kg 30744 21351 19670 23793 26474 27931 31132 28829 3045920000-29999 kg 33915 28088 27856 33157 41809 45259 45269 44121 4904430000-44999 kg 63715 56272 54932 61769 61329 68494 75692 67977 6830945000-64999 kg 4527 4286 4245 5168 6957 7406 8984 7698 883865000 kg and over 974 1063 1388 1621 1876 1704 2566 1479 1589
* Caution is required since these data use weight classes: 2000-4499 kg and 4500-9999 kg
Sources: Statistics Canada, Trucking in Canada, 53-222:Table 3.15(1998): 3.14(1997); 3.14 (1996); 3.16 (1995); 4.17 (1994); 3.17 (1993); 4.19 (1992); 4.15 (1991); 4.15 (1990); 4.16 (1989); 4.16 (1988); 4.19 (1987); 3.20 (1986).

64
In the second part of Table 2.11 it can be seen that 77 billion tonne-km were travelled in 1998, mostly by the 20,000-29,999 kg group with 23 billion tonne-km and followed closely by the 30,000-44,999 kg group with 21 billion tonne-km. These two groups constitute 57 percent of the total quantity of tonne-km travelled in Canada. It is not surprising to note that the largest number of shipments were in the two smallest weight categories. 100-999 kg shipments were most common with 8.9 million shipments followed by under 100 kg shipments of which there were 7.0 million. These two groups reflect 59 percent of all shipments in Canada. It is only in these two categories where such dominance occurs.
Table 2.11 Canada Medium to Top For-Hire Carriers: Breakdown of Selected Estimates by Weight Group (Continued)
1990 1991 1992* 1993* 1994* 1995 1996 1997 1998
Tonne-km (x1Mil.)
total 54700.3 47709.4 47753.0 51973.8 60103.4 65767.3 71472.6 72240.1 76693.7up to 100 kg 261.0 240.6 214.5 196.5 182.0 202.7 222.2 207.8 206.7100-999 kg 2032.0 2006.1 1921.6 1951.2 2081.8 2161.0 2573.8 2681.8 2679.31000-1999 kg 1548.7 1704.5 1587.8 1501.7 1598.1 1646.4 1820.2 1915 2072.12000-4999 kg 2168.0 1989.9 2027.6 1728.0 1971.8 2131.2 2538.0 2539.8 2572.75000-9999 kg 3084.0 3034.3 3179.6 3835.6 4520.0 4820.5 5284.3 5373.1 5760.610000-19999 kg 13908.4 10085.7 9192.5 10846.0 12812.3 13906.2 15968.9 15410.2 15844.720000-29999 kg 14419.2 12736.6 12730.8 14110.2 17117.4 19279.0 20262.8 20339 23082.430000-44999 kg 15129.7 13694.3 14810.8 15274.0 17057.0 18537.7 19303.3 20597.4 20717.145000-64999 kg 1738.7 1547.6 1394.3 1720.9 1960.8 2233.8 2632.0 2568.6 2906.765000 kg and over 410.6 669.8 693.5 809.7 802.2 848.8 867.1 607.5 851.3
Shipments (x1000)
total 26729 25744 24098 21935 26068 27068 29409 25628 27018up to 100 kg 8880 8983 8090 7289 8288 8884 9349 6726 6984100-999 kg 8380 8260 7871 7845 8191 8189 9382 8589 89021000-1999 kg 2342 2464 2236 2016 2174 2166 2192 2390 26512000-4999 kg 1077 1040 1049* 949* 1038* 1066 1200 1162 11785000-9999 kg 767 754 774* 913* 1038* 1018 1144 1077 126710000-19999 kg 2021 1418 1300 1589 1742 1844 2043 1899 199820000-29999 kg 1389 1155 1148 1371 1738 1880 1854 1808 204730000-44999 kg 1769 1570 1526 1699 1695 1885 2085 1871 187145000-64999 kg 91 87 86 105 140 152 183 155 17765000 kg and over 13 13 18 21 24 22 33 20 21
* Caution is required since these data use weight classes: 2000-4499 kg and 4500-9999 kg
Sources: Statistics Canada, Trucking in Canada, 53-222:Table 3.15(1998): 3.14(1997); 3.14 (1996); 3.16 (1995); 4.17 (1994); 3.17 (1993); 4.19 (1992); 4.15 (1991); 4.15 (1990); 4.16 (1989); 4.16 (1988); 4.19 (1987); 3.20 (1986).
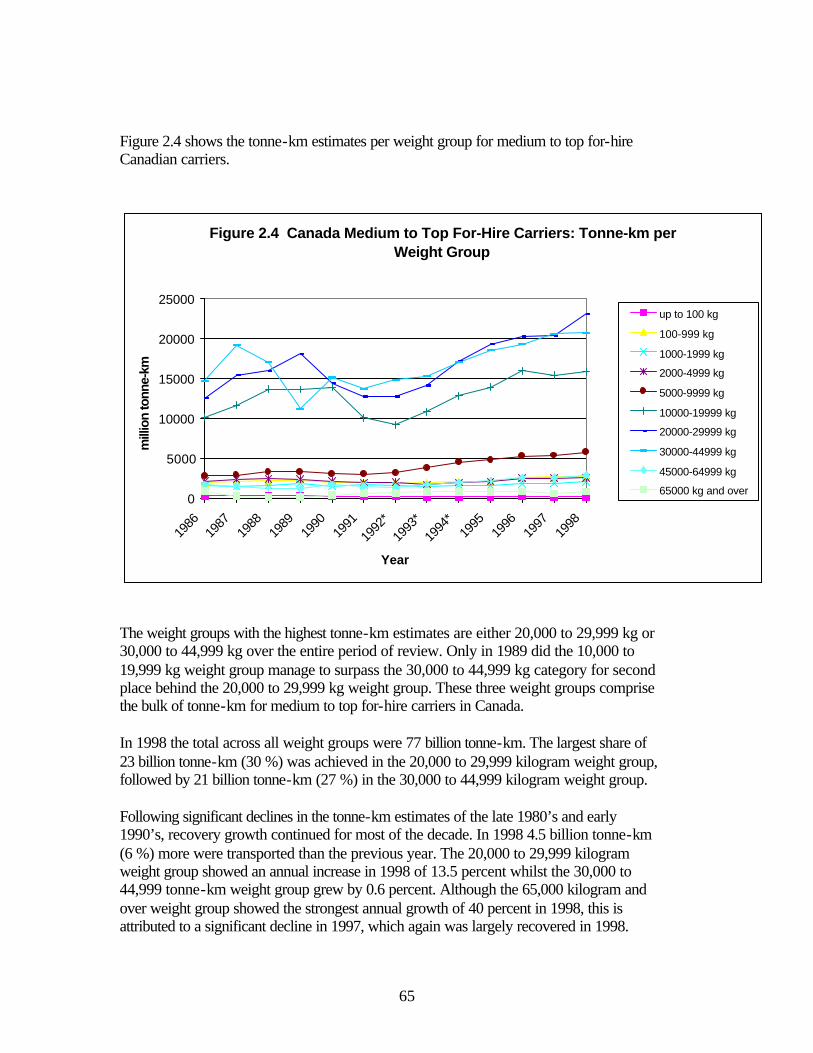
65
Figure 2.4 shows the tonne-km estimates per weight group for medium to top for-hire Canadian carriers.
The weight groups with the highest tonne-km estimates are either 20,000 to 29,999 kg or 30,000 to 44,999 kg over the entire period of review. Only in 1989 did the 10,000 to 19,999 kg weight group manage to surpass the 30,000 to 44,999 kg category for second place behind the 20,000 to 29,999 kg weight group. These three weight groups comprise the bulk of tonne-km for medium to top for-hire carriers in Canada. In 1998 the total across all weight groups were 77 billion tonne-km. The largest share of 23 billion tonne-km (30 %) was achieved in the 20,000 to 29,999 kilogram weight group, followed by 21 billion tonne-km (27 %) in the 30,000 to 44,999 kilogram weight group. Following significant declines in the tonne-km estimates of the late 1980’s and early 1990’s, recovery growth continued for most of the decade. In 1998 4.5 billion tonne-km (6 %) more were transported than the previous year. The 20,000 to 29,999 kilogram weight group showed an annual increase in 1998 of 13.5 percent whilst the 30,000 to 44,999 tonne-km weight group grew by 0.6 percent. Although the 65,000 kilogram and over weight group showed the strongest annual growth of 40 percent in 1998, this is attributed to a significant decline in 1997, which again was largely recovered in 1998.
Figure 2.4 Canada Medium to Top For-Hire Carriers: Tonne-km per Weight Group
0
5000
10000
15000
20000
25000
1986
1987
1988
1989
1990
1991
1992
*19
93*
1994
*19
9519
9619
9719
98
Year
mill
ion
tonn
e-km
up to 100 kg
100-999 kg
1000-1999 kg
2000-4999 kg
5000-9999 kg
10000-19999 kg
20000-29999 kg
30000-44999 kg
45000-64999 kg
65000 kg and over

66
Table 2.12 contains information on equipment operated in Manitoba and Canada. Manitoba information refers to small for-hire carriers and owner operators. Canada information refers only to private carriers.
In 1998 Canadian private carriers operated 25,203 total units of equipment. Straight trucks comprised 6,584, road tractors 4,903, semi-trailers and full-trailers 12,244 and other equipment 1,472 units. A long term declining trend is observed in the number of units of all equipment types used by Canadian private carriers.
Table 2.12 For-Hire, Owner Operator and Private Carriers: Equipment Operated
Year Total Owned & Leased
Operated by Owner Ooperator
Total Owned & Leased
Operated by Owner Ooperator
Total Owned & Leased
Operated by Owner Ooperator
Total Owned & Leased
Operated by Owner Ooperator
Total Owned & Leased
Operated by Owner Ooperator
Manitoba Small For-hire and Owner Operator
1986 848 832 16 2873 2807 66 10006 9523 483 1061 1061 N.A. 14788 14223 5651987 770 750 20 2657 2440 217 9440 8767 673 1279 1268 11 14146 13225 9211988 821 784 37 2825 2528 297 10169 9183 986 1021 1011 10 14836 13506 13301989 576 561 15 2087 1869 218 8003 7427 576 578 578 N.A. 11244 10435 8091990 240 230 10 1746 1580 166 7174 6260 914 150 148 2 9310 8218 10921991 291 267 24 1823 1435 388 7372 6055 1317 276 229 47 9762 7986 17761992 317 303 14 2043 1683 360 7134 5599 1535 289 243 46 9783 7828 19551993 580 564 16 2050 1625 425 7861 6531 1330 296 251 45 10787 8971 18161994 794 - - 2208 - - 1660 - - 336 - - 4998 - -1995 716 252 464 3096 584 2512 2840 776 2064 456 238 218 7108 1850 52581996 881 388 493 3159 709 2450 2771 960 1811 755 293 462 7566 2350 52161997 672 135 537 2654 451 2203 1881 612 1269 249 39 210 5456 1237 4219
Year Total Owned Leased Total Owned Leased Total Owned Leased Total Owned Leased Total Owned Leased
Canadian Private Carriers
1986 19661 18880 781 36716 34054 2662 95002 88516 6486 7194 6966 228 158573 148416 101571987 19373 18466 907 37964 34931 3033 101243 92018 9225 7652 7440 212 166232 152855 133771988 17727 16840 887 37307 33447 3860 103273 91570 11703 7432 7111 321 165739 148968 167711989 16872 15904 968 38532 34525 4007 105687 91976 13711 6918 6367 551 168009 148772 192371990 8609 7928 681 28740 25698 3042 93526 80209 13317 7458 6850 608 138333 120685 176481991 9130 8146 984 29236 25799 3437 94027 79768 14259 6526 5920 606 138919 119633 192861992 8360 7794 566 29862 26261 3601 93093 80523 12570 7189 6705 484 138504 121283 172211993 8253 7577 676 31059 26966 4093 96889 80878 16011 7677 6898 779 143878 122319 215591994 18309 - - 35970 - - 28354 - - 5913 - - 88546 - -1995 9917 8766 1151 5108 3709 1399 11898 8347 3551 1033 843 190 27956 21665 62911996 8541 7802 739 5821 3366 2455 13161 9109 4052 933 730 203 28456 21007 74491997 7954 5973 1981 4897 2849 2048 12304 11577 727 2595 1213 1382 27750 21612 61381998 6584 4873 1711 4903 3375 1528 12244 9227 3017 1472 731 741 25203 18206 6997
Note:** Semi trailer only starting in 1994.
Sources: Statistics Canada, Surface and Marine Transport (50-002):Vol.16,No.1:Table 14(1997); Vol. 15,No.1:Table 14(1996); Vol.13, No.6: Tables 1, 13(1995); Trucking in Canada, 53-222: Table 4.3 (1998): 4.4 (1995-97); 3.11 (1994); 2.7 (1993-1990); 2.29 (1989); 2.19 (1988-1986).
Total EquipmentSemi-trailers and Full Trailers**Straight Trucks Road Tractors Other Equipment

67
Figure 2.5 depicts equipment operated by Manitoba small for-hire carriers and owner operators. Total units of equipment declined from 14,788 in 1986 to 5,456 in 1997. Prior to 1994 semi-trailers and full-trailers made up the bulk of equipment. After 1994 the bulk of equipment was made up of approximately equal amounts of semi- and full-trailers as well as road tractors.
** Semi-trailers only starting in 1994 The 1994 dramatic drop in total units of equipment used by Manitoba small for-hire and owner operators (1993: 10,787; 1994: 4,998) coincided with a dramatic drop in the total units of equipment used by Canadian private carriers (1993:143,878; 1994: 88,546). The reason for this phenomenon is still unknown.
Figure 2.5 Equipment Operated: Manitoba Small For-hire and Owner Operator
0
2000
4000
6000
8000
10000
12000
14000
16000
1986 1987 1988 1989 1990 1991 1992 1993 1994 1995 1996 1997
Year
Nu
mb
er o
r u
nit
s
Semi-trailers and Full Trailers**
Road Tractors
Straight Trucks
Other Equipment

68
Table 2.13 shows the number and type of employees for small for-hire carriers in Manitoba and Canada. Over the entire period employment in this sector has been gradually increasing, but more importantly there is a trend for increased reliance on part-time workers. In 1992, in both Canada and Manitoba the ratio of full-time to part-time employees in the small for-hire sector was greater than 4. As of 1997, these numbers were reduced to 2.7 and 2.5 respectively, with a low in 1995 with only 2.3 full-time employees per part-time employee for Canada and only 1.9 in Manitoba.
The 226 carriers reporting in Manitoba in 1997 had 1,365 persons employed with small for-hire carriers and 118 as owner operators. This respectively constitute 31 percent and 21.9 percent drops from 1996. The 7,745 carriers reporting in Canada in 1997 had 35,034 persons employed with small for-hire carriers and 3,751 as owner operators. This respectively constitutes a 2.0 percent decrease and 4.8 percent increase from 1996.
Table 2.13 Manitoba and Canada Small (Level III) For-Hire Carriers: Number of Employees and Type
Year Drivers Other Employees Working OwnersSmall For-Hire
TotalOwner Operators
Carriers Reporting
TotalFull- time
Part- time Total
Full- time
Part- time Total
Full- time
Part- time
Full- time
Part- time Total
Full- time
Part- time Total
Manitoba
1991 241 192 49 170 90 80 190 163 27 445 156 53 37 16 1211992 976 827 149 250 165 85 N.A. N.A. N.A. 992 234 161 131 30 2421993 762 642 120 364 151 213 N.A. N.A. N.A. 793 333 107 107 N.A. 2511994 761 608 153 294 149 145 N.A. N.A. N.A. 757 298 231 173 58 2151995 923 616 307 535 340 195 N.A. N.A. N.A. 956 502 163 93 70 2141996 1299 973 326 692 458 234 N.A. N.A. N.A. 1430 560 151 90 61 3141997 915 674 241 450 297 153 N.A. N.A. N.A. 971 394 118 77 41 226
Canada
1991 13293 10368 2925 5791 3522 2269 8270 6503 1767 20393 6961 2983 2103 880 65561992 18790 15624 3166 7664 5775 1889 N.A. N.A. N.A. 21399 5055 2143 1655 488 59781993 21585 18013 3572 9767 5790 3977 N.A. N.A. N.A. 23803 7549 3109 2035 1074 75381994 22933 17505 5428 9906 5860 4046 N.A. N.A. N.A. 23365 9474 3836 2044 1792 79011995 23507 17403 6104 8881 5185 3696 N.A. N.A. N.A. 22588 9800 4180 1594 2586 79851996 24344 19197 5147 11410 7156 4254 N.A. N.A. N.A. 26353 9401 3490 2695 795 81401997 24177 18449 5728 10857 7175 3682 N.A. N.A. N.A. 25624 9410 3751 3027 724 7745
Sources: Statistics Canada, Surface and Marine Transport, 50-002,Vol.16 No.1, Table 4(1997); Vol. 15,No.1:Table 4(1996); Vol.13, No.6: Table 4(1995); 1990 is Table 11 equivalent in Vol.16 No.1, Table 4(1997). Trucking in Canada, 53-222: 3.4 (1994); 4.4 (1993); 6.4 (1992); 6.5 (1991); 6.8 (1990).

69
Figures 2.6 and 2.7 supports the suggestion that the Manitoba labour market in the small (Level III) for-hire carrier sector is more volatile than the equivalent parameters for Canada.
Figure 2.6 Number of Employees and Type for Manitoba Small For-Hire Carriers
0
500
1000
1500
2000
2500
1991 1992 1993 1994 1995 1996 1997
Year
Em
plo
yee
Nu
mb
ers Small For-Hire Total
SF-H Full Tiime
SF-H Part Time
Owner Operator Total
OP Full Tiime
OP Part Time
Grand Total
Figure 2.7 Number of Employees and Type for Canada Small For-Hire Carriers
0
5,000
10,000
15,000
20,00025,000
30,000
35,000
40,000
45,000
1991 1992 1993 1994 1995 1996 1997
Year
Nu
mb
er o
f E
mp
loye
es Small For-Hire Total
SF-H Full Tiime
SF-H Part Time
Owner Operator Total
OP Full Tiime
OP Part Time
Grand Total

70

71
Table 2.14 shows employment as well as wages and salaries for Manitoba and Canada with special reference to Manitoba trucking.
During the period 1986 to 1999 employment in Manitoba grew by 44,000, from 499,000 to 543,000; an increase of 8.8 percent. National employment grew 2.6 million from 11.9 million to 14.5 million, or 21.3 percent for the same period. Since provincial growth in employment is lower than national growth, the Manitoban share of total Canadian employment shows a declining trend.
Table 2.14 Manitoba and Canada Employment (both sexes, 15 years and over; average for year)and Wages and Salaries
Employment For-Hire Trucking Wages and Salaries
YearManitoba
TotalCanada
Total%
Canada
Manitoba Emplo- yees*
% of all Manitoba
Emplo- yees
Manitoba Total Average
Canada Total Average
Manitoba Trucking ** Average
Units Thousands Millions$ Dollars Millions$ Dollars $1,000 Dollars
1986 499 11979 4.17 7336 1.93 10067 20173 247343 20648 215065 293161987 506 12321 4.11 7874 1.98 10645 21037 268756 21813 241184 306301988 508 12710 4.00 7961 1.96 11263 22172 294840 23198 241268 303061989 514 12986 3.96 5425 1.34 11768 22894 318716 24543 165451 304981990 515 13084 3.94 5039 1.23 12399 24076 333460 25486 142892 283571991 507 12851 3.95 4910 1.27 12698 25046 338525 26342 153654 312941992 502 12760 3.93 4754 1.23 13002 25900 343069 26886 151864 319441993 506 12857 3.94 5937 1.54 13185 26058 347236 27008 186768 314581994 509 13112 3.88 3508 0.89 13450 26424 355927 27145 N.A. N.A.1995 519 13357 3.89 3368 0.82 13947 26872 366391 27431 105175 312281996 519 13463 3.86 4457 1.07 14305 27563 375721 27908 148632 333481997 526 13774 3.82 N.A. N.A. 14940 28403 398038 28898 N.A. 369591998 536 14140 3.79 N.A. N.A. 15643 29184 419190 29646 N.A. N.A.1999 543 14531 3.74 N.A. N.A. 16255 29935 441378 30375 N.A. N.A.2000 NA NA NA N.A. N.A. 17468 NA 472863 NA N.A. N.A.
Note:* calculated from: Trucking in Canada, 53-222: 3.10; 3.11 (1994);
2.6 (1993); 2.6 (1992); 2.6 (1991); 2.6 (1990); 2.28 (1989); 2.18 (1988-1987); 2.17 (1986).
The 1994 trucking employee data is owner-operator only.** calculated from: Trucking in Canada, 53-222: 2.6 (1993); 2.6 (1992); 2.6 (1991); 2.6 (1990); 2.28 (1989);
2.18 (1988); 2.18 (1987); 2.17 (1986).Sources: Statistics Canada, CANSIM D28745 Manitoba Employees, D28598 Employees in Canada Statistics Canada: CANSIM D17046 Manitoba Wages and Salaries, D17023 Wages in Canada (2000,1999). Statistics Canada, CANSIM 986920 Manitoba Employees, D17239 Manitoba Wages and Salaries Statistics Canada: CANSIM D17023 Wages in Canada, L56868 Employees in Canada
Surface and Marine Transport, 50-002 Vol. 15 no.1 table 8,11(1996) Vol. 13 no.6 table 8(1995)

72
Figures 2.8 and 2.9 graphically presents employment and wages and salaries for Manitoba and Canada. Both charts depict the declining trend in Manitoba employment as a share of total Canadian employment as well as the declining trend in for-hire trucking employment as a share of total Manitoba employment.
Figure 2.8 Manitoba and Canada Employment
0
2,000
4,000
6,000
8,000
10,000
12,000
14,000
16,000
1986
1988
1990
1992
1994
1996
1998
Year
Thou
sand
s of
Em
ploy
ees
0
0.5
1
1.5
2
2.5
3
3.5
4
4.5
Per
cent
age Manitoba Total
Canada Total
MB Employment % of Canada
F-H Trucking Employment % of MB

73
From Figure 2.9 it appears that the average annual income in Manitoba compares very favourably with the national average. However, simple comparison of these figures would not take account of all relevant factors pertinent to the issue at hand and some caveats are in order. Most notably, average income does not equate to disposable income or growth in net worth. An explanation of the apparent contradiction in average annual disposable income and employment growth could possibly be found along these lines. It is noteworthy that the average annual income for Manitoba for-hire trucking is higher than the provincial annual average in years for which data is available.
Figure 2.9 Manitoba and Canada Employment and Wages and Salaries
0
5,000
10,000
15,000
20,000
25,000
30,000
35,000
40,000
1986
1987
1988
1989
1990
1991
1992
1993
1994
1995
1996
1997
1998
1999
Year
Wag
es (
$)
0
0.5
1
1.5
2
2.5
3
3.5
4
4.5
Per
cen
tag
e
Manitoba AverageCanada AverageMB Trucking AverageMB Employment % of CanadaF-H Trucking Employment % of MB

74
Figure 2.10 depicts total registered vehicles in Manitoba. It is evident that the bulk of vehicles are registered for non-commercial use. The decline in total registrations is ascribed to reductions in the non-commercial category (see Table 2.15 and Figure 2.11). In fact, commercial registered vehicles increased for the period under review (see Table 2.16 and Figure 2.12).
Figure 2.10 Manitoba Registered Vehicles
0
100,000
200,000300,000
400,000
500,000
600,000
700,000800,000
900,000
1,000,000
1986
1987
1988
1989
1990
1991
1992
1993
1994
1995
1996
1997
1998
1999
Year
Nu
mb
er o
f u
nit
s
Non-commercialVehicles
CommercialVehicles
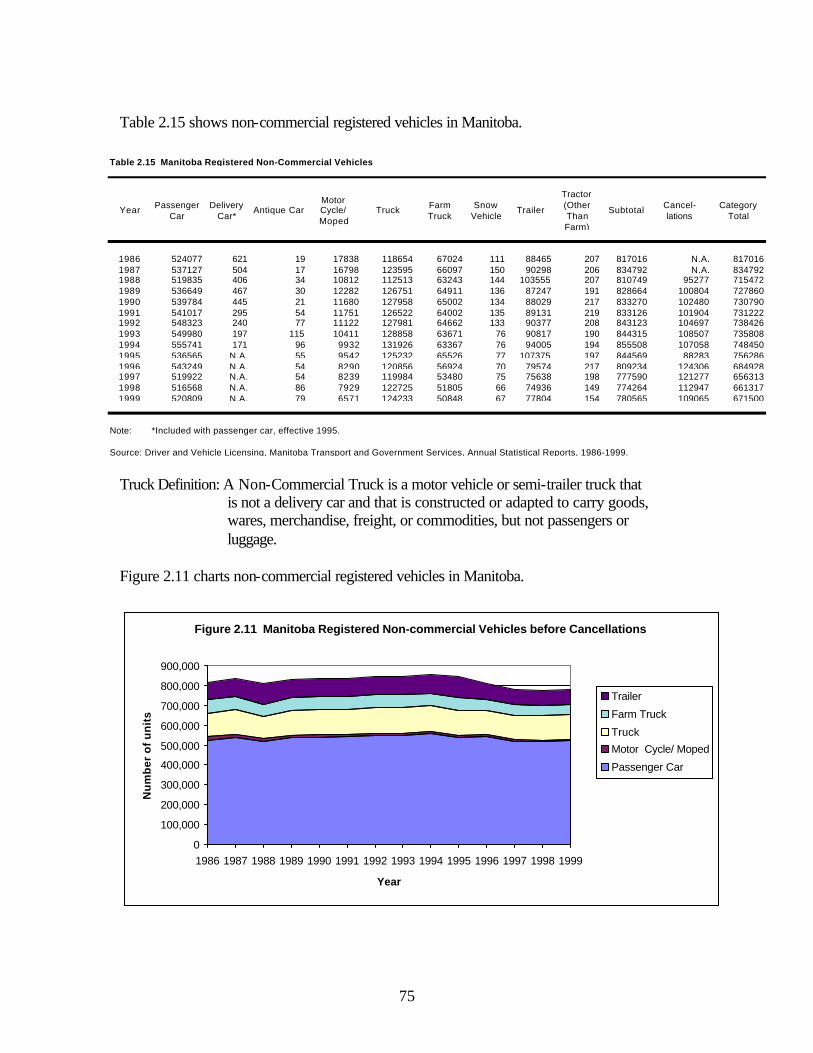
75
Table 2.15 shows non-commercial registered vehicles in Manitoba.
Truck Definition: A Non-Commercial Truck is a motor vehicle or semi-trailer truck that
is not a delivery car and that is constructed or adapted to carry goods, wares, merchandise, freight, or commodities, but not passengers or luggage.
Figure 2.11 charts non-commercial registered vehicles in Manitoba.
Table 2.15 Manitoba Registered Non-Commercial Vehicles
Year Passenger Car
Delivery Car*
Antique CarMotor Cycle/ Moped
Truck Farm Truck
Snow Vehicle
Trailer
Tractor (Other Than Farm)
Subtotal Cancel- lations
Category Total
1986 524077 621 19 17838 118654 67024 111 88465 207 817016 N.A. 8170161987 537127 504 17 16798 123595 66097 150 90298 206 834792 N.A. 8347921988 519835 406 34 10812 112513 63243 144 103555 207 810749 95277 7154721989 536649 467 30 12282 126751 64911 136 87247 191 828664 100804 7278601990 539784 445 21 11680 127958 65002 134 88029 217 833270 102480 7307901991 541017 295 54 11751 126522 64002 135 89131 219 833126 101904 7312221992 548323 240 77 11122 127981 64662 133 90377 208 843123 104697 7384261993 549980 197 115 10411 128858 63671 76 90817 190 844315 108507 7358081994 555741 171 96 9932 131926 63367 76 94005 194 855508 107058 7484501995 536565 N.A. 55 9542 125232 65526 77 107375 197 844569 88283 7562861996 543249 N.A. 54 8290 120856 56924 70 79574 217 809234 124306 6849281997 519922 N.A. 54 8239 119984 53480 75 75638 198 777590 121277 6563131998 516568 N.A. 86 7929 122725 51805 66 74936 149 774264 112947 6613171999 520809 N.A. 79 6571 124233 50848 67 77804 154 780565 109065 671500
Note: *Included with passenger car, effective 1995.
Source: Driver and Vehicle Licensing, Manitoba Transport and Government Services, Annual Statistical Reports, 1986-1999.
Figure 2.11 Manitoba Registered Non-commercial Vehicles before Cancellations
0
100,000
200,000
300,000
400,000
500,000
600,000
700,000
800,000
900,000
1986 1987 1988 1989 1990 1991 1992 1993 1994 1995 1996 1997 1998 1999
Year
Nu
mb
er o
f u
nit
s
Trailer
Farm Truck
TruckMotor Cycle/ Moped
Passenger Car

76
The largest share (6.7 %) of total non-commercial vehicles before cancellations (1999: 780,565) consists of passenger cars (1999: 520,809). In 1996 and 1997 total non-commercial vehicles declined due to significant reductions in passenger car, motor cycle/moped, truck, farm truck and trailer registrations. Furthermore, cancellations rose to 124,306 and 121,277 in 1996 and 1997 respectively, which exacerbated the decline in total registrations after cancellations. Table 2.16 shows commercial registered vehicles in Manitoba.
Truck Definition: A Commercial Truck is a truck (or trailer) used to transport the
registered owner's (or lessee's) own business goods:
a. Beyond a radius of 20 kilometres of the City of Winnipeg, where the registered owner's business address is in the City of Winnipeg,
b. Beyond a radius of a city, town or village other than the City of Winnipeg, where the registered owner's address is not in the City of Winnipeg.
Table 2.16 Manitoba Registered Commercial Vehicles
Year TruckPSV** Truck
U-drive Car/ Truck***
Dealer/Repairer
Taxi/ LiveryPSV** Bus
Commercial
Trailer ****
PSV** Trailer
SubtotalCancel- lations
Category Total
Grand Total
1986 22896 4237 2545 4257 865 171 3858 26 38855 N.A. 38855 8558711987 24099 5221 2389 4519 858 161 8110 28 45385 N.A. 45385 8801771988 23780 4321 2543 4655 825 160 16144 25 52453 4376 48077 7635491989 26096 4580 2438 4712 909 154 18695 26 57610 4160 53450 7813101990 25845 5017 2446 4850 832 166 21225 17 60398 5081 55317 7861071991 25809 4580 2533 4878 868 174 23607 14 62463 4405 58058 7892801992 27380 4897 2267 4856 841 159 25978 14 66392 4108 62284 8007101993 27857 5079 N.A. 5112 852 164 19207 11 58282 3498 54784 7905921994 28904 5253 N.A. 5853 840 161 24936 20 65967 3723 62244 8106941995 26424 5091 N.A. 6141 866 148 26920 18 65608 5189 60419 8167051996 23648 4984 N.A. 7026 963 153 30009 18 66801 6141 60660 7455881997 24188 5700 N.A. 7128 1058 146 32263 17 70500 6572 63928 7202411998 25035 6062 N.A. 13390 888 143 25637 20 71175 5471 65704 7270211999 25251 6403 N.A. 7425 901 196 29793 34 70003 7505 62498 733998
Note: ** Public service vehicle.*** U-drive car included with passenger car and U-drive truck included with truck, effective 1993.**** Includes semi-trailers.
Source: Driver and Vehicle Licensing, Manitoba Transport and Government Services, Annual Statistical Reports, 1986-1999.
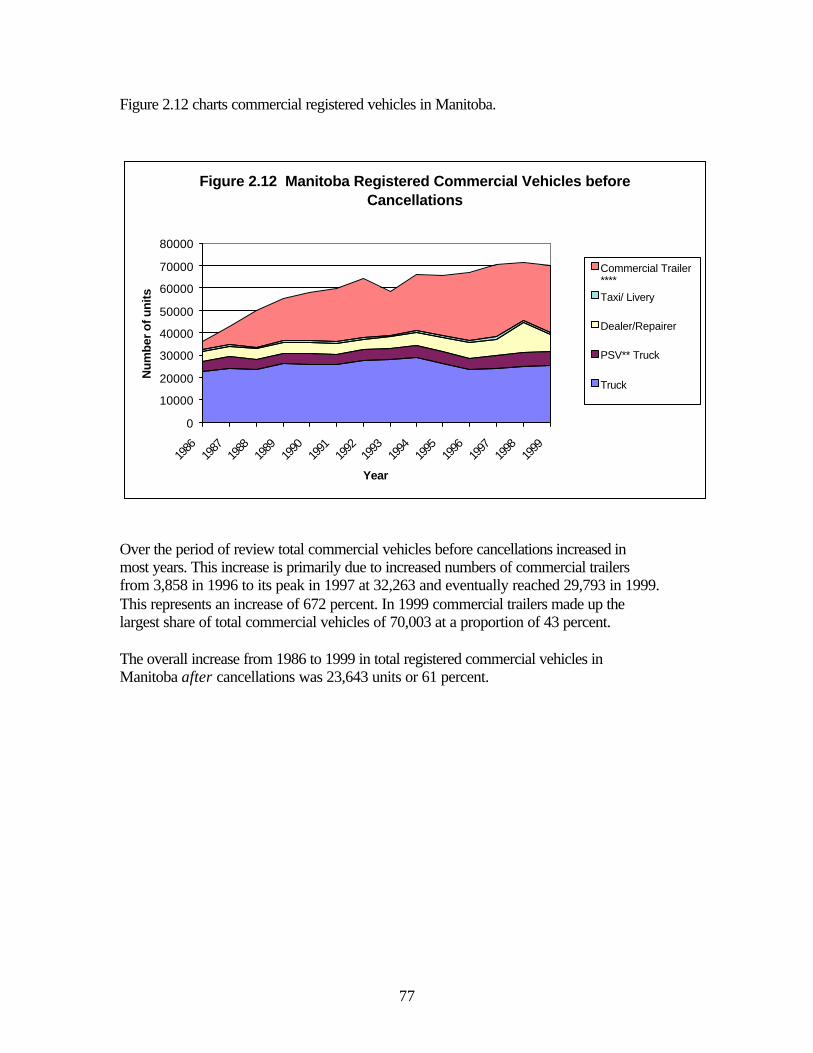
77
Figure 2.12 charts commercial registered vehicles in Manitoba.
Over the period of review total commercial vehicles before cancellations increased in most years. This increase is primarily due to increased numbers of commercial trailers from 3,858 in 1996 to its peak in 1997 at 32,263 and eventually reached 29,793 in 1999. This represents an increase of 672 percent. In 1999 commercial trailers made up the largest share of total commercial vehicles of 70,003 at a proportion of 43 percent. The overall increase from 1986 to 1999 in total registered commercial vehicles in Manitoba after cancellations was 23,643 units or 61 percent.
Figure 2.12 Manitoba Registered Commercial Vehicles before Cancellations
0
10000
20000
30000
40000
50000
60000
70000
80000
1986
1987
1988
1989
1990
1991
1992
1993
1994
1995
1996
1997
1998
1999
Year
Num
ber
of u
nits
Commercial Trailer ****Taxi/ Livery
Dealer/Repairer
PSV** Truck
Truck

78
Table 2.17 shows surface type on Manitoba provincial trunk highways.
Table 2.17 Manitoba Provincial Trunk Highways (1999): Kilometers by Surface Type, January 2001.
Route Concrete Bituminous Road Mix A.S.T. Gravel Total
1 1.0 463.7 464.71A 0.3 30.4 30.72 49.4 265.6 315.03 6.3 321.9 68.2 396.4
3A 11.3 11.34 8.9 8.95 299.1 11.1 90.3 400.5
5A 6.6 6.66 720.7 21.7 742.47 20.4 84.1 104.58 27.2 116.1 19.5 162.89 3.9 80.9 84.8
9A 2.9 4.8 7.710 676.8 1.9 44.6 723.3
10A 12.1 12.111 141.1 5.8 146.912 6.1 228.8 4.5 19.7 259.113 50.4 50.414 50.3 50.315 11.0 36.5 28.4 75.916 259.6 259.6
16A 9.0 9.017 2.4 22.2 97.6 4.8 127.018 27.5 27.8 55.319 5.0 5.020 65.2 9.6 95.2 170.0
20A 5.1 5.121 70.8 105.4 176.222 0.8 20.1 20.923 0.6 137.7 128.0 266.324 7.9 72.7 80.625 28.2 28.226 1.0 63.4 64.427 2.9 2.929 0.5 0.530 10.8 11.1 21.9
Note: Bituminous refers to a 3 to 4 inch asphalt surface whereas A.S.T.refers to asphalt surface treatment at approximately 0.25 inch thickness.
Source: Manitoba Highways and Transportation; Traffic Engineering.

79
Table 2.17 Manitoba Provincial Trunk Highways (1999): Kilometers by Surface Type(Continued)
Route Concrete Bituminous Road Mix A.S.T. Gravel Total
31 11.6 11.1 22.732 22.7 22.734 0.5 123.8 124.339 56.3 107.9 164.241 9.2 10.1 51.4 70.742 7.8 44.7 52.544 88.9 30.1 119.045 98.6 7.6 106.249 1.6 1.650 71.9 51.7 123.652 1.3 33.8 35.157 1.6 1.659 12.8 136.9 40.1 189.860 152.2 152.267 18.6 11.6 14.8 45.068 57.3 13.0 138.6 208.975 45.0 46.8 91.877 41.5 41.583 252.6 1.1 78.9 332.689 10.0 10.0
100 39.9 39.9101 11.4 38.3 49.7110 3.1 7.4 10.5
Total 211.4 5,287.3 96.4 1,751.0 17.2 7,363.3
Note: Bituminous refers to a 3 to 4 inch asphalt surface whereas A.S.T.refers to asphalt surface treatment at approximately 0.25 inch thickness.
Source: Manitoba Highways and Transportation; Traffic Engineering.

80
Table 2.18 shows traffic volume on Manitoba provincial trunk highways.
Table 2.18 Manitoba Provincial Trunk Highways: Traffic Volume and Percentage of Truck Activity
PTH Route StationNr AADT % truck AADT % truck AADT % truck AADT % truck AADT % truck
Route 1Ontario border 74C 3309 13.9 3140 13.9 3600 13.9 3780 13.9 3980 13.9PTH 100 47C 22237 5.3 22480 5.3 22020 5.3 18620 5.3 19650 5.3PTH 41 25C 2175 29.9 2380 29.9 2790 29.9 3130 29.9 2950 29.9
Route 1APTH 26 368C 5120 8.7 5400 8.7 4250 8.7 N.A. N.A. 5230 4.2
Route 2PTH 3 1899C 1988 9.9 2050 9.9 N.A. N.A. N.A. N.A. N.A. N.A.PTH 18 281C 1116 8.8 1140 8.8 1400 8.8 N.A. N.A. 1420 8.8PTH 83 40C 705 10.8 720 10.8 750 10.8 770 10.8 800 10.8
Route 3PTH 100 648C 4570 9.6 4410 9.6 4640 9.6 4430 12.5 4110 13.7PTH 34 262C 1015 9.7 1000 9.7 840 9.7 N.A. N.A. 870 14.5PTH 83 327C 520 11.3 500 11.3 N.A. N.A 540 11.3 N.A. N.A.
Route 3ACrystal City 515C 350 7.8 310 7.8 260 7.8 N.A N.A 260 7.8
Route 4PTH 59 2498C N.A. N.A. 2500 7.4 1590 7.4 N.A. N.A 1990 7.4
Route 5PTH 3 292C 230 4.5 230 4.5 190 4.5 N.A N.A. 260 5.0PTH 16 390C 895 5.3 1040 5.3 N.A. N.A. 1170 5.3 N.A N.A.PTH 83 467C 1267 6.2 1250 6.2 1030 6.2 N.A. N.A. 1320 6.6
Note: For longer PTHs, endpoints and a median were chosen; otherwise, representative points were chosen.
AADT= annual average daily traffic which is an estimate of typical daily traffic for all days of the week over a one-year period.
PTH= provincial trunk highway.
PR= provincial roadway.
* Indicates a combined north/south or east/west count.
Source: Manitoba Highways and Government Services, Manitoba Highway Traffic Information System.
1989 1992 1995 19991998

81
Table 2.18 Manitoba Provincial Trunk Highways: Traffic Volume and Percentage of Truck Activity (Cont.)
PTH Route StationNr AADT % truck AADT % truck AADT % truck AADT % truck AADT % truck
Route 5APTH 5 2464C 2304 4.3 2330 4.3 N.A. N.A. 2310 4.3 N.A. N.A.
Route 6PR 236 1846C 2889 5.2 3560 5.2 N.A. N.A. 3480 5.2 N.A. N.A.PTH 60 1890C 400 14.2 450 14.2 490 14.2 N.A. N.A. 520 14.2Thompson 1886C 1620 N.A. 1820 N.A. 1950 N.A. N.A. N.A. 2490 N.A.
Route 7PR 221 2C 9902 10.4 10950 10.4 N.A. N.A. N.A. N.A. N.A. N.A.PTH 17 16C 1608 6 1590 6 1760 6 1790 6 1780 6.0PTH 68 192C 945 10.2 1100 10.2 N.A. N.A. 1290 11 N.A. N.A.
Route 8PTH 101 712C 13340 9.3 12400 9.3 N.A. N.A. 12170 9.3 N.A. N.A.PR 231 199C 1120 7.9 1500 7.9 N.A. N.A. 2020 7.9 N.A. N.A.Hecla Island 604C 460 N.A. 400 N.A. N.A. N.A. 570 N.A. N.A. N.A.
Route 9PTH 101 711C 14026 6 15220 6 13830 6 15270 6 13420 6.0PR 232 715C 1355 6.5 1800 6.5 N.A. N.A. 1750 6.5 N.A. N.A.Gimli 200C 1530 8 1900 8 N.A. N.A. 2430 8 N.A. N.A.
Route 9APTH 9 565C 8200 3.1 10000 3.1 10120 3.1 N.A. N.A. 9220 3.1
Route 10PR 341 1283C 500 9.5 700 9.5 660 9.5 N.A. N.A. 690 9.5PTH 10A 705C 1816 6.4 1780 6.4 2150 6.4 N.A. N.A. 2410 6.4Flin Flon 10A 2425C 1081 7 1090 70 910 7 N.A. N.A. 750 7.0Flin Flon 10 501C 2233 9 2290 9 2340 2.4 N.A. N.A. 2180 2.4
Note: For longer PTHs, endpoints and a median were chosen; otherwise, representative points were chosen.
AADT= annual average daily traffic which is an estimate of typical daily traffic for all days of the week over a one-year period.
PTH= provincial trunk highway.
PR= provincial roadway.
* Indicates a combined north/south or east/west count.
Source: Manitoba Highways and Government Services, Manitoba Highway Traffic Information System.
199919981989 1992 1995

82
Table 2.18 Manitoba Provincial Trunk Highways: Traffic Volume and Percentage of Truck Activity (Cont.)
PTH Route StationNr AADT % truck AADT % truck AADT % truck AADT % truck AADT % truck
Route 10APR 274 84C N.A. N.A. N.A. N.A. 620 7 690 7 700 7.0
Route 11PTH 1 147C 670 10.7 850 10.7 N.A. N.A. 790 9.9 N.A. N.A.PR 307 726C 1066 4.3 1270 4.3 1040 4.3 N.A. N.A. 1190 4.3PTH 59 119C 504 9.6 980 9.6 750 9.6 N.A. N.A. 880 9.6
Route 12U.S. Border 160C 520 12 650 12 N.A. N.A. 880 12 N.A. N.A.PTH 15 142C 785 8.1 1020 8.1 1140 8.1 N.A. N.A. 860 8.1PTH 59 123C 990 2.4 1150 2.4 1600 2.4 N.A. N.A. 710 2.4
Route 13PR 305 1835C 1989 9 2050 9 1800 9 N.A. N.A. 2500 9.0PTH 1 372C 1485 13.7 1820 13.7 N.A N.A. 1740 13.7 N.A N.A
Route 14PTH 75 716C 1281 18.8 1310 18.8 950 18.8 N.A. N.A. 1630 32.7PTH 3 243C 5825 5.9 5960 5.9 5790 5.9 N.A. N.A. 7920 5.9
Route 15PTH 11 2272C 345 4.3 500 4.3 800 4.3 N.A. N.A. 720 4.3PR 207 2446C 7575 4.1 10000 4.1 9230 4.1 9970 7.5 8980 7.5
Route 16PTH 1 46C 2871 12.6 2900 12.6 3070 12.6 3330 15 3420 15.0PTH 10 395C 1995 13.2 2300 13.2 N.A. N.A. 2120 13.2 N.A. N.A.Sask. border 80C N.A. N.A. 1100 19.1 1210 19.1 1590 15 1590 15.0
Route 16APTH 16 392C 190 6.6 2000 6.6 N.A. N.A. 1950 6.6 N.A. N.A.
Note: For longer PTHs, endpoints and a median were chosen; otherwise, representative points were chosen.
AADT= annual average daily traffic which is an estimate of typical daily traffic for all days of the week over a one-year period.
PTH= provincial trunk highway.
PR= provincial roadway.
* Indicates a combined north/south or east/west count.
Source: Manitoba Highways and Government Services, Manitoba Highway Traffic Information System.
1989 1992 1995 19991998

83
Table 2.18 Manitoba Provincial Trunk Highways: Traffic Volume and Percentage of Truck Activity (Cont.)
PTH Route StationNr AADT % truck AADT % truck AADT % truck AADT % truck AADT % truck
Route 17PTH 8 609C 390 6.5 450 6.5 N.A. N.A. 640 6.5 N.A. N.A.PR 231 186C 315 10 470 10 N.A. N.A. 540 10 N.A. N.A.PR 325 689C 640 7.5 740 7.5 N.A. N.A. 1110 7.5 N.A. N.A.
Route 18PR 341(Lena) 1264C 325 11.1 400 11.1 310 11.1 N.A. N.A. 300 11.1PTH 23 286C 760 7.2 900 7.2 770 7.2 N.A. N.A. 880 7.2PTH 2 282C 598 8.8 620 8.8 610 8.8 N.A. N.A. 730 8.8
Route 19PTH 5 446C 150 6.6 150 6.6 N.A. N.A. N.A. N.A. N.A. N.A.
Route 20Ochre River 458C 978 7 990 7 N.A. N.A. 1090 7 730 7.0PR 271 1978C 234 7.4 240 7.4 310 7.4 N.A. N.A. 380 7.4PTH 10 482C 234 7.1 240 7.1 290 7.1 N.A. N.A. 280 7.1
Route 20APTH 20 459C 2068 5.7 2100 5.7 N.A. N.A. N.A. N.A. 2080 5.7
Route 21PR 251 1318C 150 8 200 8 N.A. N.A. 180 8 N.A N.A.PTH 1 351C 460 9.2 430 7.2 610 7.2 N.A. N.A. 730 7.2PTH 16 403C 575 11.2 550 11.2 580 8 N.A. N.A. 750 8.4
Route 22PTH 23 691C 270 9.1 270 9.1 270 9.1 310 9.1 N.A. N.A.PTH 2 540C 466 9 470 9 N.A. N.A. 600 9 410 9.0
Route 23PTH 59 167C 775 14.8 820 14.8 N.A. N.A. 1340 14.8 N.A. N.A.PTH 34 268C 630 6.6 630 6.6 670 6.6 N.A. N.A. 930 10.1PTH 21 318C 305 10 250 10 N.A. N.A. 330 10 N.A. N.A.
Note: For longer PTHs, endpoints and a median were chosen; otherwise, representative points were chosen.
AADT= annual average daily traffic which is an estimate of typical daily traffic for all days of the week over a one-year period.
PTH= provincial trunk highway.
PR= provincial roadway.
* Indicates a combined north/south or east/west count.
Source: Manitoba Highways and Government Services, Manitoba Highway Traffic Information System.
199919981989 1992 1995

84
Table 2.18 Manitoba Provincial Trunk Highways: Traffic Volume and Percentage of Truck Activity (Cont.)
PTH Route StationNr AADT % truck AADT % truck AADT % truck AADT % truck AADT % truck
Route 24PTH 10 427C 612 4.7 640 4.7 620 4.7 N.A. N.A. 730 4.7PTH 21 423C 370 9.7 380 9.7 430 9.7 N.A. N.A. 400 9.7PTH 83 421C 497 6 450 6 400 6 N.A. N.A. 480 5.0
Route 25PTH 10 431C 335 15.7 330 15.7 360 15.7 N.A. N.A. 300 15.7Rivers 432C 637 8 650 8 610 8 N.A. N.A. 770 8.0
Route 26PTH 1 376C 1240 12.7 1700 12.7 1600 12.7 N.A. N.A. 1600 10.0Poplar Point 524C 425 12 500 12 N.A. N.A. 370 12 N.A. N.A.Highbluff Access 370C 1190 7.2 1100 7.2 950 7.2 N.A. N.A. 990 5.3
Route 27PTH 9 210C 1790 4.7 2100 4.7 N.A. N.A. 2300 4.7 N.A. N.A.
Route 30PR 243 237C 1180 11 1230 11 1330 11 N.A. N.A. 1180 11.0PTH 14 239C 2053 9.1 2050 9.1 1680 9.1 N.A. N.A. 1960 9.1
Route 31PTH 3 258C 307 10 300 10 290 10 N.A. N.A. 380 10.0PR 201 1901C 141 11 150 11 N.A. N.A. N.A. N.A. N.A. N.A.
Route 32PR 521 1832C 364 11.6 400 11.6 350 11.6 N.A. N.A. 470 11.6PTH 14 241C 2286 11 2580 11 3210 11 N.A. N.A. 3480 12.3
Note: For longer PTHs, endpoints and a median were chosen; otherwise, representative points were chosen.
AADT= annual average daily traffic which is an estimate of typical daily traffic for all days of the week over a one-year period.
PTH= provincial trunk highway.
PR= provincial roadway.
* Indicates a combined north/south or east/west count.
Source: Manitoba Highways and Government Services, Manitoba Highway Traffic Information System.
19981989 1992 1995 1999

85
Table 2.18 Manitoba Provincial Trunk Highways: Traffic Volume and Percentage of Truck Activity (Cont.)
PTH Route StationNr AADT % truck AADT % truck AADT % truck AADT % truck AADT % truck
Route 34PTH 3 264C 415 9.7 410 9.7 330 9.7 N.A. N.A. 360 13.2PTH 2 277C 498 10.1 510 10.1 280 5.5 N.A. N.A. 340 9.8PTH 16 384C 645 6.4 750 6.4 N.A. N.A. 890 8.7 N.A. N.A.
Route 39PTH 6 2142C 201 10.6 200 10.6 210 10.6 N.A. N.A. 240 10.6PR 392 637C 280 10.4 290 10.4 330 10.4 N.A. N.A. 290 10.4PTH 10 636C 369 14.2 370 19.5 80 19.5 N.A. N.A. 310 19.5
Route 41PTH 1 339C 174 9.7 180 9.7 N.A. N.A. 320 9.7 200 9.7PR 545 412C 270 10 210 10 220 10 N.A. N.A. 250 10.0PTH 16 414C 290 5.9 270 5.9 320 5.9 N.A. N.A. 360 9.1
Route 42PTH 16 2078C 365 6.9 480 6.9 410 6.9 N.A. N.A. 580 9.5PTH 41 1877C 345 11.1 400 11.1 330 11.1 N.A. N.A. 370 11.1
Route 44PTH 1 560C 635 5.6 600 5.6 N.A. N.A. 1340 5.6 N.A. N.A.PTH 11 114C 1365 7 1500 7 1260 7 N.A. N.A. 1540 7.0PTH 9 507C 4425 2.2 5030 2.2 5520 2.2 N.A. N.A. 5240 2.2
Route 45PTH 10 438C 670 6.4 790 6.4 N.A. N.A. 620 6.4 N.A. N.A.PTH 21 404C 315 10 310 10 310 10 N.A. N.A. 440 10.0PTH 16 418C 1015 5 1050 5 1010 5 N.A. N.A. 1140 6.9
Route 49PTH 83 494C 431 7.8 440 7.8 420 7.8 N.A. N.A. 460 7.8
Note: For longer PTHs, endpoints and a median were chosen; otherwise, representative points were chosen.
AADT= annual average daily traffic which is an estimate of typical daily traffic for all days of the week over a one-year period.
PTH= provincial trunk highway.
PR= provincial roadway.
* Indicates a combined north/south or east/west count.
Source: Manitoba Highways and Government Services, Manitoba Highway Traffic Information System.
1989 1992 1995 19991998

86
Table 2.18 Manitoba Provincial Trunk Highways: Traffic Volume and Percentage of Truck Activity (Cont.)
PTH Route StationNr AADT % truck AADT % truck AADT % truck AADT % truck AADT % truck
Route 50PTH 16 380C 565 7.9 640 7.9 860 7.9 860 7.9 N.A. N.A.PR 278 452C 290 6.2 310 6.2 N.A. N.A. 400 6.2 N.A. N.A.PR 361 449C 481 6.3 470 6.3 N.A. N.A. 400 6.3 N.A. N.A.
Route 52PR 302 2093C 1000 9 1300 9 N.A. N.A. 1950 9 N.A. N.A.PTH 59 169C 1725 9 1760 9 N.A. N.A. 2380 9 N.A. N.A.
Route 57PTH 83 706C 250 10 260 10 280 10 N.A. N.A. 330 10.0
Route 59U.S. Border 162C 340 18.5 410 18.5 N.A. N.A. 360 18.5 N.A. N.A.PTH 101 662C 18600 9.2 17100 9.2 19250 9.2 19770 4.2 21324 4.2PR 504 120C 1004 3.9 1090 3.9 1620 3.9 N.A. N.A. 780 3.0
Route 60PTH 6 1892C 215 11.6 240 11.6 460 11.6 250 11.6 N.A. N.A.PTH 10 2279C 238 13.4 250 13.4 250 13.4 N.A. N.A. 280 13.4
Route 67PTH 9 2062C 1100 5.7 1580 5.7 1520 5.7 N.A. N.A. 1800 5.7PTH 7 177C 925 11.2 970 11.9 N.A. N.A. 2630 12.9 N.A. N.A.PTH 6 212C 680 10 1060 10 N.A. N.A. 1160 6 N.A. N.A.
Route 68PTH 8 194C 635 4.3 650 4.3 N.A. N.A. 750 4.3 N.A. N.A.PTH 6 219C 380 11.8 530 11.8 N.A. N.A. 310 11.8 N.A. N.A.PTH 5 455C 994 8.1 1080 8.1 N.A. N.A. 1130 8.1 N.A. N.A.
Note: For longer PTHs, endpoints and a median were chosen; otherwise, representative points were chosen.
AADT= annual average daily traffic which is an estimate of typical daily traffic for all days of the week over a one-year period.
PTH= provincial trunk highway.
PR= provincial roadway.
* Indicates a combined north/south or east/west count.
Source: Manitoba Highways and Government Services, Manitoba Highway Traffic Information System.
1989 1992 1995 19991998

87
The percentage of truck traffic is not always available for the specific year being reported. Consequently, truck traffic on these routes for the most recent available year is reported as at the time of data collection. Only if no estimate is available for truck traffic in any year of a specific route is data being reported as ‘not available’. This is done to simplify reading of data in Table 2.18 for cursory examination. Hence, the truck traffic percentage for any route and year should be considered with caution and verified from the original source for the actual year of occurrence before final conclusions are based thereupon. Below follows some possible inferences on highway truck volumes from data in Table 2.18 under the assumptions discussed above. The highest share of truck traffic as a percentage of total traffic is provincial trunk highway 75 station number 716C (route 14)
Table 2.18 Manitoba Provincial Trunk Highways: Traffic Volume and Percentage of Truck Activity (Cont.)
PTH Route StationNr AADT % truck AADT % truck AADT % truck AADT % truck AADT % truck
Route 75PR 243 727C 1915 21.6 2020 21.6 1970 21.6 N.A. N.A. 2800 21.6PTH 23 227C 3535 14 4000 14 4360 14 N.A. N.A. 5410 14.0PR 247 9C 6129 7.4 6760 7.4 6880 7.4 7430 7.4 7730 7.4
Route 77PTH 10 679C 255 6.4 230 6.4 260 6.4 N.A. N.A. 300 6.4Sask. Border 634C 178 10 160 10 160 10 N.A. N.A. 150 10.0
Route 83U.S. Border 543C 165 11 170 11 N.A. N.A. 200 11 N.A. N.A.PTH 16 408C 445 10.7 410 10.7 440 10.7 N.A. N.A. 560 12.0Swan River 720C 1691 8 1700 8 1470 8 N.A. N.A. 2030 8.0
Route 89U.S. Border 157C 80 85 110 10.2 N.A. N.A. 60 10.2 N.A. N.A.PTH 12 508C 495 3 440 5.4 N.A. N.A. 350 5.4 N.A. N.A.
Route 100PTH 59 732C 7682 14.5 8600 14.5 N.A. N.A. 11890 14.5 N.A. N.A.PTH 75 670C 9162 13.3 # 10000 13.1 N.A. N.A. 12390 2.7 N.A. N.A.PTH 1 47C 22237 5.3 22480 5.3 22020 5.3 18620 5.3 19650 5.3
Route 101PTH 15 1850C 2152 10.2 2550 10.2 13060 10.2 5170 19.8 5620 19.8PTH 9 676C 14698 12.5 13000 12.5 N.A. N.A. 16290 12.5 N.A. N.A.PTH 1 678C 9756 12 10000 12 N.A. N.A. 12890 12 N.A. N.A.
Note: For longer PTHs, endpoints and a median were chosen; otherwise, representative points were chosen.
AADT= annual average daily traffic which is an estimate of typical daily traffic for all days of the week over a one-year period.
PTH= provincial trunk highway.
PR= provincial roadway.
* Indicates a combined north/south or east/west count.
Source: Manitoba Highways and Government Services, Manitoba Highway Traffic Information System.
1989 1992 1995 19991998

88
where 33 percent trucks were counted. At an annual average daily traffic (AADT) of 1,630 in 1999 this suggests 533 trucks on average per day. Provincial trunk highway 41 station number 25C (route 1) counted 30 percent trucks at an AADT of 2,950, which suggests 882 trucks on average per day. However, some routes have lower percentages of truck traffic due to the diluting effect of non-truck traffic, but higher absolute truck volumes. Provincial trunk highway 100 station number 47C (route 1) counted 19,650 AADT in 1999. A truck percentage of 5.3 percent suggests 1,041 trucks on average per day. Also, provincial trunk highway 15 station number 1850C (route 101) counted 5,620 AADT in 1999. A truck percentage of 19.8 percent suggests 1,113 trucks on average per day.

88
3. RAILWAY TRANSPORTATION This chapter reports on the statistics for rail transportation. Information in the related chapter on surface movement of commodities by rail overlaps with this chapter and they should be read in conjunction with each other. Table 3.1 shows revenue and tonnes for movement of goods from Manitoba to various Canadian destinations with a small mention of the U.S.
Revenue data are available for the period 1987 to 1990. Please note the aggregation of data for some provinces. Shipments East to Ontario are larger in tonnage than to the U.S. The main exports to the Ontario market are inputs for manufacturing, especially vehicle parts, and agricultural goods destined for Europe and South America.
Table 3.1 Railway Freight: Revenue and Tonnes for Movement of Goods From Manitoba to Province or Territory of Destination **
Destination NFLD PEI* NS NB QUE ONT MAN SASK ALTA# BC NWTUS by Rail
TOTAL
Revenue ($'000)
1987 434 414 5953 4771 27676 152836 20382 12354 10629 55692 9 25328 3164781988 318 466 4793 4080 25503 116417 15252 11426 9658 54949 12 29408 2722821989 373 4244 3035 22508 87896 13540 9370 9060 49404 18 29139 2285871990 131 4072 3284 23004 111487 13971 7711 8276 72989 48 26016 270989
Tonnes ('000)
1987 3 6 70 50 484 5925 934 572 198 1154 -- 452 98481988 -- 6 60 56 459 4519 762 469 188 1179 -- 532 82301989 -- 5 46 36 343 3272 619 385 180 999 -- 527 64121990 -- 2 40 43 407 4322 752 351 168 1546 -- 534 81651991 -- -- 31 50 522 5854 636 267 168 1428 -- 568 95241992 80 588 4510 435 205 158 1892 -- 709 85771993 102 606 3238 495 208 226 2660 -- 801 83361994 98 601 4148 457 166 169 1326 -- 931 78961995 81 452 3587 405 163 172 1662 -- 1199 77211996 61 506 3280 485 189 150 1331 -- 1840 78421997 69 580 3864 391 224 287 1808 -- 2225 94471998 56 541 3345 120 224 243 965 -- 2380 7874
Note: Revenue data is not available after 1990.* Represents the Atlantic Region (NFLD, PEI, NS, NB) as of 1992.** Class 1 Railways--CN/CP only (does not include Burlington Northern Ltd. traffic)# Includes NWT tonnage.
Sources: Statistics Canada, Rail in Canada, 52-216: Table 6.3 (1993-1998).

89
Figure 3.1 illustrates the movement of goods from Manitoba to the various destinations. Due to the aggregation of provinces, comparable data amongst the aggregated provinces is available only as of 1992 and is presented as such. Total goods shipped show a declining trend from 9.8 million tonnes in 1987 to 7.9 million tonnes in 1998. Ontario remains the major destination, but has decreased in absolute values. Movement of goods to the US has significantly increased to 2.4 million tonnes in 1998, up from 452,000 tonnes in 1987. This was the only destination that showed an annual increase in 1998. However, the increase was less than the total reduction to all other destinations and consequently the total goods moved declined in 1998.
For #and *: Refer to Table 3.1
Figure 3.1 Railway Freight: Movement of Goods from Manitoba to Destination
0
1000
2000
3000
4000
5000
6000
7000
8000
9000
10000
1992 1993 1994 1995 1996 1997 1998
Year
To
nn
es (
'000
)
US by RailBCALTA#SASKMANONTQUE
PEI*

90
Table 3.2 shows tonnes from revenue freight with initial or final haul in Manitoba. Several types of data are no longer collected due to budget restraints at the federal level and reduced cooperation by the railway companies.
Table 3.3 shows intermodal tonnage in Canada from 1988 until 1993.
Table 3.2 Revenue Freight: Receiving Initial or Final Haul in Manitoba, 1986-1990*
Carload Traffic 1986 1987 1988 1989 1990
Railway Cars Loaded No. 159164 156377 133866 110993 129399Loaded in Manitoba Tonnes 10030446 9990023 8455368 6728348 8463181Received from US to Cdn points " 821585 971450 1158323 1212809 1199182Received from US to US points " 27545 15745 23882 48892 56423Total Carried (Initial Haul) " 10879576 10977218 9637573 7991049 9718786Unloaded in Manitoba " 5187362 5075573 4820712 4362331 4326492Delivered to US Rail " 9388401 9949192 10398782 10147304 10283079
* Class 1 and class 2 railways.
Source: Statistics Canada, Rail in Canada, 52-216: 5.5 (1991 to 1995)
Table 3.3 Canada Intermodal Tonnage, CN and CP, 1988-1993
Year COFC TOFC TOTAL % COFC
CN North America
1988 4475 2930 7405 601989 4763 2841 7604 631990 3423 2467 5890 581991 3437 2313 5750 601992 3579 2130 5709 631993 4572 2118 6690 68
CP Rail System
1988 5817 1189 7006 831989 5531 1333 6864 811990 5603 1242 6845 821991 5122 1249 6371 801992 4949 1255 6204 801993 5139 1256 6395 80
COFC: Container On Flat CarTOFC: Trailer On Flat CarSources: Statistics Canada, Rail in Canada (52-216).

91
Table 3.4 shows marine container traffic for Manitoba for both rail and truck. These quantities are expected to grow as several agencies have forecast increased use of both domestic and marine containers.
Table 3.4 Manitoba Marine Container Traffic (in TEUs); (Rail and Truck Combined)
Year 1992 1993 1994 1995 1996 1997* 1998* 1999* 2000*
Provincial Through Put 22495 23621 25110 27858 32043 35450 41155 60125 77850
Import/ExportTotal
* ForecastNotes: Rail and truck are combined in order to provide confidentiality to carriers.
Sources: University of Manitoba, Manitoba International Overseas Shipper Survey (MIOSS)

92
Table 3.5 and Figure 3.2 depict the fuel taxes for three modes of transport and two provinces for 1999.
In Manitoba, the provincial fuel taxation on diesel was lower for rail (6.3 cents per liter) than for road (10.9 cents per liter) by a 4.6 cents per liter differential. The differential for Ontario was 9.8 cents per liter. In both provinces road gasoline had the highest taxes of all the fuels (Manitoba: 11.5 cents per liter; Ontario: 14.7 cents per liter). Federal tax rates exceeded provincial tax rates in the aviation mode.
Table 3.5 Fuel Taxes by Province and Mode of Transportation (1999)
Mode Fuel Type Manitoba Ontario Federal
cents per litreRoad
Diesel 10.9 14.3 4.0Gasoline 11.5 14.7 10.0Propane 5.7 4.3 0Natural Gas 2.5 0 0
Rail Diesel 6.3 4.5 4.0
AviationGasoline 3.2 2.7 11.0Turbo Fuel 3.2 2.7 4.0
Source: Taxation Manitoba, Revenue Canada, Ontario Finance Dept.
Figure 3.2 Fuel Taxes by Province and Mode of Transportation (1999)
02468
10121416
RoadD
iesel
RoadG
asoline
RoadP
ropan
e
RoadN
atural
Gas
RailDies
el
Aviation
Gasolin
e
Aviation
Turbo
Fuel
Fuel Type
cent
s/lit
re MBOntFed

93
Table 3.6 shows the fuel consumption consumed in Manitoba by Class 1 railways.
Figure 3.3 indicates the fuel consumed in Manitoba by Class 1 railways. Total consumption declined form 172 million liters in 1989 to 165 million liters in 1998. It is expected that 1999 values will eventually show that fuel consumption decreased even more quickly as both CN and CP have instituted drastic fuel saving measures as the price of diesel increased during 1999 and 2000.
Table 3.6 Fuel Consumption: Diesel Oil Consumed in Manitoba by Class I Railways
Mainline PassengerFreight Transport Rail Transport
Year Canadian Canadian VIA Total*National Pacif ic Rai l
'000 litres
1989 92999 69405 9356 1717641990 91233 68178 5792 1652031991 97233 70503 5151 1728871992 92853 65551 5090 1634941993 94230 63473 4987 1625901994 96426 71282 4813 1725221995 92633 67070 4339 1640421996 71833 61732 4408 1379731997 104247 67750 4722 1788581998 94432 61408 4310 164899
* Includes values for Short Haul Freight Rail Transport and Support Activit ies to Class 1 Rail Transport.
Sources: Statistics Canada, Rail in Canada, 52-216: Table 3.4 (1998 to 1991); 3.5 (1990-1989)

94
Table 3.7 shows hourly employment in Manitoba in rail transport related services to 1996 and total employment of all modes thereafter.
T a b l e 3 . 7 M a n i t o b a R a i l w a y E m p l o y m e n t : R a i l T r a n s p o r t a n d R e l a t e d S e r v i c e s
Y e a r H o u r l y T o t a l *
1 9 8 6 8 4 7 3 1 0 8 2 31 9 8 7 5 1 7 2 9 5 4 91 9 8 8 5 2 7 3 9 4 0 01 9 8 9 5 2 5 7 9 1 8 71 9 9 0 4 9 2 0 8 5 7 11 9 9 1 4 6 6 0 8 1 4 61 9 9 2 4 4 0 9 7 7 9 61 9 9 3 4 3 4 3 7 5 2 81 9 9 4 4 2 6 6 7 1 7 31 9 9 5 x x1 9 9 6 3 5 9 6 6 5 2 11 9 9 7 3 4 0 0 2 3 9 0 01 9 9 8 3 5 0 0 2 4 0 0 0
N o t e : x = c o n f i d e n t i a l ; r a i l w a y s o n s t r i k e i n 1 9 9 5 .* A s o f 1 9 9 7 r e f e r s t o S I C 4 5 1 - 4 5 9 : T r a n s p o r t a t i o n i n c l u s i v e o f a l l m o d e s .S o u r c e s : S t a t i s t i c s C a n a d a , S u r v e y o f E m p l o y m e n t , P a y r o l l s a n d H o u r s ( S E P H ) ( 7 2 - 0 0 2 ) : T a b l e 4 ( S I C 1 9 8 0 : 4 5 3 )
Figure 3.3 Fuel Consumption: Diesel Oil Consumed in Manitoba by Class I Railways
020,000
40,00060,00080,000
100,000120,000
140,000160,000180,000200,000
1989 1990 1991 1992 1993 1994 1995 1996 1997 1998
Year
Lit
res
('00
0)
VIA RailCanadian PacificCanadian National

95
The increased total number of employees as of 1997 is due to the inclusion of all modes with Standard Industrial Code (SIC) 451-459 and is indicated by the arrows in Figure 3.4.
Figure 3.4 Manitoba Railway Employment: Rail Transport and Related Services
0
5000
10000
15000
20000
25000
30000
1986 1987 1988 1989 1990 1991 1992 1993 1994 1995 1996 1997 1998
Year
Em
plo
yees
Hourly
Total*
SIC451-459

95
4. URBAN AND INTERCITY TRANSPORTATION This chapter analyzes statistics on urban bus, taxicab, school bus and intercity bus transportation in Manitoba. Data on public transit in the cities of Winnipeg and Brandon is presented. The taxicab industry pertains to the city of Winnipeg. The section on intercity bus transportation is also relevant to the chapter on highway transportation and should be read along with it. 4.1 URBAN TRANSPORTATION 4.1.1 Public Transportation Table 4.1 shows operating data for Winnipeg Transit System. Revenue vehicle kilometres increased from 25.7 million kilometres in 1986 to a peak of 26.4 million in 1987 and 1988. In 1999 22.2 million revenue vehicle kilometres were traveled, down 10.2 percent from the 24.7 million revenue vehicle kilometres of 1998. Regular service passenger trips have declined significantly over the period under review from 61,366 in 1986 to 38,553 in 1999. Total operating cost in 1999 was $80.5 million. This represents a 1.0 percent increase over the $79.7 million of 1998 and a 26.4 percent increase over the period of review from $63.7 million in 1986. Total revenue in 1999 was $47.6 million, a 2.0 percent increase over the $46.7 million of 1998. The increase in total revenue for the period of review was 49 percent, up $15.6 million from the $32.0 million of 1986. Regular service passenger revenue increased $14.3 million or 47 percent from $30.5 million in 1986 to $44.7 million 1999.

96
Table 4.1 Winnipeg Transit System: Operating Data (Thousand)
Year 1986 1987 1988 1989 1990 1991 1992 1993 1994 1995 1996 1997 1998 1999
Rev. Vehicle Kms. 25751 26413 26413 26275 26180 26056 25970 25309 24820 24843 24539 24374 24738 22215Total Vehicle Kms. 26057 26413 26413 26537 26524 26377 25970 25309 25253 26045 24901 24469 24826 25374Rev. Vehicle Hrs. 1370 1382 1383 1399 1387 1372 1366 1323 1297 1296 1286 1278 1290 1200Total Vehicle Hrs. n/a n/a n/a 1414 1407 1391 1366 1323 1297 1296 1286 1278 1290 1307
Operator Paid Hrs. n/a n/a n/a n/a n/a n/a 1806 1764 1940 1845 1840 1752 1711 1766Mechanic Paid Hrs. n/a n/a n/a n/a n/a n/a 475 133 116 112 114 112 131 132Total Paid Empl. Hrs. 2669 2719 2725 2728 2597 2573 2672 2637 2740 2653 2646 2545 2523 2498
Regular Service 61366 60525 55310 54943 53580 50860 47531 44366 41623 39908 39492 40031 39226 38553Passenger Trips
Expenditures:Transp. Operations n/a n/a n/a n/a 36812 30941 34347 39968 39746 40916 40810 40941 41776 41483Vehicle Fuel/Energy n/a n/a n/a n/a 6149 6091 5898 5520 5325 5750 6310 6405 5244 5871Vehicle Maintenance n/a n/a n/a n/a 8837 9614 11533 13257 13638 13439 13888 14353 15029 14678Plant Maintenance n/a n/a n/a n/a 2567 2842 3776 3624 3492 3692 3537 3438 3885 3866General/Admin n/a n/a n/a n/a 20898 20169 15415 7353 6559 7188 7128 7481 6721 7510Tot. Dir. Oper. Exp. 60558 66106 67789 66147 69113 69658 70970 69722 68760 70985 71673 72618 72655 73408Total Oper. Costs 63689 69431 71493 69668 72679 73639 75062 74756 74395 77380 78378 79252 79685 80509
Regular Service 30465 31722 34051 34965 36604 38201 38186 38376 39319 37796 40512 42911 44032 44722Pass. Revenues
Total Oper. Rev. 31978 33465 35867 37451 38612 39558 39611 39861 40642 39162 41722 44114 45463 46044Total Revenues 31978 33465 35867 37451 38612 40246 40269 40022 41756 39972 42571 45224 46668 47624
Table 4.1 Winnipeg Transit System: Operating Data (Thousand) (Continued)
Year 1986 1987 1988 1989 1990 1991 1992 1993 1994 1995 1996 1997 1998 1999
Net Direct 28580 32641 31922 28696 30501 30099 31358 29861 28118 31823 29950 28504 27193 27365Operating Cost
Net Operating Cost 31711 35966 35626 32217 34066 33393 34793 34735 32639 37408 35806 34028 33017 32886Provincial Share 15329 17255 16385 16344 16216 19360 17450 15352 13966 13850 13761 14567 14166 14122Municipal Share 15329 17255 17414 13945 15904 12632 17343 18128 17587 22496 20945 24413 21511 21555
Net Capital Cost 6135 8781 7003 5352 7843 5768 6303 998 15472 1486 4960 14116 20574Provincial Share 2950 2904 3140 2514 2953 2192 2001 485 7081 18 15 2103 6905 9799Municipal Share 3186 5877 3864 2838 4890 3576 4303 513 8391 1468 1300 4750 8251
Note: All transit systems do not always report all data items. Statistical data has been rounded up to the nearest thousand."-" means nil or zero; "n/a" means not available.Source: Winnipeg Transit Department Canadian Urban Transit Association (CUTA) ; Canadian Transit Fact Book

97
Figure 4.1 indicates total operating data for Winnipeg Transit System. Note that as either total operating costs decline or total revenues increase, the shortfall of net operating cost declines concurrently.
These shortfalls in operating costs are supplemented from provincial and municipal sources. The provincial share has remained relatively constant (1986: $15.3 million; 1999: $14.1 million) whereas the municipal share rose 41 percent from 1986 ($15.3 million) to 1999 ($21.6 million). Similarly, net capital costs are supplemented from provincial and municipal sources. Sharp rises in net capital costs are observed in 1998 ($14.1 million) and 1999 ($20.6 million). In 1999 the provincial contribution was $9.8 million and the municipal share $8.3 million.
Figure 4.1 Winnipeg Transit System: Operating Data (Total)
0
10,000
20,000
30,000
40,000
50,000
60,000
70,000
80,000
90,000
1986
1987
1988
1989
1990
1991
1992
1993
1994
1995
1996
1997
1998
1999
Year
$'00
0
Total Oper. CostsTotal RevenuesNet Operating CostProvincial ShareMunicipal ShareNet Capital CostProvincial ShareMunicipal Share

98
Figure 4.2 indicates direct operating data and the ratio of direct to total operating costs. Again, net direct operating cost is a function of total direct operating expenses and total operating revenue. In 1993/94/95 significant reductions in the ratio of direct operating expenses to total operating cost were recorded. Since the total direct operating expenses increased over this time, the compliment of costs making up total operating costs must have increased at a faster rate. In 1999 the ratio of direct to total operating costs was 91.18 percent.
Figure 4.2 Winnipeg Transit System: Operating Data (Direct)
0
10,000
20,000
30,000
40,000
50,000
60,000
70,000
80,000
1986
1987
1988
1989
1990
1991
1992
1993
1994
1995
1996
1997
1998
1999
Year
$'00
0
88
89
90
91
92
93
94
95
96
Per
cen
tag
e
Tot. Dir. Oper. Exp.
Total Oper. Rev.
Net Direct Operating Cost
Dir.Op.Exp/Tot.Op.Cost(%)

99
Figure 4.3 shows direct operating data and the ratios of regular passenger fare revenue to total revenue as well as operating revenue to total revenue.
The fact that total operating revenue is a function of regular passenger fare revenue explains the resemblance in the curves of the two ratios and the high correlation it suggests. As of 1997 both ratios were declining while total operating revenue was increasing. This implies total revenue actually increased at a faster rate than operating revenue. Hence, non-operating revenue must have posted higher growth rates than operating revenue. In 1999 regular passenger fare revenue and operating revenue respectively were 94 percent and 97 percent of total revenue.
Figure 4.3 Winnipeg Transit System: Operating Data (Direct)
0
10,000
20,000
30,000
40,000
50,000
60,000
70,000
80,000
1986
1987
1988
1989
1990
1991
1992
1993
1994
1995
1996
1997
1998
1999
Year
$'00
0
93
94
95
96
97
98
99
100
101
Per
cent
age
Tot. Dir. Oper. Exp.
Total Oper. Rev.
Net Direct Operating Cost
Reg.Pass.Fare/Tot.Rev(%)
Op.Rev/Tot.Rev(%)

100
Table 4.2 shows Winnipeg Transit performance indicators. As indicated by the first row, Winnipeg Transit’s operating ratio improved over the entire period, moving from 53 percent to a high of 63 percent as of 1999. The operating cost per passenger ($/ passenger) also increased from 0.47 to 0.71, as their costs increased while their ridership decreased. Also during the fourteen-year time frame of the table, the average fare charged has increased over 130 percent, the perception of which may have been a contributing factor to the decline in transit ridership.
Table 4.2 Winnipeg Transit Performance Indicators
1986 1987 1988 1989 1990 1991 1992 1993 1994 1995 1996 1997 1998 1999
Financial performance Tot.Oper.Rev. / 53 51 53 56 56 57 55 57 59 55 58 61 63 63 Tot.Dir.Oper.Exp. (RC Ratio) %Municipal Share (Oper.) / Capita 26.16 29.44 27.45 23.01 25.99 20.43 28.27 29.55 28.67 35.38 32.88 39.38 34.81 34.77Net. Oper. Cost / Reg. Serv. Pass. 0.47 0.54 0.58 0.59 0.57 0.66 0.73 0.67 0.68 0.80 0.76 0.71 0.69 0.71
Average FareReg. Serv. Pass. Rev. / Reg. Serv.Pass 0.50 0.52 0.62 0.68 0.71 0.75 0.80 0.86 0.94 0.95 1.03 1.07 1.12 1.16
Cost EffectivenessTot. Dir. Oper. Exp. / Reg. Serv. Pass. 0.99 1.09 1.23 1.20 1.29 1.37 1.49 1.57 1.65 1.78 1.81 1.81 1.85 1.9
Cost EfficiencyTot. Dir. Oper. Exp. / Tot. Veh. Hrs. 44.21 47.82 49.01 49.80 49.82 50.76 51.94 52.68 52.99 54.77 55.75 56.83 56.33 56.18
Service UtilizationReg. Serv. Pass. / Capita 104.72 103.29 92.66 90.68 87.55 82.27 77.48 72.32 67.85 62.76 62.00 64.57 63.47 62.18Reg. Serv. Pass. / Rev. Veh. Hrs. 44.80 43.78 39.98 39.28 38.62 37.06 34.78 33.52 32.08 30.79 30.72 31.33 30.41 32.14
Amount of ServiceRev. Veh. Hrs. / Capita 2.34 2.36 2.32 2.31 2.27 2.22 2.23 2.16 2.11 2.04 2.02 2.06 2.09 1.93
Average SpeedRev. Veh. Kms. / Rev. Veh. Hrs. 18.80 19.11 19.10 18.87 18.87 18.99 19.01 19.12 19.13 19.17 19.09 19.08 19.18 18.52
Vehicle Utilization Rev. Veh. Kms. / Active Vehicle (x1000) n/a n/a n/a 46.9 46.8 46.5 46.9 46.0 47.2 48.7 46.5 45.7 46.4 47.5
Labour Productivity Rev. Veh. Hrs. / Oper. Paid Hrs. n/a n/a n/a n/a n/a n/a 0.76 0.75 0.67 0.70 0.70 0.73 0.75 0.68
Top Wage RatesOperators n/a n/a n/a 15.40 15.40 15.87 16.59 16.59 16.97 17.73 17.73 17.73 17.73 18.1Mechanics n/a n/a n/a 17.70 17.70 18.24 19.07 19.07 19.51 20.39 20.39 20.39 20.39 20.82
Reg. Serv. Pass. Rev. / Rev. Veh. Hr 22.24 22.95 24.62 24.99 26.38 27.84 27.95 29.00 30.30 29.16 31.50 33.58 34.13 37.28Reg. Serv. Pass. Rev. / Rev. Veh. Km 1.18 1.20 1.29 1.33 1.40 1.47 1.47 1.52 1.58 1.52 1.65 1.76 1.78 2.01Reg. Serv. Pass. Trips / Rev. Veh. Km 2.38 2.29 2.09 2.09 2.05 1.95 1.83 1.75 1.68 1.61 1.61 1.64 1.59 1.74
Note: All transit systems do not always report all data items; "n/a" means not available.Vehicle Utilization figures are in thousands of kilometers.Source: Winnipeg Transit Department Canadian Urban Transit Association (CUTA) ; Canadian Transit Fact Book

101
Figures 4.4 and 4.5 charts some selected indicators.
Financial operating performance is indicated by the Revenue/Cost (RC) ratio as defined in Table 4.2 and depicted in Figure 4.4. In 1999 operating revenue covered 63 percent of direct operating expenses. Hence, a 37 percent shortfall on operations existed. A general improving trend in this indicator is observed for the review period. In 1986 operating revenue covered only 53 percent of direct operating expenses. Service utilization is indicated by regular service passengers on both a per capita and per revenue vehicle hour basis. Both of these indicators declined for the greatest part of the review period, but show a change in trend as of 1996. Regular service passengers per capita were 104.7 in 1986 and declined to 62.8 in 1995. In 1999 this ratio was 62.2, only 0.9 percent lower than 1995 and 0.3 percent higher than 1996 (62.0). Regular service passengers per revenue vehicle hours were 44.8 in 1986 and declined to 30.8 in 1995. In 1999 this ratio was 32.1, up 4.4 percent over 1995. Higher increases or slower decreases in the ratio of regular service passengers per revenue vehicle hours as opposed to regular service passengers per capita suggests that revenue vehicle hours were more efficiently adjusted than in a simple direct relation with capita/population. This is indicated in Figure 4.5. Note that the ratio of revenue vehicle hours per capita is equivalent to the ratio of regular service passengers per capita and revenue vehicle hours per regular service passengers. The inverse is also charted for demonstrative purposes. In 1999 revenue vehicle hours per capita declined 7.7 percent to 1.9. Regular service passengers per capita declined only 2.0 percent to 62.2. This efficiency gain is reflected in the regular service passengers per revenue vehicle hour ratio increase of 5.7 percent to 32.1.
Figure 4.4 Winnipeg Transit Performance Indicators
0
20
40
60
80
100
120
1986
1987
1988
1989
1990
1991
1992
1993
1994
1995
1996
1997
1998
1999
Year
Per
cen
t
RC Ratio
Reg. Serv. Pass./ Capita
Reg. Serv. Pass./ Rev. Veh. Hrs.
Reg. Serv. Pass.Rev. / Rev. Veh.Hr

102
Regular service passenger revenue is in current dollar values. The upward trend in regular service passenger revenue per revenue vehicle hour and per revenue vehicle kilometre is thus expected. Regular service passenger trips per revenue vehicle kilometre show a declining trend for most of the review period, but increased by 9.4 percent in 1999.
Figure 4.5 Winnipeg Transit Performance Indicators
0
0.5
1
1.5
2
2.5
1986
1987
1988
1989
1990
1991
1992
1993
1994
1995
1996
1997
1998
1999
Year
Per
cen
t
Rev. Veh. Hrs. /Capita
Reg. Serv. Pass.Rev. / Rev. Veh. Km
Reg. Serv. Pass.Trips / Rev. Veh.KmCap./Rev.Veh.Hrs

103
Table 4.3 shows statistics for Winnipeg Handi-Transit. According to the available data, Handi-Transit use increased by 85 percent from 1990 to 1999, from 249,000 passengers to 461,000, while the net cost to do so only increased by approximately 62 percent, from $3.5 million to $5.7 million. This lowered the cost per ride from $14.23 to $12.42 over the decade.
T a b l e 4 . 3 W i n n i p e g H a n d i - T r a n s i t S t a t i s t i c s
B U S N E T C O S T
Y E A R R I D E R S H O U R S C O S T R E V E N U E N E T C O S T P E R R I D E
1 9 8 6 8 6 7 9 9 4 2 8 9 3 1 8 5 0 0 0 0 6 6 9 0 0 1 7 8 3 1 0 0 2 0 . 5 41 9 8 7 9 7 3 2 9 4 8 3 1 8 2 1 0 9 1 0 0 8 0 3 0 0 2 0 2 8 8 0 0 2 0 . 8 41 9 8 8 T r a n s i t 1 0 1 6 1 2 5 0 1 9 7 2 2 8 0 4 0 0 1 0 9 2 0 0 2 1 7 1 2 0 0 2 1 . 3 7
U n i c i t y ( J u n e 2 8 ) 1 9 5 6 2 2 0 8 5 0 0 2 1 0 0 0 1 8 7 5 0 0 9 . 5 8T o t a l 1 2 1 1 7 4 2 4 8 8 9 0 0 1 3 0 2 0 0 2 3 5 8 7 0 0 1 9 . 4 7
1 9 8 9 T r a n s i t 1 1 0 8 0 4 5 3 6 3 5 2 3 6 4 4 0 0 1 1 0 8 0 0 2 2 5 3 6 0 0 2 0 . 3 4U n i c i t y 9 5 6 9 0 9 0 5 4 0 0 9 5 6 9 0 8 0 9 7 1 0 8 . 4 6T o t a l 2 0 6 4 9 4 3 2 6 9 8 0 0 2 0 6 5 0 0 3 0 6 3 3 0 0 1 4 . 8 3
1 9 9 0 T r a n s i t 1 1 5 6 8 6 5 4 9 5 2 2 4 6 7 9 0 3 1 1 6 6 0 0 2 3 5 1 3 0 3 2 0 . 3 2U n i c i t y 1 3 3 3 1 4 1 3 5 6 1 9 0 1 6 4 3 0 0 1 1 9 1 8 9 0 8 . 9 4T o t a l 2 4 9 0 0 0 3 8 2 4 0 9 3 2 8 0 9 0 0 3 5 4 3 1 9 3 1 4 . 2 3
1 9 9 1 T r a n s i t 1 2 0 4 4 1 5 6 5 2 6 2 5 2 1 3 9 9 1 3 3 9 8 7 2 3 8 7 4 1 2 1 9 . 8 2B r o k e r a g e * 1 6 2 1 3 6 1 8 4 6 6 2 6 1 8 0 3 4 8 1 6 6 6 2 7 8 1 0 . 2 8T o t a l 2 8 2 5 7 7 4 3 6 8 0 2 5 3 1 4 3 3 5 4 0 5 3 6 9 0 1 4 . 3 5
1 9 9 2 T r a n s i t 1 1 9 8 6 1 5 6 4 6 6 2 6 4 1 2 7 8 2 0 9 9 2 9 2 4 3 1 3 4 9 2 0 . 2 8B r o k e r a g e 1 9 5 3 2 3 2 2 5 7 2 9 6 1 7 9 4 1 1 2 0 7 7 8 8 5 1 0 . 6 4T o t a l 3 1 5 1 8 4 4 8 9 8 5 7 4 3 8 9 3 4 0 4 5 0 9 2 3 4 1 4 . 3 1
1 9 9 3 T r a n s i t 1 1 9 0 9 1 5 5 5 0 2 2 6 8 0 9 8 4 1 1 4 4 3 3 2 5 3 6 5 5 1 2 1 . 3 0B r o k e r a g e 2 5 2 2 8 3 3 0 0 0 1 8 0 3 0 5 9 6 7 2 6 9 4 2 1 3 1 0 . 6 8T o t a l 3 7 1 3 7 4 5 6 8 1 1 6 4 4 5 0 4 0 0 5 2 3 0 7 6 4 1 4 . 0 8
1 9 9 4 T r a n s i t 1 1 3 0 5 0 5 5 7 2 4 2 6 7 0 9 3 2 1 5 2 0 9 8 2 5 1 8 8 3 4 2 2 . 2 8B r o k e r a g e 2 6 1 6 9 3 3 2 8 8 3 5 5 3 5 2 0 8 2 2 9 3 6 2 7 3 1 1 . 2 2T o t a l 3 7 4 7 4 3 5 9 5 9 2 8 7 5 0 4 1 8 0 5 4 5 5 1 0 7 1 4 . 5 6
1 9 9 5 T r a n s i t 1 1 0 9 7 7 5 5 7 1 7 2 5 5 7 4 7 7 1 4 2 1 0 1 2 4 1 5 3 7 7 2 1 . 7 6B r o k e r a g e 2 8 2 4 0 1 3 8 0 7 0 3 4 3 6 1 6 0 0 3 4 4 5 4 3 3 1 2 . 2 0T o t a l 3 9 3 3 7 8 6 3 6 4 5 1 1 5 0 3 7 0 1 5 8 6 0 8 1 0 1 4 . 9 0
1 9 9 6 T r a n s i t 7 1 1 2 6 3 6 1 0 5 1 7 0 7 2 4 8 9 6 5 5 5 1 6 1 0 6 9 3 2 2 . 6 5B r o k e r a g e * * 3 3 5 7 9 8 4 1 7 6 6 4 6 4 5 5 8 5 2 3 7 2 0 7 9 4 1 1 . 0 8T o t a l 4 0 6 9 2 4 5 8 8 3 8 9 4 5 5 2 4 0 7 5 3 3 1 4 8 7 1 3 . 1 0
1 9 9 7 T r a n s i t * * * 1 6 6 5 2 8 3 2 6 4 0 3 8 1 1 2 2 6 7 0 3 8 1 1 4 1 2 2 . 8 9B r o k e r a g e 3 9 3 5 2 2 5 3 5 2 0 9 8 5 3 5 7 3 4 4 8 1 6 3 6 4 1 2 . 2 4T o t a l 4 1 0 1 7 4 5 7 5 5 9 0 9 5 5 8 4 0 4 5 1 9 7 5 0 5 1 2 . 6 7
1 9 9 8 T r a n s i tB r o k e r a g e 4 4 6 5 3 6 6 1 3 9 1 9 0 6 4 7 9 4 7 5 4 9 1 2 4 3 1 2 . 3T o t a l 4 4 6 5 3 6 6 1 3 9 1 9 0 6 4 7 9 4 7 5 4 9 1 2 4 3 1 2 . 3
1 9 9 9 T r a n s i tB r o k e r a g e 4 6 1 2 4 4 6 4 3 4 4 7 0 7 0 4 7 4 9 5 7 2 9 7 2 1 1 2 . 4 2T o t a l 4 6 1 2 4 4 6 4 3 4 4 7 0 7 0 4 7 4 9 5 7 2 9 7 2 1 1 2 . 4 2
H a n d i - T r a n s i t s e r v i c e i s d e l i v e r e d t h r o u g h t w o m e a n s :1 ) d i r e c t l y b y W i n n i p e g T r a n s i t u s i n g a f l e e t o f s p e c i a l l y d e s i g n e d b u s e s , o r2 ) t h r o u g h a b r o k e r a g e c o n t r a c t i n v o l v i n g t h e u s e o f o r d i n a r y t a x i c a b s
* I n 1 9 9 1 , b r o k e r a g e a r r a n g e m e n t s c a r r i e d b y U n i c i t y T a x i & F i r s t C l a s s T r a n s p o r t a t i o n* * I n 1 9 9 6 , b r o k e r a g e a r r a n g e m e n t s c a r r i e d b y U n i c i t y , D u f f y ' s , H a n d i - H e l p e r & G u l l w i n g* * * N u m b e r s a r e f r o m J a n u a r y t o J u n e .
S o u r c e : W i n n i p e g T r a n s i t D e p a r t m e n t

104
Table 4.4 shows public transit metropolitan performance comparisons. According to this table Winnipeg Transit is operating at one of the highest levels in the country. Their Revenue/Cost ratio is second only to Toronto, their cost effectiveness is fairly ordinary, but they are the most cost efficient of all of the major urban transit services in Canada. Results from the RC ratio and cost efficiency propose that total direct operating expenses are laudable. In order to improve cost effectiveness the only parameter that could be addressed is regular service passenger trips.
Table 4.4 Public Transit Metropolitan Performance Comparisons
City Prov. 1986 1987 1988 1989 1990 1991 1992 1993 1994 1995 1996 1997 1998 1999
Revenue/Cost RatioVancouver BC n/a n/a n/a n/a 0.54 0.51 0.49 0.51 0.52 0.52 0.52 0.52 0.51 0.52Calgary AB n/a n/a n/a n/a 0.49 0.49 0.49 0.50 0.51 0.46 0.50 0.53 0.55 0.50Edmonton AB n/a n/a n/a n/a 0.44 0.44 0.43 0.43 0.39 0.44 0.45 0.49 0.49 0.50Winnipeg MB 0.53 0.51 0.53 0.56 0.56 0.57 0.55 0.57 0.59 0.55 0.58 0.61 0.63 0.63Toronto ON n/a n/a n/a n/a 0.68 0.70 0.63 0.65 0.65 0.68 0.75 0.79 0.81 0.84Ottawa ON n/a n/a n/a n/a 0.58 0.56 0.56 0.57 0.58 0.54 0.56 0.58 0.59 0.58Montreal PQ n/a n/a n/a n/a 0.40 0.46 0.45 0.46 0.47 0.48 0.46 0.51 0.52 0.53Quebec City PQ n/a n/a n/a n/a 0.41 0.40 0.42 0.44 0.44 0.41 0.43 0.43 0.45 0.47
Cost Effectiveness ($)Vancouver BC n/a n/a n/a n/a 1.75 1.87 1.95 2.60 2.54 2.53 2.58 2.64 2.72 2.80Calgary AB n/a n/a n/a n/a 1.73 2.03 1.91 1.93 1.83 1.77 1.69 1.64 1.62 1.86Edmonton AB n/a n/a n/a n/a 2.03 2.18 2.36 2.42 2.78 2.44 2.41 2.32 2.17 2.23Winnipeg MB 0.99 1.09 1.23 1.27 1.29 1.37 1.49 1.57 1.65 1.78 1.81 1.81 1.85 1.90Toronto ON n/a n/a n/a n/a 1.34 1.52 1.69 1.69 1.70 1.68 1.81 1.81 1.74 1.74Ottawa ON n/a n/a n/a n/a 1.58 1.72 1.85 1.91 1.94 2.09 2.08 1.95 1.98 1.99Montreal PQ n/a n/a n/a n/a 1.46 1.50 1.62 1.68 1.67 1.67 1.69 1.62 1.61 1.61Quebec City PQ n/a n/a n/a n/a 1.74 1.90 1.87 1.83 1.95 2.08 2.01 2.00 2.07 2.10
Cost Efficiency ($)Vancouver BC n/a n/a n/a n/a 64.01 70.54 73.33 76.68 78.07 80.66 81.30 84.17 83.63 85.59Calgary AB n/a n/a n/a n/a 72.46 82.74 76.37 78.89 74.08 72.66 72.55 73.69 73.15 81.08Edmonton AB n/a n/a n/a n/a 56.21 59.71 61.62 65.90 71.40 58.72 62.56 60.72 65.00 61.65Winnipeg MB 44.21 47.82 49.01 49.80 49.82 50.76 51.94 52.68 52.99 54.77 55.75 56.83 56.33 56.18Toronto ON n/a n/a n/a n/a 70.06 76.24 82.38 83.09 81.31 79.97 85.94 87.53 84.18 85.74Ottawa ON n/a n/a n/a n/a 74.43 78.71 84.63 90.37 67.80 71.42 73.29 71.18 72.12 72.75Montreal PQ n/a n/a n/a n/a 94.33 95.32 91.80 93.60 79.72 79.54 84.38 87.54 95.48 94.22Quebec City PQ n/a n/a n/a n/a 61.28 66.74 69.11 66.97 67.30 68.28 71.69 74.73 77.81 78.67
n/a means not available
Note: R/C Ratio = Total Operating Revenues / Total Direct Operating Expenses The resulting figure indicates what percentage of the transit system's costs are paid for by passenger fares.
Note: Cost Effectiveness = Total Direct Operating Expenses / Regular Service Passenger Trips Indicates the cost per passenger carried.
Note: Cost Efficiency = Total Direct Operating Expense / Total Vehicle Hours Represents the cost of running the transit system per hour, with no consideration of revenue. Indicates the cost per vehicle hour.
Winnipeg Transit DepartmentSource: Canadian Urban Transit Association (CUTA) ; Canadian Transit Fact Book

105
Figure 4.6 gives a comparison of public transit performance with revenue to cost ratios across metropolitan areas. The RC ratios of Winnipeg and Ottawa are very similar for the initial period under review. As of 1996 Winnipeg improved notably over Ottawa to capture second place after Toronto. In 1999 the RC ratio for Toronto was 0.84 and for Winnipeg 0.63.
Figure 4.6 Public Transit Metropolitan Performance Comparisons: Revenue/Cost Ratio
0.000.10
0.200.30
0.40
0.50
0.600.70
0.800.90
1990 1991 1992 1993 1994 1995 1996 1997 1998 1999
Year
Vancouver
Calgary
Edmonton
Winnipeg
Toronto
Ottawa
Montreal
Quebec City
Figure 4.7 Public Transit Metropolitan Performance Comparisons: Cost Effectiveness
0.00
0.50
1.00
1.50
2.00
2.50
3.00
1990 1991 1992 1993 1994 1995 1996 1997 1998 1999
Year
Dol
lars
Vancouver
Calgary Edmonton Winnipeg
Toronto Ottawa
Montreal Quebec City

106
Figure 4.7 shows a comparison of cost effectiveness across metropolitan areas. Winnipeg had the lowest total direct operating expenses per regular service passenger from 1990 to 1994. In 1999 it held fourth position at $1.90, trailing Montreal ($1.61), Toronto ($1.74) and Calgary ($1.86). Figure 4.8 shows cost efficiency comparisons across various metropolitan areas. Winnipeg consistently had the lowest total direct operating expense per total vehicle hours for the review period.
In 1999 the total direct operating expense per total vehicle hours for Winnipeg was $56.18. Edmonton followed Winnipeg with a value of $61.65. The highest figure of $94.22 was reported by Montreal. Caution is advised in the interpretation of these data. Most of these cities operate rapid transit systems, such as subways or light rail systems (LRT), that have higher costs, but also higher quality than street buses.
Figure 4.8 Public Transit Metropolitan Performance Comparisons: Cost Efficiency
0.00
20.00
40.00
60.00
80.00
100.00
120.00
1990 1991 1992 1993 1994 1995 1996 1997 1998 1999
Year
Dol
lars
Vancouver Calgary Edmonton Winnipeg Toronto Ottawa Montreal Quebec City

107
Table 4.5 gives metropolitan public transit comparison of adult cash fare statistics. From these tables (4.4 & 4.5) we are seeing that Winnipeg has one of the best current fare structures. Vancouver can be discounted due their poor performance in the three cost categories, including being the least cost effective transit system overall.
Figure 4.9 shows that adults in Ottawa and Quebec City paid the highest fare of $2.25 in 1999.
Vancouver had the lowest fare at $1.50, followed by Winnipeg at $1.55.
Table 4.5 Public Transit Metropolitan Comparisons : Adult Cash Fare Statistics, Selected Cities
City Prov. 1986 1987 1988 1989 1990 1991 1992 1993 1994 1995 1996 1997 1998 1999
Vancouver BC n/a n/a n/a n/a 1.25 1.35 1.35 1.35 1.50 1.50 1.50 1.50 1.50 1.50Calgary AB n/a n/a n/a n/a 1.00 1.10 1.50 1.50 1.50 1.50 1.50 1.60 1.60 1.60Edmonton AB n/a n/a n/a n/a 1.25 1.35 1.35 1.35 1.60 1.60 1.60 1.60 1.60 1.60Winnipeg MB 0.85 0.90 1.00 1.00 1.10 1.15 1.20 1.30 1.35 1.35 1.40 1.45 1.50 1.55Toronto ON n/a n/a n/a n/a 1.20 1.30 2.00 2.00 2.00 2.00 2.00 2.00 2.00 2.00Ottawa ON n/a n/a n/a n/a 0.90 0.95 1.30 1.50 1.60 1.60 1.85 1.85 2.25 2.25Montreal PQ n/a n/a n/a n/a 1.25 1.50 1.60 1.75 1.75 1.85 1.85 1.85 1.85 1.90Quebec City PQ n/a n/a n/a n/a 1.40 1.75 n/a 1.80 1.80 1.80 1.85 1.85 2.00 2.25
n/a means not availableFigures are in Canadian dollars.
Source: Canadian Urban Transit Association (CUTA) ; Canadian Transit Fact Book Winnipeg Transit Department
Figure 4.9 Public Transit Metropolitan Comparisons: Adult Cash Fare
0.00
0.50
1.00
1.50
2.00
2.50
1990 1991 1992 1993 1994 1995 1996 1997 1998 1999
Year
Dol
lars
Vancouver
Calgary Edmonton Winnipeg Toronto Ottawa Montreal
Quebec City

108
Table 4.6 shows operating data for the city of Brandon Transit System.
Table 4.6 Brandon Transit System - Operating Data
1990 1991 1992 1993 1994 1995 1996 1997 1998
Revenue Vehicle Kilometers 930918 925201 809760 799410 1013900 994415 942732 954516 946819Total Vehicle Kilometers 940793 935750 821279 804452 1012100 1005470 948537 959776 950379Revenue Vehicle Hours 43632 43632 41456 40926 45432 44040 43046 42305 41964Total Vehicle Hours 43632 43632 41456 41141 45697 44586 43301 42535 42157
Regular Service Pass. Trips 1217475 1300335 931514 845240 663751 744677 747969 730556 726308
Expenditures:Transportation Operations Exp. 1118724 1167634 1955326 1099093 1294004 1182420 1120371 1093214 1125063Fuel/Energy Exp. for Vehicles n/a n/a n/a n/a n/a 186833 156509 156853 160378Vehicle Maintenance Exp. 664936 747011 n/a 665019 765078 651272 624128 632229 622113Plant Maintenance Exp. 4320 60928 103066 27922 28400 29201 27563 25855 32945General/Administration Exp. 217532 163083 104705 218222 164890 217939 267048 231363 227896Total Direct Operating Exp. 2005512 2138656 2163097 2006256 2252372 2267665 2195619 2139514 2168395Total Operating Costs 2005512 2138656 2163097 2006256 2252372 2267665 2195619 2139514 2168395
Regular Service Pass. Rev. 754833 806207 614799 557851 581800 650777 728445 703484 713263Total Operating Revenues 777568 831441 634298 578870 618900 698454 774300 734360 742506Total Revenues 777568 831441 634298 578870 618900 698454 774300 734360 742506
Net Direct Operating Cost 1227944 1307215 1528799 1427386 1633472 1569211 1421319 1405154 1425889Net Operating Cost 1227944 1307215 1528799 1427386 1633472 1569211 1421319 1405154 1425889Provincial Share 570606 610511 543662 642131 691600 638195 626016 626016 626800Municipal Share 657338 696704 985137 785255 941872 931016 795303 779138 799089
Net Capital Cost 199941 229650 226000 4000 4000 358150 6809 357500 203000Provincial Share 104740 114825 113000 n/a n/a 114000 n/a 100000 100000Municipal Share 95201 114825 113000 4000 4000 47150 6809 4500
Note: All transit systems do not always report all data itemsNote: Statistical data has been rounded up to the nearest thousand.Note: Motor bus vehicle numbers include standard and low floor busesSource: Canadian Urban Transit Association (CUTA) ; Canadian Transit Fact Book Brandon Transit - Engineering and Operations Department Transportation Services

109
Table 4.7 shows performance indicators for Brandon Transit. It is difficult to compare the performance indicators between Winnipeg Transit and Brandon Transit due to the large difference in the sizes of the rider base. In every category, due to the fact that Brandon cannot take advantage of any economies of scale, their values are lower than in Winnipeg. To make a comparison as to the availability of these economies, consider that Winnipeg’s population is currently 680,000 and Brandon’s is 42,000, a difference of approximately sixteen times.
Table 4.7 Brandon Transit Performance Indicators
1990 1991 1992 1993 1994 1995 1996 1997 1998 1999
Financial PerformanceTot.Oper.Rev. / Tot.Dir.Oper.Exp. (RC Ratio) 39 39 29 29 27 31 35 34 34 37Municipal Share (Oper.) / Capita 16.98 18.00 25.39 20.13 24.28 23.30 19.91 19.48 19.98 18.39Net. Oper. Cost / Reg. Serv. Pass. 1.01 1.01 1.64 1.69 2.46 2.11 1.90 1.92 1.96 1.84Average FareReg. Serv. Pass. Rev / Reg. Serv. Pass 0.63 0.63 0.66 0.66 0.88 0.87 0.97 0.97 0.98 1.02Cost EffectivenessTot. Dir. Oper. Exp. / Reg. Serv. Pass 1.65 1.64 2.32 2.37 3.39 3.05 2.94 2.93 2.99 2.91Cost EfficiencyTot. Dir. Oper. Exp. / Tot. Veh. Hrs. 45.96 45.96 52.18 49.02 49.29 50.86 50.71 50.3 51.44 49.58Service UtilizationReg. Serv. Pass. / Capita 31.45 33.59 24.01 21.67 17.11 18.64 18.72 18.26 18.16 18.51Reg. Serv. Pass. / Rev. Veh. Hrs. 27.90 29.80 22.47 20.65 14.61 16.91 17.38 17.27 17.31 17.15Amount of ServiceRev. Veh. Hrs. / Capita 1.13 1.13 1.07 1.05 1.17 1.10 1.08 1.06 1.05 1.08Average SpeedRev. Veh. Kms. / Rev. Veh. Hrs. 21.34 21.20 19.53 19.53 22.32 22.58 21.90 22.56 22.56 23.28Vehicle UtilizationRev. Veh. Kms. / Active Vehicle 51718 51400 44986 44412 56672 55859 55796 56457 59399 56092Labour ProductivityRev. Veh. Hrs. / Operator Paid Hrs. n/a n/a 0.62 n/a 0.77 0.76 0.77 0.78 0.77 0.75Top Wage RatesOperators 13.70 14.41 15.06 15.06 15.47 15.70 15.86 16.02 16.18 16.18Mechanics n/a n/a n/a 16.19 16.29 16.98 17.15 17.32 17.49 17.49Reg. Serv. Pass. Rev. / Rev. Veh. Hr. 17.3 18.48 14.83 13.63 12.81 14.78 16.92 16.68 17 17.51Reg. Serv. Pass. Rev. / Rev. Veh. Km. 0.81 0.87 0.76 0.70 0.57 0.65 0.77 0.74 0.75 0.75Reg. Serv. Pass. Trips / Rev. Veh. Km. 1.31 1.41 1.15 1.06 0.65 0.75 0.79 0.77 0.77 0.74
Note: All transit systems do not always report all data items; "n/a" means not available.Source: Winnipeg Transit Department Canadian Urban Transit Association (CUTA) ; Canadian Transit Fact Book

110
Table 4.8 shows employment and vehicle data for Winnipeg Transit and Brandon Transit respectively.
Table 4.8 Individual Urban Transit Employment and Vehicle Data
Year 1986 1987 1988 1989 1990 1991 1992 1993 1994 1995 1996 1997 1998 1999
Winnipeg Transit System:
Employment:Full-time employees 1328 1355 1359 1359 1346 1353 1329 1304 1321 1275 1263 1221 1266 1276 (incl. management)Other Part-time employees 62 62 59 67 65 65 - - 95 82 81 71 74 65Total Employment 1390 1417 1418 1426 1411 1418 1329 1304 1416 1357 1344 1292 1340 1341
Vehicle Data:Motor Bus 535 540 543 560 560 560 554 550 535 535 535 535 535 534
Brandon Transit System:
Employment:Full-time employees (incl. management) 36 36 36 36 35 37 36 35 35 35 32 32 32 32Other Part-time employees 3 3 3 3 3 3 3 3 3 3 2 2 3 3Total Employment 39 39 39 39 38 40 39 38 38 38 34 34 35 35
Vehicle Data:Motor Bus n/a n/a n/a n/a 18 18 18 18 18 18 17 17 17 17
Note: All transit systems do not always report all data items. Full-time employee data include management personnel. Vehicle numbers include standard, low-floor and community buses."-" means nil or zeron/a means not availableSource: Canadian Urban Transit Association (CUTA) ; Canadian Transit Fact Book Winnipeg Transit Department Brandon Transit

111
Table 4.9 shows the fare structure chronology for Winnipeg Transit System. Since 1992 the all-items Consumer Price Index (CPI) for Manitoba has increased by 18.1 percent (Canada: 13.5 %)1. Fares for all forms of public transportation (intercity, bus and taxi) have increased by 62 percent in Manitoba (Canada: 53 %)2 and transit fares by 50 percent (Canada: 33 %)3. With the use of this very broad estimate, we are seeing that transit fares in Winnipeg are increasing faster than average prices of all items in Manitoba and faster than city bus and subway fares in Canada, but slower than all public transportation elsewhere.
1 Cansim Matrix 9964: Consumer Price Indexes for Manitoba, Series: P207000 and P200000 2 Cansim Matrix 9964: Consumer Price Indexes for Manitoba, Series: P207079 and P200192 3 Cansim Matrix 9964: Consumer Price Indexes for Manitoba, Series: P207081 and P200194
Table 4.9 Winnipeg Transit System Fare Structure Chronology
Adult Child Senior Race TrackEffective Pass Pass Pass
Date Cash Ticket Monthly Super Weekday Cash Ticket Monthly Super Cash Ticket Monthly Super Special Shuttle
1-Mar-1986 0.85 0.75 28.00 - - 0.35 0.30 14.00 - 0.35 0.30 14.00 - 2.00 0.851-Mar-1987 0.90 0.80 30.00 - - 0.40 0.35 15.00 - 0.40 0.35 15.00 - 2.10 0.901-Mar-1988 1.00 0.90 34.00 - - 0.50 0.45 17.00 - 0.50 0.45 17.00 - 2.35 1.001-May-1990 1.10 1.00 38.00 - - 0.55 0.50 20.00 - 0.55 0.50 20.00 - 2.60 1.101-Feb-1991 1.15 1.05 40.00 - - 0.60 0.55 22.00 - 0.60 0.55 22.00 - 2.70 1.151-Feb-1992 1.20 1.10 42.00 - - 0.60 0.58 22.00 - 0.60 0.58 23.00 - 2.90 1.201-Feb-1993 1.25 1.15 44.00 - - 0.65 0.63 25.00 - 0.65 0.63 25.00 - - -1-Jul-1993 1.30 1.20 45.00 - - 0.70 0.65 25.50 - 0.70 0.65 25.50 - - -1-Feb-1994 1.35 1.35 48.00 - - 0.75 0.75 28.00 - 0.75 0.75 28.00 - - -1-Jun-1995 1.35 1.30 48.00 13.00 11.70 0.80 0.75 28.00 7.50 0.80 0.75 28.00 7.50 - -1-Feb-1996 1.40 1.35 52.00 13.50 12.15 0.80 0.80 30.80 8.00 0.85 0.80 30.80 8.00 - -1-Jan-1997 1.45 1.40 53.90 14.00 12.60 0.85 0.80 30.80 8.00 0.85 0.80 30.80 8.00 - -1-Jan-1998 1.50 1.45 55.85 14.50 13.00 1.50 0.85 32.75 8.50 1.50 0.85 32.75 8.501-Jan-1999 1.55 1.50 57.75 15.00 13.50 1.25 0.90 34.65 9.00 1.25 0.90 34.65 9.001-Apr-2000 1.60 1.55 59.70 15.50 14.00 1.30 0.95 36.60 9.50 1.30 0.95 36.60 9.501-Sep-2000 1.60 1.55 59.70 15.50 14.00 1.30 0.95 36.60 9.50 1.30 0.95 36.60 9.50 47.751-Jan-2001 1.65 1.60 61.60 16.00 14.40 1.35 1.00 38.50 10.00 1.35 1.00 38.50 10.00 49.30
"-" means nil or zero (i.e. pass did not exist for specified year)
Sources: Winnipeg Transit Department

112
Table 4.10 shows the cash fare structure chronology for Brandon Transit System. Brandon has kept much closer to the average public transit increases in Canada. From 1986 to 1999 fares have increased by 50%.
Table 4.11 shows urban transit annual statistics for Manitoba.
Table 4.10 Brandon Transit System Cash Fare Structure Chronology
Year Adult Student/ Special Senior Student
1986 $0.60 $0.40 $0.601987 $0.85 $0.60 $0.851988 $0.90 $0.65 $0.901989 $0.90 $0.65 $0.901990 $0.90 $0.65 $0.901991 $0.90 $0.65 $0.901992 $1.00 $0.75 $1.001993 $1.10 $0.85 $1.101994 $1.10 $0.85 $1.101995 $1.15 $0.90 $1.151996 $1.25 $1.00 $1.251997 $1.25 $1.00 $1.251998 $1.50 $1.25 $1.501999 $1.50 $1.25 $1.5020002001
Sources: Brandon Transit - Engineering and Operations Department Transportation Services
Table 4.11 Manitoba Urban Transit Annual Statistics
1986 1987 1988 1989* 1990 1991 1992 1993 1994 1995 1996 1997**
Carriers Reporting No. 2 2 2 n/a 2 2 2 2 2 2 2 4Regular Service Revenues $'000s 31233 32528 34939 n/a 37359 38998 38801 38934 39901 38447 41240 58322Total Operating Revenues $'000s 32919 34473 37042 n/a 39390 41077 41237 40601 42375 40671 43345 61708Total Subsidies $'000s 40856 45994 43767 n/a 35294 34701 42851 37164 49748 40821 37343 62077 (operating & capital)Total Revenues $'000s 73775 80467 80809 n/a 74684 75778 84088 77764 92124 81492 80688 123785
Direct Regular Pass. Serv. Operating Costs: Transportation Operations $'000s 33955 41555 41119 n/a 37930 38200 44147 48803 47589 48342 48586 67301Revenue Veh. Maintenance $'000s 9431 11135 11959 n/a 9501 10361 11533 13922 13868 14091 14512 19296Non-Rev. Veh. Maintenance $'000s 2175 2530 2736 n/a 2570 2903 2702 3652 3521 3721 3565 4751General & Administrative $'000s 18133 12826 13846 n/a 21115 20332 17375 10202 6756 7405 7395 9946
Tot. Direct Regular Pass. $'000s 63695 68045 69661 n/a 71119 105392 85419 76580 71734 73560 74058 101295Services Operating Costs $'000s
Total Operating Expenses $'000s 67505 71370 73365 n/a 74684 109373 79850 81613 77370 79955 80772 109879
Employment:Full-time employees No. 1364 1392 1396 n/a 1383 1391 1366 1340 1354 1308 1295 1712 (including management) Other Part-time employees No. 62 64 67 n/a 67 67 - - 97 84 83 73Total Annual Paid Hours 000's hr 2670 2844 2804 n/a 2676 2655 2753 2637 2669 2725 2715 3631Total Compensation $'000s 46662 50189 50933 n/a 51013 79582 57384 56814 55623 56950 56855 76104

113
Figures 4.10 and 4.11 charts selected urban transit annual statistics for Manitoba.
MB = Manitoba; SK = Saskatchewan Please note that as of 1997 statistics for Manitoba and Saskatchewan are combined.
Table 4.11 Manitoba Urban Transit Annual Statistics (Continued)
1986 1987 1988 1989* 1990 1991 1992 1993 1994 1995 1996 1997**
Fuel: Diesel Fuel Consumption '000 L 17054 16987 16937 n/a 16543 16751 16315 16154 16317 16325 16218 21685Gasoline Consumption '000 L 372 19 - n/a 231 231 - - - - - -
Revenue Vehicles Operated (Owned & Leased):Standard Motor Bus *** No. 576 573 561 n/a 578 578 572 562 544 543 542 713Low Floor Motor Bus No. - - - n/a - - - 6 9 4 4 37Other No. 20 21 19 - - - - - - - - 6Total No. 596 594 580 n/a 578 578 572 568 553 547 546 756
Total Vehicle Kilometers:Regular passenger service '000km 27008 27337 27568 n/a 27464 27313 26779 26108 25834 25838 25482 34528Total '000km 27751 28169 28358 n/a 27464 27313 26791 26113 26273 27050 25849 35145
Total Passengers Carried '000s 63580 62822 57290 n/a 54802 52160 48468 45212 42505 40653 40244 56572Total Capital Expenses $'000s 6269 9097 7144 n/a 8054 6917 6533 817 15476 1844 715 9463Total Capital Subsidies $'000s n/a n/a n/a n/a 8043 5998 6529 1002 15476 1844 115 7906
* Establishments domiciled in Saskatchewan, Alberta, British Columbia, the Yukon and N.W.T. were combined with establishments domiciled in Manitoba to meet confidentiality requirements.** Manitoba and Sasketchewan combined.*** Data entries from 1986-1991 inclusive are motor bus entry totals. Entries after 1991 are categorized as standard motor bus and low floor motor bus.Note: Some component totals have been rounded up to the nearest thousand."-" means nil or zero; "n/a" means not available.
Source : Statistics Canada, Passenger Bus and Urban Transit Statistics (53-215): Tables 7, 8, 9, 10, 11.
Figure 4.10 Manitoba Urban Transit Annual Statistics
0
20,000
40,000
60,000
80,000
100,000
120,000
140,000
1990 1991 1992 1993 1994 1995 1996 1997** 1998**
Year
$'00
0
Total Revenues
Total Operating Revenues
Total Subsidies
Tot. Direct RegularPass.Services OperatingCostsTotal Operating Expenses
MB+SK

114
In Figure 4.10 total revenues and total operating expenses are shown. Total revenue is a function of total operating revenue and total subsidies. The last year that data for Manitoba was not combined with Saskatchewan was 1996. Total revenue in 1996 was $80.7 million, total operating revenue was $43.3 million and the total subsidies were $37.3 million. Total direct regular passenger services operating costs were $74.0 million and total operating expenses $80.8 million. The lower total operating expense than total direct regular passenger services operating costs suggests possible erroneous data for 1992 and should be viewed with caution.
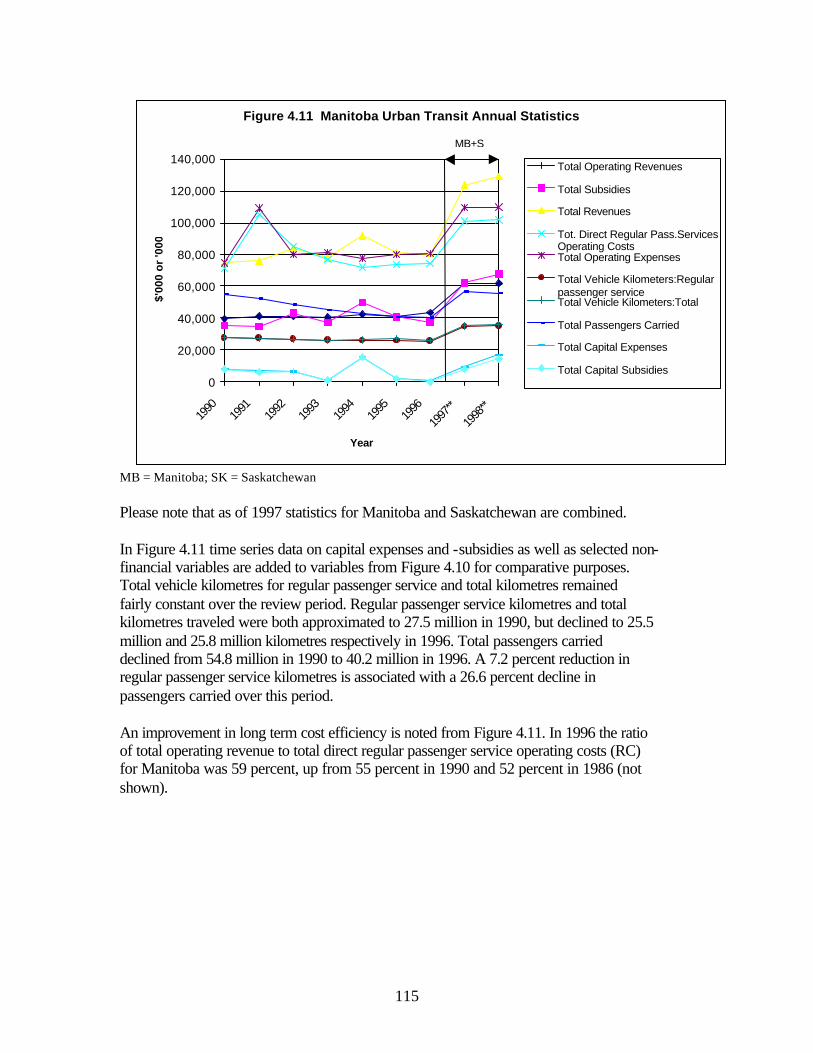
115
MB = Manitoba; SK = Saskatchewan Please note that as of 1997 statistics for Manitoba and Saskatchewan are combined. In Figure 4.11 time series data on capital expenses and -subsidies as well as selected non-financial variables are added to variables from Figure 4.10 for comparative purposes. Total vehicle kilometres for regular passenger service and total kilometres remained fairly constant over the review period. Regular passenger service kilometres and total kilometres traveled were both approximated to 27.5 million in 1990, but declined to 25.5 million and 25.8 million kilometres respectively in 1996. Total passengers carried declined from 54.8 million in 1990 to 40.2 million in 1996. A 7.2 percent reduction in regular passenger service kilometres is associated with a 26.6 percent decline in passengers carried over this period. An improvement in long term cost efficiency is noted from Figure 4.11. In 1996 the ratio of total operating revenue to total direct regular passenger service operating costs (RC) for Manitoba was 59 percent, up from 55 percent in 1990 and 52 percent in 1986 (not shown).
Figure 4.11 Manitoba Urban Transit Annual Statistics
0
20,000
40,000
60,000
80,000
100,000
120,000
140,000
1990
1991
1992
1993
1994
1995
1996
1997
**
1998
**
Year
$'00
0 or
'000
Total Operating Revenues
Total Subsidies
Total Revenues
Tot. Direct Regular Pass.ServicesOperating CostsTotal Operating Expenses
Total Vehicle Kilometers:Regularpassenger serviceTotal Vehicle Kilometers:Total
Total Passengers Carried
Total Capital Expenses
Total Capital Subsidies
MB+S

116
Table 4.12 shows urban transit annual statistics for Canada. A less obvious trend is that most public transit systems are replacing their old buses with new low floor models, in order to serve those passengers requiring special service.
Table 4.12 Canada Urban Transit Annual Statistics
1986 1987 1988 1989 1990 1991 1992 1993 1994 1995 1996 1997
Carriers Reporting No. 62 65 68 65 65 65 74 74 84 80 77 65
Regular Service Revenues $'000s 969674 978327 1050899 1147927 1189075 1293271 1374388 1405519 1425307 1454419 1531458 1620760Total Operating Revenues $'000s 1041368 1046714 1125419 1214455 1273915 1416197 1451881 1493907 1518926 1545306 1621407 1712274Total Subsidies $'000s 1238241 1393671 1454384 1772383 1448620 1557330 2135196 2130928 1992595 2034464 2054754 2133818 (operating & capital)Total Revenues $'000s 2279609 2440385 2579803 2986838 2722535 2973527 3587077 3624834 3511521 3579770 3676161 3846092
Direct Regular Pass. ServicesOperating Costs:Transportation Operations $'000s 1014197 1073959 1150970 1282788 1342118 1506748 1522201 1590798 1503955 1531095 1538540 1523711Revenue Vehicle Maintenance $'000s 331746 347773 380271 388477 427998 511545 547127 569596 570360 558183 586354 606303Non-Revenue Veh. Maintenance $'000s 149168 170693 187939 146085 213440 230168 243871 278846 279783 299809 299889 302449General & Administrative $'000s 272715 260095 280860 307480 379842 357948 369894 366354 351700 327486 328198 323492
Total Direct Regular Passenger $'000s 1767826 1852521 2000040 2191898 2363398 2606409 2742364 2805595 2705799 2716573 2752981 2755955Services Operating Costs $'000s
Total Operating Expenses $'000s 2054316 2144045 2299589 2533804 2722261 3051524 3140812 3245959 3167586 3223836 3247675 3269483
** Data entries from 1986-1991 inclusive are motor bus entry totals. Entries after 1991 are categorized as standard motor bus and low floor motor bus.
Note: Some component totals have been rounded up to the nearest thousand."-" means nil or zeron/a means not available
Source : Statistics Canada, Passenger Bus and Urban Transit Statistics (53-215): Tables 7, 8, 9, 10, 11.
Table 4.12 Canada Urban Transit Annual Statistics (Continued)
1986 1987 1988 1989 1990 1991 1992 1993 1994 1995 1996 1997
Carriers Reporting No. 62 65 68 65 65 65 74 74 84 80 77 65
Employment:Full-time employees No. 34501 35051 35715 36974 37943 38491 38317 37023 37814 37494 36852 36478 (including management)Other Part-time employees No. 1344 1030 1126 1872 1223 1091 3434 1105 1449 1463 1572 1553Total Annual Paid Hours 000's hr 73874 73564 99770 80284 80420 75739 83154 77932 68671 72355 47052 72699Total Compensation $'000s 1322667 1372922 1468177 1533540 1652252 2492476 1952492 1994619 1994088 1982227 1222760 2009073Fuel:Diesel Fuel Consumption '000 L 311347 307466 360435 277155 331079 365655 375826 344178 344424 346836 327714 334986Gasoline Consumption '000 L 3880 2438 2703 20009 15468 2186 - - 10725 10315 368 436
Revenue Vehicles Operated (Owned & Leased):Standard Motor Bus** No. 10366 10600 10535 9780 10202 10474 9757 10196 10085 9855 9622 9030Low Floor Motor Bus No. - - - - - - 135 145 188 305 499 1019Total No. 12968 13371 13344 12720 13156 13542 12956 13527 13411 13140 13049 13077
Total Vehicle Kms Traveled:Regular passenger service '000km 552985 531510 543344 562571 552428 564459 724575 716672 732470 699360 676689 706640Total '000km 756140 694321 749039 780642 769326 780825 754399 756634 776471 742260 716369 749963
Total Passengers Carried '000s 1521101 1468963 1514822 1520421 1528400 1450057 1432105 1396451 1360708 1361062 1352870 1382242
Total Capital Expenses $'000s 371280 309205 338435 426528 401818 481010 504490 478084 665232 695025 834046 819404
Total Capital Subsidies $'000s n/a n/a n/a 455119 387339 485698 468038 488420 413979 450475 494037 641300
** Data entries from 1986-1991 inclusive are motor bus entry totals. Entries after 1991 are categorized as standard motor bus and low floor motor bus.
Note: Some component totals have been rounded up to the nearest thousand."-" means nil or zeron/a means not available
Source : Statistics Canada, Passenger Bus and Urban Transit Statistics (53-215): Tables 7, 8, 9, 10, 11.

117
Figures 4.12 and 4.13 depict urban transit annual statistics for Canada.
Figure 4.12 Canada Urban Transit Annual Statistics
0
500,000
1,000,000
1,500,000
2,000,000
2,500,000
3,000,000
3,500,000
4,000,000
4,500,000
1989 1990 1991 1992 1993 1994 1995 1996 1997 1998
Year
$'00
0
Total OperatingRevenues
Total Subsidies
Total Revenues
Total Direct RegularPassenger ServicesOperating CostsTotal OperatingExpenses
Figure 4.13 Canada Urban Transit Annual Statistics
0
500,000
1,000,000
1,500,000
2,000,000
2,500,000
3,000,000
3,500,000
4,000,000
4,500,000
1989 1990 1991 1992 1993 1994 1995 1996 1997 1998
Year
$'00
0 or
'000
Total Operating Revenues
Total Subsidies
Total Revenues
Total Direct Regular PassengerServices Operating CostsTotal Operating Expenses
Total Vehicle Kms Traveled:Regularpassenger serviceTotal Vehicle Kms Traveled:Total
Total Passengers Carried
Total Capital Expenses
Total Capital Subsidies

118
Figure 4.14 shows the improvement in long term cost efficiency. In 1998 the ratio of total operating revenue to total direct regular passenger service operating costs (RC) for Canada was 63 percent, up from 59 percent in 1996, 54 percent in 1990 and 59 percent in 1986 (not shown).
For * and **: Refer to Table 4.11. MB = Manitoba; SK = Saskatchewan.
Figure 4.14 Manitoba and Canada Urban Transit Annual Statistics: Total Operating Revenue to Total Direct Regular Passenger Service Operating Cost
0
10
20
30
40
50
60
70
1989* 1990 1991 1992 1993 1994 1995 1996 1997** 1998**
Year
Per
cen
tag
e Canada R/C
MB R/C
MB+SK

119
4.1.2 Taxi Industry Table 4.13 shows the number of vehicles operated by the Winnipeg taxi industry. Practically all increases in the number of taxis operating in Winnipeg can be attributed to the two newer companies, Spring/Star and Blueline.
Table 4.14 gives a breakdown of the taxi industry owners by company and drivers. T a b l e 4 . 1 4 T h e S t r u c t u r e o f W i n n i p e g T a x i I n d u s t r y :A B r e a k d o w n o f I n d u s t r y O w n e r s b y C o m p a n y a n d D r i v e r s .
# o f # o f # o f # o f # o f T a x i C o m p a n y P r e m i u m S t a n d a r d Access ib le S e a s o n a l O w n e r s / # o f
T a x i c a b s T a x i c a b s T a x i c a b s T a x i c a b s S h a r e h o l d e r s D r i v e r s
1 9 9 6 / 9 7B l u e l i n e P r e m i u m T a x i 9 - - 3 1B l u e l i n e A c c e s s i b l e T a x i - - 9 - -D u f f y ' s T a x i - 1 5 0 2 2 9 1 3 4R a p i d T a x i - 1 - - 1S p r i n g T a x i - 2 5 5 2 1U n i c i t y T a x i - 2 1 9 8 2 0 2 2 4
T o t a l 9 3 9 5 2 4 5 4 3 6 1 1 7 0 0
1 9 9 8 / 9 9B l u e l i n e P r e m i u m T a x i 7 - - N . A . N . A .B l u e l i n e A c c e s s i b l e T a x i - - 7 - -D u f f y ' s T a x i - 1 4 9 2 N . A . N . A .R a p i d T a x i - 0 - - N . A .S p r i n g T a x i - 2 9 8 N . A . N . A .U n i c i t y T a x i - 2 1 6 1 1 N . A . N . A .
T o t a l 7 3 9 4 2 8 6 1 N . A . 1 6 8 9
" - " m e a n s n i l o r z e r o .
S o u r c e : R a t e a p p l i c a t i o n s u b m i t t e d t o t h e M a n i t o b a T a x i c a b B o a r d , 1 9 9 7 .
Table 4.13 Winnipeg Taxi Industry: Number of Vehicles
Taxi Company 1987 1997 1999 2000
Unicity Taxi (includes Access) 222 227 227 226Duffy's Taxi 150 152 151 154Spring/Star Taxi 10 30 37 36Blueline Taxi 0 18 14 13
Total 382 427 429 429
Source: Manitoba Taxicab Board Annual Reports.

120
Table 4.15 shows gross earnings for taxicab drivers and operators as contained in the 1997 rate application.
Table 4.16 shows the 1997 application for meter rate increase.
T a b l e 4 . 1 5 W i n n i p e g T a x i c a b G r o s s E a r n i n g s : D r i v e r a n d O p e r a t o r
G r o s s E a r n i n g s : D r i v e r & O p e r a t o r
S h i f t 1 S h i f t 2 T o t a lD r i v e r $ 0 $ 2 5 , 0 0 0 $ 2 5 , 0 0 0O p e r a t o r $ 5 0 , 0 0 0 $ 2 5 , 0 0 0 $ 7 5 , 0 0 0
1 9 9 1 1 9 9 2 1 9 9 3 1 9 9 4 1 9 9 5 1 9 9 6
C o n s u m e r P r i c e I n d e x
C P I 1 2 5 . 0 1 2 6 . 9 1 3 0 . 3 1 3 2 . 2 1 3 5 . 7 1 3 9 . 6% C h a n g e - 1 . 5 2 . 7 1 . 5 2 . 7 2 . 9
E f f e c t o f C P I o n v a r i o u s G r o s s E a r n i n g s c a t e g o r i e s
R e v e n u e $ 1 0 0 , 0 0 0 $ 9 8 , 4 8 0 $ 9 5 , 8 4 0 $ 9 4 , 4 4 1 $ 9 1 , 9 3 8 $ 8 9 , 3 0 0G r o s s Y $ 7 5 , 0 0 0 $ 7 3 , 8 7 5 $ 7 1 , 8 8 0 $ 7 0 , 8 0 2 $ 6 8 , 8 9 0 $ 6 6 , 8 9 2W a g e s $ 2 5 , 0 0 0 $ 2 4 , 6 2 5 $ 2 3 , 9 6 0 $ 2 3 , 6 0 0 $ 2 2 , 9 6 3 $ 2 2 , 2 9 7
S o u r c e : R a t e a p p l i c a t i o n s u b m i t t e d t o t h e M a n i t o b a T a x i c a b B o a r d , 1 9 9 7 .
Table 4.16 Application For Taxicab Meter Rate Increase
1991 1996 %Change
Net Operator Income
Direct Costs of Sales: Licensing/Vehicle Inspections $200 $400 100%Vehicle Oil & Filter $17,000 $19,000 12%Repair & Maintenance $5,000 $5,500 10%Autopac & Extension Insurance $4,200 $4,800 14%Total $26,400 $29,700 13%
Indirect Costs of Sales:Accounting & Legal $500 $1,000 100%Employer's Statutory Contributions $2,800 $3,500 25%Dispatch & Management Fees $4,160 $5,096 22%Other (Miscellaneous/Contingencies) $1,000 $1,500 50%Total $8,460 $11,096 31%
Gross Earnings $75,000 $66,892 (11%)Costs of Sales $34,860 $40,796 17%Net earnings $40,140 $26,096 (35%)
Source: Rate application submitted to the Manitoba Taxicab Board, 1997.

121
Table 4.17 shows taxicab fees regulation for the latest available year.
Table 4.18 shows taxicab fares for 1996 to 1999.
Table 4.17 Taxicab Fees Regulation
1987 1988 1990 1992 1997
Standard Taxicab Rates
Drop Rate $1.90 $1.90 $2.10 2.25 2.55
Distance Charge$0.10/134
meters$0.10/125
meters $0.10/113
meters $0.10/106
meters $0.10/ 93
meters
Waiting Time$0.10/24 seconds
$0.10/20 seconds
$0.10/18 seconds
$0.10/17 seconds
$0.10/ 15 seconds
Trunk per trip charge $0.25 nil nil nil nil
License Fees (Per Vehicle)
Standard/Premium $100.00 $200.00 $200.00Limousine/Executive $100.00 $200.00 $200.00Handicab Van $100.00 $100.00 $100.00Drive-yourself bus. lic. $100.00 $200.00 $200.00
Taxicab Driver License$10.00 one
year$60.00
two year$30.00 per
year
Source: Manitoba Taxicab Board Annual Reports.
Table 4.18 New Metered Taxicab Fares
Standard and Accessible Taxicabs Premium Taxicabs
Drop ChargeDistance Change
Waiting time
Charge
Drop Charge
Distance Change
Waiting time Charge
1996 $2.25 $0.10 per
106 metres$0.10 per 17 second
$3.60 $0.10 per
106 metres$0.10 per 17
second
1997 $2.55 $0.10 per 93
metres$0.10 per 15 second
$4.10 $0.10 per 93
metres$0.10 per 15
second
1999 $2.55 $0.10 per 93
metres$0.10 per 15 second
Source: Manitoba Taxicab Board Annual Reports
There are no longer any Premium Taxicabs in Manitoba

122
Table 4.19 compares taxicab rates across selected cities in Canada as contained in the 1997 rate application.
Table 4.20 gives a summary of licenses issued to the Winnipeg taxicab industry.
Table 4.19 Comparison of Rates Across Selected Cities in Canada*
City Meter Rate
Calgary $11.60 $4.25 per accessible van.
Edmonton $11.50 Additional per person charges.
Halifax $11.70 $ .50 per additional person.
London $13.90 Additional parcel and person charges.
Saskatoon $11.90 $10.00 minimum per accessible trip.
Toronto $13.10 $5.00 parcel charge.
Victoria $15.15 None
Vancouver $12.10 None
Winnipeg $11.55 None
* a sample trip of ten kilometers is utilized
Source: Rate application submitted to the Manitoba Taxicab Board, 1997.
Surcharges
Table 4.20 Winnipeg Taxicab Industry - Summary of Licenses Issued
93/94 94/95 95/96 98/99
Licenses Issued:To operate a taxicab bus. 656 502 777 565To operate a taxicab 400 400 400 404Standard taxicabs 406 219 628 404Seasonal standard 38 12 16 61Accessible 18 20 23 44Handicab Van 73 70 60 20Limousine 39 42 41 26Drive-yourself 82 11 9 1 bus. licenseNo. of taxicab bus. lic. 72 138No. of licenses issued 1596 1521 1633 1729No. of new applicants 134 120 135 263
Source: Manitoba Taxicab Board Annual Reports.

123
4.1.3 School Bus Transport Table 4.21 shows the regular operational expenditures from school bus statistics for Manitoba. According to this table, the cost to transport school children on these buses has almost doubled, when the number of children transported has decreased by almost 12 percent. There seem to be two main reasons for this. Between fuel and the increased cost of maintenance, running the buses has increased the cost per km from $0.96 to $1.24. Also, due to increased concerns with regards to the children’s safety and welfare, increased supervision and training was deemed necessary; the administration costs that have gone from $1.5 million to $3 million partially reflect this.
Table 4.21 Manitoba School Bus Statistics: Regular Operational Expenditures
Units 1989 1989/90 1990/91 1991/92 1992/93 1993/94 1994/95 1995/96 1996/97 1997/98 1998/99 1999/00*
AdministrationAmount $'000's 1536 2362 2424 2575 2642 2680 2710 2730 2804 2878 2951 3005
Regular TransportationTransportation Exp. $000's 20755 38211 39936 38457 38905 37995 38254 38777 39181 38504 48471 40768Transported Pupils No. 67821 65999 67505 68406 70088 64969 62872 62617 61598 60029 60777 59831Cost Per Pupil $ 306 579 592 562 555 585 608 619 636 641 666 681Amount $ n/a n/a n/a n/a n/a n/a n/a n/a 40484Total Kilometers 000's 21896 30195 32743 34586 34612 33620 33125 32793 32652 33085 32362 32909Cost Per Km. $ 0.95 1.27 1.22 1.11 1.12 1.13 1.15 1.18 1.24 1.16 1.25 1.24Loaded Kilometers 000's 14762 19088 21159 23543 22916 22591 22208 22032 n/a 22264 22534 22282Cost Per Loaded Km. $ 1.41 2.00 1.89 1.63 1.70 1.68 1.72 1.76 n/a 1.73 1.80 1.83
Allowances In Lieu ofTransportation $ 477755 625578 759821 817231 896752 732002 817049 497852 631099 407250 478091 439806
Other (i.e. field trips) $'000's 875 1466 1182 1728 1814 1619 1489 1616 1303 1653 1527 1759
* Budget
Note:Regular transportation data is not available in the 1986 budget report, except for total transportation expendituresRegular transportation expenditures for 1989 are representative of actual data from January-JuneFor 1996/97, the following Amount, Total Kilometers and Cost Per Km. are grouped under "Regular And Other" (Total Of Programs 720 and 790)For 1996/97, loaded kilometers and the corresponding cost per km is not listedStatistical data for administration, regular transportation exp., allowances and other are listed under Transportation of Pupils - Function: 700Some figures are rounded up to the nearest thousandStatistical data is based upon financial and statistical information submitted by district school divisions
Source: Annual Frame Reports, Schools Finance Branch of Manitoba Education and Training

124
Table 4.22 shows regular operational expenditures from urban and rural school divisions in Manitoba. This table demonstrates some of the main differences between urban and rural school bus use. Many more students use the buses in rural areas due to the lack of alternative transport and the difficulty of organizing car pools. Costs are proportionally greater in rural areas due to the longer distances that must be travelled by the drivers, but costs per km are lower because of the efficiencies achieved by having more students moving longer distances.
Table 4.22 Manitoba School Bus Regular Operational Expenditures: Urban and Rural Divisions
Units 1989 1989/90 1990/91 1991/92 1992/93 1993/94 1994/95 1995/96 1996/97 1997/98 1998/99 1999/00*
Urban School DivisionsTransportation Exp. $000's 5582 10251 10629 10755 11007 10833 10497 10153 9904 9013 9743 9736Transported Pupils No. 22437 21534 22615 23683 25861 21427 19305 17495 17273 16146 17033 16413Cost Per Pupil $ 249 476 470 454 426 506 544 580 573 558 572 593Amount No. n/a n/a n/a n/a n/a n/a n/a n/a 10338Total Kilometers 000's 3228 3971 5235 5572 5527 5759 5096 4840 4575 4538 4450 4356Cost Per Km. $ 1.73 2.58 2.03 1.93 1.99 1.88 2.06 2.1 2.26 1.99 2.19 2.24Loaded Kilometers 000's 1958 2233 2918 3449 3398 3473 3153 2256 n/a 2867 2913 2,862Cost Per Loaded Km. $ 2.85 4.6 3.64 3.12 3.24 3.12 3.33 4.5 n/a 3.14 3.34 3.40
Rural School DivisionsTransportation Exp. $000's 15172 27960 29307 27702 27897 27162 27757 28624 29277 29491 38728 31032Transported Pupils No. 45384 44465 44890 44723 44227 43542 43567 45122 44325 43883 43744 43418Cost Per Pupil $ 334 629 653 619 631 624 637 634 661 672 885 715Amount $ n/a n/a n/a n/a n/a n/a n/a n/a 30146Total Kilometers 000's 18668 26225 27509 29014 29085 27861 28029 27953 28077 28547 27912 28553Cost Per Km. $ 0.81 1.07 1.07 0.95 0.96 0.97 0.99 1.02 1.07 1.03 1.39 1.09Loaded Kilometers 000's 12804 16854 18240 20093 19518 19118 19054 19776 n/a 19397 19621 19421Cost Per Loaded Km. $ 1.18 1.66 1.61 1.38 1.43 1.42 1.46 1.45 n/a 1.52 1.97 1.60
* Budget
Note: (1) Urban school divisions refer to school divisions no.1-10 plus division no.12 Rural school divisions include Brandon (div.40), Portage La Prairie (div.24), and Lord Selkirk (div.11) (2) Statistical data is not available in the 1986 budget report (3) Regular transportation expenditures for 1989 are representative of actual data from January-June (4) For 1996/97, the following Amount, Total Kilometers and Cost Per Km. are grouped under "Regular And Other" (Total of Programs 720 and 790); loaded kilometers and the corresponding cost per km is not available (5) Figures for transportation expenditures and total kilometers/loaded kilometers are rounded up to the nearest thousandStatistical data is based upon financial and statistical information submitted by district school divisions
Source: Annual Frame Reports, Schools Finance Branch of Manitoba Education and Training

125
4.2 INTERCITY TRANSPORTATION Table 4.23 indicates travel to Canada by bus. Over the past decade-and-a-half, the use of intercity buses decreased from its peak in 1986 to a fairly low level in the early 1990s, and then increased again in the later part of the decade.
Table 4.24 shows travel to Manitoba by bus. With regard to bus travellers from the U.S.A., the same trend is observed as for the rest of Canada. Manitobans travelling to the U.S. on the other hand has demonstrated large increases as compared to the Canadian average.
Table 4.23 Travel to Canada by Bus ('000 travellers)
Year % %
1986 38199.5 1921.3 5.0 38118.9 1313.0 3.41987 36952.6 1561.6 4.2 44693.2 1337.4 3.01988 36147.1 1541.7 4.3 51308.4 1415.9 2.81989 34705.1 1395.1 4.0 59911.1 1449.7 2.41990 34734.1 1441.7 4.2 70432.8 1405.6 2.01991 33577.2 1371.3 4.1 79350.6 1367.5 1.71992 32427.3 1388.5 4.3 76727.5 1417.4 1.81993 32622.7 1442.2 4.4 66741.2 1419.0 2.11994 34858.8 1571.4 4.5 54313.2 1421.0 2.61995 37330.1 1607.5 4.3 52153.5 1439.1 2.81996 38471.2 1668.4 4.3 52699.0 1563.7 3.01997 40489.9 1781.2 4.4 50941.8 1532.1 3.01998 43857.2 1753.0 4.0 42767.7 1351.6 3.21999 44630.2 1807.5 4.0 42196.4 1393.4 3.32000 43993.8 1871.8 4.3 42666.4 1405.7 3.3
Source: CANSIM database, International Travellers Enter/Return to Canada D145002, D145013, D145035, D145044
USA residents
entering Can.
USA Residents
by Bus
Can. Residents
from USA
Can. Residents
from USA by bus
Table 4.24 Travel to Manitoba by Bus ('000 travellers)
Year % %
1986 636.5 20.2 3.2 1061.1 40.8 3.81987 646.5 23.4 3.6 1192.9 43.1 3.61988 621.7 24.3 3.9 1255.3 44.1 3.51989 674.5 21.7 3.2 1633.7 46.5 2.81990 633.2 19.3 3.0 1942.7 47.7 2.51991 569.1 16.5 2.9 2151.7 45.1 2.11992 546.8 15.1 2.8 2019.2 61.2 3.01993 560.2 19.1 3.4 1731.8 94.6 5.51994 562.1 23.9 4.3 1474.6 147.6 10.01995 573.6 21.5 3.7 1339.8 113.9 8.51996 587.9 21.1 3.6 1385.4 107.3 7.71997 601.3 19.5 3.2 1314.3 123.0 9.41998 637.9 18.9 3.0 1155.4 121.8 10.51999 662.8 17.5 2.6 1155.8 116.0 10.02000 675.4 15.3 2.3 1206.1 114.2 9.5
Source: CANSIM database, International Travellers Enter/Return to Canada D145471, D145482, D145503, D145513.
USA residents
entering MB
USA Residents
by Bus
Can. Residents from USA
Can. Residents
from USA by bus
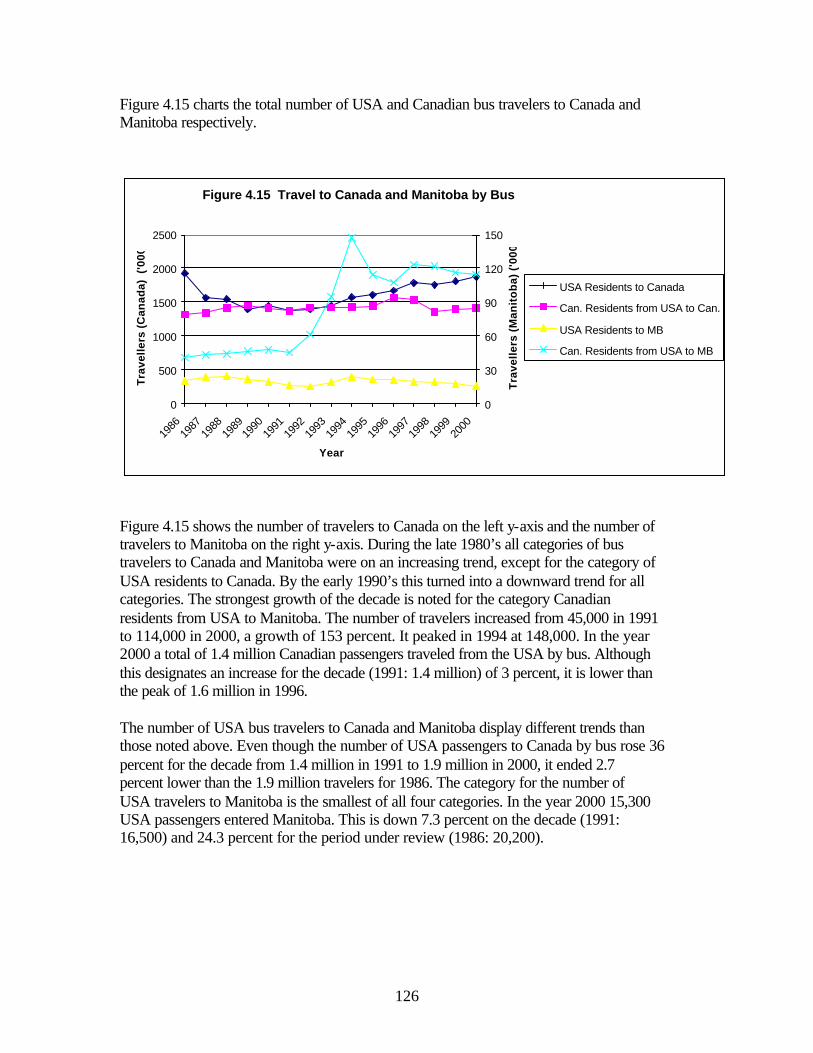
126
Figure 4.15 charts the total number of USA and Canadian bus travelers to Canada and Manitoba respectively.
Figure 4.15 shows the number of travelers to Canada on the left y-axis and the number of travelers to Manitoba on the right y-axis. During the late 1980’s all categories of bus travelers to Canada and Manitoba were on an increasing trend, except for the category of USA residents to Canada. By the early 1990’s this turned into a downward trend for all categories. The strongest growth of the decade is noted for the category Canadian residents from USA to Manitoba. The number of travelers increased from 45,000 in 1991 to 114,000 in 2000, a growth of 153 percent. It peaked in 1994 at 148,000. In the year 2000 a total of 1.4 million Canadian passengers traveled from the USA by bus. Although this designates an increase for the decade (1991: 1.4 million) of 3 percent, it is lower than the peak of 1.6 million in 1996. The number of USA bus travelers to Canada and Manitoba display different trends than those noted above. Even though the number of USA passengers to Canada by bus rose 36 percent for the decade from 1.4 million in 1991 to 1.9 million in 2000, it ended 2.7 percent lower than the 1.9 million travelers for 1986. The category for the number of USA travelers to Manitoba is the smallest of all four categories. In the year 2000 15,300 USA passengers entered Manitoba. This is down 7.3 percent on the decade (1991: 16,500) and 24.3 percent for the period under review (1986: 20,200).
Figure 4.15 Travel to Canada and Manitoba by Bus
0
500
1000
1500
2000
2500
1986
1987
1988
1989
1990
1991
1992
1993
1994
1995
1996
1997
1998
1999
2000
Year
Tra
velle
rs (
Can
ada)
('0
00)
0
30
60
90
120
150
Tra
velle
rs (
Man
ito
ba)
('0
00)
USA Residents to Canada
Can. Residents from USA to Can.
USA Residents to MB
Can. Residents from USA to MB

127
Figure 4.16 depicts USA and Canadian bus travelers as a portion of total travelers to Canada and Manitoba. In the late 1990s, American bus travellers as a proportion of all travellers entering Canada decreased, while Canadian bus travellers began to use the service more frequently almost achieving the level of use of fifteen years previous. In Manitoba, similar lows are observed in 1991, but after that point travel begins to increase rapidly. It eventually achieves a level almost triple that of the rest of Canada. This larger than average proportion of bus travellers from Manitoba can in large part be explained by the increased popularity of weekend trips to casinos in North Dakota and Minnesota.
The share of bus travel to total travelers entering Canada and Manitoba is illustrated in Figure 4.16. The share or proportion line for the category of Canadian bus travelers from USA to Manitoba as a percentage of total Canadian travelers from USA to Manitoba (i.e. all modes) shows a similar trend to the absolute number of passengers of the same category. This suggests that the increase in this category is largely due to an increase in travelers by bus and not by means of other modes. In fact, the increase from a 2.1 percent share in 1991 to 9.5 percent share in 2000 explains more than the increase in total travelers of this category (352 %). Actual figures from Table 4.24 indicate a decline in the total number of Canadian travelers from the USA to Manitoba over this period from 2.2 million in 1991 to 1.2 million in 2000. This explains the larger growth in share of, rather than actual growth in absolute numbers of, Canadian residents traveling by bus to Manitoba. In the category of Canadian travelers from the USA to Canada the share by bus increased from 1.7 percent in 1991 to 3.3 percent in 2000. This share increase of 91 percent once again is larger than the growth in absolute numbers of 2.8 percent and once again is explained along similar lines to the above. Note from Table 4.23 that the total number of Canadian travelers from the USA to Canada decreased from 79.4 million in 1991 to 42.7 million in 2000.
Figure 4.16 Travel to Canada and Manitoba by Bus
0
2
4
6
8
10
12
1986
1987
1988
1989
1990
1991
1992
1993
1994
1995
1996
1997
1998
1999
2000
Year
Per
cen
tag
e o
f T
ota
l
USA Residents to Canada
Can. Residents from USA to Can.
USA Residents to MB
Can. Residents from USA to MB

128
Table 4.25 shows operating revenues and expenses for interurban and rural bus transportation in Canada. For the past decade rural bus companies have retained fairly stable operating ratios. This shows that however the market has changed over the period, the companies involved in providing this service have more than adequately kept pace with altering trends.
Table 4.26 shows employment with large interurban and rural bus transportation companies in Canada.
Table 4.26 Canada Interurban and Rural Bus Transportation: Employment, Large Companies*
Year 1986 1987 1988 1989 1990 1991 1992 193 1994 1995 1996 1997 1998
Employees (No.)Drivers 2500 2549 2450 2411 2457 2394 2200 1976 2154 1643 1419 1446 690Mechanics 718 706 627 711 591 489 472 423 242 149 145 60Other 1564 1545 1394 1090 2062 1893 1734 1635 1687 1660 1571 1369 456Total 4782 4800 4471 4212 5110 4776 4406 4034 3841 3545 3139 2960 1206
Hours Worked ('000)Drivers N/A N/A N/A N/A N/A N/A N/A N/A 4481 2597 3184 2708 1013Mechanics** N/A N/A N/A N/A N/A N/A N/A N/A 357 317 260 115Other N/A N/A N/A N/A N/A N/A N/A N/A 3509 2915 2591 2348 661Total N/A N/A N/A N/A N/A N/A N/A N/A 7990 5869 6092 5316 1788
Employee Benefits N/A N/A N/A N/A N/A N/A N/A N/A 25193 13481 9756 8978 7128
Total Compensation 162968 158216 154146 150348 179105 176074 165726 148405 157552 127740 107852 98285 39456
Average Compensation 34079 32962 34477 35695 35050 36866 37614 36789 41018 36034 34359 33204 32716
* Large Companies with revenues over $2 mil.** Mechanics included with Other in 1994
Source: Statistics Canada, Passenger Bus and Urban Transit Statistics (53-215): Table 3 (1989-98); Table 6 (1987-88); Table 7 (1986).
Table 4.25 Canada Interurban and Rural Bus Transportation: Operating Revenues and Expenses($'000)
Year 1987 1988 1989 1990 1991 1992 1993 1994 1995 1996 1997 1998
Reporting Companies n/a 43 28 30
Operating RevenuesScheduled Intercity Service 214071 208460 228045 260475 269126 254559 229188 241219 210832 207367 189332 82481Charter Service 37355 39713 38798 31704 34102 41682 35997 37887 33809 30890 19034 14122School Bus Service 919 331 750 1446 3780 3657 2924 3077 5952 7848 3495 3960Other Passenger Bus Service* 871 2219 2488 2414 1918 29839 6995 9396 12167Baggage, Parcel, and Express 83707 81095 79628 83808 73463 73665 69348 10796Other Operating Revenues** 83892 82132 91879 108120 15527 16408 13925 14656 14021 14917 13085 9553
Total Operating Revenues 337109 332855 361960 404158 408160 397403 361662 380647 367916 341682 303691 133080
Operating ExpensesDrivers' Wages and Salaries*** 84359 84269 80261 84236 85938 85765 76553 77700 74708 71795 63194 29264Other Employees' Wages and Salaries 84437 81532 68604 98684 103197 97945 92837 54639 61714 46336 40710 18304All Employee Benefits 19720 18089 20873 29633 28955 26892 24821 25193 14671 10954 9711 8191Repair and Maintenance Expenses 29267 32617 39999 44587 43089 41669 38150 27190 32483 30974 27776 15457Fuel (incl. Taxes) 27055 26868 28223 29295 29719 28815 25951 26340 25747 22747 20504 10745Other Operating Expenses 50608 60275 55095 75413 74644 79249 65115 138518 123449 122799 115111 34618
Total Operating Expenses 295439 303649 293055 361848 365542 360355 323427 349580 332772 305605 277007 116580
Interest and Other Non-operating Expenses 15689 16387 23313 23725 23245 21934 20991 N.A. 20096 23912 10143 7134
Total Expenses 311128 320036 316368 385573 388787 382269 344418 349580 352867 329517 287149 123713
Operating Ratio 88 91 81 90 90 91 89 92 90 89 91 88
* Included with school bus service 1992-94, includes urban transport 1986-91** Includes subsidies*** Excludes benefitsSource: Statistics Canada, Passenger Bus and Urban Transit Statistics (53-215): Table 1(1989-98); Table 4(1987-88); Table 5(1986).

129
This demonstrates how these companies have kept up with changing trends. There has been increasing consolidation in this industry where 75 percent of the workforce has been laid off and wages in real terms have decreased more than 24 percent. Table 4.27 shows passengers carried and kilometres traveled by interurban and rural bus transportation in Canada. It seems by the data on this table that both scheduled passenger travel and distance travelled have decreased by two-thirds over the period. If 1998 is an aberration, and these low figures are only temporary, then passengers have decreased by 50 percent and distance travelled only by approximately one-third, using the 1997 values instead.
Table 4.27 Interurban and Rural Bus Transportation in Canada: Passengers Carried and Kilometers Traveled
Year 1986 1987 1988 1989 1990 1991 1992 1993 1994 1995 1996 1997 1998
Fare Passengers Carried ('000)Scheduled Intercity Service 21800 21612 18189 17153 16391 15309 13841 10863 11438 10289 9506 10119 6140Other 1049 114 73 80 600 607 1031 N/A N/A 897 763 1239 1574Total 22849 21726 18262 17233 16991 15916 14872 10863 11438 11186 10270 11358 7714
Distance Run ('000 km)Scheduled Intercity Service 170564 168527 156789 155669 167739 163182 147625 137965 145313 123983 106825 99967 45732Other 2495 139 263 370 420 419 901 730 20530 29793 23534 17712 17336Total 173059 168666 157052 156039 168159 163601 148526 138695 165843 153776 130359 117679 63068
Fuel Consumed ('000 l)Diesel 75336 74160 73190 77416 81370 80544 76800 60803 62984 22314 47397 42646 17854Gasoline 1678 279 670 106 200 174 89 3236 0 26607 0 0 0Total 77014 74439 73860 77522 81570 80718 76889 64039 62984 48921 47397 42646 17854
Source: Statistics Canada, Passenger Bus and Urban Transit Statistics (53-215):Table 4, 6 (1995-98); Table 5, 7(1989-94); Table 8 (1987-88); Table 9 (1986)
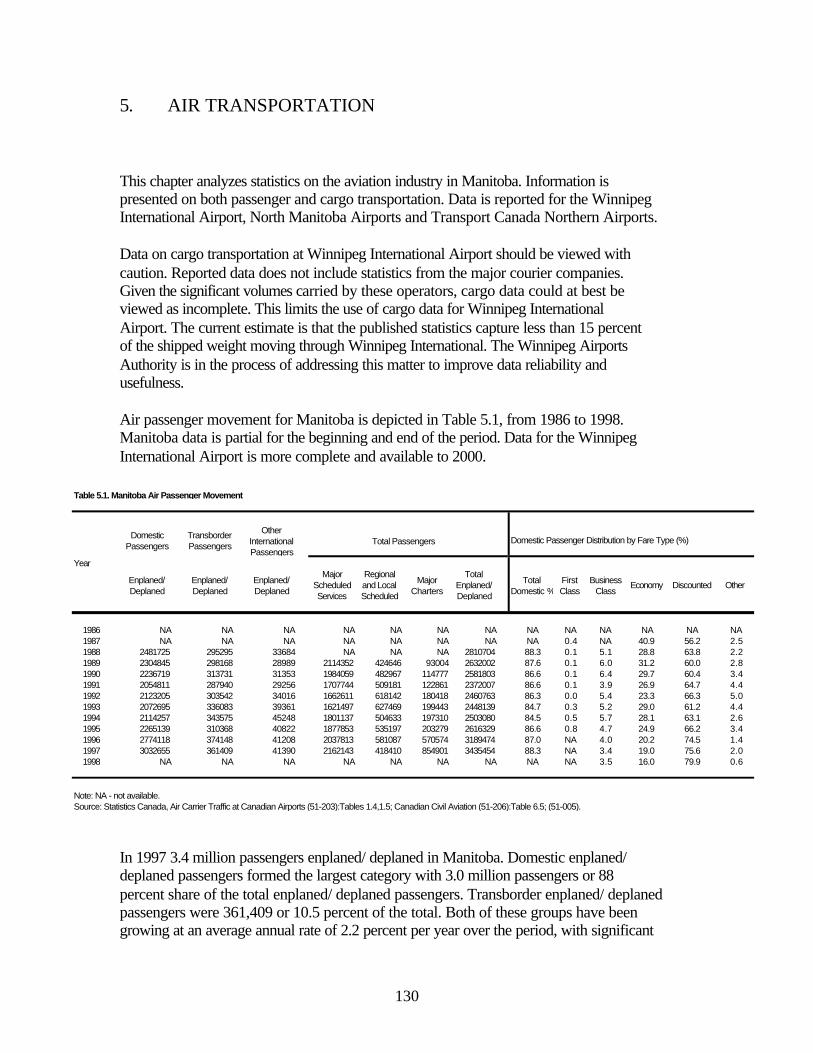
130
5. AIR TRANSPORTATION This chapter analyzes statistics on the aviation industry in Manitoba. Information is presented on both passenger and cargo transportation. Data is reported for the Winnipeg International Airport, North Manitoba Airports and Transport Canada Northern Airports. Data on cargo transportation at Winnipeg International Airport should be viewed with caution. Reported data does not include statistics from the major courier companies. Given the significant volumes carried by these operators, cargo data could at best be viewed as incomplete. This limits the use of cargo data for Winnipeg International Airport. The current estimate is that the published statistics capture less than 15 percent of the shipped weight moving through Winnipeg International. The Winnipeg Airports Authority is in the process of addressing this matter to improve data reliability and usefulness. Air passenger movement for Manitoba is depicted in Table 5.1, from 1986 to 1998. Manitoba data is partial for the beginning and end of the period. Data for the Winnipeg International Airport is more complete and available to 2000.
In 1997 3.4 million passengers enplaned/ deplaned in Manitoba. Domestic enplaned/ deplaned passengers formed the largest category with 3.0 million passengers or 88 percent share of the total enplaned/ deplaned passengers. Transborder enplaned/ deplaned passengers were 361,409 or 10.5 percent of the total. Both of these groups have been growing at an average annual rate of 2.2 percent per year over the period, with significant
Table 5.1. Manitoba Air Passenger Movement
Domestic Passengers
Transborder Passengers
Other International Passengers
Total Passengers
Year
Enplaned/ Deplaned
Enplaned/ Deplaned
Enplaned/ Deplaned
Major Scheduled Services
Regional and Local Scheduled
Major Charters
Total Enplaned/ Deplaned
Total Domestic %
First Class
Business Class
Economy Discounted Other
1986 NA NA NA NA NA NA NA NA NA NA NA NA NA1987 NA NA NA NA NA NA NA NA 0.4 NA 40.9 56.2 2.51988 2481725 295295 33684 NA NA NA 2810704 88.3 0.1 5.1 28.8 63.8 2.21989 2304845 298168 28989 2114352 424646 93004 2632002 87.6 0.1 6.0 31.2 60.0 2.81990 2236719 313731 31353 1984059 482967 114777 2581803 86.6 0.1 6.4 29.7 60.4 3.41991 2054811 287940 29256 1707744 509181 122861 2372007 86.6 0.1 3.9 26.9 64.7 4.41992 2123205 303542 34016 1662611 618142 180418 2460763 86.3 0.0 5.4 23.3 66.3 5.01993 2072695 336083 39361 1621497 627469 199443 2448139 84.7 0.3 5.2 29.0 61.2 4.41994 2114257 343575 45248 1801137 504633 197310 2503080 84.5 0.5 5.7 28.1 63.1 2.61995 2265139 310368 40822 1877853 535197 203279 2616329 86.6 0.8 4.7 24.9 66.2 3.41996 2774118 374148 41208 2037813 581087 570574 3189474 87.0 NA 4.0 20.2 74.5 1.41997 3032655 361409 41390 2162143 418410 854901 3435454 88.3 NA 3.4 19.0 75.6 2.01998 NA NA NA NA NA NA NA NA NA 3.5 16.0 79.9 0.6
Note: NA - not available.Source: Statistics Canada, Air Carrier Traffic at Canadian Airports (51-203):Tables 1.4,1.5; Canadian Civil Aviation (51-206):Table 6.5; (51-005).
Domestic Passenger Distribution by Fare Type (%)

131
yearly variance. The most extreme changes are reductions of passengers enplaned/ deplaned by almost 10 percent in one year and increases by over 22 percent in the next. Other international passengers comprised 41,390 enplaned/ deplaned or 1.2 percent of the total. This group has grown slightly faster overall, but has seen even larger year-on-year variations than Domestic or Transborder passengers. They have varied from a low of –14 percent to a high of 16 percent growth; further, this area has grown by less than one percent year-on-year for each of the final two years of the available data. Figure 5.1 shows the annual enplaned/ deplaned air passengers in Manitoba. The predominance of domestic passengers as the leading category for the period under review is illustrated. During the late 1980’s and early 1990’s domestic passengers showed significant declines. The lowest number of domestic passengers occurred in 1991 when 2.05 million passengers enplaned/ deplaned (88 % share of total passengers). Even though the lowest number of domestic passengers occurred in 1991, the lowest share of 84 percent domestic passengers (2.11 million passengers) happened in 1994.
This low domestic share is the result of an increase in transborder and other international enplaned/ deplaned passengers respectively to 343,575 (13.7 % share of total passengers) and 45,248 (1.8 % share of total passengers) in 1994. The 1991 to 1994 growth rates of 19.3 and 55 percent respectively for the smaller transborder and international categories were large enough to surpass in absolute value the slower growth rate of 2.9 percent of the much larger domestic category. Figure 5.2 shows air passenger movement in Manitoba by service type. Despite considerable declines in passenger movements by major scheduled services during the late 1980’s and early 1990’s, it remained the predominant service type throughout the review period. In 1997 2.2 million passengers or 63 percent of total passengers were moved by means of this service type. Also in 1997, a total of 418,410 passengers
Figure 5.1 Manitoba Air Passenger Movement. Enplaned/Deplaned
0
500,000
1,000,000
1,500,000
2,000,000
2,500,000
3,000,000
3,500,000
4,000,000
1988 1989 1990 1991 1992 1993 1994 1995 1996 1997
Year
Pas
sen
ger
Nu
mb
ers
Other International PassengersTransborder PassengersDomestic Passengers

132
(12.2 %) were moved by way of regional and local scheduled services. A total of 854,901 passengers (24.9 %) were moved by way of major charters. The most noticeable growth is observed for the major scheduled services category during 1996 and 1997. The increase of 651,622 passengers as of 1995 represents a growth of 320 percent to 854,901 passengers in 1997. Major scheduled services increased by 15.1 percent whilst regional and local scheduled services declined by 21.8 percent over this same period.
Figure 5.3 shows domestic air passenger movement in Manitoba by fare type.
Figure 5.2 Manitoba Air Passenger Movement. Service Type
0
500,000
1,000,000
1,500,000
2,000,000
2,500,000
3,000,000
3,500,000
4,000,000
1989 1990 1991 1992 1993 1994 1995 1996 1997
Year
Pas
sen
ger
Nu
mb
ers
Major ChartersRegional and Local ScheduledMajor Scheduled Services
Figure 5.3 Manitoba Air Passenger Movement. Domestic Passenger Distribution by Fare Type
0
10
20
30
40
50
60
70
80
90
1988 1989 1990 1991 1992 1993 1994 1995 1996 1997 1998
Year
Per
cen
tag
e Business ClassEconomyDiscountedOther

133
In 1997 domestic passengers accounted for 88 percent of all passengers in Manitoba (see Table 5.1). A significantly greater share of domestic air passengers made use of discounted airfares. In 1998 80 percent of domestic passengers used discounted fares, up from the 76 percent of 1997. Economy class and business class respectively were 16.0 percent and 3.5 percent in 1998. Trends over the review period suggest that discounted airfare was expanding at the expense of business and economy classes. The decline in the domestic market share of business class fares from 1988 to 1998 was 31 percent. The decline in the economy fare for the equivalent period was 44 percent. The growth in discounted fare was 25.2 percent over the same period.

134
Table 5.2 shows air cargo movement for Manitoba. Please note the caveats at the beginning of the chapter on cargo data in Manitoba. Moreover, Statistics Canada acknowledges that these data do not represent the total cargo loaded and unloaded for the following reasons: (i) the regional and local scheduled carriers do not file cargo data on their airport activity survey, (ii) the major scheduled services survey (which does capture cargo data) does not (generally) cover carriers which utilize aircraft under 30,000 kg and, (iii) the major charter survey does not collect data on domestic courier cargo or domestic entity cargo flights. As an example, in 1996 the Winnipeg International Airport alone actually shipped 101,500 tonnes4. According to this figure, real cargo movements are eight times larger than what is captured by Statistics Canada in Table 5.2 for the entire province. Also, local sources claim that Winnipeg is the busiest courier airport in Canada. According to point (iii) above this data is not captured by official data and hence exacerbates the undercount.
According to official data a total of 13,895 tonnes of air cargo were moved during 1997. Major scheduled services moved 94 percent or 13,000 tonnes and major charter services 6.4 percent or almost 900 tonnes. This data suggests a declining trend in air cargo movement. The peak for the period under review was recorded in 1989 when 30,000 tonnes of air cargo were moved. The significant drop in tonnage of 35 percent in1994 by major scheduled services coincides with the cessation of all cargo flights by Air Canada at Winnipeg International Airport. Great variability is noted in the air cargo moved by major charter services ranging from a low of 49.5 tonnes in 1991 to a 24-fold peak of almost 1,200 tonnes two-years previous in 1989. The magnitude of this data makes trend analysis insignificant, given the inaccuracies of the larger system.
4 Shurvell, S. and Prentice B.E., “Economic Impact of Winnipeg International Airport”, University of Manitoba Transport Institute, September, 1998.
Table 5.2. Manitoba Air Cargo Movement (tonnes)*
Year Major Scheduled Services Major Charter Services Total
1986 N A N A N A1987 N A N A N A1988 N A N A 15555.61989 29186.8 1189.1 30375.91990 28720.6 329.3 29049.91991 26013.9 49.5 26063.41992 28393.7 498.9 28892.61993 30112.3 109.2 30221.51994 19454.6 173.0 19627.61995 15015.0 231.3 15336.31996 12567.4 98.2 12665.61997 13007.0 887.9 13894.91998 N A N A N A
Note: NA - not available*Includes major scheduled and charter operations, does not include courier operationsSource: Statistics Canada, Air Carrier Traffic at Canadian Airports (51-203):Table 5.3; (51-005).

135
Table 5.3 shows passenger movement at Winnipeg International Airport. Information is presented in the major categories of domestic, transborder and international passenger sectors. Each sector is segmented into scheduled carriers and charters. The final column displays total enplaned/ deplaned passengers by service type.
Note that domestic data is not available for regional carriers for the years 1999 and 2000. Hence, the number of domestic passengers moved in these years most likely is significantly underestimated. According to available figures and estimates for the year 2000 a total of 2.4 million domestic passengers enplaned/ deplaned at Winnipeg International Airport, the same total as for 1999. However, in 2000 charters comprised a larger share of domestic passengers at 4.4 percent as opposed to the 1.1 percent for 1999. Given that the remaining share is made up of scheduled services, the predominance of the latter service type in the domestic market is clearly illustrated for recent years. This was not consistently the case in earlier years (see Figure 5.5). In 1998 regional carriers moved 447,200 of a total of 2.5 million domestic passengers and a total of 2.4 million non-charter domestic passengers, that is 18.1 and 18.8 percent respectively. Transborder passengers show an overall increasing trend for the 1990’s. An estimated 393,500 passengers, the highest ever, traveled cross border by air in 2000. This is up 25.5 percent on 1990. The significance of charters in cross border passenger movement shows
Table 5.3. Winnipeg International Airport Passenger Movement ('000)
Domestic Passengers Transborder Passengers International Passengers Total Passengers
Year Major Carriers
Regional Carriers
Scheduled Major
Carriers and Regional
ChartersTotal
Scheduled and Charter
Major Carriers
ScheduledCharters Total
Major Carriers
ScheduledCharters Total
Major Carriers
Scheduled
Regional Carriers Charters Enplaned/
Deplaned
1986 1808.5 102.1 1910.6 20.0 1930.6 256.6 77.0 333.6 3.1 0.0 3.1 2068.2 102.4 97.0 2267.31987 1781.3 112.8 1894.1 4.5 1898.6 240.1 85.9 326.0 3.1 0.0 3.1 2024.5 112.8 90.4 2227.71988 1953.2 174.4 2127.6 0.1 2127.7 232.9 65.6 298.5 8.7 24.9 33.6 2194.8 174.4 90.7 2459.91989 1779.0 205.7 1984.7 2.9 1987.6 236.8 61.3 298.1 0.3 28.4 28.7 2016.1 205.7 92.6 2314.41990 1634.5 249.5 1884.0 26.2 1910.2 255.1 58.5 313.6 3.3 28.0 31.3 1892.9 249.5 112.7 2255.11991 1392.8 316.9 1709.7 45.7 1755.4 228.6 59.3 287.9 7.9 21.4 29.3 1629.3 316.9 126.4 2072.61992 1334.7 379.1 1713.8 90.9 1804.7 238.3 65.3 303.6 9.8 24.2 34.0 1582.8 379.1 180.3 2142.21993 1268.0 331.1 1599.1 107.0 1706.1 274.7 61.1 335.8 9.0 30.6 39.6 1551.7 331.1 198.7 2081.51994 1331.0 330.2 1661.2 96.0 1757.2 275.6 67.3 342.9 11.9 33.4 45.3 1618.5 330.2 196.7 2145.41995 1556.3 240.2 1796.5 95.0 1902.6 285.6 69.0 355.6 10.2 33.6 40.8 1852.1 240.2 200.2 2291.11996 1623.9 277.0 1900.9 530.3 2415.2 359.8 7.7 373.6 9.2 32.0 41.2 1992.8 267.1 570.1* 2830.01997 1769.0 148.8 1917.8 809.1 2727.0 346.5 7.5 361.1 3.3 38.0 41.4 2118.9 156.0 854.6* 3129.51998 1926.6 447.2 2373.8 102.5 2476.4 339.0 0.4 352.7 2.5 51.4 53.9 2290.6 n/a 154.3 2900.01999 2343.4 n/a n/a 25.6 2369.0 356.1 22.5 378.6 n/a 71.5 71.5 2699.4 101.0 119.6 2920.02000 2265.1 n/a n/a 104.1 2369.2 379.3 14.2 393.5 0.9 73.8 74.6 2645.3 100.0 192.0 2937.0
n/a - not available* Due to the 1995 Open Skies Agreement and the opening of Greyhound Airlines operationsTotal Passengers Enplaned/ Deplaned for 1998, 1999 and 2000: Estimates only.Scheduled carriers include Air Canada, Canadian Airlines International, Athabaska Airways and NorthWest Airlines.Chartered carriers include Canada 3000, Royal Airlines, Air Canada, and Canadian Airlines International
Source: Statistics Canada, Canadian Civil Aviation (51-203) Tables 1.2, 1.3, 2.1, 2.2, 3.1, 3.2, 4.1, 4.2.Winnipeg Airports Authority Winnipeg International Airport (information from Transport Canada Aviation Forecasts 1996-2009; TP 7960E, March 1997)

136
a declining trend over the review period. The 1986 total of 77,000 passengers represents a 30 percent share of the cross border market. This dropped to 3.7 percent or 14,200 passengers in 2000. The total number of international passengers from Winnipeg International Airport shows an increasing trend for the review period. In 2000 74,600 passengers traveled internationally, up 138 percent over the 31,300 passengers in 1990. In 1990 charters made up 89 percent of international travelers and in 2000 it accounted for 99 percent. Figure 5.4 illustrates passenger movement at Winnipeg International Airport by sector.
Figure 5.5 shows domestic passenger movement at Winnipeg International Airport by service type. In terms of total passengers the predominance of major carriers in scheduled services is reiterated. Since the figure for regional carriers are not available for 1998 and also the three most recent years are estimates only, values of total enplaned/ deplaned passengers should be viewed with caution. Suffice it to note that the increase in passengers on regional carriers at the expense of scheduled major carriers during the first half of the 1990’s and the period directly preceding, appeared to have been turned around for the latter half of the decade for which data is available.
Figure 5.4 Winnipeg International Airport Passenger Movement by Sector
0
500
1000
1500
2000
2500
3000
3500
1986 1987 1988 1989 1990 1991 1992 1993 1994 1995 1996 1997 1998 1999 2000
Year
Pas
sen
ger
s ('0
00)
InternationalTransborderDomestic

137
The increase in passenger movement by charters in 1996 and 1997 respectively represents a 185 and 327 percent increase over the preceding high of 200,200 passengers in 1995. This spike is for the greater part attributed to two major developments. The first was the signing of an open skies agreement in 1995. The second was the start-up of Greyhound Airlines that introduced the seamless travel option through a strategic alliance with Greyhound Bus Lines. Regional carriers have been consistently losing ground to the majors, and now seem to be at their lowest passenger level since the beginning of the data. The discontinuation of Greyhound Airlines ended the aberration of charter flights. This traffic was generally picked up by the new scheduled discount airline, WestJet.
Figure 5.5 Winnipeg International Airport Passenger Movement by Service Type
0.0
500.0
1000.0
1500.0
2000.0
2500.0
3000.0
1986
1987
1988
1989
1990
1991
1992
1993
1994
1995
1996
1997
1998
1999
2000
Year
Pas
sen
ger
s ('0
00)
Major Carriers Scheduled
Regional Carriers
Charters

138
Table 5.4 shows air cargo movement at Winnipeg International Airport. Information is not considered to be complete since official data collected to date is exclusive of cargo handled by courier services. According to a 1998 report5 where data was provided by the Winnipeg Airports Authority, in 1996 cargo volumes were detailed as follows: loaded weight 54,000 tonnes (53 %), unloaded weight 48,000 tonnes (47 %), the domestic portion was 89 percent of the whole followed by transborder at 6 percent, and other international at 5 percent.
5 Shurvell, S. and Prentice B.E., “Economic Impact of Winnipeg International Airport”, University of Manitoba Transport Institute, September, 1998.
Table 5.4 Winnipeg International Airport Air Cargo Movement
Loaded Cargo Unloaded cargo TotalYear
Domestic Transborder Other International Domestic Transborder Other International
1986 NA NA NA NA NA NA 15701.21987 NA NA NA NA NA NA 11959.21988 NA NA NA NA NA NA 14886.71989 11433.2 970.8 430.2 15175.1 1667.4 0.0 29676.71990 10989.9 802.4 0.0 15161.8 1515.1 8.2 28477.51991 9959.5 592.7 21.5 43704.5 1245.2 19.8 25543.21992 10678.7 785.1 169.5 15019.9 1595.2 103.2 28351.61993 11150.9 750.4 83.5 15827.4 1841.1 26.9 29680.21994 6685.0 983.9 117.5 9297.3 1964.9 23.0 19071.61995 4801.0 1163.6 162.4 6532.9 2138.7 42.2 14840.81996 3721.9 1187.3 81.9 4983.8 2117.8 19.9 12116.61997 3764.3 1160.9 n/a 5017.0 2394.5 588.0 13424.71998 n/a n/a n/a n/a n/a n/a 1800.01999 n/a n/a n/a n/a n/a n/a n/a2000 n/a n/a n/a n/a n/a n/a n/a
Source: Statistics Canada, Air Carrier Traffic at Canadian Airports (51-203):Table 5.2. (51-005).

139
Table 5.5 shows aircraft movement at the Winnipeg International Airport. Itinerant movements are segmented into domestic, transborder and international sectors6. As of 1996 no segmentation of itinerant movements or military movements are available.
6 A local movement is referred to as an aircraft departing or landing at an airport, yet remaining in the same airspace. An itinerant movement encompasses all non-local domestic, transborder, and international aircraft arrivals and departures.
Table 5.5 Winnipeg International Airport Aircraft Movement ('000)
ItinerantYear Local Total Military
Domestic Transborder International Total
1986 92.6 8.3 0.4 101.3 44.0 145.3 14.01987 94.7 8.0 0.5 103.2 42.6 145.8 14.61988 101.4 9.1 0.5 111.0 42.3 153.3 14.01989 106.5 10.2 0.6 117.3 37.5 154.8 11.91990 105.6 8.4 0.4 114.4 41.0 155.4 12.01991 95.9 8.1 0.5 104.5 35.6 140.1 11.41992 95.6 8.3 0.6 104.5 35.4 139.9 10.91993 93.3 8.7 0.5 102.5 36.5 139.0 11.31994 103.6 10.2 0.5 114.3 40.6 154.9 11.41995 109.7 11.8 0.5 122.0 34.0 156.0 10.51996 n/a n/a n/a 126.2 28.9 155.1 n/a1997 n/a n/a n/a 130.2 25.0 155.2 n/a1998 n/a n/a n/a 126.9 23.2 150.1 n/a1999 n/a n/a n/a 135.2 21.3 156.1 n/a2000 n/a n/a n/a 138.1 18.0 156.0 n/a
n/a - not availableSource: Winnipeg Airports Authority
Winnipeg International Airport Finance, Statistics and Forecasts
Figure 5.6 Winnipeg International Airport Aircraft Movements
0
20
40
60
80
100
120
140
160
180
1986 1987 1988 1989 1990 1991 1992 1993 1994 1995 1996 1997 1998 1999 2000
Year
Mo
vem
ents
('0
00)
TotalItinerantLocal
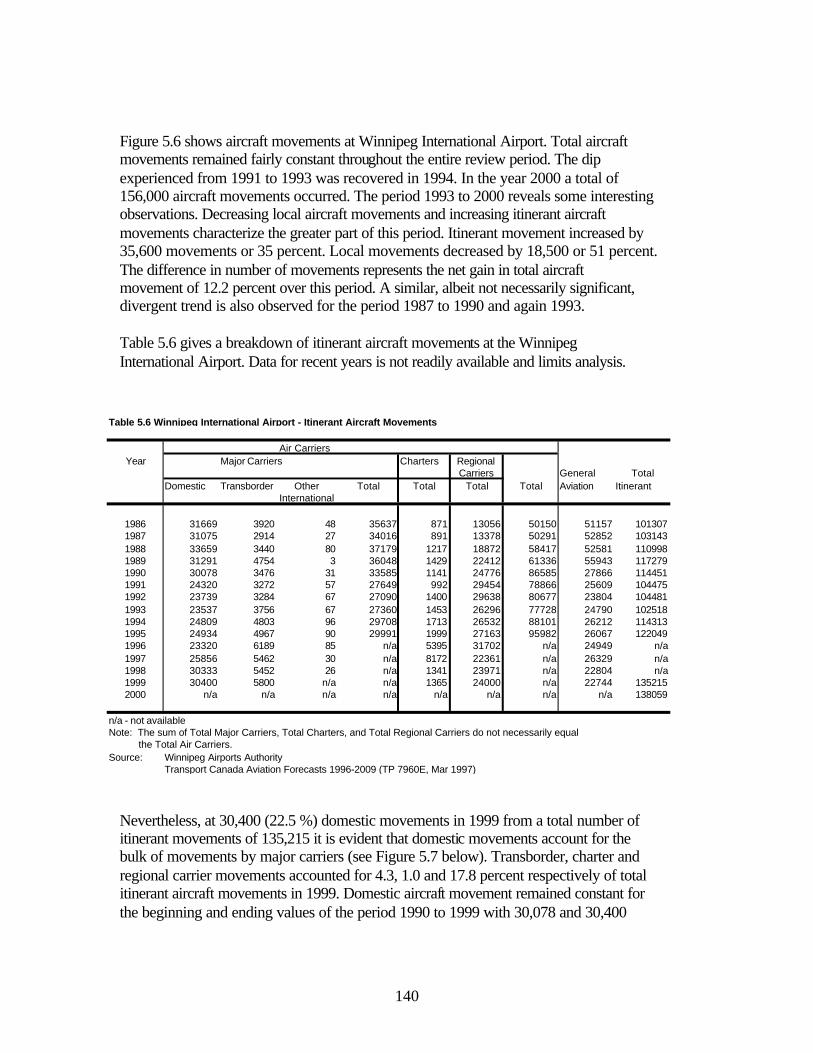
140
Figure 5.6 shows aircraft movements at Winnipeg International Airport. Total aircraft movements remained fairly constant throughout the entire review period. The dip experienced from 1991 to 1993 was recovered in 1994. In the year 2000 a total of 156,000 aircraft movements occurred. The period 1993 to 2000 reveals some interesting observations. Decreasing local aircraft movements and increasing itinerant aircraft movements characterize the greater part of this period. Itinerant movement increased by 35,600 movements or 35 percent. Local movements decreased by 18,500 or 51 percent. The difference in number of movements represents the net gain in total aircraft movement of 12.2 percent over this period. A similar, albeit not necessarily significant, divergent trend is also observed for the period 1987 to 1990 and again 1993. Table 5.6 gives a breakdown of itinerant aircraft movements at the Winnipeg International Airport. Data for recent years is not readily available and limits analysis.
Nevertheless, at 30,400 (22.5 %) domestic movements in 1999 from a total number of itinerant movements of 135,215 it is evident that domestic movements account for the bulk of movements by major carriers (see Figure 5.7 below). Transborder, charter and regional carrier movements accounted for 4.3, 1.0 and 17.8 percent respectively of total itinerant aircraft movements in 1999. Domestic aircraft movement remained constant for the beginning and ending values of the period 1990 to 1999 with 30,078 and 30,400
Table 5.6 Winnipeg International Airport - Itinerant Aircraft Movements
Air CarriersYear Major Carriers Charters Regional
Carriers General TotalDomestic Transborder Other Total Total Total Total Aviation Itinerant
International
1986 31669 3920 48 35637 871 13056 50150 51157 1013071987 31075 2914 27 34016 891 13378 50291 52852 1031431988 33659 3440 80 37179 1217 18872 58417 52581 1109981989 31291 4754 3 36048 1429 22412 61336 55943 1172791990 30078 3476 31 33585 1141 24776 86585 27866 1144511991 24320 3272 57 27649 992 29454 78866 25609 1044751992 23739 3284 67 27090 1400 29638 80677 23804 1044811993 23537 3756 67 27360 1453 26296 77728 24790 1025181994 24809 4803 96 29708 1713 26532 88101 26212 1143131995 24934 4967 90 29991 1999 27163 95982 26067 1220491996 23320 6189 85 n/a 5395 31702 n/a 24949 n/a1997 25856 5462 30 n/a 8172 22361 n/a 26329 n/a1998 30333 5452 26 n/a 1341 23971 n/a 22804 n/a1999 30400 5800 n/a n/a 1365 24000 n/a 22744 1352152000 n/a n/a n/a n/a n/a n/a n/a n/a 138059
n/a - not availableNote: The sum of Total Major Carriers, Total Charters, and Total Regional Carriers do not necessarily equal the Total Air Carriers.Source: Winnipeg Airports Authority
Transport Canada Aviation Forecasts 1996-2009 (TP 7960E, Mar 1997)

141
movements respectively. Notable is the 67 percent increase in transborder movements over this same period. Figure 5.7 shows itinerant aircraft movements for major carriers at the Winnipeg International Airport. International movements were omitted due to its relative insignificance compared to domestic and transborder data. In addition to the predominance of domestic movements and the growth in transborder movements the variability in domestic movements is illustrated.
The lowest number of domestic movements for the period under review is in 1996 at 23,320 and the highest in 1988 at 33,659. This represents a 31 percent decrease over the period where data is available.
Figure 5.7 Winnipeg International Airport Itinerant Aircraft Movements: Major Carriers
0
5,000
10,000
15,000
20,000
25,000
30,000
35,000
40,000
1986 1987 1988 1989 1990 1991 1992 1993 1994 1995 1996 1997 1998 1999
Year
Mo
vem
ents
DomesticTransborder

142
Table 5.7 and Figure 5.8 show passenger movements for 22 northern Manitoba Airports. In 1999 a total of 168,470 passengers were moved at these airports. Throughout the entire review period Island Lake was the busiest airport in terms of passenger movement. In 1999 this airport moved 45,160 passengers, although its highest total for the entire period was the previous year, when 45,980 passengers were moved. For the period 1990 to 1999 passenger traffic at Island Lake airport increased by 53 percent.
Other airports do not share a growth trend similar to that of Island Lake. During the initial part of the review period Norway House was in an unchallenged second position. In 1990 it moved 24,920 passengers, or 84 percent of the first ranked airport. In 1999 this figure dropped to 13,920 passengers or only 31 percent of the first ranked airport. It lost it’s second rank in 1995 and regained it in 1998, but only to an airport that itself closed 15.5 percent lower in 1999 than in 1990 (St. Theresa Point). Throughout the entire period Northern passenger movements increased by 5 percent, but there were large fluctuations as can be clearly seen in Figure 5.8. Figure 5.8 shows passenger movements for selected northern Manitoba airports.
Table 5.7 Northern Manitoba Airports Passenger Movement ('000)
Year Total Berens River Blood- vein Brochet Cross Lake God's Lake
Narrows God's River Ilford Island Lake Lac Brochet Little Grand Rapids Norway House
1986 160.28 10.55 3.90 7.01 10.19 10.57 0.57 29.42 4.44 7.87 23.131987 164.59 13.53 3.98 7.01 8.13 11.76 0.57 27.45 5.19 9.24 21.011988 155.64 11.20 4.33 6.60 7.23 11.38 0.62 28.28 5.11 7.60 19.021989 173.19 10.55 3.15 6.24 7.59 11.86 0.73 30.66 4.77 7.59 22.691990 166.04 10.00 3.81 4.42 8.32 9.99 4.40 0.76 29.60 3.99 7.99 24.921991 160.49 10.10 3.11 3.33 7.82 10.02 4.23 1.06 30.50 4.34 8.75 21.571992 178.71 11.36 4.78 3.31 8.26 9.00 5.24 1.20 34.44 4.46 10.04 23.791993 173.48 12.42 3.54 3.25 8.14 8.79 4.66 0.98 36.39 4.30 9.04 21.971994 177.30 12.10 3.53 3.49 8.57 11.24 5.55 1.27 33.80 5.48 10.07 24.601995 167.25 8.27 3.17 2.95 8.26 13.19 6.11 0.85 36.96 5.75 10.48 11.891996 166.74 7.34 3.57 3.15 9.33 11.35 6.05 1.29 39.86 5.17 9.93 11.761997 160.27 4.75 4.02 3.14 6.98 11.29 5.94 1.02 36.23 4.97 9.37 12.411998 163.57 3.02 3.32 3.09 4.05 8.51 6.69 1.07 45.98 4.36 9.58 14.071999 168.47 11.26 2.39 2.99 4.10 8.53 6.58 0.95 45.16 4.32 8.77 13.92
Year Oxford House Pikwi- tonei Poplar
River Pukata-wagan Red Sucker Lake
St. Theresa Point
Shamat- tawa
South Indian Lake
Tadoule Lake
Thicket Portage
York Landing
1986 11.40 1.42 5.29 3.00 5.00 14.62 5.41 2.40 0.56 0.88 2.681987 12.01 1.30 5.77 3.61 4.13 14.23 5.61 2.54 3.45 1.16 2.931988 11.38 1.20 5.52 4.28 4.09 13.84 4.64 2.08 3.08 1.17 3.001989 12.66 5.26 4.93 5.29 4.93 16.89 5.15 3.15 3.71 1.47 3.941990 9.93 1.69 4.62 2.44 5.78 14.68 5.19 3.32 3.69 1.53 4.981991 10.02 1.15 5.31 2.68 4.53 12.91 6.01 3.45 3.75 1.31 4.551992 11.51 1.17 5.76 6.06 5.89 15.17 4.85 4.13 3.83 0.66 3.821993 9.10 1.10 5.73 6.09 6.92 13.76 3.39 5.02 3.72 1.09 4.121994 9.09 0.77 6.06 4.58 7.64 12.64 4.48 4.92 3.28 0.92 3.231995 9.58 1.06 6.33 4.07 7.62 14.17 4.34 6.66 1.95 0.90 2.691996 10.16 1.15 5.62 3.72 6.52 13.94 4.97 5.41 2.26 1.29 2.901997 11.00 0.87 5.84 4.38 5.68 13.77 5.82 4.71 3.24 1.24 3.591998 11.04 0.91 6.20 3.96 6.12 13.98 6.14 3.42 3.06 0.98 4.041999 10.62 1.02 7.48 3.77 6.62 12.40 6.47 3.20 3.29 1.00 3.63
Source: Manitoba Department of Transportation and Government Services, Norhtern Airports and Marine.

143
The great variability in the total annual movement of passengers is notable from the thickest line on the figure above.
Figure 5.8 Northern Manitoba Airports Passenger Movement: Selected Airports
0
5
1015
2025
3035
4045
50
1986 1987 1988 1989 1990 1991 1992 1993 1994 1995 1996 1997 1998 1999
Year
Air
po
rt P
asse
ng
ers
('00
0)
135
140
145150
155160
165170
175180
185
To
tal P
asse
ng
ers
('00
0)
Island LakeNorway HouseSt. Theresa PointTotal

144
Cargo movements for northern Manitoba airports are depicted in Table 5.8 and Figure 5.10. A total of 10,539.8 tonnes of cargo were moved at these airports during 1999. This, however, is 31 percent lower than the peak in 1997 at 15,264.7 tonnes. Notwithstanding the two-year decline, it ended 1999 at 40 percent higher than 1990. It is unknown how much courier activity exists, therefore these quantities may not reflect 100 percent of the cargo volume being shipped through these towns.
As of 1994 Island Lake showed strong growth in cargo movement and distinguished itself as the first ranked airport in cargo movement. The second ranked cargo airport over this period is St Theresa Point. Cargo movements peaked at all of the selected airports in 1997, but only Island Lake continued to grow in 1998. Cargo declined at all of the selected airports in 1999. There were some notable, if small, exceptions: Berens River grew by almost 1100 percent, from 53 to 629 tonnes, Pikwitonei grew by 43 percent, from 86 to 123 tonnes, and Tadoule Lake and York Landing grew by just over 22 percent. These towns offered a very small proportion of the total, therefore their growth is only exceptional by its increase and not its magnitude.
Table 5.8 Northern Manitoba Airports Cargo Movement (tonnes)*
Year Total Berens River
Blood- vein
Brochet Cross Lake God's Lake Narrows
God's River Ilford Island Lake Lac Brochet Little Grand Rapids
Norway House
1986 9660.3 146.8 105.3 374.5 46.1 859.9 NA 8.8 1827.7 633.4 568.7 1083.61987 8796.6 195.8 114.7 378.8 24.0 680.6 NA 8.6 1758.9 553.3 581.4 837.21988 7744.4 146.8 94.5 415.4 21.9 561.5 NA 5.4 1418.5 490.5 362.6 349.01989 9552.5 160.0 98.5 346.9 23.3 854.4 NA 9.6 1147.6 542.0 419.9 406.81990 7535.3 99.8 127.2 288.5 40.2 523.9 300.9 14.6 1061.6 290.6 512.6 578.21991 7211.0 63.3 85.0 208.6 32.7 414.9 230.4 18.8 1172.1 613.2 483.2 416.01992 8421.8 86.5 137.7 210.7 27.5 564.0 334.4 38.1 1349.6 439.1 745.5 270.61993 7651.3 98.5 104.4 237.5 41.0 570.8 276.6 39.2 1302.4 423.2 585.7 241.51994 8151.9 107.2 96.1 140.1 66.9 642.8 243.8 27.7 1655.3 394.8 729.4 313.21995 9077.3 126.4 81.8 121.5 72.0 576.3 325.1 14.4 2584.4 420.5 621.7 131.41996 9533.2 108.3 78.7 93.1 84.8 692.6 362.5 23.3 3502.0 260.6 618.4 140.81997 15264.7 87.3 98.5 139.5 67.7 739.7 396.5 16.2 5195.6 307.8 1294.9 134.51998 12558.7 53.5 78.1 209.9 46.9 596.5 408.5 26.0 5373.2 501.8 736.5 325.91999 10539.8 628.9 57.7 143.6 49.8 864.4 425.9 12.5 3227.4 259.2 770.4 270.8
Year Oxford House
Pikwi- tonei
Poplar River
Pukatawagan
Red Sucker Lake
St. Theresa Point
Shamat- tawa
South Indian Lake
Tadoule Lake
Thicket Portage
York Landing
1986 885.5 78.5 120.8 39.2 520.4 1218.6 756.6 130.0 146.9 3.2 105.91987 966.2 66.7 237.5 76.7 276.1 1046.2 487.6 127.7 300.6 5.5 72.81988 980.8 49.5 359.0 50.2 361.5 871.4 545.2 124.9 395.7 4.8 135.21989 1242.5 293.7 408.5 12.8 405.8 907.3 1117.5 136.3 879.3 6.6 133.31990 1131.9 65.4 267.8 20.2 48.2 1031.7 571.7 174.7 222.9 7.6 155.21991 1212.6 62.7 323.6 21.3 161.2 763.8 399.0 125.1 271.0 5.2 127.31992 1282.1 57.4 354.6 55.0 495.6 955.5 447.8 164.0 273.1 1.2 131.81993 881.8 66.0 286.4 77.0 543.9 879.8 399.9 270.8 180.6 7.9 136.41994 739.4 50.1 260.8 19.7 615.9 996.7 375.3 243.6 259.6 6.5 167.01995 722.6 59.2 296.6 11.5 568.9 1164.7 594.0 266.3 225.2 4.6 88.21996 754.2 72.0 289.0 15.7 479.2 1024.3 495.1 206.7 128.8 7.2 95.91997 1314.9 59.3 326.4 9.8 1029.1 3112.2 529.0 139.8 159.9 5.0 101.11998 1080.1 86.3 255.7 2.1 779.0 1180.2 420.1 88.8 181.1 4.3 124.21999 921.6 123.6 279.0 1.0 518.7 1071.3 482.6 52.3 221.5 2.9 154.7
*Note: Gods River started reporting in April, 1990. Source: Manitoba Department of Transportation and Government Services, Norhtern Airports and Marine.

145
Figure 5.9 shows the cargo movement for the selected northern Manitoba airports.
The initial growth in total annual cargo movements for the period 1994 to 1997 and the subsequent slump are evident from the total line graph.
Figure 5.9 Northern Manitoba Airports Cargo Movement: Selected Airports
0
1000
2000
3000
4000
5000
6000
1986
1987
1988
1989
1990
1991
1992
1993
1994
1995
1996
1997
1998
1999
Year
Air
po
rt C
arg
o (
To
nn
es)
0
3,000
6,000
9,000
12,000
15,000
18,000
To
tal C
arg
o (
To
nn
es)
Island LakeSt. Theresa PointTotal
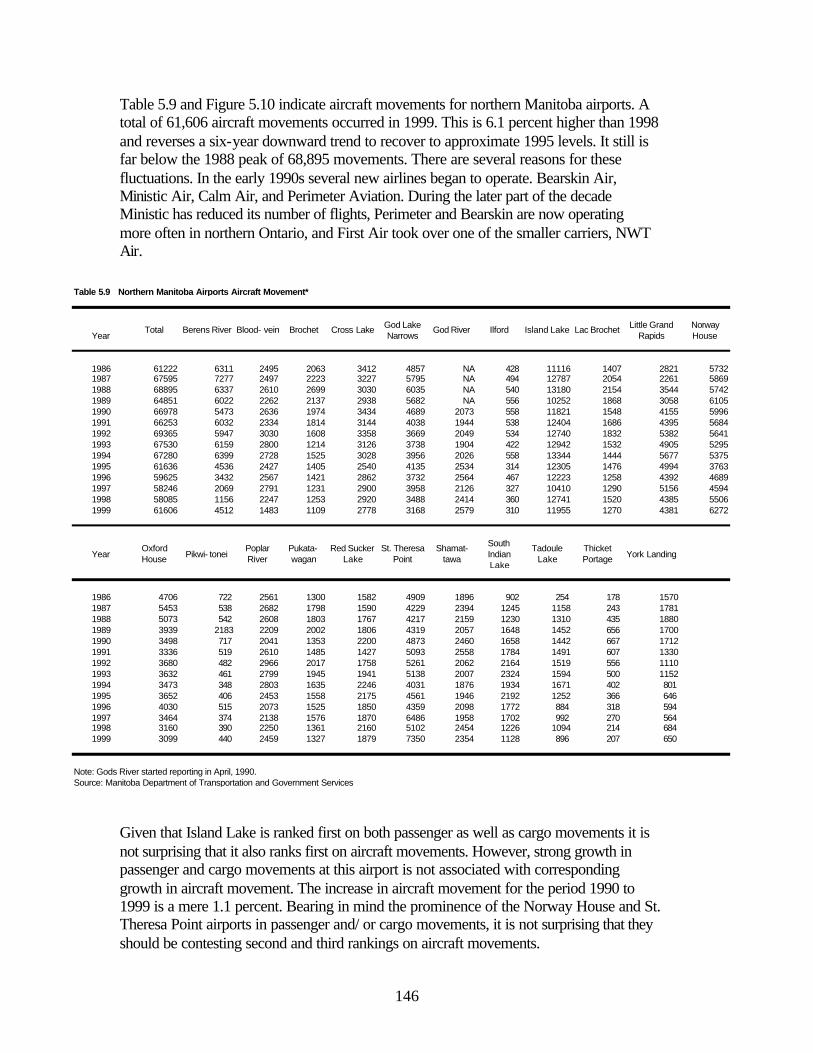
146
Table 5.9 and Figure 5.10 indicate aircraft movements for northern Manitoba airports. A total of 61,606 aircraft movements occurred in 1999. This is 6.1 percent higher than 1998 and reverses a six-year downward trend to recover to approximate 1995 levels. It still is far below the 1988 peak of 68,895 movements. There are several reasons for these fluctuations. In the early 1990s several new airlines began to operate. Bearskin Air, Ministic Air, Calm Air, and Perimeter Aviation. During the later part of the decade Ministic has reduced its number of flights, Perimeter and Bearskin are now operating more often in northern Ontario, and First Air took over one of the smaller carriers, NWT Air.
Given that Island Lake is ranked first on both passenger as well as cargo movements it is not surprising that it also ranks first on aircraft movements. However, strong growth in passenger and cargo movements at this airport is not associated with corresponding growth in aircraft movement. The increase in aircraft movement for the period 1990 to 1999 is a mere 1.1 percent. Bearing in mind the prominence of the Norway House and St. Theresa Point airports in passenger and/ or cargo movements, it is not surprising that they should be contesting second and third rankings on aircraft movements.
Table 5.9 Northern Manitoba Airports Aircraft Movement*
YearTotal Berens River Blood- vein Brochet Cross Lake God Lake
NarrowsGod River Ilford Island Lake Lac Brochet Little Grand
RapidsNorway House
1986 61222 6311 2495 2063 3412 4857 NA 428 11116 1407 2821 57321987 67595 7277 2497 2223 3227 5795 NA 494 12787 2054 2261 58691988 68895 6337 2610 2699 3030 6035 NA 540 13180 2154 3544 57421989 64851 6022 2262 2137 2938 5682 NA 556 10252 1868 3058 61051990 66978 5473 2636 1974 3434 4689 2073 558 11821 1548 4155 59961991 66253 6032 2334 1814 3144 4038 1944 538 12404 1686 4395 56841992 69365 5947 3030 1608 3358 3669 2049 534 12740 1832 5382 56411993 67530 6159 2800 1214 3126 3738 1904 422 12942 1532 4905 52951994 67280 6399 2728 1525 3028 3956 2026 558 13344 1444 5677 53751995 61636 4536 2427 1405 2540 4135 2534 314 12305 1476 4994 37631996 59625 3432 2567 1421 2862 3732 2564 467 12223 1258 4392 46891997 58246 2069 2791 1231 2900 3958 2126 327 10410 1290 5156 45941998 58085 1156 2247 1253 2920 3488 2414 360 12741 1520 4385 55061999 61606 4512 1483 1109 2778 3168 2579 310 11955 1270 4381 6272
YearOxford House Pikwi- tonei
Poplar River
Pukata- wagan
Red Sucker Lake
St. Theresa Point
Shamat- tawa
South Indian Lake
Tadoule Lake
Thicket Portage York Landing
1986 4706 722 2561 1300 1582 4909 1896 902 254 178 15701987 5453 538 2682 1798 1590 4229 2394 1245 1158 243 17811988 5073 542 2608 1803 1767 4217 2159 1230 1310 435 18801989 3939 2183 2209 2002 1806 4319 2057 1648 1452 656 17001990 3498 717 2041 1353 2200 4873 2460 1658 1442 667 17121991 3336 519 2610 1485 1427 5093 2558 1784 1491 607 13301992 3680 482 2966 2017 1758 5261 2062 2164 1519 556 11101993 3632 461 2799 1945 1941 5138 2007 2324 1594 500 11521994 3473 348 2803 1635 2246 4031 1876 1934 1671 402 8011995 3652 406 2453 1558 2175 4561 1946 2192 1252 366 6461996 4030 515 2073 1525 1850 4359 2098 1772 884 318 5941997 3464 374 2138 1576 1870 6486 1958 1702 992 270 5641998 3160 390 2250 1361 2160 5102 2454 1226 1094 214 6841999 3099 440 2459 1327 1879 7350 2354 1128 896 207 650
Note: Gods River started reporting in April, 1990.Source: Manitoba Department of Transportation and Government Services

147
Figure 5.10 depicts aircraft movement for selected northern Manitoba airports.
The downward trend in aircraft movements at Island Lake airport in the latter 1990’s is notable in view of the increase in total passenger and cargo movements for the corresponding period. These individual trends are less significant than the overall industry trend of consolidation and streamlining that was mentioned previously.
Figure 5.10 Northern Manitoba Airports Aircraft Movements: Selected Airports
0
2,000
4,000
6,000
8,000
10,000
12,000
14,000
16,000
1986
1987
1988
1989
1990
1991
1992
1993
1994
1995
1996
1997
1998
1999
Year
Air
po
rt M
ove
men
ts
56,000
58,000
60,000
62,000
64,000
66,000
68,000
70,000
72,000
To
tal M
ove
men
ts
Island LakeNorway House
St. Theresa PointTotal

148
Table 5.10 shows total enplaned/ deplaned passenger movements for northern Manitoba Transport Canada airports.
Aircraft movement at Transport Canada northern airports is depicted in Table 5.11.
Table 5.10 Transport Canada Northern Airports Passenger Movement --Total Enplaned/Deplaned
Year Brandon Churchill Dauphin Flin Flon Gillam Lynn Lake The Pas Thompson
1986 3620 2860 1400 1490 1780 1760 1570 93301987 37400 28700 900 15800 15700 12900 19000 975001988 19000 34700 1100 17400 14800 11200 21900 1097001989 11300 31600 2500 15000 14500 8300 20000 984001990 8200 31600 4000 13600 15200 5800 19200 951001991 200 22800 2100 13600 11800 3800 15200 905001992 x 19900 3000 15900 9800 2900 14900 954001993 x 16998 x 13649 7070 x 13544 992241994 x 18341 x 11657 6604 x 15817 994671995 x 19617 x 13215 7551 x 17531 1133541996 x 19069 x 13433 x x 20089 1052331997 n/a n/a n/a n/a n/a n/a n/a n/a1998 n/a n/a n/a n/a n/a n/a n/a n/a1999 n/a n/a n/a n/a n/a n/a n/a n/a2000 n/a n/a n/a n/a n/a n/a n/a n/a
Note: x - confidentialSource: Transport Canada, Aviation Statistics Centre personnel.
Table 5.11 Transport Canada Northern Airports Aircraft Movement
Year Brandon Churchill Dauphin Flin Flon Gillam Lynn Lake The Pas Thompson
1986 38192 7872 15016 4018 6088 11479 5081 379901987 32025 8488 12679 3736 5540 11170 4526 423611988 30262 9357 14950 3838 4470 10638 5233 413191989 34893 7815 14694 4324 5201 9159 5414 408501990 36616 6440 13308 6635 4684 8386 7166 376091991 24088 6923 10372 4118 4857 7965 3890 372581992 19649 6210 9222 4834 4144 6677 4620 346191993 21657 6221 9898 4041 3076 6520 5066 372151994 22482 7098 NA 4445 3351 6766 4652 361891995 21250 5912 NA 5235 2885 4370 4141 345211996 20163 6702 NA 4444 2993 2576 2652 333951997 n/a n/a n/a n/a n/a n/a n/a n/a1998 n/a n/a n/a n/a n/a n/a n/a n/a1999 n/a n/a n/a n/a n/a n/a n/a n/a2000 n/a n/a n/a n/a n/a n/a n/a n/a
Note: NA - not availableSource: Transport Canada, Aircraft Movement Statistics (TP-577), and Aviation Statistics Centre.
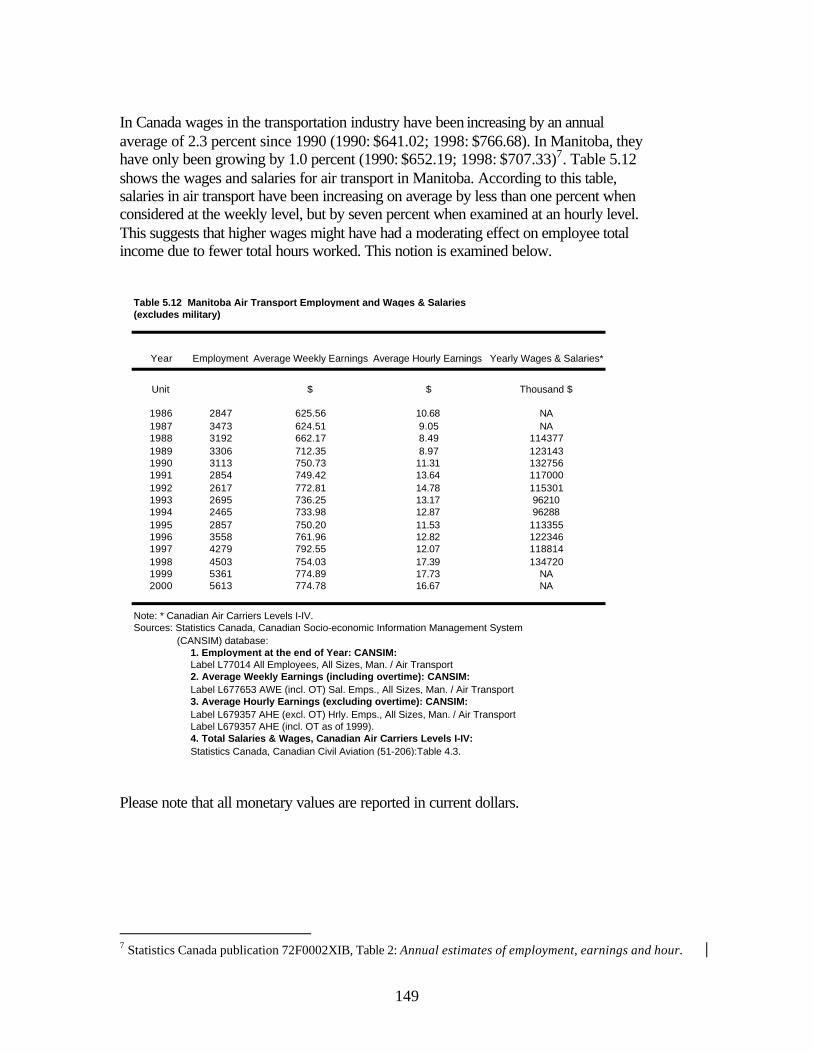
149
In Canada wages in the transportation industry have been increasing by an annual average of 2.3 percent since 1990 (1990: $641.02; 1998: $766.68). In Manitoba, they have only been growing by 1.0 percent (1990: $652.19; 1998: $707.33)7. Table 5.12 shows the wages and salaries for air transport in Manitoba. According to this table, salaries in air transport have been increasing on average by less than one percent when considered at the weekly level, but by seven percent when examined at an hourly level. This suggests that higher wages might have had a moderating effect on employee total income due to fewer total hours worked. This notion is examined below.
Please note that all monetary values are reported in current dollars. 7 Statistics Canada publication 72F0002XIB, Table 2: Annual estimates of employment, earnings and hour.
Table 5.12 Manitoba Air Transport Employment and Wages & Salaries(excludes military)
Year Employment Average Weekly Earnings Average Hourly Earnings Yearly Wages & Salaries*
Unit $ $ Thousand $
1986 2847 625.56 10.68 NA1987 3473 624.51 9.05 NA1988 3192 662.17 8.49 1143771989 3306 712.35 8.97 1231431990 3113 750.73 11.31 1327561991 2854 749.42 13.64 1170001992 2617 772.81 14.78 1153011993 2695 736.25 13.17 962101994 2465 733.98 12.87 962881995 2857 750.20 11.53 1133551996 3558 761.96 12.82 1223461997 4279 792.55 12.07 1188141998 4503 754.03 17.39 1347201999 5361 774.89 17.73 NA2000 5613 774.78 16.67 NA
Note: * Canadian Air Carriers Levels I-IV.Sources: Statistics Canada, Canadian Socio-economic Information Management System (CANSIM) database:
1. Employment at the end of Year: CANSIM:Label L77014 All Employees, All Sizes, Man. / Air Transport2. Average Weekly Earnings (including overtime): CANSIM:Label L677653 AWE (incl. OT) Sal. Emps., All Sizes, Man. / Air Transport3. Average Hourly Earnings (excluding overtime): CANSIM:Label L679357 AHE (excl. OT) Hrly. Emps., All Sizes, Man. / Air TransportLabel L679357 AHE (incl. OT as of 1999).4. Total Salaries & Wages, Canadian Air Carriers Levels I-IV:Statistics Canada, Canadian Civil Aviation (51-206):Table 4.3.

150
Figures 5.11 and 5.12 graphically illustrate air transportation employment and wages and salaries in Manitoba.
* Refer to Table 5.12.
A distinctive change in employment trends is observed in 1994. This is the year that a downward trend bottomed-out at 2,465 and thereafter set upon an upward trend. In the
Figure 5.11 Manitoba Air Transport Employment and Wages and Salaries (excludes military)
0
1,000
2,000
3,000
4,000
5,000
6,000
1986
1987
1988
1989
1990
1991
1992
1993
1994
1995
1996
1997
1998
1999
2000
Year
Em
plo
ymen
t
0
25,000
50,000
75,000
100,000
125,000
150,000
Yea
rly
Wag
es &
Sal
arie
s ($
'000
)
Employment
Yearly Wages &Salaries*
Figure 5.12 Manitoba Air Transport Employment and Wages and Salaries (excludes military)
0
1000
2000
3000
4000
5000
6000
1986
1987
1988
1989
1990
1991
1992
1993
1994
1995
1996
1997
1998
1999
2000
Year
Em
ploy
men
t
8
10
12
14
16
18
20
Hou
rly
Wag
es ($
)
Employment
Average HourlyEarnings

151
year 2000 it had increased by 128 percent to 5,613 employees. Yearly wages and salaries followed a trend similar to that of employment. It is, however, noticeable that during the period 1994 to 1998 employment grew by 83 percent whilst yearly wages and salaries grew by only 40 percent. Along with results shown from earlier periods this illustrates the lag-effect and inverse relationship in salaries and employment. A fairly moderate increase in average weekly income is observed for the period 1994 to 1997. During this time average hourly income declined in every year except for an increase of 44 percent in 1997. These figures suggest flexibility in total hours worked to buffer weekly income in view of lower hourly rates.

152
The indirect air transportation tax is depicted in Table 5.13. Although the amount collected with the air transport tax has been increasing, its proportion of the total indirect taxes collected has been falling due to an even larger increase in the amount of indirect taxes.
Table 5.13 Manitoba Indirect Air Transportation Tax ($million)
YearIndirect Air
Transport TaxTotal Indirect Tax Percentage
1986 16 1364 1.171987 20 1496 1.341988 23 1651 1.391989 23 1725 1.331990 24 1729 1.391991 20 1760 1.141992 21 1933 1.091993 24 2019 1.191994 21 2169 0.971995 21 2210 0.951996 24 2257 1.061997 NA NA NA1998 NA NA NA1999 NA NA NA2000 NA NA NA
Sources: Statistics Canada, Canadian Socio-economic Information Management System (CANSIM) database:
Label D12303 Indirect Taxes Manitoba / Air Transportation TaxLabel D42298 Indirect Taxes Manitoba / Total - Provincial Indirect Taxes

153
Aircraft gasoline sales, fuel tax and fuel price index is shown in Table 5.14. Due to the mobility and flexibility of air service, fuel taxes affect aircraft landings. The marginal users of Manitoba’s airports (of which Winnipeg has 85% of passengers) can choose to land in more airline friendly locations that have reduced aviation fuel taxes.
Aviation fuel sales declined during periods of economic downturn. This is noticeable during the early 1990’s. In the year 2000 6.36 million cubic meters of fuel were sold in Canada. Since 1997 the aviation fuel tax in Manitoba has been 3.2 cents per litre.
Table 5.14 Aircraft Gasoline Sales, Fuel Tax and Gasoline Price Index
YearCanada Net
Sales* ('000 cu.m)
Manitoba Fuel Tax (Cents / Litre)
Price Index** (1992 = 100)
1986 4542 4.8 93.51987 4836 4.8 91.71988 5234 5.8 87.01989 5356 5.8 95.21990 5167 5.8 110.41991 4616 5.8 106.41992 4758 5.0 100.01993 4556 4.2 104.81994 4808 4.2 105.61995 5160 4.2 110.31996 5765 4.2 115.01997 5911 3.2 115.81998 6074 3.2 108.21999 6361 3.2 116.12000 6363 3.2 134.1
* Net Sales in total for the year.** CPI for gasolineSources: Statistics Canada, Canadian Socio-economic Information Management System (CANSIM) database:For Canada Net Sales:Label D2546 Refined Petroleum Prod - net sales in Canada - aviation.For Price Index:Label P207074 CPI 1992=100 Gasoline, Manitoba.For Fuel Tax:Manitoba Provincial Director of Taxation Management and Research

154
Table 5.15 shows the income statement for Canadian air carriers level IB-IV for Manitoba.
The operating ratio of the Manitoba air carriers has been relatively high throughout the 1990’s. Final year in the period produced a large operating loss.
Table 5.15 Manitoba Income Statement for Canadian Air Carriers Levels IB-IV ($000)
Year 1991 1992 1993 1994 1995 1996 1997 1998
Operating revenuesScheduled services 44980 37068 40163 39788 39330 50276 53960 63298-passengers 33312 26265 28822 28311 31789 38470 45947 50377-goods 11668 10803 11341 11476 7541 11806 8013 12921Charter services 34573 29508 26740 28790 40942 37613 34575 41673-passengers 21293 19634 19335 23391 31486 31233 32713 39044-goods 13280 9874 7405 5399 9456 6380 1862 2630Other flying services 204 258 244 260 24 - 7757 16418Subsidies 0 0 0 0 - - - -Net incidental air transport related revenue 2240 3891 1345 1724 2913 3317 1207 1934Total operating revenues 81997 70726 68492 70561 83209 91206 97499 123324
Operating expensesMaintenance, ground property and equipment 927 1083 1170 868 2541 1694 6770 11502Aircraft operations 26754 24042 25795 27904 31613 35983 35154 52477Maintenance, flight equipment 22385 21023 16882 18220 19558 20504 20754 24575General services and administration 18359 17681 16443 18203 18956 21204 24002 33711Depreciation 5233 4661 5310 4936 5459 6702 6474 7009Total operating expenses 73657 68490 65591 70131 78126 86087 93154 129275
Operating income (loss) 8340 2236 2901 430 5083 5119 4346 -5950
Operating Ratio (%) 90 97 96 99 94 94 96 105
Non-Operating income (expenses)Capital gains (losses),net -6 -209 496 222 102 6 382 3Interest and discount income 12 56 156 105 - -63 101 166Interest expenses 1470 884 936 1291 2086 2574 3270 3498Miscellaneous non-operating income (expenses),net 993 635 1188 806 6638 6121 186 14Total non-operating income (expenses),net -1080 -662 747 -85 4490 3636 -1699 -5310
Income (loss) before provision for income taxes 7259 1573 3649 345 9574 8755 2647 -11260Provision for income taxes (tax refund) 1305 70 564 207 1802 1666 525 425
Net income (loss) 5954 1503 3085 137 7772 7088 2121 -11685
Note: Data for 1986 and 1987 is unavailable.Source: Statistics Canada, Canadian Civil Aviation, (51-206): Table 3.5.

155
Figure 5.13 charts operating statistics for Canadian air carriers levels IB to IV in Manitoba from 1991 to 1998. As of 1994 operating revenues showed an upward trend, as did operating expenses. In 1998, total operating expenses surpassed total operating revenues for the first time, resulting in operational and net losses, something they had not seen in many years.
Figure 5.13 Manitoba Income Statement for Canadian Air Carriers Levels IB-IV
-20,000
0
20,000
40,000
60,000
80,000
100,000
120,000
140,000
1991 1992 1993 1994 1995 1996 1997 1998
Year
($00
0)
Total operating revenuesTotal operating expensesOperating income (loss)Net income (loss)

156
Table 5.16 and Figures 5.14 and 5.15 show the passenger and goods revenue for the Canadian air carriers levels I-IV for Manitoba.
As of 1993 passenger revenue steadily increased over the remainder of the review period. Goods revenue shows large fluctuations, especially during the late 1980’s and early
Table 5.16 Manitoba Passenger and Goods Revenue for Canadian Air Carriers Levels I-IV ($000)
Year Passenger Revenue Goods Revenue Passenger:Goods
1986 NA NA NA1987 NA NA NA1988 221493 26380 8.401989 232268 32665 7.111990 246724 46091 5.351991 205111 32399 6.331992 178981 24480 7.311993 189362 37119 5.101994 230388 28041 8.221995 252959 39832 6.351996 288969 34184 8.451997 308235 33290 9.261998 407670 30242 13.481999 NA NA NA
Source: Statistics Canada, Canadian Civil Aviation, (51-206): Table 3.6.
Figure 5.14 Manitoba Passenger and Goods Revenue for Canadian Air Carriers Levels I-IV
0
100,000
200,000
300,000
400,000
500,000
1988
1989
1990
1991
1992
1993
1994
1995
1996
1997
1998
Year
Pas
sen
ger
Rev
enu
e ($
'000
)
0
10,000
20,000
30,000
40,000
50,000
Go
od
s R
even
ue
($'0
00)
Passenger Revenue
Goods Revenue
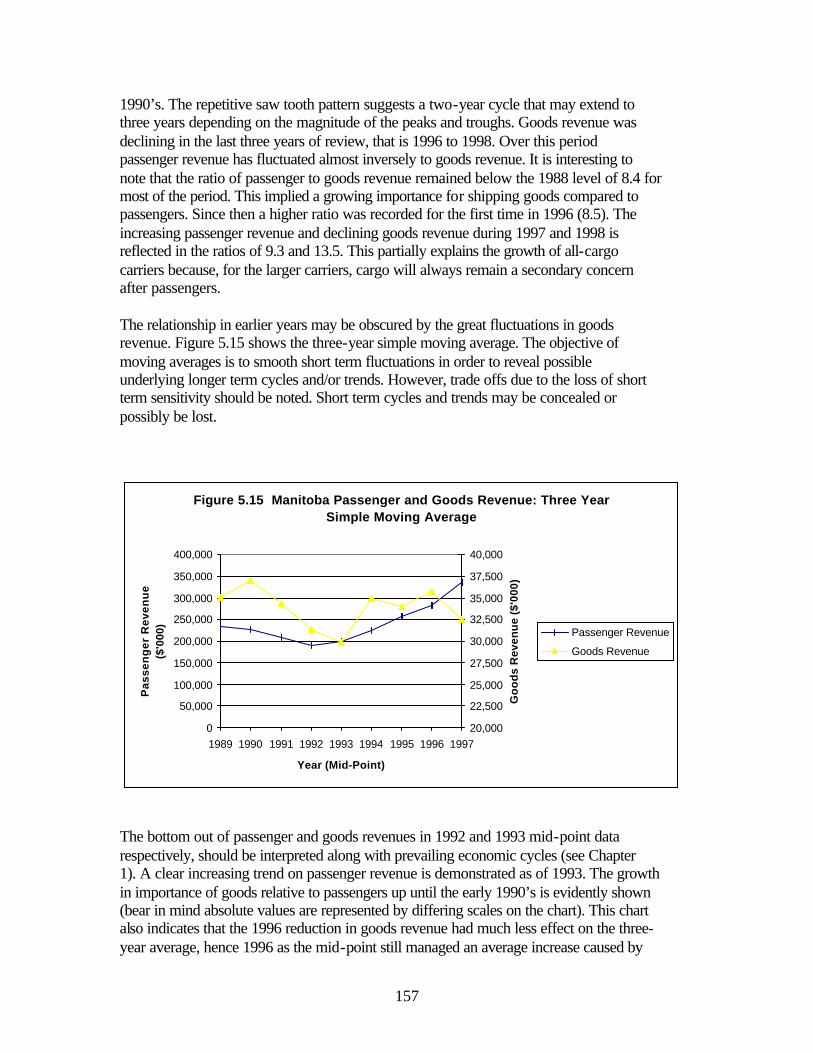
157
1990’s. The repetitive saw tooth pattern suggests a two-year cycle that may extend to three years depending on the magnitude of the peaks and troughs. Goods revenue was declining in the last three years of review, that is 1996 to 1998. Over this period passenger revenue has fluctuated almost inversely to goods revenue. It is interesting to note that the ratio of passenger to goods revenue remained below the 1988 level of 8.4 for most of the period. This implied a growing importance for shipping goods compared to passengers. Since then a higher ratio was recorded for the first time in 1996 (8.5). The increasing passenger revenue and declining goods revenue during 1997 and 1998 is reflected in the ratios of 9.3 and 13.5. This partially explains the growth of all-cargo carriers because, for the larger carriers, cargo will always remain a secondary concern after passengers. The relationship in earlier years may be obscured by the great fluctuations in goods revenue. Figure 5.15 shows the three-year simple moving average. The objective of moving averages is to smooth short term fluctuations in order to reveal possible underlying longer term cycles and/or trends. However, trade offs due to the loss of short term sensitivity should be noted. Short term cycles and trends may be concealed or possibly be lost.
The bottom out of passenger and goods revenues in 1992 and 1993 mid-point data respectively, should be interpreted along with prevailing economic cycles (see Chapter 1). A clear increasing trend on passenger revenue is demonstrated as of 1993. The growth in importance of goods relative to passengers up until the early 1990’s is evidently shown (bear in mind absolute values are represented by differing scales on the chart). This chart also indicates that the 1996 reduction in goods revenue had much less effect on the three-year average, hence 1996 as the mid-point still managed an average increase caused by
Figure 5.15 Manitoba Passenger and Goods Revenue: Three Year Simple Moving Average
0
50,000
100,000
150,000
200,000
250,000
300,000
350,000
400,000
1989 1990 1991 1992 1993 1994 1995 1996 1997
Year (Mid-Point)
Pas
sen
ger
Rev
enu
e ($
'000
)
20,000
22,500
25,000
27,500
30,000
32,500
35,000
37,500
40,000
Go
od
s R
even
ue
($'0
00)
Passenger Revenue
Goods Revenue

158
the 1995 spike. However, mid-point 1997 registered a strong decline on average following three successive years of decline in 1996, 1997 and 1998. Please bear in mind that this data covers a limited time series. Many more data points are required to adequately investigate the longer term trends and cycles of these parameters. Also, please refer to the caveats on official cargo data discussed elsewhere in this chapter. Notably, gaps in official cargo data and airport site statistics could alter observed from actual trends. Furthermore, a changing goods composition could further exacerbate existing distortions.

159
6 PIPELINES This chapter gives an overview of statistics on pipelines as a mode of transport. Data refers to natural resources of energy, specifically gas and oil. The inaccessibility of production areas by conventional modes of transport often limits options to pipelines only. Furthermore, even when alternatives are available pipelines remain the preferred mode of transport. This is evident from exports to the USA. These factors illustrate the importance of pipelines to the regional and ultimately national economies. The development of international demand for renewable natural resources such as water creates potential for expanded trade. Along with these opportunities the demand for transportation of liquids will increase. Since the northern areas of Canada and specifically Manitoba is well endowed with water and also given the inaccessibility of vast areas, pipelines as the mode of transport is of strategic value. It should be noted though that this industry is only in a conceptual phase and subject to many regulatory, environmental impact and social matters. Also, careful consideration is needed of the impact this will have on industries competing for the same resources. In this case aquaculture/fishing, eco-tourism and the hydro energy industries amongst others are implied. Table 6.1 and Figure 6.1 show national revenues, expenses and operating revenues for the natural gas industry.
Table 6.1 Natural Gas Industry: National Revenues, Expenses and Annual Operating Ratios
Year Revenues Expenses Operating Ratio (%)
--------------$million--------------
1986 12500.0 10591.7 851987 10840.2 8955.6 831988 10879.0 9046.6 831989 11094.6 8985.6 811990 11411.2 9368.1 821991 11276.1 9000.8 801992 11599.2 9184.3 791993 12645.7 9918.8 781994 12646.5 9532.5 751995 12646.5 9532.5 751996 13499.1 10044.3 741997 14069.1 10662.5 761998 13501.7 10305.8 761999 14783.4 11537.0 78
Source: Statistics Canada, Gas Utilities (57-205): Text Table 1.
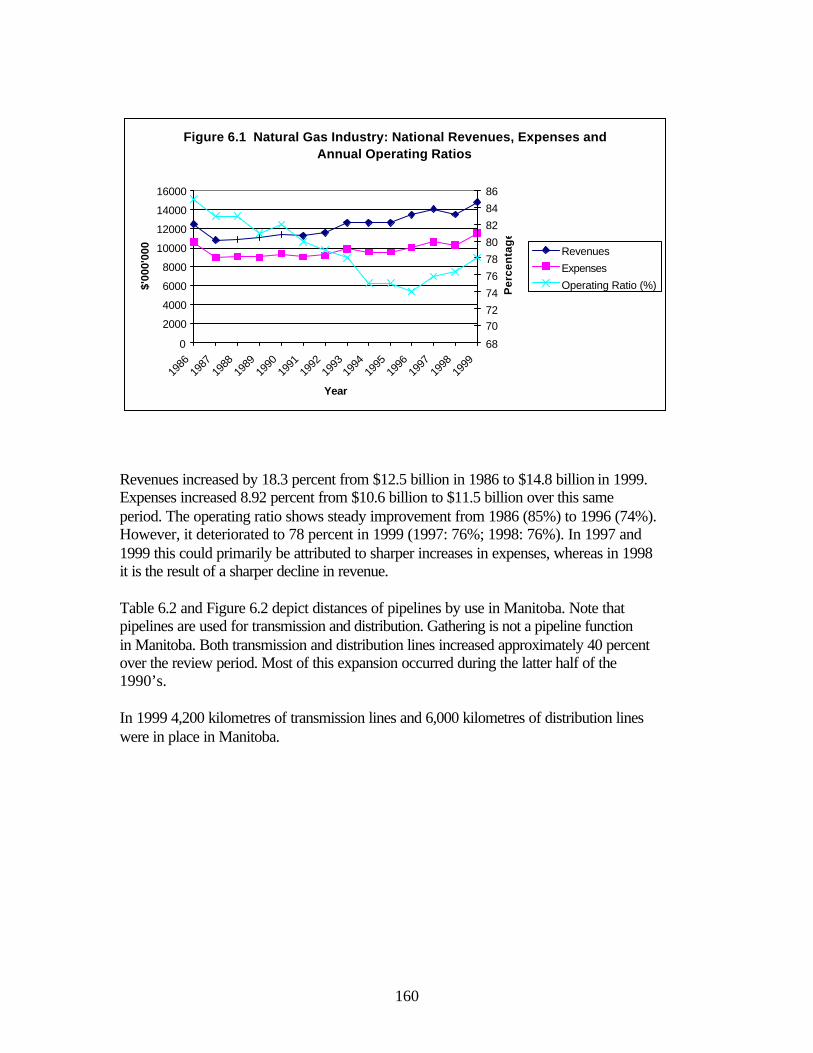
160
Revenues increased by 18.3 percent from $12.5 billion in 1986 to $14.8 billion in 1999. Expenses increased 8.92 percent from $10.6 billion to $11.5 billion over this same period. The operating ratio shows steady improvement from 1986 (85%) to 1996 (74%). However, it deteriorated to 78 percent in 1999 (1997: 76%; 1998: 76%). In 1997 and 1999 this could primarily be attributed to sharper increases in expenses, whereas in 1998 it is the result of a sharper decline in revenue. Table 6.2 and Figure 6.2 depict distances of pipelines by use in Manitoba. Note that pipelines are used for transmission and distribution. Gathering is not a pipeline function in Manitoba. Both transmission and distribution lines increased approximately 40 percent over the review period. Most of this expansion occurred during the latter half of the 1990’s. In 1999 4,200 kilometres of transmission lines and 6,000 kilometres of distribution lines were in place in Manitoba.
Figure 6.1 Natural Gas Industry: National Revenues, Expenses and Annual Operating Ratios
0
2000
4000
6000
8000
10000
12000
14000
16000
1986
1987
1988
1989
1990
1991
1992
1993
1994
1995
1996
1997
1998
1999
Year
$'00
0'00
0
68
707274767880828486
Per
cen
tag
e
RevenuesExpensesOperating Ratio (%)

161
Table 6.2 Manitoba Pipelines in Place ('000 Km)
Year Gathering Transmission Distribution Total
1986 0 3.0 4.4 7.41987 0 3.0 4.5 7.51988 0 3.0 4.6 7.61989 0 3.1 3.8 6.91990 0 3.3 3.9 7.21991 0 3.4 3.9 7.31992 0 3.6 4.0 7.61993 0 3.7 4.1 7.81994 0 3.7 4.2 7.91995 0 3.8 4.4 8.21996 0 4.2 4.6 8.81997 0 4.2 5.2 9.51998 0 4.2 5.8 10.01999 0 4.2 6.0 10.2
Source: Statistics Canada, Gas Utilities (57-205): Table 5(1996-99), Table 7.
Figure 6.2 Pipelines in Manitoba
0
2
4
6
8
10
12
1986
1987
1988
1989
1990
1991
1992
1993
1994
1995
1996
1997
1998
1999
Year
'000
km
Transmission
Distribution
Total

162
Table 6.3 gives a breakdown of transmission pipelines in Manitoba by outside diameter. Pipelines of 532 millimetres and over diameter make up more than 63 percent of all transmission lines.
Table 6.4 gives a breakdown of distribution pipelines in Manitoba by outside diameter.
Pipelines of diameter up to 75 millimetres make up more than 70 percent of distribution lines. The share of the second largest category of 76 to 150 millimetres diameter is 18.5 percent.
Table 6.3 Manitoba Pipe Line Distance (in Km) by Size of Pipe, Transmission, All Systems, Outside Diameter (mm)
Year 0-75 76-150 151-226 227-328 329-531 532 and over Total
1986 66.5 497.1 314.4 169.8 20.1 1927.3 2995.21987 241.7 483.0 149.2 169.1 20.1 1927.3 2990.41988 247.7 483.4 149.2 70.5 118.1 1927.3 2996.21989 273.0 483.4 149.2 70.5 118.1 1980.9 3075.11990 318.0 528.4 149.2 168.5 20.1 2097.8 3282.01991 244.2 557.6 107.4 193.8 40.0 2222.3 3365.31992 261.7 576.1 107.4 97.5 136.4 2376.0 3555.11993 265.4 576.1 107.4 97.5 136.4 2493.7 3676.51994 261.7 576.1 107.4 97.5 136.4 2493.7 3672.81995 286.6 612.0 137.8 105.0 136.4 2544.9 3822.71996 336.6 742.0 136.8 221.4 40.0 2684.7 4161.51997 369.9 774.1 136.8 221.4 40.0 2699.3 4241.51998 369.9 774.1 136.8 221.4 40.0 2699.3 4241.51999 369.9 774.1 136.8 221.4 40.0 2699.3 4241.5
Source: Statistics Canada, Gas Utilities (57-205): Table 4(1997-1999), Table 6.
Table 6.4 Manitoba Pipe Line Distance (in Km) by Size of Pipe, Distribution, Outside Diameter (mm)
Year 0-75 76-150 151-226 227-328 329-531 532 and over Total
1986 3486.4 601.6 253.1 38.0 48.3 4427.41987 3546.2 609.4 254.5 37.9 48.3 4496.31988 3592.7 624.8 254.8 37.9 48.3 4558.51989 2921.7 594.8 244.5 37.9 48.3 3847.21990 3021.7 594.8 244.5 37.9 48.3 3947.21991 2948.4 681.7 218.7 38.0 61.0 3947.81992 3012.4 694.2 222.0 38.0 61.2 4027.81993 3110.6 694.2 222.0 38.0 61.2 4126.01994 3168.3 694.2 222.0 38.0 61.2 4183.71995 3326.0 789.0 222.0 38.0 61.0 4436.01996 3481.0 819.0 225.0 38.0 61.0 4624.01997 3934.9 897.4 288.1 38.0 61.0 5219.41998 4083.7 1077.9 531.0 38.0 61.0 - 5791.61999 4235.7 1103.9 531.0 38.0 61.0 - 5969.6
Source: Statistics Canada, Gas Utilities (57-205): Table 4(1997-1999), Table 6.
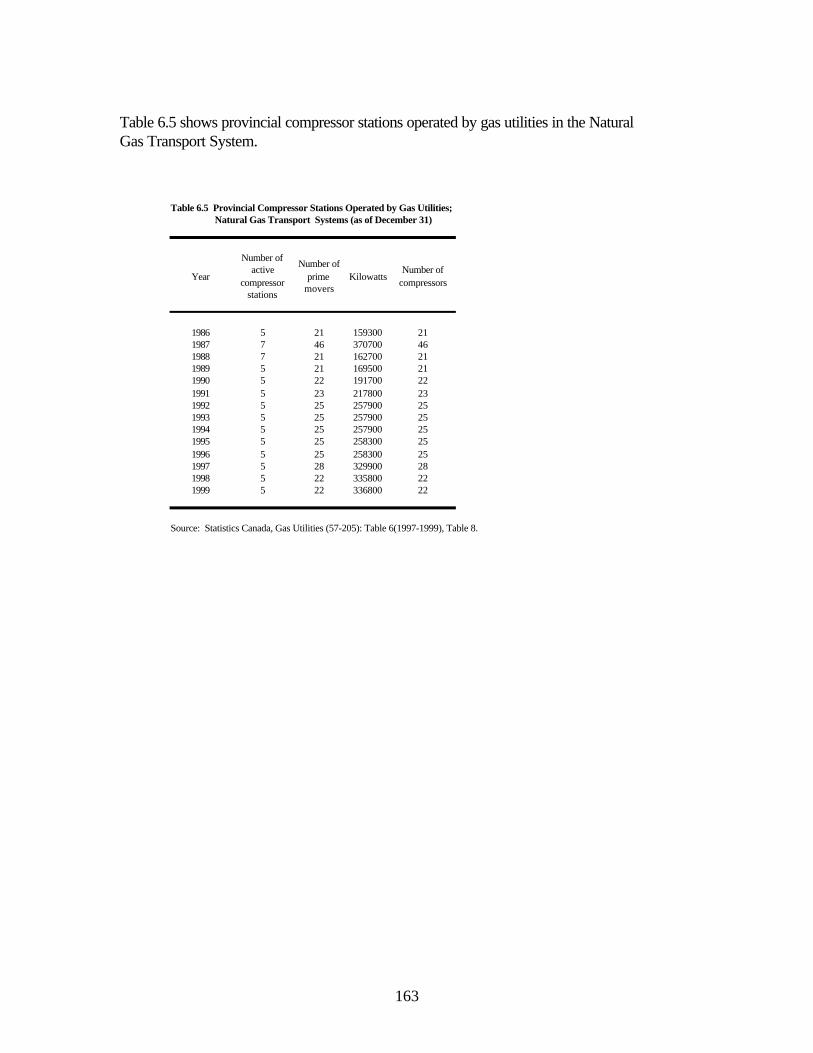
163
Table 6.5 shows provincial compressor stations operated by gas utilities in the Natural Gas Transport System.
Table 6.5 Provincial Compressor Stations Operated by Gas Utilities; Natural Gas Transport Systems (as of December 31)
Year
Number of active
compressor stations
Number of prime
moversKilowatts
Number of compressors
1986 5 21 159300 211987 7 46 370700 461988 7 21 162700 211989 5 21 169500 211990 5 22 191700 221991 5 23 217800 231992 5 25 257900 251993 5 25 257900 251994 5 25 257900 251995 5 25 258300 251996 5 25 258300 251997 5 28 329900 281998 5 22 335800 221999 5 22 336800 22
Source: Statistics Canada, Gas Utilities (57-205): Table 6(1997-1999), Table 8.

164
Table 6.6 shows natural gas inflows to Manitoba. As of 1993 gas inflows to Manitoba resulted exclusively from transfers from other provinces. In 1999 70 billion cubic metres of natural gas were transferred from other provinces to Manitoba, more than double the 33 billion cubic metres of 1986.
Table 6.7 and Figure 6.3 show natural gas outflows from Manitoba.
Table 6.6 Manitoba Natural Gas Inflows ('000 cu.m.)
Received Transfers fromYear Production Imports Other Receipts From Storage Other Provinces Total
1986 168 32820764 328209321987 2817 32497808 325006251988 3024 37419475 374224991989 2886 39072214 390750801990 859 41653140 416539991991 10 45271632 452716421992 158 52499930 525000881993 58083030 580830301994 60157118 601571181995 62258546 622585461996 64307557 643075571997 66074152 660741521998 68821944 688219441999 69620997 69620997
Sources: Statistics Canada, Gas Utilities (57-205): Table 2(1996-99), Table 4.
Table 6.7 Manitoba Natural Gas Outflows ('000 cu.m.)
Total Delivered Gas Transfers to
YearSales by Utilities
Direct Sales
Exports To Storage Used in System Other Province Total
1986 1769055 281682 4224259 246673 26380327 328209321987 1543190 313614 3594853 248245 26684296 325006251988 1799578 27172 6326226 344090 28905298 374224991989 1830865 48058 7108113 352862 29656500 390750801990 1928626 19381 8472060 435112 30881520 416539991991 1839358 7164 9654434 501556 33275214 452716421992 1772186 6790 10364053 627978 39663096 525000881993 1543521 280649 11146866 645073 44391159 580860301994 1523083 276278 11203643 615428 46520805 601571181995 1602265 293774 11439889 668680 48239484 622585461996 1738323 290068 12192031 666706 49322099 643075571997 1636071 264297 12290765 614850 51320936 660741521998 1465920 330709 13942222 - 492444 52632792 688219441999 1509534 506563 13886002 - 543421 53182951 69620997
Sources: Statistics Canada, Gas Utilities (57-205): Table 2(1996-99), Table 4.

165
The larger part of natural gas outflows from Manitoba was attributable to transfers to other provinces, followed by exports. In 1999 53 billion cubic metres of gas were transferred to other provinces and 14 billion cubic metres of gas were exported. This accounts for more than 96 percent of total outflows.
Figure 6.3 Manitoba Natural Gas Outflows
0
10,000,000
20,000,000
30,000,000
40,000,000
50,000,000
60,000,000
70,000,000
80,000,000
1986
1987
1988
1989
1990
1991
1992
1993
1994
1995
1996
1997
1998
1999
Year
'000
cu.m
Transfers to Other ProvinceExportsGas Used in SystemDirect SalesTotal Sales by Utilities

166
Tables 6.8 to 6.10 show gas sales by category of service in Manitoba. For each category the number of customers, volume of gas sold, revenue, volume sales per customer and revenue per 10 cubic metres are depicted. Table 6.5 depicts the residential service category.
Table 6.9 depicts the commercial service category.
Table 6.8 Manitoba Gas Sales by Category of Service (Residential)
YearCustomers as
of 31 December
Average Number of Customers
Gas Sold RevenueSales Per Customer
Revenue per
customer
Revenue per 10 cubic metres
x1000 cu.m x$1000 cu.m $
1986 188470 186120 660555 120120 3549.1 645.39 1.811987 192228 190269 539648 100003 2836.2 525.59 1.851988 193689 192034 677373 111898 3527.4 582.70 1.651989 197832 195250 716877 118902 3669.7 606.88 1.661990 200234 199043 755466 140902 3795.5 707.90 1.861991 200604 199908 694347 124684 3473.3 623.71 1.801992 202542 201012 680873 128904 3387.2 641.28 1.891993 206794 205242 691972 143222 3371.5 697.82 2.071994 208144 207171 679058 151563 3262.4 731.59 2.231995 212049 210065 705389 151719 3358.0 722.25 2.151996 215524 213429 776843 152398 3639.8 714.04 1.961997 218827 216676 701679 154405 3238.4 712.61 2.21998 222110 220391 610083 159252 2768.2 722.59 2.611999 224059 222976 630064 171868 2825.7 770.79 2.73
Sources: Statistics Canada, Gas Utilities (57-205): Table 1.
Table 6.9 Manitoba Gas Sales by Category of Service (Commercial)
YearCustomers as
of 31 December
Average Number of Customers
Gas Sold RevenueSales Per Customer
Revenue per
customer
Revenue per 10 cubic metres
x1000 cu.m x$1000 cu.m $
1986 17962 17785 641674 101589 36079.5 5712.06 1.581987 18469 18209 533319 81713 29288.8 4487.51 1.531988 18699 18865 633998 83839 33607.1 4444.21 1.321989 19438 18842 644499 84016 34205.4 4458.97 1.301990 19640 19674 673881 88179 34252.4 4482.01 1.311991 19300 19578 638492 77827 32612.7 3925.23 1.221992 19522 19302 605732 71872 31381.8 3723.55 1.191993 21917 21780 741363 108006 34038.7 4958.95 1.461994 20701 21566 731486 115239 35335.8 5343.61 1.581995 22399 22176 759981 110031 34270.0 4961.68 1.451996 22680 22326 821756 106208 36807.5 4757.20 1.291997 23128 22808 780940 116746 34239.7 5118.64 1.491998 23454 23260 680401 121246 29252.0 5212.64 1.781999 24392 24038 678034 130381 28206.8 5423.95 1.92
Sources: Statistics Canada, Gas Utilities (57-205): Table 1.

167
Table 6.10 depicts the industrial category.
Table 6.11 shows the total sales of gas for Manitoba across all service categories.
Table 6.10 Manitoba Gas Sales by Category of Service (Industrial)
Year
Customers as of
December 31
Average Number of Customers
Gas Sold RevenueSales Per Customer
Revenue per customer
Revenue per 10 cubic
metresx1000 cu.m x$1000 cu.m $
1986 204 211 466826 59744 2212445.5 283146.9 1.281987 654 598 470223 55868 786326.1 93424.8 1.191988 128 866 488207 52305 563749.4 60398.4 1.071989 1668 1666 469489 48580 281806.1 29159.7 1.031990 1658 1678 499279 50220 297544.1 29928.5 1.011991 1630 1662 506519 53123 304764.7 31963.3 1.051992 1675 1637 485581 52400 296628.6 32010.0 1.081993 147 133 110186 12964 828466.2 97473.7 1.181994 149 148 112539 14694 755295.3 99507.9 1.311995 146 145 136895 16707 942478.0 115022.4 1.221996 136 142 139724 15140 985128.1 106745.1 1.081997 121 128 153452 17023 1201973.9 133339.4 1.111998 155 141 175436 24180 1241292.5 171084.91 1.381999 157 156 201436 28734 1291256.4 184192.31 1.43
Sources: Statistics Canada, Gas Utilities (57-205): Table 1.
Table 6.11 Manitoba Gas Sales by Category of Service (Total)
Year
Customers as of
December 31
Average Number of Customers
Gas Sold RevenueSales Per Customer
Revenue per customer
Revenue per 10 cubic metres
New Customers from New
Constructions
New Customers from
Conversions
x1000 cu.m x$1000 cu.m $
1986 206636 204116 1769055 281453 8666.9 1378.9 1.59 4.5 0.61987 211351 209076 1543190 237584 7381.0 1136.4 1.54 3.8 0.41988 212516 211765 1799578 248044 8498.0 1171.3 1.38 3.0 0.41989 218938 215858 1830865 251498 8481.8 1165.1 1.37 2.7 0.51990 221559 220395 1928626 279301 8750.8 1267.3 1.45 1.5 0.31991 221534 221148 1839358 255633 8317.3 1155.9 1.39 1.1 0.51992 223739 221951 1772186 253176 7984.6 1140.7 1.43 1.8 0.81993 228858 227155 1543521 264191 6795.0 1163.0 1.71 1.9 0.61994 228994 228884 1523983 281496 6651.2 1229.9 1.85 1.8 0.81995 234594 232386 1602265 278457 6895.0 1198.3 1.74 1.8 0.71996 238340 235897 1738323 273746 7369.0 1160.5 1.57 1.7 1.11997 242076 239611 1636071 288174 6828.0 1202.7 1.76 1.6 1.61998 245719 243793 1465920 304679 6013.0 1249.7 2.081999 248608 247169 1509534 330983 6107.3 1339.1 2.19
Sources: Statistics Canada, Gas Utilities (57-205): Table 1.
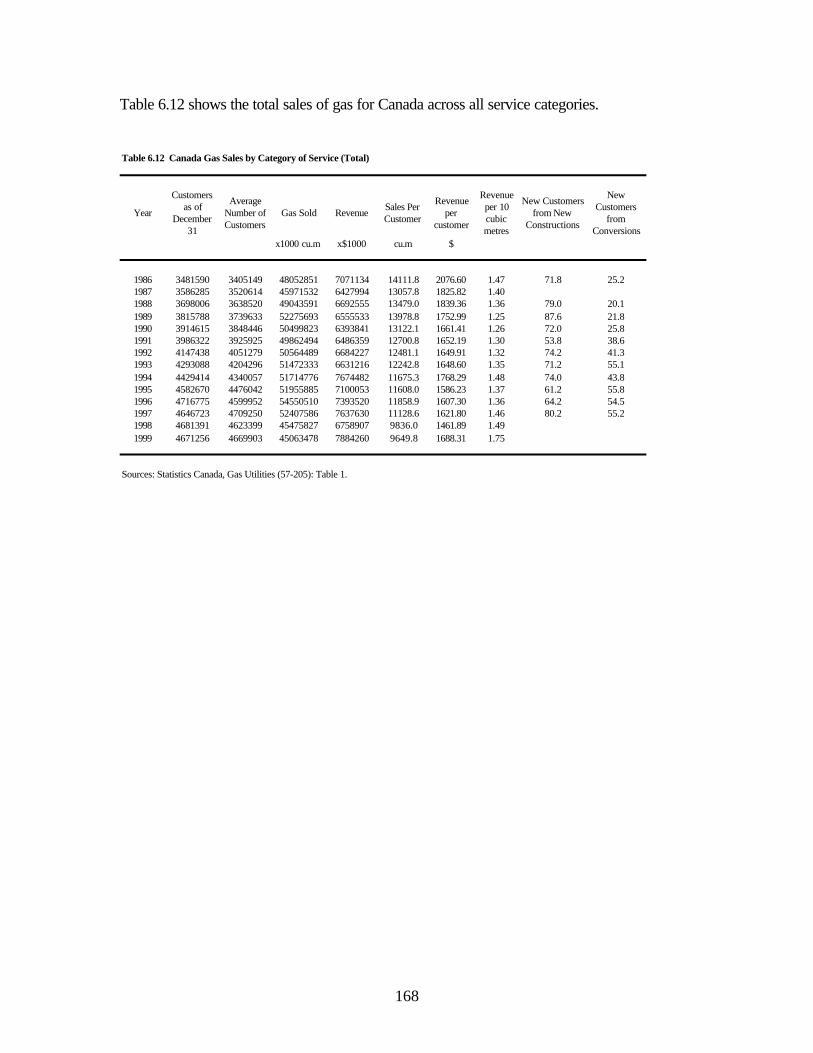
168
Table 6.12 shows the total sales of gas for Canada across all service categories.
Table 6.12 Canada Gas Sales by Category of Service (Total)
Year
Customers as of
December 31
Average Number of Customers
Gas Sold RevenueSales Per Customer
Revenue per
customer
Revenue per 10 cubic metres
New Customers from New
Constructions
New Customers
from Conversions
x1000 cu.m x$1000 cu.m $
1986 3481590 3405149 48052851 7071134 14111.8 2076.60 1.47 71.8 25.21987 3586285 3520614 45971532 6427994 13057.8 1825.82 1.401988 3698006 3638520 49043591 6692555 13479.0 1839.36 1.36 79.0 20.11989 3815788 3739633 52275693 6555533 13978.8 1752.99 1.25 87.6 21.81990 3914615 3848446 50499823 6393841 13122.1 1661.41 1.26 72.0 25.81991 3986322 3925925 49862494 6486359 12700.8 1652.19 1.30 53.8 38.61992 4147438 4051279 50564489 6684227 12481.1 1649.91 1.32 74.2 41.31993 4293088 4204296 51472333 6631216 12242.8 1648.60 1.35 71.2 55.11994 4429414 4340057 51714776 7674482 11675.3 1768.29 1.48 74.0 43.81995 4582670 4476042 51955885 7100053 11608.0 1586.23 1.37 61.2 55.81996 4716775 4599952 54550510 7393520 11858.9 1607.30 1.36 64.2 54.51997 4646723 4709250 52407586 7637630 11128.6 1621.80 1.46 80.2 55.21998 4681391 4623399 45475827 6758907 9836.0 1461.89 1.491999 4671256 4669903 45063478 7884260 9649.8 1688.31 1.75
Sources: Statistics Canada, Gas Utilities (57-205): Table 1.

169
Table 6.13 shows natural gas exports from Manitoba to the USA. In 1999 nearly 14 billion cubic metres of gas were exported to the USA.
Figure 6.4 illustrates that more than 99 percent of gas exports to the USA were piped along the Emerson line.
Table 6.13 Manitoba Natural Gas Exports to the United States ('000 cu.m)
Emerson Sprague Total
1986 4215222 9037 42242591987 3586605 8248 35948531988 6316361 9865 63262261989 7096894 11219 71081131990 8461340 10720 84720601991 9645432 9002 96544341992 10265833 98220 103640531993 10953337 193529 111468661994 11038562 165081 112036431995 11232979 206910 114398891996 11950666 241365 121920311997 12084389 206376 122907651998 13737171 205051 139422221999 13804940 81062 13886002
Source: Statistics Canada, Gas Utilities (57-205): Table 3(1997-1999), Table 5.
Figure 6.4 Manitoba Natural Gas Exports to the USA
0
2,000,000
4,000,000
6,000,000
8,000,000
10,000,000
12,000,000
14,000,000
16,000,000
1986 1987 1988 1989 1990 1991 1992 1993 1994 1995 1996 1997 1998 1999
Year
'000
cu.m Emerson
Sprague

170
The increase in total gas exports to the USA from Manitoba has increased phenomenally from 4.2 billion cubic metres in 1986 to 13.9 billion cubic metres in 1999, a more than 3 fold increase.

171
APPENDIX I MANITOBA TRANSPORTATION COURIER SERVICES SURVEY
Table I.1 1997 Manitoba Transportation Courier Services Survey : Operation
P/U & Del Operations Hours of Operation
No. Locally National U.S. International days/week Hrs/day
1 Yes No No No 7 days/wk 7am-9pm(M-F)2 Yes No No No 6 days/wk 7:30am-5:30 (M-F), 9am-2pm (Sat.)3 Yes Yes Yes Yes 5 days/wk 7:30am-5:30 (M-F)4 Yes Yes No No 5 days/wk 7am-6pm (M-F), 9am-2pm (Sat.)5 Yes Yes Yes Yes 5 days/wk 9am-6pm (24 hr. call)6 Yes No No No 5 days/wk 8am-6pm (M-F)7 Yes Yes Yes Yes 7 days/wk 24 hrs/day (Mon-Sun)8 Yes Yes Yes Yes 5 days/wk 7:30am-6pm (M-F), 24hr weekends9 Yes Yes Yes Yes 7 days/wk 7am-5:30pm (M-Sun), 24hrs.10 Yes Yes Yes Yes 5 days/wk 8am-5:30pm (M-F)11 Yes Yes Yes Yes 5 days/wk 8am-5pm (M-F)12 Yes No No No 5 days/wk 7:30-5:30 (M-F), 24hr weekends13 Yes No No No 5 days/wk 8am-5pm (M-F), 24hrs for p/u14 Yes Yes Yes Yes 5 days/wk 2am-9:30pm (M-F), Sat-Sun avail.15 Yes No No No 6 days/wk 7am-5:30pm (M-F), 8am-12noon (Sat.)16 Yes No No No 6 days/wk 7am-6pm (M-F), 8am-4pm (Sat.)17 Yes Yes No No 6 days/wk 6:30am-7:30pm (M-Sat.)18 Yes Yes Yes No 5 days/wk 7:30am-5pm (M-F)19 Yes Yes No No 5 days/wk 7am-11pm (M-F)20 Yes Yes No No 5 days/wk 6am-12noon (M-F)21 Yes No No No 6 days/wk 8am-8pm (M-F), 9am-12noon (Sat.)22 Yes No No No 7 days/wk 24 hrs. (M-Sun)23 No Yes No No 5 days/wk 8am-5pm (M-F)24 Yes No No No 5 days/wk 7am-9pm (M-F)25 Yes No No No 5 days/wk 7:45am-5:15pm (M-F)26 Yes Yes Yes Yes 7 days/wk 24 hrs/day27 Yes Yes Yes Yes 7 days/wk 24 hrs/day
Total
Source: 1997 Manitoba Courier Services Telephone Survey, University of Manitoba Transport Institute (UMTI)

172
Table I.2 1997 Manitoba Transportation Courier Services Survey: Vehicles by Type
Total Employment 2793
No. of Owner Operator 835
Estimated Average Delivery Distance (Kms/day) 3485
Average Volume of Shipments (pieces)
Per Day 36535Per Week 235225
No. of Vehicles in Fleet 891
Breakdown of Vehicle by Type
Total Cars Mini- Vans Truck Type Flat TractorVans Step-Vans 1/4 ton ½ ton 1 ton 3 ton 5 ton Decks Trailer Other
891 278 30 207 11 93 39 48 42 3 19 34
Source: 1997 Manitoba Courier Services Telephone Survey, University of Manitoba Transport Institute (UMTI)
Table I.3 1997 Manitoba Transportation Courier Services Survey: Volume Changes
1993 to 1996 Percentage (%)Courier Number Change In Courier Volume
1993
1 30%2 100%3 N/A4 0%5 100%6 0%7 4%8 N/A9 30%10 10-15%11 25%12 0-5%13 10%14 30%15 N/A16 25%17 30%18 N/A19 7-10%20 100%21 10%22 10-15%23 10%24 11%25 300%26 8%27 10-15%
Source: 1997 Manitoba Courier Services Telephone Survey, University of Manitoba Transport Institute (UMTI)Note:Data entries for delivery distance traveled and volume of individual shipments are average values.Data entries for "000/000" represent individual "outgoing/incoming" shipments."N/A" means not available due to confidentiality/ or is unknown.

173
Table I.4 1997 Manitoba Transportation Courier Services Survey : Courier Goods Destinations
Percent (%) of Percent (%) of Outgoing Percent (%) of Total Percent (%) of Total Percent (%) of Total Courier Number Courier Goods Courier Goods by mode Manitoba Outgoing Outbound Shipments Inbound Shipments
Destined for Air Line-haul Truck East/West Shipments to Destination to DestinationOutside (expedited (Regular service) (East/West) Domestic U.S. Int'l Domestic U.S. Int'lWinnipeg* service)
1 2% - - - - - - - - -2 1% - - - - - - - - -3 20% 75% 25% 70%/30% 85% 10% 5% 85% 10% 5%4 25% - - 60%/40% 100% - - 100% - -5 N/A 95% 5% 60%/40% 70% 15% 15% 80% 10% 10%6 10% - - - - - - - - -7 20% 20% 80% 65%/35% 98% 1% 1% 98% 1% 1%8 N/A 75% 25% 75%/25% 70% 2% 10% 90% 10%9 0% 0% 100% 70%/30% N/A N/A N/A N/A N/A N/A
10 1% 100% 0% 75%/25% 40% 40% 20% 30% 50% 20%11 99% 10% 90% 99% 1% 99% 1%12 0% - - - - - - - - -13 0% - - - - - - - - -14 100% 60% 40% 70%/30% 95% 4% 1% 95% 4% 1%15 0% - - - - - - - - -16 0% - - - - - - - - -17 5% 0% 100% 10%/90% - - - - - -18 1% - - 70%/30% 95% 5% - 95% 5% -19 99% 0% 100% 70%/30% - - - - - -20 40% 10% 90% 70%/30% - - - - - -21 0% - - - - - - - - -22 0% - - - - - - - - -23 100% 100% N/A 100% - - 100% - -24 0% - - - - - - - - -25 5% - - - - - - - - -26 1% N/A N/A N/A 95% 4% 1% N/A N/A N/A27 95% 90% 10% N/A 97% 2% 1% 100%
Source: 1997 Manitoba Courier Services Telephone Survey, University of Manitoba Transport Institute (UMTI)Note:The above percentages are estimations on the behalf of courier firms.* refers to the percentage of courier goods that are destined for locations in Manitoba other than Winnipeg."-" means nil or zero."N/A" means not available.

174
APPENDIX II TRANSPORTATION EQUIPMENT MANUFACTURING
Table II.1 Manitoba Transportation Equipment Industry Statistics: Manufacturing Activity
Production Workers Cost of Cost of Value ValueYear Establish- Person Wages Fuel & Materials of Added
ment Number Hours Electricity & Supplies Shipment('000) ($'000,000) ($'000,000) ($'000,000) ($'000,000) ($'000,000)
All Manufacturing Industries1986 1282 39876 81742 832.8 162.3 3097.1 5649.4 2407.81987 1186 N/A N/A N/A N/A N/A N/A N/A1988 1299 44746 91914 1002.0 173.5 3633.6 6671.0 2912.01989 1258 44647 91677 1051.2 177.2 3809.5 6984.1 3060.01990 1167 39973 82511 998.4 181.1 3435.9 6739.5 3154.61991 1090 37821 78096 970.3 202.4 3109.2 6161.4 2844.81992 1047 36537 75661 979.7 198.4 3231.2 6228.4 2829.81993 1024 37301 77174 1016.2 206.4 3554.6 6650.1 2957.91994 1004 39208 80796 1077.0 205.8 4000.7 7542.7 3371.81995 1053 41127 85038 1138.8 212.6 4522.3 8306.5 3689.01996 1143 41559 86033 1151.8 211.7 4784.7 8951.5 3949.91997 1098 48114 97378 1324.5 226.8 5459.8 9969.3 4426.5
Transportation Equipment Industry, Total (SIC 32)1986 62 4085 8488 91.5 6.3 201.1 449.8 255.01987 61 N/A N/A N/A N/A N/A N/A N/A1988 66 4679 9771 116.7 8.1 314.4 652.7 360.91989 69 5467 11431 140.4 9.5 364.5 776.5 417.21990 60 4853 10232 135.0 9.9 370.3 763.8 391.81991 59 4393 9366 127.6 10.1 323.3 709.2 395.01992 58 4667 9713 140.6 9.5 318.9 745.5 419.51993 56 4876 10034 143.4 11.4 355.1 808.2 427.21994 57 5272 11073 165.0 12.1 430.9 961.6 515.01995 56 5168 11079 164.9 11.3 511.4 1017.9 533.11996 61 5813 11734 183.3 11.4 534.2 1212.7 674.81997 56 7200 14360 227.0 12.5 656.7 1342.5 716.7
Table II.1 Manitoba Transportation Equipment Industry Statistics: Manufacturing Activity
Production Workers Cost of Cost of Value ValueYear Establish- Person Wages Fuel & Materials of Added
ment Number Hours Electricity & Supplies Shipment('000) ($'000,000) ($'000,000) ($'000,000) ($'000,000) ($'000,000)
Aircraft & Aircraft Parts Industry (SIC 321)1986 9 1910 4139 45.1 2.0 88.2 203.8 134.01987 11 N/A N/A N/A N/A N/A N/A N/A1988 11 2237 4829 62.0 2.5 138.8 300.1 173.11989 13 2795 5909 76.6 3.0 163.5 395.5 237.31990 12 2746 5901 82.2 3.6 170.4 410.3 236.71991 13 2528 5476 78.3 3.6 157.6 389.6 247.71992 12 2629 5600 85.0 3.3 149.6 408.9 249.71993 13 2372 4933 76.6 4.3 115.5 371.2 238.31994 12 2275 4965 83.9 4.0 113.8 381.3 263.81995 12 1984 4350 75.8 3.6 92.6 332.4 262.91996 11 2135 4472 81.8 3.8 118.6 440.6 317.01997 11 2682 5561 100.7 4.1 185.9 540.0 377.1
Truck and Bus Body & Trailer Industry (324)1986 19 1071 2147 21.9 1.2 64.4 130.5 60.51987 19 N/A N/A N/A N/A N/A N/A N/A1988 20 N/A N/A N/A N/A N/A N/A N/A1989 N/A N/A N/A N/A N/A N/A 35.3 10.41990 N/A N/A N/A N/A N/A N/A 9.4 4.71991 N/A N/A N/A N/A N/A N/A 10.0 4.11992 20 1091 2212 31.3 1.7 68.4 166.4 95.31993 19 1237 2553 34.8 1.9 81.8 181.1 95.91994 20 1620 3374 46.6 2.4 135.6 259.3 120.61995 19 1668 3645 50.4 2.5 181.5 326.2 147.61996 23 2006 4000 56.9 2.6 156.8 372.6 213.71997 N/A N/A N/A N/A N/A N/A N/A N/A

175
Table II.1 Manitoba Transportation Equipment Industry Statistics: Manufacturing Activity
Production Workers Cost of Cost of Value ValueYear Establish- Person Wages Fuel & Materials of Added
ment Number Hours Electricity & Supplies Shipment('000) ($'000,000) ($'000,000) ($'000,000) ($'000,000) ($'000,000)
Motor Vehicle Parts and Accessories (325)1986 16 N/A N/A N/A N/A N/A N/A N/A1987 15 N/A N/A N/A N/A N/A N/A N/A1988 19 531 1087 10.3 0.8 23.3 50.4 27.31989 18 548 1127 11.0 0.8 26.2 57.7 30.51990 14 353 720 7.7 0.6 18.7 44.1 23.71991 13 303 594 6.8 0.6 15.4 36.1 19.81992 13 359 677 7.7 0.5 15.5 36.2 20.01993 14 492 932 10.2 0.8 21.2 50.1 28.41994 15 565 1065 12.0 0.9 33.0 68.0 35.11995 14 484 943 11.0 0.6 25.6 55.4 31.61996 N/A N/A N/A N/A N/A N/A N/A N/A1997 N/A N/A N/A N/A N/A N/A N/A N/A
Other Motor Vehicle Parts and Accessories (3259)1986 6 61 127 1.0 0.1 2.8 6.8 4.11987 16 N/A N/A N/A N/A N/A N/A N/A1988 7 106 223 2.0 0.1 4.0 8.1 4.01989 7 76 159 1.4 0.1 3.9 8.0 3.91990 7 51 104 1.0 0.1 2.7 5.9 3.21991 6 17 36 0.4 0.1 1.6 3.1 1.41992 6 18 34 N/A -- 0.6 1.7 1.01993 6 75 152 N/A 0.1 3.3 5.6 2.21994 6 58 126 1.1 0.2 6.4 7.8 1.31995 6 57 119 N/A 0.1 3.3 6.8 3.81996 5 26 40 0.4 0.0 0.9 2.5 1.61997 N/A N/A N/A N/A N/A N/A N/A N/A
Table II.1 Manitoba Transportation Equipment Industry Statistics: Manufacturing Activity
Production Workers Cost of Cost of Value ValueYear Establish- Person Wages Fuel & Materials of Added
ment Number Hours Electricity & Supplies Shipment('000) ($'000,000) ($'000,000) ($'000,000) ($'000,000) ($'000,000)
Boat building & Repair Industry (328)1986 14 162 343 2.6 0.2 6.2 11.3 5.01987 12 N/A N/A N/A N/A N/A N/A N/A1988 12 245 423 3.5 0.4 9.6 20.9 11.21989 12 191 381 3.3 0.4 9.8 16.5 6.11990 10 129 261 2.2 0.3 5.5 10.7 4.81991 N/A N/A N/A N/A N/A N/A N/A N/A1992 N/A N/A N/A N/A N/A N/A N/A N/A1993 5 100 207 1.9 0.3 4.2 8.9 4.51994 4 108 223 2.0 0.3 4.5 9.8 5.01995 N/A N/A N/A N/A N/A N/A N/A N/A1996 6 184 298 2.9 0.3 6.7 13.4 6.31997 N/A N/A N/A N/A N/A N/A N/A N/A
Sources: Statistics Canada, Manufacturing Industries of Canada (31-203): Table 25 (1996-97); Table 29.

176
Table II.2 Manitoba Transportation Equipment Industry Statistics: Total Activity
Administration and Office Total Employees Cost of Shipment ValueYear Establish- Employees Wages & Material Value & Other Added
ment Number Salaries Number Salaries & Supplies Revenue($'000,000) ($'000,000) ($'000,000) ($'000,000) ($'000,000)
All Manufacturing Industries1986 1282 12964 383.0 52840 1215.8 3732.8 6424.5 2547.31987 1186 N/A N/A 54031 1284.6 3904.4 6992.5 2910.11988 1299 12464 408.3 57210 1410.3 4238.3 7381.7 3017.91989 1258 12099 420.0 56746 1471.2 4225.0 7515.9 3176.31990 1167 12890 462.4 52863 1460.8 3878.3 7293.9 3266.51991 1090 10894 409.1 48715 1379.4 3547.0 6750.4 2996.01992 1047 11726 454.2 48263 1433.9 3667.5 6779.9 2945.01993 1024 11334 465.5 48635 1481.7 4033.8 7258.5 3087.01994 1004 11454 469.0 50662 1546.0 4508.9 8219.1 3540.01995 1053 11325 486.0 52452 1624.8 5081.3 9060.4 3883.91996 1143 11555 510.4 53114 1662.2 5420.9 9790.3 4152.41997 1098 11831 532.1 59945 1856.6 6199.3 10941.4 4659.1
Transportation equipment Industry, Total (SIC 32)1986 62 1901 58.6 5986 150.1 252.6 517.8 271.61987 61 N/A N/A 6300 164.5 285.5 588.6 284.61988 66 2071 67.4 6750 184.1 340.1 687.8 370.21989 69 2113 71.4 7580 211.8 392.7 815.0 427.51990 60 2363 81.2 7216 216.2 406.2 812.0 404.11991 59 2209 81.5 6602 209.1 390.2 784.8 403.71992 58 2152 83.5 6819 224.1 374.8 801.5 419.61993 56 2078 91.8 6954 235.2 406.0 868.7 436.71994 57 2107 77.8 7379 243.5 468.1 1011.6 527.81995 56 2072 80.4 7240 245.3 565.6 1091.8 552.81996 61 2183 89.6 7996 272.8 580.9 1268.1 683.51997 56 2594 105.3 9794 332.3 727.9 1,417.0 720.0
Table II.2 Manitoba Transportation Equipment Industry Statistics: Total Activity
Administration and Office Total Employees Cost of Shipment ValueYear Establish- Employees Wages & Material Value & Other Added
ment Number Salaries Number Salaries & Supplies Revenue($'000,000) ($'000,000) ($'000,000) ($'000,000) ($'000,000)
Aircraft and Aircraft Parts Industry (SIC 321)1986 9 1067 31.8 2977 76.9 117.0 242.1 143.41987 11 N/A N/A 3210 84.3 128.9 284.9 133.31988 11 1013 34.2 3250 96.2 150.2 314.5 176.01989 13 1113 37.9 3908 114.5 168.2 404.3 241.41990 12 1254 42.2 4000 124.4 177.2 420.5 240.21991 13 1113 44.2 3641 122.6 196.9 435.9 254.61992 12 1088 45.5 3717 130.5 190.3 448.6 248.71993 13 1125 47.9 3497 124.5 149.2 404.2 237.91994 12 1065 36.8 3340 120.7 124.0 393.9 266.21995 12 854 31.9 2838 107.7 112.2 366.7 277.51996 11 941 38.1 3076 119.9 128.5 453.5 320.11997 11 1135 48.0 3817 148.6 199.4 557.2 380.8
Truck and Bus Body & Trailer Industry (324)1986 19 383 11.0 1481 32.9 76.5 145.6 63.51987 19 N/A N/A N/A N/A N/A N/A N/A1988 20 N/A N/A N/A N/A N/A N/A N/A1989 N/A N/A N/A N/A N/A N/A N/A N/A1990 N/A N/A N/A N/A N/A N/A N/A N/A1991 N/A N/A N/A N/A N/A N/A N/A N/A1992 20 648 20.7 1739 51.9 70.7 168.1 94.71993 19 577 19.7 1814 54.5 84.2 182.9 95.21994 20 637 23.1 2257 69.8 138.2 260.8 119.61995 19 793 28.8 2461 79.2 185.6 329.1 146.41996 23 800 34.1 2806 88.3 160.3 375.2 212.81997 N/A N/A N/A N/A N/A N/A N/A N/A

177
Table II.2 Manitoba Transportation Equipment Industry Statistics: Total Activity
Administration and Office Total Employees Cost of Shipment ValueYear Establish- Employees Wages & Material Value & Other Added
ment Number Salaries Number Salaries & Supplies Revenue($'000,000) ($'000,000) ($'000,000) ($'000,000) ($'000,000)
Motor Vehicle Parts and Accessories (325)1986 16 N/A N/A N/A N/A N/A N/A N/A1987 15 N/A N/A N/A N/A N/A N/A N/A1988 19 133 4.2 664 14.5 27.4 55.5 28.21989 18 122 4.4 670 15.4 30.1 62.4 31.21990 14 131 5.4 484 13.1 20.8 46.4 24.01991 13 126 4.9 429 11.6 17.7 38.1 19.51992 13 121 4.2 480 11.8 17.1 37.9 20.11993 14 112 4.2 604 14.4 22.9 52.1 28.61994 15 123 4.7 688 16.7 35.7 71.0 35.41995 14 114 4.9 598 15.9 28.6 59.0 32.31996 N/A N/A N/A N/A N/A N/A N/A N/A1997 N/A N/A N/A N/A N/A N/A N/A N/A
Other Motor Vehicle Parts and accessories Industry (32590)1986 6 21 0.7 82 1.7 2.8 6.8 4.01987 16 N/A N/A 86 1.8 2.8 6.7 3.91988 7 27 0.8 133 2.8 5.0 9.8 4.81989 7 15 0.7 91 2.1 4.9 8.1 3.01990 7 22 0.9 73 1.8 2.8 5.9 3.01991 6 15 0.6 32 1.0 1.8 3.2 1.31992 6 2 N/A 20 0.5 0.8 1.8 1.01993 6 1 N/A 74 1.6 3.5 5.9 2.31994 6 24 1.1 132 3.1 15.9 22.5 6.41995 6 1 N/A 58 1.3 3.4 6.9 3.71996 5 5 0.1 31 0.5 1.0 2.6 1.61997 N/A N/A N/A N/A N/A N/A N/A N/A
Table II.2 Manitoba Transportation Equipment Industry Statistics: Total Activity
Administration and Office Total Employees Cost of Shipment ValueYear Establish- Employees Wages & Material Value & Other Added
ment Number Salaries Number Salaries & Supplies Revenue($'000,000) ($'000,000) ($'000,000) ($'000,000) ($'000,000)
Boat building and Repair Industry (328)1986 14 24 0.6 186 3.2 9.8 15.4 50.01987 12 N/A N/A 208 3.5 11.9 19.0 6.61988 12 26 0.9 271 4.4 15.1 27.5 12.31989 12 27 0.8 218 4.1 16.8 24.9 7.41990 10 38 1.3 167 3.5 10.4 16.5 5.71991 N/A N/A N/A N/A N/A N/A N/A N/A1992 N/A N/A N/A N/A N/A N/A N/A N/A1993 5 21 0.9 121 2.7 11.0 17.4 6.11994 4 24 1.1 132 3.1 15.9 22.5 6.41995 N/A N/A N/A N/A N/A N/A N/A N/A1996 6 33 1.4 217 4.3 19.6 28.8 8.81997 N/A N/A N/A N/A N/A N/A N/A N/A
Sources: Statistics Canada, Manufacturing Industries of Canada (31-203): Table 25 (1996-97); Table 29.

178
Table II.3 Canadian Transportation Equipment Industry Statistics: Manufacturing Activity
Production Workers Cost of Cost of Value ValueYear Establish- Person Wages Fuel & Materials of Added
ment Number Hours Electricity & Supplies Shipment('000) ($'000,000) ($'000,000) ($'000,000) ($'000,000) ($'000,000)
All Manufacturing Industries1986 38380 1351563 2852525 33081.7 6999.6 143336.1 253410.6 102459.31987 36790 N/A N/A N/A N/A N/A N/A N/A1988 40262 1473332 3086757 38853.0 7362.8 166504.9 297435.9 124430.11989 39150 1495937 3124874 41374.1 7717.4 174775.3 308805.3 127406.61990 39864 1393324 2893337 40406.5 7936.1 168664.3 298918.5 122972.51991 36339 1288206 2674862 38931.8 8109.1 158616.6 280190.7 N/A1992 34511 1234208 2574145 38822.4 8177.3 162427.0 286043.3 115718.01993 32943 1219940 2555795 39406.5 8593.8 177672.6 309674.9 124155.01994 31974 1243026 2631864 41405.0 9151.6 202655.5 352834.7 142858.81995 32718 1288386 2732268 43968.3 9387.9 227912.9 396384.3 1617931996 36239 1279030 2693882 44135.9 9450.3 23282.8 406486.9 164940.11997 34935 1409852 2924759 48847.4 10175.0 251038.2 434082.9 174499.9
Transportation Equipment Manufacturing Industry, Total (SIC 32)1986 1556 165383 381071 4936.2 359.1 30139.9 44399.8 13861.21987 1514 N/A N/A N/A N/A N/A N/A N/A1988 1674 182229 399514 5781.5 413.5 35887.4 51718.1 15477.71989 1699 188887 411579 6240.9 443.9 36868.3 53783.3 16472.01990 1599 175200 373204 5956.9 424.2 35429.9 51654.9 15906.21991 1472 161624 341946 5762.7 425.7 33485.2 48179.7 14409.01992 1400 168493 358838 6193.8 456.3 36697.4 52785.1 16003.21993 1349 166985 362939 6563.1 499.2 45090.5 64112.8 18670.71994 1336 172685 387991 7226.2 526.7 53523.1 76132.1 22506.81995 1425 182721 407785 7744.3 545.3 60218.1 85546.3 25423.61996 1526 184526 393580 7678.0 553.0 58905.0 87180.8 27995.41997 1495 198009 413964 8493.9 575.2 65112.3 96052.0 31075.7
Table II.3 Canadian Transportation Equipment Industry Statistics: Manufacturing Activity
Production Workers Cost of Cost of Value ValueYear Establish- Person Wages Fuel & Materials of Added
ment Number Hours Electricity & Supplies Shipment('000) ($'000,000) ($'000,000) ($'000,000) ($'000,000) ($'000,000)
Aircraft and Aircraft Parts Industry (SIC 321)1986 198 23841 54008 702.1 34.1 1440.5 3291.6 1895.81987 185 N/A N/A N/A N/A N/A N/A N/A1988 202 28938 60749 913.6 44.0 2198.7 4308.5 2195.11989 194 29133 61950 987.1 43.8 2286.7 5111.8 2901.01990 199 30179 64709 1082.5 46.9 2583.5 5699.1 3339.41991 199 27701 59311 1045.5 54.3 2419.4 5391.4 3068.01992 189 27571 60270 1034.6 47.6 1938.5 4862.2 3120.61993 182 23071 50353 904.5 44.8 1887.8 4796.0 3002.71994 177 23065 50973 962.5 47.7 2169.9 5743.5 3387.61995 193 24907 55551 1100.2 51.7 3016.9 6769.3 4167.21996 200 26046 57104 1156.7 55.9 3478.2 8063.7 4709.71997 192 28146 58519 1227.8 56.0 4013.3 8566.5 5434.7
Truck and Bus Body & Trailer Industry (SIC 324)1986 311 10732 21557 226.7 11.6 801.5 1301.9 487.31987 315 N/A N/A N/A N/A N/A N/A N/A1988 343 12582 25347 286.8 16.3 1107.0 1740.9 634.01989 373 13275 27593 323.5 18.3 1088.0 1826.6 729.71990 333 9773 20344 255.9 15.1 857.0 1411.4 539.01991 311 7466 15306 198.0 12.3 664.9 1093.9 400.01992 292 8031 16382 217.1 12.8 613.3 1105.8 478.41993 288 8724 17892 241.0 13.0 697.1 1259.1 550.21994 279 9851 20226 277.7 14.3 899.3 1566.7 664.01995 292 11327 23547 324.8 16.9 1143.3 1922.8 780.91996 311 12210 23553 337.9 17.9 1103.5 2001.5 887.81997 309 14320 27622 411.1 19.9 1352.2 2332.6 984.7

179
Table II.3 Canadian Transportation Equipment Industry Statistics: Manufacturing Activity
Production Workers Cost of Cost of Value ValueYear Establish- Person Wages Fuel & Materials of Added
ment Number Hours Electricity & Supplies Shipment('000) ($'000,000) ($'000,000) ($'000,000) ($'000,000) ($'000,000)
Motor Vehicle Parts and Accessories (SIC 325)1986 560 72359 159124 1987.7 175.2 6690.1 12921.7 6092.01987 552 N/A N/A N/A N/A N/A N/A N/A1988 630 80307 174001 2343.9 199.2 8020.8 14539.4 6355.81989 679 82162 175788 2445.7 207.5 8632.1 15447.3 6592.41990 619 73098 155948 2254.2 192.7 7710.2 13902.0 5942.41991 580 66176 140404 2086.2 184.7 7000.1 12706.6 5459.01992 560 72870 154506 2368.8 214.0 7991.2 14099.0 5861.61993 554 76810 163923 2600.0 232.1 9371.7 16931.9 7358.81994 567 80413 177482 2924.7 259.6 11537.4 19995.7 8330.11995 601 86781 192484 3260.6 269.9 12731.7 22333.1 9329.31996 654 87568 183694 3269.5 271.4 13262.9 23839.6 10417.01997 658 96655 195019 3708.9 286.8 15514.0 27432.3 11726.5
Other Motor Vehicle Parts and Accessories (SIC 3259)1986 202 18887 41668 515.4 38.8 1578.2 3246.5 1624.91987 190 N/A N/A N/A N/A N/A N/A N/A1988 239 23854 50366 645.3 46.5 2086.3 3823.5 1695.51989 259 23981 51017 682.7 47.3 2262.9 4110.7 1795.41990 264 23812 49939 707.9 50.7 2312.0 4233.0 1866.01991 249 24635 52761 815.1 64.2 2634.7 4844.9 2121.01992 237 27917 59486 966.4 75.1 2868.6 5224.5 2285.51993 229 26718 56051 940.6 73.9 3082.4 5549.4 2391.11994 230 27574 61392 1052.0 83.0 3608.1 6192.4 2528.91995 236 30458 68210 1192.0 85.8 4296.7 7206.2 2837.01996 261 30697 64414 1159.5 82.8 4376.2 7453.9 3009.01997 257 33939 69457 1357.9 92.3 5545.2 9266.8 3655.4
Table II.3 Canadian Transportation Equipment Industry Statistics: Manufacturing Activity
Production Workers Cost of Cost of Value ValueYear Establish- Person Wages Fuel & Materials of Added
ment Number Hours Electricity & Supplies Shipment('000) ($'000,000) ($'000,000) ($'000,000) ($'000,000) ($'000,000)
Boat building and Repair Industry (SIC 328)1986 359 3964 7766 70.4 4.3 182.7 333.9 143.21987 327 N/A N/A N/A N/A N/A N/A N/A1988 379 5150 10256 97.3 5.6 374.8 463.4 189.71989 326 4774 9762 99.0 5.9 257.7 440.9 179.21990 314 3756 7756 86.1 4.8 185.2 342.0 154.11991 252 2673 5496 65.9 4.5 115.4 250.6 129.01992 233 2245 4523 55.3 3.2 89.2 221.3 128.21993 198 2222 4605 58.4 3.1 97.0 225.3 126.91994 196 2885 6021 73.9 4.9 136.7 303.7 163.81995 227 3596 7214 91.3 4.6 220.4 428.1 220.41996 249 4251 7849 99.3 5.5 247.3 476.9 240.01997 230 4424 8288 103.3 5.5 210.9 480.9 246.8
Motor Vehicle Industry (SIC 323)1986 26 41607 110642 1555.9 100.2 19600.0 24186.6 4474.01987 27 N/A N/A N/A N/A N/A N/A N/A1988 28 41351 99917 1703.2 111.3 22915.4 28113.8 4954.21989 30 43890 102704 1863.1 128.7 22615.6 27519.2 4854.81990 32 44344 95306 1791.7 125.3 22299.2 27238.8 4706.31991 35 44587 94312 1900.1 135.6 21800.5 26016.8 4088.01992 33 43573 93797 1980.2 141.3 24600.6 29564.1 4956.91993 31 43302 99022 2243.1 168.7 31512.1 37802.5 6013.41994 27 43445 104874 2426.6 167.7 36608.6 44557.9 7960.31995 27 43532 101280 2419.6 168.6 40679.7 49473.8 8719.01996 26 40237 92080 2268.5 165.8 37972.0 47902.0 9784.81997 25 41720 98764 2518.9 171.9 41458.0 52715.3 10872.4

180
Table II.3 Canadian Transportation Equipment Industry Statistics: Manufacturing Activity
Production Workers Cost of Cost of Value ValueYear Establish- Person Wages Fuel & Materials of Added
ment Number Hours Electricity & Supplies Shipment('000) ($'000,000) ($'000,000) ($'000,000) ($'000,000) ($'000,000)
Railroad Rolling Stock Industry (SIC 326)1986 27 4698 9982 138.2 15.6 732.6 1027.7 285.21987 29 N/A N/A N/A N/A N/A N/A N/A1988 27 5277 11227 162.3 19.4 549.2 1082.5 526.91989 28 5180 11571 186.2 20.0 956.3 1568.8 625.41990 28 4314 9023 146.4 19.5 747.8 1188.1 416.21991 27 4420 9056 153.9 18.8 547.4 1029.7 485.01992 23 4385 8936 160.0 18.6 669.4 1296.8 636.01993 22 4411 9141 170.9 17.6 746.9 1212.3 518.91994 21 5812 13203 263.2 16.3 1306.0 1990.7 928.91995 18 5930 13395 272.7 18.5 1507.7 2414.5 950.61996 22 6260 13766 267.8 20.9 1847.1 2678.6 727.91997 21 6043 12505 263.5 20.3 1732.2 2713.9 815.3
Shipbuilding and Repair Industry (SIC 327)1986 54 6962 15457 229.4 15.8 597.6 1020.1 377.11987 55 N/A N/A N/A N/A N/A N/A N/A1988 50 7390 15452 243.8 15.2 696.8 1234.1 511.51989 57 8974 19308 300.0 17.1 854.5 1568.4 709.71990 59 8372 17656 308.6 17.4 898.0 1579.3 674.71991 54 7615 15999 286.9 13.1 783.9 1376.5 644.01992 54 8717 18195 346.6 15.8 520.8 1167.5 614.41993 52 7030 15132 304.9 16.1 384.2 1185.6 784.51994 44 5742 12285 258.2 12.0 322.8 976.3 612.01995 49 5190 11302 229.7 10.6 251.3 970.3 698.61996 46 4345 9230 183.0 9.9 140.3 718.7 556.61997 50 3931 7937 165.6 9.7 128.3 497.7 374.6
Table II.3 Canadian Transportation Equipment Industry Statistics: Manufacturing Activity
Production Workers Cost of Cost of Value ValueYear Establish- Person Wages Fuel & Materials of Added
ment Number Hours Electricity & Supplies Shipment('000) ($'000,000) ($'000,000) ($'000,000) ($'000,000) ($'000,000)
Other Transportation Equipment Industry (SIC 329)1986 21 1220 2534 25.9 2.3 94.8 216.4 106.61987 24 N/A N/A N/A N/A N/A N/A N/A1988 15 1234 2566 30.6 2.5 124.8 235.4 110.61989 12 1499 2904 36.4 2.6 177.4 300.2 149.61990 15 1335 2462 31.6 2.5 149.0 294.2 133.81991 14 986 2063 26.3 2.4 153.6 314.2 134.01992 16 1101 2230 31.3 3.0 274.6 468.4 207.11993 22 1415 2870 40.3 3.9 393.9 700.0 315.91994 25 1472 2929 39.4 4.2 542.4 997.6 460.21995 18 1458 3012 45.3 4.4 667.0 1234.4 557.71996 18 3609 6304 95.4 5.8 853.8 1499.9 671.71997 10 2770 5309 95.0 5.1 703.5 1312.8 620.7
Sources: Statistics Canada, Manufacturing Industries of Canada (31-203): Table 4 (1996-97); Table 1.
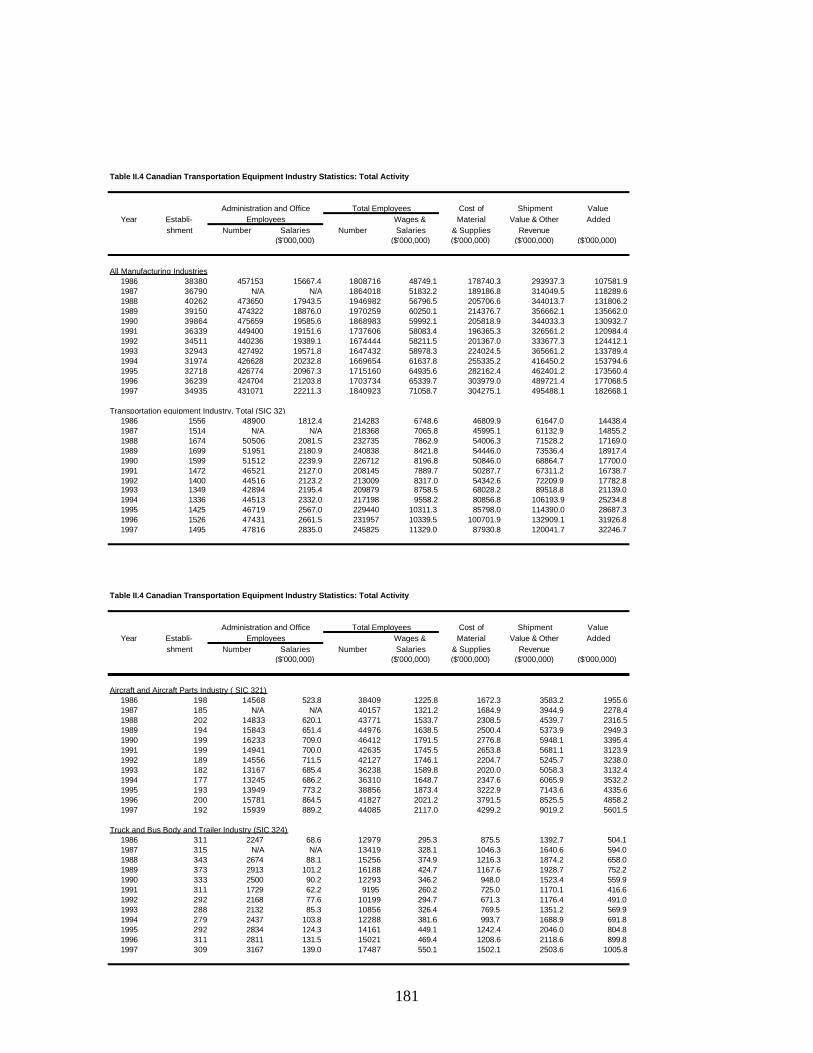
181
Table II.4 Canadian Transportation Equipment Industry Statistics: Total Activity
Administration and Office Total Employees Cost of Shipment ValueYear Establi- Employees Wages & Material Value & Other Added
shment Number Salaries Number Salaries & Supplies Revenue($'000,000) ($'000,000) ($'000,000) ($'000,000) ($'000,000)
All Manufacturing Industries1986 38380 457153 15667.4 1808716 48749.1 178740.3 293937.3 107581.91987 36790 N/A N/A 1864018 51832.2 189186.8 314049.5 118289.61988 40262 473650 17943.5 1946982 56796.5 205706.6 344013.7 131806.21989 39150 474322 18876.0 1970259 60250.1 214376.7 356662.1 135662.01990 39864 475659 19585.6 1868983 59992.1 205818.9 344033.3 130932.71991 36339 449400 19151.6 1737606 58083.4 196365.3 326561.2 120984.41992 34511 440236 19389.1 1674444 58211.5 201367.0 333677.3 124412.11993 32943 427492 19571.8 1647432 58978.3 224024.5 365661.2 133789.41994 31974 426628 20232.8 1669654 61637.8 255335.2 416450.2 153794.61995 32718 426774 20967.3 1715160 64935.6 282162.4 462401.2 173560.41996 36239 424704 21203.8 1703734 65339.7 303979.0 489721.4 177068.51997 34935 431071 22211.3 1840923 71058.7 304275.1 495488.1 182668.1
Transportation equipment Industry, Total (SIC 32)1986 1556 48900 1812.4 214283 6748.6 46809.9 61647.0 14438.41987 1514 N/A N/A 218368 7065.8 45995.1 61132.9 14855.21988 1674 50506 2081.5 232735 7862.9 54006.3 71528.2 17169.01989 1699 51951 2180.9 240838 8421.8 54446.0 73536.4 18917.41990 1599 51512 2239.9 226712 8196.8 50846.0 68864.7 17700.01991 1472 46521 2127.0 208145 7889.7 50287.7 67311.2 16738.71992 1400 44516 2123.2 213009 8317.0 54342.6 72209.9 17782.81993 1349 42894 2195.4 209879 8758.5 68028.2 89518.8 21139.01994 1336 44513 2332.0 217198 9558.2 80856.8 106193.9 25234.81995 1425 46719 2567.0 229440 10311.3 85798.0 114390.0 28687.31996 1526 47431 2661.5 231957 10339.5 100701.9 132909.1 31926.81997 1495 47816 2835.0 245825 11329.0 87930.8 120041.7 32246.7
Table II.4 Canadian Transportation Equipment Industry Statistics: Total Activity
Administration and Office Total Employees Cost of Shipment ValueYear Establi- Employees Wages & Material Value & Other Added
shment Number Salaries Number Salaries & Supplies Revenue($'000,000) ($'000,000) ($'000,000) ($'000,000) ($'000,000)
Aircraft and Aircraft Parts Industry ( SIC 321)1986 198 14568 523.8 38409 1225.8 1672.3 3583.2 1955.61987 185 N/A N/A 40157 1321.2 1684.9 3944.9 2278.41988 202 14833 620.1 43771 1533.7 2308.5 4539.7 2316.51989 194 15843 651.4 44976 1638.5 2500.4 5373.9 2949.31990 199 16233 709.0 46412 1791.5 2776.8 5948.1 3395.41991 199 14941 700.0 42635 1745.5 2653.8 5681.1 3123.91992 189 14556 711.5 42127 1746.1 2204.7 5245.7 3238.01993 182 13167 685.4 36238 1589.8 2020.0 5058.3 3132.41994 177 13245 686.2 36310 1648.7 2347.6 6065.9 3532.21995 193 13949 773.2 38856 1873.4 3222.9 7143.6 4335.61996 200 15781 864.5 41827 2021.2 3791.5 8525.5 4858.21997 192 15939 889.2 44085 2117.0 4299.2 9019.2 5601.5
Truck and Bus Body and Trailer Industry (SIC 324)1986 311 2247 68.6 12979 295.3 875.5 1392.7 504.11987 315 N/A N/A 13419 328.1 1046.3 1640.6 594.01988 343 2674 88.1 15256 374.9 1216.3 1874.2 658.01989 373 2913 101.2 16188 424.7 1167.6 1928.7 752.21990 333 2500 90.2 12293 346.2 948.0 1523.4 559.91991 311 1729 62.2 9195 260.2 725.0 1170.1 416.61992 292 2168 77.6 10199 294.7 671.3 1176.4 491.01993 288 2132 85.3 10856 326.4 769.5 1351.2 569.91994 279 2437 103.8 12288 381.6 993.7 1688.9 691.81995 292 2834 124.3 14161 449.1 1242.4 2046.0 804.81996 311 2811 131.5 15021 469.4 1208.6 2118.6 899.81997 309 3167 139.0 17487 550.1 1502.1 2503.6 1005.8

182
Table II.4 Canadian Transportation Equipment Industry Statistics: Total Activity
Administration and Office Total Employees Cost of Shipment ValueYear Establi- Employees Wages & Material Value & Other Added
shment Number Salaries Number Salaries & Supplies Revenue($'000,000) ($'000,000) ($'000,000) ($'000,000) ($'000,000)
Motor Vehicle Parts and Accessories (SIC 325)1986 560 12882 478.5 85241 2466.2 6949.9 13199.1 6109.61987 552 N/A N/A 88550 2593.1 7259.1 13306.7 5858.41988 630 14028 561.5 94335 2905.4 8304.0 14876.0 6409.21989 679 14092 583.0 96254 3028.7 8973.8 15826.8 6630.11990 619 13298 578.5 86396 2832.7 8020.8 14264.4 5994.21991 580 12088 555.5 78264 2641.6 7287.8 13047.2 5512.11992 560 10506 504.3 83376 2873.1 8305.5 14449.6 5897.91993 554 11164 571.2 87974 3171.2 9657.0 17256.8 7398.31994 567 12197 648.6 92610 3573.4 12102.2 20751.1 8520.81995 601 13892 747.3 100673 4007.9 13121.5 22760.7 9367.11996 654 14038 776.8 101606 4046.3 13651.1 24236.4 10425.61997 658 15517 963.8 112172 4672.7 15953.1 27859.4 11714.5
Other Motor Vehicle Parts and Accessories (SIC 3259)1986 202 3644 130.2 22531 645.5 1672.8 3354.4 1638.11987 190 N/A N/A 23373 672.5 1767.0 3429.6 1621.91988 239 3882 143.6 27736 788.9 2200.0 3967.1 1725.31989 259 4255 170.4 28236 853.0 2380.6 4270.2 1837.21990 264 4537 189.8 28349 897.8 2429.7 4400.8 1916.11991 249 4632 211.0 29267 1026.1 2792.8 5046.4 2164.51992 237 3628 178.9 31545 1145.3 2973.5 5370.1 2326.11993 229 4046 206.5 30764 1147.1 3212.5 5718.8 2430.51994 230 4442 235.7 32016 1287.7 3981.3 6758.4 2721.71995 236 5003 272.1 35461 1464.1 4503.4 7473.4 2897.51996 261 5276 290.2 35973 1449.7 4576.4 7722.3 3077.11997 257 5895 336.1 39834 1694.1 5716.4 9466.4 3683.9
Table II.4 Canadian Transportation Equipment Industry Statistics: Total Activity
Administration and Office Total Employees Cost of Shipment ValueYear Establi- Employees Wages & Material Value & Other Added
shment Number Salaries Number Salaries & Supplies Revenue($'000,000) ($'000,000) ($'000,000) ($'000,000) ($'000,000)
Boat building and Repair Industry (SIC 328)1986 359 330 8575.0 4294 78.9 202.1 356.4 146.21987 327 N/A N/A 5089 93.6 270.2 442.7 170.31988 379 453 13.2 5603 110.5 295.3 489.6 195.41989 326 441 13.7 5215 112.6 278.1 463.3 181.31990 314 290 10.6 4046 96.8 197.7 357.5 157.21991 252 327 11.0 3000 76.9 130.0 268.7 133.01992 233 426 13.8 2671 69.1 101.2 236.1 130.91993 198 417 14.0 2639 72.5 113.7 246.5 131.41994 196 492 17.7 3377 91.6 164.3 335.2 167.61995 227 556 21.2 4152 112.5 261.1 469.8 221.51996 249 627 24.2 4878 123.5 280.8 520.8 250.41997 230 659 25.0 5083 128.3 268.6 546.6 254.7
Motor Vehicle Industry (SIC 323)1986 26 11937 510.6 53544 2066.5 35465.5 40462.4 4784.31987 27 N/A N/A 52034 2116.4 34309.1 39093.2 4751.31988 28 11330 545.4 52681 2248.6 40276.0 46790.4 6270.21989 30 11502 570.2 55392 2433.2 39325.6 46121.0 6746.61990 32 11745 575.1 56089 2366.7 36846.5 43241.0 6161.21991 35 11091 561.6 55678 2461.6 37815.5 44044.6 6100.81992 33 11091 561.6 55678 2461.6 37815.5 44044.6 6100.81993 31 10890 606.4 54192 2849.4 53801.0 62328.8 8250.61994 27 10904 652.4 54349 3078.9 62935.9 73200.9 10276.01995 27 10556 682.3 54088 3101.9 65384.5 77162.5 11702.91996 26 9827 657.3 50064 2925.8 78778.1 92390.1 13466.81997 25 8787 613.5 50507 3132.4 63201.0 75363.8 11777.9
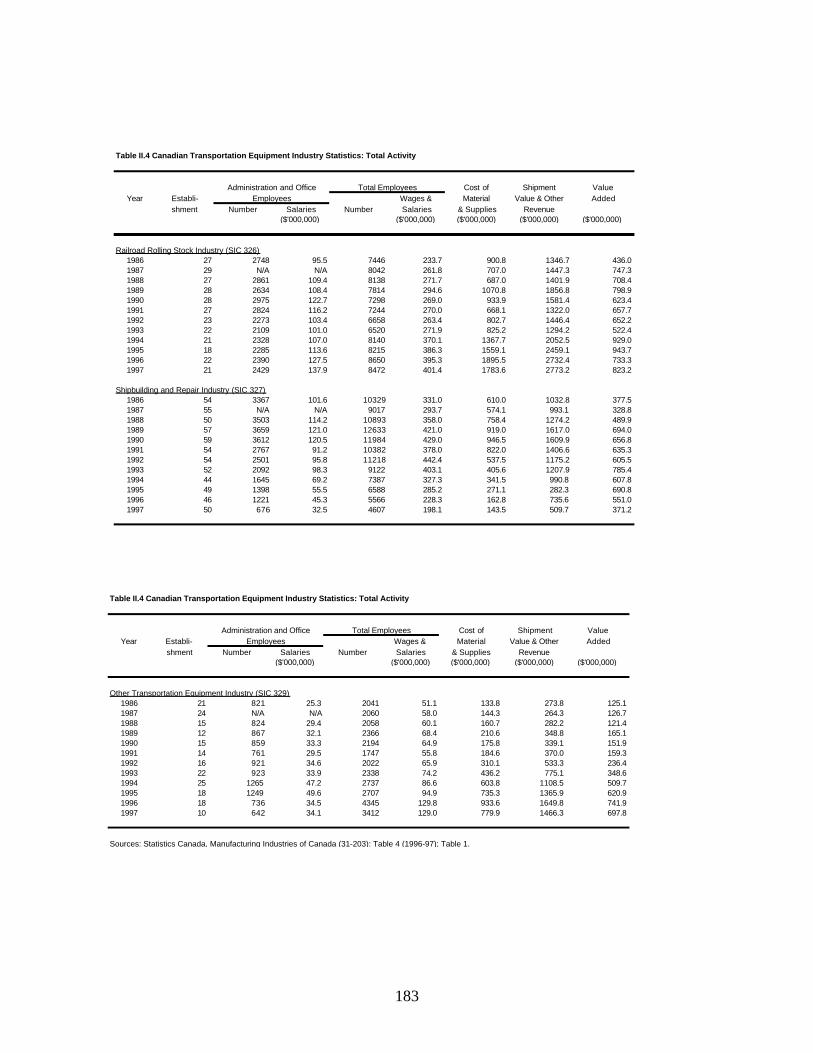
183
Table II.4 Canadian Transportation Equipment Industry Statistics: Total Activity
Administration and Office Total Employees Cost of Shipment ValueYear Establi- Employees Wages & Material Value & Other Added
shment Number Salaries Number Salaries & Supplies Revenue($'000,000) ($'000,000) ($'000,000) ($'000,000) ($'000,000)
Railroad Rolling Stock Industry (SIC 326)1986 27 2748 95.5 7446 233.7 900.8 1346.7 436.01987 29 N/A N/A 8042 261.8 707.0 1447.3 747.31988 27 2861 109.4 8138 271.7 687.0 1401.9 708.41989 28 2634 108.4 7814 294.6 1070.8 1856.8 798.91990 28 2975 122.7 7298 269.0 933.9 1581.4 623.41991 27 2824 116.2 7244 270.0 668.1 1322.0 657.71992 23 2273 103.4 6658 263.4 802.7 1446.4 652.21993 22 2109 101.0 6520 271.9 825.2 1294.2 522.41994 21 2328 107.0 8140 370.1 1367.7 2052.5 929.01995 18 2285 113.6 8215 386.3 1559.1 2459.1 943.71996 22 2390 127.5 8650 395.3 1895.5 2732.4 733.31997 21 2429 137.9 8472 401.4 1783.6 2773.2 823.2
Shipbuilding and Repair Industry (SIC 327)1986 54 3367 101.6 10329 331.0 610.0 1032.8 377.51987 55 N/A N/A 9017 293.7 574.1 993.1 328.81988 50 3503 114.2 10893 358.0 758.4 1274.2 489.91989 57 3659 121.0 12633 421.0 919.0 1617.0 694.01990 59 3612 120.5 11984 429.0 946.5 1609.9 656.81991 54 2767 91.2 10382 378.0 822.0 1406.6 635.31992 54 2501 95.8 11218 442.4 537.5 1175.2 605.51993 52 2092 98.3 9122 403.1 405.6 1207.9 785.41994 44 1645 69.2 7387 327.3 341.5 990.8 607.81995 49 1398 55.5 6588 285.2 271.1 282.3 690.81996 46 1221 45.3 5566 228.3 162.8 735.6 551.01997 50 676 32.5 4607 198.1 143.5 509.7 371.2
Table II.4 Canadian Transportation Equipment Industry Statistics: Total Activity
Administration and Office Total Employees Cost of Shipment ValueYear Establi- Employees Wages & Material Value & Other Added
shment Number Salaries Number Salaries & Supplies Revenue($'000,000) ($'000,000) ($'000,000) ($'000,000) ($'000,000)
Other Transportation Equipment Industry (SIC 329)1986 21 821 25.3 2041 51.1 133.8 273.8 125.11987 24 N/A N/A 2060 58.0 144.3 264.3 126.71988 15 824 29.4 2058 60.1 160.7 282.2 121.41989 12 867 32.1 2366 68.4 210.6 348.8 165.11990 15 859 33.3 2194 64.9 175.8 339.1 151.91991 14 761 29.5 1747 55.8 184.6 370.0 159.31992 16 921 34.6 2022 65.9 310.1 533.3 236.41993 22 923 33.9 2338 74.2 436.2 775.1 348.61994 25 1265 47.2 2737 86.6 603.8 1108.5 509.71995 18 1249 49.6 2707 94.9 735.3 1365.9 620.91996 18 736 34.5 4345 129.8 933.6 1649.8 741.91997 10 642 34.1 3412 129.0 779.9 1466.3 697.8
Sources: Statistics Canada, Manufacturing Industries of Canada (31-203): Table 4 (1996-97); Table 1.

184
APPENDIX III GOVERNMENT AND EMPLOYMENT
Table III.1 Government Expenditures on Transportation ($ Million)
Year 1991/92 1992/93 1993/94 1994/95 1995/96 1996/97 1997/98
Air 117 99 91 89 105 102 78Water 169 143 126 130 99 87 96Rail 16 16 22 19 27 11 2Roads and Highways 6144 5885 5906 6185 6376 5802 5977Public Transit 1369 1213 1215 1308 1287 1275 1294Multimodal 210 208 208 190 193 159 172
Total Gross Expenditures 8025 7564 7568 7921 8087 7436 7619
Less Federal Transfers (154) (126) (228) (279) (325) (301) (638)
Total Net Expenditures 7871 7438 7340 7642 7762 7135 6981
Gross Transportation Expenditures as a % of Provincial Government Expenditures5.4% 4.9% 4.9% 5.0% 5.0% 4.7% 4.8%
Source: Donner Report (Prokop, 1999) Table 2.1
Table III.2 Local Government Expenditures on Transportation ($ Million)
Year 1991 1992 1993 1994 1995 1996 1997
Gross Expenditures 7365 7604 7728 7971 8337 8114 8001Roads and Streets 5967 5950 6084 6334 6623 6375 6256Public Transit 1297 1558 1534 1535 1580 1613 1636Other Transportation 101 96 110 102 134 126 109
Less Transfers (1715) (1742) (1734) (1989) (2206) (1506) (1229)Provincial 1695 1715 1708 1904 2040 1375 1195Federal 20 27 26 85 166 131 104
Net Expenditures 5650 5862 5994 5982 6131 6608 6772
Gross Transportation Expenditures as a % of Total Local Government Expenditures20.1% 19.8% 19.7% 20.0% 20.2% 20.7% 20.4%
Source: Donner Report (Prokop, 1999) Table 2.2

185
Table III.3 Average Weekly Earnings in the Transport Sector by Mode (Current Dollars)
Total PublicTransport Rail Water1 Air1 Truck Transit Other2
Year
1985 515 589 561 592 482 459 4491990 602 770 683 719 544 513 5361995 684 942 799 789 599 590 6311996 695 977 813 803 613 577 6591997 716 999 829 816 638 627 6901998* 729 990 830 812 671 633 695
Note: Table does not include owner-operators, private trucking, delivery services, or gov't. employees1. Does not include incidental services2. 'Other' includes taxis, inter-urban, pipeline, and other modes* Average based on the first ten months of 1998Source: Donner Report (Prokop, 1999) Table 2.5.
Table III.4 Employment by Industry in Manitoba, Est. ('000)
Year 1986 1987 1988 1989 1990 1991 1992 1993 1994 1995 1996 1997 1998
061-092 Mining, quarrying, and oil wells 4.1 4.1 4.2 4.6 4.5 4.1 4.1 3.8 3.6 3.4 2.9 3.9 3.8101-399 Manufacturing 59.8 61.7 62.5 62.3 60.6 51.5 50.0 49.1 48.5 53.2 55.1 57.5 61.1
Non-durable goods 32.0 32.7 33.1 32.1 30.7 26.7 25.1 24.6 23.4 25.3 24.6 25.4 27.0Durable goods 27.8 29.0 29.4 30.2 29.9 24.8 24.9 24.5 25.1 27.9 30.5 32.1 34.1321-329 Transportation Equipment 6.3 6.5 6.7 7.2 7.6 7.0 6.8 6.6 6.8 6.8 7.7 8.7 10.0321 Aircraft and parts 2.8 3.2 3.2 3.6 4.1 3.8 3.6 3.5 3.3 3.0 2.9 3.2 3.7
401-449 Construction 15.7 17.3 16.5 15.2 15.5 13.8 13.6 12.3 13.2 13.9 14.2 14.3 15.7041-499 Goods producing industries 85.7 89.6 89.9 88.9 87.4 76.2 74.4 71.9 71.8 77.2 79.1 82.5 87.6451-499 Transportation, storage, communication 41.0 40.6 41.4 42.7 42.4 42.4 42.1 41.7 42.7 43.1 43.5 42.6 42.8
451-459 Transportation 24.6 23.4 24.1 25.3 24.6 24.0 22.8 23.3 24.1 24.2 23.9 23.9 24.0481-484 Communication 9.9 10.4 10.5 10.7 10.8 11.4 11.7 10.9 10.9 10.8 10.6 10.0 10.1
Table III.5 Average Weekly Earnings in Manitoba, Est.($)
Year 1986 1987 1988 1989 1990 1991 1992 1993 1994 1995 1996 1997 1998
061-092 Mining, quarrying, and oil wells 638.69 647.85 719.89 823.78 823.54 861.86 888.46 922.92 910.14 988.99 983.15 909.33 903.13101-399 Manufacturing 406.45 429.57 445.13 466.47 485.08 509.38 524.53 528.65 541.09 542.60 587.82 605.08 615.79
Non-durable goods 383.99 406.23 416.64 433.61 451.79 476.04 485.38 492.92 503.20 509.53 533.99 549.50 575.17Durable goods 432.27 455.94 477.22 501.45 519.32 545.20 563.97 564.56 576.38 572.65 631.26 649.06 647.94321-329 Transportation Equipment 458.44 479.14 493.75 515.18 543.66 565.63 610.79 606.56 597.11 583.57 656.60 684.94 690.79321 Aircraft and parts 499.39 523.03 537.78 549.50 589.90 619.03 709.29 732.48 746.13 748.17 764.37 777.20 754.53
401-449 Construction 500.19 519.90 533.19 551.05 573.86 571.26 586.82 570.53 620.40 627.84 615.52 629.04 609.54041-499 Goods producing industries 448.99 471.38 489.60 515.60 537.74 559.68 578.18 579.61 596.53 602.06 628.72 643.34 644.06451-499 Transportation, storage, communication 555.16 570.59 598.30 629.33 652.19 656.66 668.89 666.07 670.88 688.58 698.18 716.33 707.33
451-459 Transportation 555.09 576.43 609.74 639.72 654.05 660.31 678.39 662.04 661.04 676.05 686.39 709.83 700.45481-484 Communication 525.98 521.23 534.24 568.46 599.60 600.82 592.64 600.67 607.03 616.74 620.26 620.64 604.69
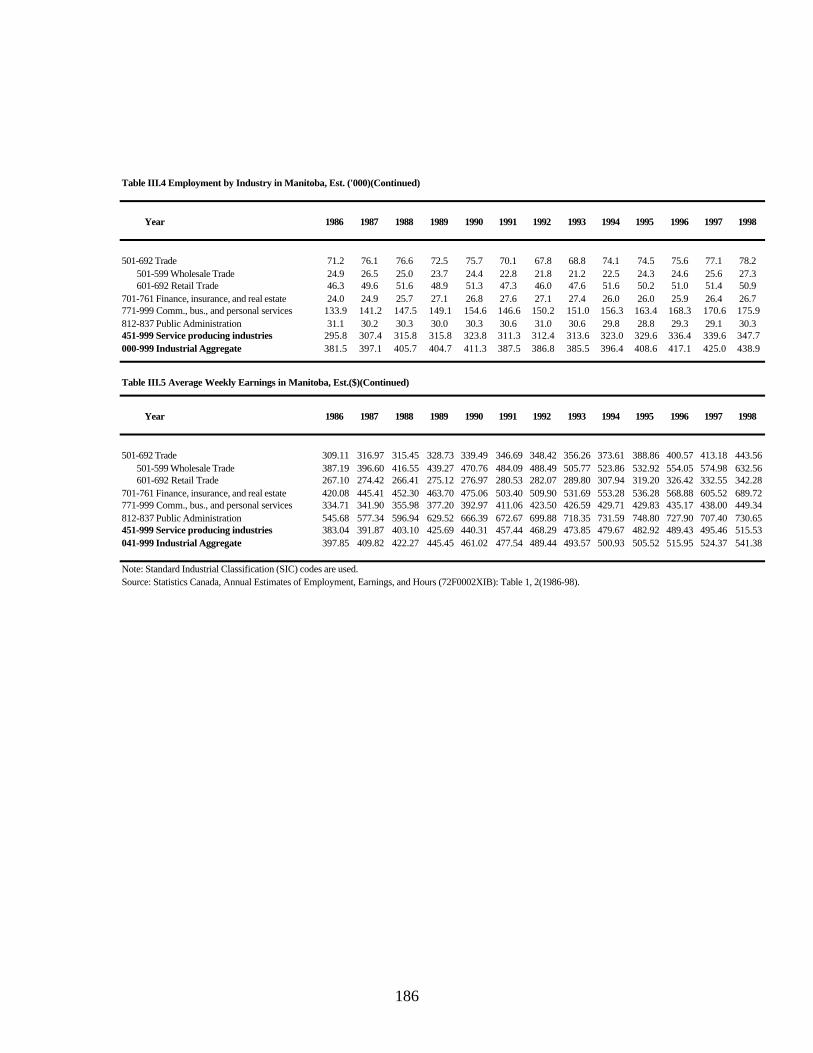
186
Table III.4 Employment by Industry in Manitoba, Est. ('000)(Continued)
Year 1986 1987 1988 1989 1990 1991 1992 1993 1994 1995 1996 1997 1998
501-692 Trade 71.2 76.1 76.6 72.5 75.7 70.1 67.8 68.8 74.1 74.5 75.6 77.1 78.2501-599 Wholesale Trade 24.9 26.5 25.0 23.7 24.4 22.8 21.8 21.2 22.5 24.3 24.6 25.6 27.3601-692 Retail Trade 46.3 49.6 51.6 48.9 51.3 47.3 46.0 47.6 51.6 50.2 51.0 51.4 50.9
701-761 Finance, insurance, and real estate 24.0 24.9 25.7 27.1 26.8 27.6 27.1 27.4 26.0 26.0 25.9 26.4 26.7771-999 Comm., bus., and personal services 133.9 141.2 147.5 149.1 154.6 146.6 150.2 151.0 156.3 163.4 168.3 170.6 175.9812-837 Public Administration 31.1 30.2 30.3 30.0 30.3 30.6 31.0 30.6 29.8 28.8 29.3 29.1 30.3451-999 Service producing industries 295.8 307.4 315.8 315.8 323.8 311.3 312.4 313.6 323.0 329.6 336.4 339.6 347.7000-999 Industrial Aggregate 381.5 397.1 405.7 404.7 411.3 387.5 386.8 385.5 396.4 408.6 417.1 425.0 438.9
Table III.5 Average Weekly Earnings in Manitoba, Est.($)(Continued)
Year 1986 1987 1988 1989 1990 1991 1992 1993 1994 1995 1996 1997 1998
501-692 Trade 309.11 316.97 315.45 328.73 339.49 346.69 348.42 356.26 373.61 388.86 400.57 413.18 443.56501-599 Wholesale Trade 387.19 396.60 416.55 439.27 470.76 484.09 488.49 505.77 523.86 532.92 554.05 574.98 632.56601-692 Retail Trade 267.10 274.42 266.41 275.12 276.97 280.53 282.07 289.80 307.94 319.20 326.42 332.55 342.28
701-761 Finance, insurance, and real estate 420.08 445.41 452.30 463.70 475.06 503.40 509.90 531.69 553.28 536.28 568.88 605.52 689.72771-999 Comm., bus., and personal services 334.71 341.90 355.98 377.20 392.97 411.06 423.50 426.59 429.71 429.83 435.17 438.00 449.34812-837 Public Administration 545.68 577.34 596.94 629.52 666.39 672.67 699.88 718.35 731.59 748.80 727.90 707.40 730.65451-999 Service producing industries 383.04 391.87 403.10 425.69 440.31 457.44 468.29 473.85 479.67 482.92 489.43 495.46 515.53041-999 Industrial Aggregate 397.85 409.82 422.27 445.45 461.02 477.54 489.44 493.57 500.93 505.52 515.95 524.37 541.38
Note: Standard Industrial Classification (SIC) codes are used.Source: Statistics Canada, Annual Estimates of Employment, Earnings, and Hours (72F0002XIB): Table 1, 2(1986-98).