translink annual report & accounts 2016/17 · · 2017-08-24northern ireland transport holding...
TRANSCRIPT
Translink Annual Report & Accounts 2016/17

ANNUAL REPORT AND ACCOUNTS 2016/17
2
04 STRATEGIC REPORT
3
CONTENTS01 Officers and Advisers 04
02Chairman’s Foreword 05
03Northern Ireland Transport Holding Company (NITHC) Board 06
04Strategic Report 08
05Directors’ Report 26
06Directors’ Responsibilities 28
07Corporate Governance Statement 29
08Audit and Risk Committee Report 35
09Safety Oversight Committee Report 37
10 Directors’ Remuneration Report 38
11Independent Auditor’s Report to the Members of Northern Ireland Transport Holding Company 41
12Consolidated Income Statement 43
13Consolidated Statement of Comprehensive Income 44
14Consolidated Balance Sheet 45
15Company Balance Sheet 46
16Statement of Changes in Reserves 47
17Consolidated Cash Flow Statement 48
18Notes to the Consolidated Financial Statements 49
ANNUAL REPORT AND ACCOUNTS 2016/17
4
DirectorsMr Frank Hewitt (Chairman)Mr Chris Conway (Group Chief Executive)Mr Patrick Anderson (Chief Financial Officer)Mr Philip O’Neill (Chief Operating Officer)Mr Anthony Depledge OBEMr Bernard MitchellMrs Hilary McCartanMs Angela ReaveyDr Mark Sweeney OBE
Company SecretaryMr JP Irvine
Independent AuditorDeloitte (NI) LimitedChartered Accountants and Statutory AuditorBelfastUnited Kingdom
Head Office22 Great Victoria StreetBelfastBT2 7LX
BankersBank of Ireland54 Donegall PlaceBelfastBT1 5BX
Trading SubsidiariesUlsterbus LimitedCitybus LimitedNorthern Ireland Railways Company LimitedNIR Operations Limited
Non-trading SubsidiariesFlexibus LimitedTranslink (NI) LimitedNIR Networks Ltd
OFFICERS AND ADVISERS
02 CHAIRMAN’S FOREWORD
5
CHAIRMAN’S FOREWORDI am pleased to present the Annual Report and Accounts for the Northern Ireland Transport Holding Company (NITHC) for the year ended 26 March 2017. During the past year, the Group has continued to face challenges but significant progress has been made in stabilising the Group’s financial position and in increasing the numbers of passengers using our services.
I wish to record my thanks to the Department for Infrastructure for its ongoing support. While Chris Hazzard MLA left his Ministerial post in January 2017 with the dissolution of the Northern Ireland Executive, I would wish to record my thanks to him for his commitment and support during his time in office.
Constraints on public spending have continued to impact the Group's financial position, particularly the loss of fuel duty rebate and reduction of revenue support for unprofitable, but socially necessary services. However, the measures taken by the Board and Management Team to increase passenger numbers and to control operating costs have resulted in an annual outcome which is better than budgeted.
The Group’s loss for the financial year before tax and technical accounting adjustments was £10.9m (see Review of the Business on page 11) against a budgeted loss of £13.4m. The improved financial position is attributable to increased revenues, mainly through passenger numbers, and continued efforts to drive cost reductions and efficiencies in the Group. However, the losses do continue to put pressure on the Group’s Balance Sheet position. The Group’s loss for the financial year before tax and after technical accounting adjustments was £0.7m (2016: loss of £18.3m).
During the year, the Group recorded almost 80 million passenger journeys. This figure exceeded our budget for 2016/17 and our total passenger journeys in 2015/16. Passenger numbers increased on most of our services and in particular on Metro, Goldline and Northern Ireland Railways, demonstrating that passengers are responding positively to the improved comfort and punctuality which Translink now offers. We are already considering how we can attract more passengers with the introduction of new fleet, continuing to offer value for money fares, and with increased service frequency and comfort. Our fleet development programme has also included the introduction of new dedicated, high specification buses to serve Belfast International Airport, helping to support the growth of tourism in Northern Ireland.
We ran our first ever Bus and Train Week in May 2016, which stimulated much greater awareness of our public transport offering, and also highlighted the important role public transport plays in supporting economic growth, social inclusion, active lives and improving air quality. The Christmas transport plan for Belfast encouraged considerable numbers of passengers to travel into Belfast by bus and train for shopping and entertainment during the 2016 festive
season and in this context, I would wish to thank Belfast City Council for their invaluable support for this initiative.
Our Smartmovers campaign, which features some of our regular passengers, is also showing positive results in promoting the benefits of public transport.
Increased passenger numbers require increased focus on safety, both for our passengers and for our staff. We have continued to make safety our top priority and, while there will always be risks associated with our business, we will take every possible measure to ensure the safety of our passengers and staff.
Our capital development programme has proceeded and includes the completion of the second phase of the Derry~Londonderry to Coleraine railway line upgrade, further development on the Belfast Rapid Transit Network, scheduled for introduction in 2018, and on the Belfast and Derry~Londonderry transport hubs. The Board of NITHC regards these projects as key to the development of a modern public service network in Northern Ireland and is encouraged by the emphasis on public transport in the draft Programme for Government with Translink as the key delivery partner.
Despite the challenges which we face, politically and financially, the Board believes that 2016/17 provided concrete evidence that progress can be made in effecting the travelling culture change that is required to improve the flow of people, goods and services throughout Northern Ireland, and to reduce the congestion, and improve the air quality, in our towns and cities. This culture change will necessitate continued capital investment in our public transport infrastructure and we trust that the Department for Infrastructure can, and will, continue to provide the funding to maintain the appropriate level of investment. A public transport system which aims to provide an acceptable level of accessibility for most, if not all, of the population of Northern Ireland, will, however, also need significant levels of revenue support and it is our hope that Departments, and public representatives, will recognise and respond to this need. For its part, NITHC stands ready to play its part, and to work with all those concerned to deliver the standard of public transport that Northern Ireland needs, and deserves.
Finally, on behalf of the Board, I wish to thank the entire Translink team for its effort and commitment during 2016/17.
Frank HewittChairman21 June 2017
ANNUAL REPORT AND ACCOUNTS 2016/17
6
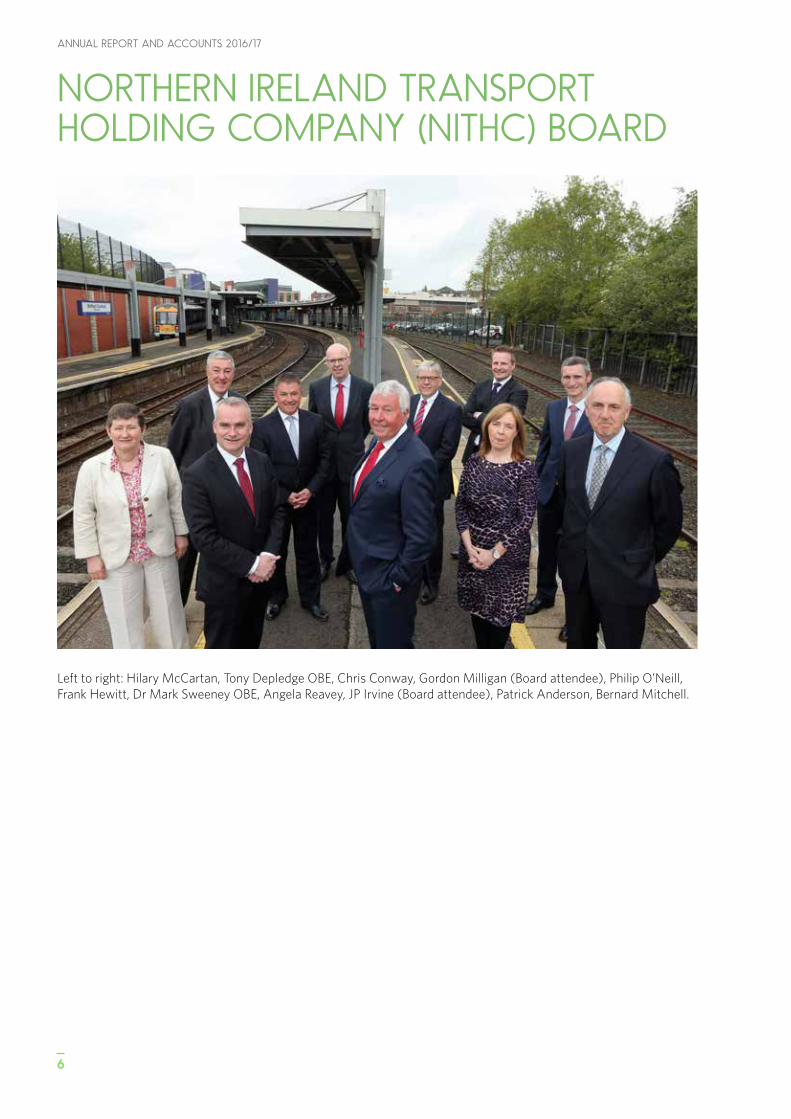
NORTHERN IRELAND TRANSPORT HOLDING COMPANY (NITHC) BOARD
Left to right: Hilary McCartan, Tony Depledge OBE, Chris Conway, Gordon Milligan (Board attendee), Philip O’Neill, Frank Hewitt, Dr Mark Sweeney OBE, Angela Reavey, JP Irvine (Board attendee), Patrick Anderson, Bernard Mitchell.
7
03 NORTHERN IRELAND TRANSPORT HOLDING COMPANY (NITHC) BOARD
1. Frank Hewitt Chairman Appointed Group Chairman in July 2015 and a
Non-Executive Director of the Company between 2011 and 2015, Frank’s career spans both the public and private sectors and he has held a number of public appointments. He is currently a UK board member of the Big Lottery Fund and a Non-Executive Board member of the Strategic Investment Board.
2. Chris Conway Group Chief Executive Chris graduated from the University of Ulster with
a BSc in Engineering and also has an MBA from the University of Ulster. He has extensive international business experience with Tata Steel Europe where he worked as Managing Director Tata Steel Distribution Ireland and previously as Vice President Operations for Nortel Networks in Europe. Chris is a Chartered Company Director and a Fellow of the Institute of Directors. He is a member of the CBI NI Council and Business in the Community NI advisory board.
3. Hilary McCartan Non-Executive Director Appointed as a Non-Executive Director in January
2016, Hilary has held senior management posts in the private sector and Non-Executive roles in the public sector. She is a Fellow of Chartered Accountants Ireland. Hilary currently holds the following public appointments: a Commissioner for Londonderry Port and Harbour Commissioners and a Non-Executive Director of the Southern Health and Social Care Trust.
4. Tony Depledge OBE Non-Executive Director Appointed as a Non-Executive Director in 2011,
Tony has a background in passenger transport management in both the public and private sectors. He is Chairman of UniversityBus Ltd, the bus-operating subsidiary of the University of Hertfordshire and is a trustee of the Rees Jeffreys Road Fund. Tony is a Fellow of the Chartered Institute of Logistics and Transport and is an honorary President of the European Union Committee of the international transport trade association UITP.
5. Dr Mark Sweeney OBE Non-Executive Director Appointed as a Non-Executive Director in January
2016, Mark has a background in the industrial, commercial and manufacturing sectors within Northern Ireland and globally. He is a former Vice President of Caterpillar and was Global Operations Director for Caterpillar's Electric Power Division and Managing Director of FG Wilson Eng. Ltd. He is a Fellow of the Institution of Mechanical Engineers and is currently a Non-Executive Director of Invest NI.
6. Philip O’Neill Chief Operating Officer Appointed as a Director in April 2010, Philip
commenced work with the Group in 1979 and since then has held various technical and managerial positions in Ulsterbus, Citybus and NI Railways. In February 2009, Philip was appointed as Chief Operating Officer.
7. Angela Reavey Non-Executive Director Appointed as a Non-Executive Director in January
2016, a Fellow of Chartered Accountants Ireland, Angela has experience working at a senior level in both the public and private sectors. She is a past Chairman of the Chartered Accountants Ireland – Ulster Society and former Board member of the Northern Ireland Science Park Foundation and Trustee of NISP CONNECT; she is currently a Board member of Firmus Energy.
8. Patrick Anderson Chief Financial Officer Paddy joined Translink as Chief Financial Officer in
2015. A Fellow of Chartered Accountants Ireland, Paddy has an extensive range of experience at Board level in both the private and public sectors, including utilities, health and central government. He is a Fellow of the Institute of Directors and completed the Chartered Director Programme in 2014.
9. Bernard Mitchell Non-Executive Director Appointed as a Non-Executive Director in February
2012, Bernard worked in the NI Health and Social Services from 1978 to 2011, including 10 years as a Chief Executive. He is currently Chair of the NI Guardian Ad Litem Agency and Co-Chair of the Audit and Risk Committee of Police Ombudsman for Northern Ireland. On a voluntary basis, he is a member of the Marie Curie Cancer Care NI Advisory Board and Chair of the Strand Arts Centre.
ANNUAL REPORT AND ACCOUNTS 2016/17
8
IntroductionAs a Public Corporation constituted under the Transport Act (Northern Ireland) 1967, NITHC is not bound by The Companies Act 2006 (Strategic Report and Directors’ Report) Regulations 2013 (‘The Act’). However, consistent with corporate entities of a similar size to the organisation, the members have adopted the main provisions of the Act and therefore present a Strategic Report.
Our Business The Translink Group consists of a Public Corporation, the Northern Ireland Transport Holding Company (NITHC) which owns and controls seven private limited subsidiary companies (together referred to as the Group or Translink). We are Northern Ireland’s main public transport provider.
According to the latest Office for National Statistics classifications, we are collectively referred to as a Public Non-Financial Corporation. This effectively means we are a market body with a degree of commercial independence that is governed in policy terms by the Department for Infrastructure (DfI).
Performance 2016/17Translink’s performance in 2016/17 has been against a backdrop of continued and very challenging reductions in public funding. This has reduced by 20% since 2013/14.
Losses for the year before tax and technical accounting adjustments were £10.9m, compared to £10.5m for the prior year. (See Review of the Business on page 11).
The organisation has developed a business improvement strategy to ensure the ongoing efficiency of its operations while also delivering on the draft Programme for Government (PfG) objective to grow the use of public transport. This strategy has four key objectives:• Operational excellence• Customer satisfaction• Value for money• Passenger growth
STRATEGIC REPORT
The Board can report good progress in respect of the strategy with approximately £6m of cost reduction in the year, building on the good work already achieved in 2015/16. There is also an ongoing cost reduction and revenue enhancing programme of activities which will deliver significant further financial benefits over the next three years.
There has been strong growth during 2016/17 in both bus and rail fare paying passengers with combined growth of around 1.5 million passenger journeys compared with the previous year. A total of almost 80 million passenger journeys was achieved.
Metro, Ulsterbus and NI Railways all achieved growth in fare-paying pupils and concessionary travel: no fares revision was applied during the year.
The Public Service Contract, which runs from October 2015 for at least five years, cements the implementation of European and Northern Ireland legislation. Translink is confirmed as a key delivery partner for the provision of public transport services with exclusive rights to operate the timetabled network in Northern Ireland.
The Group buys forward a significant proportion of its fuel costs to provide stability in respect of such costs for both budgeting and its passengers. This is reflected in the financial statements.
The retirement benefit obligation in the balance sheet increased from £120m in 2016 to £250m in the current year, primarily because of reduced yields on UK Bonds. This is a long-term liability and does not affect the ability of the Group to pay its debts as they fall due or the ability of the Group to operate as a going concern.

9
04 STRATEGIC REPORT
10
ANNUAL REPORT AND ACCOUNTS 2016/17
KEY ACHIEVEMENTS 2016/17
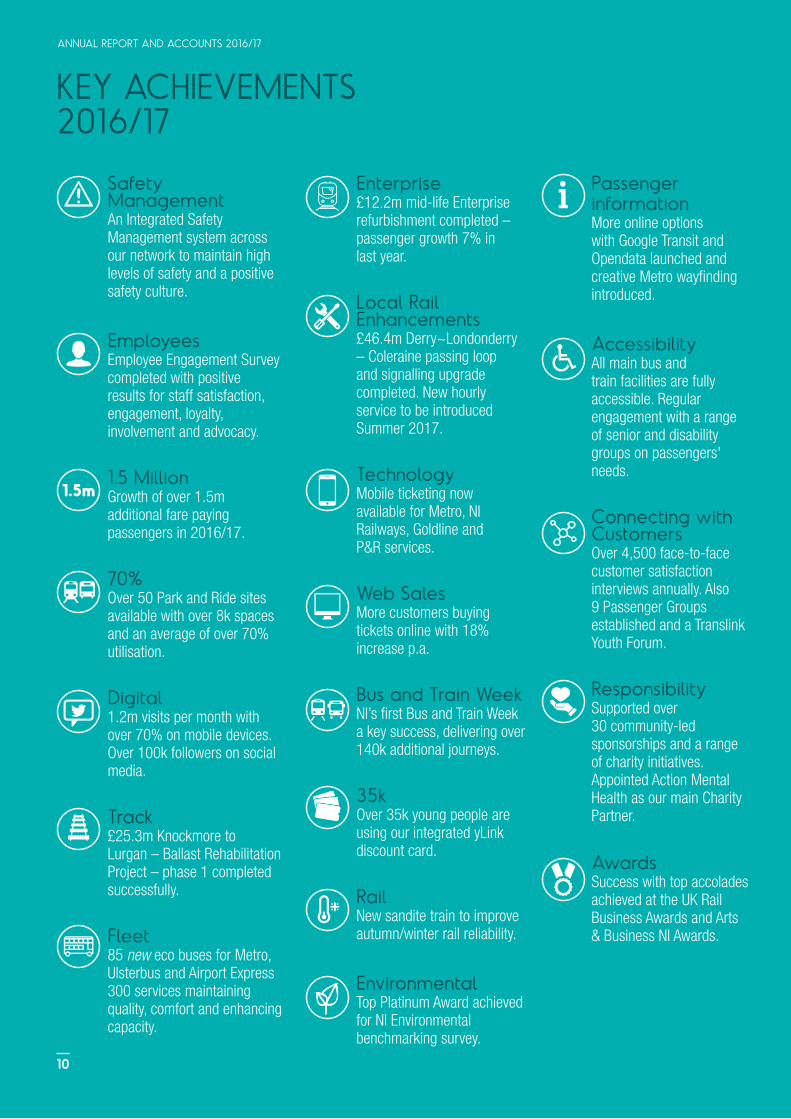
Safety Management An Integrated Safety Management system across our network to maintain high levels of safety and a positive safety culture.
EmployeesEmployee Engagement Survey completed with positive results for staff satisfaction, engagement, loyalty, involvement and advocacy.
1.5 Million Growth of over 1.5m additional fare paying passengers in 2016/17.
70% Over 50 Park and Ride sites available with over 8k spaces and an average of over 70% utilisation.
Digital1.2m visits per month with over 70% on mobile devices. Over 100k followers on social media.
Track£25.3m Knockmore to Lurgan – Ballast Rehabilitation Project – phase 1 completed successfully.
Fleet85 new eco buses for Metro, Ulsterbus and Airport Express 300 services maintaining quality, comfort and enhancing capacity.
Enterprise£12.2m mid-life Enterprise refurbishment completed – passenger growth 7% in last year.
Local Rail Enhancements£46.4m Derry~Londonderry – Coleraine passing loop and signalling upgrade completed. New hourly service to be introduced Summer 2017.
TechnologyMobile ticketing now available for Metro, NI Railways, Goldline and P&R services.
Web SalesMore customers buying tickets online with 18% increase p.a.
Bus and Train WeekNI’s first Bus and Train Week a key success, delivering over 140k additional journeys.
35kOver 35k young people are using our integrated yLink discount card.
RailNew sandite train to improve autumn/winter rail reliability.
EnvironmentalTop Platinum Award achieved for NI Environmental benchmarking survey.
Passenger informationMore online options with Google Transit and Opendata launched and creative Metro wayfinding introduced.
AccessibilityAll main bus and train facilities are fully accessible. Regular engagement with a range of senior and disability groups on passengers' needs.
Connecting with CustomersOver 4,500 face-to-face customer satisfaction interviews annually. Also 9 Passenger Groups established and a Translink Youth Forum.
ResponsibilitySupported over 30 community-led sponsorships and a range of charity initiatives. Appointed Action Mental Health as our main Charity Partner.
AwardsSuccess with top accolades achieved at the UK Rail Business Awards and Arts & Business NI Awards.
11
04 STRATEGIC REPORT
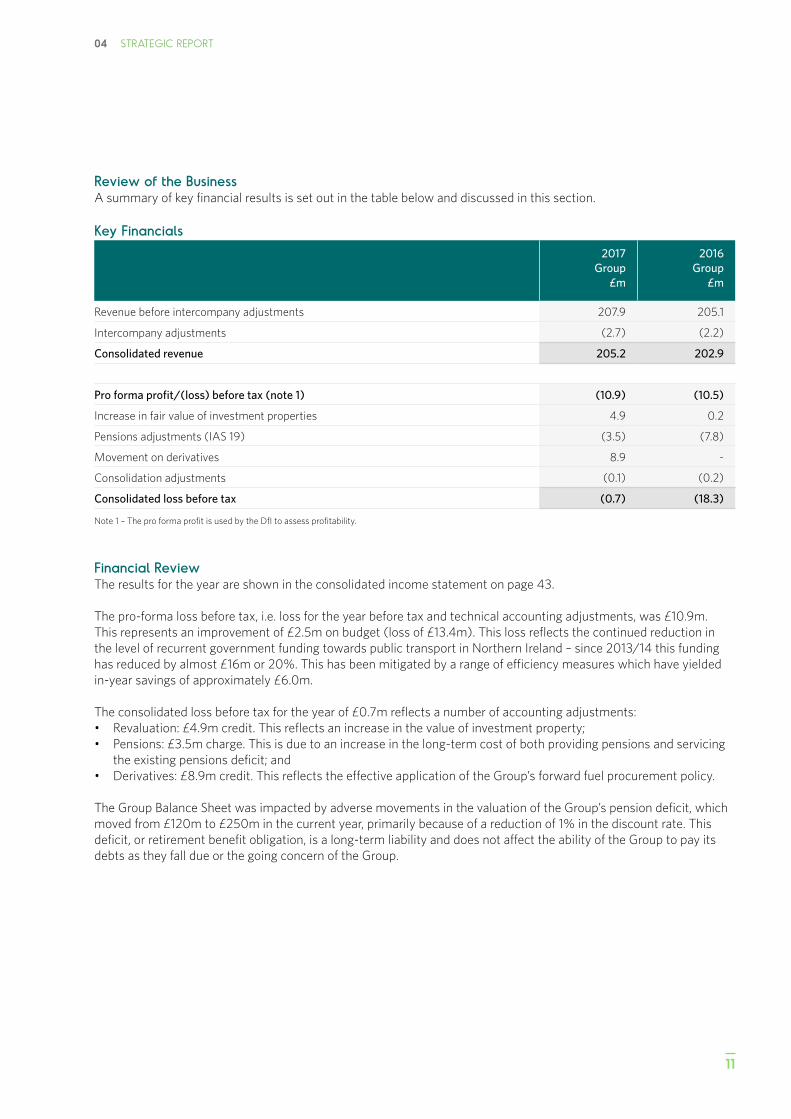
Review of the BusinessA summary of key financial results is set out in the table below and discussed in this section.
Key Financials
2017 Group
£m
2016Group
£m
Revenue before intercompany adjustments 207.9 205.1
Intercompany adjustments (2.7) (2.2)
Consolidated revenue 205.2 202.9
Pro forma profit/(loss) before tax (note 1) (10.9) (10.5)
Increase in fair value of investment properties 4.9 0.2
Pensions adjustments (IAS 19) (3.5) (7.8)
Movement on derivatives 8.9 -
Consolidation adjustments (0.1) (0.2)
Consolidated loss before tax (0.7) (18.3)
Note 1 – The pro forma profit is used by the DfI to assess profitability.
Financial ReviewThe results for the year are shown in the consolidated income statement on page 43.
The pro-forma loss before tax, i.e. loss for the year before tax and technical accounting adjustments, was £10.9m. This represents an improvement of £2.5m on budget (loss of £13.4m). This loss reflects the continued reduction in the level of recurrent government funding towards public transport in Northern Ireland – since 2013/14 this funding has reduced by almost £16m or 20%. This has been mitigated by a range of efficiency measures which have yielded in-year savings of approximately £6.0m.
The consolidated loss before tax for the year of £0.7m reflects a number of accounting adjustments:• Revaluation: £4.9m credit. This reflects an increase in the value of investment property; • Pensions: £3.5m charge. This is due to an increase in the long-term cost of both providing pensions and servicing
the existing pensions deficit; and• Derivatives: £8.9m credit. This reflects the effective application of the Group’s forward fuel procurement policy.
The Group Balance Sheet was impacted by adverse movements in the valuation of the Group’s pension deficit, which moved from £120m to £250m in the current year, primarily because of a reduction of 1% in the discount rate. This deficit, or retirement benefit obligation, is a long-term liability and does not affect the ability of the Group to pay its debts as they fall due or the going concern of the Group.
ANNUAL REPORT AND ACCOUNTS 2016/17
12
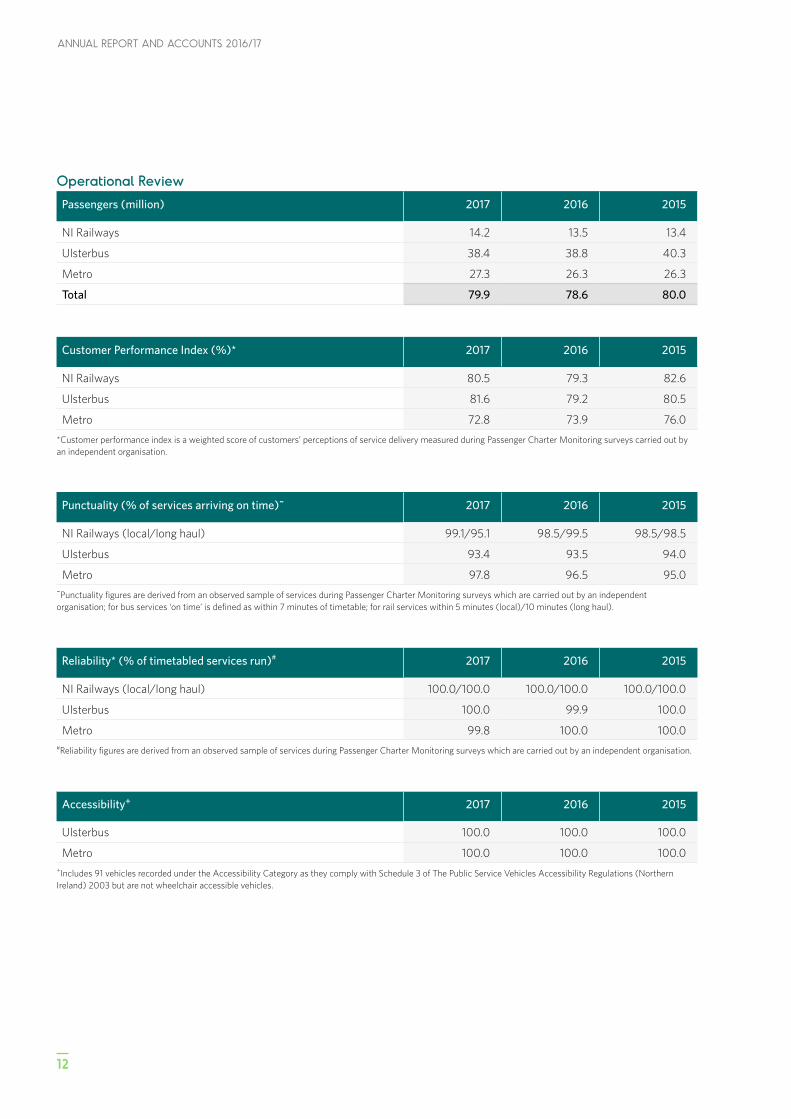
Operational Review
Passengers (million) 2017 2016 2015
NI Railways 14.2 13.5 13.4
Ulsterbus 38.4 38.8 40.3
Metro 27.3 26.3 26.3
Total 79.9 78.6 80.0
Customer Performance Index (%)* 2017 2016 2015
NI Railways 80.5 79.3 82.6
Ulsterbus 81.6 79.2 80.5
Metro 72.8 73.9 76.0
*Customer performance index is a weighted score of customers’ perceptions of service delivery measured during Passenger Charter Monitoring surveys carried out by an independent organisation.
Punctuality (% of services arriving on time)~ 2017 2016 2015
NI Railways (local/long haul) 99.1/95.1 98.5/99.5 98.5/98.5
Ulsterbus 93.4 93.5 94.0
Metro 97.8 96.5 95.0~Punctuality figures are derived from an observed sample of services during Passenger Charter Monitoring surveys which are carried out by an independent organisation; for bus services ‘on time’ is defined as within 7 minutes of timetable; for rail services within 5 minutes (local)/10 minutes (long haul).
Reliability* (% of timetabled services run)# 2017 2016 2015
NI Railways (local/long haul) 100.0/100.0 100.0/100.0 100.0/100.0
Ulsterbus 100.0 99.9 100.0
Metro 99.8 100.0 100.0#Reliability figures are derived from an observed sample of services during Passenger Charter Monitoring surveys which are carried out by an independent organisation.
Accessibility+ 2017 2016 2015
Ulsterbus 100.0 100.0 100.0
Metro 100.0 100.0 100.0+Includes 91 vehicles recorded under the Accessibility Category as they comply with Schedule 3 of The Public Service Vehicles Accessibility Regulations (Northern Ireland) 2003 but are not wheelchair accessible vehicles.

04 STRATEGIC REPORT
13
Capital Investment
Capital expenditure 2017£m
2016£m
Buses/coaches 23.0 7.9
Trains 3.6 12.0
Infrastructure 35.4 21.0
Other 19.3 9.7
Total 81.3 50.6
The investment in bus/coaches of £23.0m relates to the purchase of 10 Double Deck buses for Airport services, 33 Metro Double Decks and 40 Single Deck buses for Ulsterbus. Payments towards the purchase of a further 12 Double Deck High Capacity coaches for deployment on our Goldline network and 30 vehicles for the Belfast Rapid Transit project have also been made during the year.
Expenditure of £3.6m on trains relates to the overhaul of the Class 3000 and Class 4000 trains in addition to feasibility work on the New Trains 3 project.
Infrastructure expenditure of £35.4m includes £24.8m on Coleraine to Derry~Londonderry Renewals programme and £6.8m on Knockmore to Lurgan Track Ballast Rehabilitation project.
Other projects being progressed during the year include £3.6m on the Belfast Transport Hub, £2.3m on the new Central Workshop and Stores, £1.9m on the North-West Hub, £4.0m on the Future Ticketing project and £1.2m on the new Sandite and Water Jetting Machine.
Key Performance Indicators (KPIs)
2017 2016
Fleet size:
Buses/coaches 1,361 1,356
Rail Rolling Stock 45 sets 45 sets
Average fleet age (buses: years) 9.0 8.0
ANNUAL REPORT AND ACCOUNTS 2016/17
14
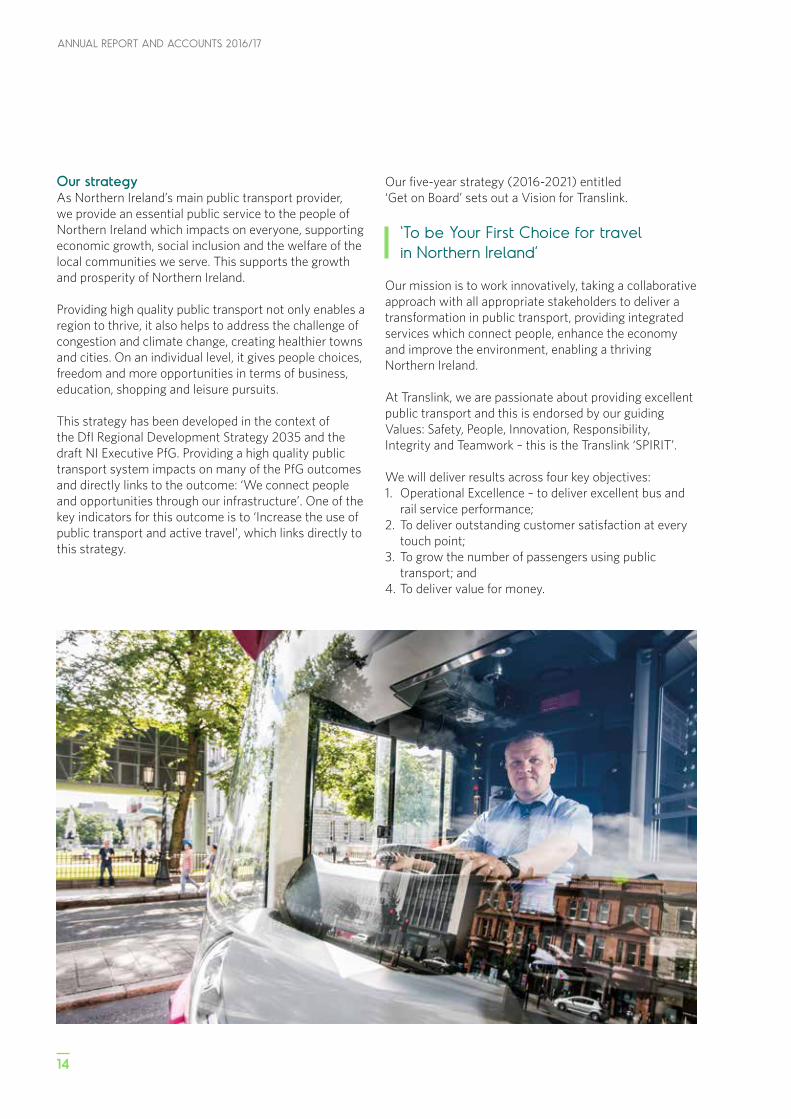
Our strategyAs Northern Ireland’s main public transport provider, we provide an essential public service to the people of Northern Ireland which impacts on everyone, supporting economic growth, social inclusion and the welfare of the local communities we serve. This supports the growth and prosperity of Northern Ireland.
Providing high quality public transport not only enables a region to thrive, it also helps to address the challenge of congestion and climate change, creating healthier towns and cities. On an individual level, it gives people choices, freedom and more opportunities in terms of business, education, shopping and leisure pursuits.
This strategy has been developed in the context of the DfI Regional Development Strategy 2035 and the draft NI Executive PfG. Providing a high quality public transport system impacts on many of the PfG outcomes and directly links to the outcome: ‘We connect people and opportunities through our infrastructure’. One of the key indicators for this outcome is to ‘Increase the use of public transport and active travel’, which links directly to this strategy.
Our five-year strategy (2016-2021) entitled ‘Get on Board’ sets out a Vision for Translink.
‘To be Your First Choice for travel in Northern Ireland’
Our mission is to work innovatively, taking a collaborative approach with all appropriate stakeholders to deliver a transformation in public transport, providing integrated services which connect people, enhance the economy and improve the environment, enabling a thriving Northern Ireland.
At Translink, we are passionate about providing excellent public transport and this is endorsed by our guiding Values: Safety, People, Innovation, Responsibility, Integrity and Teamwork – this is the Translink ‘SPIRIT’.
We will deliver results across four key objectives:1. Operational Excellence – to deliver excellent bus and
rail service performance;2. To deliver outstanding customer satisfaction at every
touch point;3. To grow the number of passengers using public
transport; and4. To deliver value for money.
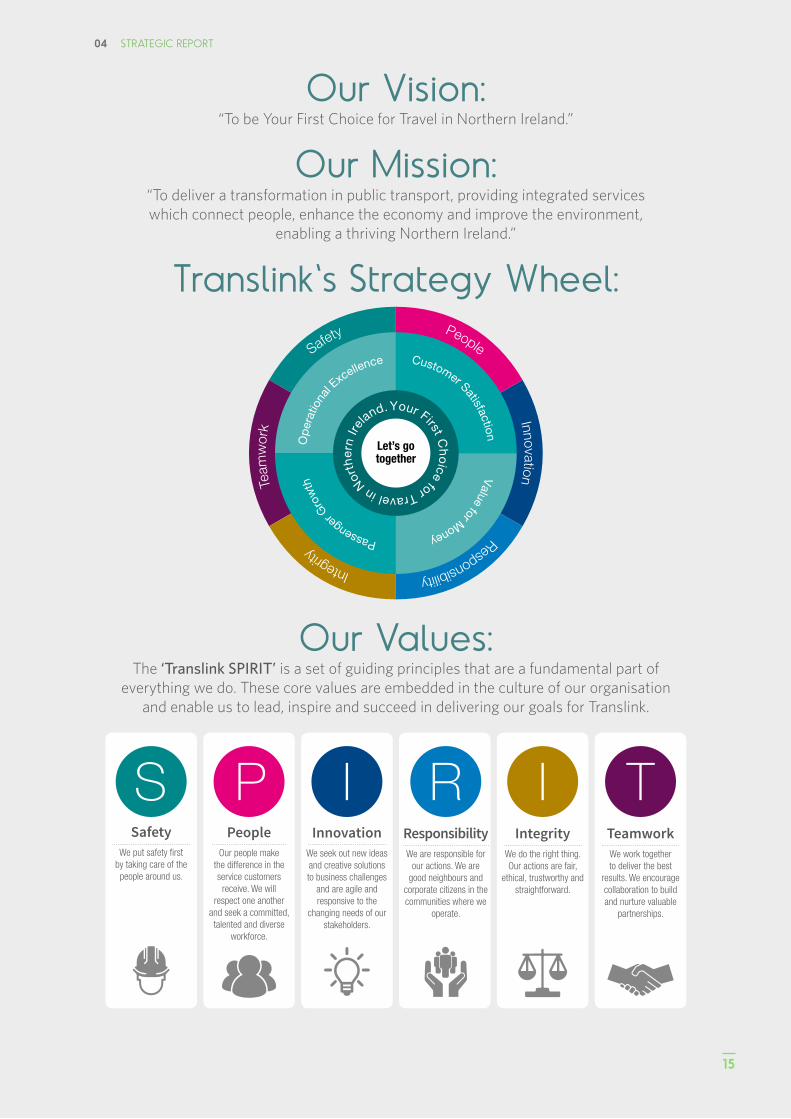
Translink's Strategy Wheel:
Our Vision: “To be Your First Choice for Travel in Northern Ireland.”
Our Mission:“To deliver a transformation in public transport, providing integrated services which connect people, enhance the economy and improve the environment,
enabling a thriving Northern Ireland.”
Our Values:The ‘Translink SPIRIT’ is a set of guiding principles that are a fundamental part of
everything we do. These core values are embedded in the culture of our organisation and enable us to lead, inspire and succeed in delivering our goals for Translink.
SafetyWe put safety first
by taking care of the people around us.
PeopleOur people make
the difference in the service customers
receive. We will respect one another
and seek a committed, talented and diverse
workforce.
InnovationWe seek out new ideas and creative solutions to business challenges
and are agile and responsive to the
changing needs of our stakeholders.
ResponsibilityWe are responsible for
our actions. We are good neighbours and
corporate citizens in the communities where we
operate.
Integrity We do the right thing. Our actions are fair,
ethical, trustworthy and straightforward.
TeamworkWe work together to deliver the best
results. We encourage collaboration to build and nurture valuable
partnerships.
04 STRATEGIC REPORT
15
ANNUAL REPORT AND ACCOUNTS 2016/17
16
OBJECTIVE 1:To deliver excellent bus and rail service performance. At Translink we recognise that to achieve our Vision and deliver on our Mission we must offer an integrated service across our bus, coach and rail services that exceeds customer expectations on punctuality and reliability.
SafetyThe safety and wellbeing of our customers, employees and the general public remains central to Translink’s operations. A significant work programme is in place to deliver, enhance and maintain safe systems, a positive safety culture, emergency preparedness and high profile public safety campaigns in support of this commitment.
As a large and complex organisation with responsibility for the safe transport of people as they go about their everyday lives, we do not leave safety to chance. Our Safety Management System guides our organisation in everything that we do and we strive to engage each and every one of our employees to live by the key principles of behavioural safety.
Our Safety Management System aims to have zero staff or passenger safety incidents.
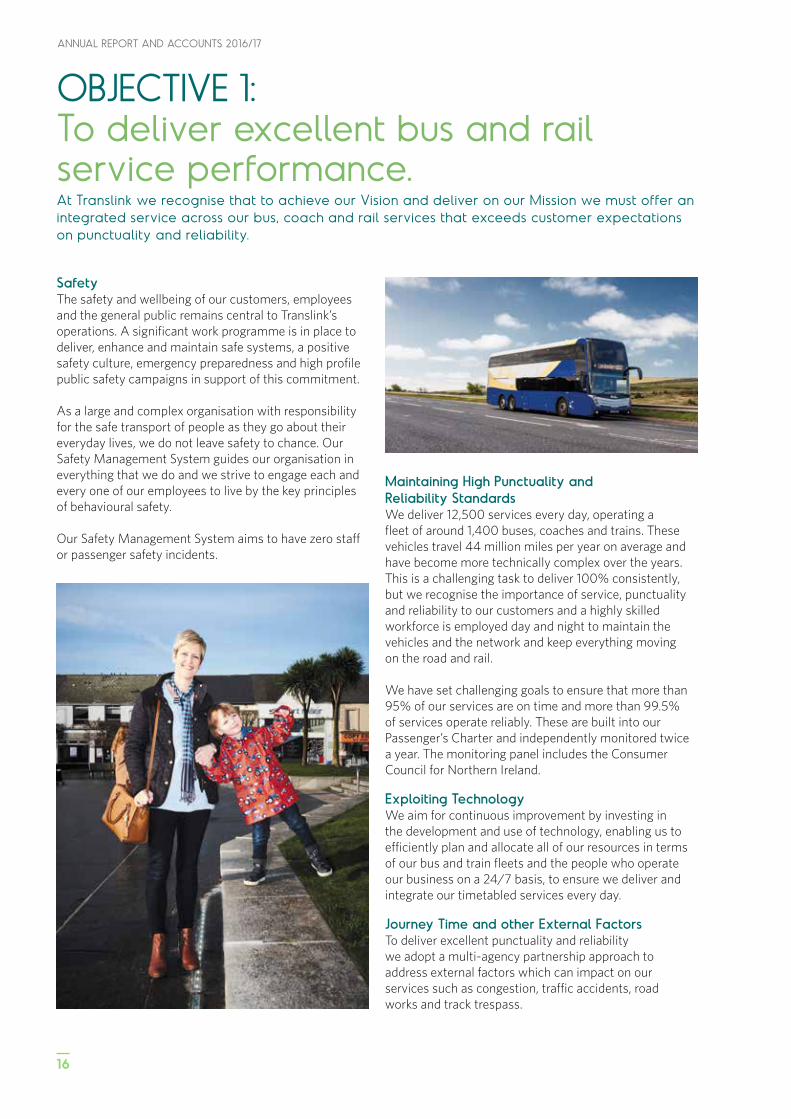
Maintaining High Punctuality and Reliability StandardsWe deliver 12,500 services every day, operating a fleet of around 1,400 buses, coaches and trains. These vehicles travel 44 million miles per year on average and have become more technically complex over the years. This is a challenging task to deliver 100% consistently, but we recognise the importance of service, punctuality and reliability to our customers and a highly skilled workforce is employed day and night to maintain the vehicles and the network and keep everything moving on the road and rail.
We have set challenging goals to ensure that more than 95% of our services are on time and more than 99.5% of services operate reliably. These are built into our Passenger’s Charter and independently monitored twice a year. The monitoring panel includes the Consumer Council for Northern Ireland.
Exploiting TechnologyWe aim for continuous improvement by investing in the development and use of technology, enabling us to efficiently plan and allocate all of our resources in terms of our bus and train fleets and the people who operate our business on a 24/7 basis, to ensure we deliver and integrate our timetabled services every day.
Journey Time and other External FactorsTo deliver excellent punctuality and reliability we adopt a multi-agency partnership approach to address external factors which can impact on our services such as congestion, traffic accidents, road works and track trespass.
04 STRATEGIC REPORT
17
Fleet Strategy We are continuing to work on bringing forward plans to improve the frequency and capacity on the rail network and have a Rail Network Utilisation Strategy which prioritises our investment needs arising from the Future Rail Investment Strategy.
The Network Utilisation Strategy has been developed to scope potential fleet investment in order to increase passenger capacity on the rail network.
In order to maintain the attractiveness of our services, we aim to have a bus fleet with an average age of eight years. It is important we establish a sustained programme of vehicle replacement and retire older vehicles to maintain our high standards of quality, comfort and accessibility for all our passengers.
We need to ensure we are operating with the most environmentally friendly and fuel efficient vehicles across our fleet and will continue to invest in low emissions technologies in our future fleet procurement.
Network ResilienceOur trains operate over 300 miles of track including many bridges, level crossings and signals and
we routinely inspect and efficiently maintain this infrastructure to high technical, operational and safety standards. We will renew assets as they approach the end of their useful life which is measured on a balance of safety, economy, availability, reliability and ongoing maintenance. This ensures we maintain operational efficiency.
We are also developing plans to upgrade the rail infrastructure and improve journey times across the network, with work started on the line between Lisburn and Lurgan.
PeopleWe are proud to be recognised as an Investor in People (IIP) having attained a number of awards throughout the organisation. We will continue to provide excellent learning and development opportunities in order to give employees the opportunity to stretch themselves, to do more and new things.
We are committed to creating a diverse workforce as we recognise the benefits this brings to our organisation. By working together to enhance our business environment, we can create a culture that inspires the best ideas, the best people and best opportunity to thrive.
ANNUAL REPORT AND ACCOUNTS 2016/17
18
OBJECTIVE 2To deliver outstanding customer satisfaction at every touch point.The Translink brand means that people should get a high quality, integrated presentation when they use our services and meet with our people.
We want to ensure everyone gets a friendly, helpful and professional service at all times. We know this is an essential lever for improving customer satisfaction and increasing trust, as well as being a predominant factor in brand choice and loyalty.
Customer satisfaction is built in to our Passenger’s Charter and independently monitored twice a year. We have set a target to achieve greater than 85% customer satisfaction across all our services.
The key elements that drive customer satisfaction are punctuality, value for money, availability of seating, passenger information, passenger comfort, customer service and cleanliness.
Customer Driven InnovationCustomer information is an important tool for business growth. We want to be at the forefront of I.T. developments in transport. Our priority is continued enhancement towards more accurate, individual and easy to use information about all our services. This adds value and helps to generate journeys and reduce cost of distribution.
We will continue to improve access to timetables and in service information, incorporating real time data across a range of internet accessible devices.
To inspire new developments we have made our data available on the Opendata platform to allow third parties to develop commercial applications, effectively promoting shared mobility services.
We will extend digital departure screens across the public transport network for next scheduled and real time departures including airports and park and ride sites.
Customer Complaints and ComplimentsOur customers are very important to us and we welcome their comments and suggestions on how we might improve our services. With over 1.5m people travelling every week, we know there will be times when things go wrong. When they do, we will do our best to put things right. Our Passenger’s Charter sets out our responsibilities and is a statement of our commitment to provide high quality bus and train services in Northern Ireland. We aim to reduce the number of complaints to fewer than 15 per 100,000 journeys.
04 STRATEGIC REPORT
19
Ticketing TechnologiesInnovative ticketing solutions with a focus on integration, flexibility and convenience play an important role in attracting more people on board Translink services.
Enhancements such as the acceptance of contactless payment cards on-bus, e-purse payments, ticket vending machines at bus and rail stations and key stops, gated rail stations, online/app ticket purchases and smartcard top-ups plus provision of ticketing for Belfast Rapid Transit are all planned.
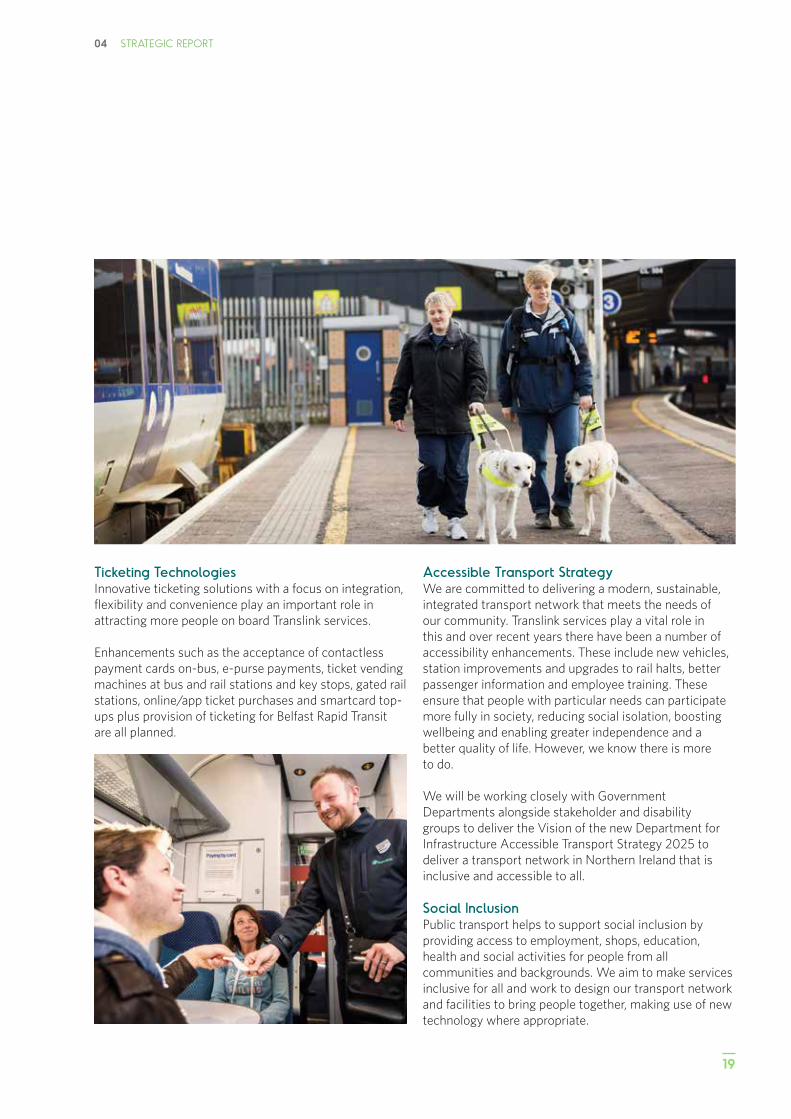
Accessible Transport StrategyWe are committed to delivering a modern, sustainable, integrated transport network that meets the needs of our community. Translink services play a vital role in this and over recent years there have been a number of accessibility enhancements. These include new vehicles, station improvements and upgrades to rail halts, better passenger information and employee training. These ensure that people with particular needs can participate more fully in society, reducing social isolation, boosting wellbeing and enabling greater independence and a better quality of life. However, we know there is more to do.
We will be working closely with Government Departments alongside stakeholder and disability groups to deliver the Vision of the new Department for Infrastructure Accessible Transport Strategy 2025 to deliver a transport network in Northern Ireland that is inclusive and accessible to all.
Social InclusionPublic transport helps to support social inclusion by providing access to employment, shops, education, health and social activities for people from all communities and backgrounds. We aim to make services inclusive for all and work to design our transport network and facilities to bring people together, making use of new technology where appropriate.
ANNUAL REPORT AND ACCOUNTS 2016/17
20
OBJECTIVE 3:To grow the number of passengers using public transport.We are committed to supporting an increase in modal shift towards sustainable transport.
We have developed long-term investment strategies for bus and rail services and will work with all key stakeholders to develop funding plans and policy support to deliver passenger growth.
Successful delivery of these growth plans will contribute significantly to modal shift from private to public transport in Northern Ireland.
A number of exciting investment projects are already underway that will contribute to the transformation of our public transport network.
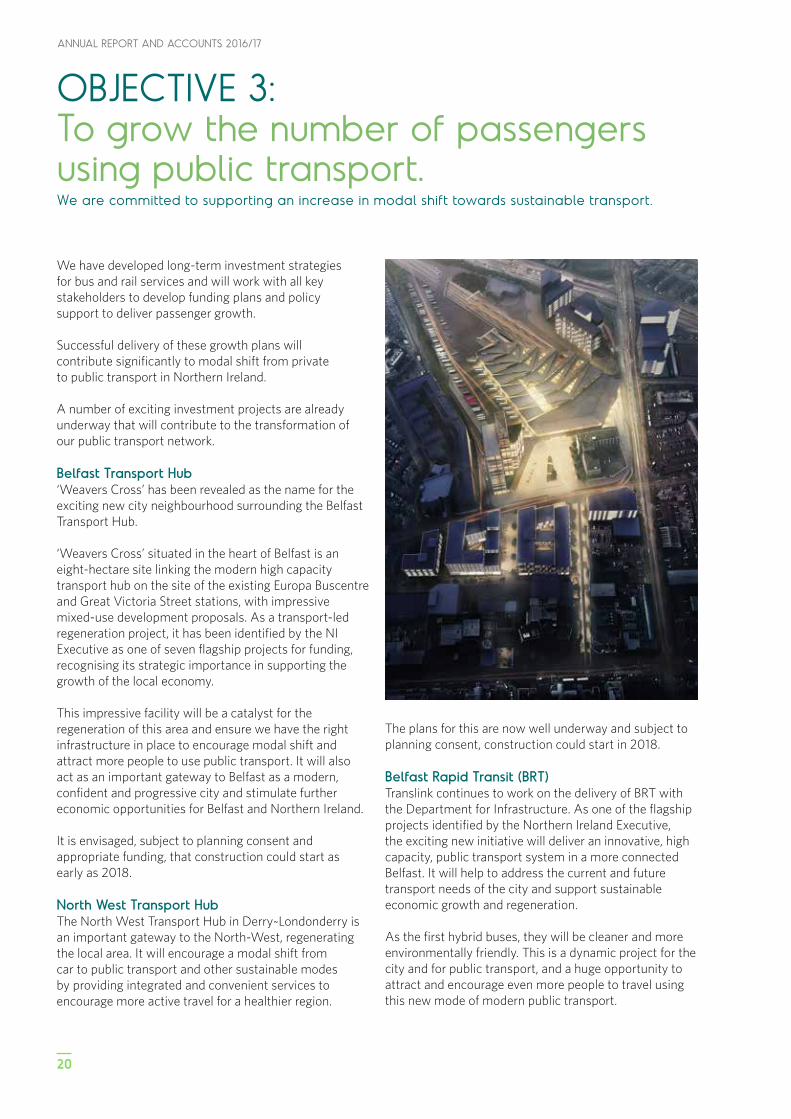
Belfast Transport Hub ‘Weavers Cross’ has been revealed as the name for the exciting new city neighbourhood surrounding the Belfast Transport Hub.
‘Weavers Cross’ situated in the heart of Belfast is an eight-hectare site linking the modern high capacity transport hub on the site of the existing Europa Buscentre and Great Victoria Street stations, with impressive mixed-use development proposals. As a transport-led regeneration project, it has been identified by the NI Executive as one of seven flagship projects for funding, recognising its strategic importance in supporting the growth of the local economy.
This impressive facility will be a catalyst for the regeneration of this area and ensure we have the right infrastructure in place to encourage modal shift and attract more people to use public transport. It will also act as an important gateway to Belfast as a modern, confident and progressive city and stimulate further economic opportunities for Belfast and Northern Ireland.
It is envisaged, subject to planning consent and appropriate funding, that construction could start as early as 2018.
North West Transport HubThe North West Transport Hub in Derry~Londonderry is an important gateway to the North-West, regenerating the local area. It will encourage a modal shift from car to public transport and other sustainable modes by providing integrated and convenient services to encourage more active travel for a healthier region.
The plans for this are now well underway and subject to planning consent, construction could start in 2018.
Belfast Rapid Transit (BRT)Translink continues to work on the delivery of BRT with the Department for Infrastructure. As one of the flagship projects identified by the Northern Ireland Executive, the exciting new initiative will deliver an innovative, high capacity, public transport system in a more connected Belfast. It will help to address the current and future transport needs of the city and support sustainable economic growth and regeneration.
As the first hybrid buses, they will be cleaner and more environmentally friendly. This is a dynamic project for the city and for public transport, and a huge opportunity to attract and encourage even more people to travel using this new mode of modern public transport.
04 STRATEGIC REPORT
21
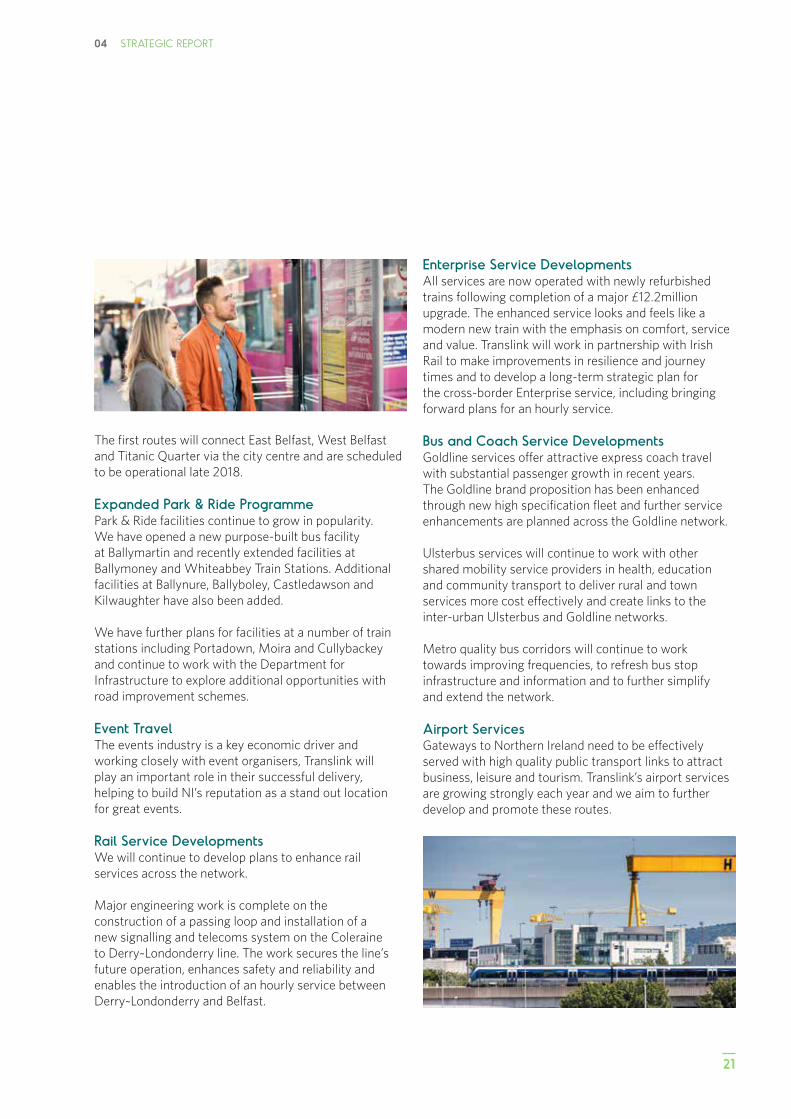
The first routes will connect East Belfast, West Belfast and Titanic Quarter via the city centre and are scheduled to be operational late 2018.
Expanded Park & Ride ProgrammePark & Ride facilities continue to grow in popularity. We have opened a new purpose-built bus facility at Ballymartin and recently extended facilities at Ballymoney and Whiteabbey Train Stations. Additional facilities at Ballynure, Ballyboley, Castledawson and Kilwaughter have also been added.
We have further plans for facilities at a number of train stations including Portadown, Moira and Cullybackey and continue to work with the Department for Infrastructure to explore additional opportunities with road improvement schemes.
Event TravelThe events industry is a key economic driver and working closely with event organisers, Translink will play an important role in their successful delivery, helping to build NI’s reputation as a stand out location for great events.
Rail Service DevelopmentsWe will continue to develop plans to enhance rail services across the network.
Major engineering work is complete on the construction of a passing loop and installation of a new signalling and telecoms system on the Coleraine to Derry~Londonderry line. The work secures the line’s future operation, enhances safety and reliability and enables the introduction of an hourly service between Derry~Londonderry and Belfast.
Enterprise Service DevelopmentsAll services are now operated with newly refurbished trains following completion of a major £12.2million upgrade. The enhanced service looks and feels like a modern new train with the emphasis on comfort, service and value. Translink will work in partnership with Irish Rail to make improvements in resilience and journey times and to develop a long-term strategic plan for the cross-border Enterprise service, including bringing forward plans for an hourly service.
Bus and Coach Service DevelopmentsGoldline services offer attractive express coach travel with substantial passenger growth in recent years. The Goldline brand proposition has been enhanced through new high specification fleet and further service enhancements are planned across the Goldline network.
Ulsterbus services will continue to work with other shared mobility service providers in health, education and community transport to deliver rural and town services more cost effectively and create links to the inter-urban Ulsterbus and Goldline networks.
Metro quality bus corridors will continue to work towards improving frequencies, to refresh bus stop infrastructure and information and to further simplify and extend the network.
Airport ServicesGateways to Northern Ireland need to be effectively served with high quality public transport links to attract business, leisure and tourism. Translink’s airport services are growing strongly each year and we aim to further develop and promote these routes.

ANNUAL REPORT AND ACCOUNTS 2016/17
22
OBJECTIVE 4:To deliver value for money The challenge for Translink is to work with all stakeholders to agree a shared mobility model for Northern Ireland which connects people and offers value for money.
There is global evidence that as cities become more urbanised and aided by technology, we are moving towards a shared mobility model, an integrated transport proposition that uses technology to knit public transport together with other modes – walking, cycling, car sharing, taxis and anything else you can think of.
We have an ambitious vision to transform public transport to become the first choice for travel in a shared mobility model in Northern Ireland, growing passenger numbers through a clear focus on our customers and delivering service excellence through our people. We want to engage with all stakeholders to demonstrate the value of public transport and connect people to other sustainable modes of transport.
FundingImproved public transport in Northern Ireland will require appropriate levels of public funding. The recent NI Audit Office report on the ‘Effectiveness of Public Transport in NI’ endorsed the need for additional spend on the delivery of public transport for Northern Ireland. Public transport expenditure levels, per head of population, in NI are around 60% of that in England and Wales and 40% of that in Scotland.
We will continue to work with all key stakeholders to develop funding plans and policy support to attract more people to public transport and support modal shift.
There are many models across the world for funding public transport. However, whatever approach is adopted it is clear that passengers respond positively to high quality services. If the objective by all stakeholders is to transform public transport and enhance economic development, then creating a stable environment to invest in services is required.
Cost EfficiencyWe will maintain a strong cost and continuous improvement focus towards driving business efficiencies throughout the organisation in order to offer best value for our customers and stakeholders and operate effectively.
We are also active in our efforts to minimise fuel consumption through the purchase of more eco-friendly vehicles and have introduced a range of best practice energy-saving measures such as eco-driving programmes to improve our fuel efficiency. These initiatives support our efforts to manage cost, keep fares as low as possible and improve customer satisfaction on value for money.
23
04 STRATEGIC REPORT
Revenue GenerationWe aim to generate revenue to reinvest in frontline bus and rail services while keeping fares as low as possible. To achieve this, we will maximise commercial opportunities and look at innovative ways of generating revenue from our bus, rail and station infrastructures to invest in public transport.
Fares StrategyWe will work on an annual basis with key stakeholders to review fares and maintain value for money for our customers.
We also actively promote and encourage customers to get the best value deal to help them save money. We have a range of special promotions and everyday value fares available such as Smartlink and yLink, as well as other multi-journey fares including rail weeklies and monthlies. We will continue to innovate in this area and have introduced mLink and iLink fares which offer customers more choice, convenience and integration.
We will work alongside partners like the Consumer Council for Northern Ireland to promote best value.
CongestionAs well as affecting competitiveness and air quality, a congested town and city has both a direct and indirect economic impact.
Translink will work with all key stakeholders to tackle this issue and support the development of a Transport Strategy for our cities and towns.
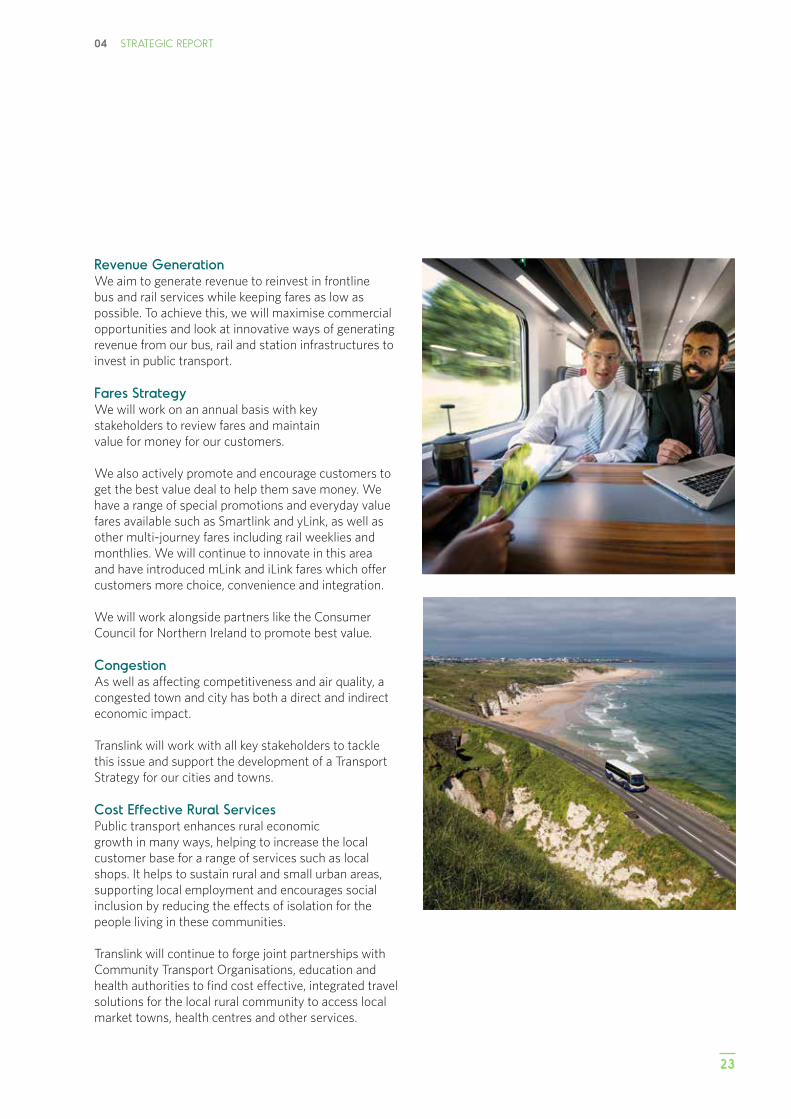
Cost Effective Rural ServicesPublic transport enhances rural economic growth in many ways, helping to increase the local customer base for a range of services such as local shops. It helps to sustain rural and small urban areas, supporting local employment and encourages social inclusion by reducing the effects of isolation for the people living in these communities.
Translink will continue to forge joint partnerships with Community Transport Organisations, education and health authorities to find cost effective, integrated travel solutions for the local rural community to access local market towns, health centres and other services.
ANNUAL REPORT AND ACCOUNTS 2016/17
24
THE TRANSLINK SPIRIT
We are committed to considering the interests of society by taking responsibility for the impact of our activities on customers, suppliers, employees, stakeholders and communities as well as our environment. Our focus is on supporting sustainable economic growth and vibrant local communities, and enhancing the quality of life we enjoy across our cities, towns and rural communities. We have a full range of activities based on the following key themes: Safety, Health and Wellbeing, Environment, Community Engagement and Our People.
The safety and wellbeing of our customers, employees and the general public remains central to Translink’s operations. We work with the local community to instil long-term support and engagement through specific projects and initiatives. These have included: rail safety campaigns, community projects, agricultural safety, interagency safety events, safety bus activity, seatbelt campaigns and regional school initiatives.
We are committed to delivering workplace health and wellbeing initiatives to help our employees lead fit and healthy lifestyles. Employee welfare is impacted by organisational culture as well as attitudes, values, beliefs and daily practices that affect their mental and physical wellbeing.
We continue to support local communities through stakeholder engagement, disability awareness, charity activity, supporting community projects and festivals, youth initiatives, events and sponsorships.
In recognition of our efforts we have been awarded the Platinum Award in the annual Northern Ireland Environmental Benchmarking Survey 2016 and the Business of the Year Award at the 2017 Allianz Arts & Business NI Awards.
The Translink SPIRIT is embedded in everything we do, underpinning our efforts to achieve our key objectives.
SafetyThe safety and wellbeing of our customers, staff and the general public is central to our operations.
We are guided by our Safety Management System and are constantly developing our safety capabilities and preparedness. We aim for zero staff or passenger safety incidents.
PeopleWe value and seek to develop our people.
We have won a number of awards for Investors in People (IIP) and strive to achieve the gold standard.
We are committed to creating a diverse workforce as we recognise the value this brings to our organisation. We have pledged to tackle the gender imbalance within the Group through the Business in the Community ‘Gender Project’.
InnovationWe have worked to instil a culture of continuous improvement throughout the organisation which challenges everyone to focus on what we do, or could do, to provide an excellent service for our customers and wider stakeholders.
Further formal processes are being introduced to improve service delivery and drive efficiencies throughout the Group.
ResponsibilityWe believe that Corporate Social Responsibility (CSR) is not just about ethics but is an important strategic tool for our business.
We continue to deliver a comprehensive CSR programme based on the four key themes of Go Safe, Go Eco, Go Healthy and Go Together and have been recognised as one of Northern Ireland’s leading businesses in this area.
Along with our continued commitment to our employees’ health through our occupational health programmes, we continue to engage with and contribute to the local community to protect and enhance safety, wellbeing and the environment.
IntegrityWe act with integrity in everything we do within a robust Corporate Governance Framework.
We will continue to work collaboratively with our sponsor Department (DfI) and other regulators and stakeholders and governing authorities to ensure compliance with relevant regulations.
TeamworkWe are committed to creating the right conditions for all our people to give of their best, to espouse our Vision and Values and to be an advocate for public transport.
25
PRINCIPAL RISKS AND UNCERTAINTIES
The business faced a number of risks and uncertainties, both internal and external. These encompass commercial, safety, employee and data security and are set out in more detail within the Corporate Governance statement on page 29.
04 STRATEGIC REPORT
ANNUAL REPORT AND ACCOUNTS 2016/17
26
DIRECTORS’ REPORT
The Directors present their annual report on the affairs of the Group, together with the financial statements and auditor’s report, for the 52 weeks ended 26 March 2017.
There have been no significant events since the balance sheet date which have a material effect on the accounts. An indication of likely future developments in the business of the Group is included in the Strategic Report.
DirectorsThe Directors, who served throughout the year and up to the date of approval of the accounts, are noted on page 4.
Directors’ IndemnitiesThe Company has made qualifying third party indemnity provisions for the benefit of its Directors which were made during the year and remain in force at the date of this report.
Equal OpportunitiesThe Group is committed to equality of opportunity for job applicants and within the workforce and values diversity.
Applications for employment by disabled persons are always fully considered, bearing in mind the aptitudes of the applicant concerned. In the event of members of staff becoming disabled, every effort is made to ensure that their employment with the Group continues and that appropriate training is arranged. It is the policy of the Group that the training, career development and promotion of disabled persons should, as far as possible, be identical to that of other employees.
Employee ConsultationDuring the year, the policy of providing employees with information about the Group has continued through the electronic publication of the newsletter ‘Expresslines’, a weekly email from the Group Chief Executive and ‘Team Talk’ briefings.
Whistleblowing / Fraud Reporting The Group’s whistleblowing procedures ensure that arrangements are in place to enable colleagues, suppliers and service providers to raise concerns about possible improprieties on a confidential basis.
Whistleblowing events are monitored by the Audit and Risk Committee.
AuditorsEach of the persons who is a Director at the date of approval of this annual report confirms that:
• so far as the Director is aware, there is no relevant audit information of which the Company's auditor is unaware; and
• the Director has taken all the steps that he/she ought to have taken as a director in order to make himself/herself aware of any relevant audit information and to establish that the Company's auditor is aware of that information.
This confirmation is given and should be interpreted in accordance with the provisions of s418 of the Companies Act 2006.
Financial InstrumentsThe Group’s principal financial instruments comprise cash, Group indebtedness, trade debtors, trade creditors, fuel hedges, investments in subsidiaries and certain other debtors and accruals. The main risks associated with these financial assets and liabilities are set out below.
Market RiskMarket risk is the risk that changes in market prices, such as commodity prices, interest rates and exchange rates will affect the Group’s financial performance and/or financial position. The objective of the Group’s management of market risk is to manage and control market risk exposures within acceptable parameters. The Group does not consider currency risk or interest rate risk to be material due to the low levels of foreign currency transactions and its borrowings being limited to its overdraft.
The Group enters into derivative financial instruments in the ordinary course of business in order to manage market risk, in the form of fuel price risk. All such transactions are carried out within guidelines set by the Board. Market risk exposures are measured using sensitivity analysis.
Under IFRS guidelines the derivative financial instruments are recognised in the Group’s financial statements at fair value with full disclosure at note 24 to the accounts.
There has been no change to the Group’s exposure to market risks or the manner in which these risks are managed and measured.
27
05 DIRECTORS’ REPORT
Credit RiskCredit risk arises on trade debtors and certain other debtors, a significant element of which relate to amounts owed by UK government bodies and in relation to which the Directors consider the credit risk to be remote. Group and Company policy is aimed at minimising credit risk and requires that deferred terms are granted only to non-government customers who demonstrate an appropriate payment history and satisfy creditworthiness procedures. Individual exposures are monitored with customers subject to credit limits to ensure that the Group exposure to bad debts is not significant. The credit risk on liquid funds is limited because the counterparties are banks with high credit ratings assigned by international credit-rating agencies.
Liquidity RiskLiquidity risk arising in respect of the Company’s subsidiary undertakings is managed through the Group’s central purchasing and treasury function, with flexibility maintained by retaining surplus cash in readily accessible bank accounts, bank overdraft facilities and control of Group indebtedness. Further, significant capital projects are normally funded by grant aid, with such projects requiring approval by both the Board and Department.
Going ConcernThe Directors acknowledge the guidance ‘Going Concern and Liquidity Risk: Guidance for Directors of UK Companies 2009’ published by the Financial Reporting Council in October 2009, the FRC guidance 'Update for Audit Committees: Issues arising from Current Economic Conditions', published in November 2010, and the June 2012 publication by the Panel of the Sharman Inquiry entitled ‘Final Report and Recommendations on Going Concern and Liquidity Risk’, the content of which was incorporated by the FRC into its September 2014 update to the UK Corporate Governance Code.
The Group’s business activities, together with the factors likely to affect its future development, performance and government funding are set out in the Strategic Report. Principal risks and uncertainties are as detailed above. The Corporate Governance Statement on page 29 includes details of how risks are managed. As a Public Corporation, whose legal status is not expected to change in the immediate future, the Group receives financial support from Government in the form of railway Public Service Obligation, limited route subsidy and capital grant support.
In addition the Group receives recompense for the carriage of concession groups. The Group has received notification of its indicative baseline resource funding for 2017/18 and has prepared a budget on this basis. This resource baseline reflects a reduction in recurrent funding of approximately £16m or 20% since 2013/14. The Group has budgeted to generate a trading loss for 2017/18 which it will fund entirely from reserves. A Corporate Plan has not been prepared given the context where there is currently no Minister and a lack of certainty on future resource allocations from the Northern Ireland Executive. The Consolidated Balance Sheet shows a deficit of £139.8m (2016: deficit of £27.6m). This deficit is entirely attributable to the Group’s retirement benefit obligation of £250.1m, an increase of approximately £130m from 2016. The obligation is long term and does not affect the Group’s cash flow in the short to medium term.
In October 2015, Translink was granted a contract for the provision of public transport services for at least five years. This contract (with the Department for Infrastructure) includes a commitment that payment for these services will be maintained at such a level to ensure that as a minimum Translink is able to meet its going concern obligations. This has been a key consideration for the Directors in assessing whether the accounts can be prepared on a going concern basis. Furthermore, a letter dated 9 June 2017 from the Department for Infrastructure reaffirms the Department’s commitment to ensure that NITHC / Translink remains a viable financial entity and states that Translink is a key delivery partner in terms of the draft Programme for Government. On this basis, the Directors believe that it is reasonable to assume that the Group has and will continue to have adequate resources to meet its anticipated liabilities as they fall due and to enable it to continue in operational existence for the foreseeable future. Accordingly, the Board has concluded that it is appropriate that the accounts are prepared on a going concern basis.
By order of the Board
JP IrvineCompany Secretaryfor and on behalf of the Board21 June 2017
ANNUAL REPORT AND ACCOUNTS 2016/17
28
DIRECTORS’ RESPONSIBILITIES
The Directors are responsible for preparing the Annual Report and the financial statements in accordance with applicable law and regulations.
Company law requires the Directors to prepare such financial statements for each financial year. Under that law the Directors are required to prepare the Group financial statements in accordance with International Financial Reporting Standards (IFRSs) as adopted by the European Union and Article 4 of the International Accounting Standards (IAS) Regulation and have also chosen to prepare the parent company financial statements under IFRSs as adopted by the European Union. Under company law the Directors must not approve the financial statements unless they are satisfied that they give a true and fair view of the state of affairs of the Company and of the profit or loss of the Company for that period.
In preparing these financial statements, International Accounting Standard 1 requires that Directors:• properly select and apply accounting policies;• present information, including accounting policies, in
a manner that provides relevant, reliable, comparable and understandable information;
• provide additional disclosures when compliance with the specific requirements in IFRSs is insufficient to enable users to understand the impact of particular transactions, other events and conditions on the entity’s financial position and financial performance; and
• make an assessment of the Company’s ability to continue as a going concern.
The Directors are responsible for keeping adequate accounting records that are sufficient to show and explain the Company’s transactions and disclose with reasonable accuracy at any time the financial position of the company and enable them to ensure that the financial statements comply with the Companies Act 2006. They are also responsible for safeguarding the assets of the Company and hence for taking reasonable steps for the prevention and detection of fraud and other irregularities.
The Directors are responsible for the maintenance and integrity of the corporate and financial information included on the Company’s website. Legislation in the United Kingdom governing the preparation and dissemination of financial statements may differ from legislation in other jurisdictions.
Directors’ Responsibility StatementWe confirm that to the best of our knowledge:• the financial statements, prepared in accordance
with the relevant financial reporting framework, give a true and fair view of the assets, liabilities, financial position and profit or loss of the Company and the undertakings included in the consolidation;
• the Strategic Report includes a fair review of the development and performance of the business and the position of the Company and the undertakings included in the consolidation taken as a whole, together with a description of the principal risks and uncertainties that they face; and
• the annual report and financial statements, taken as a whole, are fair, balanced and understandable and provide the information necessary for shareholders to assess the Company’s position and performance, business model and strategy.
This responsibility statement was approved by the board of Directors on 21 June 2017 and is signed on its behalf by:
Chief Executive OfficerChris Conway
Chief Financial OfficerPatrick Anderson
29
07 CORPORATE GOVERNANCE STATEMENT
CORPORATE GOVERNANCE STATEMENT
IntroductionThe Translink Group is owned by the Public Corporation the Northern Ireland Transport Holding Company (NITHC). NITHC itself is sponsored by the Department for Infrastructure (the “Department” or “DfI”). Under the ownership of NITHC, there are seven private limited subsidiary companies including Ulsterbus, Citybus (Metro) and Northern Ireland Railways. These three operating subsidiaries represent the main passenger transport companies which passengers, communities and stakeholders have come to know, trust, and depend on. Translink operates under a hybrid governance model. This means that the organisation is subject to public sector governance, private sector governance, and a very broad set of laws and regulations which come from both sectors. For example, as a public body, Translink is subject to Freedom of Information requests and public procurement rules, yet equally as a group of private limited companies, Translink’s directors are bound by company law directors’ duties, insolvency law and annual reporting obligations (at Companies House). Translink is committed to strong governance and, during the year, the Group has followed all applicable UK Corporate Governance Code provisions to the extent practical for a sponsored public corporation. There is an important additional layer of public sector governance known as the Management Statement and Financial Memorandum (MSFM). The MSFM sets a bespoke corporate governance framework for the organisation, and in so doing applies relevant provisions of Managing Public Money NI because of the receipt of public funds both in capital grants and (public service obligation) revenue.
Relationship with the Sponsor Department The Minister for Infrastructure is accountable to the Assembly for the activities and performance of the Translink Group. The Minister sets regional infrastructure and transport policy and performs the following functions:• approving strategic objectives and corporate plan;• approving the accountability, policy and performance
framework within which the Group operates (as detailed in the MSFM and associated documents);
• keeping the Assembly informed as to the Group’s performance;
• approving the amount of grant/subsidy or other funds to be paid to NITHC or its subsidiaries; and
• performing responsibilities specified in the Transport Act (Northern Ireland) 1967), including making appointments to the Board and laying the annual report and accounts of the Group before the Assembly.
There are periodic meetings which form the top-level governance arrangements between Translink and the Department for Infrastructure. These interfaces include:• meetings between the Minister and the Translink
Chairman and/or Group Chief Executive;• Board-level governance meetings (led by the
Permanent Secretary) with the full Board on a regular basis;
• Departmental monitoring meeting where senior sponsor branch officials meet with Translink’s Chief Financial Officer and General Counsel on a bi-monthly basis;
• ad-hoc meetings and interfaces between different management teams to keep both organisations up to date in a vein of ‘no surprises’.
ANNUAL REPORT AND ACCOUNTS 2016/17
30
The Role of the Board The Board’s areas of focus in helping to transform public transport to support the growth and prosperity of NI include strategic leadership, financial and business scrutiny, risk management, governance, succession planning and stakeholder relations.
The Board collectively supports and scrutinises management against its strategic aims thereby ensuring that Translink continues to perform successfully.
The Board had eleven scheduled meetings during the year, including a one day Board Strategy Workshop.
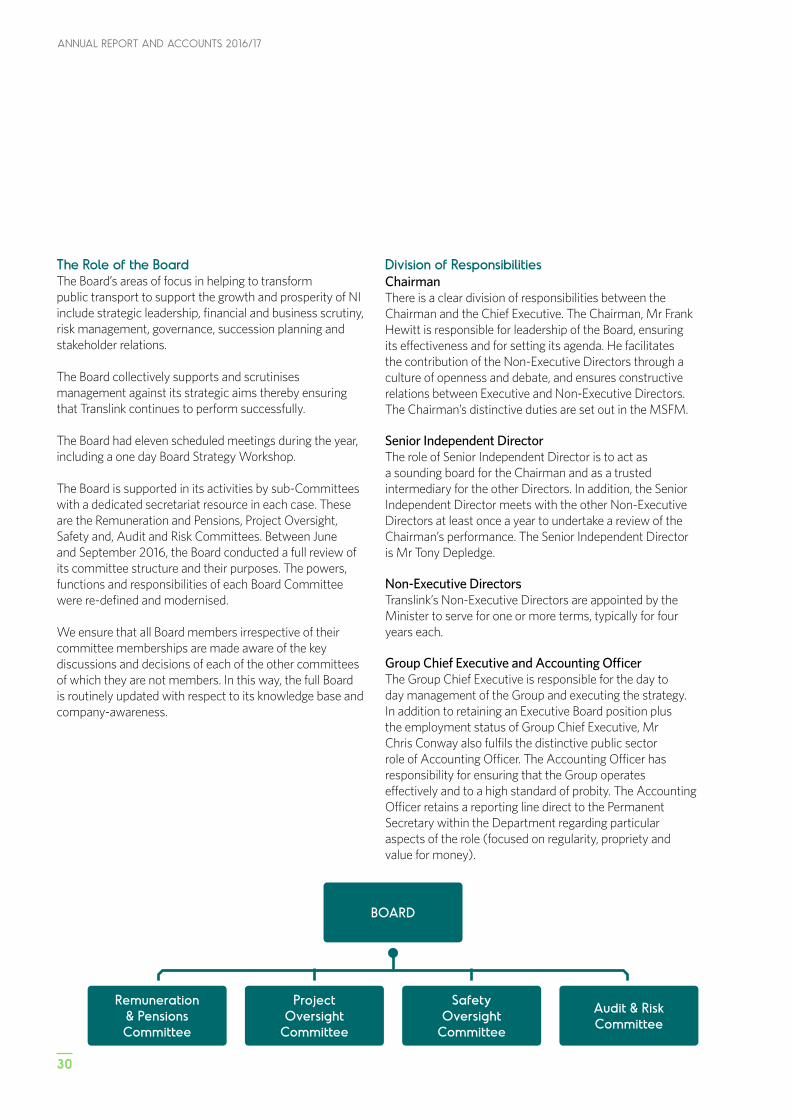
The Board is supported in its activities by sub-Committees with a dedicated secretariat resource in each case. These are the Remuneration and Pensions, Project Oversight, Safety and, Audit and Risk Committees. Between June and September 2016, the Board conducted a full review of its committee structure and their purposes. The powers, functions and responsibilities of each Board Committee were re-defined and modernised.
We ensure that all Board members irrespective of their committee memberships are made aware of the key discussions and decisions of each of the other committees of which they are not members. In this way, the full Board is routinely updated with respect to its knowledge base and company-awareness.
Division of Responsibilities ChairmanThere is a clear division of responsibilities between the Chairman and the Chief Executive. The Chairman, Mr Frank Hewitt is responsible for leadership of the Board, ensuring its effectiveness and for setting its agenda. He facilitates the contribution of the Non-Executive Directors through a culture of openness and debate, and ensures constructive relations between Executive and Non-Executive Directors. The Chairman’s distinctive duties are set out in the MSFM.
Senior Independent DirectorThe role of Senior Independent Director is to act as a sounding board for the Chairman and as a trusted intermediary for the other Directors. In addition, the Senior Independent Director meets with the other Non-Executive Directors at least once a year to undertake a review of the Chairman’s performance. The Senior Independent Director is Mr Tony Depledge.
Non-Executive DirectorsTranslink’s Non-Executive Directors are appointed by the Minister to serve for one or more terms, typically for four years each.
Group Chief Executive and Accounting Officer The Group Chief Executive is responsible for the day to day management of the Group and executing the strategy. In addition to retaining an Executive Board position plus the employment status of Group Chief Executive, Mr Chris Conway also fulfils the distinctive public sector role of Accounting Officer. The Accounting Officer has responsibility for ensuring that the Group operates effectively and to a high standard of probity. The Accounting Officer retains a reporting line direct to the Permanent Secretary within the Department regarding particular aspects of the role (focused on regularity, propriety and value for money).
BOARD
Remuneration & Pensions Committee
Project Oversight
Committee
Safety Oversight
Committee
Audit & Risk Committee
31
07 CORPORATE GOVERNANCE STATEMENT
Board Effectiveness CompositionThe Board currently comprises three Executive Directors, the Chairman and five Non-Executive Directors. The Chief Corporate Services & Human Resources Officer plus the Company Secretary support the Board and attend every meeting. The Non-Executive Directors bring wide and varied commercial experience to Board and Committee deliberations.
Independence and conflictsEach of the Directors has a duty under the Companies Act 2006 to avoid a situation where he/she has, or can have, a direct or indirect interest that conflicts, or possibly may conflict, with the Group’s interests. The Board has established procedures for the disclosure of conflicts and perceptions of conflict by Directors at every meeting but also through regular recorded declarations throughout the financial year. In accordance with the spirit of the Companies Act 2006, the Board considers, manages, and documents all conflicts of interests. From this pro-active analysis, the Board is content to confirm that all Non-Executive Directors are independent as set out in in the terms of the UK Corporate Governance Code.
Board development, workshops and continuous improvementDuring the year, the Directors received training on current issues and operational updates on various aspects of the business.
Information and supportThe Board receives regular updates on business performances against the Corporate Plan and Strategy. These come in the form of results-based “SMART” key performance indicators, shaped from a range of corporate objectives and Departmental objectives set for the Company in its Public Service Contract.
There is an established procedure whereby the Board or any of its Committees may take independent professional advice when appropriate. Any individual director, wishing to do so in the furtherance of their duties, may take independent professional advice if it is needed.
Board evaluation The Board undertakes a formal review of its performance and that of its Committees on an annual basis.
The Chairman is responsible for evaluation of individual Board Directors. This assessment is supplemented by the Department who undertake their own assessment in consultation with the Permanent Secretary and the Chairman. This includes an assessment whether Directors are able to allocate sufficient time to the Group in order to discharge their responsibilities effectively. All of Translink’s directors routinely satisfy the requirements of these effectiveness assessments.
ANNUAL REPORT AND ACCOUNTS 2016/17
32
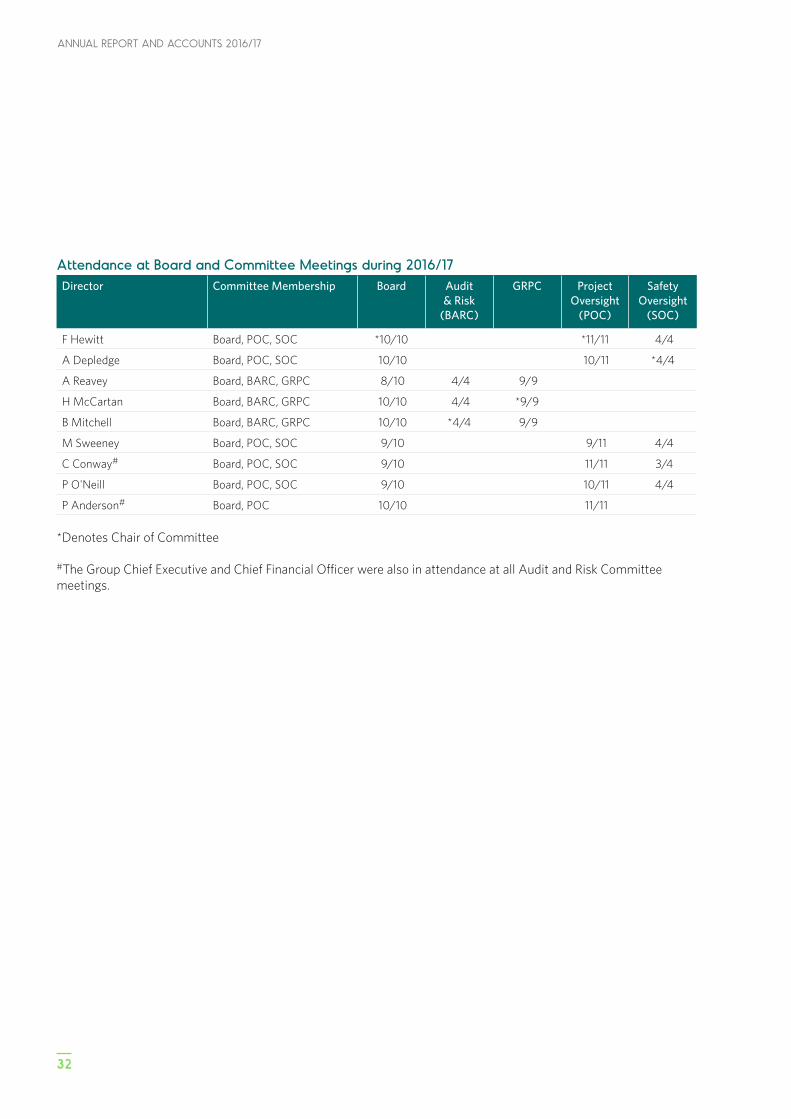
Attendance at Board and Committee Meetings during 2016/17Director Committee Membership Board Audit
& Risk (BARC)
GRPC Project Oversight
(POC)
Safety Oversight
(SOC)
F Hewitt Board, POC, SOC *10/10 *11/11 4/4
A Depledge Board, POC, SOC 10/10 10/11 *4/4
A Reavey Board, BARC, GRPC 8/10 4/4 9/9
H McCartan Board, BARC, GRPC 10/10 4/4 *9/9
B Mitchell Board, BARC, GRPC 10/10 *4/4 9/9
M Sweeney Board, POC, SOC 9/10 9/11 4/4
C Conway# Board, POC, SOC 9/10 11/11 3/4
P O'Neill Board, POC, SOC 9/10 10/11 4/4
P Anderson# Board, POC 10/10 11/11
*Denotes Chair of Committee
#The Group Chief Executive and Chief Financial Officer were also in attendance at all Audit and Risk Committee meetings.
33
07 CORPORATE GOVERNANCE STATEMENT
SOURCES OF ASSURANCE AND RISK MANAGEMENT CONTROLS
Effective Internal ControlsThe Board acknowledges that it is responsible for the Group’s risk management and internal control systems and carries out, at least annually, a review of their effectiveness.
Translink has implemented an appropriate Corporate Risk and Assurance Framework which simultaneously functions as a risk-identification and management tool as well as an assurance-mapping tool. It plays a key part of the Company’s Risk Management Strategy (reserved to the Board) and ultimately its Corporate Governance framework of controls. This integrated approach to risk management and assurance to ensure that its review of risk is used to inform the internal audit plan, accountability and assurance gaps, future corporate planning, and the continuous improvement of internal controls.
Internal AuditInternal audit services, including Head of Internal Audit, are provided by an independent firm. Internal audit conducts a comprehensive programme of audit review and ad-hoc advisory services on various control items throughout the year. The results, recommendations and significant findings are reported to senior executive management via the combined Internal Audit and Risk Review meetings. Management agrees and implements actions, which are tracked through to completion by Internal Audit and the Audit and Risk Committee.
A regular internal audit progress report is presented to every meeting of the Audit and Risk Committee throughout the annual cycle. At the end of the year, the Head of Internal Audit produces his formal opinion and provides an annual assurance rating for the Company. This provides an important element of assurance to the Accounting Officer, Audit and Risk Committee, and Board.
External AuditThe external auditors provide the Audit and Risk Committee with reports on the external audit, including a regulatory opinion, in connection with the annual accounts and general financial performance. Through their annual management letter and advice to the Company, key recommendations are taken on board and implemented. Safeguards have been put in place to ensure the ongoing objectivity and independence of the external auditors. A procurement exercise to award a new external audit contract for the 2017/18 year onward is nearing completion.
Risk Management ProcessesTranslink has in place a risk management strategy which was last refreshed by the Board in 2014. Divisional risk and assurance frameworks sit underneath the Corporate Risk and Assurance Framework. Risk Champions within each division
work closely with General Counsel and the wider compliance and audit teams in quarterly risk champion forums, which act as early warning signals for changing risk profiles or new risks. These divisional registers are then used by executive/divisional owners to inform the Corporate Risk and Assurance Framework. This comes to the Board twice each year, and comes to every meeting of the Audit and Risk Committee. This document is influenced heavily by residual risk score (the score of a risk after management control and processes have been applied) to determine the most significant risks at any given time. The Group Chief Executive and General Counsel take the lead in sponsoring and maintaining the Corporate Risk and Assurance Framework.
Risk registers also exist for major projects. Logs exist to capture emerging risks and near misses.
Assurance MappingPrior to completing this Corporate Governance Statement the Group Chief Executive requires all members of the Executive Committee to sign Assurance letters which provide regular assurance for all relevant areas of their responsibility under the MSFM and risk management strategy.
Risk Management and Internal Audit Review MeetingsThe Group Chief Executive chairs the Risk Management and Internal Audit Review meetings attended by executive management plus internal audit. The meetings assist with the overall Assurance Framework, help inform and shape the work of internal audit during the year, and contribute to the progress of the annual audit plan.
Financial Reporting The Group has comprehensive planning, budgeting, and forecasting processes in place, which include detailed operational budgets for the year ahead, and the delivery of KPIs. The Board, the Department and the Minister review and approve these.
Investment AppraisalCapital expenditure is regulated tightly (through budgetary processes and authorisation levels) and all appropriate appraisals above certain pre-agreed thresholds are escalated to the relevant Board/Committee, and indeed DfI as appropriate, for consideration and approval.
The Work of the Board’s Sub-CommitteesAn important part of the Group’s assurance and accountability framework during the period was the role played by each of the four Board Sub-Committees (Audit and Risk, Remuneration and Pensions, and Project Oversight). These committees each
ANNUAL REPORT AND ACCOUNTS 2016/17
34
have an annual cycle of work, and take on additional scrutiny over the work and activity of management throughout the year. They provide minutes of committee meetings to the full Board. Moreover, the Audit and Risk Committee, the Safety Committee and the Remuneration and Pensions Committee play a vital role in submitting annual reports on their activity for the purpose of these annual report and accounts.
The above internal control systems have been in place for the year under review and up to the date of approval of the annual report and accounts.
Principal Risks and UncertaintiesThe Directors have carried out a robust assessment of the principal risks facing the Group, including those that would threaten its business model, future performance, solvency or liquidity.
The Group notes the following corporate risks that will continue to pose challenges for the foreseeable future. These particular risks require ongoing attention in order to maintain the risks to acceptable levels.
Funding shortfallsAvailability and uncertainty in government funding remain major ongoing risks. Translink is working with DfI in the context of its Public Service Contract to ensure that it is adequately funded on a recurring basis to meet the obligations set out within this Contract.
Delivery of major projects The area of project management is a key focus given the number and significance of key high value projects underway (the Belfast Transport Hub, the North-West hub, Knockmore-to-Lurgan track rehabilitation, Belfast Rapid Transit and the Translink Future Ticketing System). Translink has been careful to ensure that early assessment of potential risks are identified, categorised and evaluated in consultation with key project stakeholders. Independent gateway reviews are held for all major capital projects. Safety risks across all rail and bus activitiesSafety in our bus and rail depots, stations, track sites, and across all Group property remains an important concern. Safety related risks appear on the Corporate Risk and Assurance Framework – related to bus and train operations. Continuous public awareness and internal staff training about safety and the risks of unsafe movement is vital. Regular media campaigns inform the public of the risks posed by misuse of level crossings. Furthermore, those who flout crossing rules are routinely prosecuted with a view to dissuading such behaviour and drawing attention to the safety risks their actions present. At an operational level, there is an ongoing User Worked
Crossings Safety Improvement Programme to close or upgrade crossings which has made significant progress in the year.
Other risks which appear on the Corporate Risk and Assurance Framework include:• information management and data security;• employee relations; • commercial challenges and related risk to income; and• long term benefit obligations.
Assessment of Internal ControlThe Company’s principal risks are tested and probed on an ongoing basis by myself as Accounting Officer but also by the Board of Directors, and a dedicated group of employees we call Risk Champions.
I have in this statement provided an outline of the most significant risks which have affected our business since 28 March 2016 balanced with the assurance I take from the range of controls and processes in place to manage these significant risks. For the period, my assessment is that the relevant systems of internal control and risk management are strong and are operating effectively. Significant risks are identified, recorded, managed, and targeted for response as appropriate.
Internal Control DivergencesThere have been no major internal control divergences which have arisen since 28 March 2016 and any ongoing investigations have been outlined in the risk review above.
ConclusionTranslink has a rigorous system of accountability which I rely upon to form an opinion on the control framework. Assurances and written confirmations provided to me by Executive Committee colleagues inform my assessment of risk. I am pleased to report that I am content that Translink has operated a sound system of good governance and internal control during the reporting period.
Chris ConwayAccounting Officer and Group Chief Executive21 June 2017
35
08 AUDIT AND RISK COMMITTEE REPORT
AUDIT AND RISK COMMITTEE REPORT
Summary of the Role of the Audit and Risk CommitteeThe Audit and Risk Committee is a formally constituted committee of the Board. The primary responsibilities and tasks undertaken by the Committee are to:• monitor the integrity of the financial statements;• review the Group’s internal financial controls;• monitor and review the effectiveness of the Group’s internal
audit function;• make recommendations to the Board in relation to the
appointment, reappointment and removal of the External Auditors including remuneration and terms of engagement;
• ensure that effective risk management procedures and processes are in place;
• develop and implement policy on the engagement of the Internal and External Auditors to supply non-audit services; and
• advise the Board on whether the annual report and accounts, taken as a whole, are fair, balanced and understandable.
The Terms of Reference of the Committee are available on request from the Company Secretary.
Composition of the Audit and Risk CommitteeThe Audit and Risk Committee is appointed by the Chairman of the Company and approved by the Board. The members during 2016/17 were Non-Executive Directors, Mr Bernard Mitchell (Committee Chair), Mrs Hilary McCartan and Ms Angela Reavey. The Committee is independent of management and its membership has an appropriate range of skills in relation to governance, risk and control and also meets the requirements for recent and relevant financial experience sufficient to allow them to competently analyse the financial statements and understand good financial management disciplines.
Other AttendeesIn addition to members, the Group Chief Executive, the Chief Financial Officer, Legal Counsel and Company Secretary, the Head of Internal Audit, the External Auditors, an observer from Department for Infrastructure (the Department) and the Committee Secretary attend Committee meetings, along with any other invitees called by the Chairman to attend from time to time.
MeetingsThe Committee met on four occasions in 2016/17.
GovernanceThe Board is kept informed of the work of the Committee by means of summaries of meetings, the approved minutes of meetings and reports from the Committee Chairman at subsequent Board meetings.
On an annual basis, the Committee considers its own effectiveness and the effectiveness of the external audit function. The last such review took place in September 2016 when the Committee considered that their performance was compliant with good practice, while identifying a number of areas for further consideration.
The Group continues to operate under the Management Statement and Financial Memorandum (MSFM) that was agreed with the Department and signed on 13 March 2013. There have been no amendments to the MSFM during the 2016/17 year.
The current External Auditors were appointed for an initial term of three years commencing with the 2011/12 audit, after a public procurement competition. Their term had been extended by two years to include the 2015/16 audit in accordance with the original appointment terms. Procurement for a new appointment was at an advanced stage when the Department advised the Group that audits of capital grants would no longer be required from April 2017. As this represented a significant change in procurement scope, the process was halted, a direct award made to the incumbent auditors for the 2016/17 audit, and a new procurement competition commenced. The Committee only permits the Internal and External Auditors to undertake non-audit services when it considers that the nature and extent of the services and related fees do not compromise audit objectivity and independence and has regard to the Revised Ethical Standard 2016 which introduced new restrictions around the provision of non-audit services.
Activities in Respect of the YearThe Committee undertook the following activities in respect of the year:
Internal audit• Reviewed and approved the Internal Audit Strategy and Plan
for the year.• Received and reviewed a report from the Head of Internal
Audit at each meeting including a summary of progress against the plan, recommendations arising from reviews undertaken and progress made in the implementation of such recommendations.
ANNUAL REPORT AND ACCOUNTS 2016/17
36
• Reviewed the Annual Report and opinion by Head of Internal Audit and noted that the overall level of assurance was satisfactory.
• Followed up prior year Internal Audit reviews to ensure that recommendations were implemented.
• Considered all instances of fraud, theft and whistleblowing.
External audit• Engaged with the External Auditors at all stages of their
work including review of the planned audit approach, audit progress and conclusions.
• Reviewed the independence and objectivity and the effectiveness of the External Auditors.
Financial management and reporting• Considered a comprehensive review of the financial
statements prepared by the Chief Financial Officer.• Considered the appropriateness of key accounting
policies, whether the accounts give a true and fair view, the appropriateness of the going concern assumption, and reviewing disclosures and key judgements in the financial statements.
• Considered the report of the auditors on the financial statements and matters for those charged with governance raised by them.
• Reviewed the 2016/17 annual financial statements, along with the documents issued with them, including the Corporate Governance Statement, and recommended the adoption of these by the Board.
Risk management• Regularly considered, and challenged executives on, the
Corporate Risk and Assurance registers, including emerging risks and near misses, the fraud and theft registers and the whistleblowing register. The key risks considered by the Committee and their response are set out in the section Principal Risks and Uncertainties set out on page 34 of the Annual Report.
Governance• Reviewed and updated its Terms of Reference.• Approved a revised Internal Audit Charter.• Approved a policy for non-audit services provided by the
Internal and External Auditors.
The Committee also:Met with each of the External Auditors and the Head of Internal Audit, in the absence of executive management, to consider matters of relevance and considered new and revised guidance from Central Government.
ConclusionThe Audit and Risk Committee considers that for the 2016/17 financial year it has discharged its responsibilities in full in accordance with its remit. The Committee’s view of the effectiveness of the system of internal control is informed by the assurances provided through the maintenance and reporting of the risk registers and the documented assurance framework, the work of the Internal Auditors, the External Auditors in their Report to those Charged with Governance, and by the work of the Group Chief Executive and the Executive Team who have responsibility for the development and maintenance of the internal control framework.
The Committee is satisfied that throughout the year there was ongoing progress made in relation to internal audit recommendations made by Internal Audit and that management had due regard to the recommendations that had been made.
The Committee is satisfied that the system of internal control in operation throughout the period is satisfactory and that there have been no material breaches of internal control brought to the attention of the Committee by either management or the Internal or External Audit.
The Committee is satisfied that there are effective risk management processes and procedures in place.The Committee is satisfied that both the Internal Auditors and the External Auditors provide effective independent challenge to management.
The Committee is satisfied that the key accounting policies applied in the preparation of the financial statements are appropriate and that the financial statements have been properly prepared in accordance with them, and give a true and fair view of the Group’s results for the year and state of affairs at the year end.
The Committee is satisfied as to the independence, objectivity and effectiveness of the External Auditors.
Bernard MitchellChairman Audit and Risk Committee 21 June 2017
37
09 SAFETY OVERSIGHT COMMITTEE REPORT
SAFETY OVERSIGHT COMMITTEE REPORT
IntroductionThe Safety Oversight Committee is appointed by the Board to promote and protect the safety, general wellbeing and environment of the Group’s passengers and employees.
Throughout 2016/17 the Committee has met four times and in this time, it has reviewed the findings of reports, presentations, safety audits, accident inquiries, incident management reports and related information to reinforce best practice and to ensure lessons are learned and embedded for the future.
The Committee has been active in satisfying itself as to the adequacy and effectiveness of safety, health and environmental related policies, reporting as appropriate to the Board regarding safety policy, corporate responsibility strategy and overall safety-related performance.
The Committee has reviewed and updated its terms of reference and actively participates in the Corporate Safety Tour programme. The Board demonstrates leadership in this area by also engaging in Safety Tours that are designed to help drive safety performance and culture and to demonstrate our commitment to health and safety.
Safety Management System (SMS)The practical application and outworkings of the safety, health and environmental policies is the Translink integrated safety management system which ensures that safety management is in line with the international standard for safety management, Occupational Health Safety Assessment Series 18001.
Compliance with our SMS is assured by a continuous internal audit process. This is an essential and prominent feature of our internal reporting throughout the business; performance is reviewed by the safety oversight committee and reported at Board level ensuring the priority of health, safety and environmental best practice.
This year the staff survey again asked employees their thoughts on being informed on health and safety and about working in a safe environment. Both results demonstrated substantial positive scores and significant increases on the previous survey.
EnvironmentOnce again this year, Translink retained Platinum status in Business in the Community’s Environmental Benchmarking Survey, which has become Northern Ireland’s leading environmental benchmarking exercise, attracting organisations from more than 14 industry sectors including participants from the top 200 companies and leading public sector organisations.
InvestmentThe Committee is pleased to note the capital investment in 2016/17 seeking to take advantage of new more modern technology, incorporating additional safety benefits.
Of particular note is the work in connection with the User Worked Crossing Safety Improvement Programme. The first phase of this project has been completed resulting in the closure of 28 User Worked Crossings.
Work on the signalling upgrade between Coleraine and Derry~Londonderry has also been completed. This project has improved crossing safety for users, passengers and staff on rail services who use these crossings.
RegulatorsTranslink continues to work closely with regulators and has held knowledge sharing events recently with the Rail Accident Investigation Board, the Health and Safety Agency for Northern Ireland, the Police Service of Northern Ireland, the Northern Ireland Environment Agency, the Commission for Railway Regulation, the Rivers Agency and others.
Future FocusKeeping safety as our first priority, we will continue to develop and implement the integrated SMS with a clear focus on leadership and behavioural safety.
Embedding the Translink SPIRIT in everything we do, we will continuously develop our corporate social responsibility through Go Safe, Go Eco, Go Healthy and Go Together programmes.
Tony DepledgeChairmanSafety Oversight Committee21 June 2017
.
Afb�
ANNUAL REPORT AND ACCOUNTS 2016/17
38
DIRECTORS’ REMUNERATION REPORT
This Directors’ remuneration report is presented voluntarily by the Board having regard to the main and supporting principles of Section D.1 to the 2014 UK Corporate Governance Code (the Code).
The Group Remuneration and Pensions Committee (the “Committee”)The Committee discharges responsibility for a wide range of matters including:
Executive Pay PolicyTo annually review remuneration for senior executives and other executives including a revalorisation of pay scales and incremental increases in pay where these are linked to performance.
Pay Policy for Management, Professional and Technical Employees (MPT)To annually confirm the performance related pay distribution for MPT employees.
Senior Executive Appointments and TerminationsTo oversee the process of appointing to the position of Group Chief Executive and other senior executive posts.
To obtain assurance that redundancy, compensation and termination arrangements for senior executives and other executives are permissible under contract and under the Corporate Governance Framework before onward recommendation to the Board.
PensionsTo recommend to the Board appointments of Trustees to the Group Pension Schemes.
To consider and recommend to the Board any changes to the operation or funding of the Group’s pension schemes.
To consult periodically with the Trustees of the schemes on relevant statutory matters concerning the schemes.
The Terms of Reference of the Committee are available on request from the General Counsel and Company Secretary.
Executive Director AppointmentsExecutive Director appointments are made on the basis of open competition and the merit principle. Furthermore, as Executive Director posts entail the receipt of a Board position, the particular requirements contained within the Transport Act (NI) 1967 are also observed – this includes the requirement to obtain the approval of the Minister for Infrastructure.
Executive DirectorsThe Executive Directors of the Company are:Mr Chris Conway (Group Chief Executive)Mr Patrick Anderson (Chief Financial Officer)Mr Philip O’Neill (Chief Operating Officer)
Remuneration PolicyThe key policy objectives are to ensure that individuals are fairly rewarded for their contribution to the Group’s overall performance, to provide remuneration which is designed to attract, retain and motivate executives of the right calibre and to ensure that due regard is given to guidance from the Department.
During the year, the Committee reviewed the performance of Senior Executives and the MPT staff group.
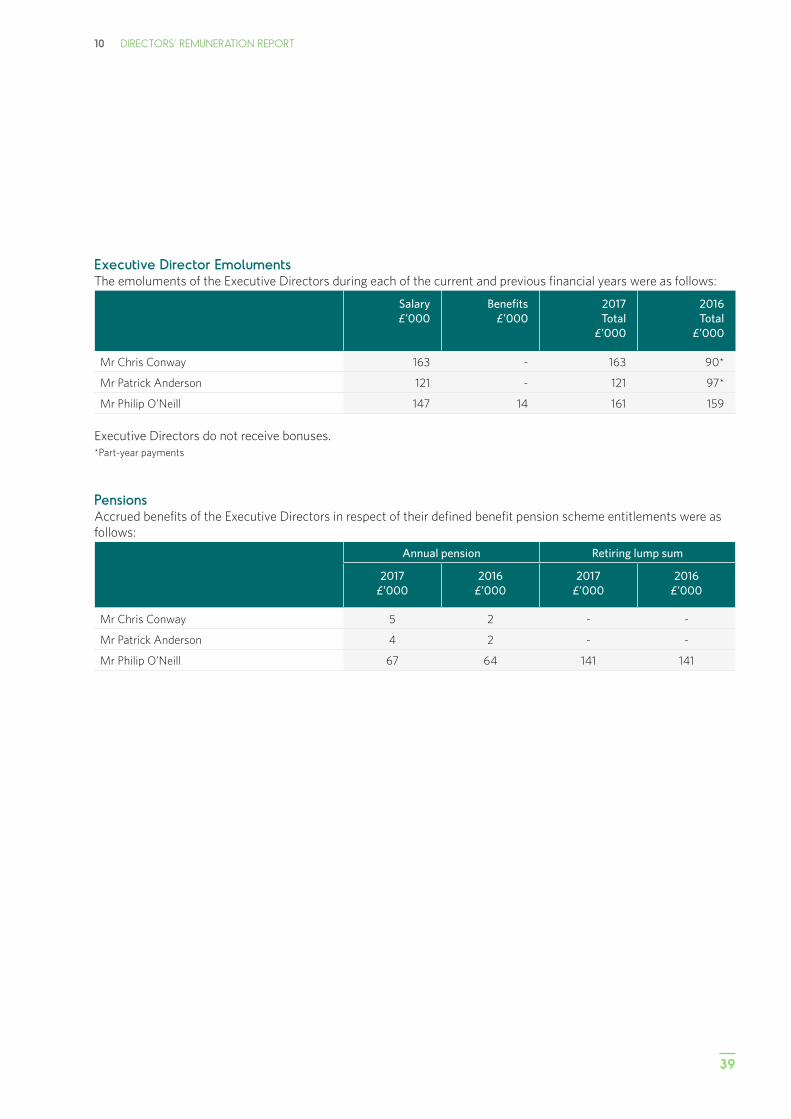
39
10 DIRECTORS’ REMUNERATION REPORT
Executive Director EmolumentsThe emoluments of the Executive Directors during each of the current and previous financial years were as follows:
Salary£’000
Benefits£’000
2017Total
£’000
2016Total
£’000
Mr Chris Conway 163 - 163 90*
Mr Patrick Anderson 121 - 121 97*
Mr Philip O’Neill 147 14 161 159
Executive Directors do not receive bonuses.*Part-year payments
PensionsAccrued benefits of the Executive Directors in respect of their defined benefit pension scheme entitlements were as follows:
Annual pension Retiring lump sum
2017£’000
2016£’000
2017£’000
2016£’000
Mr Chris Conway 5 2 - -
Mr Patrick Anderson 4 2 - -
Mr Philip O’Neill 67 64 141 141
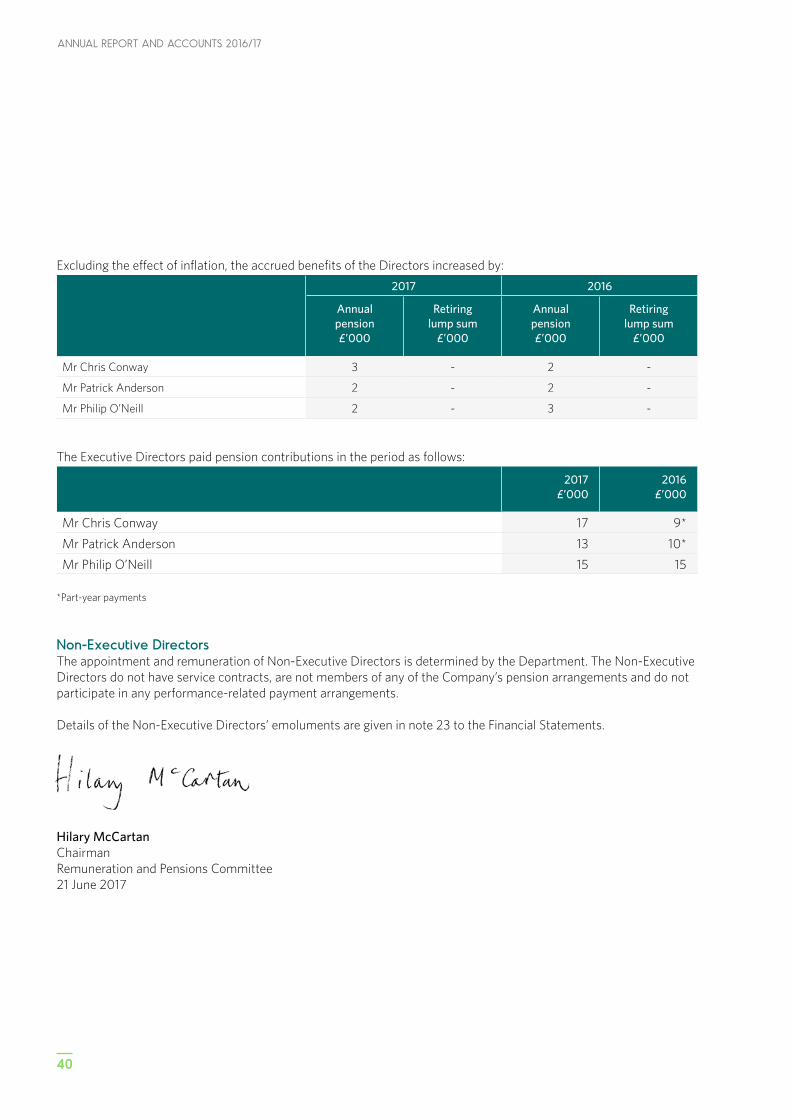
ANNUAL REPORT AND ACCOUNTS 2016/17
40
Excluding the effect of inflation, the accrued benefits of the Directors increased by:
2017 2016
Annual pension£’000
Retiring lump sum
£’000
Annual pension£’000
Retiring lump sum
£’000
Mr Chris Conway 3 - 2 -
Mr Patrick Anderson 2 - 2 -
Mr Philip O’Neill 2 - 3 -
The Executive Directors paid pension contributions in the period as follows:
2017£’000
2016£’000
Mr Chris Conway 17 9*
Mr Patrick Anderson 13 10*
Mr Philip O’Neill 15 15
*Part-year payments
Non-Executive DirectorsThe appointment and remuneration of Non-Executive Directors is determined by the Department. The Non-Executive Directors do not have service contracts, are not members of any of the Company’s pension arrangements and do not participate in any performance-related payment arrangements.
Details of the Non-Executive Directors’ emoluments are given in note 23 to the Financial Statements.
Hilary McCartanChairmanRemuneration and Pensions Committee21 June 2017
41
11 INDEPENDENT AUDITOR’S REPORT TO THE MEMBERS OF NORTHERN IRELAND TRANSPORT HOLDING COMPANY
INDEPENDENT AUDITOR’S REPORT TO THE MEMBERS OF NORTHERN IRELAND TRANSPORT HOLDING COMPANY
We have audited the financial statements of Northern Ireland Transport Holding Company for the year ended 26 March 2017 which comprise the Consolidated Income Statement, the Consolidated Statement of Comprehensive Income, the Consolidated and Company Balance Sheets, the Group Cash Flow Statement, the Consolidated and Company Statements of Changes in Reserves and the related notes 1 to 26. The financial reporting framework that has been applied in their preparation is applicable law and International Financial Reporting Standards (IFRSs) as adopted by the European Union and, as regards the parent Company financial statements, as applied in accordance with the provisions of the Companies Act 2006.
This report is made solely to the Company’s members, as a body, in accordance with Chapter 3 of Part 16 of the Companies Act 2006. Our audit work has been undertaken so that we might state to the Company’s members those matters we are required to state to them in an auditor’s report and for no other purpose. To the fullest extent permitted by law, we do not accept or assume responsibility to anyone other than the Company and the Company’s members as a body, for our audit work, for this report, or for the opinions we have formed.
Respective Responsibilities of Directors and AuditorAs explained more fully in the Directors’ Responsibilities Statement, the directors are responsible for the preparation of the financial statements and for being satisfied that they give a true and fair view. Our responsibility is to audit and express an opinion on the financial statements in accordance with applicable law and International Standards on Auditing (UK and Ireland). Those standards require us to comply with the Auditing Practices Board’s Ethical Standards for Auditors.
Scope of the Audit of the Financial StatementsAn audit involves obtaining evidence about the amounts and disclosures in the financial statements sufficient to give reasonable assurance that the financial statements are free from material misstatement, whether caused by fraud or error. This includes an assessment of: whether the accounting policies are appropriate to the Group and the parent Company’s circumstances and have been consistently applied and adequately disclosed; the reasonableness of significant accounting estimates made by the directors; and the overall presentation of the financial statements. In addition, we read all the financial and non-financial information in the annual report to identify material inconsistencies with the audited financial statements. If we become aware of any apparent material misstatements or inconsistencies, we consider the implications for our report.
Opinion on Financial StatementsIn our opinion the financial statements:• give a true and fair view of the state of the Group’s and of
the parent Company’s affairs as at 26 March 2017 and of the Group’s loss for the year then ended;
• the Group financial statements have been properly prepared in accordance with IFRSs as adopted by the European Union;
• the parent Company financial statements have been properly prepared in accordance with IFRSs as adopted by the European Union and as applied in accordance with the provisions of the Companies Act 2006; and
• the financial statements have been prepared in accordance with the requirements of the Companies Act 2006.
Opinion on other Matters prescribed by the Companies Act 2006In our opinion, based on the work undertaken in the course of the audit:• the information given in the Strategic Report and Directors’
Report for the financial year for which the financial statements are prepared is consistent with the financial statements; and
• the Strategic Report and Directors’ Report have been prepared in accordance with applicable legal requirements.
In the light of the knowledge and understanding of the Company and its environment obtained in the course of the audit, we have not identified any material misstatements in the Strategic Report and Directors’ Report.
Matters on which we are required to report by exceptionWe have nothing to report in respect of the following matters where the Companies Act 2006 requires us to report to you if, in our opinion:• adequate accounting records have not been kept, or
returns adequate for our audit have not been received from branches not visited by us; or
• the parent Company financial statements are not in agreement with the accounting records and returns; or
• certain disclosures of directors’ remuneration specified by law are not made; or
• we have not received all the information and explanations we require for our audit.
ANNUAL REPORT AND ACCOUNTS 2016/17
42
Independent Auditor’s Report to the Members of Northern Ireland Transport Holding Company (continued)
Other MattersIn accordance with engagement terms dated 4 June 2015, the directors have asked us to give a regularity opinion. Under the terms of this engagement we are required to obtain evidence sufficient to give reasonable assurance that the expenditure and income reported in the financial statements have been applied to the purposes intended by, and the financial transactions conform to, the authorities which govern them.
Non statutory opinion on regularityIn our opinion, in all material respects, the expenditure and income have been applied to the purposes intended by, and the financial transactions conform to, the authorities which govern them.
Dawn Johnston FCA (Senior statutory auditor)for and on behalf of Deloitte (NI) LimitedChartered Accountants and Statutory AuditorBelfast, United Kingdom21 June 2017
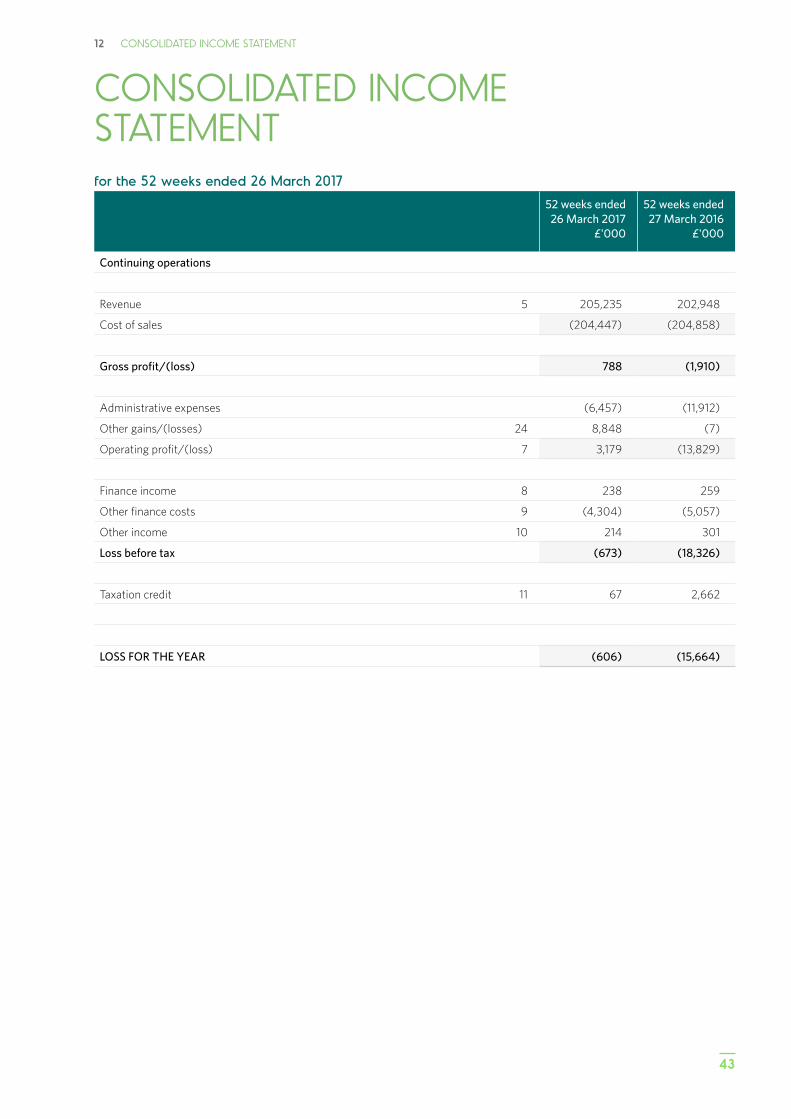
43
12 CONSOLIDATED INCOME STATEMENT
CONSOLIDATED INCOME STATEMENTfor the 52 weeks ended 26 March 2017
52 weeks ended 26 March 2017
£'000
52 weeks ended 27 March 2016
£'000
Continuing operations
Revenue 5 205,235 202,948
Cost of sales (204,447) (204,858)
Gross profit/(loss) 788 (1,910)
Administrative expenses (6,457) (11,912)
Other gains/(losses) 24 8,848 (7)
Operating profit/(loss) 7 3,179 (13,829)
Finance income 8 238 259
Other finance costs 9 (4,304) (5,057)
Other income 10 214 301
Loss before tax (673) (18,326)
Taxation credit 11 67 2,662
LOSS FOR THE YEAR (606) (15,664)
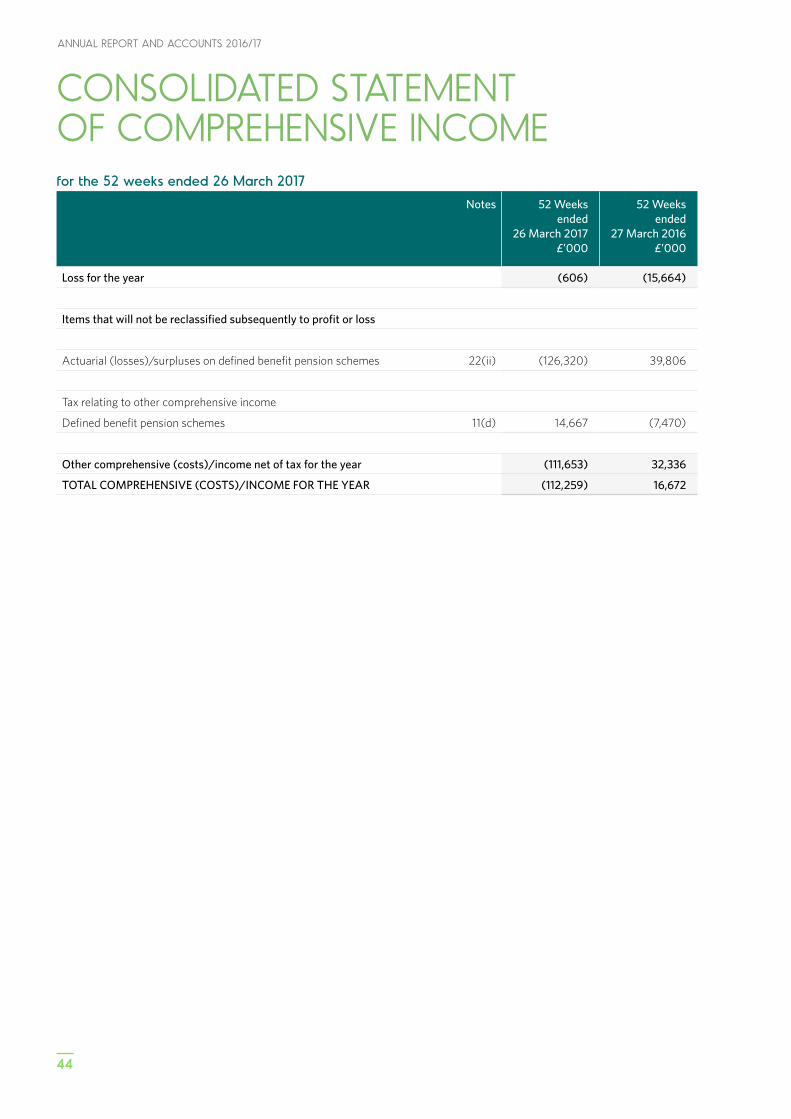
ANNUAL REPORT AND ACCOUNTS 2016/17
44
CONSOLIDATED STATEMENT OF COMPREHENSIVE INCOME for the 52 weeks ended 26 March 2017
Notes 52 Weeks ended
26 March 2017£’000
52 Weeks ended
27 March 2016£’000
Loss for the year (606) (15,664)
Items that will not be reclassified subsequently to profit or loss
Actuarial (losses)/surpluses on defined benefit pension schemes 22(ii) (126,320) 39,806
Tax relating to other comprehensive income
Defined benefit pension schemes 11(d) 14,667 (7,470)
Other comprehensive (costs)/income net of tax for the year (111,653) 32,336
TOTAL COMPREHENSIVE (COSTS)/INCOME FOR THE YEAR (112,259) 16,672
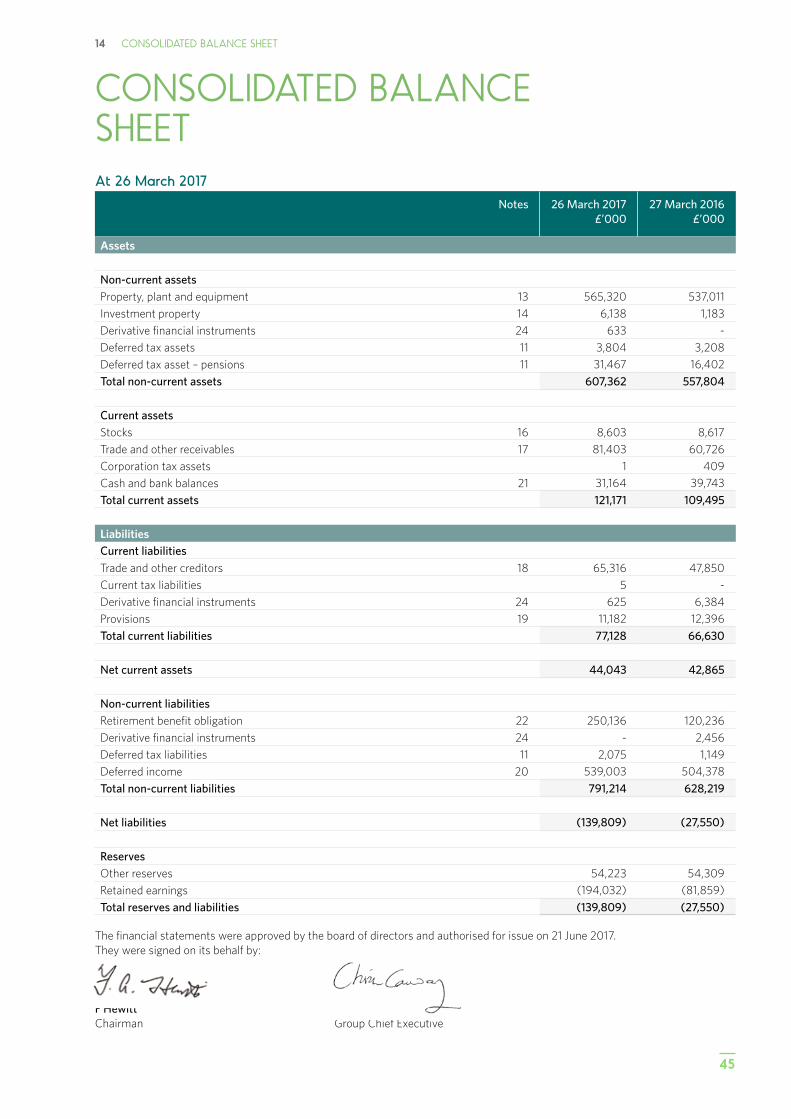
45
14 CONSOLIDATED BALANCE SHEET
CONSOLIDATED BALANCE SHEETAt 26 March 2017
Notes 26 March 2017£’000
27 March 2016£’000
Assets
Non-current assetsProperty, plant and equipment 13 565,320 537,011
Investment property 14 6,138 1,183
Derivative financial instruments 24 633 -
Deferred tax assets 11 3,804 3,208
Deferred tax asset – pensions 11 31,467 16,402
Total non-current assets 607,362 557,804
Current assetsStocks 16 8,603 8,617
Trade and other receivables 17 81,403 60,726
Corporation tax assets 1 409
Cash and bank balances 21 31,164 39,743
Total current assets 121,171 109,495
LiabilitiesCurrent liabilitiesTrade and other creditors 18 65,316 47,850
Current tax liabilities 5 -
Derivative financial instruments 24 625 6,384
Provisions 19 11,182 12,396
Total current liabilities 77,128 66,630
Net current assets 44,043 42,865
Non-current liabilitiesRetirement benefit obligation 22 250,136 120,236
Derivative financial instruments 24 - 2,456
Deferred tax liabilities 11 2,075 1,149
Deferred income 20 539,003 504,378
Total non-current liabilities 791,214 628,219
Net liabilities (139,809) (27,550)
ReservesOther reserves 54,223 54,309
Retained earnings (194,032) (81,859)
Total reserves and liabilities (139,809) (27,550)
The financial statements were approved by the board of directors and authorised for issue on 21 June 2017. They were signed on its behalf by:
F Hewitt C ConwayChairman Group Chief Executive
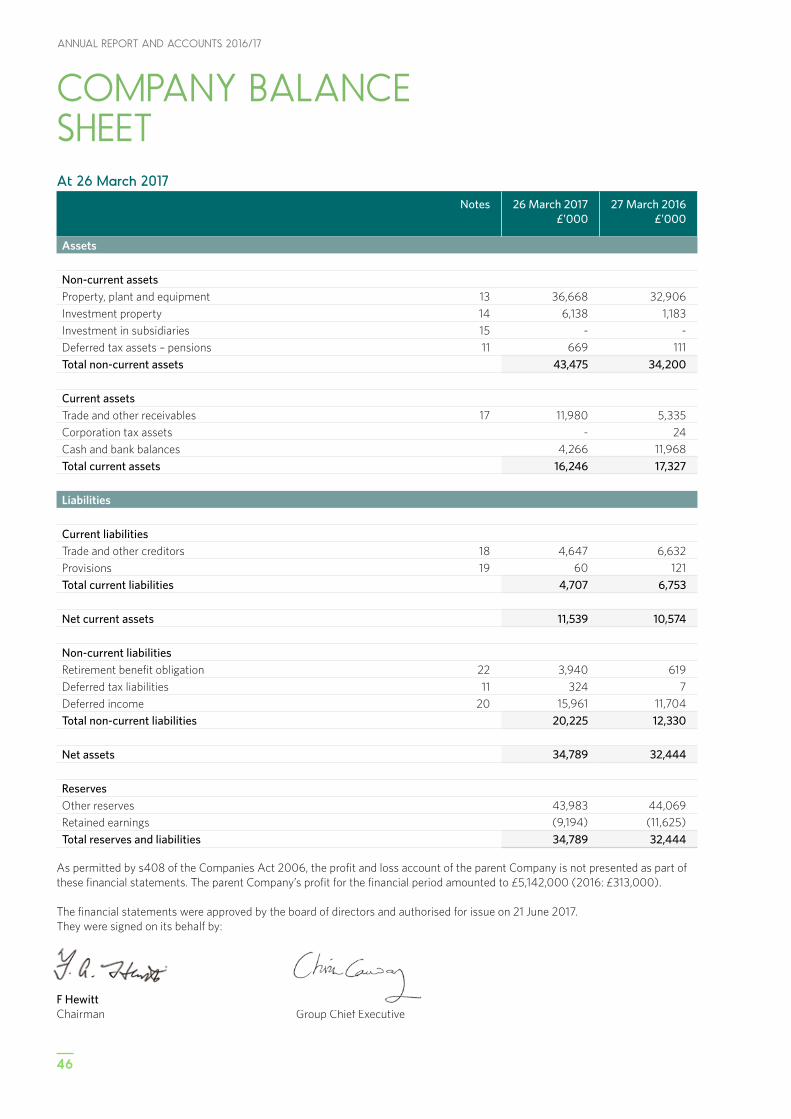
ANNUAL REPORT AND ACCOUNTS 2016/17
46
COMPANY BALANCE SHEET At 26 March 2017
Notes 26 March 2017£’000
27 March 2016£’000
Assets
Non-current assetsProperty, plant and equipment 13 36,668 32,906
Investment property 14 6,138 1,183
Investment in subsidiaries 15 - -
Deferred tax assets – pensions 11 669 111
Total non-current assets 43,475 34,200
Current assetsTrade and other receivables 17 11,980 5,335
Corporation tax assets - 24
Cash and bank balances 4,266 11,968
Total current assets 16,246 17,327
Liabilities
Current liabilitiesTrade and other creditors 18 4,647 6,632
Provisions 19 60 121
Total current liabilities 4,707 6,753
Net current assets 11,539 10,574
Non-current liabilitiesRetirement benefit obligation 22 3,940 619
Deferred tax liabilities 11 324 7
Deferred income 20 15,961 11,704
Total non-current liabilities 20,225 12,330
Net assets 34,789 32,444
ReservesOther reserves 43,983 44,069
Retained earnings (9,194) (11,625)
Total reserves and liabilities 34,789 32,444
As permitted by s408 of the Companies Act 2006, the profit and loss account of the parent Company is not presented as part of these financial statements. The parent Company’s profit for the financial period amounted to £5,142,000 (2016: £313,000).
The financial statements were approved by the board of directors and authorised for issue on 21 June 2017. They were signed on its behalf by:
F Hewitt C ConwayChairman Group Chief Executive
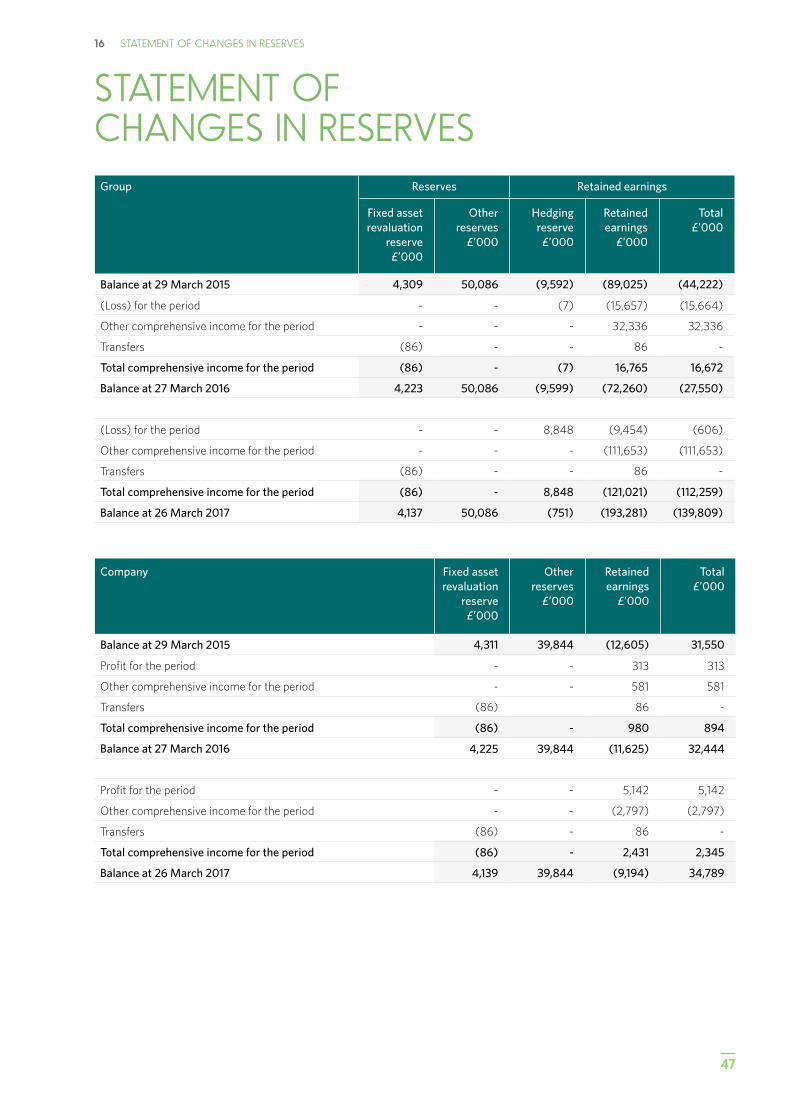
47
16 STATEMENT OF CHANGES IN RESERVES
STATEMENT OF CHANGES IN RESERVES
Group Reserves Retained earnings
Fixed asset revaluation
reserve£’000
Other reserves
£’000
Hedging reserve
£’000
Retained earnings
£’000
Total£’000
Balance at 29 March 2015 4,309 50,086 (9,592) (89,025) (44,222)
(Loss) for the period - - (7) (15,657) (15,664)
Other comprehensive income for the period - - - 32,336 32,336
Transfers (86) - - 86 -
Total comprehensive income for the period (86) - (7) 16,765 16,672
Balance at 27 March 2016 4,223 50,086 (9,599) (72,260) (27,550)
(Loss) for the period - - 8,848 (9,454) (606)
Other comprehensive income for the period - - - (111,653) (111,653)
Transfers (86) - - 86 -
Total comprehensive income for the period (86) - 8,848 (121,021) (112,259)
Balance at 26 March 2017 4,137 50,086 (751) (193,281) (139,809)
Company Fixed asset revaluation
reserve£’000
Other reserves
£’000
Retained earnings
£’000
Total£’000
Balance at 29 March 2015 4,311 39,844 (12,605) 31,550
Profit for the period - - 313 313
Other comprehensive income for the period - - 581 581
Transfers (86) 86 -
Total comprehensive income for the period (86) - 980 894
Balance at 27 March 2016 4,225 39,844 (11,625) 32,444
Profit for the period - - 5,142 5,142
Other comprehensive income for the period - - (2,797) (2,797)
Transfers (86) - 86 -
Total comprehensive income for the period (86) - 2,431 2,345
Balance at 26 March 2017 4,139 39,844 (9,194) 34,789
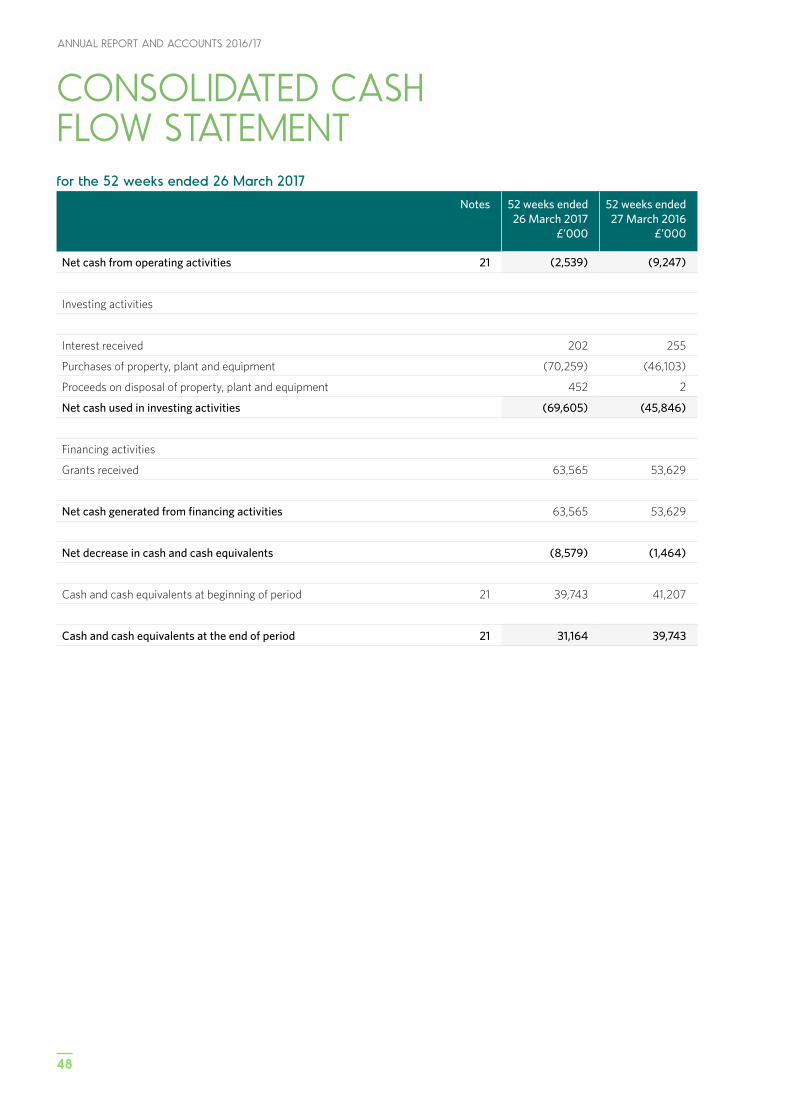
ANNUAL REPORT AND ACCOUNTS 2016/17
48
CONSOLIDATED CASH FLOW STATEMENTfor the 52 weeks ended 26 March 2017
Notes 52 weeks ended26 March 2017
£’000
52 weeks ended27 March 2016
£’000
Net cash from operating activities 21 (2,539) (9,247)
Investing activities
Interest received 202 255
Purchases of property, plant and equipment (70,259) (46,103)
Proceeds on disposal of property, plant and equipment 452 2
Net cash used in investing activities (69,605) (45,846)
Financing activities
Grants received 63,565 53,629
Net cash generated from financing activities 63,565 53,629
Net decrease in cash and cash equivalents (8,579) (1,464)
Cash and cash equivalents at beginning of period 21 39,743 41,207
Cash and cash equivalents at the end of period 21 31,164 39,743
49
18 NOTES TO THE CONSOLIDATED FINANCIAL STATEMENTS
NOTES TO THE CONSOLIDATED FINANCIAL STATEMENTSFor the 52 weeks ended 26 March 2017
1. General InformationThe Northern Ireland Transport Holding Company (the Company) is a Public Corporation incorporated in Northern Ireland under the Transport Act (Northern Ireland) 1967, which requires compliance with Companies legislation with regard to accounts and audit. It follows that the presentation and disclosure requirements of the Companies Act 2006 apply. The addresses of its registered office and principal place of business are disclosed on page 4. The principal activities of the Company and its subsidiaries (the Group) are described in the Strategic Report on page 8.
2. Significant Accounting PoliciesStatement of ComplianceThe financial statements are prepared in accordance with International Financial Reporting Standards (“IFRS”) as adopted by the European Union and with those parts of the Companies Act applicable to companies reporting under IFRS. Basis of Preparation The principal accounting policies adopted in the preparation of these financial statements are set out below. These policies have been consistently applied to all years presented, unless otherwise stated.
The financial statements have been prepared under the historical cost convention as modified by investment properties, financial assets and financial liabilities (including derivative instruments) at fair value.
The financial statements are presented in pounds sterling, the presentational and functional currency of the Group and all values are rounded to the nearest one thousand pounds except where otherwise noted.
Basis of ConsolidationThe consolidated financial statements incorporate the financial statements of the Company and entities controlled by the Company (its subsidiaries) for the 52 week period to 26 March 2017 (52 weeks to 27 March 2016). Control is achieved when the Company has the power over the investee, is exposed, or has rights, to variable return from its involvement with the investee, and has the ability to use its power to affect its returns.
All intra-group transactions, balances, income and expenses are eliminated in full on consolidation.
Going ConcernThe directors have, at the time of approving the financial statements, a reasonable expectation that the Company and the Group have adequate resources to continue in operational existence for the foreseeable future. Although the Balance Sheet shows a net liability position, this is due to the provision for retirement benefits. Thus they continue to adopt the going concern basis of accounting in preparing the financial statements. Further detail is contained in the Directors’ Report on page 27.
Inherited Pension and Compensation PaymentsThe Company has a statutory responsibility for the administration and payment of various pension and compensation liabilities inherited from the Ulster Transport Authority and the Belfast Corporation Transport Department. The Department reimburses the deficit of £297,000 (2016: £332,000) and in consequence, none of the inherited pension and compensation expenditure has been included in the financial statements.
Presentation of Income Statement and Exceptional ItemsWhere applicable, income statement information has been presented in a format which separately highlights exceptional items. Exceptional items include those which individually, or, if similar in nature, in aggregate, need to be disclosed by virtue of their nature, size or incidence in order to allow a proper understanding of the financial performance of the Group.
ANNUAL REPORT AND ACCOUNTS 2016/17
50
2. Significant Accounting Policies (continued)
Revenue RecognitionRevenue represents gross revenue earned from public transport services, including amounts receivable from concessionary fares schemes, and rental income. Where appropriate, amounts are shown net of rebates and VAT. Revenue is measured at the fair value of the consideration received or receivable. Revenue is recognised by reference to the stage of completion of the customer’s travel. Cash received for the sale of season tickets, travelcards and multi-journey smartcards is deferred within liabilities and recognised in the income statement over the period of the relevant ticket.
Income from advertising and other activities is recognised as income is earned.
Finance income is recognised using the effective interest method as interest accrues.
Property, Plant and EquipmentProperty, plant and equipment held for use in the supply of goods or services or for administration purposes are stated at cost, net of depreciation and any provision for impairment.
(i) Depreciation is provided on all property, plant and equipment at rates calculated to write off the cost, less estimated residual value based on prices prevailing at the date of acquisition of each asset, on a straight line basis, as follows:
Land not depreciated Buildings 6 – 50 years Permanent way, signalling and bridges 20 – 50 years Vehicles, plant and equipment 2 – 20 years
(ii) The carrying values of property, plant and equipment are reviewed for impairment at each balance sheet date, if events or changes in circumstances indicate the carrying value may not be recoverable. An impairment loss is recognised in profit or loss for the amounts by which the carrying value of the asset exceeds its recoverable amount, which is the higher of fair value less costs to sell and value in use.
Where an impairment loss subsequently reverses, the carrying amount of the assets is increased to the revised estimate of its recoverable amount, but so that the increased carrying amount does not exceed the carrying amount that would have been determined had no impairment loss been recognised in prior years. A reversal of an impairment loss is recognised immediately in the income statement unless the relevant asset is carried at a revalued amount, in which case the reversal is treated as a revaluation increase.
(iii) Depreciation commences when assets are ready for their intended use.
Prior to March 2000 the Group obtained valuations of certain properties (other than investment properties). The valuations have not been updated since this date and due to the age of the properties and the fact that a substantial portion were inherited, it is not practicable to state the difference between such valuations and historic cost. The March 2000 carrying values have therefore been adopted as deemed cost as the directors are of the view that the fair value of such assets cannot be reliably measured.
51
18 NOTES TO THE CONSOLIDATED FINANCIAL STATEMENTS
2. Significant Accounting Policies (continued)
Investment in Subsidiaries Investments in subsidiaries are shown at cost less provision for impairment.
Investment PropertyInvestment properties are properties held to earn rentals and/or for capital appreciation (including property under construction for such purposes). Investment properties are measured initially at cost, including transaction costs. Subsequent to initial recognition, investment properties are measured at fair value at the balance sheet date. Gains and losses arising from changes in the fair value of investment properties are included in profit or loss in the period in which they arise. An investment property is derecognised upon disposal or when the investment property is permanently withdrawn from use and no future economic benefits are expected from it. Any gain or loss arising on derecognition of the property (calculated as the difference between the net disposal proceeds and the carrying amount of the asset) is included in profit or loss in the period in which the property is derecognised.
Government GrantsGovernment grants are not recognised until there is reasonable assurance that the Group will comply with the conditions attaching to them and that the grants will be received.
Government grants are recognised in the consolidated income statement on a systematic basis over the periods in which the Group recognises as expenses the related costs for which the grants are intended to compensate. Specifically, government grants whose primary condition is that the Group should purchase, construct or otherwise acquire non-current assets are recognised as deferred revenue in the consolidated balance sheet and transferred to income on a systematic and rational basis over the useful lives of the related assets.
Government grants that are receivable as compensation for expenses or losses already incurred or for the purpose of giving immediate financial support to the Group with no future related costs are recognised in the consolidated income statement in the period in which they become receivable.
StocksStock represents consumable stores and is valued at the lower of weighted average cost and estimated net realisable value.
Retirement Benefit CostsThe majority of employees of the Group are members of the Northern Ireland Local Government Officers’ Superannuation Scheme which is a ‘multi-employer’ defined benefit pension scheme. For defined benefit retirement plans, the cost of providing benefits is determined using the Projected Unit Credit Method, with updates to formal actuarial valuations being carried out at the end of each reporting period. Remeasurement comprising actuarial gains and losses, and the return on scheme assets (excluding interest) are recognised immediately in the balance sheet with a charge or credit to the statement of comprehensive income in the period in which they occur. Remeasurement recorded in the statement of comprehensive income is not recycled. Past service cost is recognised in income in the period of scheme amendment. Net interest is calculated by applying a discount rate to the net defined liability or asset. Defined benefit costs are split into three categories:
- current service cost, past service cost and losses on curtailments and settlements;- net interest expense or income; and- remeasurement.
ANNUAL REPORT AND ACCOUNTS 2016/17
52
2. Significant Accounting Policies (continued)
Retirement Benefit Costs (continued)The Group presents the first component of defined benefit costs within cost of sales and administrative expenses (see note 22) in its consolidated income statement. Curtailment gains and losses are accounted for as past service cost.
Net interest expense or income is recognised within other finance costs (note 9). The retirement benefit obligation recognised in the consolidated balance sheet represents the deficit or surplus in the defined benefit schemes.
Operating LeasesRentals receivable/payable under operating leases are credited/charged to income on a straight line basis over the lease term.
TaxationCurrent tax, including UK corporation tax, is provided at amounts expected to be paid (or recovered) using the tax rates and laws that have been enacted or substantively enacted by the balance sheet date. Deferred tax is recognised in respect of all timing differences that have originated but not reversed at the balance sheet date where transactions or events have occurred at that date that will result in an obligation to pay more, or a right to pay less tax in the future, with the following exceptions: • provision is made for tax on gains on disposal of property, plant and equipment that have been rolled over into replacement
assets, only to the extent that, at the balance sheet date, there is a binding agreement to dispose of the assets concerned. However, no provision is made where, on the basis of all available evidence at the balance sheet date, it is more likely than not that the taxable gain will be rolled over into replacement assets and charged to tax only where the replacement assets are sold; and
• deferred tax assets are recognised only to the extent that the directors consider that it is more likely than not that there will be
suitable taxable profits from which the future reversal of the underlying timing differences can be deducted. Deferred tax is measured on an undiscounted basis at the tax rates that are expected to apply in the periods in which timing differences reverse, based on tax rates and laws enacted or substantively enacted at the balance sheet date. Third Party Claims ProvisionsProvisions are recognised when the Group has a present obligation (legal or constructive) as a result of a past event, it is probable that the Group will be required to settle that obligation and a reliable estimate can be made of the amount of the obligation.
Any surplus realised, or expected to be realised on the settlement of claims, is included in the results for the period. Consequential loss claims, under criminal injuries legislation, are estimated and taken into account in determining the operating results, pending agreement with the Department of Justice.
The Group receives claims in respect of traffic incidents and employee claims. The Group protects against the cost of such claims through third party insurance policies. An element of the claims is not insured as a result of the “excess” or “deductible” on insurance policies.
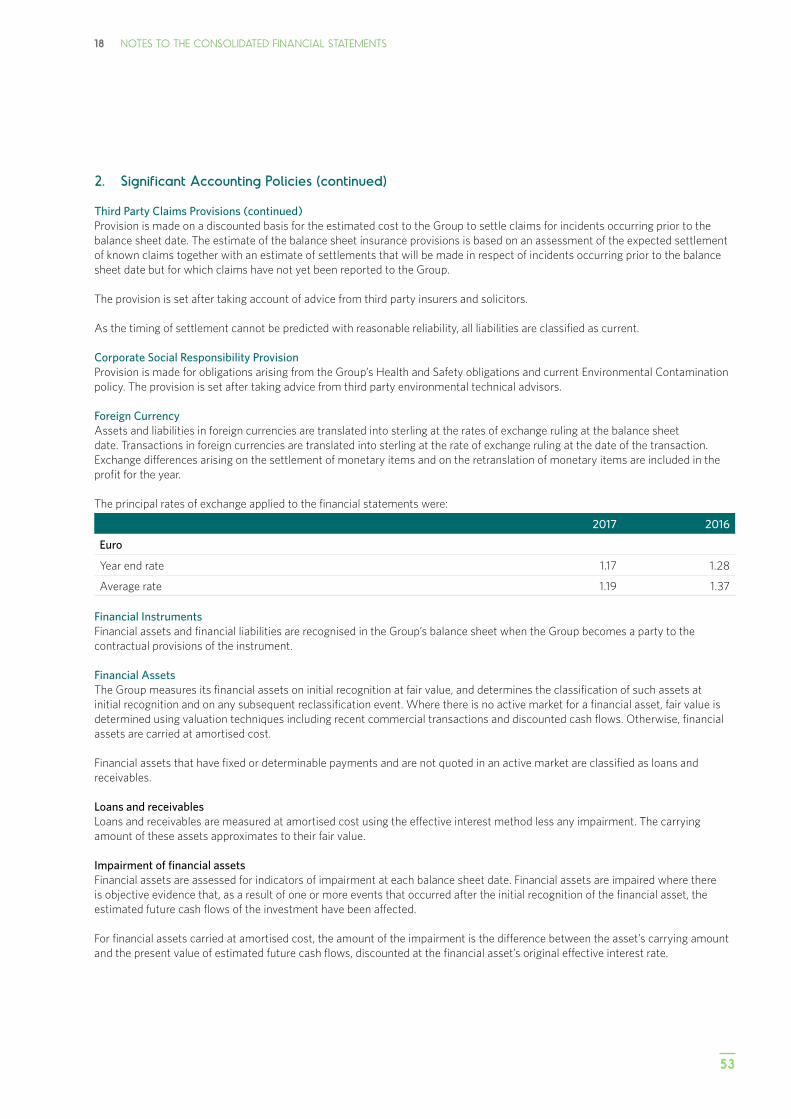
53
18 NOTES TO THE CONSOLIDATED FINANCIAL STATEMENTS
2. Significant Accounting Policies (continued)
Third Party Claims Provisions (continued)Provision is made on a discounted basis for the estimated cost to the Group to settle claims for incidents occurring prior to the balance sheet date. The estimate of the balance sheet insurance provisions is based on an assessment of the expected settlement of known claims together with an estimate of settlements that will be made in respect of incidents occurring prior to the balance sheet date but for which claims have not yet been reported to the Group.
The provision is set after taking account of advice from third party insurers and solicitors.
As the timing of settlement cannot be predicted with reasonable reliability, all liabilities are classified as current.
Corporate Social Responsibility ProvisionProvision is made for obligations arising from the Group’s Health and Safety obligations and current Environmental Contamination policy. The provision is set after taking advice from third party environmental technical advisors.
Foreign CurrencyAssets and liabilities in foreign currencies are translated into sterling at the rates of exchange ruling at the balance sheet date. Transactions in foreign currencies are translated into sterling at the rate of exchange ruling at the date of the transaction. Exchange differences arising on the settlement of monetary items and on the retranslation of monetary items are included in the profit for the year.
The principal rates of exchange applied to the financial statements were:
2017 2016
Euro
Year end rate 1.17 1.28
Average rate 1.19 1.37
Financial InstrumentsFinancial assets and financial liabilities are recognised in the Group’s balance sheet when the Group becomes a party to the contractual provisions of the instrument.
Financial AssetsThe Group measures its financial assets on initial recognition at fair value, and determines the classification of such assets at initial recognition and on any subsequent reclassification event. Where there is no active market for a financial asset, fair value is determined using valuation techniques including recent commercial transactions and discounted cash flows. Otherwise, financial assets are carried at amortised cost.
Financial assets that have fixed or determinable payments and are not quoted in an active market are classified as loans and receivables.
Loans and receivablesLoans and receivables are measured at amortised cost using the effective interest method less any impairment. The carrying amount of these assets approximates to their fair value.
Impairment of financial assetsFinancial assets are assessed for indicators of impairment at each balance sheet date. Financial assets are impaired where there is objective evidence that, as a result of one or more events that occurred after the initial recognition of the financial asset, the estimated future cash flows of the investment have been affected.
For financial assets carried at amortised cost, the amount of the impairment is the difference between the asset’s carrying amount and the present value of estimated future cash flows, discounted at the financial asset’s original effective interest rate.
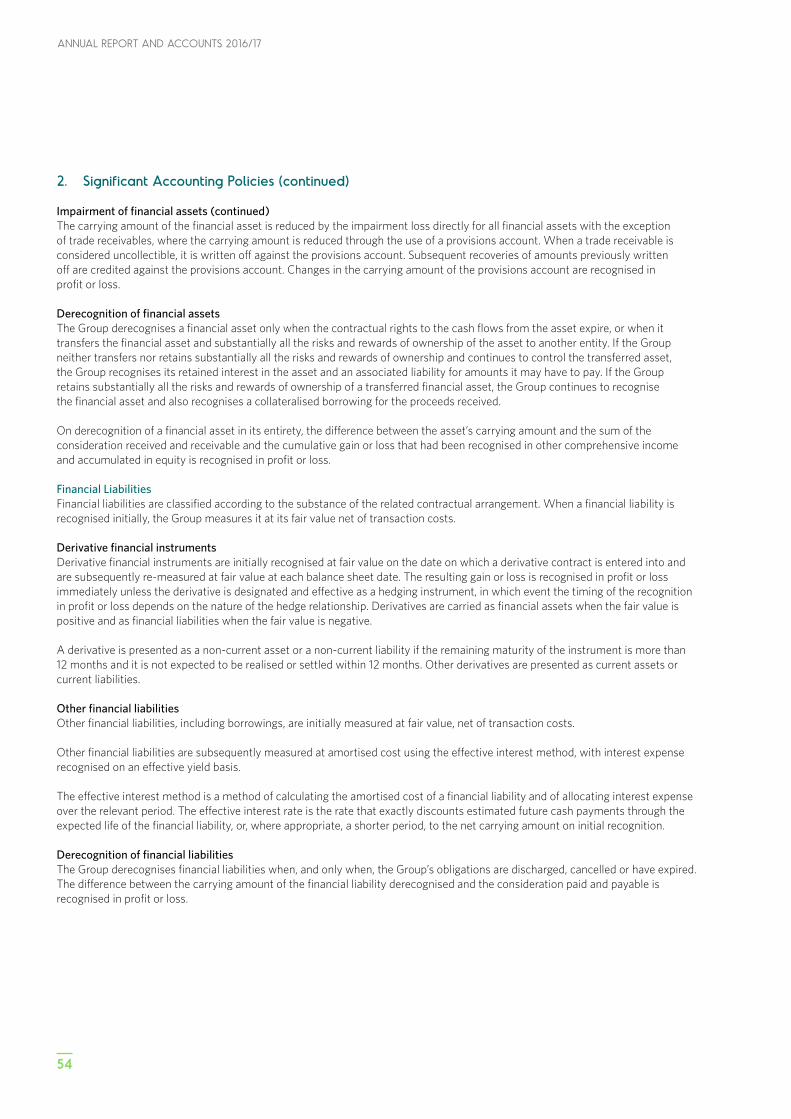
ANNUAL REPORT AND ACCOUNTS 2016/17
54
2. Significant Accounting Policies (continued)
Impairment of financial assets (continued)The carrying amount of the financial asset is reduced by the impairment loss directly for all financial assets with the exception of trade receivables, where the carrying amount is reduced through the use of a provisions account. When a trade receivable is considered uncollectible, it is written off against the provisions account. Subsequent recoveries of amounts previously written off are credited against the provisions account. Changes in the carrying amount of the provisions account are recognised in profit or loss.
Derecognition of financial assetsThe Group derecognises a financial asset only when the contractual rights to the cash flows from the asset expire, or when it transfers the financial asset and substantially all the risks and rewards of ownership of the asset to another entity. If the Group neither transfers nor retains substantially all the risks and rewards of ownership and continues to control the transferred asset, the Group recognises its retained interest in the asset and an associated liability for amounts it may have to pay. If the Group retains substantially all the risks and rewards of ownership of a transferred financial asset, the Group continues to recognise the financial asset and also recognises a collateralised borrowing for the proceeds received.
On derecognition of a financial asset in its entirety, the difference between the asset’s carrying amount and the sum of the consideration received and receivable and the cumulative gain or loss that had been recognised in other comprehensive income and accumulated in equity is recognised in profit or loss.
Financial LiabilitiesFinancial liabilities are classified according to the substance of the related contractual arrangement. When a financial liability is recognised initially, the Group measures it at its fair value net of transaction costs.
Derivative financial instrumentsDerivative financial instruments are initially recognised at fair value on the date on which a derivative contract is entered into and are subsequently re-measured at fair value at each balance sheet date. The resulting gain or loss is recognised in profit or loss immediately unless the derivative is designated and effective as a hedging instrument, in which event the timing of the recognition in profit or loss depends on the nature of the hedge relationship. Derivatives are carried as financial assets when the fair value is positive and as financial liabilities when the fair value is negative.
A derivative is presented as a non-current asset or a non-current liability if the remaining maturity of the instrument is more than 12 months and it is not expected to be realised or settled within 12 months. Other derivatives are presented as current assets or current liabilities.
Other financial liabilitiesOther financial liabilities, including borrowings, are initially measured at fair value, net of transaction costs.
Other financial liabilities are subsequently measured at amortised cost using the effective interest method, with interest expense recognised on an effective yield basis.
The effective interest method is a method of calculating the amortised cost of a financial liability and of allocating interest expense over the relevant period. The effective interest rate is the rate that exactly discounts estimated future cash payments through the expected life of the financial liability, or, where appropriate, a shorter period, to the net carrying amount on initial recognition.
Derecognition of financial liabilities The Group derecognises financial liabilities when, and only when, the Group’s obligations are discharged, cancelled or have expired. The difference between the carrying amount of the financial liability derecognised and the consideration paid and payable is recognised in profit or loss.
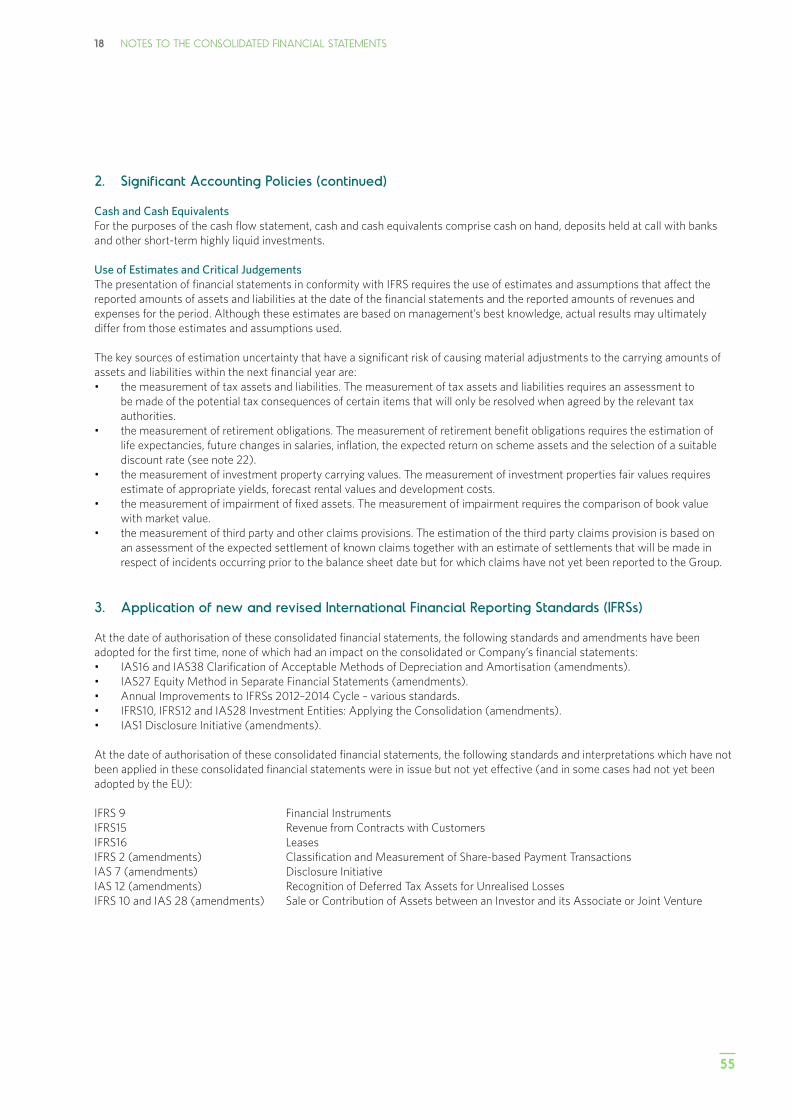
55
18 NOTES TO THE CONSOLIDATED FINANCIAL STATEMENTS
2. Significant Accounting Policies (continued)
Cash and Cash EquivalentsFor the purposes of the cash flow statement, cash and cash equivalents comprise cash on hand, deposits held at call with banks and other short-term highly liquid investments.
Use of Estimates and Critical Judgements The presentation of financial statements in conformity with IFRS requires the use of estimates and assumptions that affect the reported amounts of assets and liabilities at the date of the financial statements and the reported amounts of revenues and expenses for the period. Although these estimates are based on management’s best knowledge, actual results may ultimately differ from those estimates and assumptions used.
The key sources of estimation uncertainty that have a significant risk of causing material adjustments to the carrying amounts of assets and liabilities within the next financial year are:• the measurement of tax assets and liabilities. The measurement of tax assets and liabilities requires an assessment to
be made of the potential tax consequences of certain items that will only be resolved when agreed by the relevant tax authorities.
• the measurement of retirement obligations. The measurement of retirement benefit obligations requires the estimation of life expectancies, future changes in salaries, inflation, the expected return on scheme assets and the selection of a suitable discount rate (see note 22).
• the measurement of investment property carrying values. The measurement of investment properties fair values requires estimate of appropriate yields, forecast rental values and development costs.
• the measurement of impairment of fixed assets. The measurement of impairment requires the comparison of book value with market value.
• the measurement of third party and other claims provisions. The estimation of the third party claims provision is based on an assessment of the expected settlement of known claims together with an estimate of settlements that will be made in respect of incidents occurring prior to the balance sheet date but for which claims have not yet been reported to the Group.
3. Application of new and revised International Financial Reporting Standards (IFRSs)
At the date of authorisation of these consolidated financial statements, the following standards and amendments have been adopted for the first time, none of which had an impact on the consolidated or Company’s financial statements:• IAS16 and IAS38 Clarification of Acceptable Methods of Depreciation and Amortisation (amendments).• IAS27 Equity Method in Separate Financial Statements (amendments).• Annual Improvements to IFRSs 2012–2014 Cycle – various standards.• IFRS10, IFRS12 and IAS28 Investment Entities: Applying the Consolidation (amendments).• IAS1 Disclosure Initiative (amendments).
At the date of authorisation of these consolidated financial statements, the following standards and interpretations which have not been applied in these consolidated financial statements were in issue but not yet effective (and in some cases had not yet been adopted by the EU):
IFRS 9 Financial InstrumentsIFRS15 Revenue from Contracts with CustomersIFRS16 LeasesIFRS 2 (amendments) Classification and Measurement of Share-based Payment TransactionsIAS 7 (amendments) Disclosure Initiative IAS 12 (amendments) Recognition of Deferred Tax Assets for Unrealised LossesIFRS 10 and IAS 28 (amendments) Sale or Contribution of Assets between an Investor and its Associate or Joint Venture
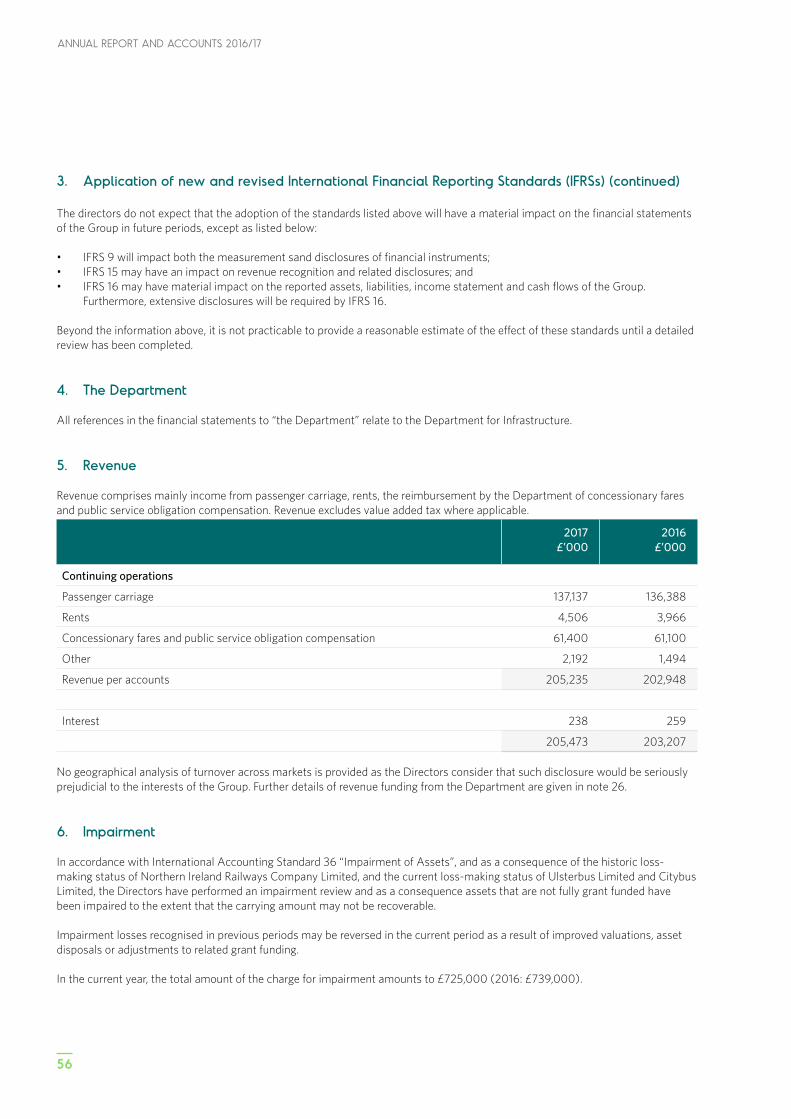
ANNUAL REPORT AND ACCOUNTS 2016/17
56
3. Application of new and revised International Financial Reporting Standards (IFRSs) (continued)
The directors do not expect that the adoption of the standards listed above will have a material impact on the financial statements of the Group in future periods, except as listed below:
• IFRS 9 will impact both the measurement sand disclosures of financial instruments;• IFRS 15 may have an impact on revenue recognition and related disclosures; and• IFRS 16 may have material impact on the reported assets, liabilities, income statement and cash flows of the Group. Furthermore, extensive disclosures will be required by IFRS 16.
Beyond the information above, it is not practicable to provide a reasonable estimate of the effect of these standards until a detailed review has been completed.
4. The Department
All references in the financial statements to “the Department” relate to the Department for Infrastructure.
5. Revenue
Revenue comprises mainly income from passenger carriage, rents, the reimbursement by the Department of concessionary fares and public service obligation compensation. Revenue excludes value added tax where applicable.
2017£’000
2016£’000
Continuing operations
Passenger carriage 137,137 136,388
Rents 4,506 3,966
Concessionary fares and public service obligation compensation 61,400 61,100
Other 2,192 1,494
Revenue per accounts 205,235 202,948
Interest 238 259
205,473 203,207
No geographical analysis of turnover across markets is provided as the Directors consider that such disclosure would be seriously prejudicial to the interests of the Group. Further details of revenue funding from the Department are given in note 26.
6. Impairment
In accordance with International Accounting Standard 36 “Impairment of Assets”, and as a consequence of the historic loss-making status of Northern Ireland Railways Company Limited, and the current loss-making status of Ulsterbus Limited and Citybus Limited, the Directors have performed an impairment review and as a consequence assets that are not fully grant funded have been impaired to the extent that the carrying amount may not be recoverable.
Impairment losses recognised in previous periods may be reversed in the current period as a result of improved valuations, asset disposals or adjustments to related grant funding.
In the current year, the total amount of the charge for impairment amounts to £725,000 (2016: £739,000).
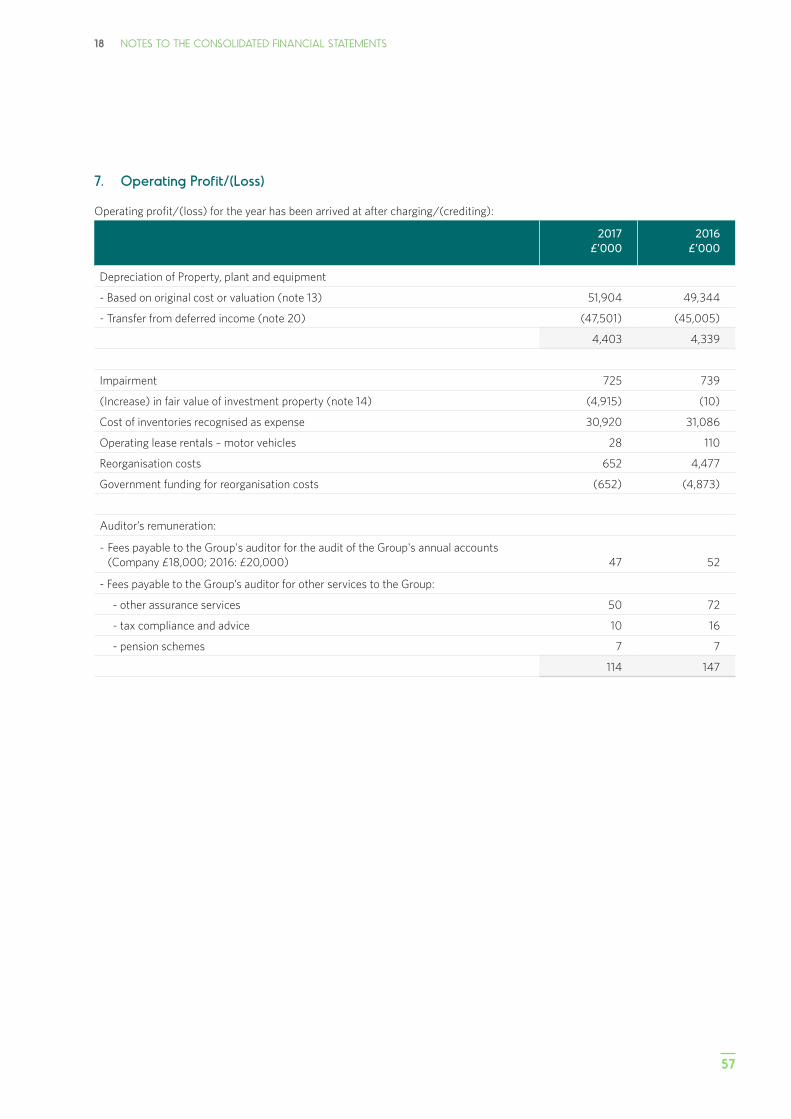
57
18 NOTES TO THE CONSOLIDATED FINANCIAL STATEMENTS
7. Operating Profit/(Loss)
Operating profit/(loss) for the year has been arrived at after charging/(crediting):
2017£’000
2016£’000
Depreciation of Property, plant and equipment
- Based on original cost or valuation (note 13) 51,904 49,344
- Transfer from deferred income (note 20) (47,501) (45,005)
4,403 4,339
Impairment 725 739
(Increase) in fair value of investment property (note 14) (4,915) (10)
Cost of inventories recognised as expense 30,920 31,086
Operating lease rentals – motor vehicles 28 110
Reorganisation costs 652 4,477
Government funding for reorganisation costs (652) (4,873)
Auditor’s remuneration:
- Fees payable to the Group's auditor for the audit of the Group's annual accounts (Company £18,000; 2016: £20,000) 47 52
- Fees payable to the Group’s auditor for other services to the Group:
- other assurance services 50 72
- tax compliance and advice 10 16
- pension schemes 7 7
114 147
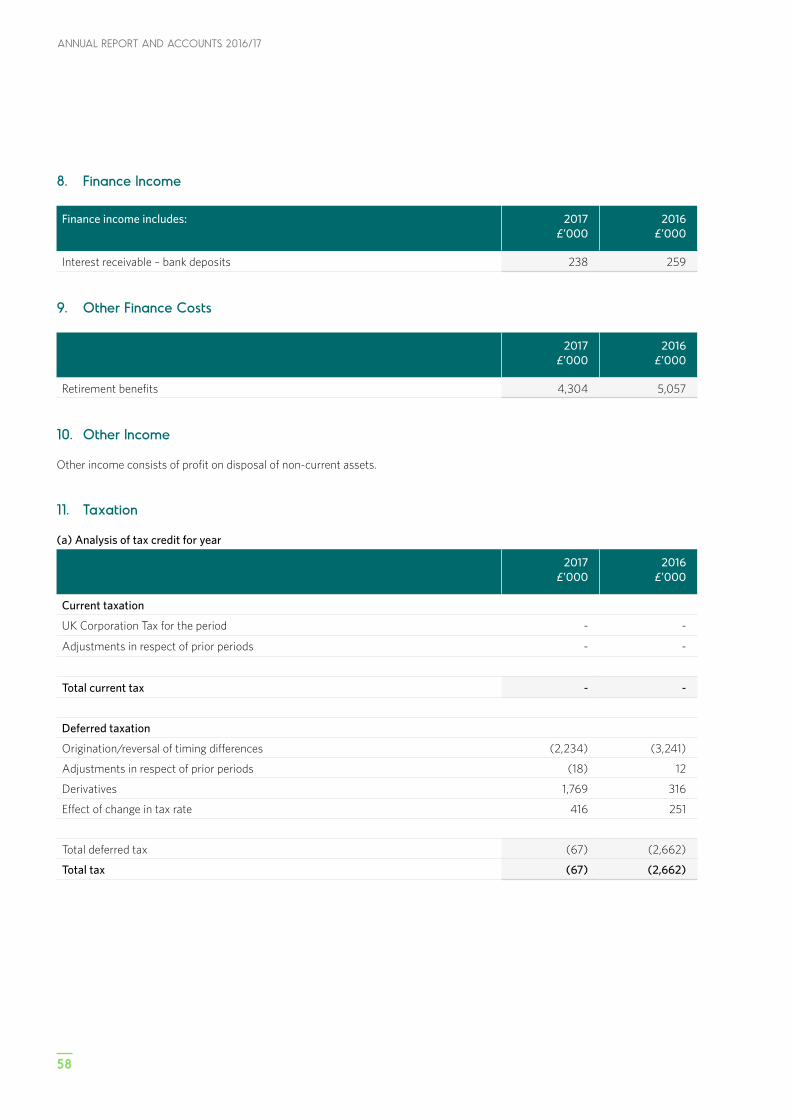
ANNUAL REPORT AND ACCOUNTS 2016/17
58
8. Finance Income
Finance income includes: 2017£’000
2016£’000
Interest receivable – bank deposits 238 259
9. Other Finance Costs
2017£’000
2016£’000
Retirement benefits 4,304 5,057
10. Other Income
Other income consists of profit on disposal of non-current assets.
11. Taxation (a) Analysis of tax credit for year
2017£’000
2016£’000
Current taxation
UK Corporation Tax for the period - -
Adjustments in respect of prior periods - -
Total current tax - -
Deferred taxation
Origination/reversal of timing differences (2,234) (3,241)
Adjustments in respect of prior periods (18) 12
Derivatives 1,769 316
Effect of change in tax rate 416 251
Total deferred tax (67) (2,662)
Total tax (67) (2,662)

59
18 NOTES TO THE CONSOLIDATED FINANCIAL STATEMENTS
11 Taxation (continued)
(b) Factors affecting tax credit for the year The credit for the year can be reconciled to the result per income statement as follows:
2017£’000
2016£’000
Loss on continuing activities before tax (673) (18,326)
Tax at 20% (2016:20%) (135) (3,665)
Non deductible expenditure/(non chargeable) income (2,621) 97
Deferred tax liability not recognised in respect of pension liability 122 327
Revaluation of investment property 399 -
Derivatives 1,769 (2)
Adjustments to tax charge in respect of prior years (18) 12
Effect of change in UK corporation tax rate 416 569
Total tax (67) (2,662)
(c) Factors that may affect future tax chargesThe Finance (No.2) Act 2015 provided that the main rate of corporation tax would reduce from 20% with effect from 1 April 2017 and 18% with effect from 1 April 2020. The Finance Act 2016 provides that the main rate of corporation tax will be 17% rather than 18% with effect from 1 April 2020.
The above rate changes will reduce any future UK corporation tax liabilities of the Company.
(d) Tax on items taken directly to other comprehensive incomeIn addition to the amount charged to the income statement, the following amounts relating to tax have been recognised in other comprehensive income:
2017£’000
2016£’000
Arising on income and expenses recognised in other comprehensive income:
Actuarial (losses)/ gains on defined benefit pension schemes (14,667) 7,470
Total tax recognised in other comprehensive income (14,667) 7,470
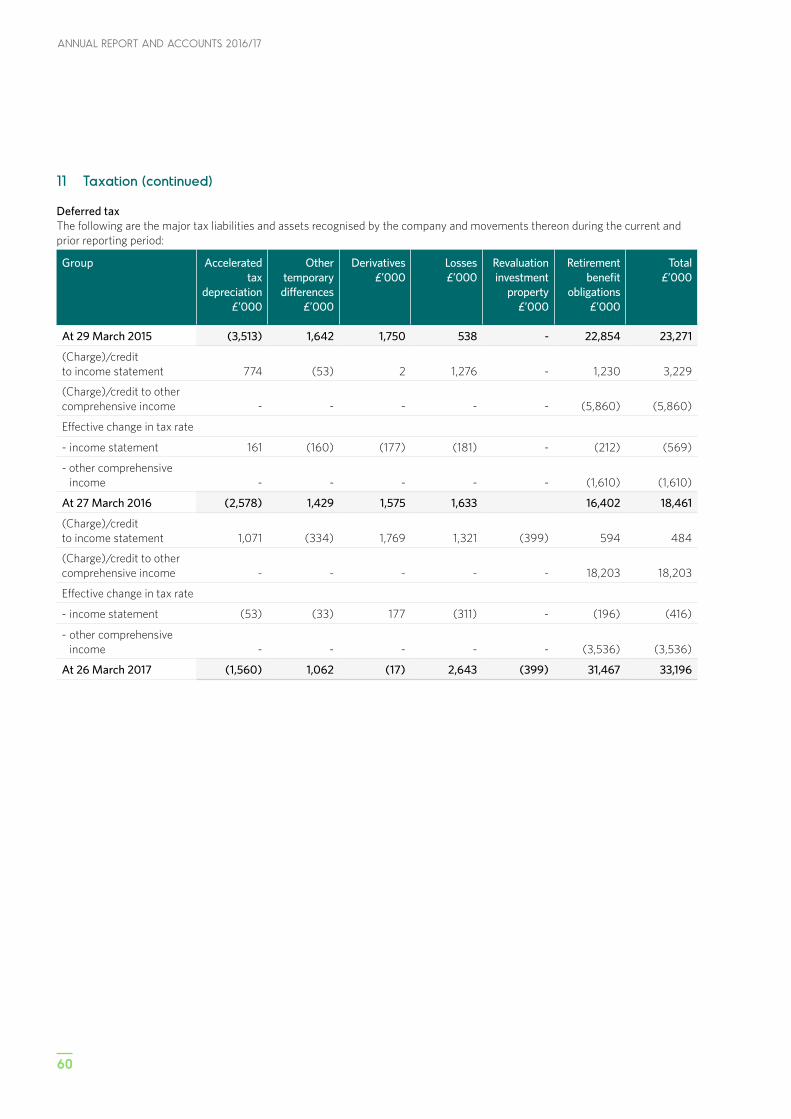
ANNUAL REPORT AND ACCOUNTS 2016/17
60
11 Taxation (continued)
Deferred taxThe following are the major tax liabilities and assets recognised by the company and movements thereon during the current and prior reporting period:
Group Accelerated tax
depreciation£’000
Other temporary
differences£’000
Derivatives£’000
Losses£’000
Revaluation investment
property£’000
Retirement benefit
obligations£’000
Total£’000
At 29 March 2015 (3,513) 1,642 1,750 538 - 22,854 23,271
(Charge)/credit to income statement 774 (53) 2 1,276 - 1,230 3,229
(Charge)/credit to other comprehensive income - - - - - (5,860) (5,860)
Effective change in tax rate
- income statement 161 (160) (177) (181) - (212) (569)
- other comprehensive income - - - - - (1,610) (1,610)
At 27 March 2016 (2,578) 1,429 1,575 1,633 16,402 18,461
(Charge)/credit to income statement 1,071 (334) 1,769 1,321 (399) 594 484
(Charge)/credit to other comprehensive income - - - - - 18,203 18,203
Effective change in tax rate
- income statement (53) (33) 177 (311) - (196) (416)
- other comprehensive income - - - - - (3,536) (3,536)
At 26 March 2017 (1,560) 1,062 (17) 2,643 (399) 31,467 33,196

61
18 NOTES TO THE CONSOLIDATED FINANCIAL STATEMENTS
11 Taxation (continued)
Deferred tax (continued)
Company Accelerated tax
depreciation £’000
Other temporary
differences £’000
Revaluation investment
property £’000
Retirement benefit
obligations £’000
Total £’000
At 29 March 2015 (237) 196 - 256 215
(Charge)/credit to income statement 48 (15) - 19 52
(Charge)/credit to other comprehensive income - - - (152) (152)
Effective change in tax rate
- income statement 19 (18) - 13 14
- other comprehensive income - - - (25) (25)
At 27 March 2016 (170) 163 - 111 104
(Charge)/credit to income statement 80 12 (399) (7) (314)
(Charge)/credit to other comprehensive income - - - 671 671
Effective change in tax rate
- income statement 1 (11) - 7 (3)
- other comprehensive income - - - (113) (113)
At 26 March 2017 (89) 164 (399) 669 345
Deferred tax assets and liabilities are offset where the Group has a legally enforceable right to do so. The following is the analysis of the deferred tax balance (after offset) for financial reporting purposes:
Group 2017£’000
2016£’000
Deferred tax asset 3,804 3,208
Deferred tax liabilities (2,075) (1,149)
Deferred tax asset – Retirement Benefit obligations 31,467 16,402
33,196 18,461
Company 2017£’000
2016£’000
Deferred tax liabilities (324) (7)
Deferred tax asset – Retirement Benefit obligations 669 111
345 104
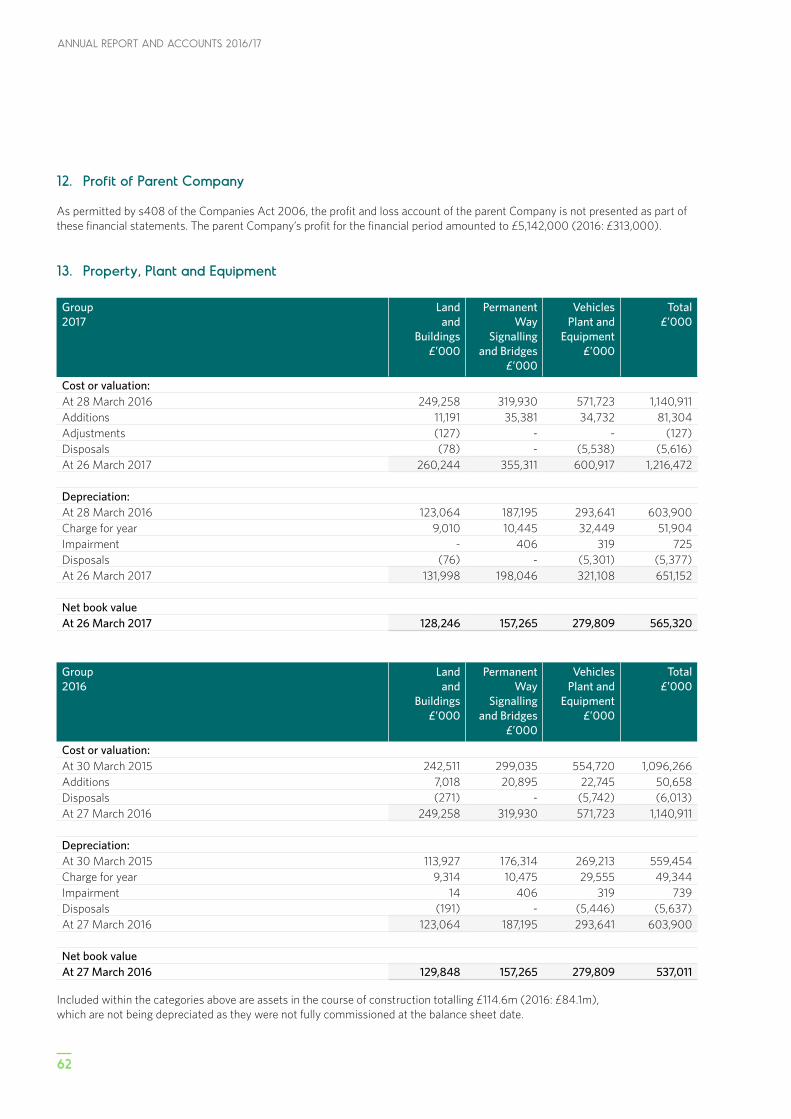
ANNUAL REPORT AND ACCOUNTS 2016/17
62
12. Profit of Parent Company
As permitted by s408 of the Companies Act 2006, the profit and loss account of the parent Company is not presented as part of these financial statements. The parent Company’s profit for the financial period amounted to £5,142,000 (2016: £313,000).
13. Property, Plant and Equipment
Group2017
Landand
Buildings£’000
PermanentWay
Signallingand Bridges
£’000
VehiclesPlant and
Equipment£’000
Total£’000
Cost or valuation:At 28 March 2016 249,258 319,930 571,723 1,140,911Additions 11,191 35,381 34,732 81,304Adjustments (127) - - (127)Disposals (78) - (5,538) (5,616)At 26 March 2017 260,244 355,311 600,917 1,216,472
Depreciation:At 28 March 2016 123,064 187,195 293,641 603,900Charge for year 9,010 10,445 32,449 51,904Impairment - 406 319 725Disposals (76) - (5,301) (5,377)At 26 March 2017 131,998 198,046 321,108 651,152
Net book valueAt 26 March 2017 128,246 157,265 279,809 565,320
Group2016
Landand
Buildings£’000
PermanentWay
Signallingand Bridges
£’000
VehiclesPlant and
Equipment£’000
Total£’000
Cost or valuation:At 30 March 2015 242,511 299,035 554,720 1,096,266Additions 7,018 20,895 22,745 50,658Disposals (271) - (5,742) (6,013)At 27 March 2016 249,258 319,930 571,723 1,140,911
Depreciation:At 30 March 2015 113,927 176,314 269,213 559,454Charge for year 9,314 10,475 29,555 49,344Impairment 14 406 319 739Disposals (191) - (5,446) (5,637)At 27 March 2016 123,064 187,195 293,641 603,900
Net book valueAt 27 March 2016 129,848 157,265 279,809 537,011
Included within the categories above are assets in the course of construction totalling £114.6m (2016: £84.1m), which are not being depreciated as they were not fully commissioned at the balance sheet date.
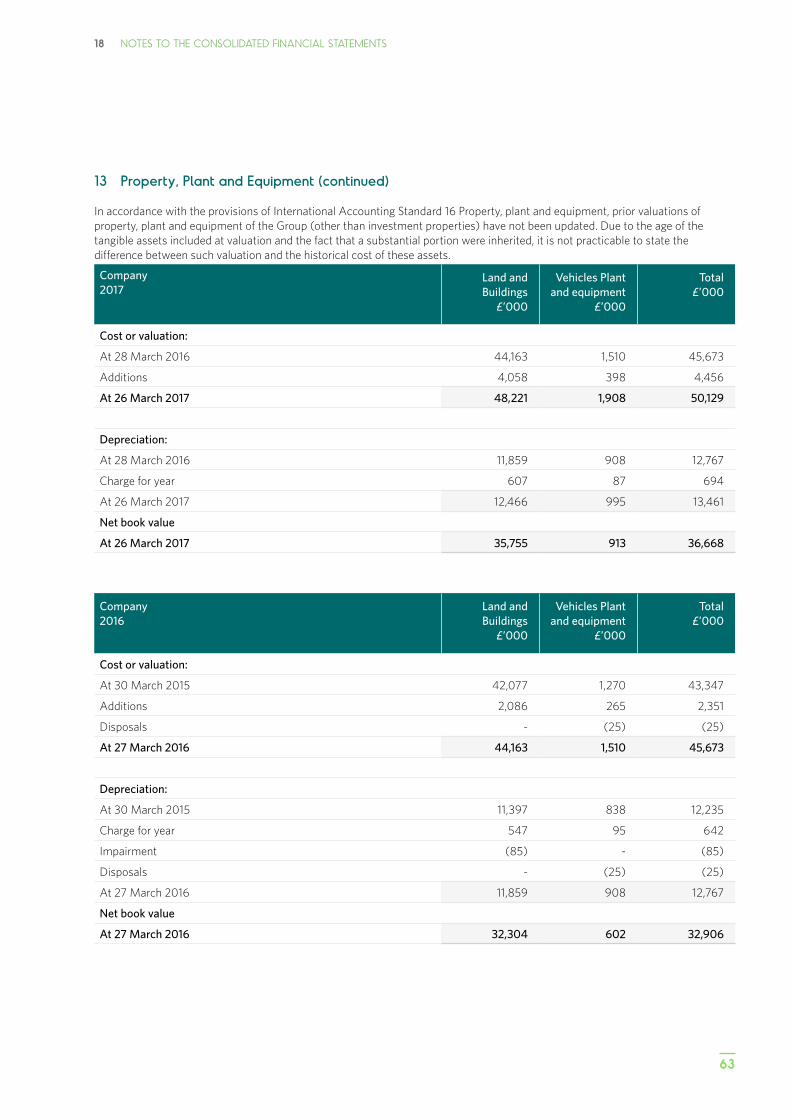
63
18 NOTES TO THE CONSOLIDATED FINANCIAL STATEMENTS
13 Property, Plant and Equipment (continued)
In accordance with the provisions of International Accounting Standard 16 Property, plant and equipment, prior valuations of property, plant and equipment of the Group (other than investment properties) have not been updated. Due to the age of the tangible assets included at valuation and the fact that a substantial portion were inherited, it is not practicable to state the difference between such valuation and the historical cost of these assets.
Company 2017
Land and Buildings
£’000
Vehicles Plant and equipment
£’000
Total£’000
Cost or valuation:
At 28 March 2016 44,163 1,510 45,673
Additions 4,058 398 4,456
At 26 March 2017 48,221 1,908 50,129
Depreciation:
At 28 March 2016 11,859 908 12,767
Charge for year 607 87 694
At 26 March 2017 12,466 995 13,461
Net book value
At 26 March 2017 35,755 913 36,668
Company 2016
Land and Buildings
£’000
Vehicles Plant and equipment
£’000
Total£’000
Cost or valuation:
At 30 March 2015 42,077 1,270 43,347
Additions 2,086 265 2,351
Disposals - (25) (25)
At 27 March 2016 44,163 1,510 45,673
Depreciation:
At 30 March 2015 11,397 838 12,235
Charge for year 547 95 642
Impairment (85) - (85)
Disposals - (25) (25)
At 27 March 2016 11,859 908 12,767
Net book value
At 27 March 2016 32,304 602 32,906
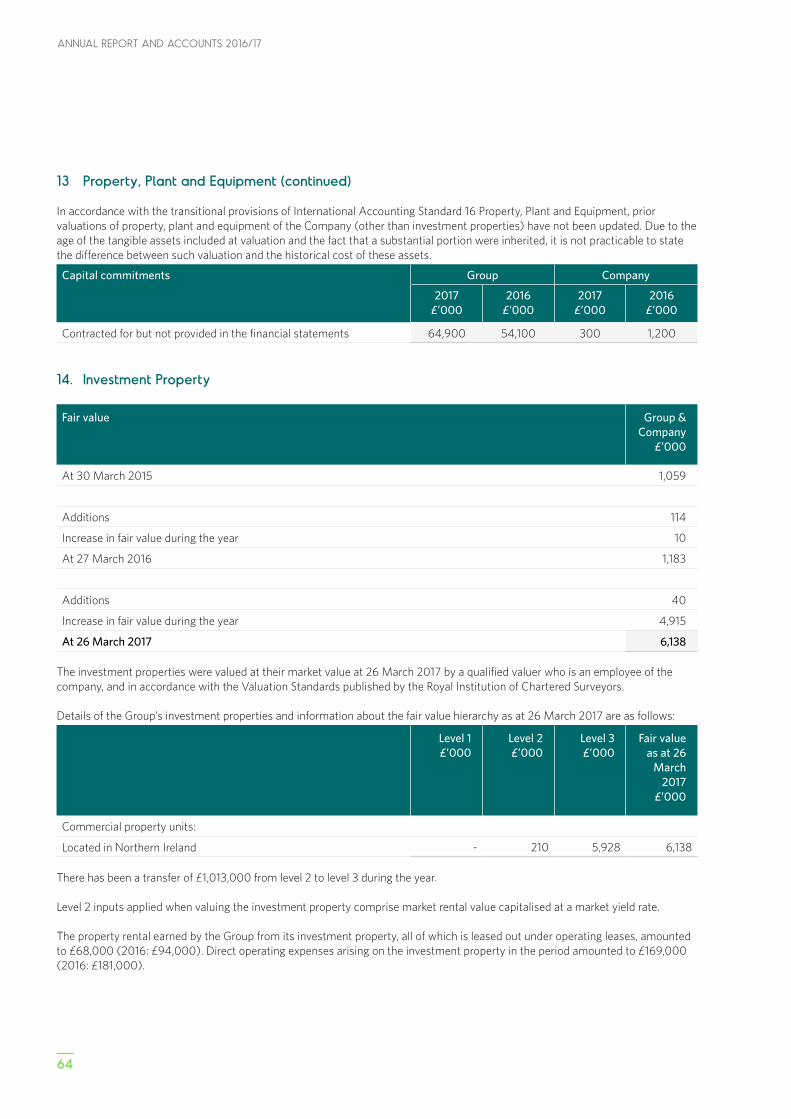
ANNUAL REPORT AND ACCOUNTS 2016/17
64
13 Property, Plant and Equipment (continued)
In accordance with the transitional provisions of International Accounting Standard 16 Property, Plant and Equipment, prior valuations of property, plant and equipment of the Company (other than investment properties) have not been updated. Due to the age of the tangible assets included at valuation and the fact that a substantial portion were inherited, it is not practicable to state the difference between such valuation and the historical cost of these assets.
Capital commitments Group Company
2017£’000
2016£’000
2017£’000
2016£’000
Contracted for but not provided in the financial statements 64,900 54,100 300 1,200
14. Investment Property
Fair value Group & Company
£’000
At 30 March 2015 1,059
Additions 114
Increase in fair value during the year 10
At 27 March 2016 1,183
Additions 40
Increase in fair value during the year 4,915
At 26 March 2017 6,138
The investment properties were valued at their market value at 26 March 2017 by a qualified valuer who is an employee of the company, and in accordance with the Valuation Standards published by the Royal Institution of Chartered Surveyors.
Details of the Group’s investment properties and information about the fair value hierarchy as at 26 March 2017 are as follows:
Level 1 £’000
Level 2 £’000
Level 3 £’000
Fair value as at 26
March 2017
£’000
Commercial property units:
Located in Northern Ireland - 210 5,928 6,138
There has been a transfer of £1,013,000 from level 2 to level 3 during the year.
Level 2 inputs applied when valuing the investment property comprise market rental value capitalised at a market yield rate.
The property rental earned by the Group from its investment property, all of which is leased out under operating leases, amounted to £68,000 (2016: £94,000). Direct operating expenses arising on the investment property in the period amounted to £169,000 (2016: £181,000).
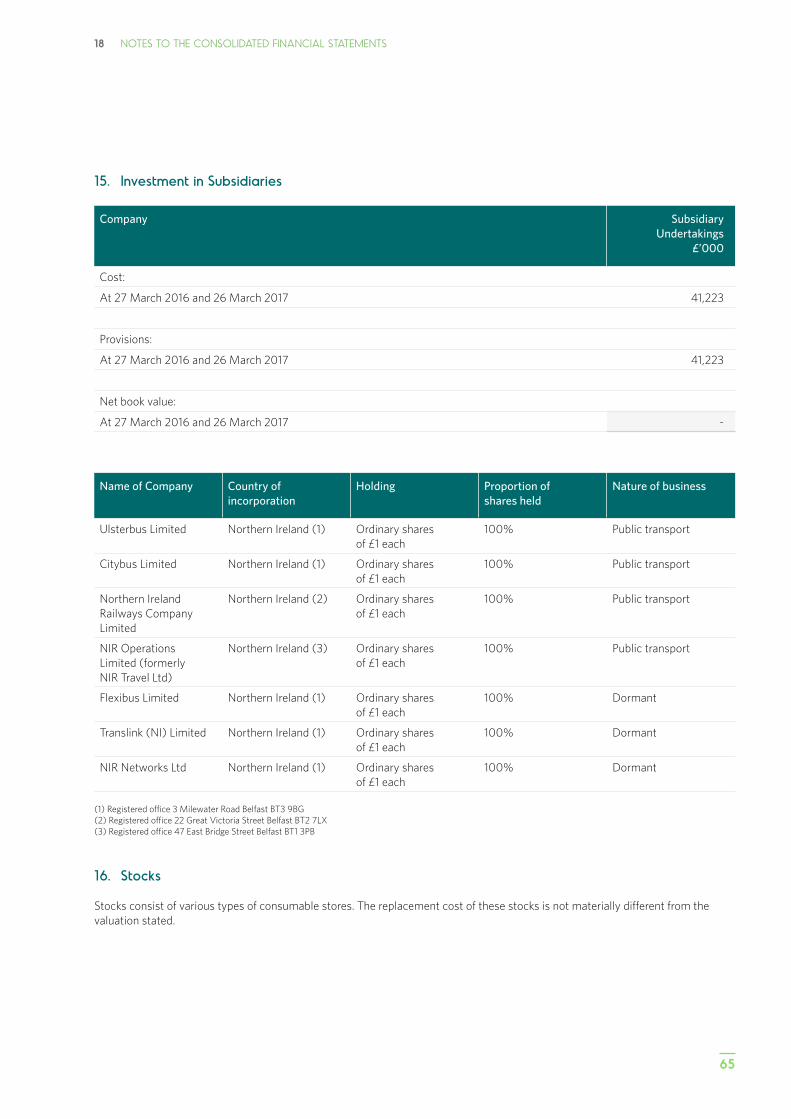
65
18 NOTES TO THE CONSOLIDATED FINANCIAL STATEMENTS
15. Investment in Subsidiaries
Company SubsidiaryUndertakings
£’000
Cost:
At 27 March 2016 and 26 March 2017 41,223
Provisions:
At 27 March 2016 and 26 March 2017 41,223
Net book value:
At 27 March 2016 and 26 March 2017 -
Name of Company Country of incorporation
Holding Proportion of shares held
Nature of business
Ulsterbus Limited Northern Ireland (1) Ordinary shares of £1 each
100% Public transport
Citybus Limited Northern Ireland (1) Ordinary shares of £1 each
100% Public transport
Northern Ireland Railways Company Limited
Northern Ireland (2) Ordinary shares of £1 each
100% Public transport
NIR Operations Limited (formerly NIR Travel Ltd)
Northern Ireland (3) Ordinary shares of £1 each
100% Public transport
Flexibus Limited Northern Ireland (1) Ordinary shares of £1 each
100% Dormant
Translink (NI) Limited Northern Ireland (1) Ordinary shares of £1 each
100% Dormant
NIR Networks Ltd Northern Ireland (1) Ordinary shares of £1 each
100% Dormant
(1) Registered office 3 Milewater Road Belfast BT3 9BG (2) Registered office 22 Great Victoria Street Belfast BT2 7LX (3) Registered office 47 East Bridge Street Belfast BT1 3PB
16. Stocks
Stocks consist of various types of consumable stores. The replacement cost of these stocks is not materially different from the valuation stated.
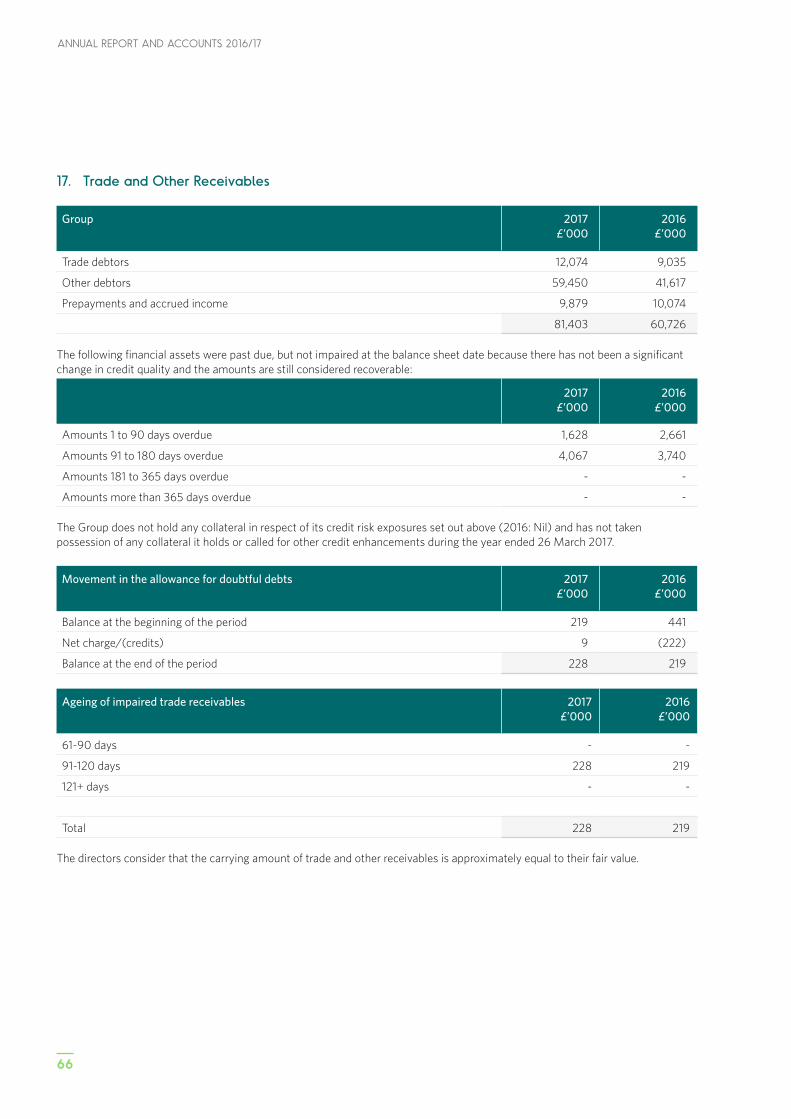
ANNUAL REPORT AND ACCOUNTS 2016/17
66
17. Trade and Other Receivables
Group 2017£’000
2016£’000
Trade debtors 12,074 9,035
Other debtors 59,450 41,617
Prepayments and accrued income 9,879 10,074
81,403 60,726
The following financial assets were past due, but not impaired at the balance sheet date because there has not been a significant change in credit quality and the amounts are still considered recoverable:
2017£’000
2016£’000
Amounts 1 to 90 days overdue 1,628 2,661
Amounts 91 to 180 days overdue 4,067 3,740
Amounts 181 to 365 days overdue - -
Amounts more than 365 days overdue - -
The Group does not hold any collateral in respect of its credit risk exposures set out above (2016: Nil) and has not taken possession of any collateral it holds or called for other credit enhancements during the year ended 26 March 2017.
Movement in the allowance for doubtful debts 2017£’000
2016£’000
Balance at the beginning of the period 219 441
Net charge/(credits) 9 (222)
Balance at the end of the period 228 219
Ageing of impaired trade receivables 2017£’000
2016£’000
61-90 days - -
91-120 days 228 219
121+ days - -
Total 228 219
The directors consider that the carrying amount of trade and other receivables is approximately equal to their fair value.
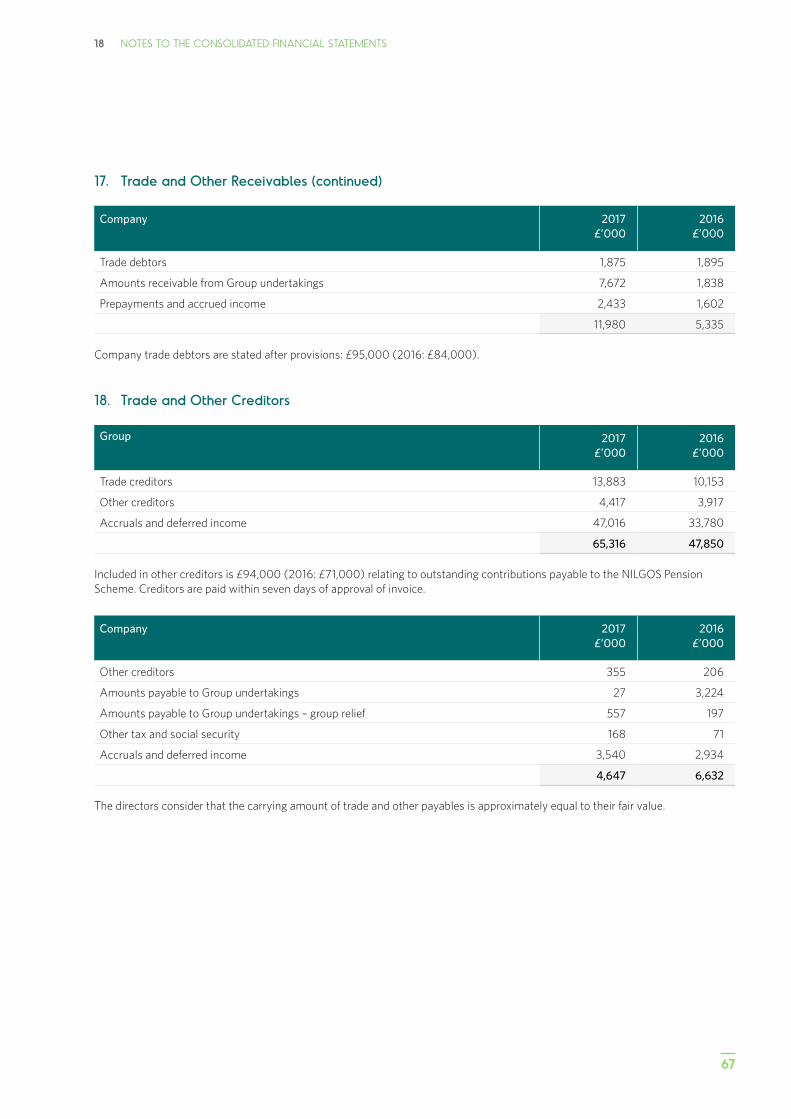
67
18 NOTES TO THE CONSOLIDATED FINANCIAL STATEMENTS
18. Trade and Other Creditors
Group 2017£’000
2016£’000
Trade creditors 13,883 10,153
Other creditors 4,417 3,917
Accruals and deferred income 47,016 33,780
65,316 47,850
Included in other creditors is £94,000 (2016: £71,000) relating to outstanding contributions payable to the NILGOS Pension Scheme. Creditors are paid within seven days of approval of invoice.
Company 2017£’000
2016£’000
Other creditors 355 206
Amounts payable to Group undertakings 27 3,224
Amounts payable to Group undertakings – group relief 557 197
Other tax and social security 168 71
Accruals and deferred income 3,540 2,934
4,647 6,632
The directors consider that the carrying amount of trade and other payables is approximately equal to their fair value.
17. Trade and Other Receivables (continued)
Company 2017£’000
2016£’000
Trade debtors 1,875 1,895
Amounts receivable from Group undertakings 7,672 1,838
Prepayments and accrued income 2,433 1,602
11,980 5,335
Company trade debtors are stated after provisions: £95,000 (2016: £84,000).

ANNUAL REPORT AND ACCOUNTS 2016/17
68
19. Provisions
Group
Group Company
CorporateSocial
Responsibility£’000
Third partyclaims£’000
Total£’000
Third partyclaims£’000
At 27 March 2016 1,021 11,375 12,396 121
Utilised during period - (2,242) (2,242) (64)
Additional provision in the year 279 749 1,028 3
At 26 March 2017 1,300 9,882 11,182 60
The Corporate Social Responsibility provision relates to anticipated clean-up costs due to land contamination at various fuelling points, estimated costs of decommissioning obsolete rolling stock in an environmentally compliant manner and provision to address the risk of damage to the railway track from the spread of invasive species. The obligations giving rise to the requirement for the provision arise from the Group’s Environmental Contamination policy and the Group’s Safety policy.
The third party claims provision relates to the insurance excess or self insured element of claims received and anticipated. The provision is based upon the best estimate of the expenditure to settle each obligation. The timing of settlement is dependent on a number of factors including the courts, but most claims are expected to be settled within one year.
20. Deferred Income
Group 2017£’000
2016£’000
At 27 March 2016 504,378 501,006
Grants receivable in year 82,976 50,504
Disposals (161) (335)
Adjustments (689) (1,792)
Transfer to profit and loss (47,501) (45,005)
At 26 March 2017 539,003 504,378
Company 2017£’000
2016£’000
At 27 March 2016 11,704 9,927
Receivable in year 4,279 2,060
Adjustments 5 (245)
Transfer to profit and loss (27) (38)
At 26 March 2017 15,961 11,704
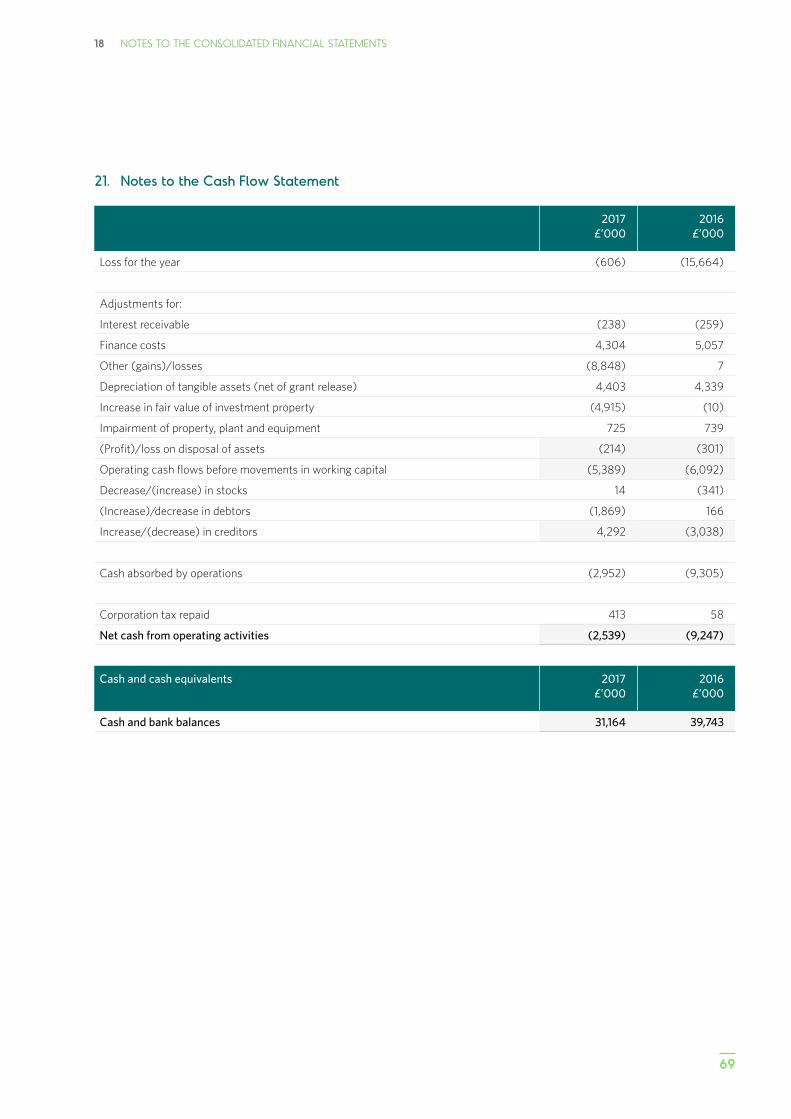
69
18 NOTES TO THE CONSOLIDATED FINANCIAL STATEMENTS
21. Notes to the Cash Flow Statement
2017£’000
2016£’000
Loss for the year (606) (15,664)
Adjustments for:
Interest receivable (238) (259)
Finance costs 4,304 5,057
Other (gains)/losses (8,848) 7
Depreciation of tangible assets (net of grant release) 4,403 4,339
Increase in fair value of investment property (4,915) (10)
Impairment of property, plant and equipment 725 739
(Profit)/loss on disposal of assets (214) (301)
Operating cash flows before movements in working capital (5,389) (6,092)
Decrease/(increase) in stocks 14 (341)
(Increase)/decrease in debtors (1,869) 166
Increase/(decrease) in creditors 4,292 (3,038)
Cash absorbed by operations (2,952) (9,305)
Corporation tax repaid 413 58
Net cash from operating activities (2,539) (9,247)
Cash and cash equivalents 2017 £’000
2016£’000
Cash and bank balances 31,164 39,743

ANNUAL REPORT AND ACCOUNTS 2016/17
70
22. Retirement Benefit Obligation
(i) Description of the schemes
NILGOS SchemeThe Company participates in the Northern Ireland Local Government Officers’ Superannuation (“NILGOS”) scheme. The NILGOS scheme is a multi-employer defined benefit scheme, the assets of which are held in a separate fund. Under the scheme, members are entitled to post-retirement benefits varying between one eightieth (plus lump sum of three eightieths) and one sixtieth of final pensionable salary on attainment of a retirement age of 65 years for service up to 31 March 2015 and to post-retirement benefits of one forty-ninth of pensionable salary in respect of each year on attainment of retirement age for service from 1 April 2015. The NILGOS scheme exposes the Group to actuarial risks such as: investment risk, interest rate risk, longevity risk and salary risk. The pension cost and funding arrangements are assessed in accordance with the advice of qualified actuaries using the projected unit credit method (an accrued benefits valuation method in which the scheme liabilities make allowances for projected earnings). The latest triennial valuation of the entire NILGOS scheme was at 31 March 2016. The market value of the assets at the date of the valuation was £5,280 million and represented 96% of benefits accruing to members after allowing for expected future increase in earnings and pensions. The employers’ contribution rate had been set at 20% following the previous valuation. The employers’ contribution rate for the years commencing 1 April 2017, 1 April 2018 and 1 April 2019 have been set at 18%, 19% and 20% respectively. In addition, deficit funding contributions amounting to £974,000 will be payable in each of these years.
The directors have obtained an update to the 31 March 2016 NILGOS valuation to 26 March 2017 using the major assumptions set out below. This update was prepared by qualified actuaries employed by Mercer Limited.
NILGOS Scheme 2017 2016
Discount rate 2.6% 3.6%
Expected return on scheme assets 2.6% 3.6%
Expected rate of salary increase 2.5% 2.3%
Future pension increases 2.2% 2.0%
Inflation (RPI) 3.2% 3.0%
Inflation (CPI) 2.2% 2.0%
Mortality assumptions: 2017 Years
2016Years
Retiring today:
Males 23.3 22.1
Females 25.9 24.7
Retiring in 20 years:
Males 25.5 24.4
Females 28.2 27.0
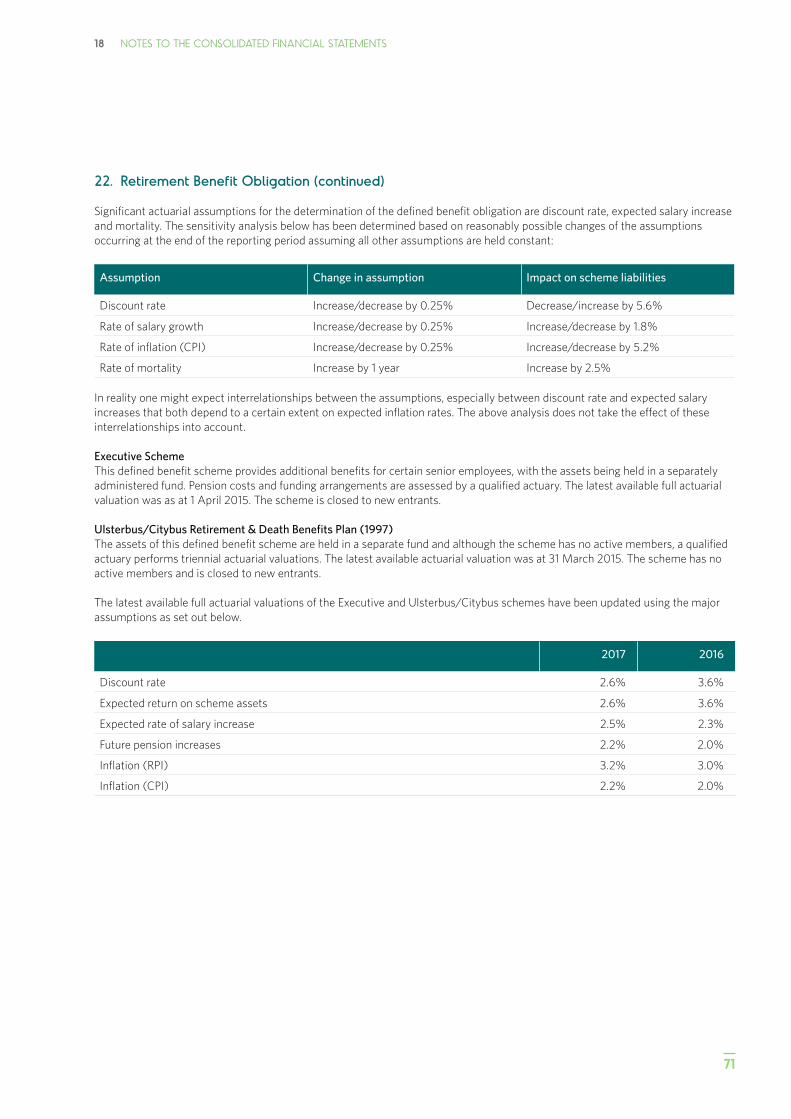
71
18 NOTES TO THE CONSOLIDATED FINANCIAL STATEMENTS
22. Retirement Benefit Obligation (continued)
Significant actuarial assumptions for the determination of the defined benefit obligation are discount rate, expected salary increase and mortality. The sensitivity analysis below has been determined based on reasonably possible changes of the assumptions occurring at the end of the reporting period assuming all other assumptions are held constant:
Assumption Change in assumption Impact on scheme liabilities
Discount rate Increase/decrease by 0.25% Decrease/increase by 5.6%
Rate of salary growth Increase/decrease by 0.25% Increase/decrease by 1.8%
Rate of inflation (CPI) Increase/decrease by 0.25% Increase/decrease by 5.2%
Rate of mortality Increase by 1 year Increase by 2.5%
In reality one might expect interrelationships between the assumptions, especially between discount rate and expected salary increases that both depend to a certain extent on expected inflation rates. The above analysis does not take the effect of these interrelationships into account.
Executive SchemeThis defined benefit scheme provides additional benefits for certain senior employees, with the assets being held in a separately administered fund. Pension costs and funding arrangements are assessed by a qualified actuary. The latest available full actuarial valuation was as at 1 April 2015. The scheme is closed to new entrants.
Ulsterbus/Citybus Retirement & Death Benefits Plan (1997)The assets of this defined benefit scheme are held in a separate fund and although the scheme has no active members, a qualified actuary performs triennial actuarial valuations. The latest available actuarial valuation was at 31 March 2015. The scheme has no active members and is closed to new entrants.
The latest available full actuarial valuations of the Executive and Ulsterbus/Citybus schemes have been updated using the major assumptions as set out below.
2017 2016
Discount rate 2.6% 3.6%
Expected return on scheme assets 2.6% 3.6%
Expected rate of salary increase 2.5% 2.3%
Future pension increases 2.2% 2.0%
Inflation (RPI) 3.2% 3.0%
Inflation (CPI) 2.2% 2.0%
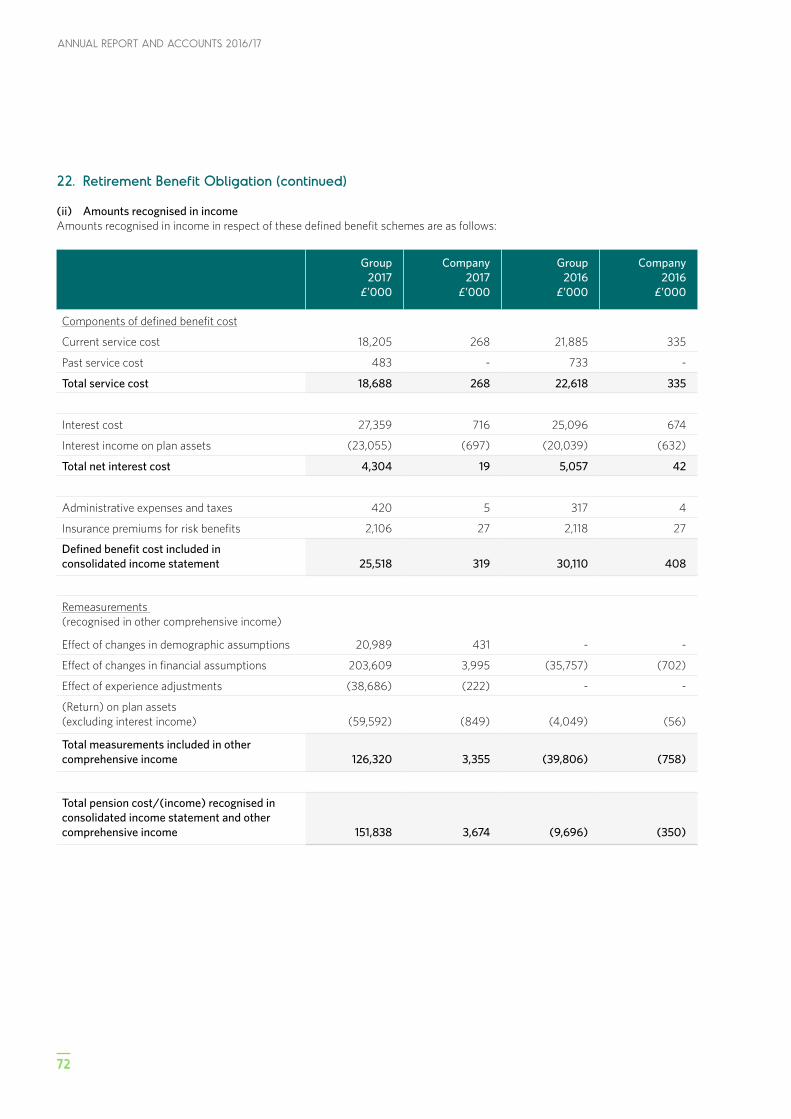
ANNUAL REPORT AND ACCOUNTS 2016/17
72
22. Retirement Benefit Obligation (continued)
(ii) Amounts recognised in incomeAmounts recognised in income in respect of these defined benefit schemes are as follows:
Group 2017
£’000
Company2017
£’000
Group2016
£’000
Company2016
£’000
Components of defined benefit cost
Current service cost 18,205 268 21,885 335
Past service cost 483 - 733 -
Total service cost 18,688 268 22,618 335
Interest cost 27,359 716 25,096 674
Interest income on plan assets (23,055) (697) (20,039) (632)
Total net interest cost 4,304 19 5,057 42
Administrative expenses and taxes 420 5 317 4
Insurance premiums for risk benefits 2,106 27 2,118 27
Defined benefit cost included in consolidated income statement
25,518
319
30,110
408
Remeasurements (recognised in other comprehensive income)
Effect of changes in demographic assumptions 20,989 431 - -
Effect of changes in financial assumptions 203,609 3,995 (35,757) (702)
Effect of experience adjustments (38,686) (222) - -
(Return) on plan assets (excluding interest income)
(59,592)
(849)
(4,049)
(56)
Total measurements included in other comprehensive income
126,320
3,355
(39,806)
(758)
Total pension cost/(income) recognised in consolidated income statement and other comprehensive income
151,838
3,674
(9,696)
(350)
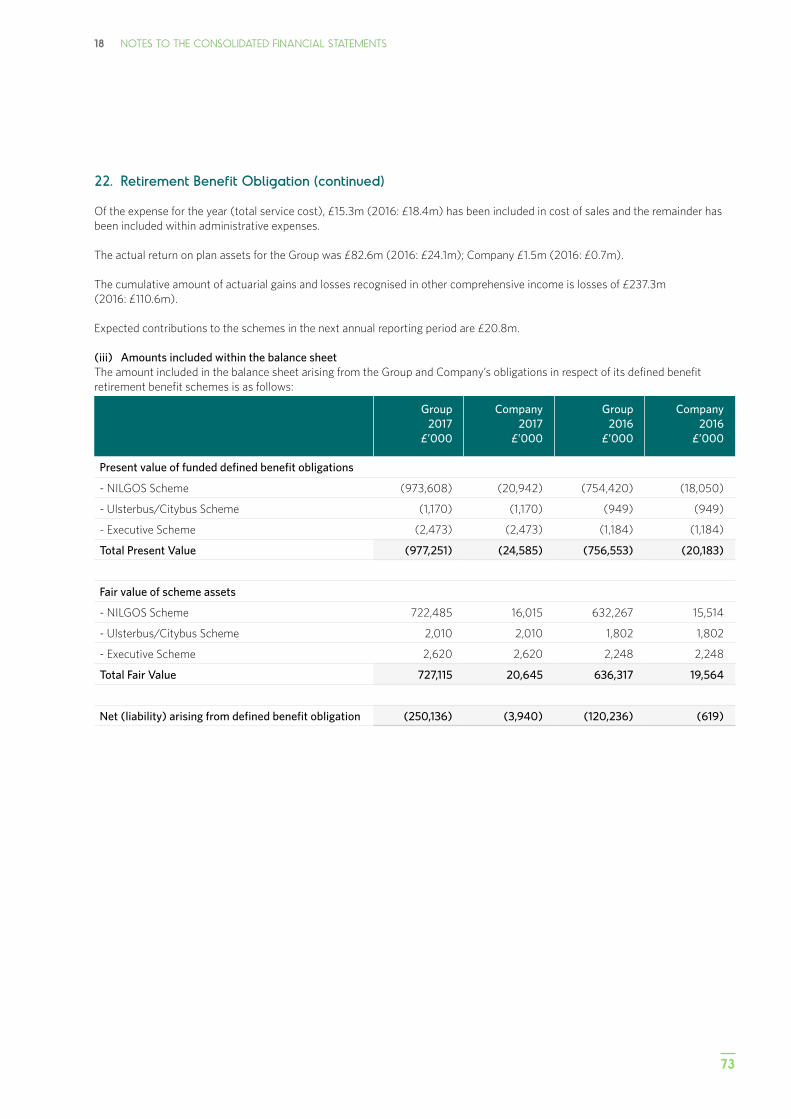
73
18 NOTES TO THE CONSOLIDATED FINANCIAL STATEMENTS
22. Retirement Benefit Obligation (continued)
Of the expense for the year (total service cost), £15.3m (2016: £18.4m) has been included in cost of sales and the remainder has been included within administrative expenses.
The actual return on plan assets for the Group was £82.6m (2016: £24.1m); Company £1.5m (2016: £0.7m).
The cumulative amount of actuarial gains and losses recognised in other comprehensive income is losses of £237.3m (2016: £110.6m).
Expected contributions to the schemes in the next annual reporting period are £20.8m.
(iii) Amounts included within the balance sheetThe amount included in the balance sheet arising from the Group and Company’s obligations in respect of its defined benefit retirement benefit schemes is as follows:
Group2017
£’000
Company2017
£’000
Group2016
£’000
Company2016
£’000
Present value of funded defined benefit obligations
- NILGOS Scheme (973,608) (20,942) (754,420) (18,050)
- Ulsterbus/Citybus Scheme (1,170) (1,170) (949) (949)
- Executive Scheme (2,473) (2,473) (1,184) (1,184)
Total Present Value (977,251) (24,585) (756,553) (20,183)
Fair value of scheme assets
- NILGOS Scheme 722,485 16,015 632,267 15,514
- Ulsterbus/Citybus Scheme 2,010 2,010 1,802 1,802
- Executive Scheme 2,620 2,620 2,248 2,248
Total Fair Value 727,115 20,645 636,317 19,564
Net (liability) arising from defined benefit obligation (250,136) (3,940) (120,236) (619)
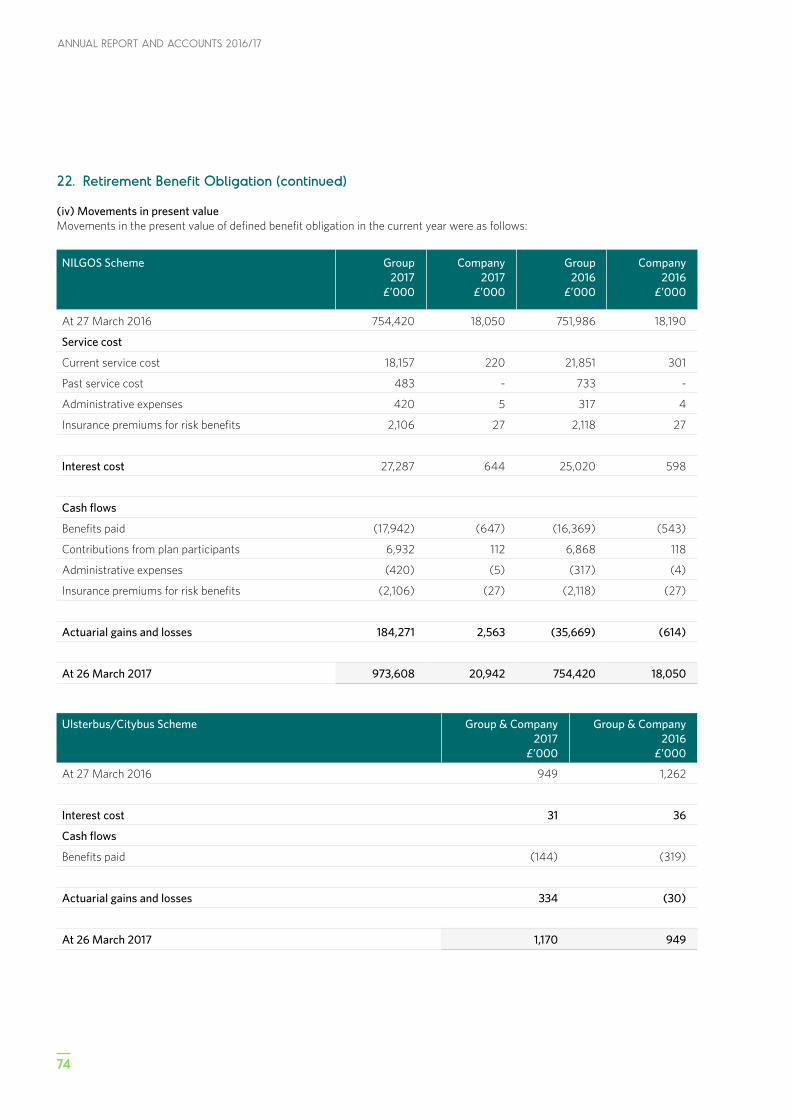
ANNUAL REPORT AND ACCOUNTS 2016/17
74
22. Retirement Benefit Obligation (continued)
(iv) Movements in present valueMovements in the present value of defined benefit obligation in the current year were as follows:
NILGOS Scheme Group2017
£’000
Company2017
£’000
Group2016
£’000
Company2016
£’000
At 27 March 2016 754,420 18,050 751,986 18,190
Service cost
Current service cost 18,157 220 21,851 301
Past service cost 483 - 733 -
Administrative expenses 420 5 317 4
Insurance premiums for risk benefits 2,106 27 2,118 27
Interest cost 27,287 644 25,020 598
Cash flows
Benefits paid (17,942) (647) (16,369) (543)
Contributions from plan participants 6,932 112 6,868 118
Administrative expenses (420) (5) (317) (4)
Insurance premiums for risk benefits (2,106) (27) (2,118) (27)
Actuarial gains and losses 184,271 2,563 (35,669) (614)
At 26 March 2017 973,608 20,942 754,420 18,050
Ulsterbus/Citybus Scheme Group & Company2017
£’000
Group & Company2016
£’000
At 27 March 2016 949 1,262
Interest cost 31 36
Cash flows
Benefits paid (144) (319)
Actuarial gains and losses 334 (30)
At 26 March 2017 1,170 949
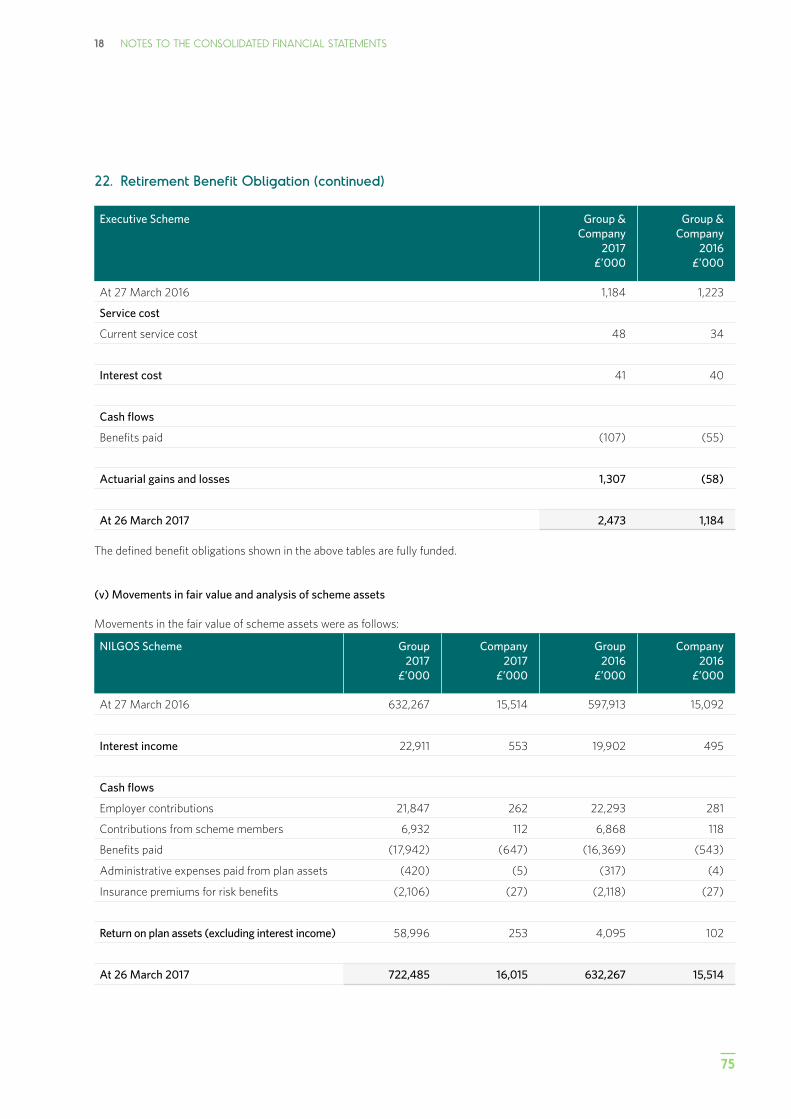
75
18 NOTES TO THE CONSOLIDATED FINANCIAL STATEMENTS
22. Retirement Benefit Obligation (continued)
Executive Scheme Group & Company
2017£’000
Group & Company
2016£’000
At 27 March 2016 1,184 1,223
Service cost
Current service cost 48 34
Interest cost 41 40
Cash flows
Benefits paid (107) (55)
Actuarial gains and losses 1,307 (58)
At 26 March 2017 2,473 1,184
The defined benefit obligations shown in the above tables are fully funded.
(v) Movements in fair value and analysis of scheme assets
Movements in the fair value of scheme assets were as follows:
NILGOS Scheme Group2017
£’000
Company2017
£’000
Group2016
£’000
Company2016
£’000
At 27 March 2016 632,267 15,514 597,913 15,092
Interest income 22,911 553 19,902 495
Cash flows
Employer contributions 21,847 262 22,293 281
Contributions from scheme members 6,932 112 6,868 118
Benefits paid (17,942) (647) (16,369) (543)
Administrative expenses paid from plan assets (420) (5) (317) (4)
Insurance premiums for risk benefits (2,106) (27) (2,118) (27)
Return on plan assets (excluding interest income) 58,996 253 4,095 102
At 26 March 2017 722,485 16,015 632,267 15,514
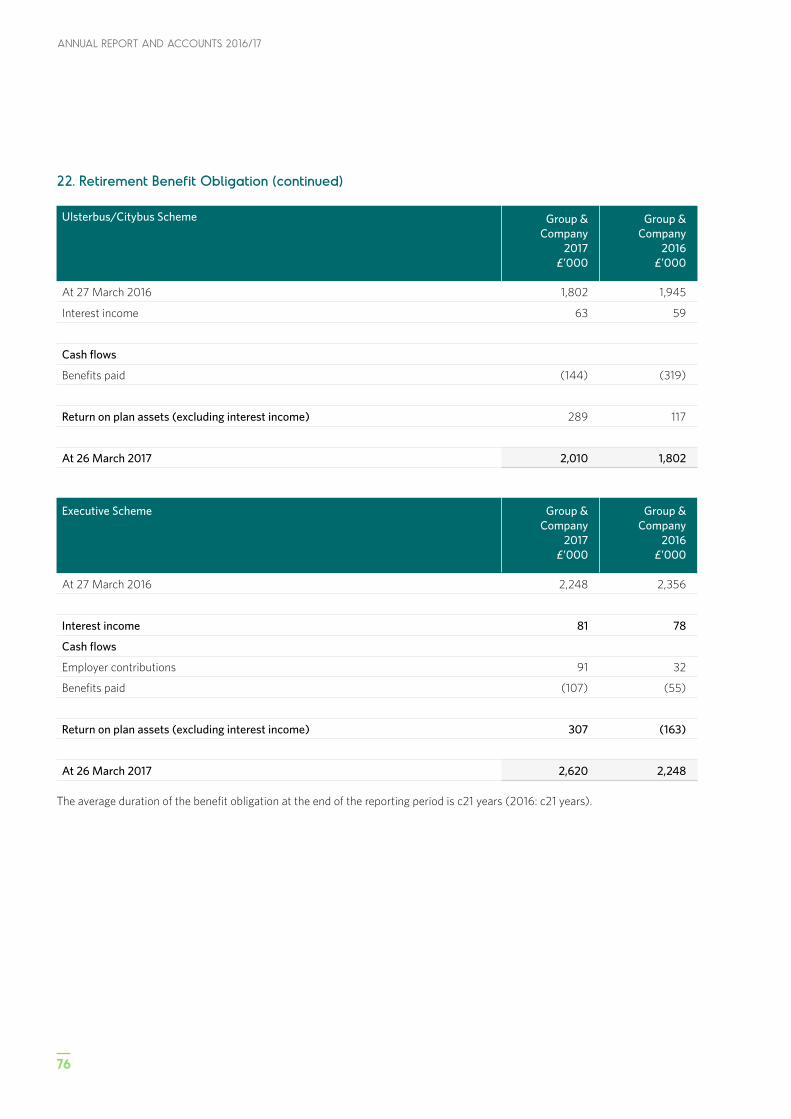
ANNUAL REPORT AND ACCOUNTS 2016/17
76
22. Retirement Benefit Obligation (continued)
Ulsterbus/Citybus Scheme Group & Company
2017£’000
Group & Company
2016£’000
At 27 March 2016 1,802 1,945
Interest income 63 59
Cash flows
Benefits paid (144) (319)
Return on plan assets (excluding interest income) 289 117
At 26 March 2017 2,010 1,802
Executive Scheme Group & Company
2017£’000
Group & Company
2016£’000
At 27 March 2016 2,248 2,356
Interest income 81 78
Cash flows
Employer contributions 91 32
Benefits paid (107) (55)
Return on plan assets (excluding interest income) 307 (163)
At 26 March 2017 2,620 2,248
The average duration of the benefit obligation at the end of the reporting period is c21 years (2016: c21 years).
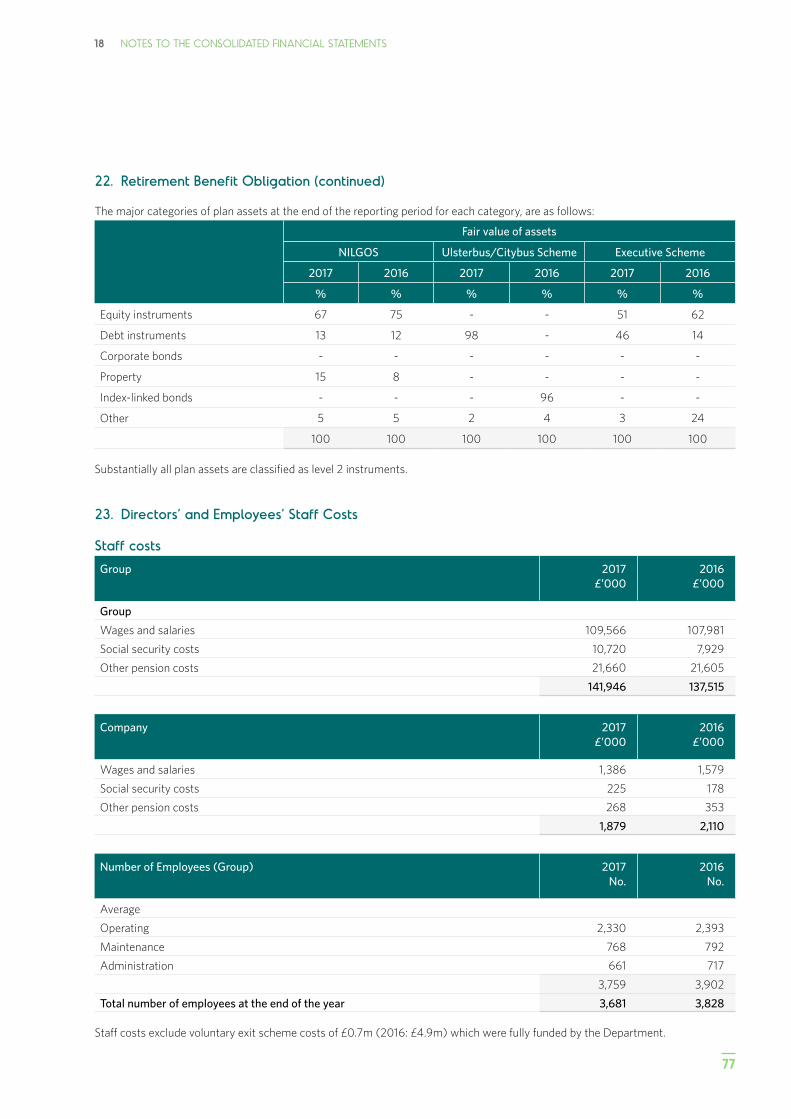
77
18 NOTES TO THE CONSOLIDATED FINANCIAL STATEMENTS
22. Retirement Benefit Obligation (continued)
The major categories of plan assets at the end of the reporting period for each category, are as follows:
Fair value of assets
NILGOS Ulsterbus/Citybus Scheme Executive Scheme
2017 2016 2017 2016 2017 2016
% % % % % %
Equity instruments 67 75 - - 51 62
Debt instruments 13 12 98 - 46 14
Corporate bonds - - - - - -
Property 15 8 - - - -
Index-linked bonds - - - 96 - -
Other 5 5 2 4 3 24
100 100 100 100 100 100
Substantially all plan assets are classified as level 2 instruments.
23. Directors’ and Employees’ Staff Costs
Staff costs
Group 2017£’000
2016£’000
Group
Wages and salaries 109,566 107,981
Social security costs 10,720 7,929
Other pension costs 21,660 21,605
141,946 137,515
Company 2017£’000
2016£’000
Wages and salaries 1,386 1,579
Social security costs 225 178
Other pension costs 268 353
1,879 2,110
Number of Employees (Group) 2017No.
2016No.
Average
Operating 2,330 2,393
Maintenance 768 792
Administration 661 717
3,759 3,902
Total number of employees at the end of the year 3,681 3,828
Staff costs exclude voluntary exit scheme costs of £0.7m (2016: £4.9m) which were fully funded by the Department.
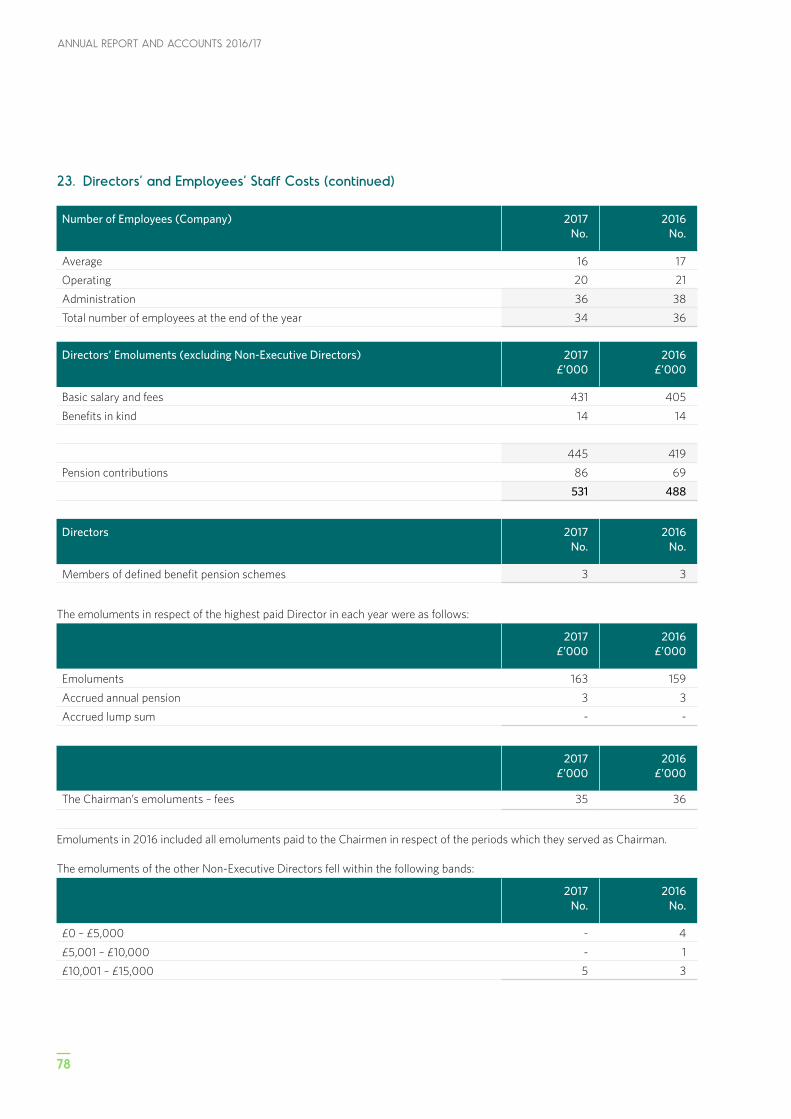
ANNUAL REPORT AND ACCOUNTS 2016/17
78
23. Directors’ and Employees’ Staff Costs (continued)
Number of Employees (Company) 2017No.
2016No.
Average 16 17
Operating 20 21
Administration 36 38
Total number of employees at the end of the year 34 36
Directors’ Emoluments (excluding Non-Executive Directors) 2017£’000
2016£’000
Basic salary and fees 431 405
Benefits in kind 14 14
445 419
Pension contributions 86 69
531 488
Directors 2017No.
2016No.
Members of defined benefit pension schemes 3 3
The emoluments in respect of the highest paid Director in each year were as follows:
2017£’000
2016£’000
Emoluments 163 159
Accrued annual pension 3 3
Accrued lump sum - -
2017£’000
2016£’000
The Chairman’s emoluments – fees 35 36
Emoluments in 2016 included all emoluments paid to the Chairmen in respect of the periods which they served as Chairman.
The emoluments of the other Non-Executive Directors fell within the following bands:
2017No.
2016No.
£0 – £5,000 - 4
£5,001 – £10,000 - 1
£10,001 – £15,000 5 3
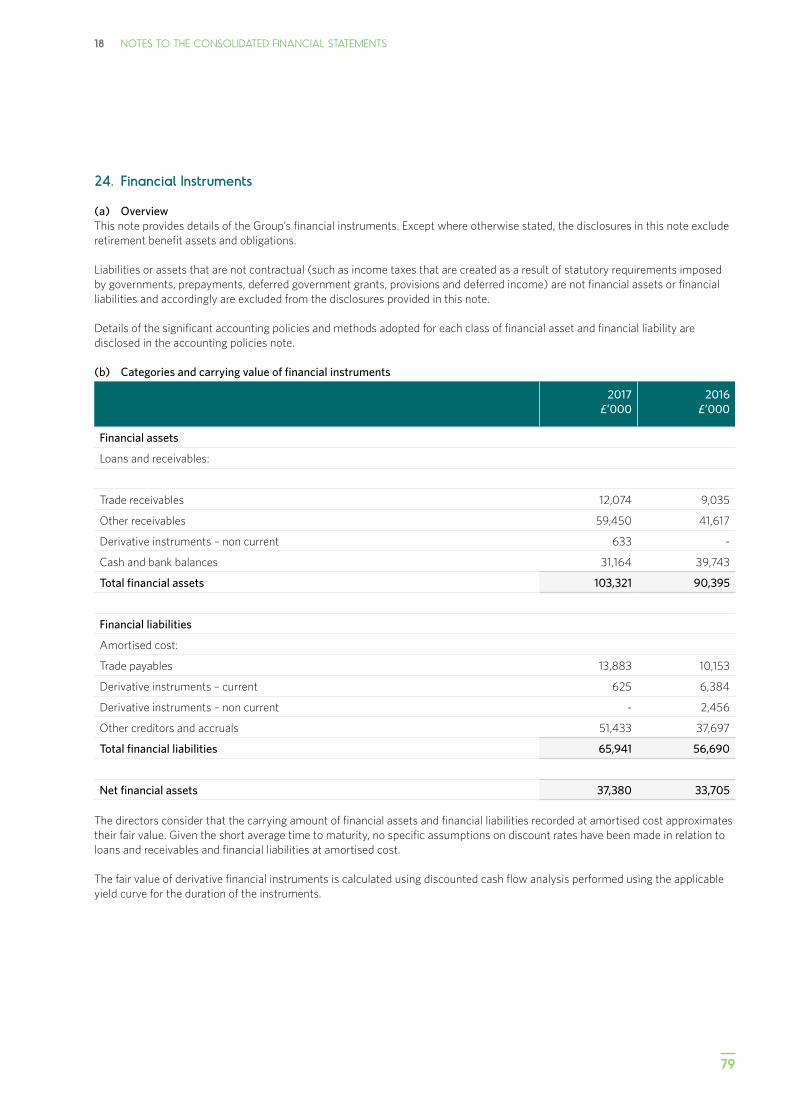
79
18 NOTES TO THE CONSOLIDATED FINANCIAL STATEMENTS
24. Financial Instruments
(a) OverviewThis note provides details of the Group’s financial instruments. Except where otherwise stated, the disclosures in this note exclude retirement benefit assets and obligations.
Liabilities or assets that are not contractual (such as income taxes that are created as a result of statutory requirements imposed by governments, prepayments, deferred government grants, provisions and deferred income) are not financial assets or financial liabilities and accordingly are excluded from the disclosures provided in this note.
Details of the significant accounting policies and methods adopted for each class of financial asset and financial liability are disclosed in the accounting policies note.
(b) Categories and carrying value of financial instruments
2017£’000
2016£’000
Financial assets
Loans and receivables:
Trade receivables 12,074 9,035
Other receivables 59,450 41,617
Derivative instruments – non current 633 -
Cash and bank balances 31,164 39,743
Total financial assets 103,321 90,395
Financial liabilities
Amortised cost:
Trade payables 13,883 10,153
Derivative instruments – current 625 6,384
Derivative instruments – non current - 2,456
Other creditors and accruals 51,433 37,697
Total financial liabilities 65,941 56,690
Net financial assets 37,380 33,705
The directors consider that the carrying amount of financial assets and financial liabilities recorded at amortised cost approximates their fair value. Given the short average time to maturity, no specific assumptions on discount rates have been made in relation to loans and receivables and financial liabilities at amortised cost.
The fair value of derivative financial instruments is calculated using discounted cash flow analysis performed using the applicable yield curve for the duration of the instruments.
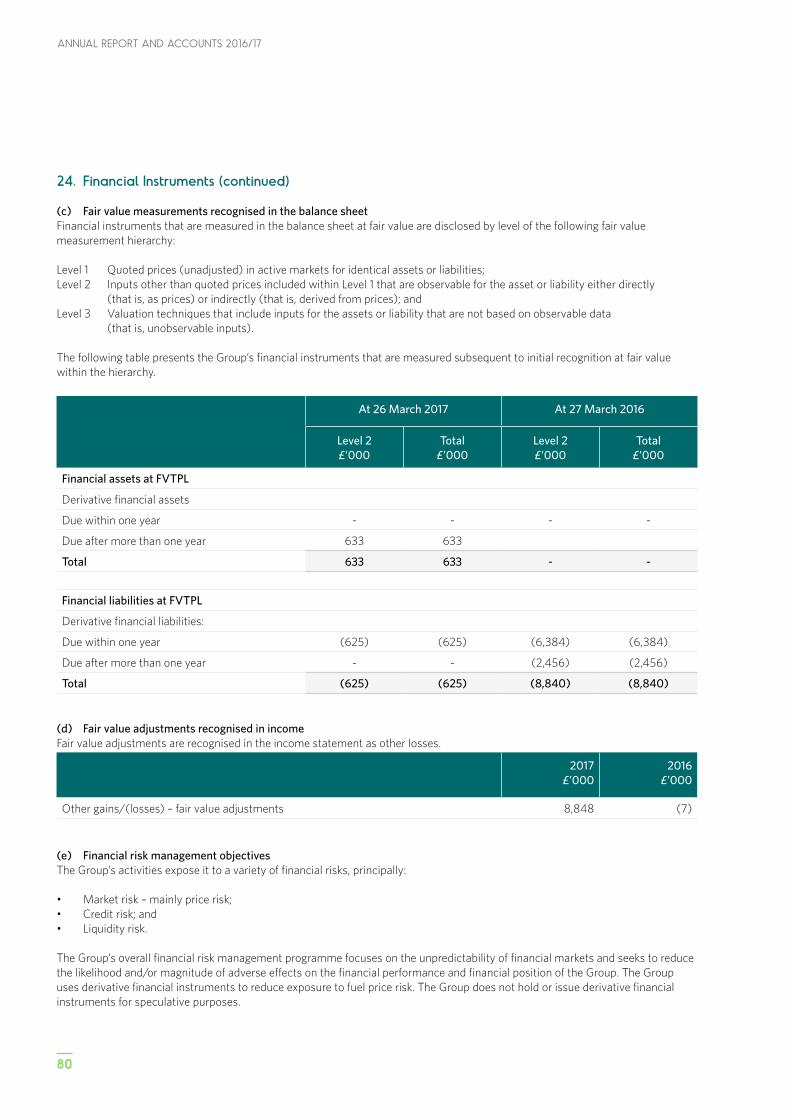
ANNUAL REPORT AND ACCOUNTS 2016/17
80
24. Financial Instruments (continued)
(c) Fair value measurements recognised in the balance sheetFinancial instruments that are measured in the balance sheet at fair value are disclosed by level of the following fair value measurement hierarchy:
Level 1 Quoted prices (unadjusted) in active markets for identical assets or liabilities;Level 2 Inputs other than quoted prices included within Level 1 that are observable for the asset or liability either directly (that is, as prices) or indirectly (that is, derived from prices); andLevel 3 Valuation techniques that include inputs for the assets or liability that are not based on observable data (that is, unobservable inputs).
The following table presents the Group’s financial instruments that are measured subsequent to initial recognition at fair value within the hierarchy.
At 26 March 2017 At 27 March 2016
Level 2£’000
Total£’000
Level 2£’000
Total£’000
Financial assets at FVTPL
Derivative financial assets
Due within one year - - - -
Due after more than one year 633 633
Total 633 633 - -
Financial liabilities at FVTPL
Derivative financial liabilities:
Due within one year (625) (625) (6,384) (6,384)
Due after more than one year - - (2,456) (2,456)
Total (625) (625) (8,840) (8,840)
(d) Fair value adjustments recognised in incomeFair value adjustments are recognised in the income statement as other losses.
2017 £’000
2016 £’000
Other gains/(losses) – fair value adjustments 8,848 (7)
(e) Financial risk management objectivesThe Group’s activities expose it to a variety of financial risks, principally:
• Market risk – mainly price risk;• Credit risk; and • Liquidity risk.
The Group’s overall financial risk management programme focuses on the unpredictability of financial markets and seeks to reduce the likelihood and/or magnitude of adverse effects on the financial performance and financial position of the Group. The Group uses derivative financial instruments to reduce exposure to fuel price risk. The Group does not hold or issue derivative financial instruments for speculative purposes.
81
18 NOTES TO THE CONSOLIDATED FINANCIAL STATEMENTS
24. Financial Instruments (continued)
This note presents qualitative information about the Group’s exposure to each of the above risks, including the Group’s objectives, policies and processes for measuring and managing risk. There have been no significant changes to these matters during the year ended 26 March 2017. This note also provides summary quantitative data about the Group’s exposure to each risk.
The Board has approved policies on fuel hedging, energy procurement and treasury management which guide management in managing risk in these areas. Group finance is responsible for ensuring these policies are implemented. Certain financial risk management activities (for example, the management of credit risk arising from trade and other receivables) are devolved to the management of individual business units.
(i) Market RiskMarket risk is the risk that changes in market prices, such as commodity prices, interest rates and exchange rates will affect the Group’s financial performance and/or financial position. The objective of the Group’s management of market risk is to manage and control market risk exposures within acceptable parameters. The Group does not consider currency risk or interest rate risk to be material due to low levels of foreign currency transactions and its borrowings being limited to its overdraft.
The Group enters into derivative financial instruments in the ordinary course of business in order to manage market risk, in the form of fuel price risk. All such transactions are carried out within the guidelines set by the Board. Market risk exposures are measured using sensitivity analysis.
There has been no change to the Group’s exposure to market risks or the manner in which these risks are managed and measured.
Foreign currency translation risk Foreign currency translation risk is the risk that the fair value or future cash flows of a financial instrument will fluctuate because of changes in foreign exchange rates. This risk for the Group is not considered to be material.
Interest rate riskInterest rate risk is the risk that the fair value or future cash flows of a financial instrument will fluctuate because of changes in market interest rates. It is considered that the Group has no exposure in this area.
Fuel price riskThe Group is exposed to fuel price risk. The Group’s operations as at 26 March 2017 consume approximately 36 million litres of diesel fuel per annum. As a result, the Group is exposed to movements in the underlying price of fuel.
The Group’s objective in managing fuel price risk is to reduce the risk that movements in fuel prices result in adverse movements in its profit and cash flow. The Group has a policy of managing the volatility in its fuel costs by maintaining an ongoing fuel hedging programme whereby derivative financial instruments are used to fix or cap the variable unit cost of a percentage of anticipated fuel consumption. The fuel derivatives hedge the underlying fuel price. The Group’s residual exposure to fuel price risk is measured by quantifying the element of projected future fuel costs, after taking account of derivative financial instruments in place, which varies due to movements in fuel prices. Group Finance is responsible for the processes for measuring and managing fuel price risk.
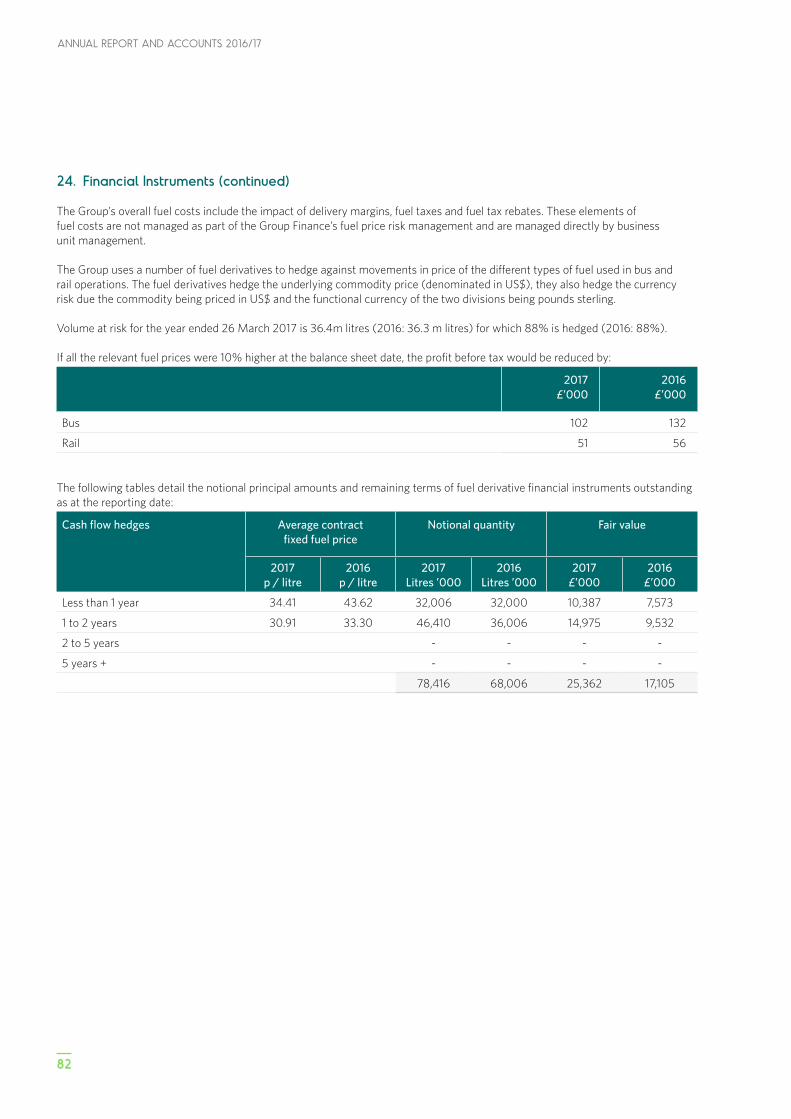
ANNUAL REPORT AND ACCOUNTS 2016/17
82
24. Financial Instruments (continued)
The Group’s overall fuel costs include the impact of delivery margins, fuel taxes and fuel tax rebates. These elements of fuel costs are not managed as part of the Group Finance’s fuel price risk management and are managed directly by business unit management.
The Group uses a number of fuel derivatives to hedge against movements in price of the different types of fuel used in bus and rail operations. The fuel derivatives hedge the underlying commodity price (denominated in US$), they also hedge the currency risk due the commodity being priced in US$ and the functional currency of the two divisions being pounds sterling.
Volume at risk for the year ended 26 March 2017 is 36.4m litres (2016: 36.3 m litres) for which 88% is hedged (2016: 88%).
If all the relevant fuel prices were 10% higher at the balance sheet date, the profit before tax would be reduced by:
2017£’000
2016£’000
Bus 102 132
Rail 51 56
The following tables detail the notional principal amounts and remaining terms of fuel derivative financial instruments outstanding as at the reporting date:
Cash flow hedges Average contract fixed fuel price
Notional quantity Fair value
2017p / litre
2016p / litre
2017Litres ’000
2016Litres ’000
2017£’000
2016£’000
Less than 1 year 34.41 43.62 32,006 32,000 10,387 7,573
1 to 2 years 30.91 33.30 46,410 36,006 14,975 9,532
2 to 5 years - - - -
5 years + - - - -
78,416 68,006 25,362 17,105
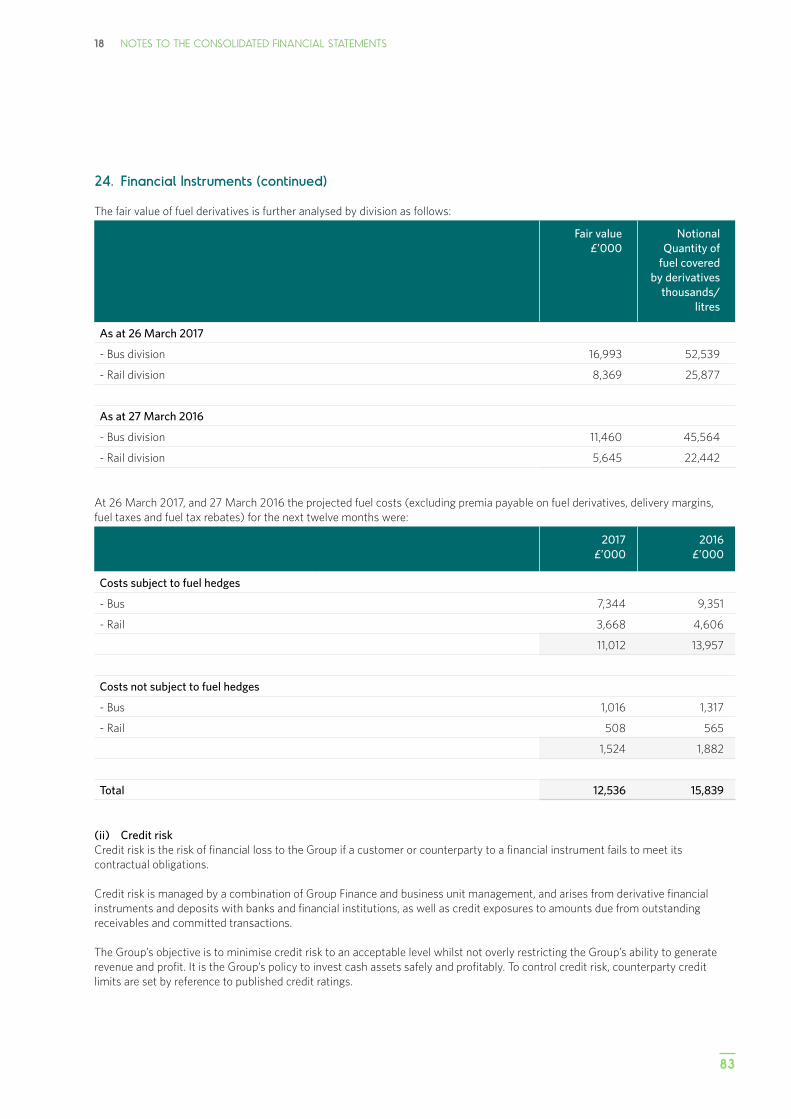
83
18 NOTES TO THE CONSOLIDATED FINANCIAL STATEMENTS
24. Financial Instruments (continued)
The fair value of fuel derivatives is further analysed by division as follows:
Fair value£’000
Notional Quantity of
fuel covered by derivatives
thousands/litres
As at 26 March 2017
- Bus division 16,993 52,539
- Rail division 8,369 25,877
As at 27 March 2016
- Bus division 11,460 45,564
- Rail division 5,645 22,442
At 26 March 2017, and 27 March 2016 the projected fuel costs (excluding premia payable on fuel derivatives, delivery margins, fuel taxes and fuel tax rebates) for the next twelve months were:
2017£’000
2016£’000
Costs subject to fuel hedges
- Bus 7,344 9,351
- Rail 3,668 4,606
11,012 13,957
Costs not subject to fuel hedges
- Bus 1,016 1,317
- Rail 508 565
1,524 1,882
Total 12,536 15,839
(ii) Credit riskCredit risk is the risk of financial loss to the Group if a customer or counterparty to a financial instrument fails to meet its contractual obligations.
Credit risk is managed by a combination of Group Finance and business unit management, and arises from derivative financial instruments and deposits with banks and financial institutions, as well as credit exposures to amounts due from outstanding receivables and committed transactions.
The Group’s objective is to minimise credit risk to an acceptable level whilst not overly restricting the Group’s ability to generate revenue and profit. It is the Group’s policy to invest cash assets safely and profitably. To control credit risk, counterparty credit limits are set by reference to published credit ratings.
ANNUAL REPORT AND ACCOUNTS 2016/17
84
24. Financial Instruments (continued)
Trade receivables consist largely of government grants and receivables, for which credit risk is considered limited. The Group’s largest credit exposures are to the Education Authority, the Department of Education and the Department for Infrastructure, all of which the Group considers unlikely to default on their respective liabilities to the Group.
The credit risk on liquid funds and derivative financial instruments is limited because the counterparties are banks with high credit ratings assigned by international credit rating agencies.
In determining whether a financial asset is impaired, the Group takes account of:• The fair value of the asset at the balance sheet date and where applicable, the historic fair value of the asset.• In the case of receivables, the counterparty’s typical payment patterns.• In the case of receivables, the latest information on the counterparty’s creditworthiness such as available financial statements and credit ratings.
The carrying amount of financial assets recorded in the financial statements, which is net of impairment losses, represents the Group’s maximum exposure to credit risk as no collateral or other credit enhancements are held.
(iii) Liquidity riskLiquidity risk is the risk that the Group will encounter difficulty in meeting its financial obligations as they fall due. The Group’s objective in managing liquidity is to ensure, as far as possible, that it will always have sufficient liquidity to meet its liabilities when due, under both normal and stressed conditions, without incurring unacceptable losses or risking damage to the Group’s reputation.
The funding policy is to finance the Group through a mixture of cash generated by the business and funding provided by its sponsor the Department for Infrastructure.
As at 26 March 2017, the Group’s credit facilities were £4,250,000 (2016: £4,250,000) including utilisation for the issuance of bank guarantees, bonds etc. This facility is guaranteed by the Department for Infrastructure until further notice.
Although there is an element of seasonality in the Group’s bus and rail operations, the overall impact of seasonality on working capital and liquidity is not considered significant. The Board expects the Group to be able to meet current and future funding requirements through free cash flow and continued funding from its sponsor Department.
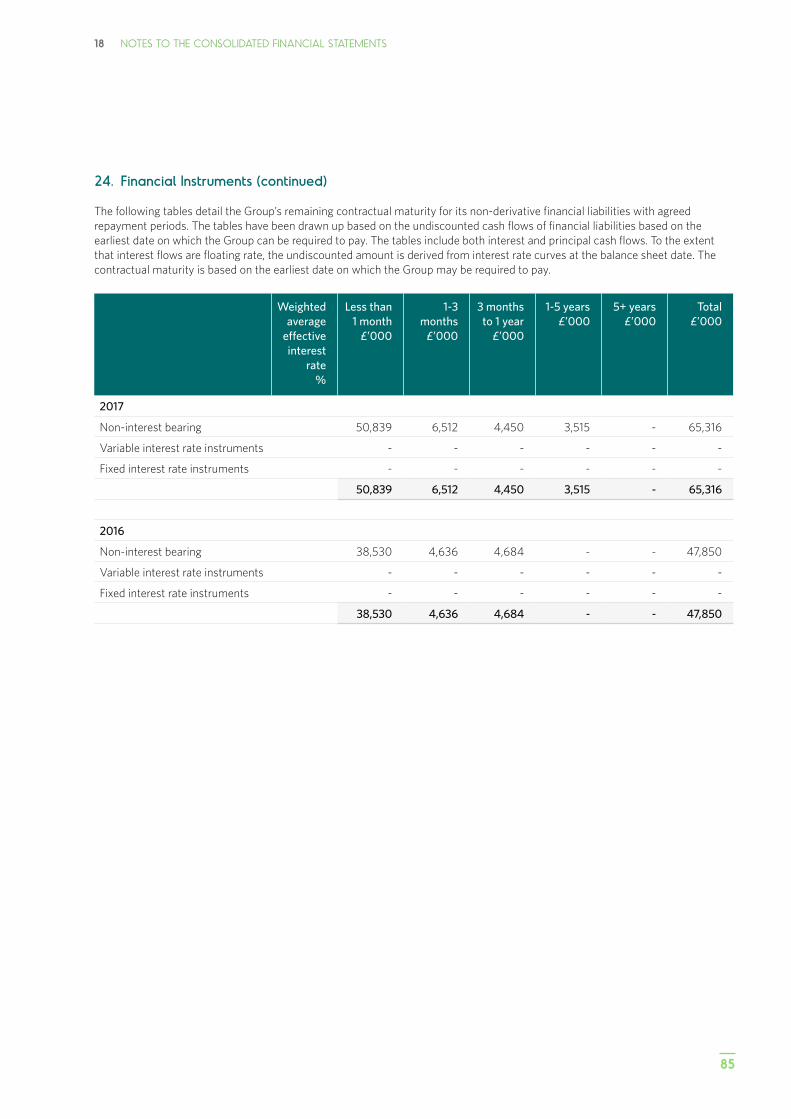
85
18 NOTES TO THE CONSOLIDATED FINANCIAL STATEMENTS
24. Financial Instruments (continued)
The following tables detail the Group’s remaining contractual maturity for its non-derivative financial liabilities with agreed repayment periods. The tables have been drawn up based on the undiscounted cash flows of financial liabilities based on the earliest date on which the Group can be required to pay. The tables include both interest and principal cash flows. To the extent that interest flows are floating rate, the undiscounted amount is derived from interest rate curves at the balance sheet date. The contractual maturity is based on the earliest date on which the Group may be required to pay.
Weighted average
effective interest
rate %
Less than 1 month
£’000
1-3 months
£’000
3 months to 1 year
£’000
1-5 years £’000
5+ years £’000
Total £’000
2017
Non-interest bearing 50,839 6,512 4,450 3,515 - 65,316
Variable interest rate instruments - - - - - -
Fixed interest rate instruments - - - - - -
50,839 6,512 4,450 3,515 - 65,316
2016
Non-interest bearing 38,530 4,636 4,684 - - 47,850
Variable interest rate instruments - - - - - -
Fixed interest rate instruments - - - - - -
38,530 4,636 4,684 - - 47,850
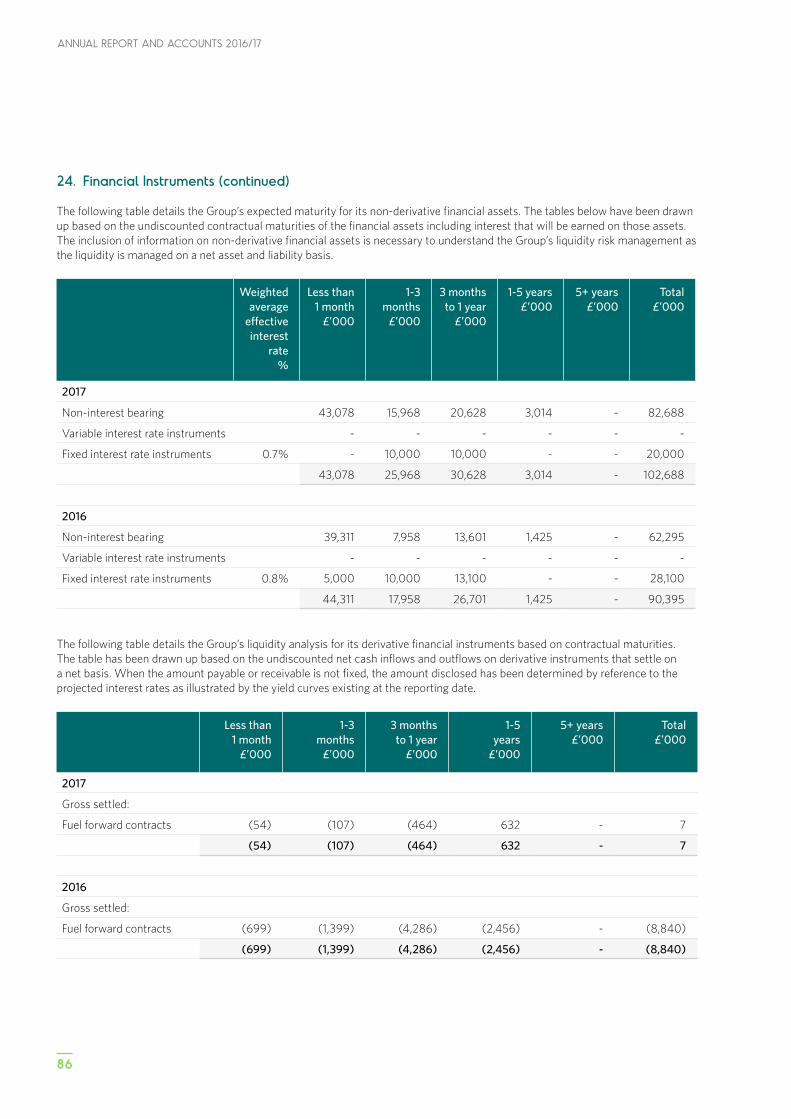
ANNUAL REPORT AND ACCOUNTS 2016/17
86
24. Financial Instruments (continued)
The following table details the Group’s expected maturity for its non-derivative financial assets. The tables below have been drawn up based on the undiscounted contractual maturities of the financial assets including interest that will be earned on those assets. The inclusion of information on non-derivative financial assets is necessary to understand the Group’s liquidity risk management as the liquidity is managed on a net asset and liability basis.
Weighted average
effective interest
rate %
Less than 1 month
£’000
1-3 months
£’000
3 months to 1 year
£’000
1-5 years £’000
5+ years £’000
Total £’000
2017
Non-interest bearing 43,078 15,968 20,628 3,014 - 82,688
Variable interest rate instruments - - - - - -
Fixed interest rate instruments 0.7% - 10,000 10,000 - - 20,000
43,078 25,968 30,628 3,014 - 102,688
2016
Non-interest bearing 39,311 7,958 13,601 1,425 - 62,295
Variable interest rate instruments - - - - - -
Fixed interest rate instruments 0.8% 5,000 10,000 13,100 - - 28,100
44,311 17,958 26,701 1,425 - 90,395
The following table details the Group’s liquidity analysis for its derivative financial instruments based on contractual maturities. The table has been drawn up based on the undiscounted net cash inflows and outflows on derivative instruments that settle on a net basis. When the amount payable or receivable is not fixed, the amount disclosed has been determined by reference to the projected interest rates as illustrated by the yield curves existing at the reporting date.
Less than 1 month
£’000
1-3 months
£’000
3 months to 1 year
£’000
1-5 years
£’000
5+ years £’000
Total £’000
2017
Gross settled:
Fuel forward contracts (54) (107) (464) 632 - 7
(54) (107) (464) 632 - 7
2016
Gross settled:
Fuel forward contracts (699) (1,399) (4,286) (2,456) - (8,840)
(699) (1,399) (4,286) (2,456) - (8,840)
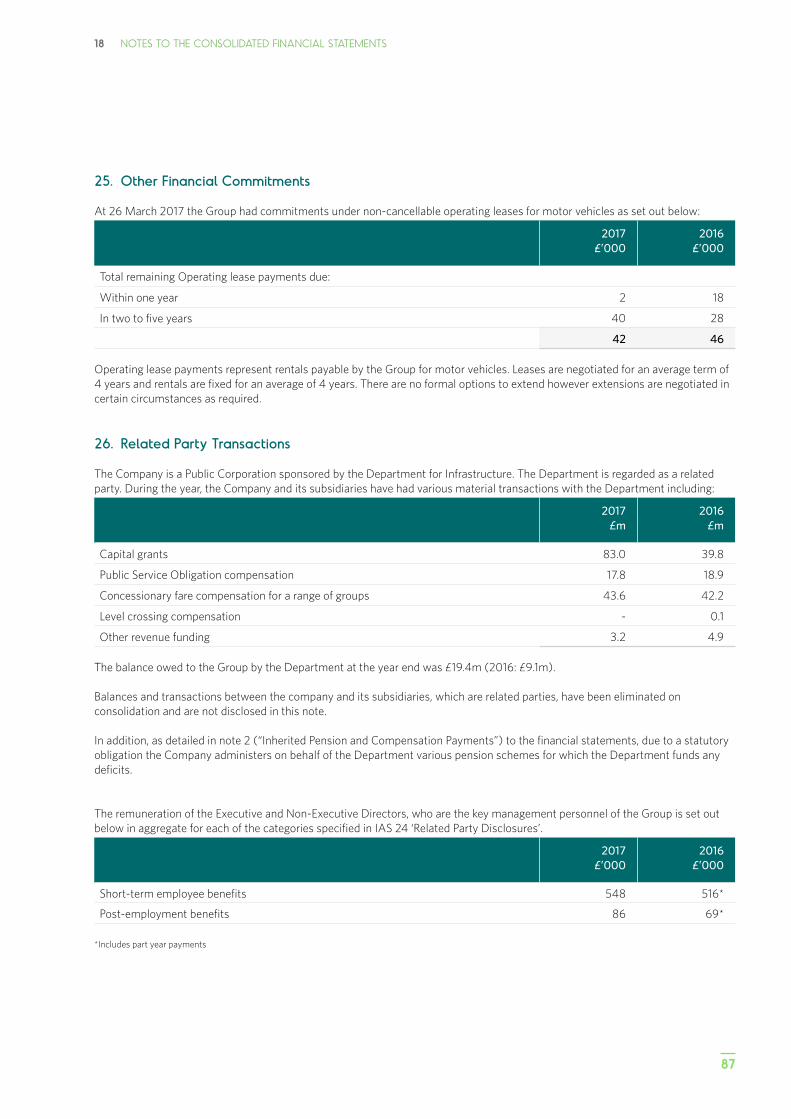
87
18 NOTES TO THE CONSOLIDATED FINANCIAL STATEMENTS
25. Other Financial Commitments
At 26 March 2017 the Group had commitments under non-cancellable operating leases for motor vehicles as set out below:
2017£’000
2016£’000
Total remaining Operating lease payments due:
Within one year 2 18
In two to five years 40 28
42 46
Operating lease payments represent rentals payable by the Group for motor vehicles. Leases are negotiated for an average term of 4 years and rentals are fixed for an average of 4 years. There are no formal options to extend however extensions are negotiated in certain circumstances as required.
26. Related Party Transactions
The Company is a Public Corporation sponsored by the Department for Infrastructure. The Department is regarded as a related party. During the year, the Company and its subsidiaries have had various material transactions with the Department including:
2017£m
2016£m
Capital grants 83.0 39.8
Public Service Obligation compensation 17.8 18.9
Concessionary fare compensation for a range of groups 43.6 42.2
Level crossing compensation - 0.1
Other revenue funding 3.2 4.9
The balance owed to the Group by the Department at the year end was £19.4m (2016: £9.1m).
Balances and transactions between the company and its subsidiaries, which are related parties, have been eliminated on consolidation and are not disclosed in this note.
In addition, as detailed in note 2 (“Inherited Pension and Compensation Payments”) to the financial statements, due to a statutory obligation the Company administers on behalf of the Department various pension schemes for which the Department funds any deficits.
The remuneration of the Executive and Non-Executive Directors, who are the key management personnel of the Group is set out below in aggregate for each of the categories specified in IAS 24 ‘Related Party Disclosures’.
2017£’000
2016£’000
Short-term employee benefits 548 516*
Post-employment benefits 86 69*
*Includes part year payments

88
NOTES

89

ANNUAL REPORT AND ACCOUNTS 2016/17
90
NOTES

18 NOTES TO THE CONSOLIDATED FINANCIAL STATEMENTS
91
ANNUAL REPORT AND ACCOUNTS 2016/17
92
This publication is available in a range of alternative formats, for example large print, braille or audio tape. Please call Translink Contact Centre 028 9066 6630.
Special thanks to all our customers and staff who kindly allowed us to use their photos in this publication.
DESIGN BY WHITENOISESTUDIOS.COM