transition to flexible plant operations u.s.a. update · sherry bernhoft epri program manager ....
TRANSCRIPT

Sherry Bernhoft EPRI Program Manager
IAEA EDF Technical Meeting on NPP Flexible Operations Paris, France
September 2013
Transition to Flexible Plant Operations U.S.A. Update

2 © 2013 Electric Power Research Institute, Inc. All rights reserved.
EPRI Our History…
• Founded in 1972
• Independent, nonprofit center for public interest energy and environmental research
• Collaborative resource for the electricity sector
• Major offices in Palo Alto, CA; Charlotte, NC; Knoxville, TN – Laboratories in Knoxville,
Charlotte and Lenox, MA Chauncey Starr EPRI Founder

3 © 2013 Electric Power Research Institute, Inc. All rights reserved.
Collaboration
U.S. Nuclear Power Plants
Source: NEI Website, 2009
U.S. Participants Non-U.S. Participants Global
Breadth and Depth
• All U.S. nuclear owners/operators
• 102 reactors
• 20 countries, >220 reactors
• >75% of the world’s commercial nuclear units
Participants Encompass Most Nuclear Reactor Designs

4 © 2013 Electric Power Research Institute, Inc. All rights reserved.
Presentation Agenda
• Nuclear Power Plants in the U.S. • Challenges
• Growth of Renewals
• Transition Plan for NPP Flexible
Operations
5 © 2013 Electric Power Research Institute, Inc. All rights reserved.
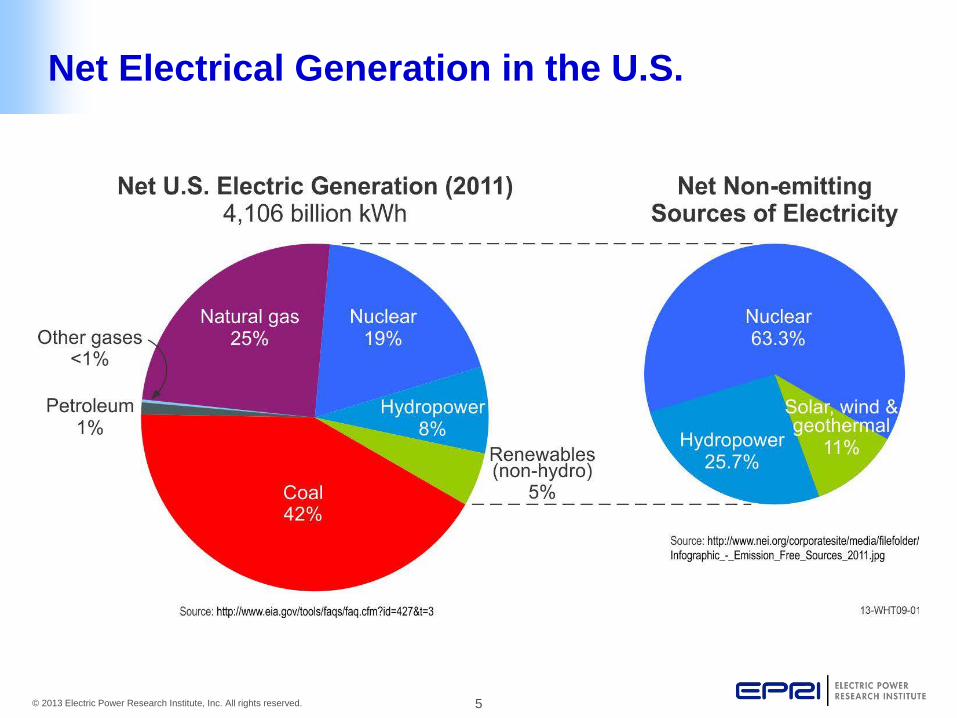
Net Electrical Generation in the U.S.

6 © 2013 Electric Power Research Institute, Inc. All rights reserved.
Operating Licenses and License Renewal

7 © 2013 Electric Power Research Institute, Inc. All rights reserved.
Challenges Facing U.S. Nuclear Power Plants
• Public Acceptance Post-Fukushima
• Economics
• Extending the Plant Operating Licenses – Beyond 60 years
• Large Scale Integration of Renewables

8 © 2013 Electric Power Research Institute, Inc. All rights reserved.
Renewables – Today and Tomorrow
• Today ~ 4% of generation from Solar and Wind Power • Expected growth of > 60 GWs by 2022

9 © 2013 Electric Power Research Institute, Inc. All rights reserved.
Regional Projection Model for the U.S.
Total Energy
for Load
Imports Solar Geothermal Biomass
Wind Hydro+ Nuclear (New) Nuclear (Existing)
Gas New Coal Environmental Retrofit Existing Coal
0
400
800
1200
1600
2010 2015 2020 2025 2030 2035
TWh
0
400
800
1200
1600
2010 2015 2020 2025 2030 2035
TWh
0
400
800
1200
1600
2010 2015 2020 2025 2030 2035
TWh
0
400
800
1200
1600
2010 2015 2020 2025 2030 2035TW
h
MIDWEST WEST
EAST
SOUTH
Source: PRISM 2.0: The Value of Innovation In Environmental Controls (1026743)

10 © 2013 Electric Power Research Institute, Inc. All rights reserved.

11 © 2013 Electric Power Research Institute, Inc. All rights reserved.
Example - Growth of Solar in California
2012 Preliminary Actual 19% of total bundled retail sales
2020 Projected 33% of total bundled retail sales
2002 Actual 11% of total bundled retail sales
Total RPS-Eligible Procurement
~14,000 GWh
Projected RPS-Eligible Procurement
~26,000 GWh
Total RPS-Eligible Procurement
7,504 GWh

12 © 2013 Electric Power Research Institute, Inc. All rights reserved.
Projected Impact on Net Generation Lo
ad &
Net
Loa
d (M
W)
0
1,000
2,000
3,000
4,000
5,000
6,000
7,000
8,000
9,000
10,000
20,000
22,000
24,000
26,000
28,000
30,000
32,000
34,000
36,000
38,000
40,000
42,000
44,000
46,000
0:00 1:30 3:00 4:30 6:00 7:30 9:00 10:30 12:00 13:30 15:00 16:30 18:00 19:30 21:00 22:30 0:00
Load Net Load Wind Solar
Load, Wind & Solar Profiles – High Load CaseJanuary 2020
Win
d &
Sol
ar (M
W)
8,000 MW in 2 hours
6,300 MW in 2 hours
13,500 MW in 2 hours
8,000 MW in 2 hours
6,300 MW in 2 hours
13,500 MW in 2 hours
Illustrative Load, Wind, & Solar Profiles
Net Load = Total Customer Load – (Wind + Solar Generation) Source:

13 © 2013 Electric Power Research Institute, Inc. All rights reserved.
Net Load Pattern Changes 2012-2020
Source: CAISO
14 © 2013 Electric Power Research Institute, Inc. All rights reserved.
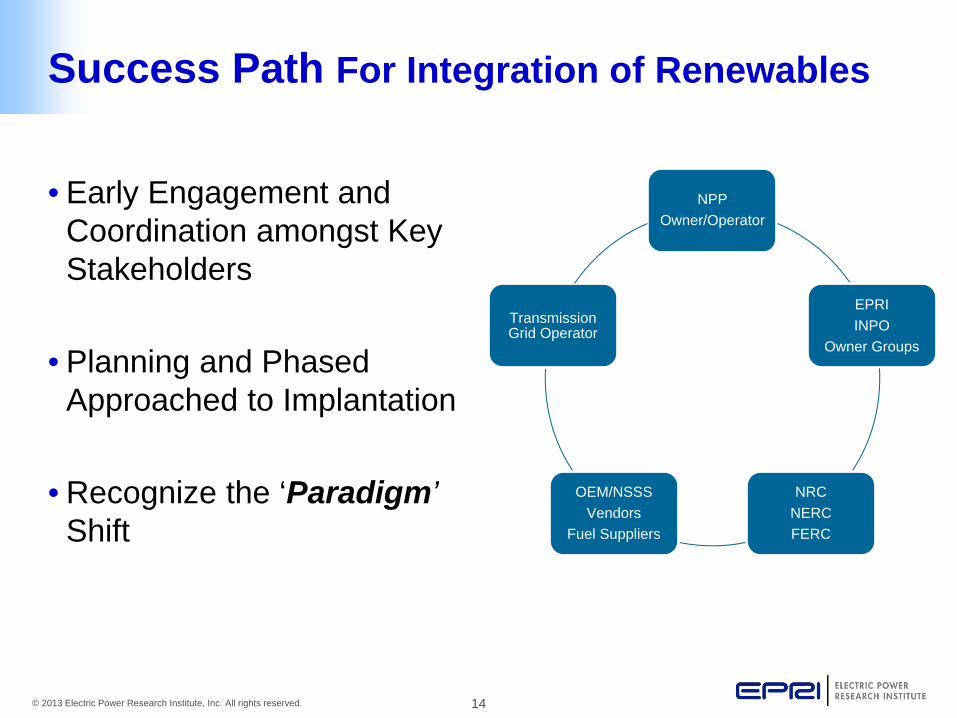
Success Path For Integration of Renewables
• Early Engagement and Coordination amongst Key Stakeholders
• Planning and Phased Approached to Implantation
• Recognize the ‘Paradigm’ Shift
NPP Owner/Operator
EPRI INPO
Owner Groups
NRC NERC FERC
OEM/NSSS Vendors
Fuel Suppliers
Transmission Grid Operator

15 © 2013 Electric Power Research Institute, Inc. All rights reserved.
Transition – Phased Approach
• Phase 1 – Identification of the Concerns
• Phase 2– What is possible based on current plant design?
• Phase 3 –Steps to Increase Flexible Operations
• Phase 4 – R&D to Support Long-Term Asset Management • Phase 5 – Understand the Economics and Plant Enhancements

16 © 2013 Electric Power Research Institute, Inc. All rights reserved.
Phase 1- Gap Matrix • Core/Fuel Performance:
– Power density – Fuel performance – Fuel cycle
• Safety Analysis: – Starting point for accidents?
• Low-cycle and High-cycle Fatigue: – Life limiting effects?
• Chemistry/ Source Term Effects • Effluent Management • Equipment ‘Wear and Tear’
– Reduced reliability? • Human Performance Challenges • Cost/Benefit

17 © 2013 Electric Power Research Institute, Inc. All rights reserved.
Phase 2 – What is Possible Today
• Define existing operating envelope: – Acceptable ramp rates – Analytical limitations – System/Equipment limitations – Instrumentation/Monitoring
Limitations • Protocol with Independent System
Operator (ISO): – How Frequent – How Fast – How Long – How Deep
• Training for Plant Staff

18 © 2013 Electric Power Research Institute, Inc. All rights reserved.
Phase 3 – Increased Maneuverability Needed? • Determine future maneuverability needs • Pinch-point analysis of plant limitations:
– Instrumentation, Monitoring and Controls Systems – Safety Analyses – Operating Practices – Plant modifications
• Cost-benefit analysis
Potential Plant Modifications:
Gray Control Rods
Boron Acid Recycle System
Additional Waste HUTs
Variable Drive Pump Controls
Core Monitoring Instrumentation
19 © 2013 Electric Power Research Institute, Inc. All rights reserved.
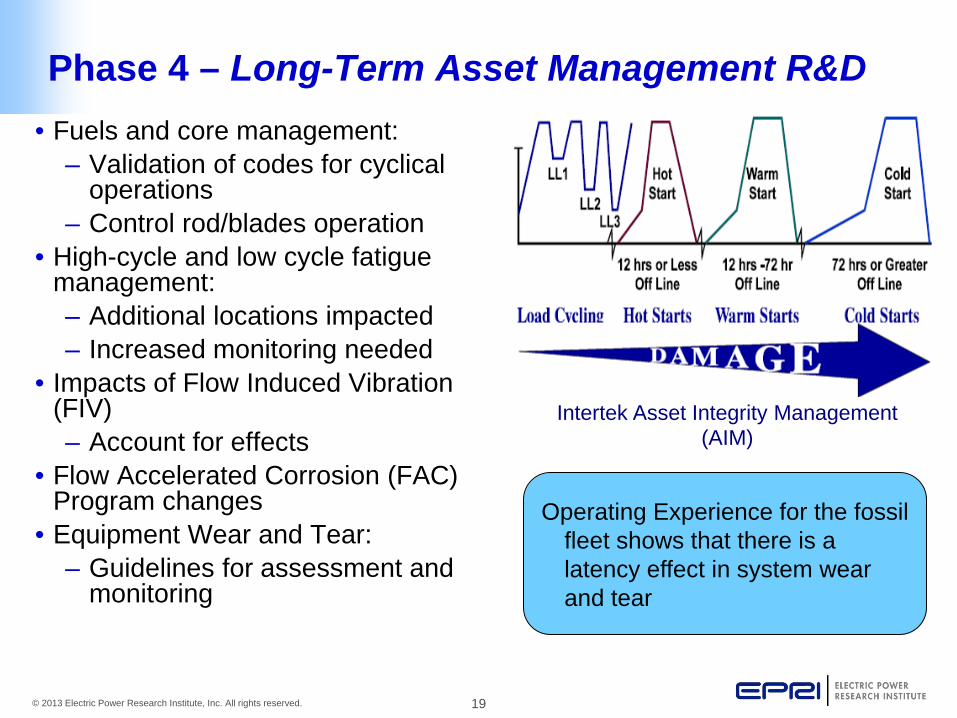
Phase 4 – Long-Term Asset Management R&D • Fuels and core management:
– Validation of codes for cyclical operations
– Control rod/blades operation • High-cycle and low cycle fatigue
management: – Additional locations impacted – Increased monitoring needed
• Impacts of Flow Induced Vibration (FIV) – Account for effects
• Flow Accelerated Corrosion (FAC) Program changes
• Equipment Wear and Tear: – Guidelines for assessment and
monitoring
Operating Experience for the fossil fleet shows that there is a latency effect in system wear and tear
Intertek Asset Integrity Management (AIM)

20 © 2013 Electric Power Research Institute, Inc. All rights reserved.
Phase 5 – Understand the Economics & Plant Enhancements • Develop economic model to understand the
cost of flexible operations: – Direct and indirect costs – Future mix of generations technologies
across a fleet – Feed into the cost of ancillary services
• Evaluate the risks: – Gather data and model into PRAs – Enhancement in Human Performance
• Plant Enhancements: – On-line monitoring systems for dynamic
plant operation – On-line fatigue and vibration monitoring – Improvements in Chemistry and water
management schemes

21 © 2013 Electric Power Research Institute, Inc. All rights reserved.
Next Steps
• Early 2014 Products – Gap Matrix – High-level guidelines to support
planning for the transition
• Utility Advisory Group – Support direction of R&D for
long-term asset management – Scoping and prioritization of
plant enhancements

22 © 2013 Electric Power Research Institute, Inc. All rights reserved.
Together…Shaping the Future of Electricity

23 © 2013 Electric Power Research Institute, Inc. All rights reserved.
Renewable Portfolio Standard Policies..
www.dsireusa.org / March 2013.
29 states,+ Washington DC and 2
territories,have Renewable Portfolio
Standards (8 states and 2 territories have
renewable portfolio goals).