traffic safety facts, 2010 data: older population
TRANSCRIPT
NHTSA’s National Center for Statistics and Analysis 1200 New Jersey Avenue SE., Washington, DC 20590
TRAFFIC SAFETY FACTS2010 Data
DOT HS 811 640 July 2012
Older PopulationThis fact sheet focuses on the older population in the United States, defined as all people age 65 and older. In 2010, 13 percent of the total U.S. resident population (40.4 million people) were age 65 and older.
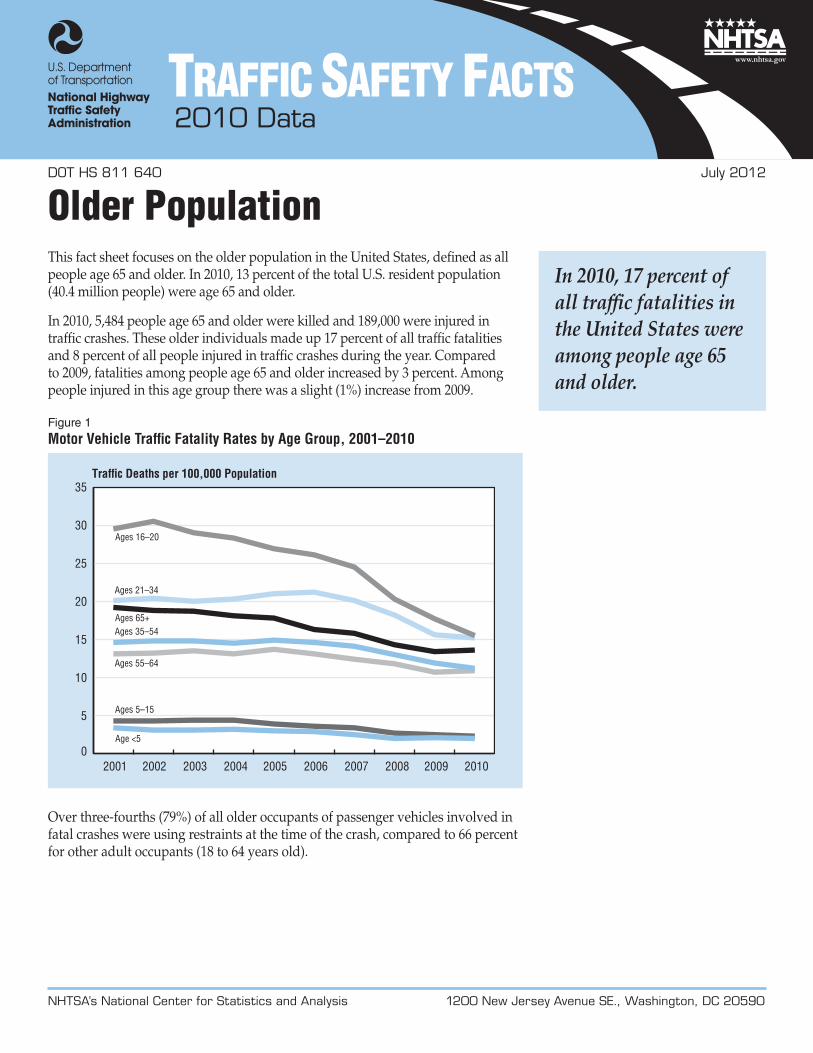
In 2010, 5,484 people age 65 and older were killed and 189,000 were injured in traffic crashes. These older individuals made up 17 percent of all traffic fatalities and 8 percent of all people injured in traffic crashes during the year. Compared to 2009, fatalities among people age 65 and older increased by 3 percent. Among people injured in this age group there was a slight (1%) increase from 2009.
Figure 1Motor Vehicle Traffic Fatality Rates by Age Group, 2001–2010
0
5
10
15
20
25
30
35
2006
Age <5
Ages 5–15
Ages 16–20
Ages 65+
Ages 21–34
2001 2002 2003 2004 2005
Traffic Deaths per 100,000 Population
2007 2008 2009 2010
Ages 35–54
Ages 55–64
Over three-fourths (79%) of all older occupants of passenger vehicles involved in fatal crashes were using restraints at the time of the crash, compared to 66 percent for other adult occupants (18 to 64 years old).
In 2010, 17 percent of all traffic fatalities in the United States were among people age 65 and older.

NHTSA’s National Center for Statistics and Analysis 1200 New Jersey Avenue SE., Washington, DC 20590
2
Table 1Involvement of the Older Population in Traffic Fatalities by Sex, 2001 and 2010
2001 2010 Percentage Change, 2001–2010
Total Age 65+Percentage
of Total Total Age 65+Percentage
of Total Total Age 65+Population (Thousands)
Total 284,969 35,290 12.4 309,350 40,438 13.1 9 15Male 139,891 14,606 10.4 152,108 17,454 11.5 9 19Female 145,077 20,684 14.3 157,242 22,984 14.6 8 11
Drivers Involved in Fatal CrashesTotal* 57,586 6,446 11.2 44,440 5,560 12.5 -23 -14Male 41,901 4,417 10.5 31,965 3,846 12.0 -24 -13Female 14,919 2,029 13.6 11,811 1,714 14.5 -21 -16
Driver FatalitiesTotal* 25,869 4,012 15.5 21,016 3,398 16.2 -19 -15Male 19,244 2,697 14.0 15,877 2,304 14.5 -17 -15Female 6,624 1,315 19.9 5,136 1,094 21.3 -22 -17
Total Traffic FatalitiesTotal* 42,196 6,759 16.0 32,885 5,484 16.7 -22 -19Male 28,986 3,832 13.2 22,902 3,242 14.2 -21 -15Female 13,205 2,927 22.2 9,979 2,241 22.5 -24 -23
Occupant FatalitiesTotal* 36,440 5,617 15.4 27,805 4,535 16.3 -24 -19Male 24,815 3,147 12.7 19,291 2,644 13.7 -22 -16Female 11,621 2,470 21.3 8,511 1,891 22.2 -27 -23
Pedestrian FatalitiesTotal* 4,901 1,058 21.6 4,280 826 19.3 -13 -22Male 3,421 609 17.8 2,946 499 16.9 -14 -18Female 1,479 449 30.4 1,333 326 24.5 -10 -27
Passenger Vehicle Occupant FatalitiesTotal* 32,043 5,437 17.0 22,187 4,116 18.6 -31 -24Male 20,834 2,987 14.3 14,265 2,268 15.9 -32 -24Female 11,205 2,450 21.9 7,919 1,848 23.3 -29 -25
Motorcyclist FatalitiesTotal 3,197 82 2.6 4,502 280 6.2 41 241Male 2,904 78 2.7 4,064 266 6.5 40 241Female 293 4 1.4 438 14 3.2 49 250
Pedalcyclist FatalitiesTotal 732 69 9.4 618 67 10.8 -16 -3Male 660 66 10.0 534 60 11.2 -19 -9Female 72 3 4.2 84 7 8.3 17 133
*Total includes unknown gender.
Older drivers made up 16 percent of all licensed drivers in 2010, compared with 14 percent in 2001.
Among the 65-and-older age group, from 2001 to 2010, the total population increased by 15 percent (increased for males by 19% and for females by 11%). However, driver fatalities for this age group declined by 15 percent (decreased for males by 15% and for females by 17%).
DriversThere were 34 million licensed older drivers in 2010 (latest data available)— a 22-percent increase from 2001. In contrast, the total number of licensed drivers increased by only 10 percent from 2001 to 2010. Older drivers made up 16 percent of all licensed drivers in 2010, compared with 14 percent in 2001.

NHTSA’s National Center for Statistics and Analysis 1200 New Jersey Avenue SE., Washington, DC 20590
3
As shown in Table 2, of all drivers, older drivers involved in fatal crashes had the lowest proportion of total drivers with a blood alcohol concentration (BAC) of .08 grams per deciliter (g/dL) or higher.
Table 2Age and Alcohol of Drivers Involved in Fatal Crashes, 2010
Age Group (Years)
Drivers Involved in Fatal Crashes
Total
BAC= .08+
Number Percent of Total<16 160 12 816–20 4,487 827 1821–34 13,125 4,111 3135–54 14,803 3,436 2355–64 5,554 769 1465+ 5,560 360 6Total *44,440 9,694 22
*Includes 751 drivers of unknown age.
Table 3Fatalities in Crashes Involving Drivers Age 65 and Older, 2001–2010
Year 2001 2002 2003 2004 2005 2006 2007 2008 2009 2010
Fatalities 6,742 6,663 6,805 6,585 6,647 6,334 6,169 5,825 5,613 5,750
People killed in crashes involving an older driver declined by 15 percent from 6,742 in 2001 to 5,750 in 2010. Since 2009, the number of people killed in crashes involving an older driver increased by 2 percent.
Most traffic fatalities involving older drivers in 2010 occurred during the daytime (77%), occurred on weekdays (71%), and involved other vehicles (66%).
Figure 2Driver Involvement Rates in Fatal Crashes by Age and Sex, 2010
0
5
10
15
20
25
30
35
40
21–24
Driver Involvement Rate per 100,000 Population
16–20 25–34 35–44 45–54 55–64 65+Driver Age (Years)
Females Males
Fatalities in crashes involving older drivers declined by 15 percent from 2001 to 2010.

NHTSA’s National Center for Statistics and Analysis 1200 New Jersey Avenue SE., Washington, DC 20590
4
PedestriansFor older people, 63 percent of pedestrian fatalities in 2010 occurred at non- intersection locations. For other pedestrians, 82 percent of fatalities occurred at non-intersection locations.
Among all fatally injured adult pedestrians, older pedestrians had the lowest proportion of pedestrians with a BAC of .08 g/dL or higher.
Table 4Pedestrian Fatalities by Age Group and BAC, 2010
Age Group (Years) Total
BAC= .08+
Number Percent of Total
<16 293 8 3
16-20 282 64 23
21-34 876 428 49
35-54 1,371 629 46
55-64 615 203 33
65+ 826 74 9
Total *4,280 1,414 33
*Includes 17 pedestrian fatalities of unknown age.
Older Population Age GroupsIn 2010, among the older population, the fatality rate for the 85+ age group was 18.67 per 100,000 population, which was higher than any other age group.
Figure 3Motor Vehicle Traffic Fatality Rates Among Older Population by Age Group, 2001–2010
10
15
20
25
30
2006
Ages 65–69
Ages 70–74
Ages 80–84
Ages 85+
2001 2002 2003 2004 2005
Traffic Deaths per 100,000 Population
2007 2008 2009 2010
Ages 75–79
For older pedestrians, 63 percent of fatalities in 2010 occurred at non-intersection locations.

NHTSA’s National Center for Statistics and Analysis 1200 New Jersey Avenue SE., Washington, DC 20590
5
In 2010, driver involvement rates per 100,000 population among older male drivers was highest (27.28) in the 85-and-older age group; and among older female drivers was highest in the 80-84 age group (8.85).
Figure 4Involvement Rates for Older Drivers in Fatal Crashes by Age Group and Sex, 2010
0
5
10
15
20
25
30
70–74
Driver Involvement Rate per 100,000 Population
65–69 75–79 80–84 85+Driver Age (Years)
Females Males
Driver involvement in fatal traffic crashes by driver ages and fatalities in those crashes can be found in Tables 5 and 6.
For more information:Information on traffic fatalities is available from the National Center for Statistics and Analysis (NCSA), NVS-424, 1200 New Jersey Avenue SE., Washington, DC 20590. NCSA can be contacted at 800-934-8517 or via the following e-mail address: [email protected]. General information on highway traffic safety can be accessed by Internet users at www.nhtsa.gov/NCSA. To report a safety-related problem or to inquire about motor vehicle safety information, contact the Vehicle Safety Hotline at 888-327-4236.
Other fact sheets available from the National Center for Statistics and Analysis are Alcohol, African American, Bicyclists and Other Cyclists, Children, Hispanic, Large Trucks, Motorcycles, Occupant Protection, Overview, Pedestrians, Race and Ethnicity, Rural/Urban Comparisons, School Transportation-Related Crashes, Speeding, State Alcohol Estimates, State Traffic Data, and Young Drivers. Detailed data on motor vehicle traffic crashes are published annually in Traffic Safety Facts: A Compilation of Motor Vehicle Crash Data from the Fatality Analysis Reporting System and the General Estimates System. The fact sheets and annual Traffic Safety Facts report can be accessed online at www-nrd.nhtsa.dot.gov/CATS/index.aspx.

NHTSA’s National Center for Statistics and Analysis 1200 New Jersey Avenue SE., Washington, DC 20590
6
Table 5Driver Involvement in Fatal Traffic Crashes by State and Age Group, 2010
State Total* Total 65+Percentage
of TotalAge Group (Years)
<16 16–20 21–34 35–54 55–69 70–74 75–79 80–84 85+ Alabama 1,161 138 11.9 7 133 360 375 195 28 24 18 14Alaska 75 8 10.7 1 6 18 28 18 2 1 0 1Arizona 978 127 13.0 2 74 264 339 157 23 23 24 16Arkansas 743 87 11.7 1 57 269 229 127 16 19 7 15California 3,651 378 10.4 7 329 1,139 1,223 571 68 71 64 48Colorado 599 67 11.2 3 61 179 205 92 13 18 11 10Connecticut 421 43 10.2 0 32 142 142 65 4 11 5 13Delaware 136 14 10.3 1 14 48 40 22 3 3 2 1Dist of Columbia 28 1 3.6 0 0 16 10 1 0 0 1 0Florida 3,426 508 14.8 11 319 1,043 1,068 544 117 102 88 60Georgia 1,682 225 13.4 6 169 484 540 291 52 38 37 25Hawaii 152 15 9.9 1 13 60 43 22 4 1 2 5Idaho 253 38 15.0 6 27 76 76 44 6 4 5 9Illinois 1,311 156 11.9 2 144 408 418 195 31 25 30 27Indiana 1,091 147 13.5 4 121 297 392 156 46 31 23 12Iowa 544 78 14.3 5 57 127 178 120 18 9 11 18Kansas 571 91 15.9 3 70 154 184 87 15 23 19 13Kentucky 1,037 123 11.9 8 106 297 384 154 24 26 18 14Louisiana 916 69 7.5 3 104 296 333 123 20 12 7 5Maine 203 32 15.8 0 24 57 52 47 5 8 5 5Maryland 683 86 12.6 1 57 214 222 114 23 15 13 8Massachusetts 403 55 13.6 0 51 129 109 69 13 9 14 7Michigan 1,311 184 14.0 9 148 324 448 229 36 28 31 38Minnesota 592 75 12.7 3 62 162 199 106 20 20 8 9Mississippi 799 92 11.5 6 80 224 293 133 22 11 12 14Missouri 1,141 158 13.8 5 116 296 405 195 29 34 26 20Montana 218 31 14.2 3 28 61 63 43 9 4 2 3Nebraska 249 41 16.5 5 31 65 79 41 9 4 8 7Nevada 346 54 15.6 0 23 90 118 67 11 11 12 7New Hampshire 168 27 16.1 0 17 39 59 31 5 5 4 7New Jersey 793 116 14.6 2 67 222 256 138 23 26 13 21New Mexico 445 39 8.8 4 48 145 149 63 12 8 4 4New York 1,559 220 14.1 3 142 447 502 270 37 45 37 40North Carolina 1,778 229 12.9 4 198 511 609 282 53 48 41 17North Dakota 145 12 8.3 3 14 42 52 23 2 1 4 1Ohio 1,504 195 13.0 3 156 441 506 250 42 28 31 32Oklahoma 893 104 11.6 3 94 254 322 130 22 23 11 17Oregon 415 66 15.9 0 36 101 135 85 14 12 17 10Pennsylvania 1,775 268 15.1 4 197 484 608 271 61 62 31 36Rhode Island 84 11 13.1 1 6 25 31 11 3 0 1 3South Carolina 1,081 119 11.0 0 108 337 375 186 26 14 13 12South Dakota 184 32 17.4 4 17 48 58 34 6 6 7 4Tennessee 1,380 171 12.4 4 137 394 479 241 40 28 24 23Texas 4,117 376 9.1 12 449 1,365 1,366 581 80 73 48 46Utah 302 36 11.9 1 36 95 101 46 9 10 1 3Vermont 87 21 24.1 1 5 27 21 18 3 6 4 2Virginia 989 128 12.9 2 99 280 323 184 35 22 18 19Washington 617 68 11.0 3 62 196 189 107 11 7 12 18West Virginia 406 60 14.8 1 39 102 142 83 8 13 10 7Wisconsin 813 116 14.3 1 90 230 256 144 33 19 14 21Wyoming 185 25 13.5 1 14 41 69 44 6 4 4 2U.S. Total 44,440 5,560 12.5 160 4,487 13,125 14,803 7,250 1,198 1,045 852 769Puerto Rico 447 38 8.5 1 48 171 121 58 7 7 3 2*Includes drivers of unknown age. The United States had 751 drivers of unknown age.

NHTSA’s National Center for Statistics and Analysis 1200 New Jersey Avenue SE., Washington, DC 20590
7
Table 6Fatalities in Traffic Crashes by State and Age Group, 2010
State Total* Total 65+Percentage
of TotalAge Group (Years)
<16 16–20 21–34 35–54 55–69 70–74 75–79 80–84 85+ Alabama 862 118 13.7 45 100 244 249 142 22 24 19 15Alaska 56 8 14.3 5 6 10 16 14 2 1 1 1Arizona 762 143 18.8 33 58 192 221 151 28 25 27 25Arkansas 563 82 14.6 15 62 185 156 86 13 20 7 19California 2,715 470 17.3 97 245 737 803 472 70 95 92 97Colorado 448 65 14.5 22 49 119 127 78 9 22 12 10Connecticut 319 51 16.0 8 29 102 96 45 6 8 9 16Delaware 101 13 12.9 6 10 31 33 12 1 4 3 1Dist of Columbia 24 4 16.7 2 0 11 5 3 2 0 0 1Florida 2,445 496 20.3 91 212 652 675 426 110 93 98 86Georgia 1,244 217 17.4 79 116 294 356 234 45 34 45 36Hawaii 113 22 19.5 3 13 35 32 13 5 4 4 4Idaho 209 29 13.9 19 22 61 51 36 6 5 3 6Illinois 927 140 15.1 33 111 281 255 140 29 20 29 29Indiana 754 138 18.3 32 96 174 234 110 37 32 24 15Iowa 390 68 17.4 19 49 90 102 77 15 12 11 15Kansas 431 80 18.6 24 56 114 107 69 13 17 16 15Kentucky 760 122 16.1 49 65 203 246 117 21 25 17 17Louisiana 710 58 8.2 42 87 200 247 89 18 14 6 5Maine 161 33 20.5 6 23 46 34 26 6 6 6 8Maryland 493 79 16.0 16 48 150 144 74 16 12 14 16Massachusetts 314 55 17.5 6 29 99 79 54 12 15 10 9Michigan 942 177 18.8 39 100 223 285 149 34 32 31 49Minnesota 411 72 17.5 26 40 112 104 72 12 18 12 15Mississippi 641 85 13.3 32 62 176 205 102 23 12 14 15Missouri 819 145 17.7 26 92 211 256 128 24 29 29 24Montana 189 34 18.0 13 29 47 41 39 8 4 5 3Nebraska 190 36 18.9 13 20 53 47 29 5 6 10 7Nevada 257 53 20.6 9 19 51 88 49 8 12 13 8New Hampshire 128 24 18.8 2 15 34 33 25 3 4 4 8New Jersey 556 136 24.5 15 42 158 146 89 28 27 27 23New Mexico 346 45 13.0 19 47 96 97 52 9 16 2 8New York 1,200 267 22.3 53 125 304 298 196 29 54 67 66North Carolina 1,319 203 15.4 57 153 348 409 201 46 41 38 26North Dakota 105 11 10.5 7 7 28 37 17 1 1 4 3Ohio 1,080 178 16.5 46 122 289 311 177 34 23 36 42Oklahoma 668 92 13.8 39 67 164 234 95 18 22 10 19Oregon 317 63 19.9 11 33 69 90 61 10 15 17 11Pennsylvania 1,324 246 18.6 44 161 341 395 181 50 58 40 53Rhode Island 66 16 24.2 4 5 15 24 7 2 3 1 5South Carolina 810 117 14.4 25 90 237 254 126 23 17 17 18South Dakota 140 29 20.7 10 14 31 40 26 4 5 5 5Tennessee 1,031 165 16.0 37 95 260 336 183 31 33 26 29Texas 2,998 362 12.1 148 344 909 892 445 62 77 55 59Utah 236 44 18.6 22 25 63 58 38 9 14 3 4Vermont 71 18 25.4 3 7 25 9 12 2 6 5 2Virginia 740 119 16.1 18 83 188 243 115 25 25 19 24Washington 458 73 15.9 21 50 132 113 86 12 9 13 21West Virginia 315 58 18.4 12 34 73 94 58 7 13 12 12Wisconsin 572 107 18.7 21 66 153 152 95 24 21 14 26Wyoming 155 18 11.6 4 8 43 55 33 4 3 3 2U.S. Total 32,885 5,484 16.7 1,428 3,441 8,863 9,614 5,354 1,033 1,088 985 1,033Puerto Rico 340 55 16.2 12 31 97 94 66 12 10 6 1*Total includes fatalities of unknown age. The United States had 46 fatalities of unknown age.
8724-072312-v3