traffic crash facts annual report 2014
TRANSCRIPT

Traffic Crash FactsTraffic Crash FactsTraffic Crash FactsTraffic Crash Facts Annual Report Annual Report Annual Report Annual Report
2014201420142014
9/11/2015Create Date:
1Page

9/11/2015Create Date:
Important Information Please Read
Please note while reviewing the 2014 Crash Facts Annual Report the statistics produced in this document are
static in nature and are subject to change as new and updated crash reports are received after the closeout date
of July 30, 2015. Additionally, the 2013 statistics reflect static values reported in the 2013 Crash Facts
Publication with a closeout date of October 13, 2014. While reviewing this publication, the Florida Traffic Crash
Statistics Summary may not reflect the same totals as additional sub tables throughout this document. This is
due to the nature of crash reporting and fields that can be reported with one to many selections. For example, a
Non-Motorist such as a Bicyclist can be reported with up to two separate Safety Equipment selections. Thus may
increase the number of reported injuries and fatalities when looking at a specific Safety Equipment value.
The information contained in this Traffic Crash Statistics booklet is extracted from law enforcement agency
reports (HSMV 90010S) of traffic crashes in which a motor vehicle is involved and which meets the following
criteria:
� Motor vehicle crashes resulting in death or personal injury; or
� Motor vehicle crashes in which one or more of the following conditions occur:
� Leaving the scene involving damage to an attended vehicle or property (Section 316.061
(1), Fla. Stat.); or
� Driving while under the influence of alcoholic beverages, chemical substances, or
controlled substances or with an unlawful blood alcohol level (Section 316.193, Fla. Stat.);
or
� A vehicle was rendered inoperable to a degree that required a wrecker to remove it from
the scene of the crash; or
� Involved a commercial motor vehicle
For questions or concerns, please contact the FIRES Crash Records Team by email at [email protected] <mailto:[email protected]>. Also, please visit the FIRES Public Portal for updated crash statistics <https://firesportal.com/Pages/Public/QuickStats.aspx>. The numbers reflected on the FIRES Public Portal are dynamic in nature and will fluctuate over time as new and updated crash reports are received.
2Page

9/11/2015Create Date:
Florida Traffic Crash Statistics Summary
2013 2014 %Change
Traffic Crashes 316,943 344,170 8.59
Drivers Involved 533,555 581,090 8.91
Average Crashes per Day 868 943 8.64
Mileage Death Rate (per 100 million VMT) 1.25 1.24 -0.80
Fatal Crashes 2,224 2,336 5.04
Fatalities 2,402 2,494 3.83
Injury Crashes 140,074 149,426 6.68
Injuries 210,887 225,608 6.98
Property Damage Only Crashes 174,500 192,408 10.26
Alcohol Suspected Crashes 17,107 16,873 -1.37
Alcohol Suspected Fatal Crashes 789 780 -1.14
Alcohol Suspected Fatalities 859 849 -1.16
Alcohol Suspected Injury Crashes 7,572 7,362 -2.77
Alcohol Suspected Injuries 11,346 11,210 -1.20
Alcohol Confirmed Crashes 5,734 5,660 -1.29
Alcohol Confirmed Fatal Crashes 436 416 -4.59
Alcohol Confirmed Fatalities 474 459 -3.16
Alcohol Confirmed Injury Crashes 2,265 2,143 -5.39
Alcohol Confirmed Injuries 3,665 3,387 -7.59
Drug Suspected Crashes 1,864 1,730 -7.19
Drug Suspected Fatal Crashes 204 204 0.00
Drug Suspected Fatalities 303 287 -5.28
Drug Suspected Injury Crashes 843 767 -9.02
Drug Suspected Injuries 2,445 2,199 -10.06
Drug Confirmed Crashes 487 469 -3.70
Drug Confirmed Fatal Crashes 205 198 -3.41
Drug Confirmed Fatalities 232 219 -5.60
Drug Confirmed Injury Crashes 246 251 2.03
Drug Confirmed Injuries 459 468 1.96
Drug & Alcohol Confirmed Crashes 360 316 -12.22
3Page

9/11/2015Create Date:
Drug & Alcohol Confirmed Fatal Crashes 238 205 -13.87
Drug & Alcohol Confirmed Fatalities 257 221 -14.01
Drug & Alcohol Confirmed Injury Crashes 163 134 -17.79
Drug & Alcohol Confirmed Injuries 314 218 -30.57
Pedestrian Crashes 8,410 8,838 5.09
Pedestrian Fatalities 498 606 21.69
Pedestrian Injuries 7,467 7,737 3.62
Bicycle Crashes 6,969 7,077 1.55
Bicyclist Fatalities 135 135 0.00
Bicyclist Injuries 6,520 6,680 2.45
Other Non-Motorist Crashes 2,413 2,516 4.27
Other Non-Motorist Fatalities 13 9 -30.77
Other Non-Motorist Injured 432 399 -7.64
Motorcycle Crashes 9,682 9,854 1.78
Motorcyclists Fatalities 444 427 -3.83
Motorcycle Passenger Fatalities 18 22 22.22
Motorcyclist Injuries 7,905 8,040 1.71
Motorcycle Passenger Injuries 837 809 -3.35
Teen Driver Crashes 36,180 38,795 7.23
Teen Driver Fatalities 57 71 24.56
Teen Passenger Fatalities 46 38 -17.39
Teen Driver Injuries 9,495 9,945 4.74
Teen Passenger Injuries 7,453 7,723 3.62
Please Note: A change in the method for calculation of alcohol and drug percentages has been made in the 2013-14
Crash Facts Report. Caution should be exercised when making any comparison between the percentages of these
tables with the same tables in prior reports.
Vehicle Miles Travelled totals are expressed in millions. Mileage Death Rate is determined Per 100 million vehicle miles
of travel annually. Registered vehicles beginning in 1998 does not include count of trailers with tags. Registered
vehicles beginning in 2010 utilized a more accurate accounting method.
*Licensed Driver and Registered Vehicle statistics were provided by Florida Department of Highway Safety and Motor
Vehicles
**Vehicle Miles statistics were provided by Florida Department of Transportation
4Page

9/11/2015Create Date:
Florida Traffic Crash Facts Table of Contents
1. Summary and Notes
Florida Traffic Crash Summary 3
Source of Data 8
Traffic Crash Data Definitions 9
Florida Motoring Environment 13
2. Drug and Alcohol Statistics
Drug & Alcohol Injury Levels 14
3. Person Involved Statistics
Drivers and Passengers Safety Restraints 15
Motorcyclist Safety Equipment 16
Moped & ATV Safety Equipmentt 17
Non-Motorist Safety Equipment 18
Injury Levels by Vehicle Type 20
All Drivers by Age Group 22
Florida Drivers by Age Group 23
All Alcohol Suspected Drivers by Age Group 24
Florida Alcohol Suspected Drivers by Age Group 25
All Drug Suspected Drivers by Age Group 26
Florida Drug Suspected Drivers by Age Group 27
All Drivers Age 15-29 28
Florida Drivers Age 15-29 29
All Alcohol Suspected Drivers Age 15-29 30
Florida Alcohol Suspected Drivers Age 15-29 31
All Drug Suspected Drivers Age 15-29 32
Florida Drug Suspected Drivers Age 15-29 33
All Drivers Age 65+ 34
Florida Drivers Age 65+ 35
All Alcohol Suspected Drivers Age 65+ 36
5Page

9/11/2015Create Date:
3. Person Involved Statistics
Florida Alcohol Suspected Drivers Age 65+ 37
All Drug Suspected Drivers Age 65+ 38
Florida Drug Suspected Drivers Age 65+ 39
Initial Driver Actions 40
4. Environment—Road and Vehicle Statistics
Crashes by Hour and Day 41
Weather Conditions at Time of Crash 43
Road Surface Conditions 44
Lighting Conditions 44
Road Contributing Circumstances 45
Road Type 46
Vehicle Harmful Events 47
Crashes by Vehicle Type 49
5. Traffic Crash History by County
Traffic Crash History 50
Traffic Fatality History 53
Traffic Injury History 56
Property Damage Only History 59
Alcohol Suspected Crash History 62
Alcohol Suspected Fatalities 65
Alcohol Suspected Injuries 68
Motorcycle Crash History 71
Motorcycle Fatality History 74
Motorcycle Injury History 77
Commercial Motor Vehicle Crash History 80
Commercial Motor Vehicle Fatality History 83
Commercial Motor Vehicle Injury History 86
Pedestrian Crash History 89
Pedestrian Fatality History 92
Pedestrian Injury History 95
6Page

9/11/2015Create Date:
5. Traffic Crash History by County
Bicycle Crash History 98
Bicycle Fatality History 101
Bicycle Injury History 104
Teen Driver Age 15-19 Crash History 107
Teen Driver Age 15-19 Fatality History 110
Teen Driver Age 15-19 Injury History 113
Crashes/Alcohol Suspected Crashes by Locality 116
7Page

9/11/2015Create Date:
Source of Florida Traffic Crash Data
The information contained in this Traffic Crash Statistics booklet is extracted from law enforcement agencyreports (HSMV 90010S) of traffic crashes in which a motor vehicle is involved and which meets the following criteria:
� Motor vehicle crashes resulting in death or personal injury; or
� Motor vehicle crashes in which one or more of the following conditions occur:
o Leaving the scene involving damage to an attended vehicle or property (Section
316.061 (1), Fla. Stat.); or
o Driving while under the influence of alcoholic beverages, chemical substances, or controlled
substances or with an unlawful blood alcohol level (Section 316.193, Fla. Stat.); or
o A vehicle was rendered inoperable to a degree that required a wrecker to remove it from the
scene of the crash (Effective 7/1/2012); or
o Involved a commercial motor vehicle (Effective 7/1/2012).
§ Please note that while the effective date of the changes above are in July, the figures in
this document utilize the above logic for the entire year beginning January 1, 2012 in
order to provide a more accurate view towards the future.
An investigating officer may report any other traffic crashes on the long-form crash report. However, only
those crashes that meet the criteria above are included in this report.
The information contained in this report was produced by Appriss, Inc., in partnership with the Florida Department of Highway Safety and Motor Vehicles and was pulled from the FIRES database. For further information or custom inquiries please contact us at [email protected] or call 850-617-2741, M-F, 8am - 5pm EST.
8Page

9/11/2015Create Date:
Alcohol Suspected
A crash involving a Driver and/or Non-Motorist for whom alcohol use was suspected by the officer or the
individual had a BAC greater than 0.00 or an alcohol test was refused by the individual (Listed on the crash
report as Suspected Alcohol Use code of '2' or BAC greater than 0.00 or Alcohol Test Status code of ‘2’) .
Alcohol Confirmed
A crash involving a Driver and/or Non-Motorist who had a BAC greater than 0.00 (Listed on the crash report
as BAC greater than 0.00). *Excludes Drug Confirmed individuals.
All-Terrain Vehicle (ATV)
A small open motorized vehicle with three or four wheels, designed for off-road use with a seat that is
straddled and handlebars for steering.
BAC
Blood Alcohol Content
Bicycle
A vehicle propelled solely by human power or a motorized Bicycle propelled by a combination of human
power and an electric helper motor rated at 200 watts or less (this term does not include a vehicle with a seat
height less than 26 inches from the ground when the seat is adjusted to its highest position, or a scooter or
similar device).
Bicyclist
Any rider of a Bicycle. A bicyclist is considered a Non-Motorist (Listed on the crash report as Non-Motorist
Person Type of '3' or '4').
Bus
A Motor Vehicle with seating for transporting nine or more persons, including the driver.
Cargo Van
A cargo van is any van where the area behind the driver or cab is designed for transporting cargo or operated
for general commercial use.
Commercial Motor Vehicle (CMV)
A Motor Vehicle or Motor Vehicle combination used on the streets or highways described as:
• Vehicle Body Type of Bus (Code of '8' on the crash report) or Vehicle Body Type of Medium/Heavy
Truck (Code of '20' on the crash report); or
• Is transporting hazardous materials and is required to be placarded (Hazmat Placard Indicator of '2' on
the crash report); or
• Commercial Motor Vehicle Configuration was completed on the crash report; or
• Has a gross, declared, or actual weight rating of 10,001 pounds or more; or
• Commercial indicator on the crash report is marked as 'Y' (True).
Driver
Unless otherwise indicated, the operator of a motor vehicle. Driver data typically excludes uninjured persons
presumed to have been operating hit-and-run or properly parked vehicles (Listed on the crash report as
Person Type of '1').
9Page

9/11/2015Create Date:
Drinking Driver
Any driver involved in a crash who was reported as having an Alcohol Suspected code of ‘2’ or had a BAC
greater than 0.00 or Alcohol Tested code of ‘2’.
Drug Confirmed
A crash involving a Driver and/or Non-Motorist who tested positive for drugs at the time of the crash
*Excludes Alcohol Confirmed individuals.
Drug and Alcohol Confirmed
A crash involving a Driver and /or Pedestrian or Non-Motorist who had a BAC greater than 0.00 AND had a
positive drug test.
Drug Suspected
A crash involving a Driver and/or Non-Motorist where drug use was suspected by the reporting officer
(Listed on the crash report as Suspected Drug Use code of '2' or Drug Tested Code of ‘2’ or Drug Test Result
code of ‘1’). *Excludes Alcohol Suspected individuals.
Farm Labor Vehicle
Any vehicle equipped and used for the transportation of nine or more migrant or seasonal farm workers, in
addition to the driver, to or from a place of employment or employment-related activities.
Fatal Traffic Crash
A traffic crash that results in one or more fatalities within thirty days of occurrence (Listed on the Crash
Report as Injury Severity code of '5').
Injury
Hurt, damage, or loss sustained by a person as a result of a traffic crash. Definitions for the various injury
levels are as follows:
• Injury crash-A non-fatal traffic crash that results in one or more injuries.
• Incapacitating injury-Any visible signs of injury from a crash and person(s) had to be carried from the
scene.
• Non-incapacitating injury-Any visible injuries such as bruises, abrasions, limping, etc.
• Possible injury-No visible signs of injury but complaint of pain or momentary unconsciousness.
• Total injury-The sum of possible, non-incapacitating, and incapacitating injuries.
Low Speed Vehicle
A low speed vehicle is any 4-wheel electric vehicle that has a top speed greater than 20 miles per hour but not greater than 25 miles per hour. A low speed vehicle can be operated on streets under certain conditions, must be licensed for use on the highway, and its operator must have a valid driver license.
Moped
A motor-powered cycle with a pedal-activated motor and a maximum of two brake horsepower (Listed on the
crash report as Vehicle Body Type of '12').
Most Harmful Events
Identifies the most harmful events for each vehicle in a traffic crash.
Motorcoach
A bus with a gross vehicle weight rating (GVWR) of 11,793 kilograms (26,000 pounds) or greater, 16 or more
designated seating positions (including the driver), and at least 2 rows of passenger seats, rearward of the
10Page

9/11/2015Create Date:
driver’s seating position, that are forward-facing or can convert to forward-facing without the use of tools.
Motorcoach includes buses sold for intercity, tour, and commuter bus service, but does not include a school
bus, or an urban transit bus sold for operation as a common carrier in urban transportation along a fixed route
with frequent stops.
Motor Home
A van where a frame-mounted recreational unit is added behind the driver or cab area or mounted on a
bus/truck chassis that is suitable to live in and drive across the country.
Motorcycle
A Motor Vehicle, with a seat or saddle for the driver's use, traveling with no more than three wheels in contact
with the ground, excluding a tractor or a Moped (Listed on the crash report as Vehicle Body Type of '11').
Motorcyclist
The driver of a Motorcycle. A Passenger on a motorcycle is considered a vehicle passenger except where
noted.
Motor Vehicle
Any motorized vehicle not operating on rails.
Non-Motorist
Any person other than an occupant of a Motor Vehicle in transport. This includes Pedestrians, Bicyclists, other
cyclists, occupants of other Motor Vehicles not in transport and occupants of transport vehicles other than
motor vehicles.
Other Non-Motorist
An individual involved in a crash who was not a Pedestrian and was not a Bicyclist, but was identified on the
crash report as an Occupant of a Motor Vehicle Not in Transport, Occupant of a Non-Motor Vehicle
Transportation Device (Other than a Bicycle) or Unknown Type of Non-Motorist (Listed on the crash report as
a Non-Motorist Person Type of '5', '6' or '7').
Passenger
Occupant of motor vehicle other than the driver.
Passenger Car
Motor Vehicles used primarily for carrying passengers.
Pedestrian
An individual involved in a crash who was not occupying a Motor Vehicle, Bicycle or other mobile
conveyance. A Pedestrian is considered a Non-Motorist (Listed on the crash report as a Non-Motorist Person
Type of '1' or '2').
Property Damage Only
Loss of all or part of an individual's vehicle and/or property damage only resulting from a traffic crash not
involving injury or fatality to a person.
Sport Utility Vehicle (SUV)
A motor vehicle other than a motorcycle or bus consisting primarily of a transport device designed for
carrying ten or fewer persons, and generally considered a multi-purpose vehicle that is designed to have
off-road capabilities. These vehicles are generally four-wheel-drive (4x4) and have increased ground clearance.
A utility vehicle has a gross vehicle weight rating (GVWR) of 10,000 pounds or less. Utility vehicles with
11Page

9/11/2015Create Date:
wheelbases greater than 88 inches are classified by overall width. The wheelbase and overall width should be
rounded to the nearest inch. Sizes range from mini, small, mid-size, full-size and large. Four-wheel
automobiles are not considered utility vehicles.
Teen Drivers and Teen Passengers
Refers to Drivers and Passengers involved in crashes who were between the ages of 15 and 19 years old.
Traffic crash
A crash involving at least one Motor Vehicle on a roadway that is open to the public.
Traffic fatality
The death of a person as a direct result of a traffic crash within thirty days of the crash occurrence. (Any
person listed on the crash report with an Injury Severity code of '5').
12Page

9/11/2015Create Date:
Florida Motoring Environment
Mileage Death Rate
DeathsNon-Fatal Injuries
CrashesVehicle Miles
Registered Vehicles
Licensed Drivers
Crash Year
1991 12,170,821 11,184,146 113,484 195,312 195,122 2,523 2.22
1992 11,550,126 11,205,298 114,000 196,174 205,432 2,480 2.18
1993 11,767,409 11,159,938 119,768 199,039 212,497 2,719 2.27
1994 11,992,578 11,393,982 120,929 206,183 223,458 2,722 2.25
1995 12,019,156 11,557,811 127,800 228,589 233,900 2,847 2.23
1996 12,343,598 12,003,930 129,637 241,377 243,320 2,806 2.16
1997 12,691,835 12,170,375 133,276 240,639 240,001 2,811 2.11
1998 13,012,132 11,277,808 136,680 245,440 241,863 2,889 2.11
1999 13,398,895 11,611,993 140,868 243,409 232,225 2,920 2.07
2000 14,041,846 11,948,485 149,857 246,541 231,588 2,999 2.00
2001 14,346,373 13,448,202 171,029 256,169 234,600 3,013 1.76
2002 14,604,720 12,989,278 178,680 250,470 229,611 3,143 1.76
2003 14,847,416 14,080,886 185,642 243,294 221,639 3,179 1.71
2004 15,007,005 14,512,264 196,722 252,902 227,192 3,257 1.66
2005 15,272,680 15,062,993 200,974 268,605 233,930 3,533 1.76
2006 15,491,878 15,612,161 203,783 256,200 214,914 3,365 1.65
2007 15,579,603 14,858,332 205,421 256,206 212,149 3,221 1.57
2008 15,556,658 15,966,287 198,494 243,342 199,657 2,983 1.50
2009 15,553,387 14,983,437 196,402 235,778 197,214 2,563 1.30
2010 15,507,284 14,845,603 195,755 235,461 195,104 2,444 1.25
2011 15,374,230 14,795,836 191,854 227,998 181,701 2,403 1.25
2012 15,378,206 14,727,755 190,850 281,321 198,029 2,430 1.27
2013 15,417,032 15,079,971 192,702 316,943 210,887 2,402 1.25
2014 15,620,312 15,473,992 201,040 344,170 225,608 2,494 1.24
Vehicle Miles Travelled totals are expressed in millions. Mileage Death Rate is determined Per 100
million vehicle miles of travel annually. Registered vehicles beginning in 1998 does not include
count of trailers with tags.
*Licensed Driver and Registered Vehicle statistics were provided by FL Department of Highway Safety and Motor Vehicles
**Vehicle Miles statistics were provided by FL Department of Transportation
13Page

9/11/2015Create Date:
Drug & Alcohol Injury Levels
Incapacitating Injuries
FatalitiesNo Injuries Non-Incapacitating Injuries
Possible Injuries
Alcohol Suspected by Injury
Driver 3,327 1,221 49417,957 2,733
Non-Motorist 67 77 43138 114
Passenger 1,482 464 1027,058 1,069
Pedestrian 143 258 210106 255
Alcohol Confirmed by Injury
Driver 961 452 2746,351 838
Non-Motorist 2 14 2330 18
Passenger 494 167 522,474 355
Pedestrian 16 50 11023 20
Drug Suspected by Injury
Driver 665 212 1712,865 417
Non-Motorist 7 9 1220 14
Passenger 395 187 621,753 241
Pedestrian 15 23 4222 14
Drug Confirmed by Injury
Driver 112 76 159344 103
Non-Motorist 0 2 85 2
Passenger 68 48 21191 46
Pedestrian 2 7 312 2
Drug & Alcohol Confirmed by Injury
Driver 34 59 147162 40
Non-Motorist 0 1 61 0
Passenger 16 32 2066 32
Pedestrian 1 3 483 0
Note: The figures in these tables represent ALL individuals who were involved in the specified crashes. They are not exclusively indicative of total drug or alcohol impaired individuals.
14Page

9/11/2015Create Date:
Safety Restraints and Injury Levels of Drivers and Passengers
Serious (Incapacitating)
Injuries
FatalitiesRestraint Type Non-Incapacitating Injuries
Possible Injuries
Not Injured
Restraint Total
Driver
787 88 14 354Lap Belt Only Used 946
3,881 1,433 1,028 4071,673None Used -Motor Vehicle Occupant
8,422
22,774 2,270 168 48417Other, Explain in Narrative
25,677
2,118 428 29 6145Restraint Used -Type Unknown
2,726
375,017 82,579 9,268 46136,145Shoulder and Lap Belt Used
503,470
3,448 755 109 5314Shoulder Belt Only Used 4,631
21,374 1,247 196 23567Unknown 23,407
Passenger
4,775 427 39 0211Lap Belt Only Used 5,452
10,924 1,756 721 1211,429None Used -Motor Vehicle Occupant
14,951
6,030 603 68 16179Other, Explain in Narrative
6,896
1,500 231 22 186Restraint Used -Type Unknown
1,840
130,564 32,121 3,403 14212,731Shoulder and Lap Belt Used
178,961
1,528 351 44 3163Shoulder Belt Only Used 2,089
35,478 4,960 339 231,302Unknown 42,102
Note: In the 2014 Crash Facts, tables for injury levels and restraint types have been modified to show only the cross-tab totals for each restraint/equipment type. This change was made to better accommodate the purpose of these tables and to show statistics on safety restraint/equipment usage as opposed to injury and fatality totals. Also, in the case of non-motorist safety equipment an individual can be using more than one equipment type, therefore column totals for injuries and fatalities will not be an accurate reflection of the true statistics.
15Page

9/11/2015Create Date:
Motorcyclist Safety Equipment and Injury Levels
Serious (Incapacitating)
Injuries
FatalitiesHelmet Type Non-Incapacitating Injuries
Possible Injuries
Not Injured
Equipment Usage Total
Driver
554 1,112 1,090 2102,048DOT-Compliant Motorcycle Helmet
5,014
541 787 1,001 1981,488No Helmet 4,015
35 38 53 1378Other Helmet 217
81 117 69 6159Unknown 432
Passenger
58 86 83 9177DOT-Compliant Motorcycle Helmet
413
96 87 120 12196No Helmet 511
3 3 6 112Other Helmet 25
18 11 11 017Unknown 57
Note: In the 2014 Crash Facts, tables for injury levels and restraint types have been modified to show only the cross-tab totals for each restraint/equipment type. This change was made to better accommodate the purpose of these tables and to show statistics on safety restraint/equipment usage as opposed to injury and fatality totals. Also, in the case of non-motorist safety equipment an individual can be using more than one equipment type, therefore column totals for injuries and fatalities will not be an accurate reflection of the true statistics.
16Page

9/11/2015Create Date:
Moped & ATV Safety Equipment and Injury Levels
Serious (Incapacitating)
Injuries
FatalitiesHelmet Type Non-Incapacitating Injuries
Possible Injuries
Not Injured
Equipment Usage Total
Driver
38 74 57 7133Helmet 309
1 0 0 00Lighting 1
102 160 111 8320None 701
1 2 1 01Not Applicable 5
51 89 37 3120Other, Explain in Narrative
300
143 34 14 033Protective Pads Used (elbows, knees, shins, etc.)
224
3 0 1 00Reflective Clothing (jacket, backpack, etc.)
4
35 88 122 16168Unknown 429
Passenger
12 18 19 020Helmet 69
2 1 1 02Lighting 6
23 23 22 043None 111
4 0 0 00Not Applicable 4
9 6 2 010Other, Explain in Narrative
27
55 9 0 08Protective Pads Used (elbows, knees, shins, etc.)
72
2 0 0 00Reflective Clothing (jacket, backpack, etc.)
2
22 9 19 233Unknown 85
Note: In the 2014 Crash Facts, tables for injury levels and restraint types have been modified to show only the cross-tab totals for each restraint/equipment type. This change was made to better accommodate the purpose of these tables and to show statistics on safety restraint/equipment usage as opposed to injury and fatality totals. Also, in the case of non-motorist safety equipment an individual can be using more than one equipment type, therefore column totals for injuries and fatalities will not be an accurate reflection of the true statistics.
17Page

9/11/2015Create Date:
Safety Equipment and Injury Levels of Non-Motorists
Serious (Incapacitating)
Injuries
FatalitiesSafety Equipment Type Non-Incapacitating Injuries
Possible Injuries
Not Injured
Equipment Usage Total
Bicyclist/Other Cyclist
2 13 1 112 29Not Applicable
45 294 120 12412 883Helmet
19 64 51 9103 246Lighting
0 9 5 014 28Protective Pads Used (elbows, knees, shins, etc.)
303 2,167 793 1172,658 6,038None
5 17 13 437 76Reflective Clothing (jacket, backpack, etc.)
21 99 15 1103 239Unknown
0 14 3 214 33Other, Explain in Narrative
Other Non-Motorist
17 3 1 03 24Reflective Clothing (jacket, backpack, etc.)
3 0 1 01 5Lighting
1 0 0 02 3Protective Pads Used (elbows, knees, shins, etc.)
8 6 1 05 20Helmet
272 11 4 110 298Not Applicable
878 114 47 7110 1,156None
140 10 1 02 153Other, Explain in Narrative
975 61 5 132 1,074Unknown
Pedestrian/Other Pedestrian
2 6 2 48 22Lighting
5 20 7 116 49Helmet
18Page

9/11/2015Create Date:
Pedestrian/Other Pedestrian
0 1 0 01 2Protective Pads Used (elbows, knees, shins, etc.)
822 2,585 1,487 5582,965 8,417None
13 49 28 755 152Reflective Clothing (jacket, backpack, etc.)
43 58 24 789 221Unknown
166 164 113 41247 731Not Applicable
34 23 9 321 90Other, Explain in Narrative
Note: In the 2014 Crash Facts, tables for injury levels and restraint types have been modified to show only the cross-tab totals for each restraint/equipment type. This change was made to better accommodate the purpose of these tables and to show statistics on safety restraint/equipment usage as opposed to injury and fatality totals. Also, in the case of non-motorist safety equipment an individual can be using more than one equipment type, therefore column totals for injuries and fatalities will not be an accurate reflection of the true statistics.
19Page

9/11/2015Create Date:
Injury Levels by Vehicle Type
Vehicle Type FatalitiesSerious (Incapacitating) Injuries
Non-Incapacitating Injuries
Possible InjuriesNot Injured
Driver
All Terrain Vehicle (ATV) 174 73 106 13126
Bus 6,879 161 18 272
Cargo Van (10,000 lbs or less)
2,995 370 47 4153
Farm Labor Vehicle 99 13 1 011
Low Speed Vehicle 300 64 26 361
Medium/Heavy Trucks (more than 10,000 lbs)
22,429 503 107 17327
Moped 214 374 237 21649
Motor Coach 162 5 0 12
Motor Home 248 27 7 219
Motorcycle 1,249 2,054 2,213 4273,773
Not Specified 6,425 214 9 152
Other Light Trucks (10,000 lbs or less)
4,725 461 46 3209
Other, Explain in Narrative
2,495 375 88 7217
Passenger Car 234,582 58,763 6,812 57925,824
Passenger Van 19,678 4,238 549 311,853
Pickup 46,970 8,012 1,205 1653,989
Sport Utility Vehicle (SUV) 64,417 14,955 1,878 1386,445
Unknown 17,097 639 19 081
20Page

9/11/2015Create Date:
Passenger
All Terrain Vehicle (ATV) 90 28 38 258
Bus 28,052 1,317 78 1426
Cargo Van (10,000 lbs or less)
623 102 22 352
Farm Labor Vehicle 44 1 0 00
Low Speed Vehicle 123 26 13 134
Medium/Heavy Trucks (more than 10,000 lbs)
3,445 124 21 064
Moped 41 38 25 058
Motor Coach 406 12 0 03
Motor Home 198 17 4 04
Motorcycle 178 187 220 22402
Not Specified 1,490 47 9 018
Other Light Trucks (10,000 lbs or less)
1,414 206 27 280
Other, Explain in Narrative
956 92 19 067
Passenger Car 89,663 24,361 2,755 2019,798
Passenger Van 14,855 3,218 361 201,196
Pickup 14,878 3,154 427 321,434
Sport Utility Vehicle (SUV) 33,311 7,681 890 462,906
Unknown 1,352 91 10 019
622,257 132,003 60,482 18,287 1,744Grand Total:
21Page
9/11/2015Create Date:
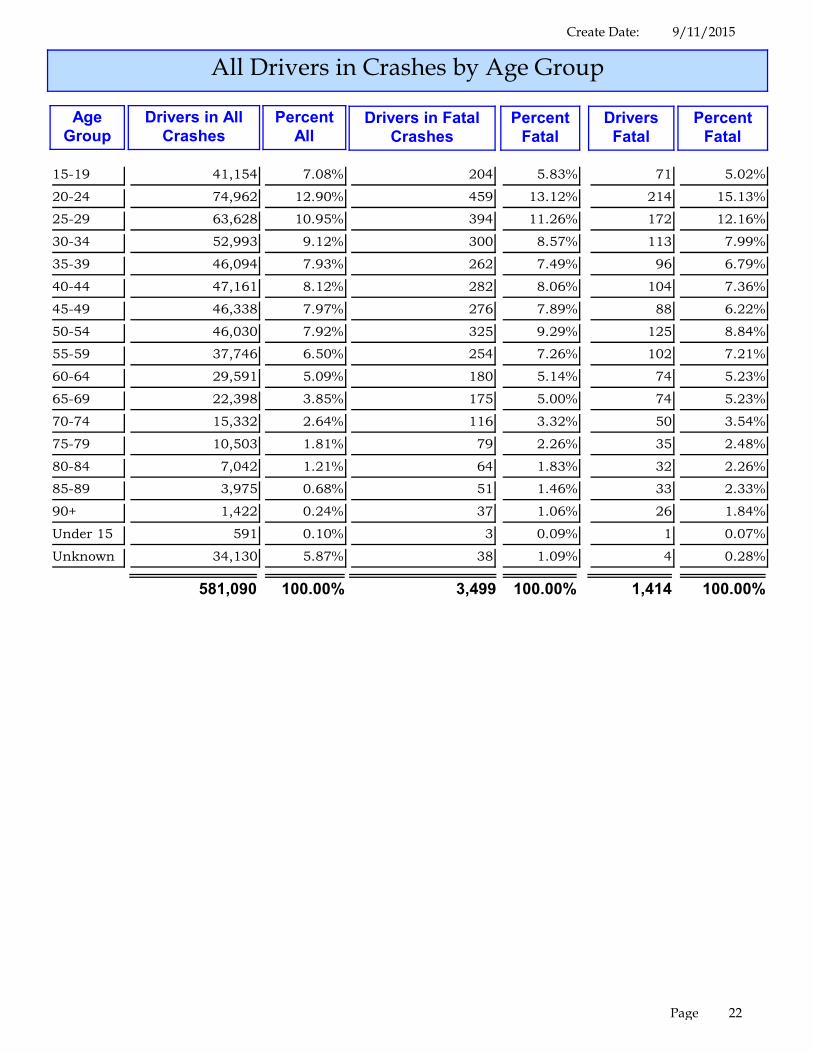
All Drivers in Crashes by Age Group
Percent
Fatal
Drivers
Fatal
Percent
Fatal
Drivers in Fatal
Crashes
Percent
All
Drivers in All
Crashes
Age
Group
15-19 41,154 %7.08 204 %5.83 71 %5.02
20-24 74,962 %12.90 459 %13.12 214 %15.13
25-29 63,628 %10.95 394 %11.26 172 %12.16
30-34 52,993 %9.12 300 %8.57 113 %7.99
35-39 46,094 %7.93 262 %7.49 96 %6.79
40-44 47,161 %8.12 282 %8.06 104 %7.36
45-49 46,338 %7.97 276 %7.89 88 %6.22
50-54 46,030 %7.92 325 %9.29 125 %8.84
55-59 37,746 %6.50 254 %7.26 102 %7.21
60-64 29,591 %5.09 180 %5.14 74 %5.23
65-69 22,398 %3.85 175 %5.00 74 %5.23
70-74 15,332 %2.64 116 %3.32 50 %3.54
75-79 10,503 %1.81 79 %2.26 35 %2.48
80-84 7,042 %1.21 64 %1.83 32 %2.26
85-89 3,975 %0.68 51 %1.46 33 %2.33
90+ 1,422 %0.24 37 %1.06 26 %1.84
Under 15 591 %0.10 3 %0.09 1 %0.07
Unknown 34,130 %5.87 38 %1.09 4 %0.28
581,090 3,499 1,414100.00% 100.00% 100.00%
22Page

9/11/2015Create Date:
Florida Resident Drivers in Crashes by Age Group
Percent
Fatal
Drivers
Fatal
Percent
Fatal
Drivers in Fatal
Crashes
Percent
All
Drivers in All
Crashes
Age
Group
15-19 38,739 %7.68 183 %5.83 62 %4.80
20-24 68,815 %13.64 430 %13.69 202 %15.65
25-29 58,004 %11.50 350 %11.14 157 %12.16
30-34 48,436 %9.60 269 %8.56 102 %7.90
35-39 42,501 %8.42 235 %7.48 86 %6.66
40-44 43,731 %8.67 261 %8.31 99 %7.67
45-49 43,011 %8.52 257 %8.18 83 %6.43
50-54 42,743 %8.47 301 %9.58 118 %9.14
55-59 34,951 %6.93 227 %7.23 93 %7.20
60-64 27,156 %5.38 161 %5.13 67 %5.19
65-69 20,186 %4.00 157 %5.00 66 %5.11
70-74 13,715 %2.72 96 %3.06 43 %3.33
75-79 9,529 %1.89 73 %2.32 33 %2.56
80-84 6,402 %1.27 57 %1.81 28 %2.17
85-89 3,701 %0.73 42 %1.34 26 %2.01
90+ 1,343 %0.27 35 %1.11 25 %1.94
Under 15 172 %0.03 0 %0.00 0 %0.00
Unknown 1,425 %0.28 7 %0.22 1 %0.08
504,560 3,141 1,291100.00% 100.00% 100.00%
23Page

9/11/2015Create Date:
All Alcohol Suspected Drivers in Crashes by Age Group
Percent
Fatal
Drivers
Fatal
Percent
Fatal
Drivers in Fatal
Crashes
Percent
All
Drivers in All
Crashes
Age
Group
15-19 592 %3.69 23 %3.78 16 %3.68
20-24 2,709 %16.88 107 %17.60 74 %17.01
25-29 2,557 %15.94 105 %17.27 74 %17.01
30-34 2,010 %12.53 68 %11.18 50 %11.49
35-39 1,462 %9.11 60 %9.87 39 %8.97
40-44 1,397 %8.71 56 %9.21 43 %9.89
45-49 1,371 %8.55 39 %6.41 26 %5.98
50-54 1,383 %8.62 54 %8.88 33 %7.59
55-59 968 %6.03 39 %6.41 31 %7.13
60-64 573 %3.57 20 %3.29 17 %3.91
65-69 382 %2.38 19 %3.13 17 %3.91
70-74 210 %1.31 8 %1.32 7 %1.61
75-79 68 %0.42 5 %0.82 4 %0.92
80-84 31 %0.19 3 %0.49 2 %0.46
85-89 15 %0.09 1 %0.16 1 %0.23
90+ 5 %0.03 1 %0.16 1 %0.23
Under 15 5 %0.03 0 %0.00 0 %0.00
Unknown 306 %1.91 0 %0.00 0 %0.00
16,044 608 435100.00% 100.00% 100.00%
24Page

9/11/2015Create Date:
Florida Resident Alcohol Suspected Drivers in Crashes by Age Group
Percent
Fatal
Drivers
Fatal
Percent
Fatal
Drivers in Fatal
Crashes
Percent
All
Drivers in All
Crashes
Age
Group
15-19 523 %3.70 20 %3.59 14 %3.54
20-24 2,400 %16.98 100 %17.95 69 %17.47
25-29 2,203 %15.58 90 %16.16 64 %16.20
30-34 1,780 %12.59 59 %10.59 42 %10.63
35-39 1,322 %9.35 56 %10.05 35 %8.86
40-44 1,262 %8.93 53 %9.52 40 %10.13
45-49 1,245 %8.81 37 %6.64 25 %6.33
50-54 1,271 %8.99 52 %9.34 32 %8.10
55-59 902 %6.38 38 %6.82 30 %7.59
60-64 532 %3.76 18 %3.23 15 %3.80
65-69 354 %2.50 17 %3.05 15 %3.80
70-74 197 %1.39 8 %1.44 7 %1.77
75-79 62 %0.44 5 %0.90 4 %1.01
80-84 28 %0.20 2 %0.36 1 %0.25
85-89 14 %0.10 1 %0.18 1 %0.25
90+ 5 %0.04 1 %0.18 1 %0.25
Under 15 2 %0.01 0 %0.00 0 %0.00
Unknown 34 %0.24 0 %0.00 0 %0.00
14,136 557 395100.00% 100.00% 100.00%
25Page

9/11/2015Create Date:
All Drug Suspected Drivers in Crashes by Age Group
Percent
Fatal
Drivers
Fatal
Percent
Fatal
Drivers in Fatal
Crashes
Percent
All
Drivers in All
Crashes
Age
Group
15-19 112 %6.67 11 %6.18 7 %5.34
20-24 224 %13.33 26 %14.61 18 %13.74
25-29 227 %13.51 24 %13.48 17 %12.98
30-34 201 %11.96 16 %8.99 14 %10.69
35-39 149 %8.87 17 %9.55 12 %9.16
40-44 137 %8.15 15 %8.43 10 %7.63
45-49 162 %9.64 17 %9.55 15 %11.45
50-54 162 %9.64 21 %11.80 14 %10.69
55-59 106 %6.31 12 %6.74 6 %4.58
60-64 75 %4.46 8 %4.49 8 %6.11
65-69 43 %2.56 6 %3.37 5 %3.82
70-74 30 %1.79 3 %1.69 3 %2.29
75-79 16 %0.95 1 %0.56 1 %0.76
80-84 4 %0.24 1 %0.56 1 %0.76
85-89 7 %0.42 0 %0.00 0 %0.00
90+ 3 %0.18 0 %0.00 0 %0.00
Under 15 2 %0.12 0 %0.00 0 %0.00
Unknown 20 %1.19 0 %0.00 0 %0.00
1,680 178 131100.00% 100.00% 100.00%
26Page

9/11/2015Create Date:
Florida Resident Drug Suspected Drivers in Crashes by Age Group
Percent
Fatal
Drivers
Fatal
Percent
Fatal
Drivers in Fatal
Crashes
Percent
All
Drivers in All
Crashes
Age
Group
15-19 102 %6.65 10 %6.21 6 %5.04
20-24 205 %13.36 23 %14.29 15 %12.61
25-29 205 %13.36 22 %13.66 17 %14.29
30-34 188 %12.26 16 %9.94 14 %11.76
35-39 138 %9.00 14 %8.70 10 %8.40
40-44 123 %8.02 15 %9.32 10 %8.40
45-49 152 %9.91 16 %9.94 14 %11.76
50-54 152 %9.91 19 %11.80 13 %10.92
55-59 99 %6.45 9 %5.59 4 %3.36
60-64 67 %4.37 7 %4.35 7 %5.88
65-69 43 %2.80 6 %3.73 5 %4.20
70-74 28 %1.83 2 %1.24 2 %1.68
75-79 14 %0.91 1 %0.62 1 %0.84
80-84 3 %0.20 1 %0.62 1 %0.84
85-89 7 %0.46 0 %0.00 0 %0.00
90+ 3 %0.20 0 %0.00 0 %0.00
Under 15 2 %0.13 0 %0.00 0 %0.00
Unknown 3 %0.20 0 %0.00 0 %0.00
1,534 161 119100.00% 100.00% 100.00%
27Page

9/11/2015Create Date:
All Drivers in Crashes - Select Ages 15-29
Percent
Fatal
Drivers
Fatal
Percent
Fatal
Drivers in Fatal
Crashes
Percent
All
Drivers in All
Crashes
Person
Age
15 564 %0.31 2 %0.19 1 %0.22
16 4,758 %2.65 19 %1.80 3 %0.66
17 8,326 %4.63 34 %3.22 8 %1.75
18 13,009 %7.24 66 %6.24 27 %5.91
19 14,497 %8.07 83 %7.85 32 %7.00
20 14,862 %8.27 64 %6.05 33 %7.22
21 15,154 %8.43 97 %9.18 45 %9.85
22 15,117 %8.41 108 %10.22 46 %10.07
23 15,131 %8.42 88 %8.33 44 %9.63
24 14,698 %8.18 102 %9.65 46 %10.07
25 14,116 %7.85 95 %8.99 41 %8.97
26 13,449 %7.48 81 %7.66 36 %7.88
27 12,362 %6.88 77 %7.28 33 %7.22
28 11,953 %6.65 72 %6.81 30 %6.56
29 11,748 %6.54 69 %6.53 32 %7.00
179,744 1,057 457100.00% 100.00% 100.00%
28Page

9/11/2015Create Date:
Florida Resident Drivers in Crashes - Select Ages 15-29
Percent
Fatal
Drivers
Fatal
Percent
Fatal
Drivers in Fatal
Crashes
Percent
All
Drivers in All
Crashes
Person
Age
15 377 %0.23 1 %0.10 0 %0.00
16 4,517 %2.73 15 %1.56 3 %0.71
17 7,933 %4.79 30 %3.12 6 %1.43
18 12,351 %7.46 60 %6.23 25 %5.94
19 13,561 %8.19 77 %8.00 28 %6.65
20 13,752 %8.31 60 %6.23 32 %7.60
21 14,019 %8.47 95 %9.87 44 %10.45
22 13,802 %8.34 102 %10.59 42 %9.98
23 13,871 %8.38 80 %8.31 41 %9.74
24 13,371 %8.08 93 %9.66 43 %10.21
25 12,823 %7.75 90 %9.35 39 %9.26
26 12,297 %7.43 69 %7.17 30 %7.13
27 11,274 %6.81 65 %6.75 30 %7.13
28 10,890 %6.58 64 %6.65 28 %6.65
29 10,720 %6.48 62 %6.44 30 %7.13
165,558 963 421100.00% 100.00% 100.00%
29Page

9/11/2015Create Date:
All Alcohol Suspected Drivers in Crashes - Select Ages 15-29
Percent
Fatal
Drivers
Fatal
Percent
Fatal
Drivers in Fatal
Crashes
Percent
All
Drivers in All
Crashes
Person
Age
15 7 %0.12 0 %0.00 0 %0.00
16 22 %0.38 0 %0.00 0 %0.00
17 80 %1.37 5 %2.13 4 %2.44
18 199 %3.40 8 %3.40 5 %3.05
19 284 %4.85 10 %4.26 7 %4.27
20 358 %6.11 7 %2.98 5 %3.05
21 614 %10.48 30 %12.77 22 %13.41
22 592 %10.11 24 %10.21 19 %11.59
23 563 %9.61 25 %10.64 15 %9.15
24 582 %9.94 21 %8.94 13 %7.93
25 569 %9.71 32 %13.62 23 %14.02
26 544 %9.29 26 %11.06 13 %7.93
27 490 %8.36 14 %5.96 9 %5.49
28 483 %8.25 17 %7.23 14 %8.54
29 471 %8.04 16 %6.81 15 %9.15
5,858 235 164100.00% 100.00% 100.00%
30Page

9/11/2015Create Date:
Florida Resident Alcohol Suspected Drivers in Crashes - Select Ages 15-29
Percent
Fatal
Drivers
Fatal
Percent
Fatal
Drivers in Fatal
Crashes
Percent
All
Drivers in All
Crashes
Person
Age
15 3 %0.06 0 %0.00 0 %0.00
16 17 %0.33 0 %0.00 0 %0.00
17 72 %1.40 4 %1.90 3 %2.04
18 175 %3.41 7 %3.33 5 %3.40
19 256 %4.99 9 %4.29 6 %4.08
20 313 %6.11 7 %3.33 5 %3.40
21 559 %10.91 29 %13.81 21 %14.29
22 523 %10.20 24 %11.43 19 %12.93
23 497 %9.70 23 %10.95 13 %8.84
24 508 %9.91 17 %8.10 11 %7.48
25 490 %9.56 29 %13.81 21 %14.29
26 471 %9.19 21 %10.00 10 %6.80
27 420 %8.19 10 %4.76 7 %4.76
28 419 %8.17 16 %7.62 13 %8.84
29 403 %7.86 14 %6.67 13 %8.84
5,126 210 147100.00% 100.00% 100.00%
31Page

9/11/2015Create Date:
All Drug Suspected Drivers in Crashes - Select Ages 15-29
Percent
Fatal
Drivers
Fatal
Percent
Fatal
Drivers in Fatal
Crashes
Percent
All
Drivers in All
Crashes
Person
Age
15 1 %0.18 0 %0.00 0 %0.00
16 6 %1.07 1 %1.64 0 %0.00
17 12 %2.13 0 %0.00 0 %0.00
18 37 %6.57 5 %8.20 3 %7.14
19 56 %9.95 5 %8.20 4 %9.52
20 50 %8.88 6 %9.84 4 %9.52
21 43 %7.64 3 %4.92 2 %4.76
22 35 %6.22 4 %6.56 3 %7.14
23 46 %8.17 9 %14.75 7 %16.67
24 50 %8.88 4 %6.56 2 %4.76
25 47 %8.35 6 %9.84 3 %7.14
26 52 %9.24 3 %4.92 2 %4.76
27 40 %7.10 5 %8.20 5 %11.90
28 50 %8.88 5 %8.20 4 %9.52
29 38 %6.75 5 %8.20 3 %7.14
563 61 42100.00% 100.00% 100.00%
32Page

9/11/2015Create Date:
Florida Resident Drug Suspected Drivers in Crashes - Select Ages 15-29
Percent
Fatal
Drivers
Fatal
Percent
Fatal
Drivers in Fatal
Crashes
Percent
All
Drivers in All
Crashes
Person
Age
15 1 %0.20 0 %0.00 0 %0.00
16 5 %0.98 1 %1.82 0 %0.00
17 10 %1.95 0 %0.00 0 %0.00
18 34 %6.64 4 %7.27 2 %5.26
19 52 %10.16 5 %9.09 4 %10.53
20 46 %8.98 5 %9.09 3 %7.89
21 40 %7.81 3 %5.45 2 %5.26
22 31 %6.05 2 %3.64 1 %2.63
23 44 %8.59 9 %16.36 7 %18.42
24 44 %8.59 4 %7.27 2 %5.26
25 42 %8.20 5 %9.09 3 %7.89
26 47 %9.18 3 %5.45 2 %5.26
27 38 %7.42 5 %9.09 5 %13.16
28 44 %8.59 5 %9.09 4 %10.53
29 34 %6.64 4 %7.27 3 %7.89
512 55 38100.00% 100.00% 100.00%
33Page

9/11/2015Create Date:
All Drivers in Crashes - Select Ages 65+
Percent
Fatal
Drivers
Fatal
Percent
Fatal
Drivers in Fatal
Crashes
Percent
All
Drivers in All
Crashes
Person
Age
65 5,079 %8.37 45 %8.62 16 %6.40
66 4,850 %7.99 32 %6.13 13 %5.20
67 4,843 %7.98 34 %6.51 15 %6.00
68 4,005 %6.60 38 %7.28 17 %6.80
69 3,621 %5.97 26 %4.98 13 %5.20
70 3,511 %5.79 28 %5.36 10 %4.00
71 3,470 %5.72 27 %5.17 12 %4.80
72 3,073 %5.06 26 %4.98 12 %4.80
73 2,761 %4.55 17 %3.26 7 %2.80
74 2,517 %4.15 18 %3.45 9 %3.60
75 2,374 %3.91 12 %2.30 4 %1.60
76 2,227 %3.67 18 %3.45 10 %4.00
77 2,081 %3.43 19 %3.64 7 %2.80
78 1,996 %3.29 15 %2.87 6 %2.40
79 1,825 %3.01 15 %2.87 8 %3.20
80 1,642 %2.71 12 %2.30 6 %2.40
81 1,443 %2.38 19 %3.64 9 %3.60
82 1,440 %2.37 14 %2.68 7 %2.80
83 1,337 %2.20 11 %2.11 7 %2.80
84 1,180 %1.94 8 %1.53 3 %1.20
85 1,040 %1.71 11 %2.11 5 %2.00
86 925 %1.52 13 %2.49 9 %3.60
87 788 %1.30 9 %1.72 8 %3.20
88 652 %1.07 11 %2.11 7 %2.80
89 570 %0.94 7 %1.34 4 %1.60
90+ 1,422 %2.34 37 %7.09 26 %10.40
60,672 522 250100.00% 100.00% 100.00%
34Page

9/11/2015Create Date:
Florida Resident Drivers in Crashes - Select Ages 65+
Percent
Fatal
Drivers
Fatal
Percent
Fatal
Drivers in Fatal
Crashes
Percent
All
Drivers in All
Crashes
Person
Age
65 4,634 %8.44 41 %8.91 14 %6.33
66 4,367 %7.96 26 %5.65 10 %4.52
67 4,373 %7.97 30 %6.52 13 %5.88
68 3,570 %6.51 35 %7.61 16 %7.24
69 3,242 %5.91 25 %5.43 13 %5.88
70 3,106 %5.66 21 %4.57 8 %3.62
71 3,118 %5.68 24 %5.22 11 %4.98
72 2,749 %5.01 20 %4.35 10 %4.52
73 2,488 %4.53 14 %3.04 5 %2.26
74 2,254 %4.11 17 %3.70 9 %4.07
75 2,152 %3.92 10 %2.17 4 %1.81
76 1,991 %3.63 16 %3.48 9 %4.07
77 1,898 %3.46 19 %4.13 7 %3.17
78 1,831 %3.34 13 %2.83 5 %2.26
79 1,657 %3.02 15 %3.26 8 %3.62
80 1,459 %2.66 8 %1.74 4 %1.81
81 1,327 %2.42 17 %3.70 7 %3.17
82 1,301 %2.37 14 %3.04 7 %3.17
83 1,236 %2.25 11 %2.39 7 %3.17
84 1,079 %1.97 7 %1.52 3 %1.36
85 967 %1.76 9 %1.96 5 %2.26
86 850 %1.55 9 %1.96 5 %2.26
87 753 %1.37 8 %1.74 7 %3.17
88 606 %1.10 9 %1.96 5 %2.26
89 525 %0.96 7 %1.52 4 %1.81
90+ 1,343 %2.45 35 %7.61 25 %11.31
54,876 460 221100.00% 100.00% 100.00%
35Page

9/11/2015Create Date:
All Alcohol Suspected Drivers in Crashes - Select Ages 65+
Percent
Fatal
Drivers
Fatal
Percent
Fatal
Drivers in Fatal
Crashes
Percent
All
Drivers in All
Crashes
Person
Age
65 94 %13.22 4 %10.81 4 %12.50
66 76 %10.69 4 %10.81 3 %9.38
67 98 %13.78 3 %8.11 3 %9.38
68 65 %9.14 5 %13.51 5 %15.63
69 49 %6.89 3 %8.11 2 %6.25
70 51 %7.17 0 %0.00 0 %0.00
71 47 %6.61 4 %10.81 4 %12.50
72 42 %5.91 1 %2.70 1 %3.13
73 37 %5.20 1 %2.70 1 %3.13
74 33 %4.64 2 %5.41 1 %3.13
75 15 %2.11 2 %5.41 2 %6.25
76 18 %2.53 1 %2.70 1 %3.13
77 20 %2.81 2 %5.41 1 %3.13
78 9 %1.27 0 %0.00 0 %0.00
79 6 %0.84 0 %0.00 0 %0.00
80 5 %0.70 1 %2.70 1 %3.13
81 9 %1.27 1 %2.70 1 %3.13
82 9 %1.27 0 %0.00 0 %0.00
83 4 %0.56 1 %2.70 0 %0.00
84 4 %0.56 0 %0.00 0 %0.00
85 7 %0.98 0 %0.00 0 %0.00
86 2 %0.28 0 %0.00 0 %0.00
87 1 %0.14 0 %0.00 0 %0.00
88 3 %0.42 0 %0.00 0 %0.00
89 2 %0.28 1 %2.70 1 %3.13
90+ 5 %0.70 1 %2.70 1 %3.13
711 37 32100.00% 100.00% 100.00%
36Page

9/11/2015Create Date:
Florida Resident Alcohol Suspected Drivers in Crashes - Select Ages 65+
Percent
Fatal
Drivers
Fatal
Percent
Fatal
Drivers in Fatal
Crashes
Percent
All
Drivers in All
Crashes
Person
Age
65 90 %13.64 4 %11.76 4 %13.79
66 70 %10.61 3 %8.82 2 %6.90
67 91 %13.79 3 %8.82 3 %10.34
68 56 %8.48 4 %11.76 4 %13.79
69 47 %7.12 3 %8.82 2 %6.90
70 47 %7.12 0 %0.00 0 %0.00
71 45 %6.82 4 %11.76 4 %13.79
72 40 %6.06 1 %2.94 1 %3.45
73 36 %5.45 1 %2.94 1 %3.45
74 29 %4.39 2 %5.88 1 %3.45
75 14 %2.12 2 %5.88 2 %6.90
76 18 %2.73 1 %2.94 1 %3.45
77 17 %2.58 2 %5.88 1 %3.45
78 8 %1.21 0 %0.00 0 %0.00
79 5 %0.76 0 %0.00 0 %0.00
80 5 %0.76 1 %2.94 1 %3.45
81 8 %1.21 0 %0.00 0 %0.00
82 7 %1.06 0 %0.00 0 %0.00
83 4 %0.61 1 %2.94 0 %0.00
84 4 %0.61 0 %0.00 0 %0.00
85 7 %1.06 0 %0.00 0 %0.00
86 1 %0.15 0 %0.00 0 %0.00
87 1 %0.15 0 %0.00 0 %0.00
88 3 %0.45 0 %0.00 0 %0.00
89 2 %0.30 1 %2.94 1 %3.45
90+ 5 %0.76 1 %2.94 1 %3.45
660 34 29100.00% 100.00% 100.00%
37Page

9/11/2015Create Date:
All Drug Suspected Drivers in Crashes - Select Ages 65+
Percent
Fatal
Drivers
Fatal
Percent
Fatal
Drivers in Fatal
Crashes
Percent
All
Drivers in All
Crashes
Person
Age
65 15 %14.56 2 %18.18 2 %20.00
66 10 %9.71 1 %9.09 1 %10.00
67 8 %7.77 1 %9.09 0 %0.00
68 6 %5.83 2 %18.18 2 %20.00
69 4 %3.88 0 %0.00 0 %0.00
70 6 %5.83 2 %18.18 2 %20.00
71 7 %6.80 0 %0.00 0 %0.00
72 8 %7.77 0 %0.00 0 %0.00
73 5 %4.85 1 %9.09 1 %10.00
74 4 %3.88 0 %0.00 0 %0.00
75 4 %3.88 0 %0.00 0 %0.00
76 4 %3.88 0 %0.00 0 %0.00
77 3 %2.91 1 %9.09 1 %10.00
78 3 %2.91 0 %0.00 0 %0.00
79 2 %1.94 0 %0.00 0 %0.00
80 2 %1.94 0 %0.00 0 %0.00
82 1 %0.97 1 %9.09 1 %10.00
83 1 %0.97 0 %0.00 0 %0.00
85 2 %1.94 0 %0.00 0 %0.00
86 1 %0.97 0 %0.00 0 %0.00
87 1 %0.97 0 %0.00 0 %0.00
88 2 %1.94 0 %0.00 0 %0.00
89 1 %0.97 0 %0.00 0 %0.00
90+ 3 %2.91 0 %0.00 0 %0.00
103 11 10100.00% 100.00% 100.00%
38Page

9/11/2015Create Date:
Florida Resident Drug Suspected Drivers in Crashes - Select Ages 65+
Percent
Fatal
Drivers
Fatal
Percent
Fatal
Drivers in Fatal
Crashes
Percent
All
Drivers in All
Crashes
Person
Age
65 15 %15.31 2 %20.00 2 %22.22
66 10 %10.20 1 %10.00 1 %11.11
67 8 %8.16 1 %10.00 0 %0.00
68 6 %6.12 2 %20.00 2 %22.22
69 4 %4.08 0 %0.00 0 %0.00
70 5 %5.10 1 %10.00 1 %11.11
71 6 %6.12 0 %0.00 0 %0.00
72 8 %8.16 0 %0.00 0 %0.00
73 5 %5.10 1 %10.00 1 %11.11
74 4 %4.08 0 %0.00 0 %0.00
75 4 %4.08 0 %0.00 0 %0.00
76 4 %4.08 0 %0.00 0 %0.00
77 1 %1.02 1 %10.00 1 %11.11
78 3 %3.06 0 %0.00 0 %0.00
79 2 %2.04 0 %0.00 0 %0.00
80 1 %1.02 0 %0.00 0 %0.00
82 1 %1.02 1 %10.00 1 %11.11
83 1 %1.02 0 %0.00 0 %0.00
85 2 %2.04 0 %0.00 0 %0.00
86 1 %1.02 0 %0.00 0 %0.00
87 1 %1.02 0 %0.00 0 %0.00
88 2 %2.04 0 %0.00 0 %0.00
89 1 %1.02 0 %0.00 0 %0.00
90+ 3 %3.06 0 %0.00 0 %0.00
98 10 9100.00% 100.00% 100.00%
39Page

9/11/2015Create Date:
Initial Driver Actions
Initial Driver Action Percent Fatal
Percent Property Damage
Vehicle or Property Damage
Percent Injury
InjuryFatal
Improper Passing 30 885%1.21 %0.58 1,520 %0.85
Exceeded Posted Speed 89 603%3.58 %0.39 294 %0.16
Failed to Keep in Proper Lane 128 3,432%5.15 %2.25 5,301 %2.96
Improper Backing 29 2,662%1.17 %1.74 8,745 %4.88
Disregarded Other Traffic Sign 10 203%0.40 %0.13 194 %0.11
Drove too Fast for Conditions 54 3,419%2.17 %2.24 3,426 %1.91
Failed to Yield Right of Way 449 26,562%18.05 %17.39 18,604 %10.39
Other Contributing Action 306 14,460%12.30 %9.47 22,212 %12.40
Over Correcting/Over Steering 16 714%0.64 %0.47 841 %0.47
Ran Red Light 62 5,359%2.49 %3.51 3,361 %1.88
Ran Stop Sign 40 2,860%1.61 %1.87 2,079 %1.16
Disregarded Other Road Markings 4 93%0.16 %0.06 116 %0.06
Followed too Closely 5 8,883%0.20 %5.82 7,661 %4.28
Improper Turn 35 3,071%1.41 %2.01 4,033 %2.25
Operated MV in Careless or Negligent Manner
647 57,741%26.02 %37.80 56,860 %31.75
Operated MV in Erratic, Reckless or Aggressive Manner
63 852%2.53 %0.56 968 %0.54
Ran off Roadway 130 2,320%5.23 %1.52 2,925 %1.63
Swerved or Avoided : Due to Wind, Slippery Surface, MV, Object, Non-Motorist in Roadway, etc.
16 1,154%0.64 %0.76 1,300 %0.73
Unknown 315 16,908%12.67 %11.07 38,163 %21.31
Wrong Side of Wrong Way 59 576%2.37 %0.38 470 %0.26
Note: In the 2014 Crash Facts, fatalities and injuries may be counted in one or more driver action, due to the fact that a single crash can have multiple drivers. Therefore, the total number of fatals, injuries and property damage crashes are not indicative of the true totals listed in the crash summary.
40Page

9/11/2015Create Date:
50,255
257
954
9
538
11
552
8
460
7
418
4
585
7
1,476
13
2,714
12
2,964
8
2,304
9
2,301
9
2,596
5
50,663
292
750
11
488
9
460
6
361
5
337
5
512
10
1,413
17
2,958
8
3,219
7
2,503
9
2,377
12
2,571
10
51,222
320
836
12
557
5
511
9
410
6
412
2
542
9
1,411
10
2,813
8
3,236
11
2,417
17
2,241
15
2,599
10
51,065
297
907
14
583
3
647
14
441
8
401
6
615
4
1,441
10
2,764
10
3,007
10
2,329
4
2,332
14
2,498
13
56,874
367
1,033
15
737
6
785
14
579
8
532
13
654
6
1,409
18
2,414
10
2,853
10
2,303
11
2,330
15
2,710
5
46,476
428
1,713
32
1,432
22
1,648
30
1,274
23
942
8
914
13
893
15
1,044
9
1,286
15
1,625
9
2,011
7
2,399
7
37,615
375
1,713
31
1,363
23
1,510
22
1,238
25
919
8
786
14
734
13
759
7
892
7
1,070
8
1,516
6
1,703
8
344,170
2,336
7,906
124
5,698
79
6,113
103
4,763
82
3,961
46
4,608
63
8,777
96
15,466
64
17,457
68
14,551
67
15,108
78
17,076
58
Total
Midnight
1
2
3
4
5
6
7
8
9
10
11
TotalSUNDAYSATURDAYFRIDAYTHURSDAYWEDNESDAYTUESDAYMONDAY
Crashes by Hour and Day
Top number for each hour/day is the total crash count. Bottom number is the fatal crash count.
41Page

9/11/2015Create Date:
3,116
12
3,154
13
3,534
10
3,919
10
3,922
11
4,177
8
3,239
23
2,124
18
1,740
14
1,526
19
1,104
9
838
8
3,089
9
3,060
9
3,434
6
3,985
13
4,046
18
4,329
18
3,343
21
2,144
17
1,803
21
1,502
19
1,141
18
838
14
3,042
13
3,132
11
3,509
8
3,755
14
3,922
14
4,245
14
3,541
22
2,332
24
1,893
24
1,671
22
1,223
21
972
19
3,018
10
2,921
18
3,300
16
3,800
13
4,005
14
4,371
18
3,342
18
2,307
12
1,882
19
1,690
17
1,394
18
1,070
14
3,244
16
3,330
7
3,854
16
4,371
10
4,518
15
4,504
17
3,787
23
2,834
25
2,314
31
2,163
25
1,968
29
1,648
22
2,725
15
2,750
10
2,823
9
2,875
15
2,703
14
2,579
13
2,667
23
2,424
20
2,184
28
2,059
32
1,832
25
1,674
34
2,089
9
2,161
13
2,231
10
2,250
6
2,257
18
2,285
22
2,329
23
1,977
22
1,899
31
1,633
24
1,286
14
1,015
11
20,323
84
20,508
81
22,685
75
24,955
81
25,373
104
26,490
110
22,248
153
16,142
138
13,715
168
12,244
158
9,948
134
8,055
122
Noon
13
14
15
16
17
18
19
20
21
22
23
TotalSUNDAYSATURDAYFRIDAYTHURSDAYWEDNESDAYTUESDAYMONDAY
42Page

9/11/2015Create Date:
Weather Conditions at Time of Crash
Weather Condition Percent Fatal
Percent Property Damage
Vehicle or Property Damage
Percent Injury
InjuryCrash
FatalCrash
Blowing Sand, Soil, Dirt 0 3%0.00 %0.00 2 %0.00
Clear 1,705 105,959%72.99 %70.91 136,072 %70.72
Cloudy 426 26,460%18.24 %17.71 28,690 %14.91
Fog, Smog, Smoke 17 708%0.73 %0.47 866 %0.45
Other, Explain in Narrative 8 381%0.34 %0.25 4,006 %2.08
Rain 179 15,819%7.66 %10.59 20,426 %10.62
Severe Crosswinds 0 9%0.00 %0.01 25 %0.01
Sleet/Hail/Freezing Rain 1 34%0.04 %0.02 62 %0.03
Unknown 0 53%0.00 %0.04 2,259 %1.17
43Page

9/11/2015Create Date:
Road Surface Conditions at Time of Crash
Road Surface Condition Percent Fatal
Percent Property Damage
Vehicle or Property Damage
Percent Injury
InjuryCrashes
FatalCrashes
Dry 2,004 123,563%85.79 %82.69 153,478 %79.77
Ice/Frost 1 48%0.04 %0.03 120 %0.06
Mud, Dirt, Gravel 15 336%0.64 %0.22 599 %0.31
Oil 0 21%0.00 %0.01 9 %0.00
Other, Explain in Narrative 1 84%0.04 %0.06 258 %0.13
Sand 1 79%0.04 %0.05 98 %0.05
Unknown 0 50%0.00 %0.03 2,303 %1.20
Unknown 6 408%0.26 %0.27 4,109 %2.14
Water (standing/moving) 5 63%0.21 %0.04 146 %0.08
Wet 303 24,774%12.97 %16.58 31,288 %16.26
Lighting Conditions at Time of Crash
Lighting Condition Percent FatalCrash
Percent Property Damage
Vehicle or Property Damage
Percent InjuryCrash
InjuryCrash
FatalCrashes
Dark-Lighted 712 28,082%30.48 %18.79 40,233 %20.91
Dark-Not Lighted 568 9,854%24.32 %6.59 12,384 %6.44
Dark-Unknown Lighting 3 265%0.13 %0.18 688 %0.36
Dawn 53 2,463%2.27 %1.65 3,032 %1.58
Daylight 913 103,240%39.08 %69.09 123,058 %63.96
Dusk 80 4,974%3.42 %3.33 5,662 %2.94
NOT SPECIFIED 0 51%0.00 %0.03 2,293 %1.19
Other, Explain in Narrative 2 100%0.09 %0.07 274 %0.14
Unknown 5 397%0.21 %0.27 4,784 %2.49
44Page
9/11/2015Create Date:
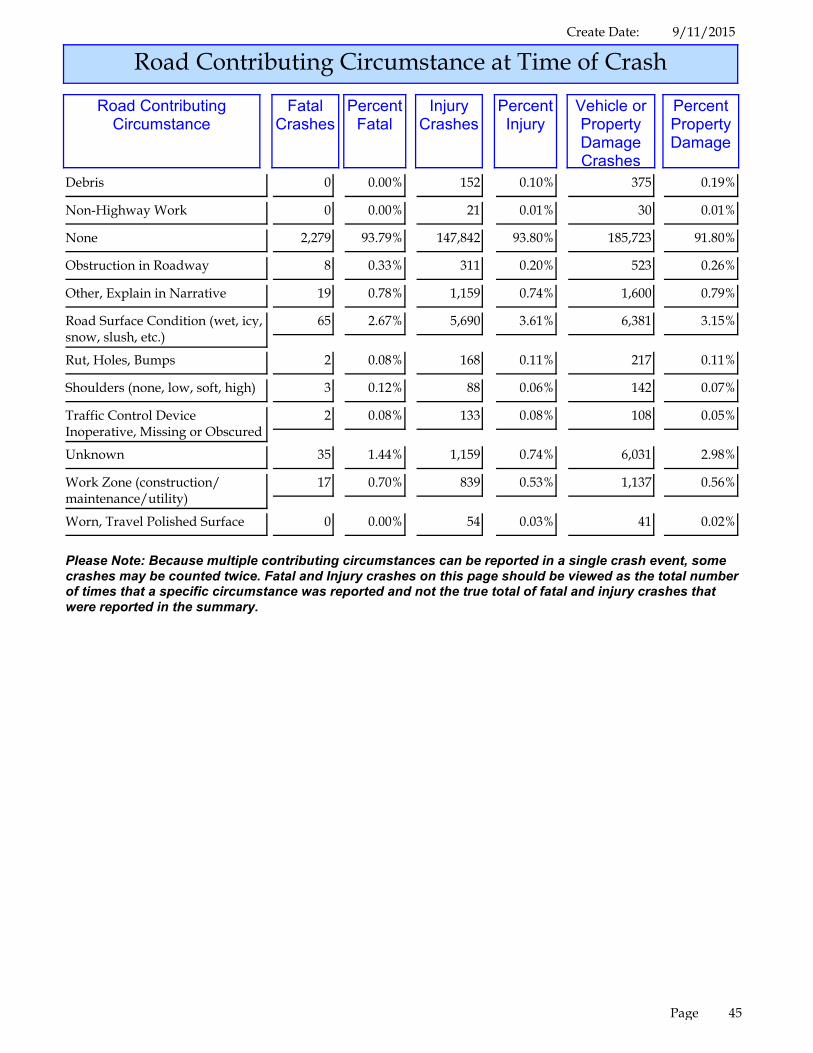
Road Contributing Circumstance at Time of Crash
Road Contributing Circumstance
Percent Fatal
Percent Property Damage
Vehicle or Property Damage Crashes
Percent Injury
Injury Crashes
Fatal Crashes
Debris 0 152%0.00 %0.10 375 %0.19
Non-Highway Work 0 21%0.00 %0.01 30 %0.01
None 2,279 147,842%93.79 %93.80 185,723 %91.80
Obstruction in Roadway 8 311%0.33 %0.20 523 %0.26
Other, Explain in Narrative 19 1,159%0.78 %0.74 1,600 %0.79
Road Surface Condition (wet, icy, snow, slush, etc.)
65 5,690%2.67 %3.61 6,381 %3.15
Rut, Holes, Bumps 2 168%0.08 %0.11 217 %0.11
Shoulders (none, low, soft, high) 3 88%0.12 %0.06 142 %0.07
Traffic Control Device Inoperative, Missing or Obscured
2 133%0.08 %0.08 108 %0.05
Unknown 35 1,159%1.44 %0.74 6,031 %2.98
Work Zone (construction/ maintenance/utility)
17 839%0.70 %0.53 1,137 %0.56
Worn, Travel Polished Surface 0 54%0.00 %0.03 41 %0.02
Please Note: Because multiple contributing circumstances can be reported in a single crash event, some crashes may be counted twice. Fatal and Injury crashes on this page should be viewed as the total number of times that a specific circumstance was reported and not the true total of fatal and injury crashes that were reported in the summary.
45Page

9/11/2015Create Date:
Traffic Crashes by Road Type
Road Type Percent FatalCrash
Percent Property Damage
Vehicle or Property Damage
Percent InjuryCrash
InjuryCrash
FatalCrash
County 488 29,139%20.89 %19.50 31,606 %16.43
Forest Road 3 51%0.13 %0.03 57 %0.03
Interstate 210 12,429%8.99 %8.32 16,942 %8.81
Local 503 42,823%21.53 %28.66 56,206 %29.21
NOT SPECIFIED 0 74%0.00 %0.05 1,762 %0.92
Other, Explain in Narrative 7 778%0.30 %0.52 3,469 %1.80
Parking Lot 5 4,995%0.21 %3.34 23,995 %12.47
Private Roadway 8 1,141%0.34 %0.76 2,748 %1.43
State 686 41,136%29.37 %27.53 39,112 %20.33
Turnpike/Toll 33 1,894%1.41 %1.27 3,299 %1.71
U.S. 393 14,966%16.82 %10.02 13,212 %6.87
46Page

9/11/2015Create Date:
Vehicle Initial Harmful Event
Vehicle Initial Harmful Event
(Collision With)
Percent FatalCrash
Percent Property Damage
Property Damage
Percent InjuryCrash
InjuryCrash
FatalCrash
Animal 1 388%0.04 %0.26 1,186 %0.62
Bridge Overhead Structure 1 21%0.04 %0.01 94 %0.05
Bridge Pier or Support 3 35%0.13 %0.02 44 %0.02
Bridge Rail 4 114%0.17 %0.08 179 %0.09
Cable Barrier 0 55%0.00 %0.04 252 %0.13
Cargo/Equipment Loss or Shift 1 60%0.04 %0.04 284 %0.15
Concrete Traffic Barrier 17 1,430%0.73 %0.96 2,083 %1.08
Cross Centerline 0 3%0.00 %0.00 12 %0.01
Cross Median 0 4%0.00 %0.00 8 %0.00
Culvert 9 259%0.39 %0.17 245 %0.13
Curb 73 1,586%3.13 %1.06 2,383 %1.24
Ditch 19 858%0.81 %0.57 1,270 %0.66
Downhill Runaway 0 1%0.00 %0.00 0 %0.00
Embankment 8 164%0.34 %0.11 187 %0.10
Equipment Failure (blown tire, brake failure, etc.)
0 3%0.00 %0.00 1 %0.00
Fell/Jumped From Motor Vehicle 13 514%0.56 %0.34 53 %0.03
Fence 16 666%0.68 %0.45 2,120 %1.10
Fire/Explosion 0 17%0.00 %0.01 161 %0.08
Guardrail End 7 215%0.30 %0.14 299 %0.16
Guardrail Face 26 1,400%1.11 %0.94 2,517 %1.31
Immersion 2 33%0.09 %0.02 106 %0.06
Impact Attenuator/Crash Cushion
4 158%0.17 %0.11 213 %0.11
Jackknife 0 95%0.00 %0.06 227 %0.12
Mailbox 14 346%0.60 %0.23 1,278 %0.66
Motor Vehicle in Transport 998 115,484%42.72 %77.29 135,478 %70.41
Other Fixed Object (wall, building, tunnel, etc.)
23 1,352%0.98 %0.90 3,528 %1.83
Other Non-Collision 52 1,961%2.23 %1.31 1,986 %1.03
Other Non-Fixed Object Collision with Non-Fixed ObjectNon-Collision Fixed Object
12 611%0.51 %0.41 1,694 %0.88
47Page

9/11/2015Create Date:
Other Post, Pole, or Support 6 436%0.26 %0.29 1,441 %0.75
Other Traffic Barrier 3 129%0.13 %0.09 407 %0.21
Overturn/Rollover 109 3,576%4.67 %2.39 2,191 %1.14
Parked Motor Vehicle 21 1,872%0.90 %1.25 19,119 %9.94
Pedalcycle 117 4,185%5.01 %2.80 239 %0.12
Pedestrian 520 6,004%22.26 %4.02 271 %0.14
Railway Vehicle (train, engine) 5 43%0.21 %0.03 60 %0.03
Ran into Water/ Canal 17 148%0.73 %0.10 375 %0.19
Ran Off Roadway, Left 0 21%0.00 %0.01 24 %0.01
Ran Off Roadway, Right 1 29%0.04 %0.02 33 %0.02
Struck By Falling, Shifting Cargo or Anything Set in Motion by Motor Vehicle
1 74%0.04 %0.05 495 %0.26
Thrown or Falling Object 0 31%0.00 %0.02 133 %0.07
Traffic Sign Support 15 446%0.64 %0.30 1,325 %0.69
Traffic Signal Support 2 59%0.09 %0.04 139 %0.07
Tree (standing) 162 2,952%6.93 %1.98 3,208 %1.67
Unknown 0 74%0.00 %0.05 2,360 %1.23
Utility Pole/Light Support 52 1,449%2.23 %0.97 2,574 %1.34
Work Zone/Maintenance Equipment
2 65%0.09 %0.04 126 %0.07
48Page

9/11/2015Create Date:
Crashes by Vehicle Type
Vehicle Type Percent Fatal
Percent Property Damage
Vehicle or Property Damage
Percent Injury
InjuryFatal
Unknown 856 18,388%19.13 %6.07 22,547 %6.16
All Terrain Vehicle (ATV) 17 391%0.38 %0.13 113 %0.03
Bus 19 1,363%0.42 %0.45 5,983 %1.63
Cargo Van (10,000 lbs or less) 25 1,681%0.56 %0.55 2,257 %0.62
Farm Labor Vehicle 0 56%0.00 %0.02 84 %0.02
Low Speed Vehicle 5 258%0.11 %0.09 239 %0.07
Medium/Heavy Trucks (more than 10,000 lbs)
184 4,320%4.11 %1.43 20,583 %5.62
Moped 21 1,339%0.47 %0.44 224 %0.06
Motor Coach 1 47%0.02 %0.02 143 %0.04
Motor Home 4 132%0.09 %0.04 230 %0.06
Motorcycle 465 8,406%10.39 %2.77 1,277 %0.35
Other Light Trucks (10,000 lbs or less)
29 2,247%0.65 %0.74 3,752 %1.03
Other, Explain in Narrative 23 1,358%0.51 %0.45 2,394 %0.65
Passenger Car 1,577 168,331%35.25 %55.54 188,257 %51.44
Passenger Van 179 14,439%4.00 %4.76 14,142 %3.86
Pickup 515 30,818%11.51 %10.17 35,428 %9.68
Sport Utility Vehicle (SUV) 534 47,111%11.94 %15.54 47,665 %13.02
Unknown 20 2,422%0.45 %0.80 20,661 %5.65
Note: In the 2014 Crash Facts, the Crashes by Vehicle Type table has been modified to exclude the column totals. This change was made to better accommodate the purpose of these tables and to show statistics on individual vehicle types as opposed to injury and fatality totals. In fact, a single crash can encompass multiple vehicle types, leading to the potential for crashes being counted more than once in the grand total. A true overall total for fatalities and injuries can be found in the summary table at the beginning of the Crash Facts publication.
49Page

9/11/2015Create Date:
Total Crash History by County
2 Year
Average
Percent
Change
County 2013 2014
Alachua %-9.85 4,4224,651 4,193
Baker %-16.04 270293 246
Bay %-5.04 3,4263,514 3,337
Bradford %24.55 247220 274
Brevard %8.22 7,3707,079 7,661
Broward %6.87 33,71432,595 34,833
Calhoun %-11.84 143152 134
Charlotte %7.17 2,1662,091 2,241
Citrus %8.16 1,4161,360 1,471
Clay %6.57 2,5142,434 2,594
Collier %11.91 4,1213,889 4,352
Columbia %4.54 1,1721,146 1,198
DeSoto %18.18 348319 377
Dixie %1.99 153151 154
Duval %0.07 20,19120,184 20,198
Escambia %3.97 5,9565,840 6,072
Flagler %13.08 1,1331,063 1,202
Franklin %-15.15 9299 84
Gadsden %-4.24 554566 542
Gilchrist %3.23 158155 160
Glades %-4.79 143146 139
Gulf %-4.86 141144 137
Hamilton %-24.03 205233 177
Hardee %6.73 323312 333
Hendry %-21.36 289323 254
Hernando %5.43 1,9301,879 1,981
Highlands %7.89 1,028989 1,067
Hillsborough %7.49 22,22221,420 23,024
Holmes %-6.33 230237 222
Indian River %31.54 1,8541,601 2,106
50Page

9/11/2015Create Date:
Jackson %-5.59 644662 625
Jefferson %1.84 219217 221
Lafayette %-32.56 3643 29
Lake %7.71 3,5443,412 3,675
Lee %14.66 8,5387,955 9,121
Leon %9.52 6,2515,967 6,535
Levy %7.92 460442 477
Liberty %2.60 7877 79
Madison %-17.48 298326 269
Manatee %12.93 5,2144,897 5,530
Marion %8.52 5,2535,038 5,467
Martin %8.59 2,1122,025 2,199
Miami-Dade %13.56 56,57352,981 60,165
Monroe %6.02 2,0551,995 2,115
Nassau %18.98 814743 884
Okaloosa %3.19 2,9612,914 3,007
Okeechobee %10.37 507482 532
Orange %10.98 25,12023,812 26,427
Osceola %17.31 4,0993,772 4,425
Palm Beach %6.95 23,50222,712 24,291
Pasco %6.79 6,5616,345 6,776
Pinellas %8.15 16,72416,069 17,378
Polk %14.81 9,1548,523 9,785
Putnam %8.06 968930 1,005
Santa Rosa %-4.92 1,6471,688 1,605
Sarasota %5.80 5,3265,176 5,476
Seminole %7.57 5,9685,750 6,185
St. Johns %7.07 2,8272,730 2,923
St. Lucie %32.75 3,4112,931 3,891
Sumter %74.45 994724 1,263
Suwannee %11.41 556526 586
Taylor %30.81 229198 259
Union %-8.80 120125 114
Unknown %0.00 00 0
Volusia %4.16 8,2158,047 8,382
51Page

9/11/2015Create Date:
Wakulla %27.82 283248 317
Walton %3.58 1,1081,088 1,127
Washington %-9.03 275288 262
316,943 344,170 %8.59 330,557
52Page

9/11/2015Create Date:
Fatality History by County
2 Year
Average
Percent
Change
20142013County
Alachua 33 30 %-9.09 32
Baker 9 2 %-77.78 6
Bay 17 30 %76.47 24
Bradford 5 4 %-20.00 5
Brevard 76 65 %-14.47 71
Broward 180 173 %-3.89 177
Calhoun 1 2 %100.00 2
Charlotte 22 19 %-13.64 21
Citrus 17 26 %52.94 22
Clay 10 18 %80.00 14
Collier 33 39 %18.18 36
Columbia 17 15 %-11.76 16
DeSoto 2 7 %250.00 5
Dixie 9 2 %-77.78 6
Duval 133 120 %-9.77 127
Escambia 45 43 %-4.44 44
Flagler 16 24 %50.00 20
Franklin 2 2 %0.00 2
Gadsden 12 6 %-50.00 9
Gilchrist 4 3 %-25.00 4
Glades 8 3 %-62.50 6
Gulf 2 2 %0.00 2
Hamilton 3 6 %100.00 5
Hardee 5 10 %100.00 8
Hendry 11 8 %-27.27 10
Hernando 29 20 %-31.03 25
Highlands 21 21 %0.00 21
Hillsborough 171 158 %-7.60 165
Holmes 6 5 %-16.67 6
53Page

9/11/2015Create Date:
Indian River 22 22 %0.00 22
Jackson 9 18 %100.00 14
Jefferson 6 1 %-83.33 4
Lafayette 5 0 %-100.00 3
Lake 48 41 %-14.58 45
Lee 92 81 %-11.96 87
Leon 18 33 %83.33 26
Levy 21 13 %-38.10 17
Liberty 2 1 %-50.00 2
Madison 9 4 %-55.56 7
Manatee 40 49 %22.50 45
Marion 47 55 %17.02 51
Martin 15 20 %33.33 18
Miami-Dade 224 280 %25.00 252
Monroe 20 11 %-45.00 16
Nassau 10 17 %70.00 14
Okaloosa 22 29 %31.82 26
Okeechobee 12 9 %-25.00 11
Orange 123 143 %16.26 133
Osceola 42 50 %19.05 46
Palm Beach 137 130 %-5.11 134
Pasco 55 71 %29.09 63
Pinellas 83 116 %39.76 100
Polk 94 113 %20.21 104
Putnam 19 20 %5.26 20
Santa Rosa 31 18 %-41.94 25
Sarasota 31 31 %0.00 31
Seminole 44 30 %-31.82 37
St. Johns 31 39 %25.81 35
St. Lucie 33 38 %15.15 36
Sumter 19 20 %5.26 20
Suwannee 13 17 %30.77 15
Taylor 6 6 %0.00 6
Union 2 1 %-50.00 2
54Page
9/11/2015Create Date:
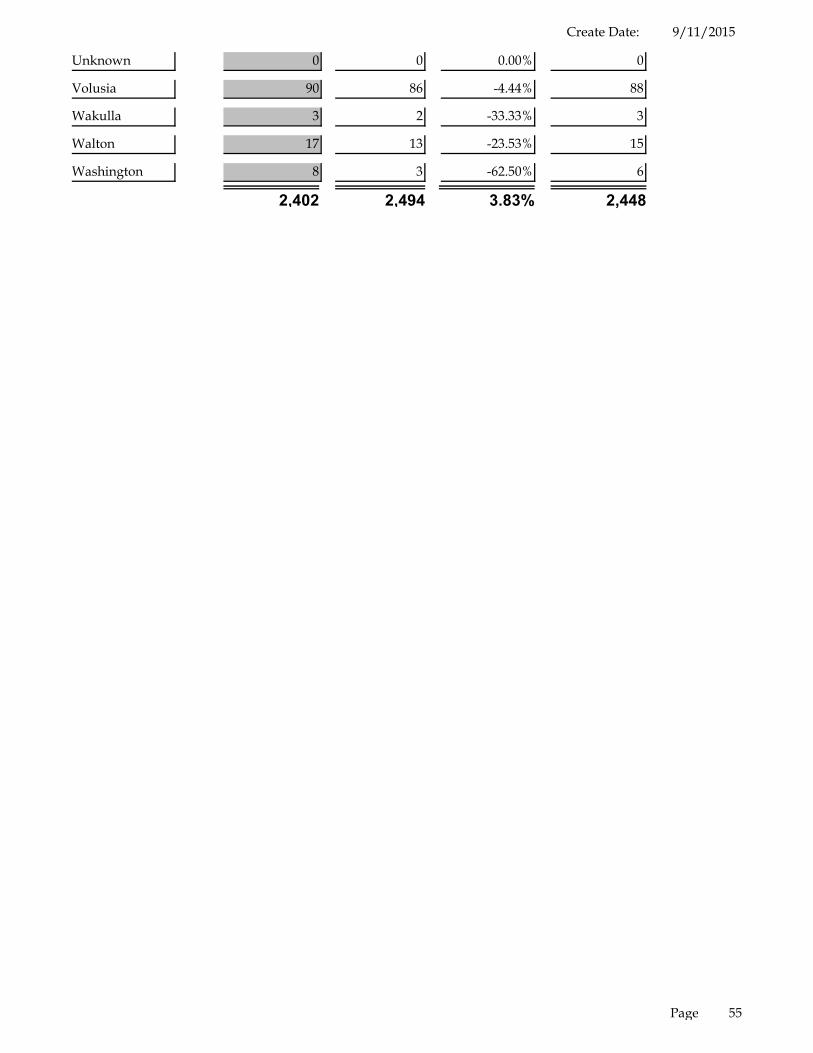
Unknown 0 0 %0.00 0
Volusia 90 86 %-4.44 88
Wakulla 3 2 %-33.33 3
Walton 17 13 %-23.53 15
Washington 8 3 %-62.50 6
2,402 2,494 %3.83 2,448
55Page
9/11/2015Create Date:
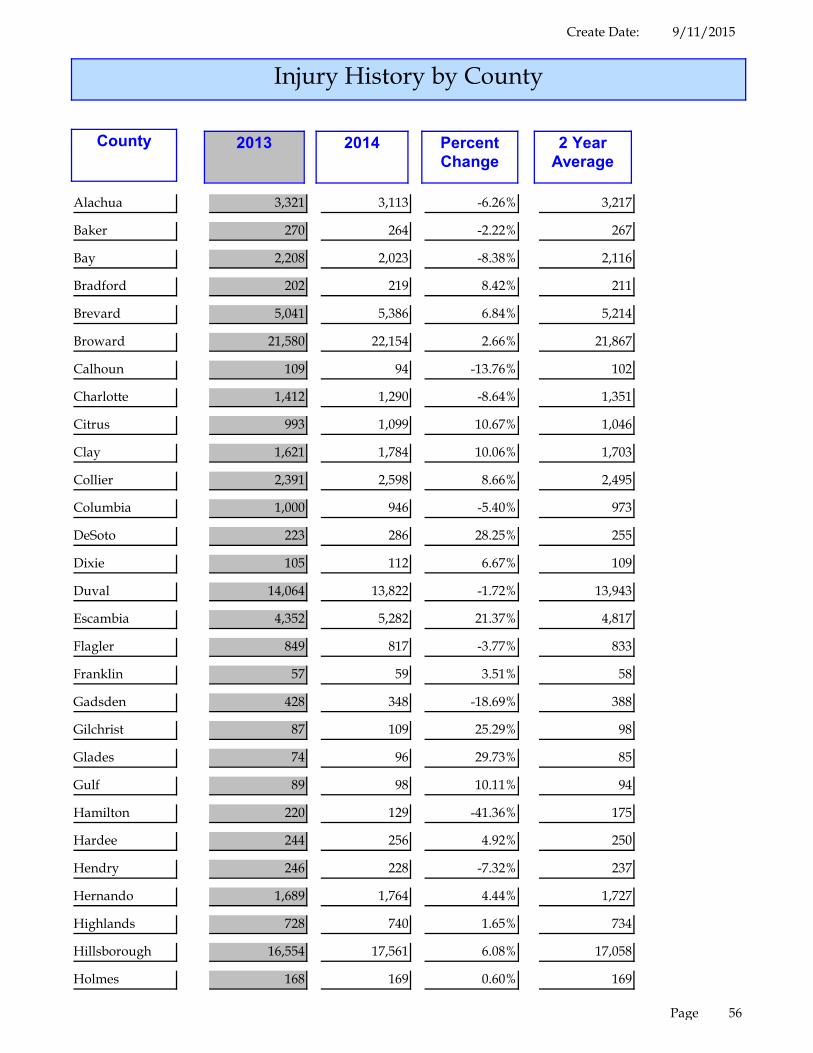
Injury History by County
2 Year
Average
Percent
Change
20142013County
Alachua 3,321 3,113 %-6.26 3,217
Baker 270 264 %-2.22 267
Bay 2,208 2,023 %-8.38 2,116
Bradford 202 219 %8.42 211
Brevard 5,041 5,386 %6.84 5,214
Broward 21,580 22,154 %2.66 21,867
Calhoun 109 94 %-13.76 102
Charlotte 1,412 1,290 %-8.64 1,351
Citrus 993 1,099 %10.67 1,046
Clay 1,621 1,784 %10.06 1,703
Collier 2,391 2,598 %8.66 2,495
Columbia 1,000 946 %-5.40 973
DeSoto 223 286 %28.25 255
Dixie 105 112 %6.67 109
Duval 14,064 13,822 %-1.72 13,943
Escambia 4,352 5,282 %21.37 4,817
Flagler 849 817 %-3.77 833
Franklin 57 59 %3.51 58
Gadsden 428 348 %-18.69 388
Gilchrist 87 109 %25.29 98
Glades 74 96 %29.73 85
Gulf 89 98 %10.11 94
Hamilton 220 129 %-41.36 175
Hardee 244 256 %4.92 250
Hendry 246 228 %-7.32 237
Hernando 1,689 1,764 %4.44 1,727
Highlands 728 740 %1.65 734
Hillsborough 16,554 17,561 %6.08 17,058
Holmes 168 169 %0.60 169
56Page

9/11/2015Create Date:
Indian River 1,035 1,241 %19.90 1,138
Jackson 483 407 %-15.73 445
Jefferson 144 121 %-15.97 133
Lafayette 27 35 %29.63 31
Lake 2,531 2,642 %4.39 2,587
Lee 5,472 6,157 %12.52 5,815
Leon 3,435 3,617 %5.30 3,526
Levy 306 384 %25.49 345
Liberty 50 51 %2.00 51
Madison 208 128 %-38.46 168
Manatee 3,845 3,823 %-0.57 3,834
Marion 3,153 3,606 %14.37 3,380
Martin 1,228 1,321 %7.57 1,275
Miami-Dade 28,666 31,752 %10.77 30,209
Monroe 1,254 1,243 %-0.88 1,249
Nassau 510 628 %23.14 569
Okaloosa 1,812 1,853 %2.26 1,833
Okeechobee 317 360 %13.56 339
Orange 16,203 17,939 %10.71 17,071
Osceola 3,261 3,885 %19.14 3,573
Palm Beach 14,294 15,068 %5.41 14,681
Pasco 6,254 6,993 %11.82 6,624
Pinellas 9,217 10,009 %8.59 9,613
Polk 5,829 6,854 %17.58 6,342
Putnam 817 866 %6.00 842
Santa Rosa 1,515 1,463 %-3.43 1,489
Sarasota 3,370 3,485 %3.41 3,428
Seminole 3,979 4,355 %9.45 4,167
St. Johns 2,032 2,063 %1.53 2,048
St. Lucie 1,864 2,616 %40.34 2,240
Sumter 529 784 %48.20 657
Suwannee 337 342 %1.48 340
Taylor 149 183 %22.82 166
Union 95 131 %37.89 113
57Page

9/11/2015Create Date:
Unknown 0 0 %0.00 0
Volusia 5,210 5,251 %0.79 5,231
Wakulla 181 231 %27.62 206
Walton 720 703 %-2.36 712
Washington 230 172 %-25.22 201
210,887 225,608 %6.98 218,248
58Page

9/11/2015Create Date:
Property Damage Only History by County
2 Year
Average
Percent
Change
20142013County
Alachua 2,420 2,205 %-8.88 2,313
Baker 137 104 %-24.09 121
Bay 2,077 1,999 %-3.76 2,038
Bradford 71 150 %111.27 111
Brevard 3,603 3,890 %7.97 3,747
Broward 17,935 19,511 %8.79 18,723
Calhoun 83 68 %-18.07 76
Charlotte 1,115 1,328 %19.10 1,222
Citrus 684 710 %3.80 697
Clay 1,325 1,409 %6.34 1,367
Collier 2,166 2,476 %14.31 2,321
Columbia 562 606 %7.83 584
DeSoto 170 194 %14.12 182
Dixie 74 75 %1.35 75
Duval 10,994 11,032 %0.35 11,013
Escambia 3,154 3,110 %-1.40 3,132
Flagler 466 619 %32.83 543
Franklin 54 40 %-25.93 47
Gadsden 301 309 %2.66 305
Gilchrist 85 91 %7.06 88
Glades 83 74 %-10.84 79
Gulf 90 76 %-15.56 83
Hamilton 134 101 %-24.63 118
Hardee 172 165 %-4.07 169
Hendry 155 124 %-20.00 140
Hernando 794 872 %9.82 833
Highlands 496 538 %8.47 517
Hillsborough 10,055 11,019 %9.59 10,537
Holmes 128 108 %-15.63 118
Indian River 892 1,249 %40.02 1,071
59Page

9/11/2015Create Date:
Jackson 363 348 %-4.13 356
Jefferson 123 135 %9.76 129
Lafayette 18 11 %-38.89 15
Lake 1,741 1,880 %7.98 1,811
Lee 4,155 5,020 %20.82 4,588
Leon 3,518 3,972 %12.91 3,745
Levy 229 233 %1.75 231
Liberty 36 41 %13.89 39
Madison 190 175 %-7.89 183
Manatee 2,481 2,997 %20.80 2,739
Marion 2,894 3,145 %8.67 3,020
Martin 1,133 1,257 %10.94 1,195
Miami-Dade 33,596 38,701 %15.20 36,149
Monroe 1,057 1,201 %13.62 1,129
Nassau 409 467 %14.18 438
Okaloosa 1,637 1,730 %5.68 1,684
Okeechobee 273 289 %5.86 281
Orange 12,669 14,189 %12.00 13,429
Osceola 1,700 1,975 %16.18 1,838
Palm Beach 12,955 14,030 %8.30 13,493
Pasco 2,752 2,889 %4.98 2,821
Pinellas 9,404 10,241 %8.90 9,823
Polk 4,523 5,170 %14.30 4,847
Putnam 432 445 %3.01 439
Santa Rosa 771 715 %-7.26 743
Sarasota 2,795 2,999 %7.30 2,897
Seminole 3,033 3,279 %8.11 3,156
St. Johns 1,481 1,653 %11.61 1,567
St. Lucie 1,639 2,146 %30.93 1,893
Sumter 369 724 %96.21 547
Suwannee 283 345 %21.91 314
Taylor 89 143 %60.67 116
Union 58 37 %-36.21 48
Unknown 0 0 %0.00 0
60Page

9/11/2015Create Date:
Volusia 4,339 4,607 %6.18 4,473
Wakulla 126 167 %32.54 147
Walton 614 670 %9.12 642
Washington 140 130 %-7.14 135
174,500 192,408 %10.00 183,454
61Page
9/11/2015Create Date:
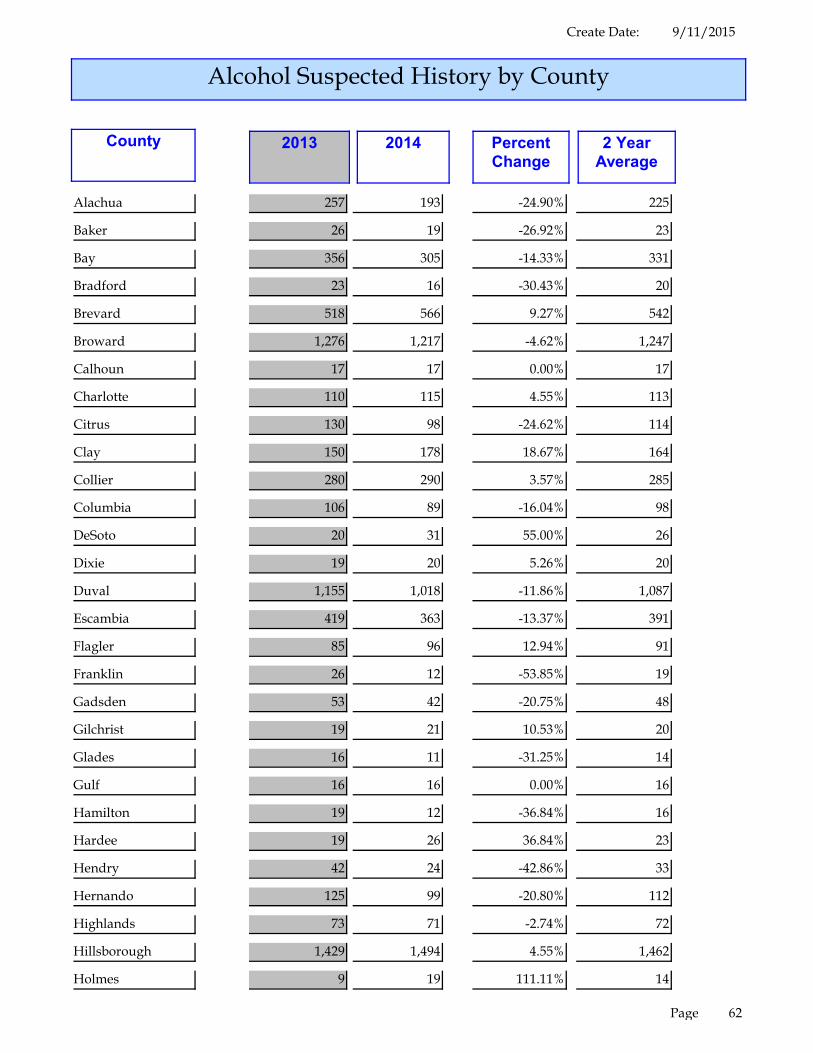
Alcohol Suspected History by County
2 Year
Average
Percent
Change
20142013County
Alachua 257 193 %-24.90 225
Baker 26 19 %-26.92 23
Bay 356 305 %-14.33 331
Bradford 23 16 %-30.43 20
Brevard 518 566 %9.27 542
Broward 1,276 1,217 %-4.62 1,247
Calhoun 17 17 %0.00 17
Charlotte 110 115 %4.55 113
Citrus 130 98 %-24.62 114
Clay 150 178 %18.67 164
Collier 280 290 %3.57 285
Columbia 106 89 %-16.04 98
DeSoto 20 31 %55.00 26
Dixie 19 20 %5.26 20
Duval 1,155 1,018 %-11.86 1,087
Escambia 419 363 %-13.37 391
Flagler 85 96 %12.94 91
Franklin 26 12 %-53.85 19
Gadsden 53 42 %-20.75 48
Gilchrist 19 21 %10.53 20
Glades 16 11 %-31.25 14
Gulf 16 16 %0.00 16
Hamilton 19 12 %-36.84 16
Hardee 19 26 %36.84 23
Hendry 42 24 %-42.86 33
Hernando 125 99 %-20.80 112
Highlands 73 71 %-2.74 72
Hillsborough 1,429 1,494 %4.55 1,462
Holmes 9 19 %111.11 14
62Page

9/11/2015Create Date:
Indian River 90 143 %58.89 117
Jackson 33 44 %33.33 39
Jefferson 19 26 %36.84 23
Lafayette 7 4 %-42.86 6
Lake 245 204 %-16.73 225
Lee 576 650 %12.85 613
Leon 345 328 %-4.93 337
Levy 39 51 %30.77 45
Liberty 7 6 %-14.29 7
Madison 19 19 %0.00 19
Manatee 316 334 %5.70 325
Marion 247 247 %0.00 247
Martin 203 202 %-0.49 203
Miami-Dade 1,496 1,437 %-3.94 1,467
Monroe 177 186 %5.08 182
Nassau 61 58 %-4.92 60
Okaloosa 280 256 %-8.57 268
Okeechobee 44 35 %-20.45 40
Orange 920 892 %-3.04 906
Osceola 171 156 %-8.77 164
Palm Beach 1,264 1,220 %-3.48 1,242
Pasco 392 325 %-17.09 359
Pinellas 932 943 %1.18 938
Polk 420 396 %-5.71 408
Putnam 73 90 %23.29 82
Santa Rosa 137 140 %2.19 139
Sarasota 360 407 %13.06 384
Seminole 286 331 %15.73 309
St. Johns 213 225 %5.63 219
St. Lucie 155 200 %29.03 178
Sumter 51 54 %5.88 53
Suwannee 53 55 %3.77 54
Taylor 25 29 %16.00 27
Union 18 13 %-27.78 16
63Page

9/11/2015Create Date:
Unknown 0 0 %0.00 0
Volusia 515 537 %4.27 526
Wakulla 26 52 %100.00 39
Walton 100 85 %-15.00 93
Washington 20 15 %-25.00 18
17,128 16,873 %-1.49 17,001
Note: Alcohol Suspected History tables were omitted from the 2013 Crash Facts publication and added back in 2014. For this reason, the totals found in these History tables may not directly align those which occur in the Summary. Therefore it is important to exercise caution when comparing the 2013 Alcohol Suspected numbers to those found in the Summary
64Page
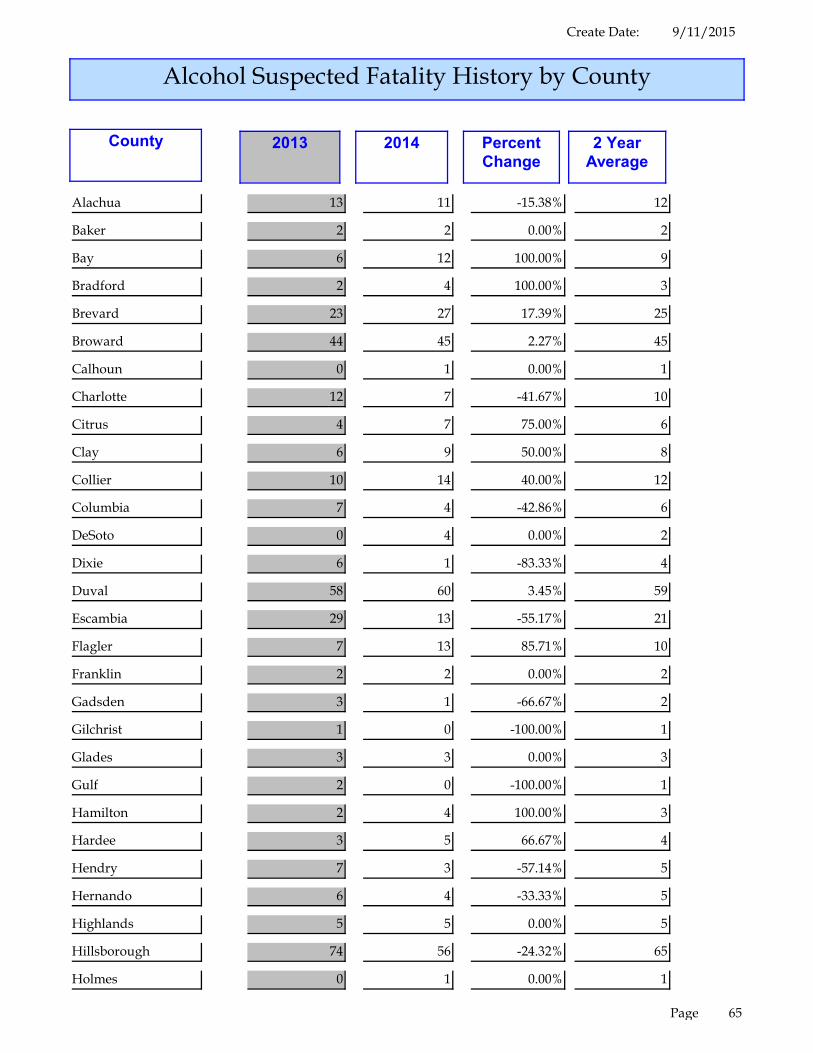
9/11/2015Create Date:
Alcohol Suspected Fatality History by County
2 Year
Average
Percent
Change
20142013County
Alachua 13 11 %-15.38 12
Baker 2 2 %0.00 2
Bay 6 12 %100.00 9
Bradford 2 4 %100.00 3
Brevard 23 27 %17.39 25
Broward 44 45 %2.27 45
Calhoun 0 1 %0.00 1
Charlotte 12 7 %-41.67 10
Citrus 4 7 %75.00 6
Clay 6 9 %50.00 8
Collier 10 14 %40.00 12
Columbia 7 4 %-42.86 6
DeSoto 0 4 %0.00 2
Dixie 6 1 %-83.33 4
Duval 58 60 %3.45 59
Escambia 29 13 %-55.17 21
Flagler 7 13 %85.71 10
Franklin 2 2 %0.00 2
Gadsden 3 1 %-66.67 2
Gilchrist 1 0 %-100.00 1
Glades 3 3 %0.00 3
Gulf 2 0 %-100.00 1
Hamilton 2 4 %100.00 3
Hardee 3 5 %66.67 4
Hendry 7 3 %-57.14 5
Hernando 6 4 %-33.33 5
Highlands 5 5 %0.00 5
Hillsborough 74 56 %-24.32 65
Holmes 0 1 %0.00 1
65Page

9/11/2015Create Date:
Indian River 3 10 %233.33 7
Jackson 5 3 %-40.00 4
Jefferson 2 0 %-100.00 1
Lafayette 3 0 %-100.00 2
Lake 28 15 %-46.43 22
Lee 35 27 %-22.86 31
Leon 9 15 %66.67 12
Levy 5 8 %60.00 7
Liberty 1 0 %-100.00 1
Madison 3 2 %-33.33 3
Manatee 21 23 %9.52 22
Marion 15 21 %40.00 18
Martin 8 5 %-37.50 7
Miami-Dade 44 52 %18.18 48
Monroe 10 4 %-60.00 7
Nassau 4 4 %0.00 4
Okaloosa 8 10 %25.00 9
Okeechobee 8 6 %-25.00 7
Orange 45 55 %22.22 50
Osceola 16 17 %6.25 17
Palm Beach 51 33 %-35.29 42
Pasco 23 16 %-30.43 20
Pinellas 27 45 %66.67 36
Polk 32 36 %12.50 34
Putnam 9 11 %22.22 10
Santa Rosa 14 8 %-42.86 11
Sarasota 15 11 %-26.67 13
Seminole 17 12 %-29.41 15
St. Johns 7 13 %85.71 10
St. Lucie 6 14 %133.33 10
Sumter 4 5 %25.00 5
Suwannee 7 4 %-42.86 6
Taylor 2 1 %-50.00 2
Union 1 1 %0.00 1
66Page

9/11/2015Create Date:
Unknown 0 0 %0.00 0
Volusia 29 33 %13.79 31
Wakulla 1 2 %100.00 2
Walton 9 9 %0.00 9
Washington 1 0 %-100.00 1
865 849 %-1.85 857
Note: Alcohol Suspected History tables were omitted from the 2013 Crash Facts publication and added back in 2014. For this reason, the totals found in these History tables may not directly align those which occur in the Summary. Therefore it is important to exercise caution when comparing the 2013 Alcohol Suspected numbers to those found in the Summary
67Page

9/11/2015Create Date:
Alcohol Suspected Injury History by County
2 Year
Average
Percent
Change
20142013County
Alachua 187 140 %-25.13 164
Baker 20 13 %-35.00 17
Bay 178 196 %10.11 187
Bradford 20 12 %-40.00 16
Brevard 348 357 %2.59 353
Broward 864 890 %3.01 877
Calhoun 20 17 %-15.00 19
Charlotte 67 66 %-1.49 67
Citrus 62 60 %-3.23 61
Clay 81 106 %30.86 94
Collier 159 178 %11.95 169
Columbia 85 55 %-35.29 70
DeSoto 16 28 %75.00 22
Dixie 14 9 %-35.71 12
Duval 779 689 %-11.55 734
Escambia 305 295 %-3.28 300
Flagler 65 79 %21.54 72
Franklin 16 10 %-37.50 13
Gadsden 34 31 %-8.82 33
Gilchrist 6 16 %166.67 11
Glades 10 7 %-30.00 9
Gulf 14 12 %-14.29 13
Hamilton 21 20 %-4.76 21
Hardee 15 17 %13.33 16
Hendry 29 14 %-51.72 22
Hernando 97 64 %-34.02 81
Highlands 30 32 %6.67 31
Hillsborough 963 1,027 %6.65 995
Holmes 8 14 %75.00 11
68Page

9/11/2015Create Date:
Indian River 47 72 %53.19 60
Jackson 22 22 %0.00 22
Jefferson 13 19 %46.15 16
Lafayette 6 5 %-16.67 6
Lake 178 145 %-18.54 162
Lee 386 386 %0.00 386
Leon 259 223 %-13.90 241
Levy 19 32 %68.42 26
Liberty 4 1 %-75.00 3
Madison 14 11 %-21.43 13
Manatee 198 225 %13.64 212
Marion 186 193 %3.76 190
Martin 106 115 %8.49 111
Miami-Dade 916 917 %0.11 917
Monroe 138 104 %-24.64 121
Nassau 29 49 %68.97 39
Okaloosa 148 127 %-14.19 138
Okeechobee 15 23 %53.33 19
Orange 613 600 %-2.12 607
Osceola 109 96 %-11.93 103
Palm Beach 893 859 %-3.81 876
Pasco 337 288 %-14.54 313
Pinellas 588 543 %-7.65 566
Polk 305 271 %-11.15 288
Putnam 44 78 %77.27 61
Santa Rosa 91 95 %4.40 93
Sarasota 230 248 %7.83 239
Seminole 198 218 %10.10 208
St. Johns 130 128 %-1.54 129
St. Lucie 109 145 %33.03 127
Sumter 27 41 %51.85 34
Suwannee 37 35 %-5.41 36
Taylor 12 16 %33.33 14
Union 20 12 %-40.00 16
69Page

9/11/2015Create Date:
Unknown 0 0 %0.00 0
Volusia 303 309 %1.98 306
Wakulla 18 34 %88.89 26
Walton 91 62 %-31.87 77
Washington 16 9 %-43.75 13
11,368 11,210 %-1.39 11,289
Note: Alcohol Suspected History tables were omitted from the 2013 Crash Facts publication and added back in 2014. For this reason, the totals found in these History tables may not directly align those which occur in the Summary. Therefore it is important to exercise caution when comparing the 2013 Alcohol Suspected numbers to those found in the Summary
70Page

9/11/2015Create Date:
Motorcycle Crash History by County
2 Year
Average
Percent
Change
20142013County
Alachua 151 113 %-25.17 132
Baker 6 8 %33.33 7
Bay 149 135 %-9.40 142
Bradford 14 7 %-50.00 11
Brevard 342 333 %-2.63 338
Broward 724 742 %2.49 733
Calhoun 3 2 %-33.33 3
Charlotte 81 81 %0.00 81
Citrus 94 95 %1.06 95
Clay 101 84 %-16.83 93
Collier 120 99 %-17.50 110
Columbia 22 17 %-22.73 20
DeSoto 9 16 %77.78 13
Dixie 5 5 %0.00 5
Duval 513 451 %-12.09 482
Escambia 176 149 %-15.34 163
Flagler 56 75 %33.93 66
Franklin 7 2 %-71.43 5
Gadsden 8 5 %-37.50 7
Gilchrist 3 8 %166.67 6
Glades 3 8 %166.67 6
Gulf 4 1 %-75.00 3
Hamilton 5 5 %0.00 5
Hardee 13 11 %-15.38 12
Hendry 5 6 %20.00 6
Hernando 120 102 %-15.00 111
Highlands 34 33 %-2.94 34
Hillsborough 700 665 %-5.00 683
Holmes 7 4 %-42.86 6
71Page

9/11/2015Create Date:
Indian River 60 55 %-8.33 58
Jackson 12 8 %-33.33 10
Jefferson 3 7 %133.33 5
Lafayette 1 1 %0.00 1
Lake 153 156 %1.96 155
Lee 292 310 %6.16 301
Leon 120 134 %11.67 127
Levy 20 21 %5.00 21
Liberty 2 3 %50.00 3
Madison 5 6 %20.00 6
Manatee 169 173 %2.37 171
Marion 179 150 %-16.20 165
Martin 85 79 %-7.06 82
Miami-Dade 1,032 1,306 %26.55 1,169
Monroe 241 270 %12.03 256
Nassau 33 26 %-21.21 30
Okaloosa 108 97 %-10.19 103
Okeechobee 7 17 %142.86 12
Orange 670 666 %-0.60 668
Osceola 141 121 %-14.18 131
Palm Beach 479 525 %9.60 502
Pasco 254 260 %2.36 257
Pinellas 579 590 %1.90 585
Polk 282 324 %14.89 303
Putnam 37 34 %-8.11 36
Santa Rosa 58 50 %-13.79 54
Sarasota 179 195 %8.94 187
Seminole 193 161 %-16.58 177
St. Johns 107 112 %4.67 110
St. Lucie 93 124 %33.33 109
Sumter 22 38 %72.73 30
Suwannee 14 14 %0.00 14
Taylor 5 3 %-40.00 4
Union 4 5 %25.00 5
72Page

9/11/2015Create Date:
Unknown 0 0 %0.00 0
Volusia 513 504 %-1.75 509
Wakulla 7 11 %57.14 9
Walton 41 32 %-21.95 37
Washington 7 4 %-42.86 6
9,682 9,854 %1.78 9,768
73Page

9/11/2015Create Date:
Motorcycle Fatality History by County
2 Year
Average
Percent
Change
20142013County
Alachua 7 3 %-57.14 5
Baker 1 1 %0.00 1
Bay 5 8 %60.00 7
Bradford 2 0 %-100.00 1
Brevard 20 8 %-60.00 14
Broward 36 42 %16.67 39
Calhoun 0 0 %0.00 0
Charlotte 6 7 %16.67 7
Citrus 7 4 %-42.86 6
Clay 1 3 %200.00 2
Collier 3 3 %0.00 3
Columbia 1 2 %100.00 2
DeSoto 0 2 %0.00 1
Dixie 1 0 %-100.00 1
Duval 25 21 %-16.00 23
Escambia 4 6 %50.00 5
Flagler 6 6 %0.00 6
Franklin 0 0 %0.00 0
Gadsden 0 0 %0.00 0
Gilchrist 0 0 %0.00 0
Glades 1 0 %-100.00 1
Gulf 0 0 %0.00 0
Hamilton 0 0 %0.00 0
Hardee 1 2 %100.00 2
Hendry 0 0 %0.00 0
Hernando 6 3 %-50.00 5
Highlands 2 4 %100.00 3
Hillsborough 44 31 %-29.55 38
Holmes 1 0 %-100.00 1
74Page

9/11/2015Create Date:
Indian River 4 3 %-25.00 4
Jackson 0 0 %0.00 0
Jefferson 1 0 %-100.00 1
Lafayette 1 0 %-100.00 1
Lake 10 10 %0.00 10
Lee 18 13 %-27.78 16
Leon 2 7 %250.00 5
Levy 2 0 %-100.00 1
Liberty 0 0 %0.00 0
Madison 0 0 %0.00 0
Manatee 10 9 %-10.00 10
Marion 9 8 %-11.11 9
Martin 2 2 %0.00 2
Miami-Dade 45 61 %35.56 53
Monroe 5 4 %-20.00 5
Nassau 0 1 %0.00 1
Okaloosa 4 6 %50.00 5
Okeechobee 0 2 %0.00 1
Orange 26 26 %0.00 26
Osceola 9 7 %-22.22 8
Palm Beach 19 17 %-10.53 18
Pasco 14 11 %-21.43 13
Pinellas 18 31 %72.22 25
Polk 14 16 %14.29 15
Putnam 3 4 %33.33 4
Santa Rosa 6 1 %-83.33 4
Sarasota 5 8 %60.00 7
Seminole 7 6 %-14.29 7
St. Johns 6 6 %0.00 6
St. Lucie 5 7 %40.00 6
Sumter 4 3 %-25.00 4
Suwannee 2 1 %-50.00 2
Taylor 0 0 %0.00 0
Union 1 0 %-100.00 1
75Page

9/11/2015Create Date:
Unknown 0 0 %0.00 0
Volusia 29 22 %-24.14 26
Wakulla 0 0 %0.00 0
Walton 1 1 %0.00 1
Washington 0 0 %0.00 0
462 449 %-2.81 456
Figures include both motorcycle drivers and passengers
76Page

9/11/2015Create Date:
Motorcycle Injury History by County
2 Year
Average
Percent
Change
20142013County
Alachua 140 97 %-30.71 119
Baker 5 8 %60.00 7
Bay 142 124 %-12.68 133
Bradford 13 7 %-46.15 10
Brevard 309 319 %3.24 314
Broward 629 628 %-0.16 629
Calhoun 4 2 %-50.00 3
Charlotte 67 68 %1.49 68
Citrus 101 98 %-2.97 100
Clay 100 82 %-18.00 91
Collier 116 99 %-14.66 108
Columbia 20 14 %-30.00 17
DeSoto 9 19 %111.11 14
Dixie 4 4 %0.00 4
Duval 456 403 %-11.62 430
Escambia 156 126 %-19.23 141
Flagler 51 75 %47.06 63
Franklin 7 2 %-71.43 5
Gadsden 7 6 %-14.29 7
Gilchrist 4 8 %100.00 6
Glades 2 8 %300.00 5
Gulf 4 1 %-75.00 3
Hamilton 7 6 %-14.29 7
Hardee 14 14 %0.00 14
Hendry 5 8 %60.00 7
Hernando 120 97 %-19.17 109
Highlands 35 29 %-17.14 32
Hillsborough 639 623 %-2.50 631
Holmes 8 4 %-50.00 6
77Page

9/11/2015Create Date:
Indian River 45 51 %13.33 48
Jackson 11 8 %-27.27 10
Jefferson 2 6 %200.00 4
Lafayette 1 0 %-100.00 1
Lake 143 140 %-2.10 142
Lee 270 289 %7.04 280
Leon 110 113 %2.73 112
Levy 17 23 %35.29 20
Liberty 2 1 %-50.00 2
Madison 4 7 %75.00 6
Manatee 167 162 %-2.99 165
Marion 162 134 %-17.28 148
Martin 67 76 %13.43 72
Miami-Dade 846 1,075 %27.07 961
Monroe 242 274 %13.22 258
Nassau 29 27 %-6.90 28
Okaloosa 92 94 %2.17 93
Okeechobee 7 16 %128.57 12
Orange 593 606 %2.19 600
Osceola 135 116 %-14.07 126
Palm Beach 414 439 %6.04 427
Pasco 247 241 %-2.43 244
Pinellas 500 497 %-0.60 499
Polk 245 292 %19.18 269
Putnam 38 35 %-7.89 37
Santa Rosa 50 49 %-2.00 50
Sarasota 166 182 %9.64 174
Seminole 174 144 %-17.24 159
St. Johns 113 106 %-6.19 110
St. Lucie 88 108 %22.73 98
Sumter 17 32 %88.24 25
Suwannee 13 13 %0.00 13
Taylor 5 3 %-40.00 4
Union 3 5 %66.67 4
78Page

9/11/2015Create Date:
Unknown 0 0 %0.00 0
Volusia 506 460 %-9.09 483
Wakulla 5 11 %120.00 8
Walton 32 31 %-3.13 32
Washington 7 4 %-42.86 6
8,742 8,849 %1.22 8,796
Figures include both motorcycle drivers and passengers
79Page

9/11/2015Create Date:
Commercial Motor Vehicle Crash History by County
2 Year
Average
Percent
Change
20142013County
Alachua 455 389 %-14.51 422
Baker 47 55 %17.02 51
Bay 411 327 %-20.44 369
Bradford 31 56 %80.65 44
Brevard 658 633 %-3.80 646
Broward 3,556 3,580 %0.67 3,568
Calhoun 16 14 %-12.50 15
Charlotte 166 250 %50.60 208
Citrus 87 114 %31.03 101
Clay 172 201 %16.86 187
Collier 474 529 %11.60 502
Columbia 139 163 %17.27 151
DeSoto 45 62 %37.78 54
Dixie 17 11 %-35.29 14
Duval 1,961 1,970 %0.46 1,966
Escambia 312 328 %5.13 320
Flagler 128 141 %10.16 135
Franklin 7 7 %0.00 7
Gadsden 96 66 %-31.25 81
Gilchrist 10 14 %40.00 12
Glades 44 25 %-43.18 35
Gulf 14 16 %14.29 15
Hamilton 48 48 %0.00 48
Hardee 37 47 %27.03 42
Hendry 49 47 %-4.08 48
Hernando 185 151 %-18.38 168
Highlands 113 102 %-9.73 108
Hillsborough 1,816 2,048 %12.78 1,932
Holmes 36 20 %-44.44 28
80Page

9/11/2015Create Date:
Indian River 230 283 %23.04 257
Jackson 103 86 %-16.50 95
Jefferson 33 35 %6.06 34
Lafayette 3 5 %66.67 4
Lake 390 420 %7.69 405
Lee 645 927 %43.72 786
Leon 518 557 %7.53 538
Levy 37 36 %-2.70 37
Liberty 12 11 %-8.33 12
Madison 63 50 %-20.63 57
Manatee 391 415 %6.14 403
Marion 436 398 %-8.72 417
Martin 219 222 %1.37 221
Miami-Dade 6,866 7,757 %12.98 7,312
Monroe 192 222 %15.63 207
Nassau 109 157 %44.04 133
Okaloosa 205 202 %-1.46 204
Okeechobee 71 95 %33.80 83
Orange 2,083 2,323 %11.52 2,203
Osceola 343 418 %21.87 381
Palm Beach 2,327 2,426 %4.25 2,377
Pasco 438 469 %7.08 454
Pinellas 1,228 1,187 %-3.34 1,208
Polk 1,054 1,192 %13.09 1,123
Putnam 66 81 %22.73 74
Santa Rosa 102 93 %-8.82 98
Sarasota 414 446 %7.73 430
Seminole 508 493 %-2.95 501
St. Johns 363 373 %2.75 368
St. Lucie 365 399 %9.32 382
Sumter 227 224 %-1.32 226
Suwannee 68 72 %5.88 70
Taylor 22 25 %13.64 24
Union 13 18 %38.46 16
81Page

9/11/2015Create Date:
Unknown 0 0 %0.00 0
Volusia 631 722 %14.42 677
Wakulla 13 18 %38.46 16
Walton 116 120 %3.45 118
Washington 21 26 %23.81 24
32,055 34,417 %7.37 33,236
82Page

9/11/2015Create Date:
Commercial Motor Vehicle Fatality History by County
2 Year
Average
Percent
Change
20142013County
Alachua 4 4 %0.00 4
Baker 3 0 %-100.00 2
Bay 0 1 %0.00 1
Bradford 1 3 %200.00 2
Brevard 6 2 %-66.67 4
Broward 8 13 %62.50 11
Calhoun 1 1 %0.00 1
Charlotte 3 1 %-66.67 2
Citrus 1 0 %-100.00 1
Clay 2 0 %-100.00 1
Collier 8 3 %-62.50 6
Columbia 1 0 %-100.00 1
DeSoto 1 0 %-100.00 1
Dixie 0 0 %0.00 0
Duval 11 7 %-36.36 9
Escambia 2 2 %0.00 2
Flagler 2 0 %-100.00 1
Franklin 0 0 %0.00 0
Gadsden 1 1 %0.00 1
Gilchrist 0 2 %0.00 1
Glades 3 0 %-100.00 2
Gulf 0 0 %0.00 0
Hamilton 1 3 %200.00 2
Hardee 1 3 %200.00 2
Hendry 1 1 %0.00 1
Hernando 4 0 %-100.00 2
Highlands 1 1 %0.00 1
Hillsborough 23 15 %-34.78 19
Holmes 0 1 %0.00 1
83Page

9/11/2015Create Date:
Indian River 2 5 %150.00 4
Jackson 0 2 %0.00 1
Jefferson 0 0 %0.00 0
Lafayette 3 0 %-100.00 2
Lake 3 1 %-66.67 2
Lee 9 8 %-11.11 9
Leon 4 7 %75.00 6
Levy 2 1 %-50.00 2
Liberty 0 0 %0.00 0
Madison 0 0 %0.00 0
Manatee 2 6 %200.00 4
Marion 3 8 %166.67 6
Martin 3 2 %-33.33 3
Miami-Dade 15 21 %40.00 18
Monroe 0 0 %0.00 0
Nassau 3 6 %100.00 5
Okaloosa 6 4 %-33.33 5
Okeechobee 1 1 %0.00 1
Orange 8 17 %112.50 13
Osceola 8 7 %-12.50 8
Palm Beach 10 11 %10.00 11
Pasco 3 8 %166.67 6
Pinellas 9 2 %-77.78 6
Polk 14 17 %21.43 16
Putnam 4 2 %-50.00 3
Santa Rosa 2 3 %50.00 3
Sarasota 3 2 %-33.33 3
Seminole 6 2 %-66.67 4
St. Johns 5 8 %60.00 7
St. Lucie 5 2 %-60.00 4
Sumter 4 3 %-25.00 4
Suwannee 0 3 %0.00 2
Taylor 1 0 %-100.00 1
Union 0 0 %0.00 0
84Page

9/11/2015Create Date:
Unknown 0 0 %0.00 0
Volusia 7 9 %28.57 8
Wakulla 0 0 %0.00 0
Walton 3 0 %-100.00 2
Washington 0 0 %0.00 0
237 232 %-2.11 235
85Page

9/11/2015Create Date:
Commercial Motor Vehicle Injury History by County
2 Year
Average
Percent
Change
20142013County
Alachua 186 152 %-18.28 169
Baker 17 41 %141.18 29
Bay 162 78 %-51.85 120
Bradford 22 35 %59.09 29
Brevard 179 199 %11.17 189
Broward 1,067 1,084 %1.59 1,076
Calhoun 11 10 %-9.09 11
Charlotte 55 58 %5.45 57
Citrus 25 36 %44.00 31
Clay 68 59 %-13.24 64
Collier 104 113 %8.65 109
Columbia 104 59 %-43.27 82
DeSoto 17 17 %0.00 17
Dixie 7 6 %-14.29 7
Duval 531 599 %12.81 565
Escambia 161 191 %18.63 176
Flagler 48 35 %-27.08 42
Franklin 1 0 %-100.00 1
Gadsden 40 22 %-45.00 31
Gilchrist 4 9 %125.00 7
Glades 17 21 %23.53 19
Gulf 2 9 %350.00 6
Hamilton 82 30 %-63.41 56
Hardee 35 25 %-28.57 30
Hendry 21 41 %95.24 31
Hernando 75 71 %-5.33 73
Highlands 46 42 %-8.70 44
Hillsborough 801 816 %1.87 809
Holmes 11 7 %-36.36 9
86Page

9/11/2015Create Date:
Indian River 66 79 %19.70 73
Jackson 52 33 %-36.54 43
Jefferson 11 13 %18.18 12
Lafayette 2 11 %450.00 7
Lake 166 140 %-15.66 153
Lee 227 275 %21.15 251
Leon 160 140 %-12.50 150
Levy 11 17 %54.55 14
Liberty 8 4 %-50.00 6
Madison 22 15 %-31.82 19
Manatee 199 120 %-39.70 160
Marion 146 162 %10.96 154
Martin 74 59 %-20.27 67
Miami-Dade 1,335 1,452 %8.76 1,394
Monroe 46 56 %21.74 51
Nassau 59 56 %-5.08 58
Okaloosa 82 39 %-52.44 61
Okeechobee 24 38 %58.33 31
Orange 668 787 %17.81 728
Osceola 126 174 %38.10 150
Palm Beach 656 701 %6.86 679
Pasco 327 231 %-29.36 279
Pinellas 387 420 %8.53 404
Polk 327 437 %33.64 382
Putnam 96 48 %-50.00 72
Santa Rosa 47 32 %-31.91 40
Sarasota 122 93 %-23.77 108
Seminole 137 134 %-2.19 136
St. Johns 87 115 %32.18 101
St. Lucie 70 109 %55.71 90
Sumter 89 72 %-19.10 81
Suwannee 28 15 %-46.43 22
Taylor 5 13 %160.00 9
Union 4 14 %250.00 9
87Page

9/11/2015Create Date:
Unknown 0 0 %0.00 0
Volusia 207 185 %-10.63 196
Wakulla 6 1 %-83.33 4
Walton 44 29 %-34.09 37
Washington 19 9 %-52.63 14
10,041 10,193 %1.51 10,117
88Page

9/11/2015Create Date:
Pedestrian Crash History by County
2 Year
Average
Percent
Change
20142013County
Alachua 113 98 %-13.27 106
Baker 5 1 %-80.00 3
Bay 93 93 %0.00 93
Bradford 4 10 %150.00 7
Brevard 210 209 %-0.48 210
Broward 990 1,061 %7.17 1,026
Calhoun 1 1 %0.00 1
Charlotte 57 64 %12.28 61
Citrus 32 46 %43.75 39
Clay 59 69 %16.95 64
Collier 96 112 %16.67 104
Columbia 26 17 %-34.62 22
DeSoto 8 11 %37.50 10
Dixie 1 2 %100.00 2
Duval 458 430 %-6.11 444
Escambia 119 139 %16.81 129
Flagler 31 23 %-25.81 27
Franklin 3 3 %0.00 3
Gadsden 6 2 %-66.67 4
Gilchrist 6 1 %-83.33 4
Glades 2 1 %-50.00 2
Gulf 4 1 %-75.00 3
Hamilton 3 0 %-100.00 2
Hardee 4 7 %75.00 6
Hendry 11 9 %-18.18 10
Hernando 55 63 %14.55 59
Highlands 24 27 %12.50 26
Hillsborough 529 618 %16.82 574
Holmes 1 1 %0.00 1
89Page

9/11/2015Create Date:
Indian River 37 48 %29.73 43
Jackson 7 11 %57.14 9
Jefferson 1 4 %300.00 3
Lafayette 3 0 %-100.00 2
Lake 91 91 %0.00 91
Lee 239 239 %0.00 239
Leon 191 182 %-4.71 187
Levy 7 9 %28.57 8
Liberty 0 0 %0.00 0
Madison 4 3 %-25.00 4
Manatee 116 144 %24.14 130
Marion 110 94 %-14.55 102
Martin 42 50 %19.05 46
Miami-Dade 1,428 1,522 %6.58 1,475
Monroe 61 58 %-4.92 60
Nassau 16 23 %43.75 20
Okaloosa 59 54 %-8.47 57
Okeechobee 16 13 %-18.75 15
Orange 635 707 %11.34 671
Osceola 99 102 %3.03 101
Palm Beach 663 633 %-4.52 648
Pasco 168 167 %-0.60 168
Pinellas 496 501 %1.01 499
Polk 189 265 %40.21 227
Putnam 29 19 %-34.48 24
Santa Rosa 24 28 %16.67 26
Sarasota 150 151 %0.67 151
Seminole 131 137 %4.58 134
St. Johns 57 58 %1.75 58
St. Lucie 63 97 %53.97 80
Sumter 14 22 %57.14 18
Suwannee 7 7 %0.00 7
Taylor 3 5 %66.67 4
Union 5 1 %-80.00 3
90Page

9/11/2015Create Date:
Unknown 0 0 %0.00 0
Volusia 265 244 %-7.92 255
Wakulla 7 7 %0.00 7
Walton 24 16 %-33.33 20
Washington 2 7 %250.00 5
8,410 8,838 %5.09 8,624
91Page
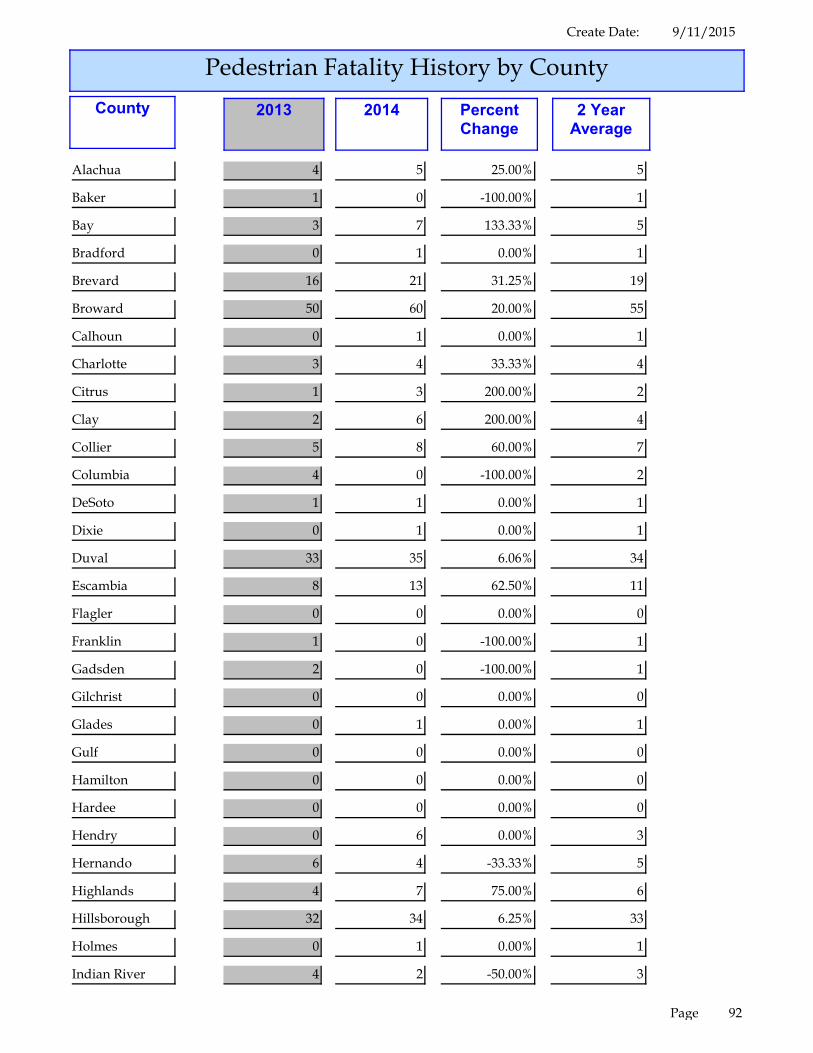
9/11/2015Create Date:
Pedestrian Fatality History by County
2 Year
Average
Percent
Change
20142013County
Alachua 4 5 %25.00 5
Baker 1 0 %-100.00 1
Bay 3 7 %133.33 5
Bradford 0 1 %0.00 1
Brevard 16 21 %31.25 19
Broward 50 60 %20.00 55
Calhoun 0 1 %0.00 1
Charlotte 3 4 %33.33 4
Citrus 1 3 %200.00 2
Clay 2 6 %200.00 4
Collier 5 8 %60.00 7
Columbia 4 0 %-100.00 2
DeSoto 1 1 %0.00 1
Dixie 0 1 %0.00 1
Duval 33 35 %6.06 34
Escambia 8 13 %62.50 11
Flagler 0 0 %0.00 0
Franklin 1 0 %-100.00 1
Gadsden 2 0 %-100.00 1
Gilchrist 0 0 %0.00 0
Glades 0 1 %0.00 1
Gulf 0 0 %0.00 0
Hamilton 0 0 %0.00 0
Hardee 0 0 %0.00 0
Hendry 0 6 %0.00 3
Hernando 6 4 %-33.33 5
Highlands 4 7 %75.00 6
Hillsborough 32 34 %6.25 33
Holmes 0 1 %0.00 1
Indian River 4 2 %-50.00 3
92Page

9/11/2015Create Date:
Jackson 0 0 %0.00 0
Jefferson 2 0 %-100.00 1
Lafayette 1 0 %-100.00 1
Lake 3 8 %166.67 6
Lee 24 17 %-29.17 21
Leon 6 6 %0.00 6
Levy 1 1 %0.00 1
Liberty 0 0 %0.00 0
Madison 0 2 %0.00 1
Manatee 8 9 %12.50 9
Marion 6 11 %83.33 9
Martin 4 2 %-50.00 3
Miami-Dade 69 77 %11.59 73
Monroe 5 3 %-40.00 4
Nassau 3 5 %66.67 4
Okaloosa 5 6 %20.00 6
Okeechobee 3 1 %-66.67 2
Orange 35 43 %22.86 39
Osceola 8 12 %50.00 10
Palm Beach 35 35 %0.00 35
Pasco 12 24 %100.00 18
Pinellas 26 41 %57.69 34
Polk 10 21 %110.00 16
Putnam 1 2 %100.00 2
Santa Rosa 3 3 %0.00 3
Sarasota 7 11 %57.14 9
Seminole 8 4 %-50.00 6
St. Johns 3 9 %200.00 6
St. Lucie 5 5 %0.00 5
Sumter 3 0 %-100.00 2
Suwannee 1 0 %-100.00 1
Taylor 1 1 %0.00 1
Union 0 0 %0.00 0
Unknown 0 0 %0.00 0
93Page

9/11/2015Create Date:
Volusia 19 25 %31.58 22
Wakulla 1 0 %-100.00 1
Walton 0 1 %0.00 1
Washington 0 0 %0.00 0
498 606 %21.69 552
94Page

9/11/2015Create Date:
Pedestrian Injury History by County
2 Year
Average
Percent
Change
20142013County
Alachua 103 88 %-14.56 96
Baker 3 2 %-33.33 3
Bay 65 72 %10.77 69
Bradford 4 7 %75.00 6
Brevard 188 166 %-11.70 177
Broward 894 950 %6.26 922
Calhoun 1 0 %-100.00 1
Charlotte 41 53 %29.27 47
Citrus 29 41 %41.38 35
Clay 55 57 %3.64 56
Collier 87 92 %5.75 90
Columbia 19 16 %-15.79 18
DeSoto 8 9 %12.50 9
Dixie 1 1 %0.00 1
Duval 419 385 %-8.11 402
Escambia 106 117 %10.38 112
Flagler 26 18 %-30.77 22
Franklin 1 2 %100.00 2
Gadsden 3 2 %-33.33 3
Gilchrist 5 1 %-80.00 3
Glades 2 0 %-100.00 1
Gulf 3 1 %-66.67 2
Hamilton 2 0 %-100.00 1
Hardee 6 6 %0.00 6
Hendry 9 9 %0.00 9
Hernando 47 54 %14.89 51
Highlands 18 23 %27.78 21
Hillsborough 485 568 %17.11 527
Holmes 1 0 %-100.00 1
Indian River 29 38 %31.03 34
95Page

9/11/2015Create Date:
Jackson 4 9 %125.00 7
Jefferson 0 3 %0.00 2
Lafayette 2 0 %-100.00 1
Lake 75 74 %-1.33 75
Lee 204 213 %4.41 209
Leon 157 147 %-6.37 152
Levy 5 6 %20.00 6
Liberty 0 0 %0.00 0
Madison 4 1 %-75.00 3
Manatee 107 136 %27.10 122
Marion 102 80 %-21.57 91
Martin 32 42 %31.25 37
Miami-Dade 1,305 1,390 %6.51 1,348
Monroe 49 43 %-12.24 46
Nassau 11 12 %9.09 12
Okaloosa 53 42 %-20.75 48
Okeechobee 8 12 %50.00 10
Orange 575 652 %13.39 614
Osceola 89 92 %3.37 91
Palm Beach 593 564 %-4.89 579
Pasco 170 135 %-20.59 153
Pinellas 452 433 %-4.20 443
Polk 147 215 %46.26 181
Putnam 29 16 %-44.83 23
Santa Rosa 22 21 %-4.55 22
Sarasota 123 126 %2.44 125
Seminole 109 102 %-6.42 106
St. Johns 52 46 %-11.54 49
St. Lucie 55 81 %47.27 68
Sumter 10 15 %50.00 13
Suwannee 3 7 %133.33 5
Taylor 2 3 %50.00 3
Union 5 1 %-80.00 3
Unknown 0 0 %0.00 0
96Page

9/11/2015Create Date:
Volusia 224 213 %-4.91 219
Wakulla 6 6 %0.00 6
Walton 21 14 %-33.33 18
Washington 2 7 %250.00 5
7,467 7,737 %3.62 7,602
97Page

9/11/2015Create Date:
Bicycle Crash History by County
2 Year
Average
Percent
Change
20142013County
Alachua 133 131 %-1.50 132
Baker 3 2 %-33.33 3
Bay 48 58 %20.83 53
Bradford 4 3 %-25.00 4
Brevard 208 218 %4.81 213
Broward 845 855 %1.18 850
Calhoun 0 0 %0.00 0
Charlotte 58 41 %-29.31 50
Citrus 19 20 %5.26 20
Clay 63 55 %-12.70 59
Collier 151 137 %-9.27 144
Columbia 11 11 %0.00 11
DeSoto 4 13 %225.00 9
Dixie 0 1 %0.00 1
Duval 299 281 %-6.02 290
Escambia 103 95 %-7.77 99
Flagler 35 30 %-14.29 33
Franklin 2 0 %-100.00 1
Gadsden 2 1 %-50.00 2
Gilchrist 2 0 %-100.00 1
Glades 1 1 %0.00 1
Gulf 1 3 %200.00 2
Hamilton 0 0 %0.00 0
Hardee 2 1 %-50.00 2
Hendry 4 2 %-50.00 3
Hernando 37 36 %-2.70 37
Highlands 14 11 %-21.43 13
Hillsborough 512 532 %3.91 522
Holmes 1 0 %-100.00 1
98Page

9/11/2015Create Date:
Indian River 46 46 %0.00 46
Jackson 1 1 %0.00 1
Jefferson 0 2 %0.00 1
Lafayette 0 0 %0.00 0
Lake 45 49 %8.89 47
Lee 189 222 %17.46 206
Leon 77 76 %-1.30 77
Levy 6 4 %-33.33 5
Liberty 0 1 %0.00 1
Madison 2 0 %-100.00 1
Manatee 113 142 %25.66 128
Marion 67 61 %-8.96 64
Martin 45 46 %2.22 46
Miami-Dade 863 989 %14.60 926
Monroe 131 126 %-3.82 129
Nassau 12 17 %41.67 15
Okaloosa 56 42 %-25.00 49
Okeechobee 4 5 %25.00 5
Orange 500 488 %-2.40 494
Osceola 91 76 %-16.48 84
Palm Beach 555 550 %-0.90 553
Pasco 146 151 %3.42 149
Pinellas 574 575 %0.17 575
Polk 156 150 %-3.85 153
Putnam 7 16 %128.57 12
Santa Rosa 12 14 %16.67 13
Sarasota 188 185 %-1.60 187
Seminole 144 118 %-18.06 131
St. Johns 62 50 %-19.35 56
St. Lucie 68 110 %61.76 89
Sumter 8 13 %62.50 11
Suwannee 0 2 %0.00 1
Taylor 2 0 %-100.00 1
Union 0 0 %0.00 0
99Page

9/11/2015Create Date:
Unknown 0 0 %0.00 0
Volusia 219 195 %-10.96 207
Wakulla 0 6 %0.00 3
Walton 17 10 %-41.18 14
Washington 1 1 %0.00 1
6,969 7,077 %1.55 7,023
100Page

9/11/2015Create Date:
Bicycle Fatality History by County
2 Year
Average
Percent
Change
20142013County
Alachua 1 1 %0.00 1
Baker 0 0 %0.00 0
Bay 0 1 %0.00 1
Bradford 0 0 %0.00 0
Brevard 10 5 %-50.00 8
Broward 13 12 %-7.69 13
Calhoun 0 0 %0.00 0
Charlotte 3 1 %-66.67 2
Citrus 1 1 %0.00 1
Clay 1 2 %100.00 2
Collier 1 3 %200.00 2
Columbia 0 0 %0.00 0
DeSoto 0 1 %0.00 1
Dixie 0 0 %0.00 0
Duval 7 1 %-85.71 4
Escambia 1 5 %400.00 3
Flagler 2 1 %-50.00 2
Franklin 0 0 %0.00 0
Gadsden 0 0 %0.00 0
Gilchrist 0 0 %0.00 0
Glades 0 1 %0.00 1
Gulf 0 0 %0.00 0
Hamilton 0 0 %0.00 0
Hardee 0 0 %0.00 0
Hendry 0 0 %0.00 0
Hernando 1 3 %200.00 2
Highlands 0 0 %0.00 0
Hillsborough 11 8 %-27.27 10
Holmes 1 0 %-100.00 1
101Page

9/11/2015Create Date:
Indian River 1 1 %0.00 1
Jackson 0 1 %0.00 1
Jefferson 0 0 %0.00 0
Lafayette 0 0 %0.00 0
Lake 3 3 %0.00 3
Lee 3 9 %200.00 6
Leon 0 0 %0.00 0
Levy 0 2 %0.00 1
Liberty 0 0 %0.00 0
Madison 0 0 %0.00 0
Manatee 1 6 %500.00 4
Marion 1 0 %-100.00 1
Martin 1 1 %0.00 1
Miami-Dade 11 18 %63.64 15
Monroe 1 1 %0.00 1
Nassau 0 0 %0.00 0
Okaloosa 1 1 %0.00 1
Okeechobee 0 0 %0.00 0
Orange 8 9 %12.50 9
Osceola 0 3 %0.00 2
Palm Beach 6 7 %16.67 7
Pasco 2 0 %-100.00 1
Pinellas 11 7 %-36.36 9
Polk 5 4 %-20.00 5
Putnam 2 0 %-100.00 1
Santa Rosa 1 2 %100.00 2
Sarasota 2 2 %0.00 2
Seminole 6 0 %-100.00 3
St. Johns 4 2 %-50.00 3
St. Lucie 5 5 %0.00 5
Sumter 1 0 %-100.00 1
Suwannee 0 1 %0.00 1
Taylor 0 0 %0.00 0
Union 0 0 %0.00 0
102Page

9/11/2015Create Date:
Unknown 0 0 %0.00 0
Volusia 5 4 %-20.00 5
Wakulla 0 0 %0.00 0
Walton 1 0 %-100.00 1
Washington 0 0 %0.00 0
135 135 %0.00 135
103Page

9/11/2015Create Date:
Bicycle Injury History by County
2 Year
Average
Percent
Change
20142013County
Alachua 127 126 %-0.79 127
Baker 4 2 %-50.00 3
Bay 47 52 %10.64 50
Bradford 3 3 %0.00 3
Brevard 187 199 %6.42 193
Broward 808 829 %2.60 819
Calhoun 0 0 %0.00 0
Charlotte 52 41 %-21.15 47
Citrus 17 17 %0.00 17
Clay 59 52 %-11.86 56
Collier 149 130 %-12.75 140
Columbia 10 10 %0.00 10
DeSoto 5 12 %140.00 9
Dixie 0 2 %0.00 1
Duval 279 268 %-3.94 274
Escambia 99 87 %-12.12 93
Flagler 31 29 %-6.45 30
Franklin 2 0 %-100.00 1
Gadsden 1 1 %0.00 1
Gilchrist 2 0 %-100.00 1
Glades 1 0 %-100.00 1
Gulf 1 3 %200.00 2
Hamilton 0 0 %0.00 0
Hardee 2 1 %-50.00 2
Hendry 4 2 %-50.00 3
Hernando 35 31 %-11.43 33
Highlands 14 11 %-21.43 13
Hillsborough 482 513 %6.43 498
Holmes 0 0 %0.00 0
104Page

9/11/2015Create Date:
Indian River 41 42 %2.44 42
Jackson 0 0 %0.00 0
Jefferson 0 2 %0.00 1
Lafayette 0 0 %0.00 0
Lake 44 47 %6.82 46
Lee 182 210 %15.38 196
Leon 71 76 %7.04 74
Levy 6 3 %-50.00 5
Liberty 0 1 %0.00 1
Madison 2 0 %-100.00 1
Manatee 111 131 %18.02 121
Marion 54 55 %1.85 55
Martin 42 44 %4.76 43
Miami-Dade 803 928 %15.57 866
Monroe 119 121 %1.68 120
Nassau 12 17 %41.67 15
Okaloosa 53 38 %-28.30 46
Okeechobee 4 5 %25.00 5
Orange 467 464 %-0.64 466
Osceola 90 70 %-22.22 80
Palm Beach 519 513 %-1.16 516
Pasco 141 149 %5.67 145
Pinellas 518 519 %0.19 519
Polk 143 140 %-2.10 142
Putnam 4 15 %275.00 10
Santa Rosa 11 12 %9.09 12
Sarasota 187 179 %-4.28 183
Seminole 135 117 %-13.33 126
St. Johns 54 47 %-12.96 51
St. Lucie 60 104 %73.33 82
Sumter 5 13 %160.00 9
Suwannee 0 2 %0.00 1
Taylor 2 0 %-100.00 1
Union 0 0 %0.00 0
105Page

9/11/2015Create Date:
Unknown 0 0 %0.00 0
Volusia 201 175 %-12.94 188
Wakulla 0 6 %0.00 3
Walton 17 13 %-23.53 15
Washington 1 1 %0.00 1
6,520 6,680 %2.45 6,600
106Page

9/11/2015Create Date:
Teen Driver Age 15-19 Crash History by County
2 Year
Average
Percent
Change
20142013County
Alachua 672 546 %-18.75 609
Baker 37 36 %-2.70 37
Bay 492 483 %-1.83 488
Bradford 26 31 %19.23 29
Brevard 932 982 %5.36 957
Broward 2,985 3,195 %7.04 3,090
Calhoun 19 20 %5.26 20
Charlotte 237 234 %-1.27 236
Citrus 192 160 %-16.67 176
Clay 389 424 %9.00 407
Collier 473 497 %5.07 485
Columbia 158 185 %17.09 172
DeSoto 29 32 %10.34 31
Dixie 18 18 %0.00 18
Duval 2,109 2,099 %-0.47 2,104
Escambia 829 827 %-0.24 828
Flagler 158 170 %7.59 164
Franklin 5 13 %160.00 9
Gadsden 51 51 %0.00 51
Gilchrist 23 22 %-4.35 23
Glades 12 19 %58.33 16
Gulf 17 17 %0.00 17
Hamilton 20 18 %-10.00 19
Hardee 39 51 %30.77 45
Hendry 51 33 %-35.29 42
Hernando 266 271 %1.88 269
Highlands 125 139 %11.20 132
Hillsborough 2,705 2,898 %7.13 2,802
Holmes 45 38 %-15.56 42
Indian River 180 242 %34.44 211
Jackson 78 79 %1.28 79
107Page

9/11/2015Create Date:
Jefferson 28 18 %-35.71 23
Lafayette 6 3 %-50.00 5
Lake 444 486 %9.46 465
Lee 1,059 1,207 %13.98 1,133
Leon 858 953 %11.07 906
Levy 49 72 %46.94 61
Liberty 16 18 %12.50 17
Madison 46 36 %-21.74 41
Manatee 666 679 %1.95 673
Marion 661 765 %15.73 713
Martin 274 285 %4.01 280
Miami-Dade 4,457 5,149 %15.53 4,803
Monroe 154 167 %8.44 161
Nassau 116 123 %6.03 120
Okaloosa 510 426 %-16.47 468
Okeechobee 70 71 %1.43 71
Orange 2,754 3,081 %11.87 2,918
Osceola 505 595 %17.82 550
Palm Beach 2,336 2,523 %8.01 2,430
Pasco 796 902 %13.32 849
Pinellas 1,857 1,860 %0.16 1,859
Polk 1,184 1,242 %4.90 1,213
Putnam 114 129 %13.16 122
Santa Rosa 320 293 %-8.44 307
Sarasota 592 626 %5.74 609
Seminole 866 928 %7.16 897
St. Johns 406 408 %0.49 407
St. Lucie 341 464 %36.07 403
Sumter 71 106 %49.30 89
Suwannee 71 67 %-5.63 69
Taylor 29 36 %24.14 33
Union 15 28 %86.67 22
Unknown 0 0 %0.00 0
Volusia 908 950 %4.63 929
Wakulla 46 57 %23.91 52
108Page

9/11/2015Create Date:
Walton 136 177 %30.15 157
Washington 47 35 %-25.53 41
36,180 38,795 %7.23 37,488
109Page

9/11/2015Create Date:
Teen Driver Age 15-19 Fatality History by County
2 Year
Average
Percent
Change
20142013County
Alachua 0 1 %0.00 1
Baker 0 0 %0.00 0
Bay 0 0 %0.00 0
Bradford 0 0 %0.00 0
Brevard 2 0 %-100.00 1
Broward 9 3 %-66.67 6
Calhoun 1 1 %0.00 1
Charlotte 1 0 %-100.00 1
Citrus 0 1 %0.00 1
Clay 1 2 %100.00 2
Collier 4 3 %-25.00 4
Columbia 1 1 %0.00 1
DeSoto 0 0 %0.00 0
Dixie 1 0 %-100.00 1
Duval 1 3 %200.00 2
Escambia 3 5 %66.67 4
Flagler 0 1 %0.00 1
Franklin 0 0 %0.00 0
Gadsden 1 0 %-100.00 1
Gilchrist 0 0 %0.00 0
Glades 0 0 %0.00 0
Gulf 0 1 %0.00 1
Hamilton 1 1 %0.00 1
Hardee 1 4 %300.00 3
Hendry 2 0 %-100.00 1
Hernando 1 0 %-100.00 1
Highlands 0 1 %0.00 1
Hillsborough 9 8 %-11.11 9
Holmes 0 1 %0.00 1
Indian River 0 0 %0.00 0
Jackson 0 1 %0.00 1
110Page

9/11/2015Create Date:
Jefferson 1 0 %-100.00 1
Lafayette 0 0 %0.00 0
Lake 0 2 %0.00 1
Lee 4 9 %125.00 7
Leon 0 4 %0.00 2
Levy 0 0 %0.00 0
Liberty 0 0 %0.00 0
Madison 1 0 %-100.00 1
Manatee 1 7 %600.00 4
Marion 3 1 %-66.67 2
Martin 1 3 %200.00 2
Miami-Dade 4 9 %125.00 7
Monroe 1 1 %0.00 1
Nassau 2 1 %-50.00 2
Okaloosa 0 0 %0.00 0
Okeechobee 0 1 %0.00 1
Orange 5 6 %20.00 6
Osceola 3 3 %0.00 3
Palm Beach 9 6 %-33.33 8
Pasco 5 1 %-80.00 3
Pinellas 3 1 %-66.67 2
Polk 8 4 %-50.00 6
Putnam 1 0 %-100.00 1
Santa Rosa 1 0 %-100.00 1
Sarasota 1 0 %-100.00 1
Seminole 2 1 %-50.00 2
St. Johns 0 2 %0.00 1
St. Lucie 3 3 %0.00 3
Sumter 0 1 %0.00 1
Suwannee 2 1 %-50.00 2
Taylor 0 0 %0.00 0
Union 0 0 %0.00 0
Unknown 0 0 %0.00 0
Volusia 2 3 %50.00 3
Wakulla 0 0 %0.00 0
111Page

9/11/2015Create Date:
Walton 1 0 %-100.00 1
Washington 0 1 %0.00 1
103 109 %5.83 106
Note: The data in this table reflects both drivers AND passengers who were between the ages of 15 and 19. Also, because the Teen Driver History tables are new to the 2014 Crash Facts, 2013 totals from the Summary table may show a slight difference in overall fatalities and injuries.
112Page

9/11/2015Create Date:
Teen Driver Age 15-19 Injury History by County
2 Year
Average
Percent
Change
20142013County
Alachua 310 240 %-22.58 275
Baker 33 34 %3.03 34
Bay 237 201 %-15.19 219
Bradford 18 21 %16.67 20
Brevard 435 432 %-0.69 434
Broward 1,510 1,512 %0.13 1,511
Calhoun 23 16 %-30.43 20
Charlotte 119 88 %-26.05 104
Citrus 84 80 %-4.76 82
Clay 173 178 %2.89 176
Collier 177 186 %5.08 182
Columbia 140 88 %-37.14 114
DeSoto 15 18 %20.00 17
Dixie 12 9 %-25.00 11
Duval 1,034 1,059 %2.42 1,047
Escambia 427 452 %5.85 440
Flagler 101 93 %-7.92 97
Franklin 6 10 %66.67 8
Gadsden 50 42 %-16.00 46
Gilchrist 13 11 %-15.38 12
Glades 6 13 %116.67 10
Gulf 8 11 %37.50 10
Hamilton 26 11 %-57.69 19
Hardee 32 21 %-34.38 27
Hendry 25 23 %-8.00 24
Hernando 165 147 %-10.91 156
Highlands 69 66 %-4.35 68
Hillsborough 1,305 1,450 %11.11 1,378
Holmes 19 24 %26.32 22
Indian River 75 94 %25.33 85
Jackson 57 56 %-1.75 57
113Page
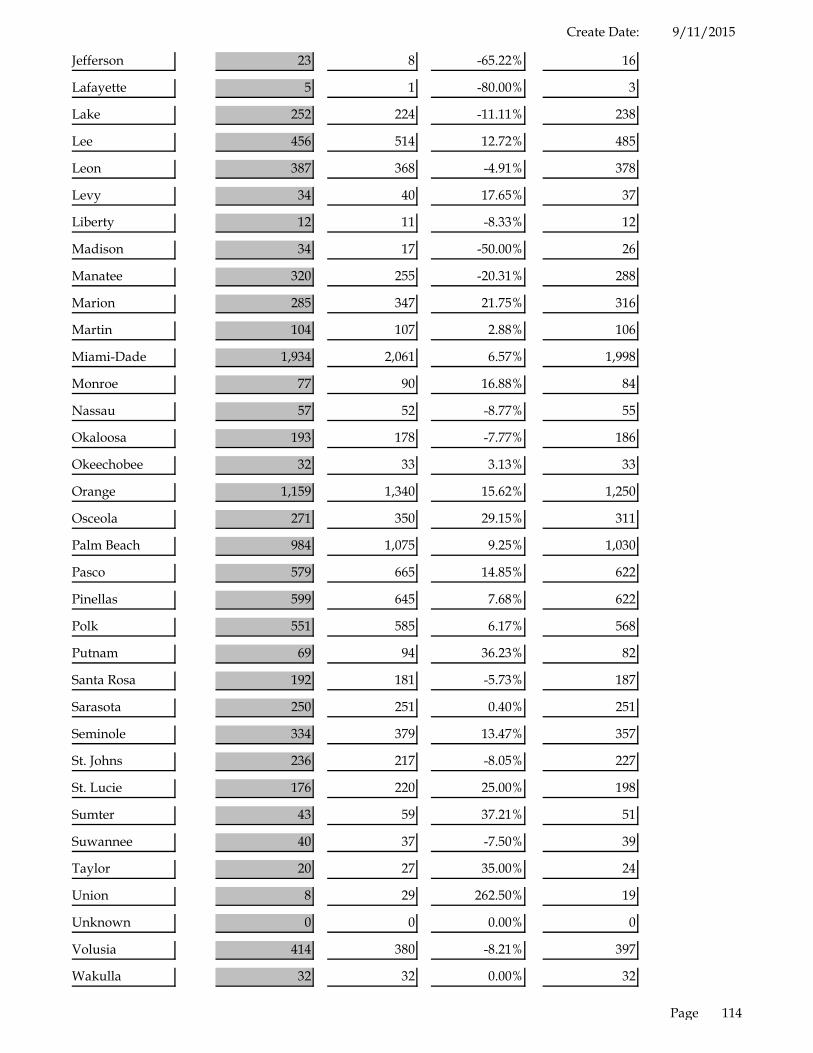
9/11/2015Create Date:
Jefferson 23 8 %-65.22 16
Lafayette 5 1 %-80.00 3
Lake 252 224 %-11.11 238
Lee 456 514 %12.72 485
Leon 387 368 %-4.91 378
Levy 34 40 %17.65 37
Liberty 12 11 %-8.33 12
Madison 34 17 %-50.00 26
Manatee 320 255 %-20.31 288
Marion 285 347 %21.75 316
Martin 104 107 %2.88 106
Miami-Dade 1,934 2,061 %6.57 1,998
Monroe 77 90 %16.88 84
Nassau 57 52 %-8.77 55
Okaloosa 193 178 %-7.77 186
Okeechobee 32 33 %3.13 33
Orange 1,159 1,340 %15.62 1,250
Osceola 271 350 %29.15 311
Palm Beach 984 1,075 %9.25 1,030
Pasco 579 665 %14.85 622
Pinellas 599 645 %7.68 622
Polk 551 585 %6.17 568
Putnam 69 94 %36.23 82
Santa Rosa 192 181 %-5.73 187
Sarasota 250 251 %0.40 251
Seminole 334 379 %13.47 357
St. Johns 236 217 %-8.05 227
St. Lucie 176 220 %25.00 198
Sumter 43 59 %37.21 51
Suwannee 40 37 %-7.50 39
Taylor 20 27 %35.00 24
Union 8 29 %262.50 19
Unknown 0 0 %0.00 0
Volusia 414 380 %-8.21 397
Wakulla 32 32 %0.00 32
114Page

9/11/2015Create Date:
Walton 71 91 %28.17 81
Washington 38 19 %-50.00 29
16,975 17,668 %4.08 17,322
Note: The data in this table reflects both drivers AND passengers who were between the ages of 15 and 19. Also, because the Teen Driver History tables are new to the 2014 Crash Facts, 2013 totals from the Summary table may show a slight difference in overall fatalities and injuries.
115Page

9/11/2015Create Date:
Crashes by Locality
Percent Alcohol
Suspected
Alcohol Suspected Crashes
Total Crashes
Locality
Alachua
Unknown 51 5 9.80
Alachua 263 13 4.94
Archer 36 2 5.56
Gainesville 3,206 132 4.12
Hawthorne 74 5 6.76
High Springs 12 1 8.33
La Crosse 3 0 0.00
Micanopy 108 5 4.63
Newberry 91 7 7.69
Unincorporated - Alachua County 291 19 6.53
University of Florida 31 4 12.90
Waldo 27 0 0.00
4,193 193Alachua 4.60
Baker
Glen St. Mary 32 6 18.75
Macclenny 85 5 5.88
Unincorporated - Baker County 129 8 6.20
246 19Baker 7.72
Bay
Unknown 3 0 0.00
Bayview 1 0 0.00
Calloway 181 10 5.52
Lynn Haven 302 17 5.63
Mexico Beach 18 0 0.00
Panama City 1,474 131 8.89
Panama City Beach 603 69 11.44
Parker 37 2 5.41
Springfield 129 4 3.10
Unincorporated - Bay County 589 72 12.22
3,337 305Bay 9.14
Bradford
Booker 5 0 0.00
116Page

9/11/2015Create Date:
Bradford
Hampton 13 0 0.00
Lawtey 16 0 0.00
Starke 182 10 5.49
Unincorporated - Bradford County 58 6 10.34
274 16Bradford 5.84
Brevard
Cape Canaveral 164 17 10.37
Cocoa 843 62 7.35
Cocoa Beach 290 25 8.62
Florida Institute of Technology 1 0 0.00
Indialantic 95 11 11.58
Indian Harbour Beach 49 4 8.16
Malabar 58 4 6.90
Melbourne 2,090 144 6.89
Melbourne Beach 43 7 16.28
Melbourne Village 5 1 20.00
Merritt Island 450 33 7.33
Mims 122 5 4.10
Palm Bay 1,299 87 6.70
Patrick AFB 9 0 0.00
Rockledge 377 32 8.49
Satellite Beach 86 7 8.14
Titusville 740 50 6.76
Unincorporated - Brevard County 658 69 10.49
West Melbourne 282 8 2.84
7,661 566Brevard 7.39
Broward
Browardale 3 0 0.00
Coconut Creek 768 35 4.56
Cooper City 390 18 4.62
Coral Springs 1,680 51 3.04
Dania Beach 678 23 3.39
Davie 3,016 114 3.78
Deerfield Beach 1,534 59 3.85
Fort Lauderdale 5,925 218 3.68
Hallandale 979 34 3.47
Hillsboro Beach 1 0 0.00
Hollywood 3,725 110 2.95
117Page

9/11/2015Create Date:
Broward
Hollywood Ridge Farm 1 0 0.00
Lauderdale by the Sea 87 3 3.45
Lauderdale Lakes 632 10 1.58
Lauderhill 995 23 2.31
Lighthouse Point 146 6 4.11
Margate 482 22 4.56
Miramar 1,165 25 2.15
North Lauderdale 482 16 3.32
Oakland Park 1,395 36 2.58
Parkland 74 3 4.05
Pembroke Park 246 18 7.32
Pembroke Pines 1,892 90 4.76
Plantation 1,625 37 2.28
Pompano Beach 2,216 74 3.34
Pompano Beach Highlands 556 25 4.50
Seminole Indian Reservation 167 20 11.98
Sunrise 1,377 33 2.40
Tamarac 933 40 4.29
Unincorporated - Broward County 714 34 4.76
West Hollywood 3 0 0.00
West Park 184 9 4.89
Weston 520 12 2.31
Wilton Manors 242 19 7.85
34,833 1,217Broward 3.49
Calhoun
Unknown 1 0 0.00
Altha 25 3 12.00
Blountstown 42 3 7.14
Unincorporated - Calhoun County 66 11 16.67
134 17Calhoun 12.69
Charlotte
Englewood 243 19 7.82
Port Charlotte 884 47 5.32
Punta Gorda 369 23 6.23
Unincorporated - Charlotte County 745 26 3.49
2,241 115Charlotte 5.13
Citrus
118Page

9/11/2015Create Date:
Citrus
Crystal River 199 19 9.55
Homosassa Springs 14 2 14.29
Inverness 328 17 5.18
Unincorporated - Citrus County 930 60 6.45
1,471 98Citrus 6.66
Clay
Unknown 1 0 0.00
Unknown 12 0 0.00
Doctors Inlet 1 0 0.00
Green Cove Springs 128 5 3.91
Keystone Heights 63 8 12.70
Middleburg 195 19 9.74
Orange Park 539 31 5.75
Penny Farms 3 0 0.00
Unincorporated - Clay County 1,652 115 6.96
2,594 178Clay 6.86
Collier
East Naples 118 9 7.63
Everglades 9 0 0.00
Immolakee 253 18 7.11
Marco Island 116 10 8.62
Naples 1,014 86 8.48
North Naples 129 7 5.43
Unincorporated - Collier County 2,713 160 5.90
4,352 290Collier 6.66
Columbia
Fort White 65 10 15.38
Lake City 872 51 5.85
Unincorporated - Columbia County 261 28 10.73
1,198 89Columbia 7.43
DeSoto
Arcadia 352 27 7.67
Unincorporated - DeSoto County 25 4 16.00
377 31DeSoto 8.22
Dixie
Cross City 28 6 21.43
119Page

9/11/2015Create Date:
Dixie
Horseshoe Beach 5 1 20.00
Unincorporated - Dixie County 121 13 10.74
154 20Dixie 12.99
Duval
Unknown 3 0 0.00
Atlantic Beach 223 29 13.00
Baldwin 10 0 0.00
Jacksonville 19,148 879 4.59
Jacksonville Beach 607 78 12.85
Jacksonville Duval County School 1 0 0.00
Jacksonville NAS 1 0 0.00
Neptune Beach 139 30 21.58
Unincorporated - Duval County 25 2 8.00
University of North Florida 41 0 0.00
20,198 1,018Duval 5.04
Escambia
Unknown 2 0 0.00
Brent 19 0 0.00
Cantonment 240 19 7.92
Century 31 3 9.68
Myrtle Grove 9 1 11.11
Pensacola 3,726 247 6.63
Saufley Field NAS 2 0 0.00
Unincorporated - Escambia County 1,983 92 4.64
University of West Florida 29 1 3.45
Warrington 21 0 0.00
West Pensacola 10 0 0.00
6,072 363Escambia 5.98
Flagler
Beverly Beach 2 1 50.00
Bunnell 159 9 5.66
Flagler Beach 76 13 17.11
Marineland 2 0 0.00
Painter Hill 1 0 0.00
Palm Coast 884 65 7.35
Unincorporated - Flagler County 78 8 10.26
1,202 96Flagler 7.99
120Page

9/11/2015Create Date:
Franklin
Apalachicola 6 1 16.67
Carrabelle 5 0 0.00
Eastpoint 19 3 15.79
Unincorporated - Franklin County 54 8 14.81
84 12Franklin 14.29
Gadsden
Chattahoochee 33 4 12.12
Greensboro 4 0 0.00
Gretna 12 1 8.33
Havana 49 2 4.08
Midway 72 5 6.94
Quincy 61 7 11.48
Unincorporated - Gadsden County 311 23 7.40
542 42Gadsden 7.75
Gilchrist
Bell 23 4 17.39
Fanning Springs 3 0 0.00
Trenton 57 3 5.26
Unincorporated - Gilchrist County 77 14 18.18
160 21Gilchrist 13.13
Glades
Moore Haven 53 5 9.43
Unincorporated - Glades County 86 6 6.98
139 11Glades 7.91
Gulf
Port Saint Joe 44 5 11.36
Unincorporated - Gulf County 58 9 15.52
Wewahitchka 35 2 5.71
137 16Gulf 11.68
Hamilton
Jasper 70 1 1.43
Jennings 37 3 8.11
Unincorporated - Hamilton County 60 7 11.67
White Springs 10 1 10.00
177 12Hamilton 6.78
121Page

9/11/2015Create Date:
Hardee
Bowling Green 59 3 5.08
Unincorporated - Hardee County 19 1 5.26
Wauchula 158 15 9.49
Zolfo Springs 97 7 7.22
333 26Hardee 7.81
Hendry
Clewiston 108 9 8.33
La Belle 68 1 1.47
Unincorporated - Hendry County 78 14 17.95
254 24Hendry 9.45
Hernando
Brooksville 641 27 4.21
Unincorporated - Hernando County 1,332 72 5.41
Weekiwachee 8 0 0.00
1,981 99Hernando 5.00
Highlands
Avon Park 212 7 3.30
Lake Placid 192 17 8.85
Sebring 490 31 6.33
Unincorporated - Highlands County 173 16 9.25
1,067 71Highlands 6.65
Hillsborough
Brandon 295 16 5.42
Palm River/Clair Mel 2 0 0.00
Plant City 706 31 4.39
Ruskin 103 7 6.80
Sweetwater Creek 1 0 0.00
Tampa 10,078 637 6.32
Tampa International Airport 97 0 0.00
Temple Terrace 344 18 5.23
Unincorporated - Hillsborough County 11,289 784 6.94
University of South Florida 109 1 0.92
23,024 1,494Hillsborough 6.49
Holmes
Bonifay 86 12 13.95
Ponce De Leon 23 1 4.35
122Page

9/11/2015Create Date:
Holmes
Unincorporated - Holmes County 90 5 5.56
Westville 23 1 4.35
222 19Holmes 8.56
Indian River
Fellsmere 46 4 8.70
Indian River Shores 15 1 6.67
Sebastian 209 14 6.70
Unincorporated - Indian River County 1,232 80 6.49
Vero Beach 602 44 7.31
Vero Beach South 1 0 0.00
Wabasso 1 0 0.00
2,106 143Indian River 6.79
Jackson
Unknown 27 1 3.70
Alford 17 2 11.76
Bascom 12 0 0.00
Cottondale 48 0 0.00
Graceville 14 1 7.14
Grand Ridge 27 4 14.81
Malone 10 1 10.00
Marianna 227 18 7.93
Sneads 14 1 7.14
Unincorporated - Jackson County 229 16 6.99
625 44Jackson 7.04
Jefferson
Monticello 35 5 14.29
Unincorporated - Jefferson County 186 21 11.29
221 26Jefferson 11.76
Lafayette
Mayo 16 2 12.50
Unincorporated - Lafayette County 13 2 15.38
29 4Lafayette 13.79
Lake
Astula 15 2 13.33
Clermont 844 42 4.98
Eustis 377 23 6.10
123Page

9/11/2015Create Date:
Lake
Fruitland Park 110 6 5.45
Groveland 190 14 7.37
Howey-in-the-Hills 16 2 12.50
Lady Lake 305 11 3.61
Leesburg 621 33 5.31
Mascotte 4 0 0.00
Minneola 49 4 8.16
Montverde 9 0 0.00
Mount Dora 298 11 3.69
Tavares 203 14 6.90
Umatilla 54 4 7.41
Unincorporated - Lake County 580 38 6.55
3,675 204Lake 5.55
Lee
Unknown 33 3 9.09
Bonita Springs 515 37 7.18
Cape Coral 1,712 142 8.29
Fort Myers 3,408 219 6.43
Fort Myers Beach 124 22 17.74
Fort Myers SE 14 0 0.00
Fort Myers SW 22 2 9.09
Fort Myers Village/Pin Mn 4 0 0.00
Lee County Airport Police 33 2 6.06
Lehigh Acres 683 45 6.59
North Fort Myers 391 28 7.16
Sanibel 38 2 5.26
Tice 5 0 0.00
Unincorporated - Lee County 2,139 148 6.92
9,121 650Lee 7.13
Leon
Unknown 11 0 0.00
Florida A&M University 72 1 1.39
Florida State University 145 7 4.83
Tallahassee 5,179 234 4.52
Unincorporated - Leon County 1,128 86 7.62
6,535 328Leon 5.02
Levy
124Page

9/11/2015Create Date:
Levy
Bronson 50 9 18.00
Cedar Key 10 2 20.00
Chiefland 102 8 7.84
Fanning Springs 6 1 16.67
Inglis 29 2 6.90
Otter Creek 4 1 25.00
Unincorporated - Levy County 164 16 9.76
Williston 110 12 10.91
Yankeetown 2 0 0.00
477 51Levy 10.69
Liberty
Bristol 20 2 10.00
Unincorporated - Liberty County 59 4 6.78
79 6Liberty 7.59
Madison
Greenville 6 0 0.00
Lee 3 1 33.33
Madison 13 1 7.69
Unincorporated - Madison County 247 17 6.88
269 19Madison 7.06
Manatee
Anna Maria 13 0 0.00
Bayshore Gardens 7 0 0.00
Bradenton 2,999 164 5.47
Bradenton Beach 24 4 16.67
Cedar Hammock/Bradenton Shores 1 0 0.00
Holmes Beach 71 4 5.63
Longboat Key 12 0 0.00
Oneco 7 0 0.00
Palmetto 745 52 6.98
Parrish 131 6 4.58
Unincorporated - Manatee County 879 81 9.22
West Bradenton 641 23 3.59
5,530 334Manatee 6.04
Marion
Belleview 233 7 3.00
125Page

9/11/2015Create Date:
Marion
Dunnellon 115 12 10.43
McIntosh 2 1 50.00
Ocala 3,662 127 3.47
Reddick 107 5 4.67
Silver Springs Shore 2 0 0.00
Unincorporated - Marion County 1,345 95 7.06
West End 1 0 0.00
5,467 247Marion 4.52
Martin
Hobe Sound 172 17 9.88
Indiantown 93 7 7.53
Jensen Beach 299 44 14.72
Jupiter Island 5 0 0.00
Ocean Breeze Park 1 0 0.00
Palm City 256 19 7.42
Port Salerno 36 7 19.44
Sewalls Point 23 1 4.35
Stuart 1,007 78 7.75
Unincorporated - Martin County 307 29 9.45
2,199 202Martin 9.19
Miami-Dade
Unknown 12 0 0.00
Aventura 679 25 3.68
Bal Harbour 54 4 7.41
Bay Harbor Islands 38 2 5.26
Biscayne Park 1 0 0.00
Carol City 1 0 0.00
Coconut Grove 593 14 2.36
Coral Gables 1,332 42 3.15
Cutler Ridge 22 1 4.55
Dade County School PD 365 1 0.27
Doral 1,070 28 2.62
El Portal 5 0 0.00
Florida City 334 14 4.19
Florida International University 63 1 1.59
Golden Beach 14 1 7.14
Golden Glades 3 0 0.00
Goulds 21 0 0.00
126Page

9/11/2015Create Date:
Miami-Dade
Hialeah 5,646 75 1.33
Hialeah Gardens 388 11 2.84
Homestead 987 64 6.48
Indian Creek Village 4 0 0.00
Kendall 254 8 3.15
Key Biscayne 94 1 1.06
Leisure City 2 0 0.00
Medley 338 3 0.89
Miami 15,461 360 2.33
Miami Beach 2,895 134 4.63
Miami Gardens 2,214 44 1.99
Miami Lakes 135 2 1.48
Miami Shores 141 7 4.96
Miami Springs 173 3 1.73
Miami TP 930 16 1.72
Miccosukee Indian Reservation 9 0 0.00
Naranja 18 0 0.00
North Bay Village 77 7 9.09
North Miami 1,444 34 2.35
North Miami Beach 919 37 4.03
Olympia Heights 1 0 0.00
Opa Locka 566 18 3.18
Palmetto Bay 408 9 2.21
Perrine 3 0 0.00
Pine Crest Village 349 17 4.87
Richmond Heights 23 0 0.00
South Miami 319 1 0.31
South Miami Heights 1 0 0.00
Sunny Isles 267 13 4.87
Surfside 109 0 0.00
Sweetwater 412 9 2.18
Unincorporated - Miami-Dade County 20,812 425 2.04
Unincorporated County 7 0 0.00
University of Miami 16 0 0.00
Virginia Gardens 27 0 0.00
West Miami 109 6 5.50
60,165 1,437Miami-Dade 2.39
Monroe
Boca Chica 1 0 0.00
127Page

9/11/2015Create Date:
Monroe
Islamorada 172 20 11.63
Key Largo 182 11 6.04
Key West 1,057 89 8.42
Layton 1 0 0.00
Marathon 220 18 8.18
Plantation 14 1 7.14
Tavernier 56 6 10.71
Unincorporated - Monroe County 412 41 9.95
2,115 186Monroe 8.79
Nassau
Callahan 63 3 4.76
Fernandina Beach 180 15 8.33
Hilliard 27 4 14.81
Unincorporated - Nassau County 493 24 4.87
Yulee 121 12 9.92
884 58Nassau 6.56
Okaloosa
Cinco Bayou 3 2 66.67
Crestview 535 29 5.42
Destin 479 63 13.15
Eglin 61 5 8.20
Fort Walton Beach 648 53 8.18
Laurel Hill 16 1 6.25
Mary Esther 158 8 5.06
Niceville 214 15 7.01
Shalimar 29 5 17.24
Unincorporated - Okaloosa County 844 72 8.53
Valparaiso 20 3 15.00
3,007 256Okaloosa 8.51
Okeechobee
Okeechobee 217 15 6.91
Unincorporated - Okeechobee County 315 20 6.35
532 35Okeechobee 6.58
Orange
Apopka 771 45 5.84
Bay Lake 2 0 0.00
128Page

9/11/2015Create Date:
Orange
Belle Isle 48 0 0.00
Conway 9 0 0.00
Eatonville 39 3 7.69
Edgewood 55 5 9.09
Lake Buena Vista 9 0 0.00
Maitland 497 28 5.63
McCoy AFB 9 0 0.00
Mount Dora 36 1 2.78
Oakland 54 2 3.70
Ocoee 344 35 10.17
Orlando 19,078 546 2.86
Orlando Transit Authority 328 3 0.91
Orlovista 1 0 0.00
Unincorporated - Orange County 2,934 121 4.12
University of Central Florida 120 6 5.00
Windermere 183 6 3.28
Winter Garden 681 34 4.99
Winter Park 1,229 57 4.64
26,427 892Orange 3.38
Osceola
Kissimmee 3,047 82 2.69
St. Cloud 283 20 7.07
Unincorporated - Osceola County 1,095 54 4.93
4,425 156Osceola 3.53
Palm Beach
Atlantis 2 0 0.00
Belle Glade 216 10 4.63
Boca Raton 2,827 137 4.85
Boynton Beach 1,427 60 4.20
Briny Breezes 4 0 0.00
Cloud Lake 1 0 0.00
Delray Beach 1,997 85 4.26
Florida Atlantic University 53 1 1.89
Greenacres City 622 41 6.59
Gulf Stream 8 0 0.00
Haverhill 10 2 20.00
Highland Beach 3 0 0.00
Hypoluxo 10 2 20.00
129Page

9/11/2015Create Date:
Palm Beach
Juno Beach 56 5 8.93
Jupiter 894 80 8.95
Lake Clark Shores 39 0 0.00
Lake Park 168 5 2.98
Lake Worth 1,203 77 6.40
Lantana 38 3 7.89
Loxahatchee Groves 33 5 15.15
Manalapan 9 1 11.11
Mangonia Park 64 3 4.69
North Palm Beach 82 9 10.98
Ocean Ridge 13 1 7.69
Pahokee 46 1 2.17
Palm Beach 178 11 6.18
Palm Beach Gardens 1,141 67 5.87
Palm Beach School Board 76 1 1.32
Palm Beach Shores 5 1 20.00
Palm Springs 356 20 5.62
Riviera Beach 590 22 3.73
Royal Palm Beach 469 29 6.18
South Bay 58 6 10.34
South Palm Beach 10 2 20.00
Tequesta Village 44 6 13.64
Unincorporated - Palm Beach County 8,132 368 4.53
Wellington 573 27 4.71
West Gate 3 1 33.33
West Palm Beach 2,831 131 4.63
24,291 1,220Palm Beach 5.02
Pasco
Unknown 1 0 0.00
Beacon Square 1 0 0.00
Dade City 391 16 4.09
Land O Lakes 148 8 5.41
New Port Richey 1,411 56 3.97
Port Richey 456 15 3.29
Saint Leo 8 0 0.00
San Antonio 119 0 0.00
Unincorporated - Pasco County 3,630 211 5.81
Zephyrhills 611 19 3.11
6,776 325Pasco 4.80
130Page

9/11/2015Create Date:
Pinellas
Belleair 26 2 7.69
Belleair Beach 12 1 8.33
Belleair Bluffs 29 4 13.79
Clearwater 4,440 140 3.15
Dunedin 428 30 7.01
Eckerd College 1 0 0.00
Gulfport 67 3 4.48
Indian Rocks Beach 52 7 13.46
Indian Shores 20 2 10.00
Kenneth City 47 3 6.38
Largo 1,374 88 6.40
Lealman 5 0 0.00
Madeira Beach 98 15 15.31
North Redington Beach 15 1 6.67
Oldsmar 270 19 7.04
Pinellas Park 1,289 96 7.45
Redington Beach 7 0 0.00
Redington Shores 15 2 13.33
Safety Harbor 188 15 7.98
Seminole 590 34 5.76
Seminole Park 10 0 0.00
South Pasedena 68 8 11.76
St. Pete/Clearwater Airport 1 0 0.00
St. Petersburg 4,822 264 5.47
St. Petersburg Beach 174 28 16.09
Tarpon Springs 524 35 6.68
Treasure Island 92 7 7.61
Unincorporated - Pinellas County 2,714 139 5.12
17,378 943Pinellas 5.43
Polk
Auburndale 359 11 3.06
Bartow 325 8 2.46
Davenport 269 12 4.46
Dundee 45 1 2.22
Eagle Lake 36 0 0.00
Fort Meade 52 0 0.00
Frostproof 38 1 2.63
Haines City 475 12 2.53
Lake Alfred 98 5 5.10
131Page

9/11/2015Create Date:
Polk
Lake Hamilton 34 1 2.94
Lake Wales 296 9 3.04
Lakeland 2,887 117 4.05
Mulberry 89 3 3.37
Polk City 113 8 7.08
Unincorporated - Polk County 3,761 172 4.57
Winter Haven 908 36 3.96
9,785 396Polk 4.05
Putnam
Unknown 5 0 0.00
Crescent City 47 5 10.64
Interlachen 65 11 16.92
Palatka 424 17 4.01
Unincorporated - Putnam County 464 57 12.28
1,005 90Putnam 8.96
Santa Rosa
Eglin AFB 2 0 0.00
Gulf Breeze 105 14 13.33
Jay 29 2 6.90
Milton 544 46 8.46
Unincorporated - Santa Rosa County 925 78 8.43
1,605 140Santa Rosa 8.72
Sarasota
Englewood 65 6 9.23
Gulf Gate Estates 5 1 20.00
Longboat Key 30 0 0.00
Nokomis/Laurel 80 12 15.00
North Port 601 38 6.32
Sarasota 2,894 180 6.22
Sarasota South 18 2 11.11
Sarasota Southeast 2 0 0.00
Sarasota-Manatee Airport 3 0 0.00
Siesta Key 3 1 33.33
Unincorporated - Sarasota County 1,209 131 10.84
Venice 552 36 6.52
Venice South 14 0 0.00
5,476 407Sarasota 7.43
132Page

9/11/2015Create Date:
Seminole
Unknown 322 8 2.48
Altamonte Springs 1,003 41 4.09
Casselberry 692 29 4.19
Lake Mary 458 28 6.11
Longwood 604 40 6.62
Oviedo 589 34 5.77
Sanford 865 43 4.97
Unincorporated - Seminole County 1,338 94 7.03
Winter Springs 314 14 4.46
6,185 331Seminole 5.35
St. Johns
Unknown 31 4 12.90
Florida Memorial College 1 0 0.00
Florida School for Deaf/Blind 3 0 0.00
Hastings 32 6 18.75
Ponte Vedra 157 14 8.92
St. Augustine 958 76 7.93
St. Augustine Beach 86 5 5.81
Unincorporated - St. Johns County 1,655 120 7.25
2,923 225St. Johns 7.70
St. Lucie
Fort Pierce 1,005 48 4.78
Port St. Lucie 1,800 95 5.28
Unincorporated - St. Lucie County 1,086 57 5.25
3,891 200St. Lucie 5.14
Sumter
Unknown 14 0 0.00
Bushnell 196 7 3.57
Center Hill 12 0 0.00
Coleman 2 1 50.00
Unincorporated - Sumter County 620 31 5.00
Webster 55 1 1.82
Wildwood 364 14 3.85
1,263 54Sumter 4.28
Suwannee
Branford 25 4 16.00
133Page

9/11/2015Create Date:
Suwannee
Live Oak 272 23 8.46
Unincorporated - Suwannee County 289 28 9.69
586 55Suwannee 9.39
Taylor
Unknown 2 0 0.00
Perry 82 5 6.10
Steinhatchee 9 3 33.33
Unincorporated - Taylor County 166 21 12.65
259 29Taylor 11.20
Union
Lake Butler 83 6 7.23
Raiford 11 4 36.36
Unincorporated - Union County 16 3 18.75
Worthing Springs 4 0 0.00
114 13Union 11.40
Unknown
Unknown 0 0 0.00
Unknown 0 0 0.00
0 0Unknown 0.00
Volusia
Unknown 1 0 0.00
Daytona Beach 2,435 115 4.72
Daytona Beach Shores 18 4 22.22
DeBary 120 10 8.33
DeLand 955 47 4.92
DeLeon Springs 47 3 6.38
Deltona 836 43 5.14
Edgewater 65 6 9.23
Holly Hill 249 11 4.42
Lake Helen 49 3 6.12
New Smyrna Beach 679 61 8.98
Oak Hill 68 9 13.24
Orange City 396 19 4.80
Ormond Beach 993 75 7.55
Ormond By The Sea 11 2 18.18
Pierson 52 5 9.62
134Page

9/11/2015Create Date:
Volusia
Ponce Inlet 17 1 5.88
Port Orange 764 52 6.81
Seville 10 1 10.00
South Daytona 183 25 13.66
Unincorporated - Volusia County 434 45 10.37
8,382 537Volusia 6.41
Wakulla
Crawfordville 113 19 16.81
Saint Marks 2 0 0.00
Sopchoppy 6 2 33.33
Unincorporated - Wakulla County 196 31 15.82
317 52Wakulla 16.40
Walton
Defuniak Springs 281 14 4.98
Freeport 65 5 7.69
Paxton 3 0 0.00
Port Washington 1 0 0.00
Santa Rosa Beach 142 12 8.45
Unincorporated - Walton County 635 54 8.50
1,127 85Walton 7.54
Washington
Caryville 15 0 0.00
Chipley 120 6 5.00
Ebro 6 1 16.67
Unincorporated - Washington County 97 4 4.12
Vernon 24 4 16.67
262 15Washington 5.73
344,170 16,873Grand Total: 4.90
The information contained herein represents data from the long-form crash report (HSMV 90010S) as filed by law enforcement agencies in the state of Florida. This information is provided to the public
through a partnership with the Florida Department of Highway Safety and Motor Vehicles and Appriss, Inc., Division of Public Information Management. Please refer all inquiries to [email protected] or call
866-495-4206.
135Page