traffic differentiation detection in mobile networks...
TRANSCRIPT

Traffic Differentiation Detection inMobile Networks using Android Phones
by
Vitali Bashko
A thesis for conferral of a Master of Science in Computer Science
Prof. Dr. J. SchonwalderName and title of first reviewer
Dr. Bendick MahlekoName and title of second reviewer
Date of Submission: July 29, 2012
Jacobs University — School of Engineering and Science

Declaration
I, Vitali Bashko, born 1986-06-25, hereby declare that this thesis is the result of myindependent work, has not been previously accepted in substance for any degreeand is not concurrently submitted for any degree.
This thesis is being submitted in fulfillment of the requirements for the degree ofMaster of Science in Computer Science.
. . . . . . . . . . . . . . . . . . . . . . . . . . . . . . . . . . . . . . . . . . . . . . . . . . . . . . . . . . . . . . . . . . . . . . . . . .Place, Date Vitali Bashko
ii

Acknowledgments
I would like to thanks to Prof. Dr. Jurgen Schonwalder for many helpful com-ments and his guidance throughout this thesis. Special thanks to Anuj Sehgal andNikolay Melnikov for helping me setup the experimental environment, and warmthanks to Lizaveta Mikhalchanka for copy editing and supporting me during mystudies.
iii
Abstract
One of the interesting topics in the networking area is so-called ”network neu-trality”. Many Internet Service Providers (ISPs) want to restrict bandwidth-hungryapplications that can hurt other applications in the network or want to control ap-plications, such as VoIP, that reduce ISPs’ ability to profit from competing servicesof their own. Multiple research projects have been done and a number of mea-surement tools have been developed in order to investigate how different trafficregulation policies are deployed by ISPs. However, the situation with traffic shap-ing in mobile networks is still unexplored, mainly because of a lack of a propermeasurement infrastructure for mobile devices. In this thesis, a new measurementtool for Android-powered mobile devices is presented, which is suitable for detect-ing the presence of content-based traffic shaping on mobile networks. A series ofexperiments on mobile networks has been done using the new measurement tool.As it turned out, most tested mobile providers do not block SIP and VoIP traffic,even despite the fact they claim that VoIP is not supported in their mobile networks.
iv

Contents
1 Introduction 1
2 State of the Art 42.1 Network Measurements Overview . . . . . . . . . . . . . . . . . 4
2.1.1 Performance Measurements . . . . . . . . . . . . . . . . 52.1.2 Routing and Topologies Measurements . . . . . . . . . . 82.1.3 Measurement of Video and Audio Streaming Performance 92.1.4 Multicast Measurements . . . . . . . . . . . . . . . . . . 112.1.5 Application and Policy Measurements . . . . . . . . . . . 12
2.2 Internet Measurement Infrastructures . . . . . . . . . . . . . . . . 152.2.1 M-LAB . . . . . . . . . . . . . . . . . . . . . . . . . . . 152.2.2 SamKnows . . . . . . . . . . . . . . . . . . . . . . . . . 162.2.3 RIPE Atlas . . . . . . . . . . . . . . . . . . . . . . . . . 17
2.3 Network Measurements for Mobile Platforms . . . . . . . . . . . 182.3.1 Internet Measurement on Mobile Networks Overview . . . 192.3.2 Traffic Shaping Detection on Mobile Networks . . . . . . 20
3 Implementation 223.1 Traffic Shaping Detection Tool Overview . . . . . . . . . . . . . 223.2 Protocol Description Files Format . . . . . . . . . . . . . . . . . 253.3 Client Requests Processing . . . . . . . . . . . . . . . . . . . . . 283.4 Measurement Test Lifecycle . . . . . . . . . . . . . . . . . . . . 323.5 Measurement Results Data Analysis . . . . . . . . . . . . . . . . 36
4 Experiments Design 404.1 List of Available Protocol Description Files . . . . . . . . . . . . 404.2 Mesurement Tool Correctness Verification Experimental Setup . . 414.3 Experiments on Mobile Networks . . . . . . . . . . . . . . . . . 43
5 Evaluation 455.1 Application Correctness Verification . . . . . . . . . . . . . . . . 455.2 Measurements on HSPA Mobile Networks . . . . . . . . . . . . . 465.3 Measurements on EDGE Mobile Networks . . . . . . . . . . . . 50
v

5.4 Measurements on Bandwidth-limited Mobile Networks . . . . . . 535.5 Other Measurements . . . . . . . . . . . . . . . . . . . . . . . . 535.6 Measurement Test Performance . . . . . . . . . . . . . . . . . . 54
6 Conclusions 56
Appendix A Source Code 65
Appendix B Pseudocode 68
Appendix C Verification Test Results 72
Appendix D Mobile Operators Details 74
Appendix E Experiment Results 75
vi

Chapter 1
Introduction
The Internet is a large distributed system that involves the network infrastruc-ture, the hosts it connects, the traffic generated by the hosts and the protocols thatgovern the transmission of packets between hosts across the network. Proper mon-itoring, performance assessment, maintenance, and troubleshooting of networksplay a fundamental role in assuring the desired quality level of the offered ser-vice. Performance critical applications already exist, from financial transactionsto streaming multimedia, which require some Quality of Service quantities to bemeasured as accurately as possible. Plenty of tools have been developed to performactive and passive Internet measurement tests and to retrieve useful informationabout the current network state.
Nowadays, the number of mobile devices, which can connect to the Internet,and the amount of mobile traffic are increasing rapidly. During the last couple ofyears, so-called smartphone devices became very popular with the users aroundthe world. There is no standard definition of the term smartphone across the indus-try. However, the popular explanation defines a smartphone as a device that allowsusers to make telephone calls, and also provides the functions of a personal digitalassistants (PDAs), portable media players, compact digital cameras and GPS nav-igation units [1]. In addition, the following features are typical for smartphones[2]:
– Operating System: a smartphone is based on an operating system that al-lows it to run third-party applications;
– Software: while almost all the cell phones include some sort of software, asmartphone provides an advanced application programmer interfaces (APIs)for running third-party applications, which allow those applications to havebetter integration with the smartphone’s operating system and hardware (e.g.,interaction with video cameras, different built-in sensors, GPS, gaming con-trols, etc.). This allows to run more complex applications which provideadditional functionality;
1

– Internet Access: smartphones can access the Internet via Wi-Fi and mobilebroadband;
– Keyboard: smartphones usually include a QWERTY keyboard which canbe hardware or software (users type on a touch screen).
– Messaging: All cell phones can send and receive text messages, but whatsets a smartphone apart is its handling of e-mail. A smartphone can syncwith multiple e-mail accounts.
The smartphone users become active members of the Internet community. Theusers of mobile devices use various services such as web surfing, email, video andaudio streaming. Network traffic generated by mobile devices is increasing at thisvery moment along with the number of smartphone users and mobile services. Inour opinion, being able to run network measurement tests from smartphone devicesin order to discover whether provided connectivity performance satisfies users ex-pectations is a very useful ability to end-users. However, the existing networkmeasurement tools for mobile platforms (Android, iPhone, Windows Phone OS)mostly allow only to obtain the basic network information (e.g., local and globalIP addresses of the mobile device) and to measure the network performance (e.g.,downlink/uplink throughput, latency, round trip time).
One of the interesting topics is the so-called ”network neutrality”. Many In-ternet Service Providers (ISPs) want to restrict bandwidth-hungry applications thatcan hurt other applications in the network. Some also want to control applications,such as VoIP, that reduce ISPs ability to profit from competing services of theirown. In contrast, some other content providers are against traffic differentiationbecause it gives the ISPs arbitrary control over the quality of service experiencedby users. Many research projects have been done [3][4][5] and a number of mea-surement tools [6][7][8] have been developed in order to investigate how the dif-ferent traffic shaping policies are deployed by ISPs. However, the situation withtraffic shaping in mobile networks is still unexplored, mainly because of a lack ofa proper measurement infrastructure for mobile devices.
Thereby, during this master thesis project, we focus on developing a measure-ment tool suitable for running active Internet measurements on Android-poweredmobile devices. The main goal of our Master Thesis project is to develop an appli-cation for an Android Operating System (OS) [9] that helps to reveal the presenceof traffic differentiation based on deep-packet inspection techniques. The solutionis based on a client-server architecture. Client connects to a measurement serverto download and run various tests. During each test, the server and the client com-ponents exchange messages that carry application-level data, which conforms tothe application protocol that we want to test. This data is carefully constructed todetect traffic differentiation along the path. The client component can be installedon any Android-powered smartphone. And the server component runs on a Linuxmachine, which has a static global IP address. In order to distribute the client com-ponent among users, it has been published on Google Play [10] digital-distribution
2

multimedia-content service.In addition, we evaluate the results obtained from the experiments that have
been made on mobile networks in order to learn how and to which extent content-based traffic differentiation policies are deployed by different mobile service provi-ders. When we talk about mobile networks, we can speculate that mobile networkoperators might want to manipulate on the VoIP application’s traffic performance.VoIP applications for smartphone devices (Skype, Viber, Sipgate, MobileVoip) ac-tually are competitors for mobile service operators. To reduce financial lossesit is tempting to restrict the performance of traffic flows that carry VoIP data.In fact, many mobile Internet providers (e.g., NettoKOM, O2, Congstar) claim[11][12][13] that they do not support VoIP and Peer-to-Peer traffic on their net-works.
By analyzing the obtained measurement results, we will try to answer the fol-lowing questions about the presence of the content-based traffic shaping in mobilenetworks:
a) Do mobile Internet Service Providers apply traffic shaping techniques basedon the deep-packet inspection in order to restrict the performance of ”un-wanted” applications. Does it depend on the type of the network? For exam-ple, the same mobile operator provides Internet access using different net-work types (e.g. HSPA, EGDE). Thereby, it is interesting to know whetherand how content-based traffic differentiation policies differ on different net-work types within the same provider.
b) Does the performance of certain application protocols in mobile networksdepend on the time of the day? Can we observe the difference in applica-tions’ performances between day time and night time? Do mobile operatorsperform application-depend traffic shaping policies during the peak hours,when the number of concurrent users is larger than usually?
c) Most of mobile providers reduce the maximum network bandwidth for thoseusers who exceeded the monthly data download limit defined by a contract.Therefore, we will try to determine whether the mobile operators performcontent-based traffic shaping in case when the user has crossed that datalimit.
3

Chapter 2
State of the Art
2.1 Network Measurements Overview
Internet measurements techniques play an important role for network operatorsand providers. They are an efficient and robust way to determine how well a net-work performs and what kind of Quality of Service guarantees Internet providersare able to offer to their customers. By gathering data from the measurement tests,network providers can retrieve useful information which lately can be used for [14]:
– Performance adjustment: identifying and reducing bottlenecks, balancingresource use, etc.
– Troubleshooting: identifying and repairing faults end misbehavior
– Planning: predicting the scale and required hardware resources
– Characterization of traffic for providing data for modeling and simulation
– Understanding and controlling complexity: understanding the interaction be-tween components of the network and to confirm that functioning, innova-tion and new technologies perform as predicted and required
Network measurement methods can fall into two categories depending on theway how data has been collected: active and passive measurements. These twotypes of measurements generally focus on different aspects of network behavior.
In passive measurements, routers or other hosts measure existing traffic pass-ing through or destined to them. Typically data is collected in three ways: pollingmanagement information base (MIB) data from routers, packet monitoring andflow monitoring. Passive network measurements are useful in order to learn thenetwork topology, analyze the network workload or measure some end-to-end per-formance metrics like packet loss and delay [15].
Unlike the passive methods, in active networking measurements we addition-
4

ally inject probe packets into the network and measure network characteristics atdifferent points. The key idea is that we know the initial structure of the probetraffic, and so by measuring how it is affected by the portion of the network it tra-verses, network conditions can be inferred. Usually, by active measurements wemean end-to-end measurements, when the probes are observed only at the originand destination hosts, so there is no need to deploy additional monitors in between.The drawback of probing is that injected packets may possibly disturb the normaltraffic flow. This is why active measurements need to be carefully planned beforeexecution and usually the bandwidth reserved for the probe packets is limited. Typ-ically, active measurements are used in order to determine network performancecharacteristics such as latency, one-way or two-way packet delay, round-trip time,stream or upload speed or hosts availability.
In addition, combining active and passive measurements is called hybrid mea-surement. An example of a hybrid measurement could be a scenario where activeprobes are sent over a network and their progress is monitored by passive meansduring the measurement. This type of arrangement allows the measurer to trackthe path of the probes and record the intermediate and end-to-end delays.
The Internet performance measurements have a long history, and during the last30 years plenty of methodologies and techniques have been proposed and a largenumber of measurement tools have been developed. Thus, we can distinguish sev-eral categories of network measurement types accordingly to their intentions: net-work performance measurements, routing and topology measurements, audio andvideo streaming characteristic measurements, measurements in case of multicastcommunication, application and policy measurements.
2.1.1 Performance Measurements
One of the goals of Internet measurement is to determine the network perfor-mance. For example, some applications benefit from knowing the amount of band-width available on a network path, so that they can adapt their sending rate andshare the bandwidth more fairly. Performance measurements focuse on the analy-sis of end-to-end behavior and on the diagnosis of network problems. These effortstypically include the collection of end-to-end packet loss, delay and round trip timestatistics, most often performed by injecting test traffic into network, thus activemeasurements techniques are usually used in this case.
The most common metrics typically measured are latency, packet loss, through-put, utilization and availability. In order to standardize the networking measure-ment metrics to make the comparison of obtained results from different sourcespossible, the Internet Engineering Task Force’s (IETF) IP Performance MetricsWorking Group (IPPM) develops standards, called Requests For Comments (RFC),for the measurement of network performance. By July 2012 the following metricshad already been defined by RFC documents:
5

– IPPM Metrics for Measuring Connectivity (RFC 2678)
– A One-way Delay Metric for IPPM (RFC 2679)
– A One-way Packet Loss Metric for IPPM (RFC 2680)
– A Round-trip Delay Metric for IPPM (RFC 2681)
– A Framework for Defining Empirical Bulk Transfer Capacity Metrics (RFC3148)
– One-way Loss Pattern Sample Metrics (RFC 3357)
– IP Packet Delay Variation Metric for IPPM (RFC 3393)
Determining the current network performance presents a quite mature field ofinterests, and a large number of measurement techniques have been proposed. Themechanism of determining the Maximum Transmission Unit (MTU) is defined inRFC 1191 [16]. The core idea is to use the IP header’s ”Don’t Fragment” bit todiscover the Path MTU (PMTU). A source node first assumes that the PMTU is theMTU of the first hop. If a router on the path notices that the datagram cannot besent to a next hop without fragmentation, the router drops the packet and sends anICMP Destination Unreachable message back to the source node. When a sendernode receives these messages, it automatically reduces the size of the packets andthus the PMTU until it receives no more error messages.
R. Prasad, C. Dovrolis, M. Murray, K. Claffy in [17] provide a detailed reviewof existent methods to determine the available network bandwidth. There are fourmajor techniques that are used:
1. The Variable Packet Size (VPS) technique attempts to estimate the capacityof each link along a path. VPS does this by sending different sized probepackets from the source node to all nodes along the path and measuring theround-trip delay time (RTT) to each hop as a function of packet size.
2. The Packet Pair/Train Dispersion (PPTD) technique sends multiple identical(in terms of size) packets back-to-back and measure the dispersion of thepackets at the receiver side. The narrow link on the path causes an increasein the dispersion of the packets, so the available bandwidth can be detected.
3. The Self-Loading Periodic Streams (SLoPS) technique is able to estimate theavailable bandwidth. It is based on principle of sending the sequence ofequal sized packets at an increasing rate and to monitor the one-way delayvariations experienced by the packets.
4. The Trains of Packet Pairs (TOPP) technique is much like the SLoPS methodbut it uses different packet stream patterns and focuses on reducing measure-ment latency. In addition, instead of just estimating the available bandwidthit is also able to estimate the tight link on the path.
6

Session-Sender
Server
Control-Client Fetch-Client
Session-ReceiverOWAMP-Test
OWAMP-Control
OWAMP-Control
Figure 2.1: OWAMP roles distribution
The One Way Active Measurement Protocol (OWAMP) defined in RFC 4656[18] provides a high precision mechanism to measure one-way delay and latencyin the Internet. Additional design goals of OWAMP include: being hard to detectand manipulate, security, logical separation of control and test functionality, andsupport for small test packets. OWAMP also supports an encrypted mode that fur-ther obscures the traffic and makes it impossible to alter timestamps undetectably.Technically OWAMP consists of two inter-related protocols: OWAMP-Control andOWAMP-Test. OWAMP-Control is used to initiate, start, and stop test sessions andto fetch their results, whereas OWAMP-Test is used to exchange test packets be-tween two measurement nodes. The OWAMP architecture separates different rolesin order to be more flexible on scheduling and executing performance measure-ments (see Figure 2.1).
– Session-Sender: the sending host of the test session
– Session-Receiver: the receiving host of the test session
– Server: manages the test sessions, configures per-session states in the sessionendpoints, and returns the results of a test session
– Control-Client: initiates requests for test sessions, triggers the start or termi-nation of test sessions
– Fetch-Client: initiates requests to fetch the results of completed test sessions
The principle of OWAMP is quite simple: the test packets are sent from thesender to the receiver and the packet’s timestamps (send and receive times), se-quence numbers and TTLs are recorded on arrival. As OWAMP measures theone-way delay by comparing the timestamps on the sender’s and receiver’s end, itis clear that the clocks of both the sender and the receiver need to be synchronized.
Similar to OWAMP, the Two-way Active Measurement Protocol (TWAMP)
7

Session-Sender
Control-Client Server
Session-ReflectorTWAMP-Test
TWAMP-Control
Figure 2.2: TWAMP roles distribution
[19] has been developed in order to measure two-way packet delay and latencycharacteristics. The TWAMP provides a different role model, the Session-Receiveris replaced by the Session-Reflector which is capable of creating and sending testpackets when it receives test packets from a Session-Sender. Unlike the Session-Receiver, it doesn’t collect any information from test packets as round-trip delayinformation is available only after the reflected test packet has been received bythe Session-Sender. Another exception is that the Server component doesn’t havethe capability to return the results of a test session as the Session-Reflector it isassociated with doesn’t collect any results. Consequently, this means that there isno need for a Fetch-Client and thus it does not exists in the TWAMP architecture(see Figure 2.2).
In addition, plenty of network performance measurement tools have been im-plemented. The most popular are: iperf, pathload, traceroute and ping. On theCAIDA [20] web page, a rich collection of performance measurement tools withtheir descriptions can be found.
2.1.2 Routing and Topologies Measurements
Another goal of Internet measurements is to learn about the network topologyand traffic routes from the source to destination hosts. The knowledge about routesis extremely helpful for understanding the current situation in a network and fortroubleshooting. For instance, in some cases there might be a fault in the networkthat causes traffic to be routed the wrong way. Generating an artificial traffic flowthrough the network and inspecting its behavior can help to troubleshoot routingfaults. Running passive measurements and observing data flows can also help todetect bottlenecks in the network configuration.
The global infrastructure of the Internet is continuously changing. It is a really
8

challenging task to track and visualize this complex system. The goal of topologymeasurements is to collect information on connectivity, which backbone node isconnected to which, and to determine their geographical locations. Routing mea-surements provide insight into the dynamics of routing protocols and routing tableupdates. These are of great importance as the reliability and robustness of the In-ternet depends on the stability and efficiency of routing.
The Cooperative Association of Internet Data Analysis (CAIDA) [20] used theskitter [21] tool more that 10 years to monitor the Internet’s topology. Skitter al-lows to record each hop from a source to many destinations, collect round trip time(RTT) along with path (hop) data, and collect the data to visualize the network con-nectivity by probing the paths to many destination IP addresses spread throughoutthe IPv4 address space.
On February 2008, CAIDA deactivated skitter data collection and transitionedto the measurement infrastructure named Archipelago [22], which provides a morepowerful and flexible IPv4 and IPv6 traceroute active measurement tool. The initialfocus of Archipelago is coordinated large-scale traceroute-based topology mea-surements using a process called team probing. In team probing, monitors aregrouped into teams and dynamically divide up the measurement work among teammembers.
NetConfigs.Com [23] provides to ISPs a suite of tools to verify their peeringpolicies, identify errors, and apply (or request) policy changes accordingly. Peer-ing data (IPv4 prefixes and AS-paths) is collected from around the world and pro-cessed into a global-view database against which AS reports and BGP tools can berun.
LinkRank [24] is a graphical tool for visualizing BGP routing changes. This toolcan be used by BGP operators to understand routing dynamics as well as by peo-ple who want to learn more about BGP. LinkRank summarizes megabytes of BGPupdates received from collection points and produces easy to understand graphsindicating the segments of routes affected.
Similar functionality is provided by the BGPlay [25] tool. BGPlay is a Java ap-plication which displays animated graphs of the routing activity of a certain prefixwithin a specified time interval. Its graphical nature makes it much easier to un-derstand how BGP updates affect the routing of a specific prefix than by analyzingthe updates themselves.
The iffinder [26] tool allows to discover which IP addresses belong to interfaceson the same router.
2.1.3 Measurement of Video and Audio Streaming Performance
Internet active measurements also might be useful in more application specificscenarios, for example in measuring channel characteristics in case of voice andvideo data streaming. Multimedia streaming is a real time application, as a resultone of the the main challenges are optimizing video quality by active measure-
9
ments of links and enhancing the overall Quality of Service (QoS). The QoS itselfis a complex function which depends on many factors including the communi-cation channel characteristics like throughput, available bandwidth, jitter, packetdelay and loss. So, it is very important to measure those characteristics precisely,in order to dynamically adopt the data packets streaming to achieve the best Qual-ity of Service.
Mubashar Mushtaq and Toufik Ahmed in [27] presented a solution based onactive measurement of RTT values, which allows to perform smooth quality adap-tation for streaming of IP packet video. They used a receiver-centric mechanismi.e., the receiver peer is in charge for selection of active peers and it also coordi-nates the overall streaming mechanism by switching from one congested node toanother present in the subset of candidate peers offering better QoS.
Reza Rejaie and Antonio Ortega have proposed a framework PALS [28]. PALSis a receiver-driven framework for quality adaptive playback of encoded mediastreaming, where a receiver coordinates delivery of layer encoded stream frommultiple senders. A peer selection criterion has been proposed based on the overalleffective throughput. There is no information available in the start so initial peersare selected on random basis.
Prasad Calyam et al, in [29], describe common end-to-end performance prob-lems in the H.323 protocol, that defines how real-time multimedia communica-tions, such as audio and video-conferencing, can be exchanged on packet-switchednetworks (Internet). Furthermore they developed the H.323 Beacon tool that canbe used to measure, monitor and qualify the performance of an H.323 video con-ference session. It can help an end-user/network engineer operator, as a debuggingtool by providing H.323-protocol specific evidence and other information neces-sary to troubleshoot H.323 application performance problems in the network.
Qian Zhang, Wenwu Zhu and Ya-Qin Zhang in [30] designed an end-to-enddistortion-minimized resource allocation scheme for scalable video transmissionover 3G wireless network using channel-adaptive hybrid unequal error protection(UEP) and delay-constrained automatic retransmission request (ARQ) error con-trol schemes. They presented dynamic measurements of error rate and throughputfor 3G wireless networks, which were used for resource allocation between sourceand channel coding.
M. Lundeval, B. Olin and others in [31] evaluate different scheduling algorithmsfor video streaming over High-Speed Downlink Packet Access (HSDPA) networks.The HSDPA communication protocol improves downlink performance on mobilenetworks and is currently being deployed in networks around the world. The Au-thors consider performance aspects of different scheduling algorithms with the aimof providing QoS for streaming applications in a scenario with mixed interactive(web browsing) and streaming services.
10

2.1.4 Multicast Measurements
Another type of network measurements that we can distinguish are measure-ments in case of multicast communication. In this scenario, multicast datagramsare delivered to all members of their destination host group, which changes dy-namically during the time. That means that hosts may join and leave the group atany time, and usually there is no restrictions on the location of members in the hostgroup. The forwarding of IP datagram is handled by so-called ”multicast routers”.The structure of data flow shapes a tree and the data flows from the root (usuallysource of the data) to the leaves. So, the multicast data monitoring becomes a chal-lenge, because it involves monitoring the distribution trees for each of the sendersand all branches of each tree.
One more important factor, that makes multicast measurements difficult is thelack of information about receivers; every node that sends data to a multicast grouponly knows about the nodes from the next level of the tree. Given these charac-teristics of multicast communication, the set of measurement metrics as well asmeasurement methodology is different than the in unicast case. Instead of measur-ing a single value that is a channel characteristic, it makes more sense to measurethe set of the specific values between the source and each receiver. The followingmetrics can be used to describe the quality of multicast communication channel:
– The set of the one way delay values between the source and each receiver
– The set of the packet loss results between the source and each receiver
– The number of time the measurement packet is repeated by a node (forrouters)
T. Saadawi in [32] extends unicast resource measurement techniques to multi-cast environments to estimate bottleneck link bandwidth. They also introduced anovel way to measure end-to-end queuing delay by using a pair of packets withdifferent priorities. The major benefit of the proposed method is that it doesn’t re-quire time synchronization and does not need to communicate with core routers.
Multicast monitoring tools can be divided into several categories: RTP mon-itoring tools, multicast routing diagnostics, multicast traceroute tools and multi-cast backbone (MBONE) mapping tools. Tools from the first group (RTP tools) areused to monitor the quality of the data transmission and popularity of individualsessions: MHealth [33] is a graphical, near real-time multicast monitoring tool.By using a combination of application level protocol data about group participants,and a multicast route tracing tool for topology information, MHealth is able to dis-cover and display the full network tree distribution and delivery quality. MHealthalso provides data logging functionality for the purpose of isolating and analyzingnetwork faults. Logs can be analyzed to provide information such as receiver listsover time, route histories and changes, and the location, duration, and frequencyof loss. Mlisten [34] was developed for the collection and processing of MBONE
11

membership information. The tool can be used to generate information about joinand leave statistics, connection time characteristics, and multicast tree size andcharacteristic. RTPMon [35] allows network administrators or support personnelto monitor listenership as well as session quality experienced by subscribers. Thetool also facilitates tracing the cause of problems resulting in quality degradation.To accomplish this task, RTPMon summarizes and analyzes information providedby RTCP source and receiver reports.
Multicast router diagnostics are used to collect information about the state ofmulticast routers: mrinfo [36] displays information about a multicast router to dis-cover the router’s physical and virtual interfaces. Routes are queried for their ver-sion number, and if this query is successful, for their metrics, thresholds and flags.Mantra [37] is a tool for monitoring the multicast traffic at the router level. It pe-riodically collected multicast routing information (e.g., MSDP and MBGP tables)from multicast-enabled backbone routers in the Internet. Then Mantra processedthis information to generate useful statistics about the deployment and availabil-ity of multicast across the inter-domain. The information collected by Mantrahas helped researchers and network administrators understand multicast operation,routing protocol interaction and evolution of the infrastructure.
Multicast traceroute tools are used to trace the path between the sender and des-tinations. One of the most popular tools is Mtrace [38]. The Mtrace tool is used toreturn a snapshot of the set of links used to connect a particular source with a par-ticular destination. Additional Mtrace options allow a user to measure the numberof multicast packets flowing across each hop.
MBONE mapping tools are used to map out the topology for a particular group.These tools can show the topology at the level of individual systems, or at the levelof autonomous system connections. Mrtree [39] uses a combination of IGMP andSNMP queries to discover the actual and potential multicast (sub)trees for a givensource and group, rooted at a given router. An actual tree, discovered using themulticast routing MIB, consists of routers which are currently forwarding multi-cast traffic to a group from a given source.
2.1.5 Application and Policy Measurements
In the real world the traffic management policies usually are driven by businessinterests (depending on peering and data transition agreements between providers),and many ISPs do not publicly disclose the details of their middlebox deployments.Those middleboxes, such as firewalls, blockers and traffic shapers are used to mon-itor and manipulate the data flown through. To achieve more revenue, ISPs may usedifferent techniques, for example the traffic shaping to optimize the performance.
Traffic shaping is a network management technique which delays some or alldatagrams to bring them into compliance with a desired traffic profile [40], and itcan be used to control the volume of traffic being sent into a network in a speci-
12

fied period, or the maximum rate at which traffic is sent. From the one side, usingintelligent traffic shaping schemes may guarantee a particular Quality of Servicefor an applications, and it can help IPSs optimize the use of their network, e.g.,to avoid the congestive collapse in the Wi-Fi based protocols. However, from theend-user perspective view, using this technique means that data which is sent bya user into the network might be artificially delayed by its ISP, which naturallyis not what users expect from their providers. Recently, it has been reported thatcertain access ISPs [41] are blocking their customers from uploading data usingthe popular BitTorrent protocol. The ISPs were found to tear down TCP connec-tions, identified as BitTorrent flows, by sending forged TCP reset packets to theend hosts. Furthermore, not only the P2P traffic can be blocked, but other data likeflash video, email or SSH transfer might be restricted as well, depending on theprovider’s policy configuration.
To differentiate between flows of different types, i.e., belonging to different ap-plications, ISPs must distinguish the packets of one flow from those of other flows.This can be done by examining one of the following [3]:
– The IP header. The source or destination addresses can determine how anISP treats a flow. For example, universities routinely rate-limit only trafficthat is going to or coming from their student dorms.
– The transport protocol header. ISPs can use port numbers or other transportprotocol identifiers to determine a flow’s treatment. For example, P2P trafficis sometimes identified based on its port numbers.
– The packet payload. ISPs can use deep-packet inspection (DPI) to identifythe application generating a packet. For example, ISPs look for P2P protocolmessages in packet payload to rate-limit the traffic of P2P applications, suchas BitTorrent.
In addition to features of a flow itself, an ISP may use other criteria to determinewhether to differentiate. Some of these include:
– Time of day. An ISP may differentiate only during peak hours.
– Network load. An ISP may differentiate on a link only when the networkload on that link is high.
– User behavior. An ISP may differentiate only against users with heavy band-width usage.
There are a number of ways how an ISP can treat one class of packets differ-ently:
– Blocking. One form of differentiation is to terminate a flow, either by block-ing its packets or by injecting a connection termination message (e.g., send-ing a TCP FIN or TCP RST packet).
13

– Deprioritizing. Routers can use multiple priority queues when forwardingpackets. ISPs can use this mechanism to assign differentiated flows to lowerpriority queues and to limit the throughput of certain classes.
– Packet dropping. Packets of a flow can be dropped either using a fixed orvariable drop rate.
– Modifying TCP advertised window size. ISPs can lower the advertised win-dow size of a TCP flow, prompting a sender to slow down.
– Application-level mechanisms. ISPs can control an application’s behavior bymodifying its protocol messages. For example, transparent proxies [42] canredirect HTTP or P2P flows to alternate content servers.
As a result, several techniques were developed, based on the Internet activeand passive measurements, which allow to detect if ISPs use traffic blocking ortraffic shaping. Marcel Dischinger et al in [4] present a large-scale measurementstudy of BitTorrent traffic blocking by ISPs. They designed and developed a toolcalled BTTest, which enables end users to test for blocking on their own accesslinks. BTTest emulates BitTorrent flows between end hosts and test servers, usingthe standard BitTorrent protocol and identifies the traffic blocking based on flowcharacteristics.
Another tool that has been designed and implemented by Marcel Dischinger,Massimiliano Marcon and others is called Glasnost [3]. Glasnost is a tool thatattempts to detect whether your Internet access provider is performing application-specific traffic shaping, It allows you to test if your ISP is throttling or blockingemail, HTTP or SSH transfer, Flash video, and P2P applications including BitTor-rent, eMule and Gnutella.
NetPolice [6] (previously named NVLens [43]) compares the aggregate lossrates of different flows to infer the presence of ”network neutrality violations” inbackbone ISPs.
NANO [5] uses causal inference to infer the presence of traffic performancedegradation. NANO relies on a vast amount of passively collected traces frommany users to infer if traversing a particular ISP leads to poorer performance forcertain kinds of traffic. It uses active measurements and a simple head-to-headcomparison of two flows to quickly inform users whether they face traffic differen-tiation – without relying on other users.
ShaperProbe [7] also detects whether traffic shaping is used in the upload ordownload directions, and in that case that it is used, ShaperProbe reports the shap-ing rate and the ”maximum burst size” before shaping begins.
DiffProbe [8] detects whether traffic differentiation based on active queue man-agement (AQM), such as RED and weighted fair queueing, is deployed in the net-work path. DiffProbe can detect differentiation that leads to small increase in la-tency and can identify the AQM technique used.
Neubot [44] runs in the background, as a daemon, and periodically performstests to measure network performance and application-specific throttling. Cur-
14
rently, two tests are implemented: one that emulates HTTP flows and another thatemulates BitTorrent flows.
2.2 Internet Measurement Infrastructures
Another important aspect of network measurements is the problem of sharinglarge Internet measurements datasets between different research projects. Whilestandalone tools that have been developed recently allow to perform accurate mea-surements to test network performance, which is important to the network admin-istrators, researchers need to collect their own data, and perhaps even develop theirown measurement tools before investigating a given question. Furthermore, a net-work operators also might be interested in obtaining real-time data in order tooptimize their network infrastructure, since the data-heavy multimedia networkapplication becomes more and more popular. In an effort to make the gatheringof the measurement data in a large scale easier and attract more participants (in-dividual persons, as well as institutions) involved into the measurement process,several projects have been founded by different groups of researchers, that providea well-designed infrastructure for performing broadband connection measurementand collecting the results.
2.2.1 M-LAB
Measurement Lab (M-Lab) [45] is an open, distributed server platform for re-searchers to develop, test, and deploy new active measurement tools. The goal ofM-Lab is to advance network research and empower the public with useful infor-mation about their broadband connections. Currently, instead of focusing on theInternet core, M-Lab focuses on measuring the end-to-end performance and onthe characteristics of broadband access links. Measurements capture basic opera-tional characteristics (e.g., TCP throughput, available bandwidth), advanced hostdiagnostics (e.g., misconfiguration, small socket buffer sizes), and ISP traffic man-agement practices (e.g., BitTorrent blocking, traffic shaping). M-Lab is helpingbuild a common pool of network measurement data, removing the need for everyresearch project to collect its own data and facilitating cross-sample analyses. Alldata collected through M-Lab is made publicly available and placed in the publicdomain.
The M-Lab platform uses a number of purpose-built and well-connected mea-surement servers in strategic locations around the globe. Currently, a total of 45servers are operational across 15 geographically distributed sites in the UnitedStates and Europe. Each tool is allocated dedicated resources on the M-Lab plat-form to facilitate accurate measurements. Server-side tools are openly licensedto allow third-parties to develop their own client-side measurement software. Re-
15

searchers and network scientists that are interested in running their tools on theM-Lab platform can contact M-Lab’s steering committee, which coordinates re-search on the M-Lab platform. Once granted access, researchers can login and runtheir experiments on M-Lab servers. Using the M-LAB platform brings benefits toresearchers, since it helps to:
– expose measurement tools and systems to a large number of users, since it isusually quite difficult to deploy a measurement tool to many highly available,well-connected servers around the world;
– validate analytical and simulation models with data from real-world Internetpaths; instead of making assumptions about the available capacity, delays,losses, presence of traffic shapers, buffer sizes, etc., an analytical or simu-lation model can be grounded on measurements derived from the availableM-Lab data;
– share and analyze datasets collected on M-Lab;
– avoid the administrative and operational overhead involved in managing alarge-scale distributed server platform.
2.2.2 SamKnows
SamKnows [46] provides a broadband performance measurement platform basedon special hardware devices called Whiteboxes. SamKnows Whiteboxes are con-sumer grade, home Wi-Fi routes with additional testing software integrated, thatcan be deployed onto the home network in order to test and report a range of met-rics:
– Web browsing: the total time taken to fetch a page and all of its resourcesfrom a popular website;
– Video streaming: the initial time to buffer, the number of buffer under-runsand the total time for buffer delays;
– Voice over IP: upstream packet loss, downstream packet loss, upstream jitter,downstream jitter, round trip latency;
– Downstream speed/Upload speed: throughput in Megabits per second utilis-ing three concurrent TCP connections;
– UDP latency: average round trip time of a series of randomly transmittedUDP packets;
– UDP packet loss: percentage of UDP packets lost from latency test;
– Consumption: volume of data downloaded and uploaded by the panellist;
– Availability: the total time the connection was deemed unavailable;
16
– DNS resolution: the time taken for the ISP’s recursive DNS resolver to returnan A record for a popular website domain name;
– ICMP latency: the round trip of five regularity spaced and schedule ICMPpackets;
– ICMP packet loss: the percentage of packets lost in the ICMP latency test.
The Whitebox can operate in a two modes: operate as a router, replacing theuser’s existing Ethernet router (in this case, all wired and wireless devices shouldconnect through the Whitebox) or operate as an Ethernet bridge, co-existing withan existing router (all wired devices should connect through the Whitebox, whilethe wireless devices should continue to connect to their existing routers).
The SamKnows Whiteboxes on panellists’ home networks execute a series ofsoftware tests over their broadband Internet connection. A test cycle on the White-box occurs once an hour every hour (24 times per day). The timing of the test-ing is randomized per Whitebox. Once a testing cycle is complete, the results ofthese tests are reported securely up (over SSL) to a hosted backend infrastructure.Whitebox communicates with a backend via the special gateway, called the datacollection service (DCS). The collected data is available to the end-users via theweb-based reporting system.
2.2.3 RIPE Atlas
The RIPE Atlas project [47] is a distributed Internet measurement network con-sisting of thousands, potentially up to tens of thousand of measurements nodes,also called active probes, placed all around the Internet, all connected to a control-ling framework. The main goal of RIPE Atlas is to take active measurements in acoordinated fashion, thereby supplying more measurement data for the benefit ofthe research community, and in general to the Internet community.
The vantage points in RIPE Atlas are called probes. They are tiny hardware de-vices capable of executing active measurements. They can be deployed anywhere:in residential settings, corporate networks and ISP infrastructures. Probes requirevirtually no configuration, and they execute their measurement tasks completelyautonomously.
The probes are controlled by a hierarchical infrastructure. This infrastructuretakes care of coordinating measurements, collecting and visualizing results, inter-acting with users, etc. Currently the RIPE Atlas measurement system executesbuilt-in measurements, such as ICMP ping to pre-defined destinations (measuringthe round trip time), traceroutes to these destinations, current uptime, uptime his-tory and total uptime, DNS (anycast) measurements, where for each root nameserver, they try to determine which instance of the name servers the probe ends upconnecting to. The measurement system takes care about scheduling such measure-ments, finding the appropriate probes to use, collecting and visualizing the results.
17

The measurement data generated by the system is recorded and kept as part of theRIPE NCC Internet measurement data set, which is available to researchers andother interested parties for further analysis. Furthermore, in the near future RIPEAtlas will provide the possibility to perform user defined network measurements.
2.3 Network Measurements for Mobile Platforms
Being able to run Internet measurement tests from mobile devices can bringadditional benefits, to all interested participants such as network administrators,service providers, researchers or end-users. In our opinion there are several reasonswhich makes smartphones good candidates for running measurements on them:
1. Smartphones became extremely popular during last couple of years, and thenumber of devices that have been activated is increasing daily. For example,in March 2011, Apple Inc. reported [48] about more that 100 million iPhoneshave been sold in the world, and in November of 2011, the total number ofAndroid-based devices (smartphones and tablets) that have been activatedexceeded 200 million [49]. So the smartphones market is very developedand mature right now.
2. Deploying a special network measurement application on smartphone, turnsit to some kind of a ”probing host” (like SamKnows Whitebox or RIPE Atlasprobe). And since there is no need to deploy additional hardware compo-nents into the network (no need to produce and deliver them), the numberof active probes might grow much faster than in hardware-oriented measure-ment infrastructures.
3. Since smartphones are mobile devices, now a ”probing host” becomes a mo-bile host, i.e., the smartphones change their geographical location during thetime, which leads to a single device can perform active Internet measure-ments from different locations (or/and different Internet providers). Thisproperty is useful for network researchers, because they can collect mea-surement results which presents data from more geographical locations muchfaster. In this way smartphones potentially become are a very attractive in-frastructure for performing Internet measurement tests and collecting ob-tained results.
4. Furthermore, most smartphone devices are able to determine their currentgeographical location using the GPS system, which is usually is not the casewhen tests are run from stationary desktops or laptops. This can bring ad-ditional benefits to broadband connectivity measurements, since now the ac-tual geographical position can be assigned to a particular measurement testresult.
18

5. Finally, the performance and policy management measurement tools can beuseful to end-users to monitor and troubleshoot the current state of the mo-bile network.
2.3.1 Internet Measurement on Mobile Networks Overview
The existing network measurement tools for mobile platforms (Android, iPhone,Windows Phone OS) mostly allow only to obtain basic network information (e.g.,local and global IP addresses of the mobile device) and to measure the networkperformance (e.g., downlink/uplink throughput, latency, round trip time).
The Network Diagnostic Tool (NDT) [50] is an application for Android-basedsmartphones for running network speed and diagnostic tests. An NDT test reportsthe upload and download speeds, in addition it also attempts to determine what, ifany, problems limited these speeds, differentiating between computer configurationand network infrastructure problems. The NDT server collects test results, recordsthe user’s IP address, upload/download speed, packet headers and TCP variablesof the test. Note that Network Diagnostic Tool is a part of the M-LAB Internetmeasurement platform.
The WindRider [51] application has been developed for the Windows mobileplatform. It attempts to detect whether your mobile broadband provider is per-forming application or service specific differentiation, i.e., prioritizing or slowingtraffic to certain websites, applications, or content. In addition, passive measure-ments are performed on the mobile device. The application measures the delaysexperienced by different web pages and records the explicit user feedback aboutdifferent applications. WindRider can be installed on a mobile device such as aPocket PC.
The Fing [52] is a multiplatform (Linux, Mac OS, Windows, Android, iPhone,iPod, iPad) toolkit for network management, which allows to perform service scans(TCP port scan), hosts availability detection, traceroute, MAC address and vendorgathering, TCP connection testing, DNS lookup.
MobiPerf [53] is a handy mobile network measurement tool designed to col-lect anonymous network measurement information directly from end users. It runson Android and iOS devices and within 2-3 minutes, users are able to obtain ba-sic network information (e.g., the device’s IP address as seen by the server andthe network type such as HSDPA), network performance information (e.g., down-link/uplink throughput in kbps) and network policies (e.g., testing which ports areblocked by the cellular ISPs).
The RadioOpt Traffic Monitor [54] measures data traffic consumed by your wifiand cellular interface. It also can measure download and upload throughput as wellas ping durations via an integrated speed test (available for Android OS based de-vices).
J. Prokkola, P. Perala and M. Hanski in [55] analyze the performance measure-ments (including one-way delay and jitter) in live 3G/HSPA networks by compar-
19
ing TCP and UDP goodput performance in WCDMA, HSDPA-only, and HSPAmobile networks. Also they discuss the impact of different properties like speed,signal strength, handovers onto the network performance.
In [56] K. Pentikousis, M. Palola, M. Jurvansuu, and P. Pekka present theresults of extensive experimentation and performance measurements with publicWCDMA 3G/UMTS networks. In this paper the so-called ”first connection good-put phenomenon” is explained. This phenomenon refers to that the observed good-put of the first of a series of back-to-back transfers is consistently below par. Inaddition, authors pay attention on the precise bandwidth measurement in mobilenetworks. Particularly they conclude that high goodput rates are only achieved us-ing large payloads.
In [57] a passive methodology for TCP performance evaluation over GeneralPacket Radio Service (GPRS) networks is presented. This technique relies on traf-fic monitoring at the GPRS ingress/egress router interface. Based on the IP andTCP headers of the packets authors estimate the end-to-end performance of TCPconnections such as connection setup behavior and data transfer performance.
2.3.2 Traffic Shaping Detection on Mobile Networks
In section 2.1.5 we discussed the measurement instruments to run applicationand policy measurements. In particular, several projects for traffic shaping detec-tion were mentioned above. Let’s look at what the State of the Art for such kind ofapplications for mobile devices and mobile networks is.
In 2009, a group of researchers from the North Western University (Evanstonand Chicago, Illinois, U.S.A.) have started a project called WindRider [51]. Wind-Rider is an application for mobile devices that performs active and passive Internetmeasurements. One of the goal of this measurement tool is to detect whether yourmobile broadband provider is performing application-specific or service-specificdifferentiation. By June 2012, the implementation for Windows Mobile 5 opera-tion system was completed. However, this version of mobile OS is outdated nowand it is not supported anymore. WindRider implementations for Apple IOS andAndroid OS were announced, but none of them have been finished yet. Moreover,the website of this project has not been updated for the last two years, and the cur-rent status of this project is unknown.
One of the most popular applications for traffic shaping detection is called Glas-nost [3]. Using this application, you can test if your ISP is throttling or blockingdifferent types of application-layer protocol traffic, like P2P protocols (includingBitTorrent, eMule), HTTP traffic, SSH transfer, Flash video and others. Glasnostis based on a client-server architecture, where the client connects to a Glasnost-server to download and run various tests. Each test measures the path between theclient and the server by generating flows that carry application-level data which areconstructed to detect traffic differentiation along the path.
However, Glasnost is not applicable for running on smartphone devices, be-
20

cause:
– the Glasnost-client component is implemented using Java Applet technol-ogy, but unfortunately Apple IOS devices do not support running Java ap-plets; and Android OS offers only limited applet support, which makes itimpossible to run the Glasnost-client on Android-based smartphones;
– In addition, the Glasnost tests were not designed to use them on mobilenetworks. As a result, a single test execution might consume more than 100MB of data traffic, which is completely unacceptable for mobile Internetusers.
Other existing tools (mentioned in section 2.1.5) have different client ports fordifferent operational systems (MAC OS X, Linux, FreeBSD, Windows). But nonethem has an implementation that can be run on modern mobile platforms (Android-based or iOS-based). So, currently there is no working application for smartphonedevices that can perform traffic shaping detection. The only workaround to makesuch measurements on mobile networks, is to use a smartphone device as an Inter-net bridge, and run one of the mentioned applications on the connected workstation(or laptop).
21

Chapter 3
Implementation
In this chapter we will provide information about a tool developed in the frameof the master thesis project, which can be used for Android smartphones and helpsto detect the deep-packet inspection based traffic shaping on mobile networks. Wewill start from the application architecture overview and the basic idea of the tech-nique that helps to detect the traffic shaping along the path. Then we will talkabout the client’s pre- and post-test request processing, the format of the protocoldescription files which are used to define the measurement tests, the measurementtest lifecycle and finally we will discuss the algorithm of statistical analysis of ob-tained measurement results.
3.1 Traffic Shaping Detection Tool Overview
As we have discussed in subsection 2.1.5, ISPs can differentiate between flowsof different types by examining the IP headers, the transport protocol headers orthe packet payloads. During this project, we created an application for Android OSthat helps to detect the traffic shaping based on the deep packet inspection tech-niques. In other words, we assume that IPSs perform deep packet inspection todetermine whether a flow carries some ”unwanted” application protocol data. De-tection of the presence of traffic differentiation based on examining IP headers ortransport protocol headers is not considered in this thesis. Another limitation ofour measurement tool, is that all communication between the server and the clientcomponents is done using stream sockets (implemented on top of the TCP proto-col). Therefore, the application can detect traffic shaping of only those applicationprotocols, which use TCP on the underlying transport layer.
The application is based on a client-server architecture (see Figure 3.1). Aclient connects to a measurement server and retrieves the list of available applica-tion protocols to test. The client can select one of these protocols and downloada corresponding application protocol description file from the server side. Each
22

Figure 3.1: Traffic shaping detection tool lifecycle overview (∗this sequence di-agram does not present the lifecycle of measurements for protocol and randomflows, refer to section 3.4 for more details).
description file provides a set of rules, which define the client’s and the server’s be-havior during the measurement test (please, refer to section 3.2 for more details).Once the client downloads a particular protocol description file, it can start a mea-surement test that checks whether current ISP deploys some traffic differentiationpolicy for the selected application protocol or not. We do not want to collect anydata about the measurements without client’s permission, therefore all measure-ment test results are stored locally on the client’s smartphone. Users can submitmeasurement results to the server side manually. The pre-measurement test and thepost-measurement test client requests processing is discussed in Section 3.3. Themeasurement test execution details are presented in Section 3.4.
The core idea behind the traffic shaping detection measurement test is the emu-lation of a pair of flows that are identical except in one respect that should triggertraffic differentiation along the path. In the context of this paper, when we talkabout the flow, we mean the sequence of packets that are exchanged between theserver and the client sides in both directions within the same TCP connection. Theperformance of the flow implies the application goodput during the lifetime of thisflow. According to the goodput definition, this is the number of useful informa-tion bits, delivered by the network to a certain destination, per unit of time [58].We distinguish two components: downlink performance and uplink performance.The first component denotes the application goodput in download (from the server
23

to the client) direction, and the second component denotes the application good-put in upload (from the client to the server) direction respectively. Measuring andcomparing the performance of those two flows helps to determine whether content-based traffic shaping methods were applied or not. Since my application for trafficshaping detection injects custom packets into the network during the measurementsit can be classified as an active measurement tool.
Let’s consider an example of constructing a pair of flows that can help to re-veal the presence of traffic shaping of a BitTorrent [59] application protocol alongthe path (see Figure 3.2). The left figure corresponds to the first flow. The clientopens a TCP connection to the measurement server (the Figure 3.2 represents onlythe application layer protocol messages, hence the TCP handshake is not shown)and starts sending packets that implement the BitTorrent protocol. In this case, thepayload of the packets carry BitTorrent protocol headers and content. The serverin its turn responds with packets that conform to the BitTorrent specification.
The packet exchange on the right figure corresponds to the second flow. Now,the client opens another TCP connection and sends the same packets, but in thiscase the payload contains randomly generated data. Note that packets preservetheir sizes as in the first flow.
The two flows traverse the same network path and have the same network-level characteristics. As a result an Internet Service Provider that differentiatesBitTorrent traffic would impact only on the first flow, and keep the second flow’sperformance untouched. Thus, significant differences in those two flows’ perfor-mances are likely to be caused by the traffic manipulation along the path. If theISP completely blocks BitTorrent traffic, it also would be noticed because one ofthe participating sides (client, server or both of them) will receive a socket time-out. And the flow with random data will successfully finish the packets exchangingmeasurement cycle.
The presented traffic shaping detection technique is similar to that used in theGlasnost [3] project. The benefit of the proposed technique is that we are runningan active measurement test. This implies that we totally control the measurementtest lifecycle (we can repeat flows with different properties like payloads or portnumbers). As a drawback, we need to generate and inject additional data into thenetwork, which in case of mobile networks (EDGE, HSPA) is still relatively ex-pensive. Additionally, the active measurement tests allow to make a conclusionabout the presence of traffic differentiation along the path without involving otherusers into a measurement process. Unlike the projects based on the passive detec-tion techniques (e.g., NANO [5]), which require making observations from manyend-hosts.
DiffProbe [8] also uses an active probing method in order to detect whether anISP is deploying forwarding mechanisms such as priority scheduling, variationsof Weighted Fair Queuing (WFQ) or Weighted Random Early Detection (WRED)to discriminate against some of its customer flows. Like in our proposed method,DiffProbe also traverse the network with two separate flows: an Application flowand a Probing flow. The difference is that instead of measuring network bandwidth,
24

Client Server
Handshake 68B
Handshake 68B
Bitfield 166B
Bitfield 166B
Request 17B
Piece 512KB
Request 17B
Piece 512KB
Client Server
Random 68B
Random 68B
Random 166B
Random 166B
Random 17B
Random 512KB
Random 17B
Random 512KB
a) BitTorrent Flow b) Random Flow
Figure 3.2: A pair of flows used to detect BiTorrent traffic differentiation along thepath.
DiffProbe compares delays and packet losses experienced by these two flows. Inthis way, DiffProbe complements the proposed traffic shaping detection method asit can detect differentiation that leads to a small increase in latency. However, assoon as active queue management techniques, used by ISP, affect on the applicationgoodput, we can also detect this type of traffic differentiation.
3.2 Protocol Description Files Format
In this section we discuss the format of so-called protocol description files thatare used by the server and the client in order to construct the flows that carry head-ers and payloads of a particular application protocol.
Only flows that carry packets which conform to an application protocol that wewant to test will trigger the traffic shaping (if shaping policy for particular protocolexists). Therefore, a set of the rules that define protocol headers and payloads mustbe defined for every application protocol for which we would like to be able to runmeasurement tests.
First, we had an idea to replay network traffic for corresponding application pro-
25
tocols previously captured with Wireshark [60] and stored in pcap [61] files. How-ever, during the development phase, we faced the problem of reading pcap files onAndroid smartphones. There is no working library available for parsing pcap for-matted files for Android OS. The only solution found was a Jnetpcap for Androidlibrary [62], which is still in an early development phase and non-optimized. Thisopen-source library is able to read pcap files, though its performance does not al-low to use this library in a real application, because of the slow data parsing speed.For example parsing a small pcap capture file with only 6 records (each record lessthan 2 kB) on a HTC Desire S smartphone (CPU 1GHz, RAM 768 MB, AndroidOS version 2.3.5) took approximately 5 seconds. Fixing performance problems, aswell as creating our own pcap-parser solution for Android OS, would have takentoo much time. So, we had to abandon the idea of using pcap formatted files in ourtraffic shaping detection tool.
As a result, we decided to create a so-called protocol description file for everyapplication protocol for which we would have liked to provide measurement tests.The proposed protocol description file format is very similar to the format used inthe Glasnost [3] application. The reason why we did not use the Glasnost formatand developed our new own format was that the measurement test lifecycles aredifferent in these two projects. The Glasnost protocols description file containscommands and parameters that are redundant in our application, and vise versasome of command that we need are not presented there.
Each protocol description file defines the name of the application protocol, portnumbers that should be used during the measurement tests, well-known port num-bers that might be officially or unofficially assigned to a particular application pro-tocol, and a sequence of commands that tells how to construct a payload whichconforms to a protocol specification.
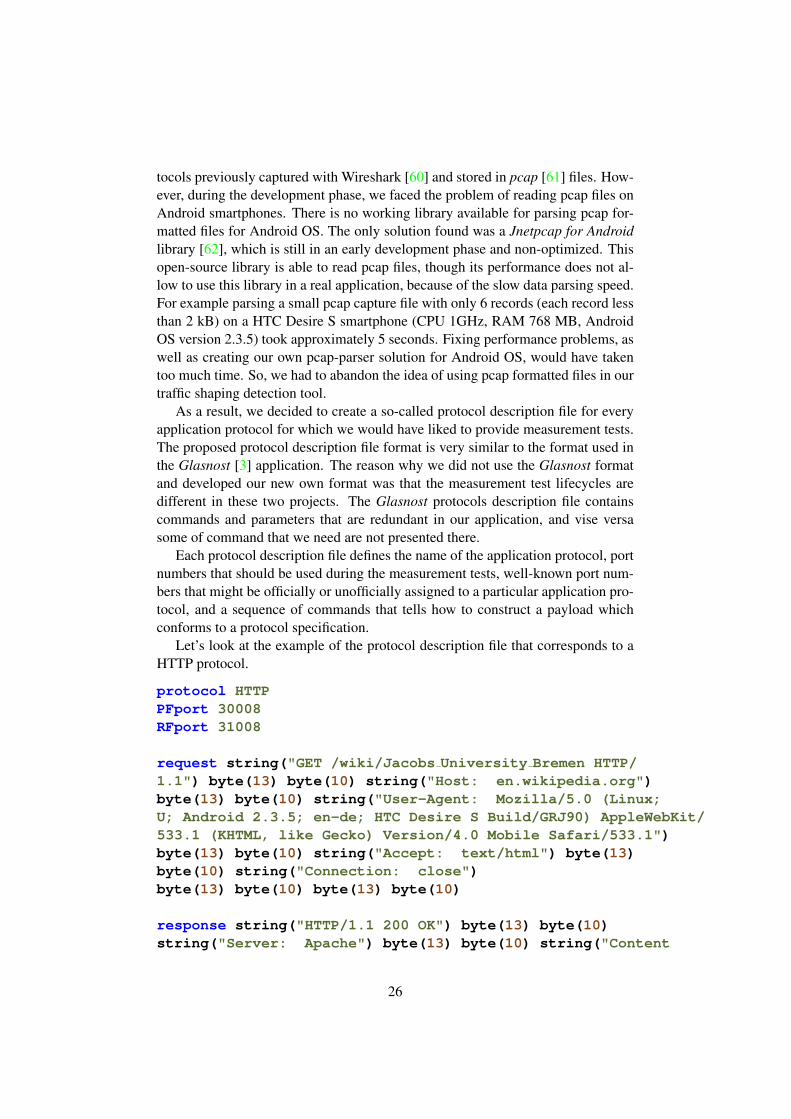
Let’s look at the example of the protocol description file that corresponds to aHTTP protocol.
protocol HTTPPFport 30008RFport 31008
request string("GET /wiki/Jacobs University Bremen HTTP/1.1") byte(13) byte(10) string("Host: en.wikipedia.org")byte(13) byte(10) string("User-Agent: Mozilla/5.0 (Linux;U; Android 2.3.5; en-de; HTC Desire S Build/GRJ90) AppleWebKit/533.1 (KHTML, like Gecko) Version/4.0 Mobile Safari/533.1")byte(13) byte(10) string("Accept: text/html") byte(13)byte(10) string("Connection: close")byte(13) byte(10) byte(13) byte(10)
response string("HTTP/1.1 200 OK") byte(13) byte(10)string("Server: Apache") byte(13) byte(10) string("Content
26
-Language: en") byte(13) byte(10) string("Content-type:text/html; charset=utf-8") byte(13) byte(10) string("Content-Length: 20") byte(13) byte(10) byte(13) byte(10)string("12345678901234567890")
The first line defines an application protocol name which is visible to an enduser. The protocol name might be an arbitrary string value placed right after a key-word protocol (separated by a space character). Note, that the application protocolname is a mandatory field and it must be unique for each protocol description file.In addition it must not contain space characters.
Next two following properties (PFport and RFport) define the TCP port num-bers which are used to communicate with a server during the measurement tests.The destination port number defined by the PFport field is used by a client to es-tablish a TCP connection for sending a flow that carries application protocol data(so-called ”protocol flow”). The RFport field defines the destination port numberused to send the flow with randomly generated data (so-called ”random flow”).The requirements for PFport and RFport values are the following: these valuesare mandatory parameters and they must be unique for each protocol descriptionfile, and these port numbers should not be registered to any application protocol inorder to avoid the possible traffic shaping from an ISP. The list of Internet socketport numbers used by different application protocols can be found here [63].
Finally, the protocol description file contains a set of request and response in-structions that define how to build the application protocol headers and payloads.In the example above, the request command tells a sender (might be a client orserver component depending in which direction we are measuring the path at themoment) to send an HTTP request to retrieve the page about the Jacobs Univer-sity Bremen from Wikipedia. The responder side sends back an HTTP 200 OKresponse that contains 20 bytes of payload. The following functions can be used ina protocol description file to construct the application protocol header and payload:
– string(argument) function appends to a message buffer a sequence ofbytes that encode a given string argument;
– byte(value) function appends to a message buffer given byte value (thisargument must be in range from 0 to 255);
– repbyte(value, N) function (is not presented in the example above)appends given byte value to a message buffer exactly N times (N must be apositive integer value).
The protocol description file might contain more than one pair of request –response commands. The only constraint is that for every request, exactly oneresponse must be defined immediately after the request definition. The commandsdefined in a protocol description file are separated by a newline character (emptylines are ignored by a parser).
Since the same protocol description file is used by both components, the server
27

and the client sides can generate a flow that carries packets that implement someapplication protocol (a destination port number defined by PFport value is used).For detecting content-based differentiation, a new TCP connection is established(RFport number is used), and the server and the client generate a flow that carriesrandomly generated data (while the size of the messages is preserved). Thereby,only the protocol flow might be affected by the traffic shaping mechanism.
The protocol description files for different application protocols are stored in aserver’s file system. Each protocol description is parsed by a server at startup time.The client can download and parse the content of any description file, right beforerunning a corresponding measurement test.
3.3 Client Requests Processing
In this section we describe the protocol used for communication between theclient and the server. For processing pre-measurement and post-measurement re-quests from the different clients, the server component opens a TCP server socket(hereinafter referred to as ”Main socket”) on the port number which is known toall clients. The main socket is responsible for processing the client demands inorder to prepare the client for measurement test execution, and for handling post-execution requests. The main socket is able to handle the following client requests:
– get a list of available application protocol;
– get a protocol description file of the specific application protocol;
– initiate a traffic shaping measurement test for the selected application proto-col;
– retrieve a downlink measurement test results from the server side;
– submit a measurement test results to the server side;
Let’s look at the client request processing in more details:
a) Retrieving a list of available application protocols to test and download-ing the specific protocol description file.
All the protocol description files are stored in a server’s file system. Theyare parsed by a server at startup time. We do not store these protocol descrip-tion files on the client, since by changing even a single protocol description fileon the server side, we would force end-users to update their client applications aswell. The different versions of the same protocol description file on the server andthe client sides would make it impossible to run the corresponding traffic shapingmeasurement test. Thereby, the client should be able to retrieve the list of sup-ported application protocols, and download the corresponding protocol description
28

Figure 3.3: The client retrieves the list of available application protocols and down-loads the HTTP protocol description file.
file right before the test execution from the server.To learn which application protocols are available for running traffic shap-
ing measurement tests, the client established a TCP connection with the server’smain socket and sends a message that contains only get all protocols\r\n stringvalue. Once this request is received by the server, it responds with a message thatcontains a list of available application protocol names separated by the ”\r\n” de-limiter (see Figure 3.3). The end of message\r\n string indicates the end of theresponse message.
Since the application protocol name is unique value, it can be used as an iden-tifier when the client wants to download the specific protocol description file. Forthis purposes a client sends a message that contains the string value of the follow-ing format: get protocol <protocol name>\r\n. Where the <protocol name>is a corresponding application protocol name. When the server receives that com-mand it sends back to the client the content of the corresponding protocol descrip-tion file (see Figure 3.3). Which is parsed by a client’s application later. Theend of message\r\n string indicates the end of protocol description file. If theserver can not find the protocol description file that corresponds to the applica-tion protocol name provided in the client’s request, it sends back a message with aget protocol failed\r\n string.
b) Initiate the traffic shaping measurement test for the selected applicationprotocol.
The main socket is also used to accept the client requests when the user wantsto start the new traffic shaping measurement test for a certain application protocol.In order to initiate new measurement test the client sends a message that contains
29

Figure 3.4: The client initiates a new measurement test for an HTTP applicationprotocol with 5 measurement cycles.
the string of the following format: start new test <protocol name> <numberof cycles>\r\n, where the <protocol name> is a corresponding application pro-tocol name, and the <number of cycles> represents the total number of measure-ment tests to run in a row.
A single measurement test execution usually is not enough to make an unam-biguous conclusion about the presence of traffic shaping along the path. So, it ishighly recommended to repeat the same test several times to increase the qualityof measurements. Once the server receives the command, it creates an object forstoring measurement test results, generates and assigns a universally unique iden-tifier (UUID) to that object, and sends back the string representation of the UUIDvalue to the client application (see Figure 3.4).
Now, the client can establish new TCP connections with the measurement server(using the PFport and RFport destination port numbers specified in the correspond-ing protocol description file) in order to run random and protocol flows. The pre-viously obtained UUID is used to identify the measurement test instance on theserver side.
c) Retrieve the measurement test results from the server side.
According to the application’s architecture, once the measurement test is done,the measurement test results for an upload direction are stored on the client, and theresults for a download direction on the server. So, to collect and merge measure-ment results of the same test, the client can send a message of the following format:retrieve test results<uuid>\r\n, where the<uuid> is the string representationof previously obtained UUID of a measurement test. The server responds with themeasurement test results for a download direction. The response message containsa plain text composed from the multiple text blocks of the following format:
30

Figure 3.5: The client requests the downlink measurement test results.
Cycle <sequence number>Protocol<message size> <RTT>...<message size> <RTT>Random<message size> <RTT>...<message size> <RTT>End Cycle
where the <sequence number> defines the number of a measurement cycle forwhich the results are presented, the <message size> value represents the numberof bytes in a message that was used to traverse the path during the test (see Section3.4 for details) and the <RTT> value is a corresponding measured round trip time(in milliseconds) of this message. The keywords Protocol and Random are usedto distinguish the measurement results between the random and the protocol flows.The number of these blocks is equal to the number of measurement cycles in a test.The end of message\r\n string indicates the end of the response message.
If some error occures during the test, or server side can not find the results forthis test, it replies with a message that contains the test results not found\r\nstring value to notify client that this operation failed. Once the data have beentransmitted the server deletes the instance of the object that stores measurementtest results for the corresponding measurement test UUID.
d) Submit measurement test results to the server.
If the user wants to share the measurement test results with us, he can pushthe report file to the measurement server. The measurement test results are storedin an HTML file. They present the measured link goodput values in the upload andthe download directions for the random and the protocol flows in a table format.
31

Figure 3.6: The client submits the measurement test results HTML file to the server.
The HTML file is the most convenient way to store the measurement test resultson the client, since it can be viewed by any browser installed on an Android smart-phone (in contrast, most Android browsers do not render XML files properly).
In order to push the report file, the client sends a message to the main socketthat carries the upload measurement results\r\n string value, and waits for theresponse message with the ready\r\n string value. After that, the content of aHTML report file is transmitted to the server side, where it is stored on the server’sfile system. The end of message\r\n string indicates the end of an HTML filecontent. Once the file transmission is completed the client closes the TCP connec-tion. If the ”ready\r\n” message has not been received within 3 seconds (defaulttimeout value), the client assumes that server is busy right now and it aborts theupload results request.
3.4 Measurement Test Lifecycle
The traffic shaping detection technique has been described in Section 3.1. Inthe current section, the implementation details of this technique are presented.
As it was mentioned above, to detect the traffic differentiation, we need to emu-late a pair of flows that are identical except in one respect that should trigger trafficdifferentiation along the path. By measuring and comparing performance of thesetwo flows, we can make a conclusion about the presence of a content-driven trafficmanipulation from the Internet Service Provider’s side. So the core task duringthe measurement test is to determine the application goodput in both (upload anddownload) directions for ”protocol” and ”random” flows.
The application goodput estimation is based on a simple idea. One of the partic-ipants, for example, the client side, measures the current local time (called ”start-time”) and sends a message to the server (see Figure 3.7). Both components knowthe size of this message, and once server receives the whole message, it immedi-ately responds with a short "OK" notification to acknowledge the client that initialmessage has been delivered successfully. Now, the client measures the local time(called ”end-time”) when the "OK" notification is delivered. Since we know the
32

TCP: bulk message
TCP: ok message
Start time
End timeClient Measurement Server
Figure 3.7: Scheme of uplink bandwidth estimation
number of bytes being transmitted, start and end measurement time values, we canestimate the goodput in upload direction using the following formula:
Goodput = Number of bytes/(start time - end time)
This calculated goodput value slightly differs from the actual one, because weare measuring the round trip time. However, we do not need to calculate the good-put very precisely. More important is to know the ratio of estimated performancesfor ”random” and ”protocol” flows.
The group of researchers in [55] showed that the near-nominal application th-roughput (and hence the goodput) in mobile networks is realizable for large pay-loads only. So, the size of the message used for probing the network (hereinafterreffed to as ”bulk message”) should be large enough to fully utilize the allocatedbandwidth. This value is different for various mobile networks, and it depends onthe network type and on the network configuration. In order to be able to measurethe goodput on different mobile networks, we send a train of bulk messages. Westart with a relatively small 2kB message and gradually increase the bulk messagesize if it is necessary. At each step the bulk message RTT value is measured. Thedecision about increasing the bulk message size or terminating the current goodputestimation round is made using the following rule:
if (bulk message RTT ≤MAX RTT ) thenincrease the bulk message size and send it again
endelse
stop current measurement roundend
In the traffic shaping detection tool configuration the MAX RTT value of 2seconds is used. This value was empirically determined during the series of testson the mobile networks. As it turned out, the bulk message with a 2 seconds RTTvalue is enough to fully utilize the allocated network bandwidth regardless the net-work type. Increasing the bulk message size after that value does not make sense
33

anymore, since the estimated goodput value remains the same.In the current application configuration the bulk message size changes accord-
ing the following scheme:
2kB -> 4kB -> 8kB -> 16kB -> 32kB -> 64kB -> 128kB ->-> 256kB -> 512kB -> 1MB -> 2MB -> 4MB -> 8MB
In practice, the goodput estimation round usually terminates when the bulk mes-sage size reaches the 1MB or 2MB value (in case of HSPA mobile networks). Thebulk message size of 4MB is used in rare cases when the mobile network band-width value is higher than 5 Mbps. The 8MB message size is never used in practice(modern HSPA mobile networks have a limit up to 7.2 Mbps) and it is reserved forfuture.
Using the proposed measurement technique the client side can estimate the ap-plication goodput on upload direction. And vice versa, to measure the goodput ondownload direction the server sends a train of bulk messages to the client.
As it was described in section 3.3, when a user wants to start a new test, first heestablishes a new TCP connection with the main socket and sends the start newtest <protocol name> <number of cycles> command. Once a server receivesthis command it creates an object to store measurement results, and generates theUUID for the measurement test session (see Algorithm 1). This UUID value lateris used to identify the test instance on a server side while handing clients requests.
For every application protocol that is supported, two server TCP sockets areopened and bound to port numbers specified in a corresponding protocol descrip-tion file (PFport and RFport). The first socket is used to accept client connectionswhich correspond to ”protocol” flows, and the second server socket handles con-nections that correspond to ”random” flows during the measurement test. Bothsockets are configured to infinitely listen to new connections made to these sock-ets and accept them. Once a new client connection has been accepted, the servercomponent creates a new thread to handle this connection (see Algorithm 1). Theaccepted client socket is passed as an argument to that thread. Hence, server sock-ets are prevented from being blocked, and the server component is able to supportprocessing multiple client connections.
A single measurement test execution usually is not enough to make an unam-biguous conclusion about the presence of traffic shaping along the path. So, it ishighly recommended to repeat the same test several times, to improve the qual-ity of measurements. Each set of goodput measurements for a single flow in bothdirections is called a measurement cycle. In order to neutralize the impact of theprevious measurements, the client establishes a new TCP connection with a corre-sponding server socket (for random or protocol flow) for each measurement cycle(see Algorithm 2). After a new connection has been established, the client andthe server send to each other the set of ”request-response” messages (hereinafterreffed to as ”protocol messages”) defined in the corresponding protocol descriptionfile. Both sides know the size, the number of protocol messages and their order.
34

Once the server receives the ”protocol request” message it immediately sends backthe corresponding ”protocol response” message. During sending the protocol mes-sages, the server and the client calculate the number of received bytes in order todetermine the end of a message. This is done to preserve a format of applicationprotocol which is tested. Otherwise, if we append custom ”end of the message”characters there is a risk that an ISP would not match the application flow.
These protocol messages are used to trigger the traffic differentiation along thepath. While the content of bulk messages is generated randomly for both (randomand protocol) flows. There is no need to make the bulk messages conform to thetested application protocol. The deep packet inspection tools do not sniff everypacket within a flow, because it would be a huge waste of clock cycles. In additionit would be useless for matching most packets, which are likely to consist of datawithout any application protocol ”identifiers” (for example the middle of some filefor P2P traffic). The bulk messages are used only for goodput estimation. We needto inject the protocol messages at the beginning of a new TCP connection, sincesome deep packet inspection tools (e.g. L7-filter [64]) make a decision about thetype of the flow by looking at the first several packets only. In the case when werun a random flow, the server and the client also inject protocol messages, but inthis case, the protocol messages content is generated randomly, while the size ofthe messages defined by the protocol description file is preserved.
Once all protocol messages defined in a protocol description file have beensent, the client sends the information that helps the server to identify the measure-ment cycle (e.g., the string representation of the test UUID of the measurementtest and the measurement cycle number separated by a space character. The \r\ncharacters indicate the end of the message). After the server received the UUIDand the measurement cycle number it responds with a message that contains theuuid received\r\n string.
After that the client and the server perform the goodput measurements for theupload and the download directions (see Algorithm 3) using algorithm describedabove. The protocol messages are injected every time right before the bulk mes-sage is about to be sent. This is done to ensure that the deep packet inspectiontools, which might continue sniffing the packets, could still match the flow. Whenthe measured RTT value becomes larger than MAX RTT threshold, or the bulkmessage size reaches the maximum value, the client (or the server depends onwhich direction we are measuring the goodput) sends a terminate message\r\nstring to notify the server that the measurements in a particular direction cycle aredone.
After the entire measurement test has been completed, the upload goodput re-sults are stored on the client side, and the measured download goodput results –on the server side. To retrieve the measurement results from the server, the clientsends a retrieve test results <uuid> command to the main socket.
35
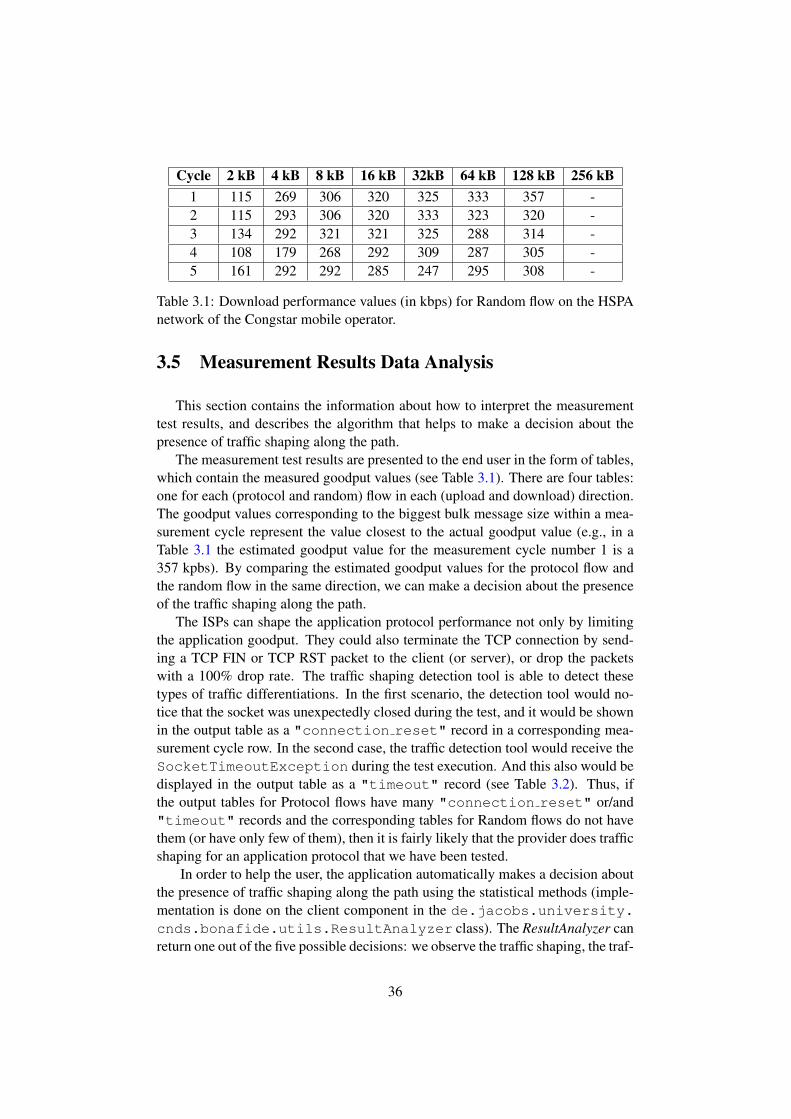
Cycle 2 kB 4 kB 8 kB 16 kB 32kB 64 kB 128 kB 256 kB1 115 269 306 320 325 333 357 -2 115 293 306 320 333 323 320 -3 134 292 321 321 325 288 314 -4 108 179 268 292 309 287 305 -5 161 292 292 285 247 295 308 -
Table 3.1: Download performance values (in kbps) for Random flow on the HSPAnetwork of the Congstar mobile operator.
3.5 Measurement Results Data Analysis
This section contains the information about how to interpret the measurementtest results, and describes the algorithm that helps to make a decision about thepresence of traffic shaping along the path.
The measurement test results are presented to the end user in the form of tables,which contain the measured goodput values (see Table 3.1). There are four tables:one for each (protocol and random) flow in each (upload and download) direction.The goodput values corresponding to the biggest bulk message size within a mea-surement cycle represent the value closest to the actual goodput value (e.g., in aTable 3.1 the estimated goodput value for the measurement cycle number 1 is a357 kpbs). By comparing the estimated goodput values for the protocol flow andthe random flow in the same direction, we can make a decision about the presenceof the traffic shaping along the path.
The ISPs can shape the application protocol performance not only by limitingthe application goodput. They could also terminate the TCP connection by send-ing a TCP FIN or TCP RST packet to the client (or server), or drop the packetswith a 100% drop rate. The traffic shaping detection tool is able to detect thesetypes of traffic differentiations. In the first scenario, the detection tool would no-tice that the socket was unexpectedly closed during the test, and it would be shownin the output table as a "connection reset" record in a corresponding mea-surement cycle row. In the second case, the traffic detection tool would receive theSocketTimeoutException during the test execution. And this also would bedisplayed in the output table as a "timeout" record (see Table 3.2). Thus, ifthe output tables for Protocol flows have many "connection reset" or/and"timeout" records and the corresponding tables for Random flows do not havethem (or have only few of them), then it is fairly likely that the provider does trafficshaping for an application protocol that we have been tested.
In order to help the user, the application automatically makes a decision aboutthe presence of traffic shaping along the path using the statistical methods (imple-mentation is done on the client component in the de.jacobs.university.cnds.bonafide.utils.ResultAnalyzer class). The ResultAnalyzer canreturn one out of the five possible decisions: we observe the traffic shaping, the traf-
36

fic shaping most probably exist, the traffic shaping most probably do not exist, wedo not observe the traffic shaping and we can not rely on provided data.
At the first step, we analyze the measurement results by the completeness crite-rion. For that purposes, we calculate so-called fail ratio for both flows, whichdetermine the ratio of the measurement cycles that exited with a "connectionreset or a "timeout" exception. If the ratio for a random flow is less than20% and the ratio for a protocol flow is more than 70% we conclude that appli-cation protocol performance has been affected by a traffic shaping along the path,otherwise we continue the data analysis.
Cycle 2 kB 4 kB 8 kB1 17 43 timeout2 19 44 timeout3 18 45 timeout4 17 44 63
Table 3.2: Example of measurement test with fail ratio of 75%
Next, we formulate the null hypothesis that the measured goodput values forthe random and the protocol flows in the same direction are close to each other, sothe traffic shaping along the path is not observed. To check this null hypothesis,the ResultAnalyzer uses the Mann–Whitney U statistical test [65]. Accordingto that method, we combine the goodput values for the two flows into a single set,sort this set in ascending order and assign the rank to each goodput value accordingto its position in a sorted set. Then we calculate the sum of goodput ranks for eachflow separately and determine the greater (Tx) value. The Mann–Whitney U valuecan be calculated using the following formula:
U = n1 · n2 + nx·(nx+1)2 − Tx;
where the n1, n2 are numbers of measured goodput values for protocol flow andrandom flow respectively, and the nx is a number of measured goodput values in aflow with a higher rank Tx.
Finally we compare the calculated U value with a corresponding Ucritical valuefrom the predefined Mann-Whitney critical values table (with a level of confidence95%) [66]. If the U > Ucritical then we can accept our null hypothesis, whichmeans that there is no traffic shaping along the path.
Additionally, we calculate the confidence interval for both flows which can bedefined by the following segment:
[Tmean − St(n) · σ√n;Tmean + St(n) · σ√
n];
where Tmean is a mean goodput value for a corresponding flow, n is a number ofmeasured goodput values for a flow, St(n) is a corresponding Student’s-t distribu-tion coefficient for an one-sided critical regions with a confidence of 95%, and σ is
37

a standard deviation:
σ =
√√√√ n∑i=1
(Tmean−Ti)2
n−1
where Ti is a measured goodput value during the ith measurement cycle. All good-put values that are out of the confidence interval are thrown away, and confidenceinterval is re-calculated again (including the mean value). This process repeats un-til all of the remaining goodput values lays inside the confidence interval. Afterthat step, the measurement results are cleaned from the distorted measurements.Thereby, we can compare the bounds of the corresponding confidence intervals,the mean goodput values and the maximum observed goodputs for both flows inorder to make a decision about the presence of the traffic shaping along the path(see Algorithm 4).
These two statistical methods add to each other. The U ≤ Ucritical does notmean that the tested application protocol has been shaped. For example, the Mann-Whitney U test would return the false positive decision about the presence of trafficshaping on the following sets of goodput values:
Protocol flow: 1000, 1001, 1002, 1003, 1004 (kbps)Random flow: 1005, 1006, 1007, 1008, 1009 (kbps)
The maximum goodput value for the protocol flow is less than minimum good-put value for the random flow (i.e., U = 0). However, all goodput values stay onthe same level, and the traffic shaping methods definitely were not applied in thiscase. The correct decision in this case can be made using the confidence intervalsmethod.
And vice versa, the confidence intervals method would make a false positivedecision in case of measurement results with a lot of distortions1:
Protocol flow: 25, 28, 32, 330, 338 (kbps)Random flow: 27, 315, 30, 332, 325 (kbps)
The mean value and the confidence interval for the Random flow are 324 and[317;330] kbps. Which is greater than values for the Protocol flow: 28 and [23;32]kbps. However, the Mann-Whitney U value is 12 which gives us a correct decision:NO SHAPING.
Mobile network performance might not be very stable during the measurementtest. The network performance can change significantly multiple times during arelatively short time frame. This is especially noticeably on low-speed networkslike EDGE. Two factors have an impact on the network performance: the signalstrength and the load of the base station which the mobile device is connectedto. Unfortunately, we do not have an access to the information about the base-
1This is a real example from experiments on the Congstar mobile network for the RTSP protocol.
38

station load at the moment. But the client component tracks all mobile networkstate changes and signal strength changes during the test. Therefore, the lack ofsignal or network discretions indicates that the obtained measurement results arenot reliable anymore.
39

Chapter 4
Experiments Design
In this chapter, we will focus on the design of experiments that we made usingthe developed traffic shaping detection tool. First, we will explain which applica-tion protocols we would like to test during the traffic shaping detection experimentson mobile networks, and clarify why exactly these protocols have been chosen.Next, we will describe the experimental setup used for application correctness ver-ification. Finally, we will describe the design of experiments made on the mobilenetworks.
4.1 List of Available Protocol Description Files
Currently, the following protocol description files are available to download andto run measurement tests: HTTP, FlashVideo (Youtube), SIP, RTSP, BitTorrent andVoIP H323. In our opinion, being able to run traffic shaping detection tests for theseapplication protocols might be interesting from the smartphone users’ perspective.
We can speculate that mobile network operators might want to manipulate onthe VoIP applications traffic performance. VoIP applications for smartphone de-vices actually are competitors for mobile service operators. To reduce financiallosses it is tempting to restrict the performance of traffic flows that carry VoIP data.
The VoIP H323 [29] standard addresses call signaling and control, multime-dia transport and control, and bandwidth control for point-to-point and multi-pointconferences. It is widely deployed worldwide by service providers and enterprisesfor both voice and video services over IP networks [67].
The Session Initiation Protocol (SIP) is a signaling protocol for controllingvoice and video streams over IP networks. This application protocol is designedto be independent from the Transport Layer protocols, therefore it can be usedover the TCP [68]. There is a number of popular SIP clients for Android-poweredsmartphones that allow to make VoIP calls over the Internet (SIPDroid, Linphone,
40

Fritz!App, CsipSimple, etc.).Since these H323 and SIP protocols are widely used in VoIP applications we
think it would be interesting to run a series of traffic measurement tests againstthem. Even despite the fact that packets that conform SIP protocol carry only lowvolume payloads, the mobile operators might want to completely block or limit theperformance of SIP flows.
According to the Google Play statistics [69][70] the BitTorrent client applica-tions are much more popular than other Peer-to-Peer (P2P) client applications (likeeMule or Gnutella). It is highly unlikely that the end-users will use the P2P clientson the mobile networks, because mobile networks are more expensive compara-tively to Wi-Fi networks. However, many mobile Internet providers (e.g. Net-toKOM, O2, Congstar) claim [11][12][13] that they do not support P2P traffic ontheir networks. It is interesting to check whether they perform deep packet basedtraffic shaping for the BitTorrent application protocol.
The Real Time Streaming Protocol (RTSP) [71] is a network control protocoldesigned for use in entertainment and communications systems to control stream-ing media servers. The protocol is used for establishing and controlling mediasessions between end points. Like HTTP, RTSP uses TCP to maintain an end-to-end connection [72]. Some popular applications (Winamp, Spotify, VLC mediaplayer) use the RTSP for controlling the audio streaming.
Finally, we created protocol description files for the HTTP and the Flashvideoprotocols. In our opinion, it is interesting to run an experiment for these applicationprotocols, since according to the Cisco Visual Networking Index (VNI) global mo-bile data traffic forecast [73] the mobile video traffic and the web traffic representmore than 90% overall mobile traffic.
4.2 Mesurement Tool Correctness Verification Experimen-tal Setup
To ensure that the developed traffic shaping detection tool is actually able todetect the content-based traffic differentiation along the path, we ran a series ofmeasurement tests on an experimental infrastructure (see Figure 4.1). In this ex-perimental setup all generated traffic goes through the Linux machine, which playsthe role of a router. The router is configured to perform deep packet inspection andthrottling flows’ performance according to predefined set of rules. Since we knowhow the performance of flows that carry different types of data should look like,we can analyze results obtained during the measurement tests, and verify whethertraffic shaping detection actually works properly or not.
The OpenVPN [74] open source package that implements VPN techniqueshas been installed onto a Linux machine for creating a point-to-point client-serverconnection. In this scenario all traffic from the client to the server and vice versagoes through the router. Thereby the router can manipulate the flows’ performance.
41

Client Router Measurement Server
tunnel
Figure 4.1: Experimental Setup Overview
To apply some traffic shaping rules on the router, we need to enable the router toclassify the traffic. For this purpose L7-filter [64] [75] classifier software has beeninstalled.
L7-filter is a software package providing a classifier for Linux’s Netfilter sub-system, which can categorize flows based on the application layer data. Unlikemost other classifiers, it does not just look at simple values such as port numbers.Instead, it does regular expression matching on the application layer data to deter-mine what protocols are being used. L7-filter can be used in different scenarios likewhen you need to match any protocol that uses unpredictable ports (e.g., peer-topeer file sharing), to match traffic on non-standard ports (e.g., web traffic on port1111), to distinguish between protocols which share a port (e.g., peer-to-peer filesharing that uses port 80).
There are two versions for this software. The first is implemented as a kernelmodule for Linux 2.4 and 2.6. The second experimental version runs as a user-space program and relies on Netfilter’s user-space libraries for the classificationprocess. In our experiments, we used the user-space version of L7-filter, which isstill in the early stages of development, but is relatively easy to install comparedto the kernel-version, and detects a larger number of protocols. All versions ofL7-filter have been released under the GNU General Public License.
Both versions of L7-filter use regular expressions (though the user-space andkernel modules use different regular expression libraries) to identify the networkprotocol. The basic idea of L7-filter is to use regular expression matching of firstseveral IP packets application layer data per flow to determine what protocol isbeing used. If the data matches regular expression for some traffic type, then theentire flow is marked as ”matched” [76]. Running a regular expression matcher onevery packet does not make any sense. Not only because it would be a huge wasteof clock cycles, but it would be useless for matching most packets, which are likelyto consist of data without any protocol ”identifier” (the middle of some file for P2Ptraffic for example).
Another benefit of using L7-filter for our testing purposes is that it providesa large number of well tested regular expressions for different protocols, includ-ing those that might be interesting from the smartphone users perspective, like:flashvideo, SIP, RTSP, H323, different P2P protocols, HTTP.
In order to test how traffic shaping detection works for different traffic shapingconfigurations, a number of traffic differentiation rules for the BitTorrent protocolhave been deployed on the router (see Table 4.1). The router has been configured
42

Destination Port Number Maximum allowed bandwidth45000 no limit45001 1024 kbps45002 512 kbps45003 256 kbps45004 128 kbps45005 64 kbps45006 drop packets (100% drop rate)45007 drop packets (50% drop rate)
Table 4.1: Throttling policy for BitTorrent flows deployed on the router in experi-mental enviroment
to limit the BitTorrent flows performance on port numbers 45000-45005 and todrop BitTorrent flow packets on port numbers 45006 and 45007 in both (uploadand download) directions. The performance of flows that carry other protocol datais not affected and stays the same on all destination port numbers.
The evaluation of measurement results is discussed in Section 5.1.
4.3 Experiments on Mobile Networks
Once the application correctness was verified, we ran a series of traffic shapingdetection tests on mobile networks. The main goal of these measurements was tolearn how and to which extend content-based traffic differentiation policies are de-ployed on mobile networks.
Usually, mobile providers do not own the radio spectrum or wireless networkinfrastructure over which they provide services to the end-users. These mobileproviders are called mobile virtual network operators (MVNOs) [77]. An MVNOenters into a business agreement with a mobile network operator (MNO) to obtainan access to network services at wholesale rates, then sets retail prices indepen-dently. For example, by July 2012, in Germany there are 4 mobile network opera-tors and more than 30 mobile virtual network operators [78].
In our traffic shaping detection experiments we had an access to four SIM-cardsfrom the mobile providers listed in table 4.2. These mobile providers use three outof four mobile networks that are available in Germany. Thereby, we can comparehow the traffic shaping policies for different mobile network operators differ fromeach other.
Furthermore, we choose two mobile providers (ALDI Talk and NettoKOM),which are based on the same mobile network infrastructure, so we can comparethe traffic shaping configurations used across the same mobile network operator.
Of course, the number of operators that we selected is not enough to determinewhether the traffic shaping configuration depends on the policies deployed by a
43

MVNO MNOALDI Talk (MEDIONMobile) [79] E-Plus
NettoKOM [11] E-PlusO2 [12] O2
Congstar [13] Telekom (former T-Mobile)
Table 4.2: List of mobile operators used in our traffic shaping detection experi-ments on mobile networks.
mobile network operator or by mobile provider (MVNO), though further measure-ments for more providers would be helpful.
In order to answer the questions formulated in Introduction 1 we performedvarious traffic shaping detection tests for six different application protocols. Threedifferent aspects were taken into account while running measurement tests:
a) Mobile network type. Mobile operators provide access to the Internet overdifferent mobile network types (e.g., GSM, EDGE, UMTS, HSPA) In orderto check, whether the traffic shaping policies within the same mobile differfor various network types, we ran measurement tests over the EDGE [80]and HSPA [81] network types (one of the most popular and widely deployed2G and 3G mobile network technologies respectively).
b) The time of the day. One of our hypotheses was that mobile providers canbehave differently depending on the time of the day. For example, they canlimit their network bandwidth during the peak hours to reduce the load ontheir network equipment. To verify whether they actually do that, we ran themeasurement tests during the different times of the day.
c) Mobile network speed. Usually, mobile providers charge users monthlyfor using the Internet and they provide access to the Internet regardless theamount of data that users consume. However the amount of data that usersconsume has an impact on the network speed. Once a user exceeds the limit(defined by a tariff-plan that is used), mobile providers restrict the networkbandwidth to some comparatively low-speed for that user. In order to check,whether mobile operators additionally perform content-based traffic shapingin that condition, we ran a series of measurements after the limit has beencrossed (see Table D.1 for details about the tariff-plans).
The traffic shaping detection application has been published on the Google Playcontent-distribution service [82]. Thereby, we also collected measurement resultswhich have been submitted by the users who used our application.
The evaluation of experiment results is discussed in Sections 5.2 – 5.4.
44

Chapter 5
Evaluation
In this chapter we discuss the evaluation and the measurement results collectedduring the set of traffic shaping detection experiments. First, we will verify thecorrectness of our application by analyzing the traffic shaping detection test resultsmade on the experimental setup. Next, we will discuss the results collected duringthe traffic shaping detection experiments on mobile networks. In addition to ourexperiments, we will discuss the measurement results which have been submittedby the users who downloaded the traffic shaping detection application from theGoogle Play service.
5.1 Application Correctness Verification
The first test to verify the correctness of the developed traffic shaping detectiontool was to check whether the measured goodput for BitTorrent flows and Randomflows stayed the same on port number 45000, where there was no traffic shap-ing policy deployed. For this purpose, we executed a measurement test with fivemeasurement cycles. As we can see from the results (see Table C.2), the goodputvalues for BitTorrent and Random flows for the download (as well as for the up-load) direction stayed very close to each other. Which indicates that the BitTorrentflows have not been affected by traffic shaping along the path. In addition, wechecked the L7-filter log file to ensure that all BitTorrent flows have been success-fully matched.
Afterwards, we ran the measurement tests on port numbers 45001 – 45005. Themeasured goodput for Random flows stayed very close to the goodput values ob-served in the experiments where no traffic shaping was involved (see Table C.2).And if we compare these values with measured performance for Protocol flows,we can see that the Mann–Whitney U values are "0" for all measurements. Inaddition, the maximum goodput values for the Protocol flows are always less thanthe corresponding lower bounds of the confidence intervals for the Random flows.
45

Therefore, we can conclude that different traffic shaping schemes were definitelyapplied along the path. Furthermore, the measured goodput for Protocol flows ondifferent port numbers matches the bandwidth limits configured on the router (seeTable 4.1).
In addition two more destination port numbers have been configured to mani-pulate on the BitTorrent traffic. On the port 45006 all the packets that belong toBitTorrent flows were dropped. The traffic shaping detection tests for port number45006 showed (see Table C.1) that for the BitTorrent flows the SocketTimeoutException has been thrown on every measurement cycle. In this way we cansuccessfully detect traffic shaping that drops all the packets that belong to an ”un-wanted” protocol flow. Note that we have no measurement results for the down-load direction in this case. This happened because the download and the uploadmeasurement tests are executed within the same TCP connection. According tothe measurement test lifecycle (see Section 3.4), the client and the server injectthe protocol messages before sending the test UUID. The L7-filter tool matchedthe flow after protocol messages had been sent, and the router started droppingthe packages. As a result the retrieve test results <uuid> command failed later,since the test UUID had never been delivered to the server.
On port 45007 the packets of the BitTorrent flows were dropped with a constantdrop rate of 50%. Measurement tests on port number 45007 showed (see Table C.1)that goodput for BitTorrent flows was approximately 2.5 times less than for Ran-dom flows. Therefore, we can successfully detect the traffic shaping based on thepacket dropping with a constant rate techniques. However, we can not distinguishthis type of traffic differentiation from the traffic shaping based on the limiting thenetwork bandwidth (like on port numbers 45001 – 45005).
The results obtained from the measurements on the experimental setup helpedus to verify that the developed traffic shaping detection application can successfullydetect the following types of the traffic manipulations along the path:
– Packet dropping (dropping packets that carry data of some traffic type usinga fixed or variable drop rate);
– Packet blocking (blocking packets or by injecting a connection terminationmessage);
– Deprioritizing (assigning differentiated flows to lower priority queues in or-der to limit the goodput of certain classes).
5.2 Measurements on HSPA Mobile Networks
First, we ran measurement tests for ALDITalk and NettoKOM mobile operatorswhich share the same E-Plus HSPA mobile network. Four experiments were com-pleted for these two mobile providers: the daytime measurements (approximately
46

from 1PM to 2PM for ALDITalk, from 3PM to 4PM for NettoKOM) and the night-time measurements (from 4AM to 5AM for ALDITalk, from 12AM to 1AM forNettoKOM).
The measurement results with calculated Mann-Whitney U values, mean valuesand confidence intervals for the ALDITalk daytime experiments are presented inTables E.1 and E.2; for the nighttime experiments in Tables E.3 and E.4; for theNettoKOM daytime experiments in Tables E.5 and E.6; for the nighttime experi-ments in Tables E.7 and E.8.
The statistical analysis showed that these two mobile operators do not applycontent-based traffic shaping to the tested application protocols. As we can seefrom the measurement result tables, the U > Ucritical for all measurements, andthe confidence intervals for corresponding Random and Protocol flows stay closeto each other.
In addition, Figures 5.1 and 5.2 provide a comparison of measured goodputvalues (in kbps) for ALDITalk’s and NettoKOM’s HSPA mobile networks duringdifferent time of the day. These figures represent the ”minimum-maximum” good-put intervals and calculated confidence intervals for protocol (PF) and random (RF)flows for tested application protocols (we ran five measurement cycles within eachmeasurement test). The interesting observation is that the confidence intervals’boundaries within the same direction for both operators stay approximately on thesame level: ∼[1000;1150] kbps for the download direction and∼[1200;1270] kbpsfor the upload direction. Also, the average goodput in the upload direction is usu-ally 100-150 kbps higher than goodput in the download direction for both opera-tors. Based on these two facts, we can assume that the ALDITalk and NettoKOMmobile operators use similar configurations of the E-PLUS’s HSPA mobile net-work.
For some application protocols we can observe that calculated confidence in-tervals for protocol flow and random flow do not intersect. For example, duringnighttime experiments for HTTP protocol on NettoKOM’s HSPA mobile network,the confidence interval for random flow is ”higher” than corresponding confidenceinterval for protocol flow (see Figures 5.1 and 5.2). The mean goodput value forprotocol flow is 14% less than the mean goodput value for random flow in thedownload direction, and 10% less in the upload direction. However, the Mann-Whitney values are U = 8 and U = 11 for the download and the upload directionrespectively (while the Ucritical = 2 in both cases). Therefore, we can concludethat the NettoKOM operator does not apply traffic shaping policy to an HTTP proto-col. We believe that in case of traffic shaping, the mean goodput value for protocolflow will be significantly lower than the mean goodput value for random flow.
We can also observe the difference between protocol and random flows’ con-fidence intervals in experiments on NettoKOM’s HSPA mobile network for FlashVideo protocol in the upload direction during nighttime (see Figure 5.2). How-ever, in this case the mean goodput value for protocol flow is higher than the meangoodput value for random flow. Therefore, we can conclude that no traffic shapingpolicy has been applied to a FlashVideo protocol.
47

Next, we ran traffic shaping detection tests on the Congstar’s HSPA mobile net-work. The measurements took place during the evening time (from 7PM to 9PM).The obtained measurement results are presented in Tables E.9 and E.10.
The first thing we can notice is that the measured goodput of SIP and randomflows significantly differ from each other. The Mann-Whitney U values are 0 forboth directions. The confidence intervals for the Random flows are [310;315] kbpsfor the download direction and [331;332] kbps for the download direction. Whilethe confidence intervals for the SIP flows are [15;16] and [5] kbps respectively.Thereby, we can conclude that the Congstar operator does traffic shaping for theSIP application protocol. The measurement results for other tested protocols donot reveal the presence of traffic shaping along the path.
The second observation is that the measured goodput stays very stable for allmeasurements. And the goodput upper limit has a surprisingly small value (themaximum observed goodput is 360 kbps only), while the HSPA networks usuallyprovide much faster connections (up to 7.2 Mbps).
Later, we repeated the traffic shaping detection test for the SIP protocol on Con-gstar’s mobile network once again, but only during the morning hours at 9AM (seeTable E.11 for results). As we can see, the mean goodput in the download di-rection for all application protocols increased by more than 16 times compared toprevious measurement results. Moreover, we no longer observe the shaping of SIPprotocol (the Mann-Whitney U values are 5 and 12 for the download and the up-load directions respectively). From this we can assume that the Congstar providerdoes time-based traffic differentiation of the SIP protocol, and it limits the networkperformance in the download direction depending on the time of the day.
48

850
900
950
1000
1050
1100
1150
1200
1250
BitTorrent VoIP-H323 FlashVideo HTTP SIP RTSP
min-max: RF daytime PF daytime RF nighttime PF nighttime
confidence interval: ALDITalk (MEDIONMobile) NettoKOM
Figure 5.1: Comparison of goodput values (in kbps) for ALDITalk’s and Net-toKOM’s HSPA mobile networks for random flows (RF) and protocol flows (PF)in the download direction during different time of the day.
BitTorrent VoIP-H323 FlashVideo HTTP SIP RTSP
min-max: RF daytime PF daytime RF nighttime PF nighttime
confidence interval: ALDITalk (MEDIONMobile) NettoKOM
900
950
1000
1050
1100
1150
1200
1250
1300
Figure 5.2: Comparison of goodput values (in kbps) for ALDITalk’s and Net-toKOM’s HSPA mobile networks for random flows (RF) and protocol flows (PF)in the upload direction during different time of the day.
49

5.3 Measurements on EDGE Mobile Networks
Four traffic shaping detection experiments on EDGE networks were completedduring the master thesis project: two experiments for the NettoKOM provider atthe daytime (9AM – 10AM) and the nighttime (12AM – 1AM) and two experi-ments for the ALDITalk provider at the daytime (10AM and 1PM) and the night-time (1AM).
The measurement results for ALDITalk EDGE network for the daytime are pre-sented in Tables E.12 and E.13, for the nighttime in Tables E.14 and E.15. Thedaytime measurement results for NettoKOM EDGE network are presented in Ta-bles E.16 and E.17, the nighttime results are in Tables E.18 and E.19.
The obtained measurement results show that both mobile operators do not ap-ply traffic shaping policies for the tested application protocols on their EDGE net-works. For all measurement, the Mann-Whitney U value is greater than the cor-responding Ucritical. And only for the HTTP protocol test in upload direction onALDITalk network during the nighttime the U < Ucritical. However, since the cor-responding confidence intervals intersect we can make a decision that there is notraffic shaping observed.
Figures 5.3 and 5.4 provide a comparison of measured goodput values (in kbps)for ALDITalk’s and NettoKOM’s EDGE mobile networks during different time ofthe day. These figures represent the ”minimum-maximum” goodput intervals andcalculated confidence intervals for protocol (PF) and random (RF) flows for testedapplication protocols (we ran five measurement cycles within each measurementtest). As expected, this mobile network type is characterized by a comparativelyslow and unstable network performance. The confidence intervals for the down-load direction within the same network can significantly differ from each otherdepending on the time of the day (e.g., in NettoKOM network measured downloadgoodput usually is 1.4 times higher than during the daytime). During the nighttimethe EDGE networks tend to be more stable, especially in the upload direction.
In addition we can see that the ALDITalk operator provides the commensurablegoodput for the upload and the download directions. While the download good-put for NettoKOM network is usually 4-5 times higher than the upload goodput.Thereby, we can conclude that these mobile operators use their own network con-figurations on top of the E-Plus mobile network.
For some application protocols we can observe that calculated confidence inter-vals for protocol flow and random flow do not intersect. For example, during night-time experiments in the download direction for BitTorrent protocol on ALDITalk’sEDGE mobile network, the confidence interval for random flow is ”higher” thancorresponding confidence interval for protocol flow (see Figure 5.3). The meangoodput value for protocol flow is 9% less than the mean goodput value for ran-dom flow. However, the Mann-Whitney value U = 7 which is greater than theUcritical = 2. Therefore, we can conclude that the ALDITalk operator does notapply traffic shaping policy to a BitTorrent protocol.
50

We can also observe the difference between protocol and random flows’ con-fidence intervals in experiments on ALDITalk’s EDGE mobile network for RTSPprotocol in the download direction during nighttime (see Figure 5.3). However, inthis case the mean goodput value for protocol flow is higher than the mean goodputvalue for random flow. Therefore, we can conclude that no traffic shaping policyhas been applied to a RTSP protocol.
51
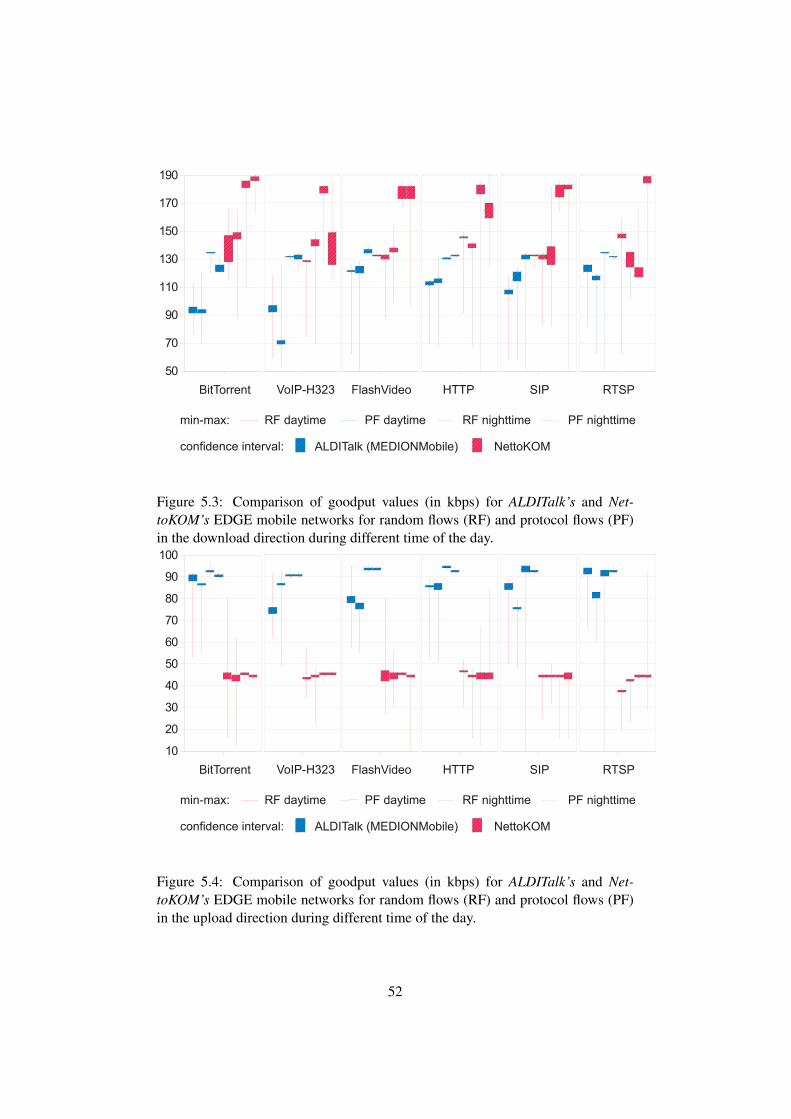
BitTorrent VoIP-H323 FlashVideo HTTP SIP RTSP
min-max: RF daytime PF daytime RF nighttime PF nighttime
confidence interval: ALDITalk (MEDIONMobile) NettoKOM
50
70
90
110
130
150
170
190
Figure 5.3: Comparison of goodput values (in kbps) for ALDITalk’s and Net-toKOM’s EDGE mobile networks for random flows (RF) and protocol flows (PF)in the download direction during different time of the day.
BitTorrent VoIP-H323 FlashVideo HTTP SIP RTSP
min-max: RF daytime PF daytime RF nighttime PF nighttime
confidence interval: ALDITalk (MEDIONMobile) NettoKOM
10
20
30
40
50
60
70
80
90
100
Figure 5.4: Comparison of goodput values (in kbps) for ALDITalk’s and Net-toKOM’s EDGE mobile networks for random flows (RF) and protocol flows (PF)in the upload direction during different time of the day.
52

5.4 Measurements on Bandwidth-limited Mobile Networks
Usually, the amount of data that users consume have an impact on the mo-bile network speed. Once a user exceeds the limit (defined by a tariff-plan thatis used), mobile providers restrict the network bandwidth to some comparativelylow-speed for that user. In order to check, whether mobile operators additionallyperform some content-based traffic shaping in this case, we ran a series of mea-surement tests on the HSPA mobile networks, after the limit has been crossed, forthe following mobile operators: NettoKOM, ALDITalk and O2 (see Table D.1 fordetails about the tariff-plans). All measurements took place during daytime: forNettoKOM at 10AM, for ALDITalk at 11AM, for O2 at 2PM.
As we can see from the measurement results (see Tables E.22 and E.23 for theALDITalk provider, Tables E.20 and E.21 for the NettoKOM provider, Tables E.24and E.25 for the O2 provider), the calculated confidence intervals for the downloadand the upload directions stay close to each other for all Protocol flows and Randomflows within the same mobile network. In addition, for almost all measurementsthe Mann-Whitney U value is greater than Ucritical. Therefore, we can concludethat none of three tested operators does apply any traffic shaping policies to thetested application protocols in case of the bandwidth-limited mobile networks. Infact, the measured maximum goodput values for all mobile operators conform tothe corresponding limits defined by the tariff-plans.
We can notice that the average goodput in the upload direction for the Net-toKOM mobile operator is 2 times less than the average uplink goodput for theALDITalk mobile operator. Which proves once again that NettoKOM and ALDITalkproviders use different configurations of the same network.
5.5 Other Measurements
In addition, we collected the measurement results which have been submittedby the users who downloaded our application from the Google Play content distri-bution service.
A set of measurements was completed on the MTS BY (Belarus) HSPA mo-bile network. The measurement results are presented in Tables E.26 and E.27.Note, that traffic shaping detection tests have taken place during different times ofthe day. By comparing the calculated Mann-Whitney U values with correspondingUcritical values and the confidence intervals for the Random and the Protocol flows,we can make a conclusion that this mobile operator does not apply any traffic shap-ing policy to the tested application protocols.
In addition, two more measurement test reports have been submitted. The mea-surement test results for the BitTorrent application protocol on the LUXGSM (Lux-emburg) UMTS mobile network during the daytime are presented in Table E.28.The measurement test results for the HTTP application protocol on the AT&T
53

(USA) UMTS mobile network during the daytime are presented in Table E.29. Inboth cases these two mobile operators do not perform traffic shaping of the testedapplication protocols.
5.6 Measurement Test Performance
The main drawback of the presented traffic shaping detection mechanism is aneed of injecting bulk messages into the tested mobile network in order to de-termine precisely the channel bandwidth. The exact number of bytes required toobtain reliable measurement results depends on the mobile network type and theactual network performance. Based on the measurement results from experimentson mobile networks, we compose Table 5.1, which represents the approximateamount of data consumed by the traffic shaping detection tool while it tests a mo-bile network in one (upload or download) direction for one flow depending on themeasured goodput.
Measured goodput Amount of data< 32 kpbs 16 kB
32 – 64 kbps 32 kB64 – 128 kbps 64 kB128 – 256 kbps 128 kB256 – 512 kbps 256 kB
512 – 1024 kbps 512 kB1 – 2 Mbps 1 MB2 – 4 Mbps 2 MB> 4 Mbps 4 MB
Table 5.1: Approximate amount of data required to test a mobile network in onedirection for one flow depending on the measured network performance
Hence we can estimate the total number of bytes in a single measurement testusing the following rule:
Btotal = N · (BPFD +BPFU +BRFD +BRFU )
where N is a number of measurement cycles, BPFD and BRFD are number ofbytes required to test a network in the download direction for protocol flow andrandom flow respectively, BPFU and BRFU – for the upload direction.
For example, to run a test with a 5 measurement cycles on a mobile networkwith a speed limit up to 1200 kbps in both directions (quite common configura-tion in HSPA mobile networks), we need to consume approximately 20 MB ofdata. In a very fast networks this value can even grow up to 60 – 80 MB. Whichis too much from a mobile user’s perspective, because usually mobile operatorsreduce the channel bandwidth after the user exceeds some data limit. Reducing the
54

amount of data consumed during the measurement cycle has a negative impact onthe quality of measurement results. However, the user can define the number ofmeasurement cycles within a measurement test from the client application’s GUI.
55

Chapter 6
Conclusions
In the scope of the Master Thesis project, a measurement tool for detectingthe presence of content-based traffic shaping mechanisms in mobile networks hasbeen developed. This active measurement tool is based on a client-server archi-tecture. The server component is a daemon running on a Linux server, which isreachable in the Internet network for other measurement participants. The client isan Android-application, which can be installed on any Android OS-based mobiledevice. When the client side establishes a connection with a measurement server,it can download and execute a number of tests that help to reveal the followingdeep-packet inspection based traffic manipulation methods along the path:
– Packet dropping (dropping packets that carry data of some traffic type usinga fixed or variable drop rate);
– Packet blocking (blocking packets or by injecting a connection terminationmessage);
– Deprioritizing (assigning flows to lower priority queues in order to limit thegoodput of certain classes).
We have made a series of measurement experiments for different mobile net-work operators. The results have shown that for most of the them there is nocontent-based traffic shaping for the tested application protocol types. Surpris-ingly, most mobile providers do not block SIP and VoIP traffic, even despite thefact they claim that VoIP is not supported in their networks [11] [12]. The only ev-idence of traffic shaping that has been found refers to the provider Congstar, whichlimits the upload and download performance of SIP flows during the evening hours.This makes it impossible to make SIP-calls on this mobile network. However, itseems to be a time dependent traffic shaping policy, since during other experimentson this mobile network that have taken place during the morning hours the manip-ulation on the SIP flows has not been noticed.
Also, our experiments have shown that the tested mobile operators do not apply
56

traffic shaping policies in case when they have already limited the network perfor-mance (after users crossed the data limit).
During developing and testing the traffic shaping detector tool, we faced a prob-lem that is specific for active Internet measurements in mobile networks. Mobilenetwork performance might not be very stable during the measurement test. Forexample, the network bandwidth can change significantly multiple times during arelatively short time frame. This is especially noticeably on low-speed networkslike EDGE. The network performance depends on two factors: the signal strengthand the load of the base station which the mobile device is connected to. Hence,during the analysis of the measurement results, we should keep in mind that sig-nificant changes in a flows’ performances might be caused not only by traffic dif-ferentiation along the path.
To obtain reliable results, the client and the server need to send messages witha large payload. A single traffic shaping measurement test with five measurementcycles might consume up to 80 MB of data depending on the network type. Thismight repel mobile Internet users from using our application. However, reducingthe amount of data consumed during the test has a negative impact on the qualityof measurement results.
57

Bibliography
[1] Wikipedia. The Free Encyclopedia: Smartphone. Available at http://en.wikipedia.org/wiki/Smartphone.
[2] About.com - Part of The New York Times Company: What Makes a Smart-phone Smart? Available at http://cellphones.about.com/od/smartphonebasics/a/what_is_smart.htm.
[3] Marcel Dischinger, Massimiliano Marcon, Saikat Guha, Krishna P. Gum-madi, Ratul Mahajan, and Stefan Saroiu. Glasnost: Enabling End Users toDetect Traffic Differentiation. In Proceedings of the USENIX Symposium onNetworked Systems Design and Implementation (NSDI), 2010.
[4] Marcel Dischinger, Alan Mislove, Andreas Haeberlen, and Krishna P. Gum-madi. Detecting BitTorrent Blocking. In Proceedings of the 8th ACMSIGCOMM Conference on Internet Measurement (IMC’08), Vouliagmeni,Greece, October 2008.
[5] Mukarram Bin Tariq, Murtaza Motiwala, Nick Feamster, and Mostafa Am-mar. Detecting network neutrality violations with causal inference. In Pro-ceedings of the 5th international conference on Emerging networking experi-ments and technologies, CoNEXT ’09, pages 289–300, New York, NY, USA,2009. ACM.
[6] Ying Zhang, Zhuoqing Morley Mao, and Ming Zhang. Detecting traffic dif-ferentiation in backbone ISPs with NetPolice. In Proceedings of the 9th ACMSIGCOMM conference on Internet measurement conference, IMC ’09, pages103–115, New York, NY, USA, 2009. ACM.
[7] Partha Kanuparthy and Constantine Dovrolis. ShaperProbe: end-to-end de-tection of ISP traffic shaping using active methods. In Proceedings of the2011 ACM SIGCOMM conference on Internet measurement conference, IMC’11, pages 473–482, New York, NY, USA, 2011. ACM.
[8] Partha Kanuparthy and Constantine Dovrolis. DiffProbe: Detecting ISP Ser-vice Discrimination. In INFOCOM, pages 1649–1657. IEEE, 2010.
[9] Android Operating System. Available at http://android.com.
58

[10] Google Play: a digital-distribution multimedia-content service from GoogleInc. Available at https://play.google.com/store.
[11] NettoKOM: Internet-Flat 1 GB. Available at http://www.nettokom.de/tarife/internet-flat-1gb.html.
[12] O2 Blue S – Der Tarif fur Ihr Smartphone. Available at http://www.o2online.de/tarife/smartphone-tarife/o2-blue-s/.
[13] Congstar Surf Flat 500. Available at http://www.congstar.de/surf-flat-500/.
[14] Markus Peuhkuri. Internet traffic measurements aims, methodology, anddiscoveries. Master’s thesis, Helsinki University of Technology, 2002.
[15] N. Duffield. Sampling for Passive Internet Measurement: A Review. Statisti-cal Science, (19(3)), 2004.
[16] S. Deering and J. Mogul. Path MTU Discovery. RFC 1191, November 1990.Available at http://tools.ietf.org/html/rfc1191.
[17] C. Dovrolis, R. Prasad, M. Murray, and K. Claffy. Bandwidth estimation:metrics, measurement techniques, and tools. IEEE Network, (6):27–35, Apr2003.
[18] S. Shalunov, B. Teitelbaum, A. Karp, J. Boote, and M. Zekauskas. A One-way Active Measurement Protocol (OWAMP). RFC 4656, September 2006.Available at http://tools.ietf.org/html/rfc4656.
[19] K. Hedayat, R. Krzanowski, A. Morton, K. Yum, and J. Babiarz. A Two-WayActive Measurement Protocol (TWAMP). RFC 5357, October 2008. Availableat http://tools.ietf.org/html/rfc5357.
[20] CAIDA: The Cooperative Association for Internet Data Analysis. Availableat http://www.caida.org/.
[21] CAIDA: The skitter tool. Available at http://www.caida.org/tools/measurement/skitter.
[22] CAIDA: Archipelago Measurement Infrastructure. Available at http://www.caida.org/projects/ark/.
[23] NetConfigs: A launch pad for network and Internet management related re-sources. Available at http://www.netconfigs.com/.
[24] Mohit Lad, Dan Massey, and Lixia Zhang. Link-Rank: A Graphical Tool forCapturing BGP Routing Dynamics. Network Operations and ManagementSymposium (NOMS), April 2004.
[25] BGPlay @ Route Views. Available at http://bgplay.routeviews.org/.
59

[26] CAIDA: iffinder tool. Available at http://www.caida.org/tools/measurement/iffinder/.
[27] Mubashar Mushtaq and Toufik Ahmed. Adaptive Packet Video StreamingOver P2P Networks Using Active Measurements. In Proceedings of the11th IEEE Symposium on Computers and Communications, pages 423–428,Washington, DC, USA, 2006. IEEE Computer Society.
[28] Reza Rejaie and Antonio Ortega. PALS: peer-to-peer adaptive layeredstreaming. In Proceedings of the 13th international workshop on Networkand operating systems support for digital audio and video, NOSSDAV ’03,pages 153–161, New York, NY, USA, 2003. ACM.
[29] Prasad Calyam, Weiping M, Mukundan Sridharan, Arif Khan, and PaulSchopis. H.323 Beacon: An H.323 application related end-to-end perfor-mance troubleshooting tool. In ACM SIGCOMM NetTs, 2004.
[30] Qian Zhang, Wenwu Zhu, and Ya-Qin Zhang. Channel-adaptive ResourceAllocation for Scalable Video Transmission over 3G Wireless Network. IEEETrans. Circuits Syst. Video Techn., 14(8):1049–1063, 2004.
[31] Magnus Lundevall, Jonas Eriksson, Frida Eng, Birgitta Olin, Niclas Wiberg,and Stefan Wanstedt. Streaming Applications Over HSDPA in Mixed ServiceScenarios. In VTC,2004.
[32] Tarek Saadawi. Plenary lecture 3: multicast active probing measurementtechnique for multimedia networks. In Proceedings of the 5th European con-ference on European computing conference, ECC’11, pages 20–20, StevensPoint, Wisconsin, USA, 2011. World Scientific and Engineering Academyand Society (WSEAS).
[33] David B. Makofske and Kevin C. Almeroth. Real-Time Multicast Tree Visu-alization and Monitoring. Software–Practice and Experience, 30:1047–1065,2000.
[34] Mlisten: MBONE Collection Tool. Available at http://www.cc.gatech.edu/computing/Telecomm/projects/mbone/.
[35] RTPmon Tool. Available at http://www.cs.columbia.edu/˜hgs/rtp/rtpmon.html.
[36] Internet Topology Discovery Using mrinfo. Available at http://inl.info.ucl.ac.be/content/mrinfo.
[37] CAIDA: Mantra - Monitoring Multicast on a Global Scale. Available athttp://www.caida.org/tools/measurement/mantra/.
[38] Mtrace tool. Available at ftp://ftp.parc.xerox.com/pub/net-research/ipmulti/.
60

[39] D. Thaler and Adams A. Mrtree. Merit Network, Inc. and University ofMichigan. Available at http://www.merit.edu/net-research/mbone/mrtree_man.html.
[40] S. Blake, D. Black, M. Carlson, E. Davies, Z. Wang, and W. Weiss. An Ar-chitecture for Differentiated Services. RFC 2475, December 1998. Availableat http://tools.ietf.org/pdf/rfc2475.pdf.
[41] DslReports: Comcast is using Sandvine to manage P2P connec-tios. Available at http://www.dslreports.com/forum/r18323368-Comcast-is-using-Sandvine-to-manage-P2P-Connections.
[42] VELOCIX: New Generation Content Delivery Network. Available at http://www.velocix.com.
[43] Ying Zhang, Z. Morley, and Mao Ming Zhang. Ascertaining the Realityof Network Neutrality Violation in Backbone ISPs. In In Proc. 7th ACMWorkshop on Hot Topics in Networks (Hotnets-VII, 2008.
[44] Neubot: The Network Neutrality Bot. Available at http://www.neubot.org/.
[45] Constantine Dovrolis, P. Krishna Gummadi, Aleksandar Kuzmanovic, andSascha D. Meinrath. Measurement lab: overview and an invitation to theresearch community. Computer Communication Review, 40(3):53–56, 2010.
[46] SamKnows - Accurate broadband performance information for consumers,governments and ISPs. Available at http://www.samknows.com/broadband/index.php.
[47] RIPE Atlas Project. Available at http://atlas.ripe.net/.
[48] Apple unveils iPad 2, on sale in Australia on March 25. Available at http://www.startupsmart.com.au/technology/2011-03-03/apple-unveils-ipad-2-on-sale-in-australia-on-march-25.html.
[49] How many Android phones have been activated? Avail-able at http://www.asymco.com/2011/12/21/how-many-android-phones-have-been-activated/.
[50] Network Diagnostic Tool (NDT). Available at http://www.internet2.edu/performance/ndt/.
[51] Windrider - A Mobile Network Neutrality Monitoring System. Available athttp://www.cs.northwestern.edu/˜ict992/mobile.htm.
[52] Fing - the Internet measurement tool. Available at http://www.over-look.com/site/.
[53] MobiPerf Official Website. Available at http://mobiperf.com.
61

[54] Google Play: Traffic Monitor application. Available at https://play.google.com/store/apps/details?id=com.radioopt.widget.
[55] J. Prokkola, P.H.J. Perala, M. Hanski, and E. Piri. 3G/HSPA Performance inLive Networks from the End User Perspective. In Communications, 2009.ICC ’09. IEEE International Conference on, pages 1 – 6, june 2009.
[56] K. Pentikousis, M. Palola, M. Jurvansuu, and P. Perala. Active goodput mea-surements from a public 3G/UMTS network. Communications Letters, IEEE,9(9):802 – 804, sep 2005.
[57] P. Benko, G. Malicsko, and A. Veres. A large-scale, passive analysis of end-to-end TCP performance over GPRS. In INFOCOM 2004. Twenty-third An-nualJoint Conference of the IEEE Computer and Communications Societies,volume 3, pages 1882 –1892 vol.3, march 2004.
[58] Wikipedia. The Free Encyclopedia: Goodput. Available at http://en.wikipedia.org/wiki/Goodput.
[59] The BitTorrent Protocol Specification, Version 11031. Available at http://bittorrent.org/beps/bep_0003.html.
[60] Wireshark: the world’s foremost network protocol analyzer. Available athttp://www.wireshark.org/.
[61] Wireshark Development: Libpcap File Format. Available at http://wiki.wireshark.org/Development/LibpcapFileFormat/.
[62] Jnetpcap library for an Android OS. Available at http://jnetpcap.com/userguide/android.
[63] IANA RFC 6335: Service Name and Transport ProtocolPort Number Registry. Available at https://www.iana.org/assignments/service-names-port-numbers/service-names-port-numbers.txt.
[64] Application layer packet classier for Linux (L7-filter). Available at http://l7-filter.clearfoundation.com/.
[65] H. B. Mann and D. R. Whitney. On a Test of Whether one of Two RandomVariables is Stochastically Larger than the Other. The Annals of MathematicalStatistics, 18(1):50–60, 1947.
[66] Critical Values for the Mann-Whitney U-Test. Available at http://www.saburchill.com/IBbiology/downloads/002.pdf.
[67] Wikipedia. The Free Encyclopedia: H.323. Available at http://en.wikipedia.org/wiki/H.323.
62

[68] Wikipedia. The Free Encyclopedia: Session Initiation Protocol. Availableat http://en.wikipedia.org/wiki/Session_Initiation_Protocol.
[69] Google Play: search query for the BitTorrent client applications. Available athttps://play.google.com/store/search?q=bittorrent+client&c=apps.
[70] Google Play: search query for the Gnutella client applications. Available athttps://play.google.com/store/search?q=Gnutella&c=apps.
[71] H. Schulzrinne, A. Rao, and R. Lanphier. Real Time Streaming Protocol(RTSP). RFC 2326, April 1998. Available at http://www.ietf.org/rfc/rfc2326.txt.
[72] Wikipedia. The Free Encyclopedia: Real Time Streaming Protocol. Availableat http://en.wikipedia.org/wiki/RTSP.
[73] Cisco Visual Networking Index: Global Mobile Data Traffic ForecastUpdate, 20112016. Available at http://www.cisco.com/en/US/solutions/collateral/ns341/ns525/ns537/ns705/ns827/white_paper_c11-520862.html.
[74] OpenVPN Community Software. Available at http://openvpn.net/index.php/open-source.html.
[75] D. Guo, L. N. Bhuyan, and B. Liu. An Efficient Parallelized L7-Filter Designfor Multicore Servers. Networking, IEEE/ACM Transactions on, PP(99):1,2011.
[76] Technical Details of L7-filter. Available at http://l7-filter.sourceforge.net/technicaldetails.
[77] Wikipedia. The Free Encyclopedia: Mobile virtual network operator. Avail-able at http://en.wikipedia.org/wiki/MVNO.
[78] Wikipedia. The Free Encyclopedia: List of mobile network operators ofEurope. Available at http://en.wikipedia.org/wiki/List_of_mobile_network_operators_of_Europe#Germany.
[79] ALDI Talk: Mobiles Internet mit ALDI. Available at http://www.alditalk.de/web/internet-prepaid-tarif/flatrate_m/.
[80] A. Furuskar, S. Mazur, F. Muller, and H. Olofsson. EDGE: enhanced datarates for GSM and TDMA/136 evolution. Personal Communications, IEEE,6(3):56 –66, jun 1999.
63

[81] S.I. Shah. UMTS: High Speed Packet Access (HSPA) Technology. In Net-working and Communications Conference, 2008. INCC 2008. IEEE Interna-tional, page 2, may 2008.
[82] Google Play: BonaFide Provider. Available at https://play.google.com/store/apps/details?id=de.jacobs.university.cnds.bonafide.
[83] Apache Maven Project. Available at http://maven.apache.org/.
[84] Android Developers: ADT Plugin for Eclipse. Available at http://developer.android.com/sdk/eclipse-adt.html.
[85] Android Developers: Building and Running from the Command Line. Avail-able at http://developer.android.com/guide/developing/building/building-cmdline.html.
64

Appendix A
Source Code
The source code of the developed traffic shaping detection tool is publicly avail-able under the BSD 2-Clause License and can be found at the CNDS website:cnds.eecs.jacobs-university.de/software
The implementation of a traffic shaping detection tool has three components:
– the server side implementation (”BonaFideServer”);
– the client side implementation (”BonaFideClient”);
– the common classes used by the server and the client components (”BonaFide-Common”);
In order to build the ”BonaFideServer” component the Apache Maven [83]build automation tool can be used. The project build process is triggered by runningthe mvn install command from the source code’s root folder. The ”BonaFide-Common” and ”BonaFideServer” components are build in this case. The foldercalled ”target” will be created inside the ”BonaFideServer” project’s folder thatcontains the executable jar file and required dependencies (see Figure A.1).
BonaFideServer/└── target ├── bonafideserver-1.0.0.jar └── lib ├── bonafidecommon-1.0.0.jar ├── jcommander-1.7.jar └── log4j-1.2.16.jar
Figure A.1: BonaFideServer component’s build structure
The ”BonaFideServer” project uses two additional dependency libraries:
– log4j is used for logging and printing traces during the program runtime;
65

– jcommander – a small java library used for parsing initial program inputparameters;
The server component can be started using the following command, where -p,-l and -s are program input parameters defined in Table A.1:
java -jar bonafideserver-1.0.0.jar -p 4000 -l list.txt-s incoming
The set of pre-defined protocol description files is also provided with the sourcecode (see protocols folder). Modify the list file in order to specify the full path toprotocol description files, and specify the path to list file as -l parameter when youstart the ”BonaFideServer” component.
Note, for starting the server component as a daemon through a SSH session weneed to tell the program to ignore the HUP (hangup) signal, enabling the commandto keep running after the user who issues the command has logged out. For thesepurposes we can run ”BonaFideServer” service using the nohup POSIX com-mand. Or, under the Debian systems, it is possible to use the following commandto daemonise a process:
/sbin/start-stop-daemon
Parameter Description Mandatory-p port number for running Main Socket no1
-l path to a file which maintains a list of protocols to load yes-s path to a folder for storing submitted results yes-v defines logging level no2
Table A.1: BonaFideServer component’s input parameters
To build the ”BonaFideClient” component it is recommended to use the EclipseIDE with pre-installed ADT plugin [84], which was specially designed to help inAndroid applications development process. However, you can also build and installthe ”BonaFide Provider” application manually using the command line (please re-fer to the ”Building and running from the command line” [85] tutorial for details).
The client component implementation is an application for the Android OS thatcan be installed on any Android-powered mobile device. The final release is named”BonaFide Provider” and it can be directly installed from the Google Play digital-distribution multimedia-content service using the following URL:
https://play.google.com/store/apps/details?id=de.jacobs.university.cnds.bonafide
1Port number 4000 is a default value2Possible logging level values sorted by priority: OFF, FATAL, ERROR, WARN, INFO, DEBUG,
TRACE. INFO is a default value.
66

Figure A.2: BonaFide Provider application QRcode
or using the generated QRcode (see Figure A.2):
During the installation process the ”BonaFide Provider” application asks for thefollowing permissions:
– android.permission.INTERNET: allows an application to open networksockets;
– android.permission.ACCESS NETWORK STATE: allows an applicationto access information about networks;
– android.permission.WRITE EXTERNAL STORAGE: allows an appli-cation to write to external storage (SD card);
– android.permission.READ PHONE STATE: allows read only access tophone state (required to obtain the information about the mobile service op-erator).
67

Appendix B
Pseudocode
Only for client: {establish a new TCP connection with the main socketsend start new test <protocol name> <number of cycles>receive UUIDclose a TCP connectionmeasure flow() /* for protocol flow */measure flow() /* for random flow */
}Only for server: {For Random and Protocol sockets:while true do
accept new TCP connectioncreate new Thread(measure flow())
end}
Algorithm 1: Running new measurement test pseudocode.
68
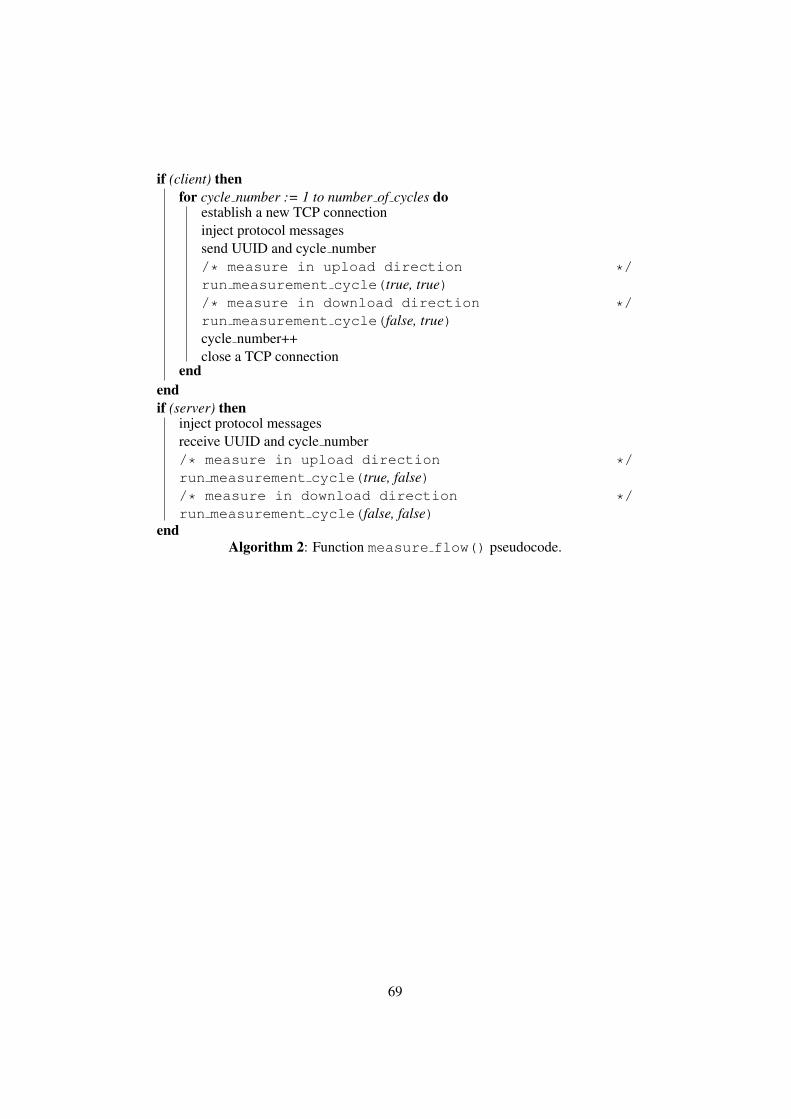
if (client) thenfor cycle number := 1 to number of cycles do
establish a new TCP connectioninject protocol messagessend UUID and cycle number/* measure in upload direction */run measurement cycle(true, true)/* measure in download direction */run measurement cycle(false, true)cycle number++close a TCP connection
endendif (server) then
inject protocol messagesreceive UUID and cycle number/* measure in upload direction */run measurement cycle(true, false)/* measure in download direction */run measurement cycle(false, false)
endAlgorithm 2: Function measure flow() pseudocode.
69

input:boolean measure uplink; true – current cycle measures uplink performance,false – downlink performanceboolean client: true – function called from the client, false – from the serverinitialization: set bulk message size value to minimum valuewhile true do
if (measure uplink and client) or (!measure uplink and !client) theninject protocol messagessend bulk messagereceive ”OK” notificationcalculate RTTif (RTT ≤ MAX RTT and bulk message size < MAX SIZE) then
increase bulk message sizeelse
send terminate messagebreak
endelse
inject protocol messagesreceive bulk messageif (bulk message is terminate message) then
breakelse
send ”OK” notificationend
endend
Algorithm 3: Function run measurement cycle() pseudocode.
70

input :U : calculated Mann – Whitney valueUcritical: critical Mann – Whitney valuePmean: mean goodput value for Protocol flowRmean: mean goodput value for Random flowPmax: max goodput value for Protocol flowσP : sigma value for Protocol flow (level of confidence 95%)σR: sigma value for Random flow (level of confidence 95%)output:decision about the presence of traffic shapingif (U > Ucritical) then
return NO SHAPINGelse
if (Pmean ≥ Rmean) or ((Pmean + σP ) ≥ (Rmean − σR)) thenreturn NO SHAPING
endif (Pmean > 0.8 ∗Rmean) or (Pmax ≥ (Rmean − σR)) then
return MOST PROBABLY NOT SHAPINGendif (0.6 ∗Rmean < Pmean ≤ 0.8 ∗Rmean) then
return MOST PROBABLY SHAPINGendif (Pmean ≤ 0.6 ∗Rmean) then
return SHAPINGend
endAlgorithm 4: Decision about the presence of traffic shaping pseudocode.
71

Appendix C
Verification Test Results
Port Cycle Download UploadUd Uu Dintervals UintervalsRF PF RF PF
45006
1
no data no data
1540 timeout
– – – –2 1538 timeout3 1542 timeout4 1541 timeout5 1538 timeout
45007
1 6883 2805 1540 618
0 02 6889 2809 1538 623 Random: Random:3 6892 2801 1541 622 [6885;6888] [618;621]4 6880 2810 1543 620 Protocol: Protocol:5 6885 2809 1544 616 [2808;2809] [1539;1542]
Table C.1: Measured goodput values (in kbps) for BitTorrent and Random flowson destination ports 45006 and 450071
1Ud – Mann-Whitney U value for the download direction; Uu – Mann-Whitney U value for theupload direction; Dintervals – 95% confidence intervals for the download direction; Uintervals –95% confidence intervals for the upload direction;
72

Port Cycle Download UploadUd Uu Dintervals UintervalsRF PF RF PF
45000
1 7043 7051 1544 1552
2 02 7049 7049 1543 1560 Random: Random:3 7035 7054 1540 1554 [7043;7046] [1540;1543]4 7046 7052 1541 1548 Protocol: Protocol:5 7040 7054 1545 1557 [7053;7054] [1552;1555]
45001
1 6981 1012 1539 1016
0 02 6988 1015 1541 1016 Random: Random:3 6992 1012 1538 1017 [6989;6992] [1537;1538]4 6990 1013 1537 1019 Protocol: Protocol:5 6885 1012 1535 1016 [1011;1012] [1015;1016]
45002
1 6095 481 1536 483
0 02 7003 481 1539 484 Random: Random:3 7002 481 1539 483 [6997;7010] [1537;1538]4 6098 481 1538 484 Protocol: Protocol:5 7005 481 1540 483 [481] [482;483]
45003
1 7008 212 1540 210
0 02 7006 212 1541 210 Random: Random:3 7008 212 1541 211 [7007;7008] [1540;1541]4 7009 212 1540 210 Protocol: Protocol:5 7004 212 1541 210 [212;212] [209;210]
45004
1 7026 101 1537 103
0 02 7023 101 1538 103 Random: Random:3 7019 101 1538 103 [7022;7023] [1537, 1538]4 7022 101 1538 103 Protocol: Protocol:5 7023 101 1536 103 [101] [103]
45005
1 7018 58 1540 57
0 02 7023 58 1542 57 Random: Random:3 7025 58 1543 56 [7019;7022] [1541;1542]4 7018 59 1545 57 Protocol: Protocol:5 7015 58 1541 57 [57;58] [56;57]
Table C.2: Measured goodput values (in kbps) for BitTorrent and Random flowson destination ports 45000 – 45005
73

Appendix D
Mobile Operators Details
Mobile Provider, Maximum Bandwidth Data Limit Reduced Bandwidthtarif-plan nameALDI Talk (MEDIONMobile),
7.2 Mbps 500MB 56 kbpsInternet-Flatrate M 1GB [79]
NettoKOM,7.2 Mbps 1 GB 56 kbps
Internet-Flat 1GB [11]
O2, Blue S [12] 7.2 Mbps 300 MB 64 kbps
Congstar,7.2 Mbps 500 MB
64 kbps downloadSurf Flat 500 [13] 16 kbps upload
Table D.1: Details of the tariff plans of mobile networks used during the trafficshaping detection experiments
74

Appendix E
Experiment Results
Here and after, in the measurement results tables the following abbreviationsare used:
RF – Random flow;
PF – Protocol flow;
U – Mann-Whitney U value;
Uc – Mann-Whitney U critical value;
Rm – mean goodput for the Random flow1;
Pm – mean goodput for the Protocol flow;
Rinterval – 95% confidence interval for the Random flow;
Pinterval – 95% confidence interval for the Protocol flow;
1Boundaries of the confidence intervals and the mean values have been rounded to integer values.
75

Protocol Cycle DownloadU Uc Rm Rinterval Pm PinternalRF PF
BitTorrent
1 923 970
8 2 988 [1026;1141] 1084 [930;1045]2 1102 11953 940 11354 797 9115 1164 1149
VoIP-H323
1 1205 1171
10 2 1008 [965;1050] 1157 [1149;1164]2 1093 10593 962 11544 804 4195 971 1148
FlashVideo
1 1132 1135
10 2 1123 [1110;1135] 1183 [1158;1207]2 1098 12023 757 12124 1139 9695 1059 704
HTTP
1 1117 1108
3 2 1110 [1101;1118] 1160 [1142;1177]2 1104 11953 1151 11714 915 11265 901 1184
SIP
1 1056 1126
10 2 1086 [1055;1116] 1106 [1095;1116]2 1212 10903 1117 11234 1045 5775 1198 1087
RTSP
1 1117 534
11 2 999 [939;1058] 1147 [1121;1172]2 958 2853 923 11954 1205 11355 843 1111
Table E.1: The results of measurements made on the ALDITalk’s HSPA mobilenetwork in the download direction during the daytime (1PM – 2PM).
76
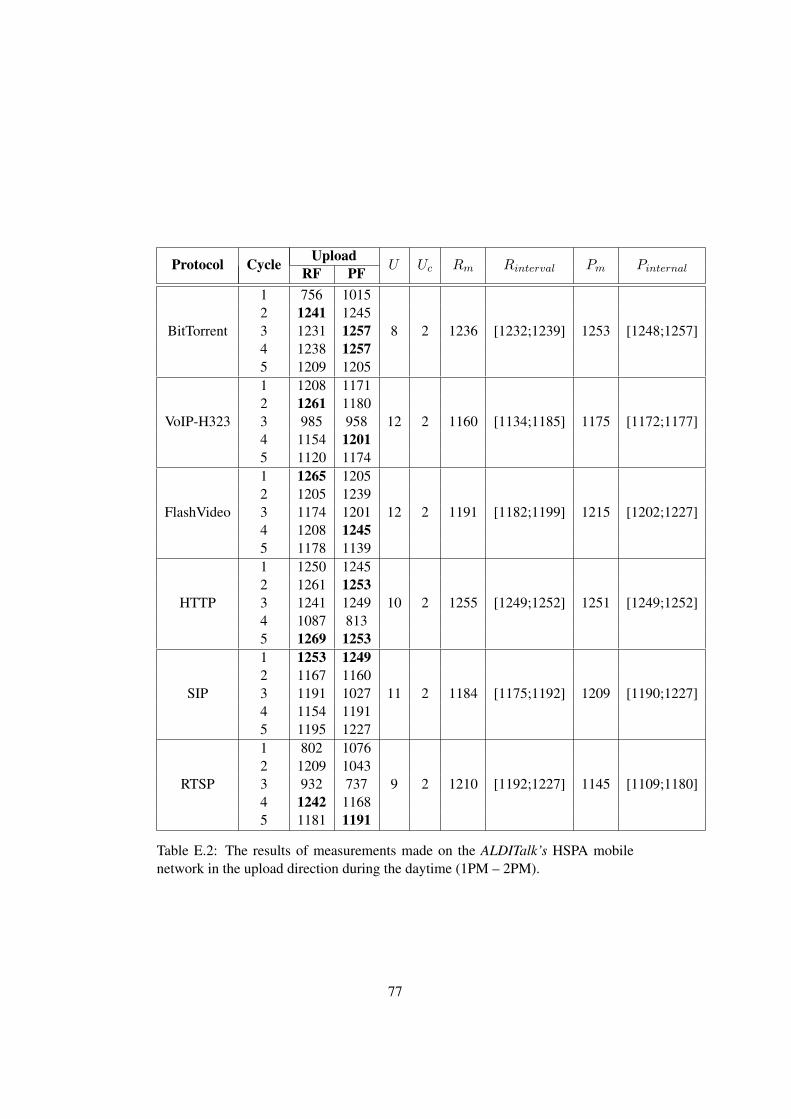
Protocol Cycle UploadU Uc Rm Rinterval Pm PinternalRF PF
BitTorrent
1 756 1015
8 2 1236 [1232;1239] 1253 [1248;1257]2 1241 12453 1231 12574 1238 12575 1209 1205
VoIP-H323
1 1208 1171
12 2 1160 [1134;1185] 1175 [1172;1177]2 1261 11803 985 9584 1154 12015 1120 1174
FlashVideo
1 1265 1205
12 2 1191 [1182;1199] 1215 [1202;1227]2 1205 12393 1174 12014 1208 12455 1178 1139
HTTP
1 1250 1245
10 2 1255 [1249;1252] 1251 [1249;1252]2 1261 12533 1241 12494 1087 8135 1269 1253
SIP
1 1253 1249
11 2 1184 [1175;1192] 1209 [1190;1227]2 1167 11603 1191 10274 1154 11915 1195 1227
RTSP
1 802 1076
9 2 1210 [1192;1227] 1145 [1109;1180]2 1209 10433 932 7374 1242 11685 1181 1191
Table E.2: The results of measurements made on the ALDITalk’s HSPA mobilenetwork in the upload direction during the daytime (1PM – 2PM).
77

Protocol Cycle DownloadU Uc Rm Rinterval Pm PinternalRF PF
BitTorrent
1 1084 1000
10 2 1094 [1083;1104] 1068 [1061;1074]2 1104 10703 1151 10784 1020 10565 1015 1108
VoIP-H323
1 1117 1129
10 2 1108 [1100;1115] 1084 [1061;1106]2 1130 11553 1093 10304 1056 10565 1114 1067
FlashVideo
1 1174 1142
5 2 1164 [1158;1169] 1128 [1119;1136]2 1154 11143 1151 11984 1181 10905 1164 1129
HTTP
1 1178 1138
11 2 1136 [1110;1161] 1141 [1138;1143]2 1070 10933 1089 11234 1184 11455 1142 1142
SIP
1 1107 1135
8 2 1124 [1106;1141] 1138 [1135;1140]2 1062 11363 1188 11444 1141 11435 1059 1125
RTSP
1 1120 1135
8 2 1093 [1090;1095] 1148 [1141;1154]2 1150 11563 1098 10454 1093 11545 1090 1108
Table E.3: The results of measurements made on the ALDITalk’s HSPA mobilenetwork in the download direction during the nighttime (4AM – 5AM).
78

Protocol Cycle UploadU Uc Rm Rinterval Pm PinternalRF PF
BitTorrent
1 1253 1246
11 2 1241 [1235;1246] 1249 [1246;1251]2 1234 12373 1238 12494 1269 12535 1220 1199
VoIP-H323
1 1234 1198
10 2 1236 [1233;1238] 1259 [1255;1262]2 1242 12603 1249 12644 1227 12205 1234 1253
FlashVideo
1 1261 1246
8 2 1257 [1252;1261] 1248 [1243;1252]2 1216 12423 1249 12614 1253 12055 1265 1257
HTTP
1 1265 1245
12 2 1233 [1230;1235] 1236 [1234;1237]2 1230 12303 1235 12654 1243 12385 1237 1232
SIP
1 1216 1226
7 2 1230 [1225;1234] 1227 [1223;1230]2 1235 12223 1226 12344 1261 12505 1257 1210
RTSP
1 1261 1135
7 2 1259 [1257;1260] 1254 [1250;1257]2 1270 12673 1249 12424 1261 12495 1261 1253
Table E.4: The results of measurements made on the ALDITalk’s HSPA mobilenetwork in the upload direction during the nighttime (4AM – 5AM).
79

Protocol Cycle DownloadU Uc Rm Rinterval Pm PinternalRF PF
BitTorrent
1 1132 1108
9 2 1141 [1135;1146] 1097 [1090;1103]2 1145 11323 1148 10874 1178 12055 995 1096
VoIP-H323
1 1195 1110
7 2 1140 [1135;1146] 1196 [1137;1142]2 1139 12053 1145 11954 1138 11845 1164 1198
FlashVideo
1 1126 1009
6 2 1124 [1119;1128] 1108 [1105;1110]2 1017 11133 1102 10094 1131 11085 1117 1104
HTTP
1 1134 932
9 2 1132 [1123;1140] 1136 [1129;1142]2 1145 10843 1117 11414 1174 11235 967 1145
SIP
1 1198 1025
6 2 1119 [1107;1130] 1066 [1024;1107]2 1120 8163 1099 7824 1063 11985 1138 1108
RTSP
1 443 907
8 2 1027 [1016;1037] 1108 [1100;1115]2 971 11223 1008 10984 1029 11065 1045 930
Table E.5: The results of measurements made on the NettoKOM’s HSPA mobilenetwork in the download direction during the daytime (3PM – 4PM).
80

Protocol Cycle UploadU Uc Rm Rinterval Pm PinternalRF PF
BitTorrent
1 1004 1238
7 2 1230 [1221;1238] 1229 [1212;1245]2 1019 11743 1245 11984 1227 12535 1220 1257
VoIP-H323
1 1249 1257
8 2 1261 [1248;1253] 1251 [1258;1263]2 1265 12383 1084 12494 1261 12495 1257 1261
FlashVideo
1 1215 1037
8 2 1123 [1118;1127] 1159 [1143;1174]2 1126 11673 940 12204 1129 11815 1116 1129
HTTP
1 1110 1093
10 2 1194 [1180;1207] 1200 [1187;1212]2 1206 12123 1009 11884 1209 10905 967 1220
SIP
1 1227 957
8 2 1208 [1189;1226] 1255 [1251;1258]2 1171 12593 717 9454 1067 12575 1227 1249
RTSP
1 1201 1167
12 2 1143 [1113;1172] 1078 [1055;1100]2 1123 10593 1105 9854 446 11235 864 1054
Table E.6: The results of measurements made on the NettoKOM’s HSPA mobilenetwork in the upload direction during the daytime (3PM – 4PM).
81

Protocol Cycle DownloadU Uc Rm Rinterval Pm PinternalRF PF
BitTorrent
1 969 940
9 2 1036 [975;1096] 926 [918;933]2 1157 9153 983 9854 875 9235 1212 1144
VoIP-H323
1 1151 1181
12 2 1169 [1149;1188] 1141 [1119;1162]2 1012 12343 1010 9534 1188 11105 1205 1132
FlashVideo
1 1177 1212
10 2 1176 [1159;1192] 1143 [1104;1181]2 1148 9073 555 11814 840 9445 1205 1105
HTTP
1 1212 988
8 2 1076 [1064;1087] 926 [874;977]2 1099 8253 1062 9674 1067 11385 350 466
SIP
1 1081 1114
12 2 1103 [1079;1126] 1024 [976;1071]2 1161 9533 923 10074 1126 7365 893 1167
RTSP
1 1099 1073
8 2 1074 [1044;1103] 1043 [979;1106]2 456 8433 1015 9234 1108 11615 713 1135
Table E.7: The results of measurements made on the NettoKOM’s HSPA mobilenetwork in the download direction during the nighttime (12AM – 1AM).
82

Protocol Cycle UploadU Uc Rm Rinterval Pm PinternalRF PF
BitTorrent
1 1245 589
8 2 1245 [1242;1247] 1233 [1224;1241]2 1249 12163 1216 12424 1168 11715 1241 1242
VoIP-H323
1 1208 1177
11 2 1226 [1215;1236] 1221 [1218;1223]2 1249 12233 1184 12574 1230 12195 1242 1223
FlashVideo
1 676 858
10 2 963 [851;1074] 1214 [1196;1231]2 1253 6813 1174 11814 923 12275 793 1234
HTTP
1 1249 1129
11 2 1234 [1225;1242] 1111 [1064;1157]2 1220 12493 1004 9894 1234 11815 883 1024
SIP
1 1184 913
10 2 1215 [1200;1229] 1232 [1225;1238]2 1242 12343 1238 12414 1005 9555 1198 1223
RTSP
1 1234 1223
8 2 1240 [1231;1248] 1216 [1212;1219]2 1231 12203 1257 12654 1265 12135 874 1209
Table E.8: The results of measurements made on the NettoKOM’s HSPA mobilenetwork in the upload direction during the nighttime (12AM – 1AM).
83
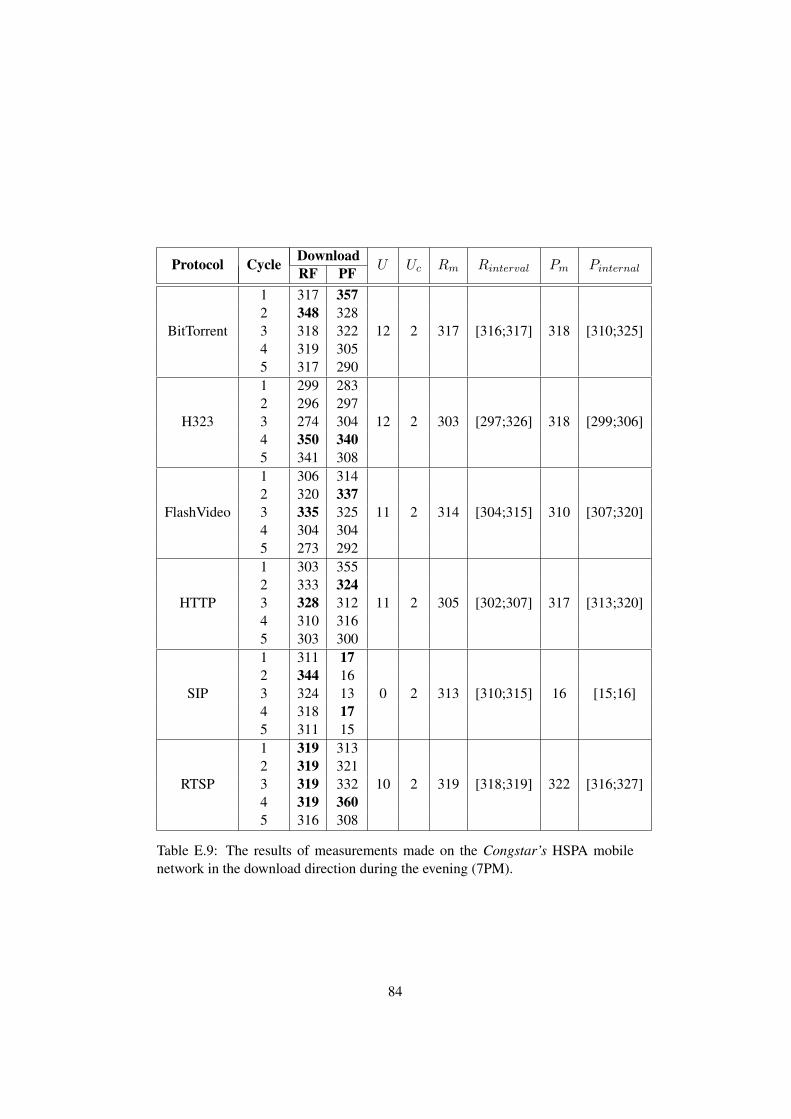
Protocol Cycle DownloadU Uc Rm Rinterval Pm PinternalRF PF
BitTorrent
1 317 357
12 2 317 [316;317] 318 [310;325]2 348 3283 318 3224 319 3055 317 290
H323
1 299 283
12 2 303 [297;326] 318 [299;306]2 296 2973 274 3044 350 3405 341 308
FlashVideo
1 306 314
11 2 314 [304;315] 310 [307;320]2 320 3373 335 3254 304 3045 273 292
HTTP
1 303 355
11 2 305 [302;307] 317 [313;320]2 333 3243 328 3124 310 3165 303 300
SIP
1 311 17
0 2 313 [310;315] 16 [15;16]2 344 163 324 134 318 175 311 15
RTSP
1 319 313
10 2 319 [318;319] 322 [316;327]2 319 3213 319 3324 319 3605 316 308
Table E.9: The results of measurements made on the Congstar’s HSPA mobilenetwork in the download direction during the evening (7PM).
84

Protocol Cycle UploadU Uc Rm Rinterval Pm PinternalRF PF
BitTorrent
1 32 333
12 2 332 [328;335] 332 [331;332]2 336 3293 333 3364 335 3315 326 332
H323
1 338 335
6 2 324 [320;327] 333 [332;333]2 321 3323 316 3264 321 3355 331 332
FlashVideo
1 334 320
10 2 332 [330;333] 327 [324;329]2 330 3313 332 3244 318 3405 337 328
HTTP
1 333 334
8 2 332 [331;332] 331 [328;333]2 333 3343 320 3374 331 3225 328 327
SIP
1 329 5
0 2 332 [331;332] 5 [5]2 332 53 320 54 332 55 328 5
RTSP
1 27 25
12 2 324 [317;330] 28 [23;32]2 315 283 30 324 332 3305 325 338
Table E.10: The results of measurements made on the Congstar’s HSPA mobilenetwork in the upload direction during the evening (7PM).
85

Direction Cycle RF PF U Uc Rm Rinterval Pm Pinternal
Download
1 5073 5471
5 2 5569 [5544;5593] 4927 [4646;5207]2 5481 45403 5545 56504 5689 47705 5593 4369
Upload
1 356 355
12 2 354 [353;354] 355 [354;355]2 355 3573 340 3414 352 3555 354 337
Table E.11: SIP protocol measurement test results on Congstar’s HSPA mobilenetwork during the morning hours (9AM).
86

Protocol Cycle DownloadU Uc Rm Rinterval Pm PinternalRF PF
BitTorrent
1 76 121
12 1 94 [91;96] 93 [91;94]2 95 933 113 954 timeout 695 93 93
VoIP-H323
1 94 71
7 1 95 [92;97] 71 [69;72]2 reset 533 96 1264 119 725 59 70
FlashVideo
1 123 102
8 2 123 [121;122] 122 [120;125]2 123 493 126 1224 122 1285 62 120
HTTP
1 115 67
7 2 113 [111;114] 115 [113;116]2 112 1173 70 1154 113 1325 114 115
SIP
1 118 124
11 2 107 [105;108] 118 [114;121]2 110 583 58 1144 107 1185 105 85
RTSP
1 64 101
8 2 124 [121;126] 117 [115;118]2 120 633 82 1164 127 1165 125 119
Table E.12: The results of measurements made on the ALDITalk’s EDGE mobilenetwork in the download direction during the daytime (10AM and 1PM).
87

Protocol Cycle UploadU Uc Rm Rinterval Pm PinternalRF PF
BitTorrent
1 92 88
5 1 90 [88;91] 87 [86;87]2 90 863 reset 554 89 885 53 87
VoIP-H323
1 92 87
7 1 75 [73;76] 87 [86;87]2 timeout 893 62 874 74 495 76 93
FlashVideo
1 95 76
3 2 80 [78;81] 77 [75;78]2 57 763 79 784 81 545 82 55
HTTP
1 52 88
3 2 86 [85;86] 86 [84;87]2 87 853 89 774 87 515 86 85
SIP
1 89 48
8 2 86 [84;87] 76 [75;76]2 86 763 84 764 50 785 70 79
RTSP
1 66 60
3 2 93 [91;94] 82 [80;83]2 95 823 91 524 88 835 94 81
Table E.13: The results of measurements made on the ALDITalk’s EDGE mobilenetwork in the upload direction during the daytime (10AM and 1PM).
88

Protocol Cycle DownloadU Uc Rm Rinterval Pm PinternalRF PF
BitTorrent
1 135 120
7 2 135 [134;135] 124 [121;126]2 135 1293 136 1344 122 1235 120 121
VoIP-H323
1 133 132
6 2 132 [131;132] 132 [130;133]2 130 1343 132 1234 134 1225 132 132
FlashVideo
1 139 133
4 2 136 [134;137] 133 [132;133]2 140 1353 134 1364 135 1335 135 133
HTTP
1 132 130
5 2 131 [130;131] 133 [132;133]2 131 1333 131 1354 131 1345 132 133
SIP
1 12 133
9 2 132 [130;133] 133 [132;133]2 130 1223 135 1334 133 1345 120 135
RTSP
1 123 133
12 2 135 [134;135] 132 [131;132]2 134 1373 136 1324 24 1325 135 133
Table E.14: The results of measurements made on the ALDITalk’s EDGE mobilenetwork in the download direction during the nighttime (1AM).
89

Protocol Cycle UploadU Uc Rm Rinterval Pm PinternalRF PF
BitTorrent
1 93 90
7 2 93 [92;93] 91 [90;91]2 97 933 91 894 93 915 93 92
VoIP-H323
1 89 93
10 2 91 [90;91] 91 [90;91]2 91 923 93 914 91 915 92 91
FlashVideo
1 95 94
8 2 94 [93;94] 94 [93;94]2 94 943 94 934 94 955 94 95
HTTP
1 95 93
1 2 95 [94;95] 93 [92;93]2 94 933 96 944 95 935 95 95
SIP
1 5 90
11 2 94 [92;95] 93 [92;93]2 94 943 97 954 92 945 94 93
RTSP
1 92 93
7 2 92 [90;93] 93 [92;93]2 91 923 95 954 7 945 92 95
Table E.15: The results of measurements made on the ALDITalk’s EDGE mobilenetwork in the upload direction during the nighttime (1AM).
90

Protocol Cycle DownloadU Uc Rm Rinterval Pm PinternalRF PF
BitTorrent
1 115 150
12 2 138 [128;147] 147 [144;149]2 152 1433 142 1654 121 1495 167 88
VoIP-H323
1 130 143
5 2 129 [128;129] 142 [139;144]2 120 703 130 1394 129 1465 74 150
FlashVideo
1 134 140
4 2 132 [130;133] 137 [135;138]2 133 1353 134 1544 130 985 88 136
HTTP
1 150 67
4 1 147 [145;148] 140 [138;141]2 146 1393 reset 1414 145 1425 91 131
SIP
1 135 142
9 2 132 [130;133] 133 [126;139]2 122 1823 83 1384 130 1205 131 82
RTSP
1 159 128
5 2 147 [145;148] 125 [124;125]2 145 1253 62 1014 148 1225 150 125
Table E.16: The results of measurements made on the NettoKOM’s EDGE mobilenetwork in the download direction during the daytime (9AM –10AM).
91

Protocol Cycle UploadU Uc Rm Rinterval Pm PinternalRF PF
BitTorrent
1 81 62
10 2 45 [43;46] 44 [42;45]2 46 473 45 454 16 125 46 42
VoIP-H323
1 34 49
11 2 44 [43;44] 45 [44;45]2 58 453 44 454 44 465 45 22
FlashVideo
1 81 47
11 2 45 [42;47] 45 [43;46]2 80 443 46 444 27 305 45 56
HTTP
1 52 16
11 1 47 [44;49] 46 [45;46]2 46 463 timeout 464 44 485 30 45
SIP
1 45 45
12 2 45 [44;45] 45 [44;45]2 44 323 46 464 25 455 46 50
RTSP
1 39 23
4 2 38 [37;38] 43 [42;43]2 37 423 19 444 38 435 31 44
Table E.17: The results of measurements made on the NettoKOM’s EDGE mobilenetwork in the upload direction during the daytime (9AM –10AM).
92

Protocol Cycle DownloadU Uc Rm Rinterval Pm PinternalRF PF
BitTorrent
1 187 190
8 2 184 [181;186] 188 [186;189]2 186 1633 147 1484 180 1895 110 186
VoIP-H323
1 126 137
9 2 180 [177;182] 138 [126;149]2 181 1203 183 1154 122 1875 176 158
FlashVideo
1 183 96
8 2 178 [173;182] 178 [173;182]2 183 1783 170 1254 187 1715 167 186
HTTP
1 26 170
9 2 180 [176;183] 165 [159;170]2 178 1253 186 1904 187 1185 172 161
SIP
1 164 11
9 2 179 [174;183] 182 [180;183]2 187 1703 185 1834 170 1805 182 183
RTSP
1 128 183
6 2 121 [117;124] 187 [184;189]2 166 1263 119 1874 151 1275 117 191
Table E.18: The results of measurements made on the NettoKOM’s EDGE mobilenetwork in the download direction during the nighttime (12AM – 1AM).
93
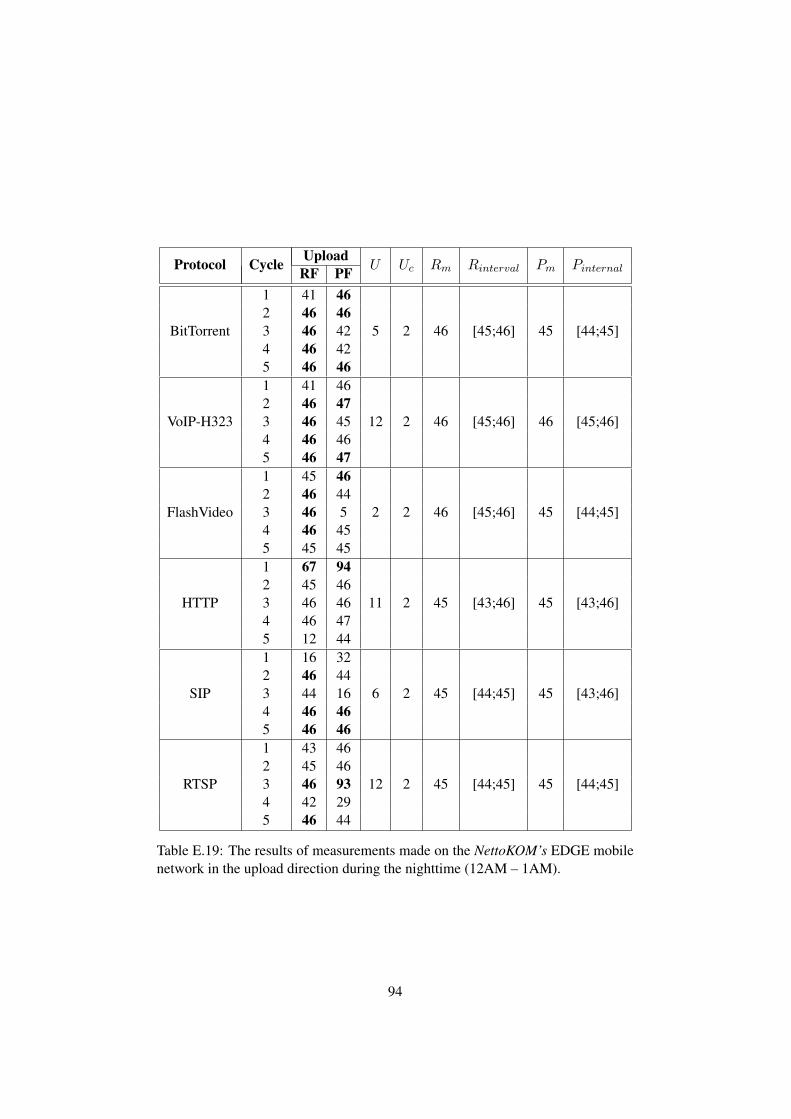
Protocol Cycle UploadU Uc Rm Rinterval Pm PinternalRF PF
BitTorrent
1 41 46
5 2 46 [45;46] 45 [44;45]2 46 463 46 424 46 425 46 46
VoIP-H323
1 41 46
12 2 46 [45;46] 46 [45;46]2 46 473 46 454 46 465 46 47
FlashVideo
1 45 46
2 2 46 [45;46] 45 [44;45]2 46 443 46 54 46 455 45 45
HTTP
1 67 94
11 2 45 [43;46] 45 [43;46]2 45 463 46 464 46 475 12 44
SIP
1 16 32
6 2 45 [44;45] 45 [43;46]2 46 443 44 164 46 465 46 46
RTSP
1 43 46
12 2 45 [44;45] 45 [44;45]2 45 463 46 934 42 295 46 44
Table E.19: The results of measurements made on the NettoKOM’s EDGE mobilenetwork in the upload direction during the nighttime (12AM – 1AM).
94

Protocol Cycle DownloadU Uc Rm Rinterval Pm PinternalRF PF
BitTorrent
1 52 54
6 2 52 [51;52] 53 [52;53]2 53 513 52 544 50 545 53 53
VoIP-H323
1 52 54
6 2 51 [50;51] 53 [52;53]2 52 503 51 544 49 535 53 53
FlashVideo
1 54 53
4 2 54 [53;54] 52 [51;52]2 54 513 51 534 56 535 55 52
HTTP
1 52 52
11 2 53 [52;53] 53 [52;53]2 55 553 54 544 54 545 51 53
SIP
1 54 53
11 2 54 [53;54] 54 [53;54]2 54 553 53 544 54 565 53 54
RTSP
1 54 52
0 2 53 [52;53] 53 [52;53]2 55 533 53 534 53 535 53 53
Table E.20: The results of measurements made on the NettoKOM’s HSPA mo-bile network in the download direction during the daytime (10AM) after the usercrossed the data limit.
95

Protocol Cycle UploadU Uc Rm Rinterval Pm PinternalRF PF
BitTorrent
1 23 21
7 2 25 [23;26] 24 [23;24]2 22 233 28 254 27 255 27 24
VoIP-H323
1 25 25
4 2 25 [24;25] 25 [24;25]2 25 243 27 254 25 255 24 25
FlashVideo
1 27 23
0 2 27 [26;27] 24 [23;24]2 26 243 26 244 27 255 27 26
HTTP
1 21 22
6 2 25 [24;25] 22 [21;22]2 25 223 26 254 24 215 28 25
SIP
1 23 27
6 2 25 [22;23] 22 [24;25]2 19 253 25 264 23 205 24 25
RTSP
1 21 25
6 2 23 [22;23] 26 [25;26]2 23 263 23 264 27 265 25 26
Table E.21: The results of measurements made on the NettoKOM’s HSPA mobilenetwork in the upload direction during the daytime (10AM) after the user crossedthe data limit.
96

Protocol Cycle DownloadU Uc Rm Rinterval Pm PinternalRF PF
BitTorrent
1 54 55
4 2 55 [54;55] 53 [52;53]2 56 523 55 534 54 555 55 53
VoIP-H323
1 53 54
9 2 53 [52;53] 53 [52;53]2 52 533 53 534 55 545 55 53
HTTP
1 55 55
9 2 55 [54;55] 54 [53;54]2 55 563 54 554 54 535 55 54
SIP
1 55 52
0 2 56 [55;56] 52 [51;52]2 56 533 55 554 56 535 56 52
RTSP
1 53 54
8 2 55 [53;54] 54 [53;54]2 55 563 55 544 54 545 54 52
Table E.22: The results of measurements made on the ALDITalk’s HSPA mo-bile network in the download direction during the daytime (11AM) after the usercrossed the data limit.
97

Protocol Cycle UploadU Uc Rm Rinterval Pm PinternalRF PF
BitTorrent
1 54 51
5 2 54 [53;54] 53 [52;53]2 55 553 55 544 53 545 54 53
VoIP-H323
1 52 54
5 2 53 [52;53] 54 [53;54]2 53 553 55 554 53 545 53 54
HTTP
1 52 55
8 2 53 [52;53] 53 [52;53]2 55 533 55 524 54 535 53 55
SIP
1 55 54
4 2 54 [53;54] 54 [53;54]2 53 543 55 534 54 545 54 54
RTSP
1 54 55
10 2 55 [55] 54 [53;54]2 55 553 54 554 54 555 55 55
Table E.23: The results of measurements made on the ALDITalk’s HSPA mobilenetwork in the upload direction during the daytime (11AM) after the user crossedthe data limit.
98
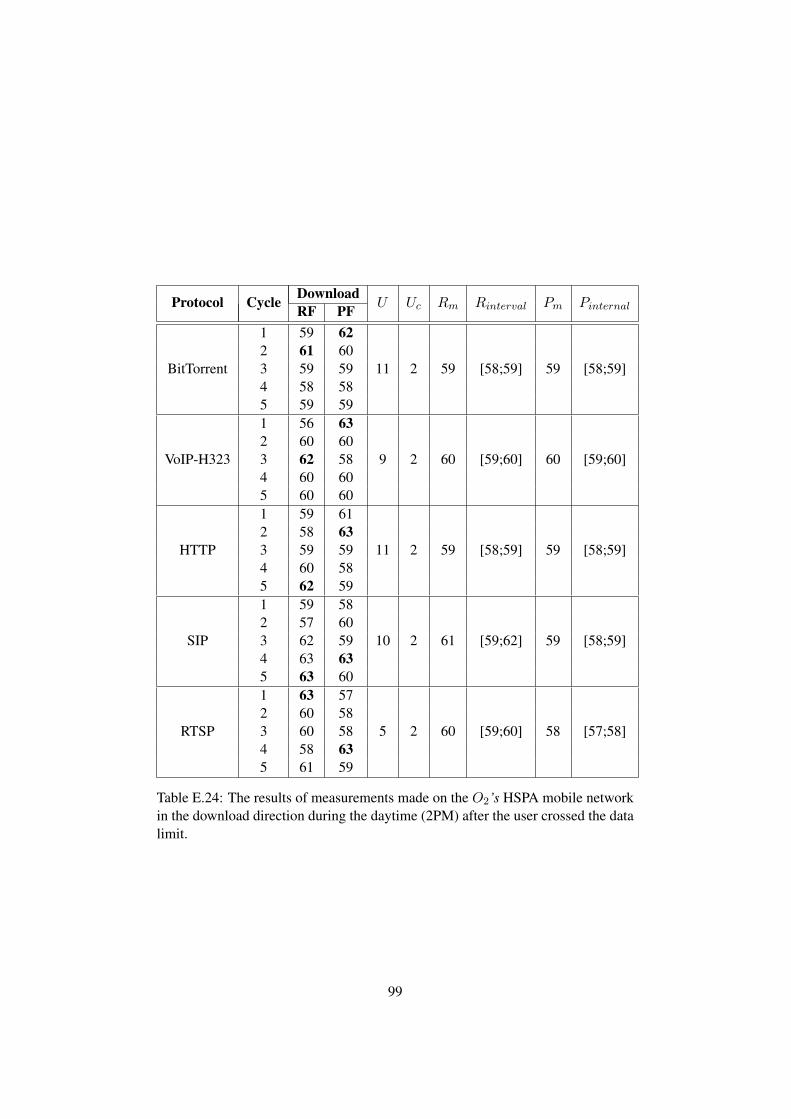
Protocol Cycle DownloadU Uc Rm Rinterval Pm PinternalRF PF
BitTorrent
1 59 62
11 2 59 [58;59] 59 [58;59]2 61 603 59 594 58 585 59 59
VoIP-H323
1 56 63
9 2 60 [59;60] 60 [59;60]2 60 603 62 584 60 605 60 60
HTTP
1 59 61
11 2 59 [58;59] 59 [58;59]2 58 633 59 594 60 585 62 59
SIP
1 59 58
10 2 61 [59;62] 59 [58;59]2 57 603 62 594 63 635 63 60
RTSP
1 63 57
5 2 60 [59;60] 58 [57;58]2 60 583 60 584 58 635 61 59
Table E.24: The results of measurements made on the O2’s HSPA mobile networkin the download direction during the daytime (2PM) after the user crossed the datalimit.
99

Protocol Cycle UploadU Uc Rm Rinterval Pm PinternalRF PF
BitTorrent
1 29 25
7 2 24 [23;24] 24 [23;24]2 24 253 23 244 25 245 25 24
VoIP-H323
1 26 26
3 2 26 [25;26] 26 [25;26]2 26 263 26 254 25 255 26 26
HTTP
1 22 25
8 2 24 [23;24] 25 [24;25]2 25 233 24 244 25 255 26 25
SIP
1 25 25
3 2 25 [24;25] 24 [23;24]2 24 243 25 244 24 245 26 22
RTSP
1 24 27
6 2 25 [24;25] 26 [25;26]2 24 253 25 264 25 265 25 26
Table E.25: The results of measurements made on the O2’s HSPA mobile networkin the upload direction during the daytime (2PM) after the user crossed the datalimit.
100

Protocol Cycle DownloadU Uc Rm Rinterval Pm Pinternal TimeRF PF
BitTorrent
1 760 752
9 2 745 [737;752] 772 [750;793] 8 PM2 730 9783 739 9874 754 7935 953 652
VoIP-H323
1 610 989
5 2 684 [682;685] 703 [698;707] 8 PM2 1050 6983 685 7104 683 7025 685 797
FlashVideo
1 5744 6133
7 2 5797 [5792;5801] 6095 [6087;6102] 3 AM2 5802 60453 6089 60894 6047 57485 5793 6102
HTTP
1 5833 6028
11 2 5841 [5832;5849] 6043 [6033;6052] 3 AM2 5857 60463 6078 60574 5833 10155 23 5703
SIP
1 1420 1647
10 2 1509 [1453;1564] 1594 [1544;1643] 3 PM2 1408 20283 2023 14974 1612 16405 1596 1408
RTSP
1 1532 1647
6 2 1497 [1487;1506] 1495 [1476;1513] 3 PM2 1934 14383 2088 15504 1514 14805 1487 1474
Table E.26: The results of measurements made on the MTS’s (Belarus) HSPA mo-bile network in the download direction.
101
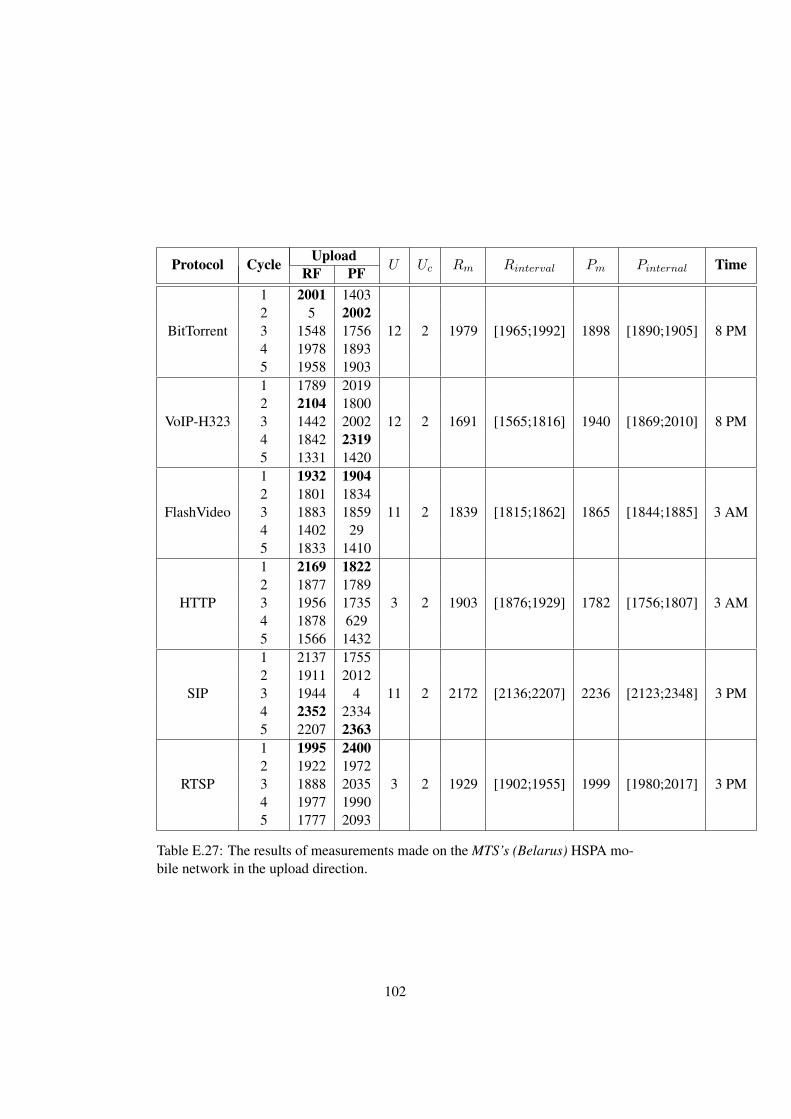
Protocol Cycle UploadU Uc Rm Rinterval Pm Pinternal TimeRF PF
BitTorrent
1 2001 1403
12 2 1979 [1965;1992] 1898 [1890;1905] 8 PM2 5 20023 1548 17564 1978 18935 1958 1903
VoIP-H323
1 1789 2019
12 2 1691 [1565;1816] 1940 [1869;2010] 8 PM2 2104 18003 1442 20024 1842 23195 1331 1420
FlashVideo
1 1932 1904
11 2 1839 [1815;1862] 1865 [1844;1885] 3 AM2 1801 18343 1883 18594 1402 295 1833 1410
HTTP
1 2169 1822
3 2 1903 [1876;1929] 1782 [1756;1807] 3 AM2 1877 17893 1956 17354 1878 6295 1566 1432
SIP
1 2137 1755
11 2 2172 [2136;2207] 2236 [2123;2348] 3 PM2 1911 20123 1944 44 2352 23345 2207 2363
RTSP
1 1995 2400
3 2 1929 [1902;1955] 1999 [1980;2017] 3 PM2 1922 19723 1888 20354 1977 19905 1777 2093
Table E.27: The results of measurements made on the MTS’s (Belarus) HSPA mo-bile network in the upload direction.
102

Direction Cycle RF PF U Uc Rm Rinterval Pm Pinternal
Download
1 1846 966
12 2 1846 [1843;1848] 1788 [1725;1850]2 1850 12173 1842 18524 1810 18495 842 1664
Upload
1 1846 966
10 2 855 [843;874] 859 [849;860]2 1850 12173 1842 18524 1810 18495 842 1664
Table E.28: The results of the BitTorrent protocol measurements made on theLUXGSM’s (Luxemburg) HSPA mobile network during the daytime (12PM).
Direction Cycle RF PF U Uc Rm Rinterval Pm Pinternal
Download
1 335 341
6 2 309 [302;315] 326 [318;333]2 317 2943 316 3494 280 3195 296 320
Upload
1 955 1023
11 2 309 [843;874] 326 [849;860]2 1003 10013 1017 10094 856 7675 985 975
Table E.29: The results of the HTTP protocol measurements made on the AT&T’s(USA) HSPA mobile network during the daytime (3PM).
103