trading techniques, with 2 questions answered
TRANSCRIPT

7/31/2019 Trading Techniques, With 2 Questions Answered
http://slidepdf.com/reader/full/trading-techniques-with-2-questions-answered 1/69
Fundamental Analysis
Fundamental Analysis is the oldest way of examining the underlying forces of industries or
companies. The reason we specify both, industries and companies is that the fundamental
analysis differs in both the cases unlike technical analysis though the ultimate goal is to find
the future price. In company particular analysis, parameters like competition and financial
information are taken in to consideration along with normal price ratios where as in industry
particular analysis, supply and demand forces does the work. In FA, analyzing might be
done on sector to sector or on company. For example, a reality company may be compared
to another reality company or sometimes a reality sector may be compared with telecom
sector. Though there are many inputs, some of important potential inputs are cash flow,
cash on hand, current ratio, earnings, market share, price/book value, price/earnings,
revenues etc. As always, there are strengths as well weaknesses when consideringfundamental analysis. Long term trends and value spotting are the strengths whereas long
time consuming, sector specific and subjectivity stands as drawbacks.
Technical Analysis
Technical Analysis (Pure Technical Analysis) never deals with ratios, earnings or sectors. Mid
half of 19th century gave much more importance to technical analysis. Though the ultimate
goal is to find the future price, lot of difference involved when compared with fundamental
analysis. There is nothing called easy rule/formula neither in fundamental nor in technical
analysis. Technical analysis helps investors to predict the future trend using time period on
X-axis and price on Y-axis (mostly). Most advantage with technical analysis over
fundamental analysis, charts and charting techniques never look whether they are from
equity, commodity or forex. In addition, fundamental analysis can not be applied to day
trading as they cannot influence minor time periods but that’s all not the case with technical
analysis. Different charts and charting software provide wide range of technical studies like
indicators, overlays, oscillators etc. Using the said instruments, traders can analyze markets
for intraday, short term and long term. Various trends, support and resistance levels,
historical price movements can be almost easily predicted using technical analysis. Last but
not the least, controversies group together as said by many experts, by the time chart
identifies a trend, much of the portion will be moved.
Basically there are two types of trading styles – One is going with the market trend and the

7/31/2019 Trading Techniques, With 2 Questions Answered
http://slidepdf.com/reader/full/trading-techniques-with-2-questions-answered 2/69
other being against the market trend. All thousands of studies, techniques or strategies
must fall in either of these two styles. Going against the trend is best suited in consolidating
markets as over bought markets start falling which is against the trend and oversold
markets start rising. Trading with the trend is obviously best suited in good volatile markets
as the trend carries for a long period, where a falling markets may fall more and rising
markets may rise more. While going through each of our chapters, traders should know the
study is of which style as said before; it would be easy to apply different trading methods in
different kinds of market
History of Candlesticks
The present candlesticks which are used in many parts of the world were developed by
Japanese in the 17th century. The present day candlestick has been modified when
compared to the one initially developed. A good trader who uses candlestick patterns must
know what exactly a candlestick is and what it indicates us.

7/31/2019 Trading Techniques, With 2 Questions Answered
http://slidepdf.com/reader/full/trading-techniques-with-2-questions-answered 3/69
The lines above and below the body are Upper shadow and Lower shadow respectively. By
looking at the candle, say nifty chart, the analyst must be in a position to tell where the
candle opened and closed. Simple rule, if the candle of nifty chart is green (or white as per
the settings), the bottom of the body is opening whereas the top of the body is closing
which means closing price is above the opening price which is a bullish one. As well, if the
candle of nifty chart is red (or black), the top of the body is opening whereas the bottom of
the body is closing which means closing price is below the opening price of the particular
period representing a bearish phase.

7/31/2019 Trading Techniques, With 2 Questions Answered
http://slidepdf.com/reader/full/trading-techniques-with-2-questions-answered 4/69
Based on the candlesticks, future trends can be predicted. Below are some of the important
candlestick patterns. All the patterns shown are reversal patterns after the end of bull/bear
phase
Bullish Patterns Bearish Patterns
Hammer Shooting Star
Morning Star Evening Star
Morning Doji Star Evening Doji Star
Bullish Engulfing Bearish Engulfing
Hanging Man
Harami
Bullish Patterns
In this chapter, we are going to learn about bullish patterns whereas in the next article, we
will explain you about bearish candlestick patterns.
Select each of the bullish patterns below to read them in detail along with special trading
techniques defined by our SM technicals team.
Hammer
This is a bullish reversal pattern formed by the candlesticks. This is done when
markets/security takes turn from bear phase to bull phase. This works well in combination
with other indicators or overlays.

7/31/2019 Trading Techniques, With 2 Questions Answered
http://slidepdf.com/reader/full/trading-techniques-with-2-questions-answered 5/69
After a good bear market, a bottom candle forms with hammer shape. Like hammer, it too
contains body and a handle which means, in that particular period, the security ends higher
when compared with its start. It’s very important to note that the color of the candle should
NOT be taken in to consideration but only the shape because even in red candle hammer
shape, the handle indicates us that the stock in that particular period recovered from low.
Trade technique by SM Technicals
First candle formation must be in the shape of hammer which throws a sign of trend
reversal.
Second candle, known as confirmation candle must be a bullish one with closing above
the previous one which indicates more strength to the ongoing trend.
Trade initiation candle, initiate the trade at the beginning of the third candle with
stoploss as the first candles low.
Note: Target recommended for his type of candlestick patters are 3 to 5 periods. Target can
also be taken same as the stoploss

7/31/2019 Trading Techniques, With 2 Questions Answered
http://slidepdf.com/reader/full/trading-techniques-with-2-questions-answered 6/69
Morning Star
As the name indicates, morning star is giving birth to a new trend which in this case is from
bear to bull phase. This is a trend reversal pattern which forms at the bottom of the
phenomenon. In this pattern, the bear candle is followed by a bull candle which is again
followed by a big green candle.
Trade technique by SM Technicals
Second candle has to open way below the first candle's close/low and end up in
green trying to fill up the gap formed.
Close of third candle must be above the first candle's mid-section.
Trade initiation candle is the fourth candle with a stoploss of second candle’s low and
target of 3 to 5 periods.
7/31/2019 Trading Techniques, With 2 Questions Answered
http://slidepdf.com/reader/full/trading-techniques-with-2-questions-answered 7/69
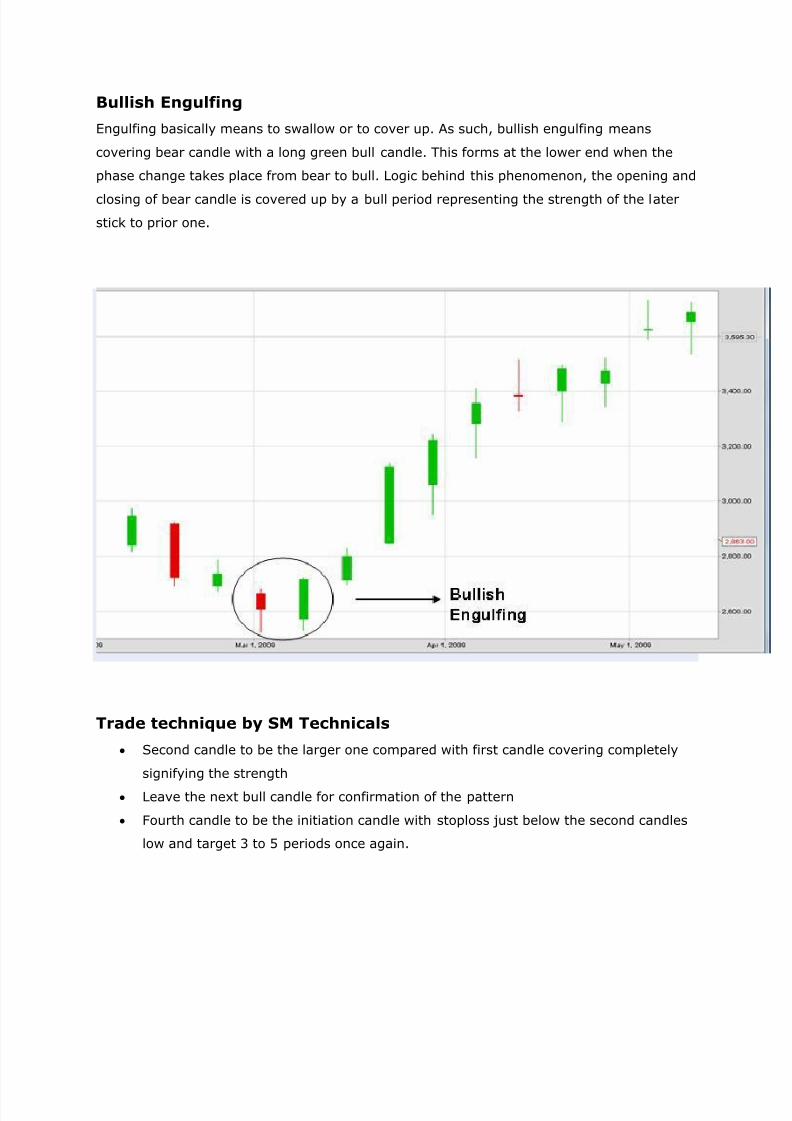
Bullish Engulfing
Engulfing basically means to swallow or to cover up. As such, bullish engulfing means
covering bear candle with a long green bull candle. This forms at the lower end when the
phase change takes place from bear to bull. Logic behind this phenomenon, the opening and
closing of bear candle is covered up by a bull period representing the strength of the later
stick to prior one.
Trade technique by SM Technicals
Second candle to be the larger one compared with first candle covering completely
signifying the strength
Leave the next bull candle for confirmation of the pattern
Fourth candle to be the initiation candle with stoploss just below the second candles
low and target 3 to 5 periods once again.

7/31/2019 Trading Techniques, With 2 Questions Answered
http://slidepdf.com/reader/full/trading-techniques-with-2-questions-answered 8/69
Doji
If the opening of a candlestick's period is almost equal to its closing, it is said to be a DOJI
phenomenon.
Morning Doji Star
Morning Doji star is similar to morning star except that the second and middle candle has to
get the shape of doji which once again represents that the trend is equalizing in that
particular period giving chance to inverse the trend - bearish to bullish.
Trade technique by SM Technicals
First candle, a bear candle
Second candle, a doji - closing equal to open of the same period.
Third candle, a confirmation green stick with closing above the first candles mid-
section
Fourth candle, trade initiation with stoploss as doji's low.

7/31/2019 Trading Techniques, With 2 Questions Answered
http://slidepdf.com/reader/full/trading-techniques-with-2-questions-answered 9/69
Bearish Patterns
Following are some of the important Bearish patterns
Shooting Star
Hanging Man
Evening Star
Bearish Engulfing
Harami
Evening Doji Star
Let us discuss all of them in detail:

7/31/2019 Trading Techniques, With 2 Questions Answered
http://slidepdf.com/reader/full/trading-techniques-with-2-questions-answered 10/69
Shooting Star:
Shooting star is a candlestick pattern which forms a reversal trend from bullish to bearish.
This looks like an inverted hammer in shape with body at the lower end and body at the
higher end. As discussed in our previous article, bullish patterns here too colour of the
candle should not be considered. Once again, logic remains same - for a red candle, the low
stays almost at the bottom which tells us that the markets are falling. As well, green candle
too indicates a bear phase as the long body shows that the markets are not likely interested
to stay long though the overall phase if positive.
Trade technique by SM Technicals
First candle - Inverted hammer shape formation (no matter whether its green or red)
Confirmation candle - red candle with the formation of lower lows (closing below the
previous candle's close)
Trade initiation candle - shorting with a stoploss of first candles high and target of 3
to 5 periods

7/31/2019 Trading Techniques, With 2 Questions Answered
http://slidepdf.com/reader/full/trading-techniques-with-2-questions-answered 11/69
Hanging Man
As the name resembles, it’s a shape similar to a man hanging with head and body. Hanging
man is also a hammer shaped pattern formed at the top of the trend. Here too the trend
reversal occur from bulls to bears forming a pattern at top. Only difference between a
shooting star and hanging man is that shooting star gets an inverted hammer whereas the
hanging man has a hammer shape.
Trade technique by SM Technicals
First candle forming at the top is a hammer shaped candle with body and shadow
Second candle being the follower with the closing below the previous one.
Third candle to be a trade initiation stick with stoploss of first candle's high and
target 3 to 5 period

7/31/2019 Trading Techniques, With 2 Questions Answered
http://slidepdf.com/reader/full/trading-techniques-with-2-questions-answered 12/69
Evening Star
This is exactly reverse to morning star forming at the top section to inverse the trend from
bullish to bearish. Strategy remains same with a bull candle followed by two bear sticks.
Trade technique by SM Technicals
Second candle gap up opening and closing in red
Third candle to close below the first candles mid-section Trade initiation at fourth candle

7/31/2019 Trading Techniques, With 2 Questions Answered
http://slidepdf.com/reader/full/trading-techniques-with-2-questions-answered 13/69
Bearish Engulfing
In this, the bull candle is swallowed by a long red bear candle curtaining to the on-going
bull phase and giving rise to a new bear trend. This forms at the top edge converting the
bullish trend to a bearish trend.
Trade technique by SM Technicals
First candle to be a bull candlestick.
Second candle is bear candle, a much bigger one to its prior bull candlestick
Third candle again must be a bear candle closing below the previous one confirming
the trend.
Trade initiation to take place at the fourth candle placing the stoploss just above the
second candles high and usual target of 3 to 5 periods

7/31/2019 Trading Techniques, With 2 Questions Answered
http://slidepdf.com/reader/full/trading-techniques-with-2-questions-answered 14/69
Harami
Harami is reverse of bearish engulfing (does not mean bullish engulfing). In bearish
engulfing, first bull candle is a small one which is covered entirely by a bear candle whereas
in Harami, the first bull candle is a much bigger one followed by a small bear candle which
gets covered by the first stick.

7/31/2019 Trading Techniques, With 2 Questions Answered
http://slidepdf.com/reader/full/trading-techniques-with-2-questions-answered 15/69
Evening Doji Star
Same as evening star altering the middle candle - Middle candle to be replaced with a doji.
This trend reversal pattern occurs at the top rearing the trend.
Trade Technique as follows
Bull candle - Doji - Bear candle closing below the bull candles mid-section - Trade starter
with regular stoploss and target.

7/31/2019 Trading Techniques, With 2 Questions Answered
http://slidepdf.com/reader/full/trading-techniques-with-2-questions-answered 16/69
Bollinger Bands
Bollinger bands are one of the most commonly used indicators based on volatility. There are
two bands, Upper and Lower bands which are placed above and below the moving average
respectively. Normal moving average used with Bollinger band is 20 SMA. The way how
Bollinger band differs from other indicators is that the bands widen when the volatility is
more and narrow when the volatility is less. The volatility is based on Standard Deviation.
In the chart shown, Bollinger bands can be seen with upper, lower and middle bands. Themiddle band is a simple moving average
Effective Strategies used with Bollinger bands
W-Bottoms
M-Tops
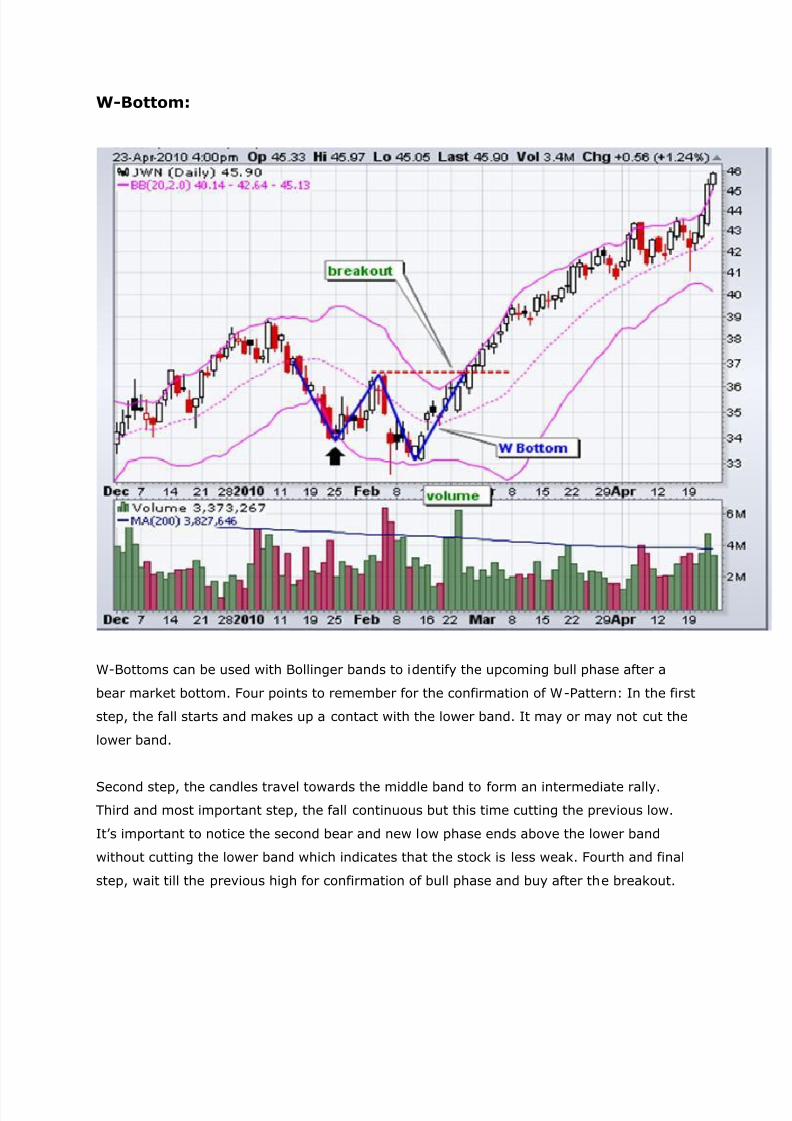
7/31/2019 Trading Techniques, With 2 Questions Answered
http://slidepdf.com/reader/full/trading-techniques-with-2-questions-answered 17/69

7/31/2019 Trading Techniques, With 2 Questions Answered
http://slidepdf.com/reader/full/trading-techniques-with-2-questions-answered 18/69
M-Tops are exactly reverse to W-Bottoms. It helps in finding the upcoming bear phase after
a bull market. Let’s put it in the other way, it helps in finding the M-Bottom (M Pattern
bottom) which confirms a bear market. Once again, four points to analyze while predicting
the M-Top – Forming first high, intermediate fall towards the middle band, making new high
(importantly not cutting the upper band), breaking the previous low.

7/31/2019 Trading Techniques, With 2 Questions Answered
http://slidepdf.com/reader/full/trading-techniques-with-2-questions-answered 19/69
Moving Averages:
First thing we would like to expose about moving averages is that they do not predict the
future prices but instead shows the trend of the running markets using past prices. Simple
Moving Average (SMA) and Exponential Moving Averages(EMA) are the most familiar
moving averages where as Weighted Moving Average (WMA) is not well known.
Simple Moving Average:
The name itself mentions the calculation part of this type moving average. For instance, a 5
day simple moving average is calculated by adding previous 5 day closing prices and
dividing it by the number of periods taken (5). This will be the calculation on 6th day.
For the calculation on the seventh day, the number of period remains same as we are
calculating for a 5 day SMA whereas the sixth (previous) day is taken into consideration
dropping the first day. Same continuous on the 8th day.
How Moving Averages are used:
Moving averages can be used solely or in combination with other MA. Normally used Moving
averages are 5,10,20,50,100 and 200.
In general, 50 periods moving average is used for medium term whereas 200 moving
averages are said to hold ultimate support/resistance levels. If the stock cuts 200 Day
moving average, it shows that the market is very much in a weak trend. As well, it the stock
breaks 200 DMA on the upper side, it means that we are heading towards a strong bull
phase.

7/31/2019 Trading Techniques, With 2 Questions Answered
http://slidepdf.com/reader/full/trading-techniques-with-2-questions-answered 20/69
Price Crossovers:
In the chart shown, the moving average is solely used with the closing prices. If the closing
market price if above the moving average, we may head towards an upward trend which
indicates bullish phase. If the closing price is below the average moving price, it indicates
that markets are weak.

7/31/2019 Trading Techniques, With 2 Questions Answered
http://slidepdf.com/reader/full/trading-techniques-with-2-questions-answered 21/69
Double Crossovers
Many analysts also go with 2 averages along with cmp candles, waiting for double
confirmation. But this method is said to have a disadvantage of showing the trend after
much of the part is completed.
When a shorter period moving average crosses longer period moving average in the upside,
it’s said to a bullish crossover, also termed as Golden cross. When a shorter period moving
average crosses longer period moving average in the downside, its said to be a bearish
crossover, also termed as Dead Cross.

7/31/2019 Trading Techniques, With 2 Questions Answered
http://slidepdf.com/reader/full/trading-techniques-with-2-questions-answered 22/69
Moving averages can also be used with combination of both SMA and EMA. Point to
remember while analyzing with both the moving averages, that movement of EMA is faster
than the movement of SMA. In short, if both averages are plotted over a chart, SMA curves
only after EMA does.
It is said that longer the analyzing period, longer the moving average to be taken. For
instance, for a long term period, a moving average of 100 may suit though there is no well
proved strategy for picking the averages. The reason is that the longer moving average is
not affected by the short term movements, giving more clarity towards the long term.

7/31/2019 Trading Techniques, With 2 Questions Answered
http://slidepdf.com/reader/full/trading-techniques-with-2-questions-answered 23/69
Parabolic SAR: (Developed by welles Wilder)
Parabolic SAR not only deals with price but also with time. SAR stands for Stop And
Reverse. Very important point we would like to expose here - if you have read our previous
article, introduction to technical analysis, in that we have released a statement, trading
against the trend is one of the two types of trading which would be done preferably during
consolidated markets. But this study contradicts our statement as this is a reverse trade
going against the trend and at the same time not preferred during dull markets. It works
well in good volatile markets. This only feature differs this overlay method with others.
7/31/2019 Trading Techniques, With 2 Questions Answered
http://slidepdf.com/reader/full/trading-techniques-with-2-questions-answered 24/69
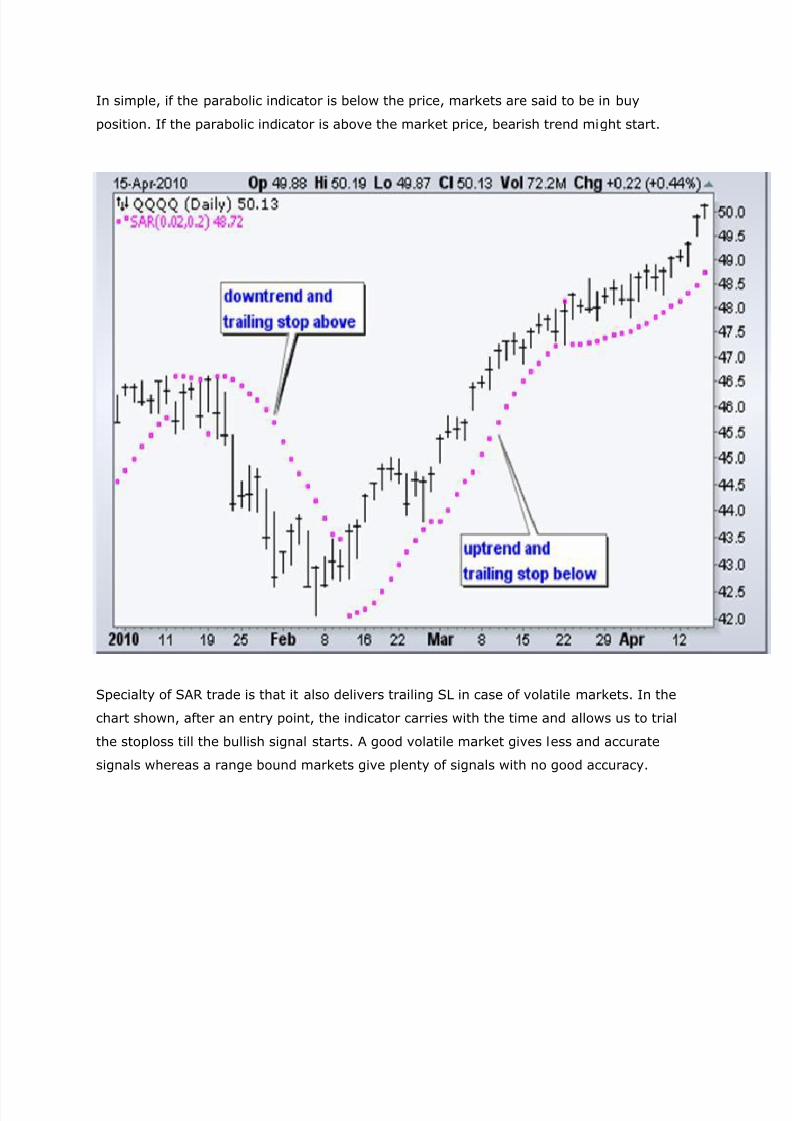
In simple, if the parabolic indicator is below the price, markets are said to be in buy
position. If the parabolic indicator is above the market price, bearish trend might start.
Specialty of SAR trade is that it also delivers trailing SL in case of volatile markets. In the
chart shown, after an entry point, the indicator carries with the time and allows us to trial
the stoploss till the bullish signal starts. A good volatile market gives less and accurate
signals whereas a range bound markets give plenty of signals with no good accuracy.

7/31/2019 Trading Techniques, With 2 Questions Answered
http://slidepdf.com/reader/full/trading-techniques-with-2-questions-answered 25/69
Trend Lines
If you believe, I can tell, technical analysis can be done using no indicator, oscillator or
overlay. Yes, I mean just trend lines. This exceptionally works well for positional traders
(short, medium and long terms). Unlike other indicators, these are not pre-arranged option
in any charting software but a tool is dedicated only for drawing trend lines. Support –
Resistance lines too come under this category which will be discussed in our next chapters.
A trend line is a straight line touching 2 or more points to define a trend likely to follow in
future.
Points to remember while drawing a trend line
The more points a trend line connects, the more respect market shows towards the trend.
Points connecting the trend line should have good enough distance. Points of less distance
may not be effective as they are not the real trend exposing points.

7/31/2019 Trading Techniques, With 2 Questions Answered
http://slidepdf.com/reader/full/trading-techniques-with-2-questions-answered 26/69
Though trend lines can be used in many ways, basically trend line can be classified in 2
ways. It serves as a support line when markets are rising and a resistance line when
markets are bearish. Former line named as Uptrend line and later as Downtrend line.
Uptrend Line
An uptrend line is a straight line connecting the lows in a bullish market. This is also known
as positive slope. It acts as a support line during a bull market. Its obvious to see the lows
connecting the trend line exceeds the previous low. If the lows connecting the line are
more, the trend is said to be a strong one. As long as the line keeps going with the pricesabove that, bulls may drive the trend. The moment prices misbehave with the slope, trend
may take a reversal.

7/31/2019 Trading Techniques, With 2 Questions Answered
http://slidepdf.com/reader/full/trading-techniques-with-2-questions-answered 27/69
Downtrend Line
This is a straight line as well heading downside connecting the highs especially in a bear
phase. This can also be called as negative slope. This line kisses the highs of every low
(lower highs) and serves as a resistance line. One can go with a bearish view till the prices
are below the trend line (Resistance line). Once if the prices break the above said line, it
may result in a trend reversal.

7/31/2019 Trading Techniques, With 2 Questions Answered
http://slidepdf.com/reader/full/trading-techniques-with-2-questions-answered 28/69
Average Directional Movement Index (DMI - ADX)
Let's put some questions before proceeding into the topic.
What is DMI (Directional Movement Index)?
What is ADX (Average Directional Index)?
What is the difference between DMI and ADX?
Many traders may have a wrong assumption that both DMI and ADX are same. Not exactly,
but ADX is used in coordination and conjunction with other indicators (DI) to complete DMI.
Directional Movement Index (DMI) is an indicator consists of Positive Directional Indicator
(+DI), Negative Directional Indicator (-DI) and Average Directional Index (ADX). ADX
oscillator is derived from +DI and –DI.
7/31/2019 Trading Techniques, With 2 Questions Answered
http://slidepdf.com/reader/full/trading-techniques-with-2-questions-answered 29/69
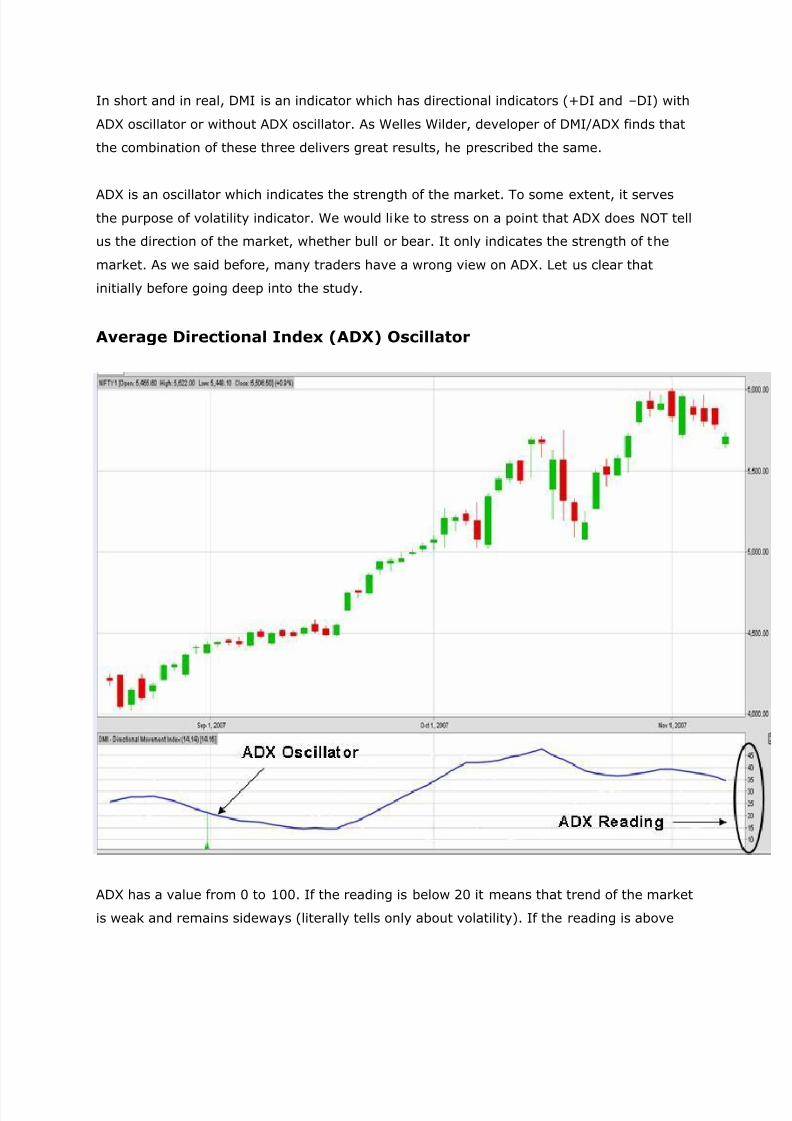
In short and in real, DMI is an indicator which has directional indicators (+DI and –DI) with
ADX oscillator or without ADX oscillator. As Welles Wilder, developer of DMI/ADX finds that
the combination of these three delivers great results, he prescribed the same.
ADX is an oscillator which indicates the strength of the market. To some extent, it serves
the purpose of volatility indicator. We would like to stress on a point that ADX does NOT tell
us the direction of the market, whether bull or bear. It only indicates the strength of the
market. As we said before, many traders have a wrong view on ADX. Let us clear that
initially before going deep into the study.
Average Directional Index (ADX) Oscillator
ADX has a value from 0 to 100. If the reading is below 20 it means that trend of the market
is weak and remains sideways (literally tells only about volatility). If the reading is above

7/31/2019 Trading Techniques, With 2 Questions Answered
http://slidepdf.com/reader/full/trading-techniques-with-2-questions-answered 30/69
40, a strong trend is the indication. In detail, if the line move from below 20 towards 40,
markets are likely to enter into a trending zone. If it moves from 40 to 20, the volatility may
end and market tries to consolidate.
Note that if the oscillator is around 20, it doesn’t mean that the markets are bearish and if
the indicator is around 80, it is not a bullish market. It only delivers the strength of the
trend. For instance, a strong falling market may also give a reading of 60+ as the trend is
very strong. As well, a strong bull market may also give the same reading of 60+. So, it
doesn’t really matter whether the market is of bullish or bearish. And finally, if the markets
are not in a good movement, it would give a reading around 20 or 30.
Directional Indicators (DI)

7/31/2019 Trading Techniques, With 2 Questions Answered
http://slidepdf.com/reader/full/trading-techniques-with-2-questions-answered 31/69
As said above, there are two DIs – Positive and Negative. +DI measures the force of up
moves whereas –DI measures the force of down moves. The crossovers of +DI and –DI
gives us the buy and sell signals. If +DI is over (crosses) –DI, a buy signal is formed and if
–DI is over (crosses) +DI, it is said be a sell signal. General setting of this would be 14
periods. These signals are used when ADX readings are good enough above 40 which
indicate that the DMI signals are true and trend is strong. Oscillators are recommended to
use in conjunction with other indicators, not relying on just one oscillator.
Average True Range (ATR)
Before explaining about ATR, we have to discuss a bit on Volatility as the whole concept of
ATR depends on market volatility.
What is volatility?
Technically, if the difference of High and low is large, the volatility is more which means that
the market movement is large IRRESPECITVE OF DIRECTION in the given period of time.
So, whether it’s a bull, bear market, if the range of the current period in respect with the
previous period is large, it is said to have a good volatility (Shown in the chart below). To
say in general, if the zigzag movement is more, volatility is more and if the whipsaws are
less, that seems to be a less volatile market.

7/31/2019 Trading Techniques, With 2 Questions Answered
http://slidepdf.com/reader/full/trading-techniques-with-2-questions-answered 32/69
It’s pretty clear in the above chart that the markets are falling and ATR rising in the first
half and in the second half, when markets are recovering from its low, ATR showing
weakness in the trend.
ATR is an indicator which uses absolute true ranges for calculating the volatility. It is
therefore one of the famous volatility indicators. Though we are not concerned about the
calculation part of the ATR as of now, we should know that its impossible to get the ATR
value for the first day as ATR calculation takes the previous day’s close into consideration.
This is the reason; we can get ATR value only from the second day of the given period.
Certain drawbacks are said to be involved in ATR as they are non-comparable. The reason
being, the stock with high price may have high ATR and a stock with low price would have
low ATR. Also, it doesn’t show any interest in finding the direction of the moves.

7/31/2019 Trading Techniques, With 2 Questions Answered
http://slidepdf.com/reader/full/trading-techniques-with-2-questions-answered 33/69
Chaikin Oscillator:
To know about chaikin oscillator, first we need to learn about Accumulation/Distribution line
which was also developed by chaikin.
Before that, let’s put a question ourselves. For instance, if you want to invest in a particular
stock, which of the following cases would you prefer?
A. Stock rising gradually with reasonable volume for a certain period of time
B. Stock rising phenomenally with very less volume.
It’s obvious that we pick ‘A’ though the rise is comparatively less just because the volumes
are good in the former case. Even institutional buying follows the same. This tells us that
volumes play a vital role while picking up a stock.
This is where chaikin acted smart while all other dealt with price and time. He included
volume in calculating Accumulation/Distribution line. Unlike other oscillators, chaikin’s line
methodology takes price opening, closing and volume into consideration. First it calculates
the Close Location Value (CLV) based on closing prices and multiplies that with volume to
form an Accumulation/Divergence line.
CLV is calculated in the following manner:
If the stock price closes at the top of the candle, CLV is +1.
If it closed above the half of the candle and below the period high, it is given a value from 0
to 1
If the stock price closes exactly at half of the candle, it is rated as 0
If the stock value closes anywhere in between halfway and above the candle low, then it is
calculated from 0 to -1
Lastly, if the closing price is at the bottom, the value is -1.
The values obtained from the above method are now multiplied with volumes to get
Acc/Dist Line. Based on this, chaikin Oscillator is developed.

7/31/2019 Trading Techniques, With 2 Questions Answered
http://slidepdf.com/reader/full/trading-techniques-with-2-questions-answered 34/69
Just similar to MACD (discussing in the next chapters) which takes the difference between
the moving averages of the prices, chaikins Oscillator too takes the difference of moving
averages but of Acc/Dist line. Finally an oscillator with volume as an ingredient was done.
Even if any intermediate rise occurs in the strong falling trend, this oscillator ignores that if
the volume is less (which generally happens) and tends to show the down trend. So, traders
who uses chaikin’s oscillator may not take volumes into consideration again as it is already
included. This indicator has a zero line above which the trend is considered as positive and
below which markets may experience bearish shower. Importantly, unlike other oscillators,
the reading is also not constant and it differs with the volume and price.

7/31/2019 Trading Techniques, With 2 Questions Answered
http://slidepdf.com/reader/full/trading-techniques-with-2-questions-answered 35/69
Trade applications:
Crossover of Zero Line
This is one of the most common applications used to trade. If the oscillator
swings above the zero line, it is treated as a bull security and buying can be
seen with good volumes. If the chaikin oscillator is below the zero line, sell
trade can be initiated.

7/31/2019 Trading Techniques, With 2 Questions Answered
http://slidepdf.com/reader/full/trading-techniques-with-2-questions-answered 36/69
Divergence
This application remains same as in the other oscillators. Above chart is the
perfect example. If the markets move upside and oscillator shows a
downward movement, a bearish divergence is said to occur and the stock is
expected to fall from thereon. If the stock price fall and chaikin indicator
moves up, we call that as a bullish divergence with a hope of security to
move upside.

7/31/2019 Trading Techniques, With 2 Questions Answered
http://slidepdf.com/reader/full/trading-techniques-with-2-questions-answered 37/69
Moving Average Convergence Divergence (MACD)
MACD was developed by Gerald Appel. If you remember our Moving Average chapter, we
have discussed double crossovers where one average crosses the other to give a buy/sell
signal. MACD exactly deals with the same but in a different overlay using a histogram.
MACD is developed using a simple calculation. The difference of lower EMA and higher EMA
is plotted as MACD.
Three strategies can be followed while using MACD.

7/31/2019 Trading Techniques, With 2 Questions Answered
http://slidepdf.com/reader/full/trading-techniques-with-2-questions-answered 38/69
Centerline Crossover
MACD oscillator consists of a center line with a value 0, positive values (0.5, 1) above and
negative values (-0.5,-1) below. When MACD is above zero/centre line, bullish trend is said
to be arrived and when the MACD is below the zero line, it is treated as a downward trend.

7/31/2019 Trading Techniques, With 2 Questions Answered
http://slidepdf.com/reader/full/trading-techniques-with-2-questions-answered 39/69
Signal Line crossover
In addition to MACD, a signal line is introduced in to the oscillator to predict the bull/bear
phases. In general, this signal line will be of 9 periods EMA. Leaving histogram and center
line, when MACD cuts and moves below the signal line, it’s a bearish crossover. When the
signal line cuts and moves below MACD, we call it a bullish crossover.

7/31/2019 Trading Techniques, With 2 Questions Answered
http://slidepdf.com/reader/full/trading-techniques-with-2-questions-answered 40/69
Divergence
Divergence is another effective strategy used in MACD method. Divergence is further
divided into bullish divergence and bearish divergence. As shown in the figure, if the stock
price makes lower low and MACD makes higher low, we call that as Bullish Divergence
which indicates that markets may take reverse turn and start to move upside. Keep in mind,
while taking stock prices, closing prices should be taken into consideration.
As well, if stock price makes higher high and MACD indicator makes lower high, it is known
as Bearish Divergence indicating markets may move down. A sell signal can be taken at this
point of time when breakout or signal crossover occurs.

7/31/2019 Trading Techniques, With 2 Questions Answered
http://slidepdf.com/reader/full/trading-techniques-with-2-questions-answered 41/69
Relative Strength Index
RSI is no way a different one when compared with other oscillators in look and feel except
in its application and calculation. Average loss and average gain are taken into consideration
for calculation of RSI. General setting of RSI is 14 periods. If RSI moves below 30, it is
treated as bearish trend and if it is above 70, it is considered as bullish phase.
Like MACD, RSI too explains 3 strategies to predict the trend of the future market.

7/31/2019 Trading Techniques, With 2 Questions Answered
http://slidepdf.com/reader/full/trading-techniques-with-2-questions-answered 42/69
Trend Identification
If RSI is in 50-70 region, one can assume that as a bullish trend and if RSI roams around
30-50 region, probably it can be said as a bearish trend.
If RSI dances at the overbought zone touching 70 several times without coming to its lower
region, the bullish trend is said to be formed whereas in bearish phase, RSI touches 30
repeatedly without daring to come up.

7/31/2019 Trading Techniques, With 2 Questions Answered
http://slidepdf.com/reader/full/trading-techniques-with-2-questions-answered 43/69
Divergence
Just as explained in our previous article MACD, if the stock closing price makes higher highs
and RSI makes lower highs, a trend reversal may take place and a bearish period may
come. When prices show lower lows and RSI shows higher low, probably markets may look
at bullish side.
Failure Swings
This is the area where RSI stands different with other indicators. Failure swings in the
market can be predicted using RSI where market reversals are said to take place.

7/31/2019 Trading Techniques, With 2 Questions Answered
http://slidepdf.com/reader/full/trading-techniques-with-2-questions-answered 44/69
In divergence, we have taken both stock price as well as RSI direction and predicted the
market movement whereas in failure swings, we take only RSI oscillator and finds the future
movement. Failure swings are classified as Bullish failure swing and Bearish failure swing.
Bullish failure swing takes place in 4 stages. When RSI moves below 30, bounces back a
little, again pulls back to 30 and breaks the previously made high, we call that as bullish
failure swing and markets are estimated to move up strongly. Point to remember, second
low made around 30 should be above the previously made low (higher low should be
formed).

7/31/2019 Trading Techniques, With 2 Questions Answered
http://slidepdf.com/reader/full/trading-techniques-with-2-questions-answered 45/69
As well, if RSI Moves above 70, pulls back, again rises to 70 and finally breaks the
previously made low, a bearish phase is said to be taking place shortly with a trend
reversal. Here, Second high around 70 should be below the previously made high (Lower
high).
Stochastic Oscillator:
Stochastic Oscillator is an oscillator which delivers the signals based on momentum of the
stock. The indicator swings between 0 and 100 which are its extreme boundaries. Like RSI,Stochastic too have observable levels of 20 and 80. Whenever the oscillator reaches 20, it
indicates that the stock is undervalued and reached it oversold zone. This gives raise to a
view that the security may take U-turn and move in the opposite direction (towards 80
levels) from thereon. As well if the stock reaches 80, it may be under overvalued stocks and
have high chances of moving down. This theory works well in consolidated markets.

7/31/2019 Trading Techniques, With 2 Questions Answered
http://slidepdf.com/reader/full/trading-techniques-with-2-questions-answered 46/69
There are 2 types of stochastic oscillators in use. Though the original version developed is
fast stochastic, later when it was smoothened with Simple Moving Average, slow stochastic
became more familiar in predicting the overbought/oversold securities.
Fast stochastic Oscillator
As always, for fast stochastic oscillator too, selection of time periods hold key and the
recommended time frame is 14 periods. Doesn’t matter whether it’s fast or slow stochastic,
both have %K as well %D lines in their oscillators as shown in the above chart. %K is
calculated as per the time frame selected. Once after %K is calculated, certain value of
Simple Moving Average is applied to %K to get %D. It’s obvious that %k moves faster when
compared with %D.

7/31/2019 Trading Techniques, With 2 Questions Answered
http://slidepdf.com/reader/full/trading-techniques-with-2-questions-answered 47/69
Slow stochastic Oscillator
This is a smoothened fast stochastic oscillator. The initial %K value which was derived in
fast stochastic is again smoothened with certain value of simple moving average and %K of
slow stochastic is extracted (exactly same procedure how %D was calculated in fast
stochastic). This is the reason; both %D of fast stochastic and %K of slow stochastic holds
same value provided both are smoothened with same SMA. Now the left parameter to becalculated is %D of slow stochastic oscillator. Once again, SMA is applied to %K of slow
stochastic to get %D
Calculation procedure goes as follows:

7/31/2019 Trading Techniques, With 2 Questions Answered
http://slidepdf.com/reader/full/trading-techniques-with-2-questions-answered 48/69
First, %K of fast stochastic oscillator is calculated
Second, %D of fast stochastic
Third, %K of slow stochastic
Finally, %D of slow stochastic oscillator is derived.
Fast Stochastic Oscillator:
Fast %K = %K basic calculation
Fast %D = 3-period SMA of Fast %K
Slow Stochastic Oscillator:
Slow %K = Fast %K smoothed with 3-period SMA
Slow %D = 3-period SMA of Slow %K
No reason to learn the above calculation as everything is done by software but need to learn
the application part.
Application
Three applications can be used with the help of these stochastic oscillators:
1. Overbought/Oversold
2. Crossover of %k with %D
3. Divergence

7/31/2019 Trading Techniques, With 2 Questions Answered
http://slidepdf.com/reader/full/trading-techniques-with-2-questions-answered 49/69
Overbought/Oversold
As discussed above, if %K (No need of second swing line, %D) of a particular security
reaches 20, it is assumed that the stock is oversold and enters into bull phase again. If %K
touches 80 or nearby, the stock is said to be at overbought zone and selling volumes may
start increasing. If the oscillator is in between 20 and 80 without touching either, it seems
to be that the stock is in the sideways.

7/31/2019 Trading Techniques, With 2 Questions Answered
http://slidepdf.com/reader/full/trading-techniques-with-2-questions-answered 50/69
Crossovers:
In this type of application, both %K and %D comes into the picture. If %K cuts %D in the
downward direction, it is said that the security may fall and if %K cuts %D in the upward
direction with good volumes, then the stock may enter into the bull zone.
Note: Combination of both first and second applications may give better results in most of
the cases.

7/31/2019 Trading Techniques, With 2 Questions Answered
http://slidepdf.com/reader/full/trading-techniques-with-2-questions-answered 51/69
Divergence
Divergence remains same as we have discussed in our previous articles. When the stock
price is making higher highs (New highs) and the oscillator in the stochastic indicator is
makes Lower highs, it gives a sign that the security is interested to move in the upper
direction pointing the future trend downwards which generates a sell signal.

7/31/2019 Trading Techniques, With 2 Questions Answered
http://slidepdf.com/reader/full/trading-techniques-with-2-questions-answered 52/69
When the security closing price is making lower lows and the swing oscillator makes higher
lows, it throws a warning signal that the stock is not tending to move downside more and at
this point, the stock may start moving upward generating a buy signal.
Ultimate Oscillator
This is not different with others except that it combines three time frames during its
oscillation. Like other, this too has a range from 0 to 100 in its values with 50 as centre line.
When oscillator is below 30, stock is said to be in oversold and when indicator is above 70,
overbought phase is said to occur.

7/31/2019 Trading Techniques, With 2 Questions Answered
http://slidepdf.com/reader/full/trading-techniques-with-2-questions-answered 53/69
This oscillator can be used with intraday, short, mid or long term as its mixture of three
different time frames. Only thing to remember is that, it is not that the security starts
moving up if it reaches oversold in this indicator. It is only confirmed when the oscillator
starts moving up again, particularly above 50 region. As well, selling to be done once the
oscillator line comes below 50.

7/31/2019 Trading Techniques, With 2 Questions Answered
http://slidepdf.com/reader/full/trading-techniques-with-2-questions-answered 54/69
Applications of ultimate Oscillator
Divergence
Even this application doesn’t really differ with others. When the stock makes new high and
oscillator descending in its way, it’s a sign for coming downfall. Here, sell the scrip only
below 50.

7/31/2019 Trading Techniques, With 2 Questions Answered
http://slidepdf.com/reader/full/trading-techniques-with-2-questions-answered 55/69
If the scrip closing prices fall by making new low without its corresponding indicator line
making the same low, then it’s said that, stock may look at reversal trend. Buy the stock
once it crosses the center line, 50.
Williams%R is same as other indicators once again except in its reading. Unlike other
normal readings, it has typical negative readings on its scale. The indicator oscillates from 0
to -100. Same as stochastics, even Williams%R too has an overbought as well oversold
regions for getting the stock movement at any point of time.

7/31/2019 Trading Techniques, With 2 Questions Answered
http://slidepdf.com/reader/full/trading-techniques-with-2-questions-answered 56/69
The recommended time period for this oscillator is 14 periods. It also had a centre/mid line
containing a value -50 with it. Indicator line remaining above -50 for certain period of time
indicates that markets are in bullish mood and the consistent closing periods below -50
indicates that the security is in the bearish phase.
Application
Just like Stochastic and RSI, if the stock reaches -20 i.e. top of the indicator, it gives us an
indication that the stock may fall with a view of overvalue. But touching the top of the
indicator does not necessarily mean that. To confirm the trend reversal, let the line comes
back and cut the -20 to travel towards -80.

7/31/2019 Trading Techniques, With 2 Questions Answered
http://slidepdf.com/reader/full/trading-techniques-with-2-questions-answered 57/69
If the stock moves to -80 it might take a pull back to the top of the oscillator again. Once
again, not necessarily very soon it touches -80. Wait till it bounces back above -80 before
taking up a bull trade.
Support
Support price of a security is the price which holds the stock from declining further.

7/31/2019 Trading Techniques, With 2 Questions Answered
http://slidepdf.com/reader/full/trading-techniques-with-2-questions-answered 58/69
It is assumed that the stock fails to go below the support level. Also, it is said that buyers
will come into picture when the price is at its support level and a considerable amount of
buy volume is estimated to come in the stock. If the support level breaks, the security may
go further down looking at its next support level.
Resistance
Resistance of a stock is nothing but just contrary to support level. It holds the stock from
rising further

7/31/2019 Trading Techniques, With 2 Questions Answered
http://slidepdf.com/reader/full/trading-techniques-with-2-questions-answered 59/69
Sellers may enter in to the stock once it reaches the resistance level. Once if the stock goes
beyond the resistance price, it is said that the stock may look for its next resistance.
Support price is generally at lower side of the stock’s current price and resistance at upper
side. Once the stock cuts the support level, the same is turned into resistance level with a
new support at its lower side.
Let’s try to understand more in a layman’s style. For instance, support and resistance are
like two walls for a bird trying to fly high – one at lower side (support) and the other at its
upper sider (resistance). As the bird misses its balance, it feels like support level not to get
break, the reason being very simple that it may fall more down once if the support breaks.
As well, once if it starts flying high, it wants the upper wall (resistance) to get break so that

7/31/2019 Trading Techniques, With 2 Questions Answered
http://slidepdf.com/reader/full/trading-techniques-with-2-questions-answered 60/69
it can fly high. This instance tells us, a trader who takes a long/buy trade does not want the
support level to break but only waits for the resistance price to break.
Fibonacci Retracement
Fibonacci retracement is a special theory which carries many controversies with it. It is said
that a Vedic formula too involved in Fibonacci retracement which has relation with the whole
universe in one or the other way. Above all this, it’s a very successful theory in high volatile
markets.
7/31/2019 Trading Techniques, With 2 Questions Answered
http://slidepdf.com/reader/full/trading-techniques-with-2-questions-answered 61/69
Some ratios are defined in Fibonacci retracement where after a drastic rise of markets,
stocks may correct partly, take support at these ratios and again continue its upward trend.
In case of drastic fall, stocks may rise – take resistance and continue its travel towards bear
side. Widely used retracements are 38.2%, 50% and 61.8%. Also 23.6% and 76.4% are
used rarely by some analysts and traders.
Note: Special tool (Fibonacci tool) is provided with charting software with predefined levels
0%, 23.6%, 38.2%, 50%, 61.8%, 76.4% and 100% as shown in the above chart.
There are 2 major applications of Fibonacci retracement where the 2nd one stands tall in its
race.
1. Trend reversal
2. Trend continual
Trend Reversal
As said above, after a drastic fall, it is expected that the stock may take a short reversal till
38.2%, 50% or 61.8% Therefore, in case of trend reversals, these levels are taken into
consideration to find how long the reversal is going to last (Below chart). Same with bull
markets too.

7/31/2019 Trading Techniques, With 2 Questions Answered
http://slidepdf.com/reader/full/trading-techniques-with-2-questions-answered 62/69
Trend Continual
This is an extension for the above application. This believes in a concept – Upper markets
always goes upper and lower markets always goes lower. In detail, after the above short
pull back from 38.2% or 50%, the stock continues its original trend to fall further breaking
all its support levels – 50%, 38.2%, 23.6% and 0%, tries to make new low(Ref. above
chart). Short trade can be taken up at every support break. Especially when the stock cuts
its final support level 0%, high chances for the stock to fall much more.
In case of long bull market, market takes a short pull back till 38.2%, 50% or 61.8% as
discussed in our first application, again starts flying cutting all its resistances including 0%
to make a new high.
Note that these 2 applications are best suitable when the stock declines or advances
heavily.

7/31/2019 Trading Techniques, With 2 Questions Answered
http://slidepdf.com/reader/full/trading-techniques-with-2-questions-answered 63/69
Gaps
Gaps are price differences between present periods opening and previous periods closing.
Certain gap is said to be formed based on its volatility and strength in the volume. As per
the gap theory, gaps formed in any kind of markets, irrespective of time period has to be
filled.

7/31/2019 Trading Techniques, With 2 Questions Answered
http://slidepdf.com/reader/full/trading-techniques-with-2-questions-answered 64/69
Gap Types:
1. Common
2. Runaway
3. Exhaustion
4. Breakaway
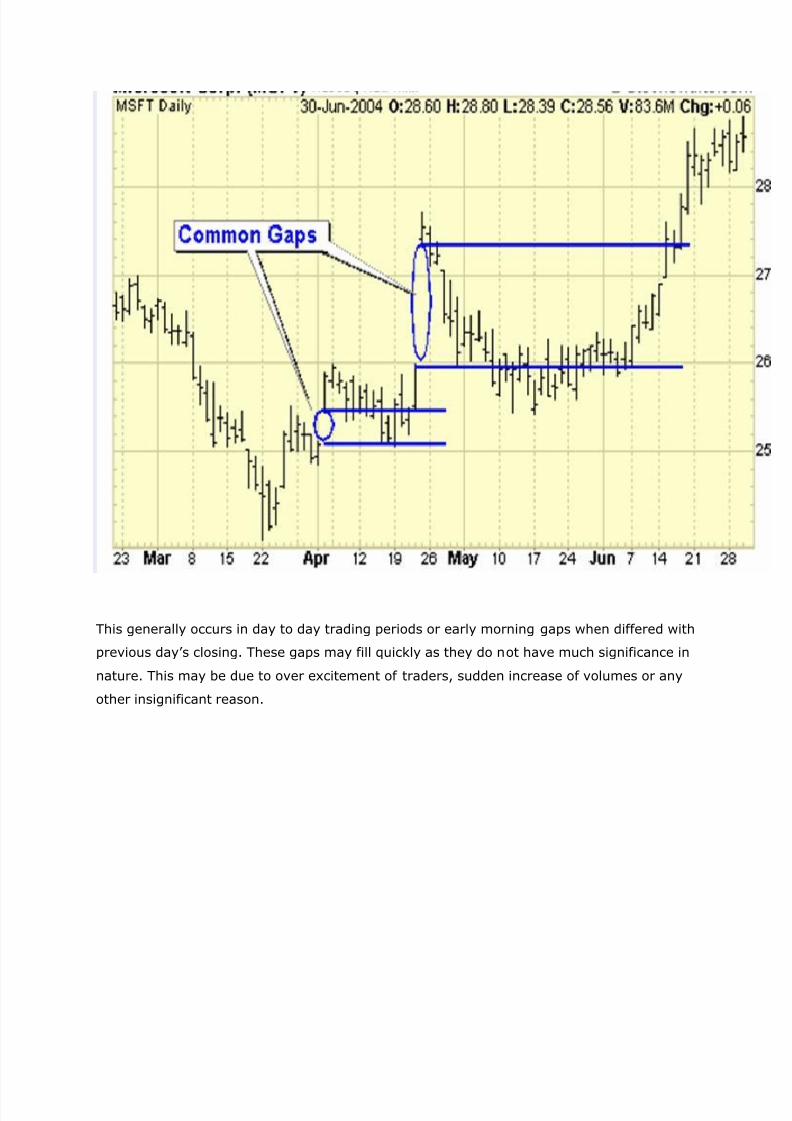
5. Common gaps (Trading gaps)
7/31/2019 Trading Techniques, With 2 Questions Answered
http://slidepdf.com/reader/full/trading-techniques-with-2-questions-answered 65/69
This generally occurs in day to day trading periods or early morning gaps when differed with
previous day’s closing. These gaps may fill quickly as they do not have much significance in
nature. This may be due to over excitement of traders, sudden increase of volumes or any
other insignificant reason.

7/31/2019 Trading Techniques, With 2 Questions Answered
http://slidepdf.com/reader/full/trading-techniques-with-2-questions-answered 66/69
Runaway gaps (Towards the trend)
When markets are taking a good trend, one can find a sudden gap in the price candles due
to sudden entry volumes which has taken effect because of good trend. Also, traders who
wait for a good correction may not find that on the charts and as a result, sudden buying
may enter into the stock. As this is a gap towards the trend, the trend may continue to
travel failing to fill the gap soon. Generally, this type of gap is not that easy to get filled. It
may take months or even years to get filled.

7/31/2019 Trading Techniques, With 2 Questions Answered
http://slidepdf.com/reader/full/trading-techniques-with-2-questions-answered 67/69
Exhaustion gaps (Trend reversal gaps)
This occurs almost at the end of a bear or bull phase. The gap that forms in this area will be
filled very soon as the trend changes immediately after the phenomenon formation. If a gap
is filled at the top after a long bull market by taking a trend reversal, once may expect bear
market ahead as investors tend to sell their stock. If this happens at the bottom after a bear
market, a bull market is said to be started.

7/31/2019 Trading Techniques, With 2 Questions Answered
http://slidepdf.com/reader/full/trading-techniques-with-2-questions-answered 68/69
Breakaway gaps (Consolidated market gaps)
When a gap forms after a consolidated markets or congestion area, it is said to be a
breakaway gap. After many weeks or months of trade, the stock starts breaking in the
either way giving rise to a trend. Investors who waits for a much longer time, puts sudden

7/31/2019 Trading Techniques, With 2 Questions Answered
http://slidepdf.com/reader/full/trading-techniques-with-2-questions-answered 69/69
volume into the stock resulting in the gap formation. As the trend starts newly, the gap may
or may not get filled immediately. It might also take months to get filled depending on the
strength of the trend.