trademark identification and expansion- …12)2016-jabs-267-285.pdf · trademark identification and...
TRANSCRIPT
© 2016 Asian Economic and Social Society. All rights reserved ISSN (P): 2309-8295, ISSN (E): 2225-4226 Volume 6, Issue 12, 2016, pp. 267-285
267
TRADEMARK IDENTIFICATION AND EXPANSION- USING VISUAL
INFORMATION MAP TO SUPPORT TREND ANALYSIS
Rain Chen
Department of Visual Communication Design, Southern Taiwan University of Science and
Technology, Taiwan, R.O.C.
Jo-Han Chang
Department of Industrial Design, National Taipei University of Technology, Taiwan, R.O.C.
Hung-Yuan Chen
Department of Visual Communication Design, Southern Taiwan University of Science and
Technology, Taiwan, R.O.C.
Article History:
Received: 17-Jul-2017
Revised received: 12-Aug-
2017
Accepted: 23-Aug-2017
Online available: 06-Sep-
2017
Keywords: Global brand,
Word marks,
Trends,
Positioning,
Competitive stress
Abstract
Comprehending global brand identification and expansion is
critical because trademarks are one major approach employed by
top hundred companies worldwide for staying competitive. This
study examined 173 word marks of the top hundred global
trademarks, and 60 ordinary consumers participated in this
trademark identification experiment. Multidimensional scaling
(MDS) was used to assess study participants’ level of similarity
of word marks from eight major industries. The present study
also built a trademark map to facilitate companies’ trademark-
related decision-making. Company managers can use this
trademark map approach to assess the identificationy of their
trademarks in the industry. Trademark analysis too is useful for
exploring trademark expansion, which suppresses the
competitors. The results here show that the top hundred global
trademarks had a very good identifiability among consumers. In
the future, companies can use this analysis method to build their
own trademark maps for evaluating the identification and
expansion of their trademarks in the industry.
1. INTRODUCTION1
Trademark infringement litigation has always played a crucial role in trademark competition.
Trademarks are usually reviewed by the trademark authority of each country for approval, but in
trademark infringement litigation, the scope of coverage of the plaintiff’s trademark will still catch
great attention because it is a key factor for judging whether the defendant has infringed the
plaintiff’s trademark or not. Therefore, how to determine the level of similarity of trademarks
objectively is critical not only for the two parties, as well as their lawyers, in trademark infringement
litigation but also the judge, who needs to identify and evaluate concrete evidence of trademark
Corresponding author's
Name: Rain Chen
Email address: [email protected]
Journal of Asian Business Strategy
http://www.aessweb.com/journals/5006 DOI: 10.18488/journal.1006/2016.6.12/1006.12.267.285
Journal of Asian Business Strategy, 6(12)2016: 267-285
268
infringement. As for trademark designers, it is risky if they are unaware of infringing the intellectual
property of others. Even if designers intentionally stay away from the trademark design or trademark
right of others, they still need to know how to design around safely while maximizing trademark
benefits. That’s why the above issues should be handled carefully.
Trademarks were designed by companies to represent their goods and services (Palumbo and Herbig,
2000). A trademark not only differentiates one’s goods and services from those of others in the
market but also protects the goods and services by law (Yu and Yi, 2011). The World Intellectual
Property Organization (WIPO) gave trademarks a general definition: A trademark is a sign capable of
distinguishing the goods or services of one enterprise from those of other enterprises. Trademarks are
protected by intellectual property rights (WIPO, 2016).
A trademark should allow consumers to identify easily the goods or services labeled with the
trademark. This feature of trademarks is called “identifiability” or “distinctiveness”, and it is an
essential component for the application of trademark registration (TAPTO, 2016).
Trademark similarity refers to partial similarities, either visually or conceptually, between word
marks or figurative marks, and trademark similarity could prevent consumers from differentiating
goods or services of a similar kind. The purpose of using trademarks is to help consumers identify the
source of goods and services, and there are three main types of trademark infringement: similar
pronunciation, similar appearance, and similar concepts (Zeng and Cai, 2007).
There are studies analyzed the evaluation models of brand identification in product design (Herm and
Moeller, 2014). Because patents and trademarks share some similar properties, some studies
proposed pattern identification in patents (Venugopalan and Rai, 2015). Researchers pointed out that
when judging whether two trademarks are similar or not, such judgment should be made based on
objective facts and by consumers with an average level of knowledge and experience. The
researchers when conducting experiments should observe if two goods or services are mistaken as
from the same source with a common level of attention. Moreover, trademark identification should be
performed based on (1) overall observation, (2) isolated observation at different time and different
place, and (3) overall impression of similarity (Wang, 2008).
Trademark confusion and misidentification refers to the condition where consumers misidentify the
source of goods or services because of highly similar trademarks. According to the guidelines on
“possible confusion and misidentification” issued by the Ministry of Economic Affairs, there are
eight factors that should be considered: (1) Level of distinctiveness of trademark(s); (2) Whether two
trademarks are similar and the extent of the extent of their similarity; (3) Whether the goods or
services are similar and the extent of their similarity; (4) Status of diversified operation of a prior
right holder; (5) Circumstances of actual confusion; (6) The extent to which relevant consumers are
familiar with the trademarks concerned; (7) Whether the application to register a trademark at issue is
filed in good faith; and (8) Other factors that cause confusion (TIPO, 2004).
Chen et al. used MDS to build a visual map Studies for examining design patent expansion (Chen and
Chang, 2015). There are also many patent expansion studies focusing on patent search technology
(Sharma et al., 2015; Mahdabi and Crestani, 2014; Al-Shboul and Myaeng, 2014). Chen et al.
examined the distance relationship among brands by analyzing data of the top hundred global brands
of a specific year (Chen and Liang, 2013). Cheng et al. used Google as an example to study factors
causing word mark confusion (Chen and Cheng, 2013).
The present study used trademark maps to review industry mapping and competitive stress of the top
hundred global trademarks. The aim of the present study is to replace the old trademark infringement
reviewing approach by exploring the development of internationally well-known trademarks of a
sector over the past decade (2006-2015) using trademark maps. Because trademark innovation is the
Journal of Asian Business Strategy, 6(12)2016: 267-285
269
major competitive approach employed by companies, it is urgent to understand the identification and
expansion of global brand names.
2. METHOD
2.1. Subjects
This study recruited 60 ordinary consumers because the key trademark observers are ordinary
consumers. Among them, 35% were males (N=21); 65% females (N=39). The average age of the
participants was 37 years old. A Likert scale (Chernyak et al., 2016) with a range from 1 (very
unfamiliar) to 5 (very familiar) was used to assess the participants’ level of familiarity with
trademarks from the eight major industries. The average score of familiarity with trademarks from the
eight major industries was 3.14, suggesting that the study participants had an above medium level of
familiarity.
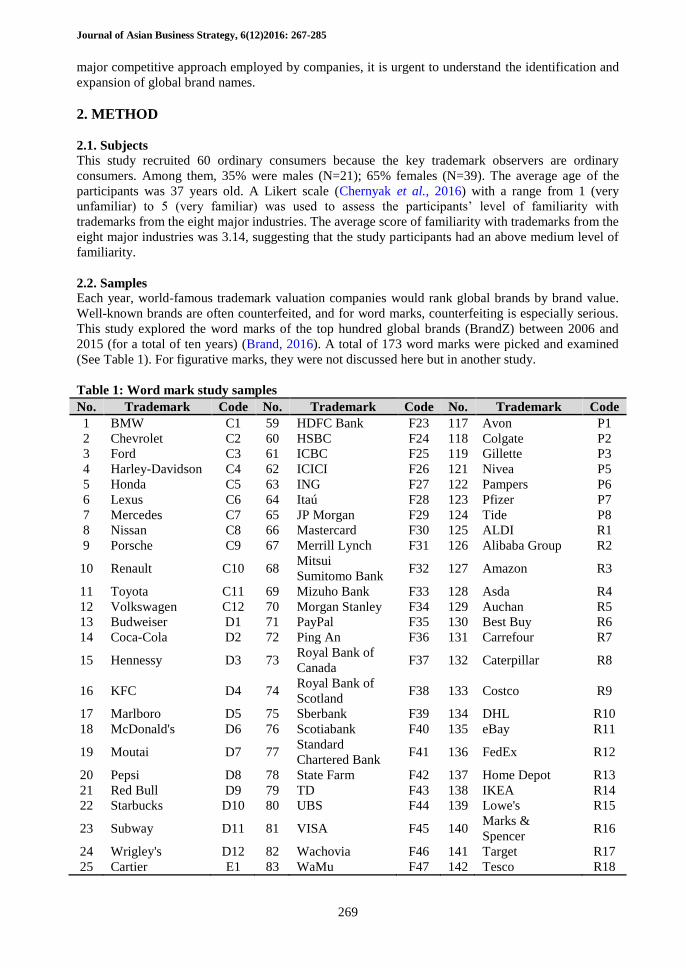
2.2. Samples
Each year, world-famous trademark valuation companies would rank global brands by brand value.
Well-known brands are often counterfeited, and for word marks, counterfeiting is especially serious.
This study explored the word marks of the top hundred global brands (BrandZ) between 2006 and
2015 (for a total of ten years) (Brand, 2016). A total of 173 word marks were picked and examined
(See Table 1). For figurative marks, they were not discussed here but in another study.
Table 1: Word mark study samples
No. Trademark Code No. Trademark Code No. Trademark Code
1 BMW C1 59 HDFC Bank F23 117 Avon P1
2 Chevrolet C2 60 HSBC F24 118 Colgate P2
3 Ford C3 61 ICBC F25 119 Gillette P3
4 Harley-Davidson C4 62 ICICI F26 121 Nivea P5
5 Honda C5 63 ING F27 122 Pampers P6
6 Lexus C6 64 Itaú F28 123 Pfizer P7
7 Mercedes C7 65 JP Morgan F29 124 Tide P8
8 Nissan C8 66 Mastercard F30 125 ALDI R1
9 Porsche C9 67 Merrill Lynch F31 126 Alibaba Group R2
10 Renault C10 68 Mitsui
Sumitomo Bank F32 127 Amazon R3
11 Toyota C11 69 Mizuho Bank F33 128 Asda R4
12 Volkswagen C12 70 Morgan Stanley F34 129 Auchan R5
13 Budweiser D1 71 PayPal F35 130 Best Buy R6
14 Coca-Cola D2 72 Ping An F36 131 Carrefour R7
15 Hennessy D3 73 Royal Bank of
Canada F37 132 Caterpillar R8
16 KFC D4 74 Royal Bank of
Scotland F38 133 Costco R9
17 Marlboro D5 75 Sberbank F39 134 DHL R10
18 McDonald's D6 76 Scotiabank F40 135 eBay R11
19 Moutai D7 77 Standard
Chartered Bank F41 136 FedEx R12
20 Pepsi D8 78 State Farm F42 137 Home Depot R13
21 Red Bull D9 79 TD F43 138 IKEA R14
22 Starbucks D10 80 UBS F44 139 Lowe's R15
23 Subway D11 81 VISA F45 140 Marks &
Spencer R16
24 Wrigley's D12 82 Wachovia F46 141 Target R17
25 Cartier E1 83 WaMu F47 142 Tesco R18
Journal of Asian Business Strategy, 6(12)2016: 267-285
270
26 Chanel E2 84 Washington
Mutual F48 143 UPS R19
27 Disney E3 85 Wells Fargo F49 144 Wal-Mart R20
28 Esprit E4 86 Westpac F50 145 Woolworths R21
29 Gucci E5 87 Telecom Italia O1 146 Accenture T1
30 H&M E6 88 Airtel O2 147 Apple T2
31 Hermes E7 89 AT&T O3 148 Baidu T3
32 Louis Vuitton E8 90 Beeline O4 149 BlackBerry T4
33 Nike E9 91 BP O5 150 Canon T5
34 Prada E10 92 BT O6 151 Cisco T6
35 Rolex E11 93 Chevron O7 152 Dell T7
36 Zara E12 94 China Mobile O8 153 Electronic Arts T8
37 US Bank F1 95 China Telecom O9 154 Facebook T9
38 ABN AMRO F2 96 Cingular
Wireless O10 155
GE (General
Electric) T10
39 Agricultural
Bank of China F3 97 ExxonMobil O11 156 Google T11
40 AIG F4 98 Movistar O12 157 HP T12
41 Allstate F5 99 MTN O13 158 Huawei T13
42 American
Express F6 100 MTS O14 159 IBM T14
43 ANZ F7 101 NTT DoCoMo O15 160 Intel T15
44 AXA F8 102 O2 O16 161 LinkedIn T16
45 Banco Santander F9 103 Orange O17 162 Microsoft T17
46 Bank of America F10 104 Petrobras O18 163 Motorola T18
47 Bank of China F11 105 PetroChina O19 164 Nintendo T19
48 Barclays F12 106 Shell O20 165 Nokia T20
49 BBVA F13 107 Sinopec O21 166 Oracle T21
50 Bradesco F14 108 SoftBank O22 167 Samsung T22
51 Chase F15 109 Telcel O23 168 SAP T23
52
China
Construction
Bank
F16 110 Telefónica
Movistar O24 169 Siemens T24
53 China Life F17 111 Telstra O25 170 Sony T25
54 China Merchants
Bank F18 112 TIM O26 171 Tencent/QQ T26
55 Citi F19 113 T-Mobile O27 172 Twitter T27
56
Commonwealth
Bank of
Australia
F20 114 verizon O28 173 Yahoo! T28
57 Deutsche Bank F21 115 Verizon Wireless O29
58 Goldman Sachs F22 116 Vodafone O30
2.3. Tools
For experiment planning, his study followed the three general trademark-judging principles: (1)
general cautions, (2) overall observation, and (3) isolation comparison. The researchers of this study
first prepared picture cards for the experiment; each card was 8cm x 8cm. Because the target of the
analysis was word marks, Times, a commonly used serif typeface, was used to make the picture
cards. This measure is to prevent special typefaces from distracting the participants’ attention.
2.4. Statistical
There were 173 word mark samples from the top hundred brands worldwide between 2006 and 2015.
Trademark competitors are usually companies in the same industry, and therefore, in the study, the
173 word mark samples were classified into eight groups based their industry. The eight industries
Journal of Asian Business Strategy, 6(12)2016: 267-285
271
were (1) cars, (2) drinks and food, (3) entertainment, apparel, and luxury, (4) financial, (5) oil, gas,
and telecom, (6) personal care and medical, (7) retail and logistics, and (8) technology. Then, the
level of similarity of word marks of each industry was determined. The present study used the MDS
approach and established a trademark map for each of the eight major industries.
3. TRADEMARK DEVELOPMENT TREND
To show the level of trademark competitiveness of each year, the present study plotted a trademark
map for each year from 2006 to 2015, and trademarks were classified by the industry (eight
industries) for the analysis. The researchers further calculated the trademark competitive stress
between 2006 and 2015 of the eight major industries. Trademark competitive stress refers to the
number of trademarks of a specific industry in a specific year, and the more trademarks, the greater
the trademark competitive stress (the maximum stress coefficient is 1 and the minimum is 0). Take
the car industry (coded C) as an example, the industry had twelve trademarks in the global top
hundred between 2006 and 2015, and in 2007, the number of trademarks of the car industry was 11.
Therefore, the trademark competitive pressure of the car industry in 2007 was 11/12=0.92, which
means that the car industry was highly competitive. The present study calculated the average
competitive stress of each year and the average competitive stress of the industry between 2006 and
2015. See Table 2.
Table 2: Trademark competitive stress
Year Industry code C D E F O P R T
Average
trademark
competitive
stress by year
2006
Number of
trademarks 12 8 11 21 10 5 13 20 --
Competitive
stress 1.00 0.67 0.92 0.42 0.33 0.63 0.62 0.71 0.66
2007
Number of
trademarks 11 7 11 25 9 4 14 19 --
Competitive
stress 0.92 0.58 0.92 0.50 0.30 0.50 0.67 0.68 0.63
2008
Number of
trademarks 10 7 10 26 11 5 12 19 --
Competitive
stress 0.83 0.58 0.83 0.52 0.37 0.63 0.57 0.68 0.63
2009
Number of
trademarks 6 10 8 24 13 7 14 18 --
Competitive
stress 0.50 0.83 0.67 0.48 0.43 0.88 0.67 0.64 0.64
2010
Number of
trademarks 6 9 7 25 18 5 11 19 --
Competitive
stress 0.50 0.75 0.58 0.50 0.60 0.63 0.52 0.68 0.60
2011
Number of
trademarks 6 8 6 27 19 4 10 20 --
Competitive
stress 0.50 0.67 0.50 0.54 0.63 0.50 0.48 0.71 0.57
2012
Number of
trademarks 6 10 6 23 22 4 12 17 --
Competitive
stress 0.50 0.83 0.50 0.46 0.73 0.50 0.57 0.61 0.59
Journal of Asian Business Strategy, 6(12)2016: 267-285
272
2013
Number of
trademarks 6 10 8 25 18 4 12 17 --
Competitive
stress 0.50 0.83 0.67 0.50 0.60 0.50 0.57 0.61 0.60
2014
Number of
trademarks 6 9 8 27 16 4 11 19 --
Competitive
stress 0.50 0.75 0.67 0.54 0.53 0.50 0.52 0.68 0.59
2015
Number of
trademarks 6 9 7 26 17 4 12 19 --
Competitive
stress 0.50 0.75 0.58 0.52 0.57 0.50 0.57 0.68 0.58
2006-
2015
Industry Total 12 12 12 50 30 8 21 28 Sum: 173
Industry
average
trademark
competitive
stress
0.63 0.73 0.68 0.50 0.51 0.58 0.58 0.67 Ave: 0.61
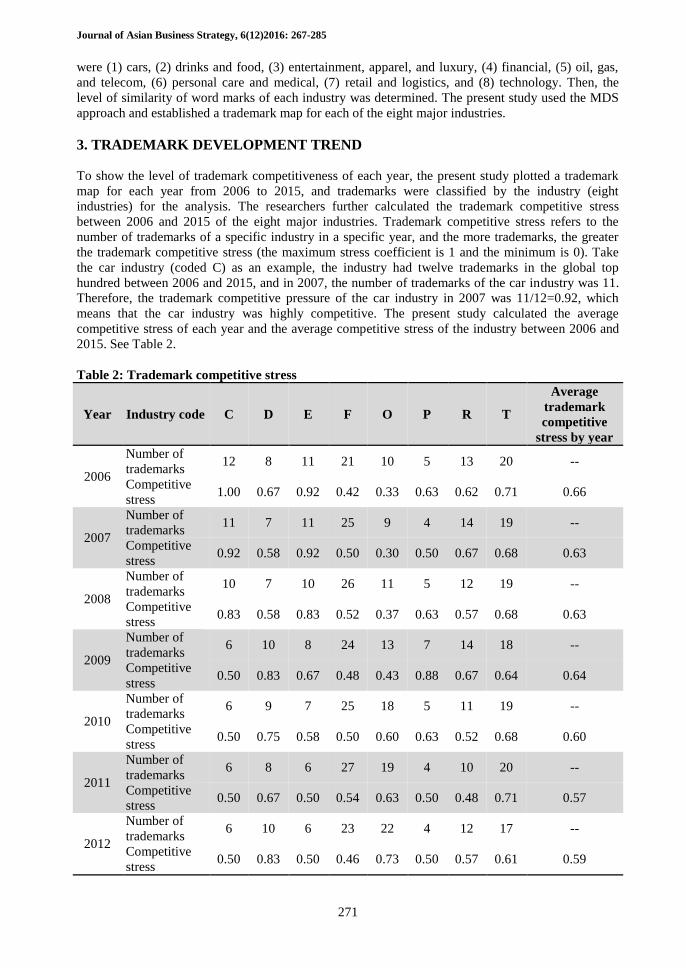
3.1. 2006 Trademark map
Among 2006 global top hundred trademarks, the financial industry had the highest number of
trademarks, accounting for 21% of all trademarks in 2006. The technology industry had the second
highest number of trademarks, 20%. The personal care and medical industry had the lowest number
of trademarks, 5%. The average trademark competitive stress of 2006 was 0.66. In terms of the level
of overlap, most of the industries had excellent trademark identifiability, except the financial
industry. The financial industry had a greater number of trademarks, and therefore more intense
trademark stress. As for other industries, the trademark competitive stress was relatively smaller
compared to that of the financial industry. Please refer to Figure 1.
Figure 1: 2006 Trademark map of the eight major industries
Journal of Asian Business Strategy, 6(12)2016: 267-285
273
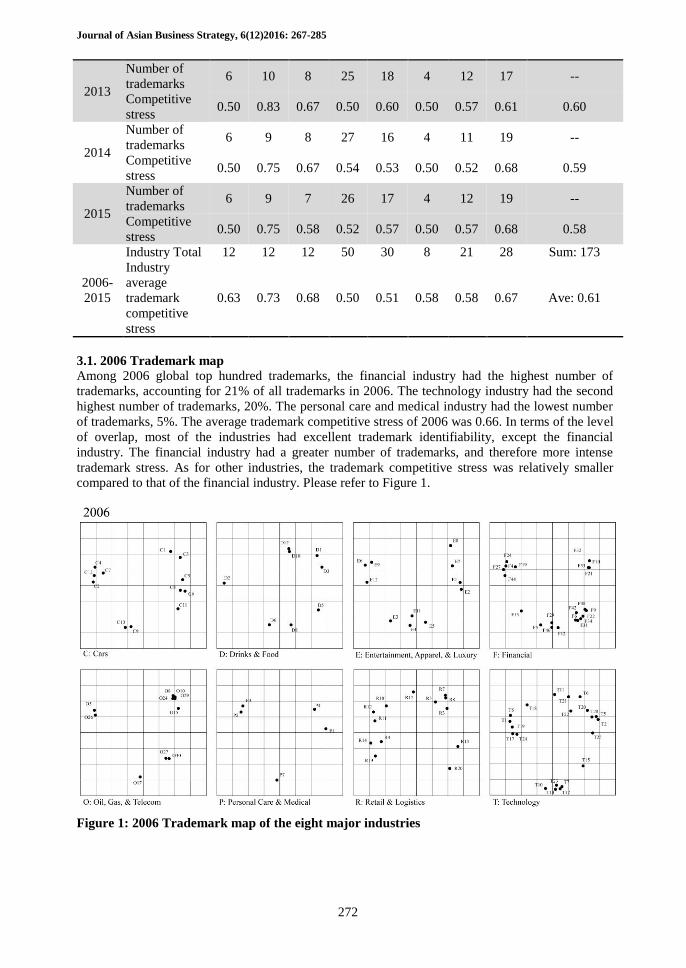
3.2. 2007 Trademark map
Among the global top hundred trademarks in 2007, the financial industry had the highest number of
trademarks, accounting for 25% of all trademarks in 2007. The technology industry had the second
highest number of trademarks, 19%. The personal care and medical industry had the lowest number
of trademarks, 4%. The average trademark competitive stress of 2007 was 0.63. In terms of the level
of overlap, most of the industries had excellent trademark identifiability, especially the drinks and
food industry. The drinks and food industry had fewer brand competitors, and therefore, the
trademark competitive stress was relatively small. Moreover, the trademark competitive stress of the
oil, gas, and telecom industry was the lowest (0.30) over the years. Please refer to Figure 2.
Figure 2: 2007 Trademark map of the eight major industries
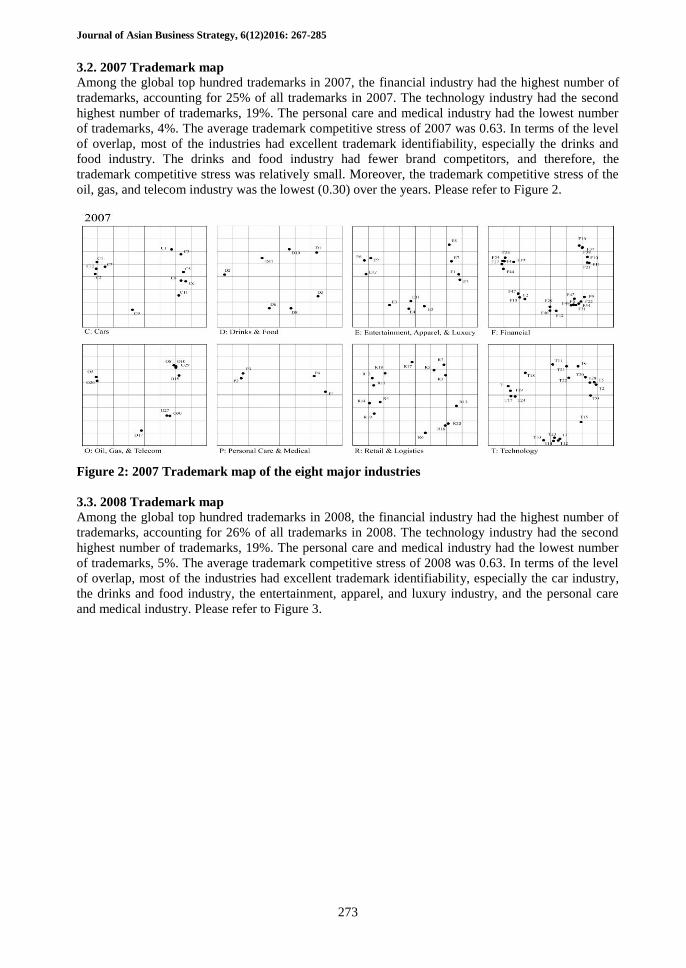
3.3. 2008 Trademark map
Among the global top hundred trademarks in 2008, the financial industry had the highest number of
trademarks, accounting for 26% of all trademarks in 2008. The technology industry had the second
highest number of trademarks, 19%. The personal care and medical industry had the lowest number
of trademarks, 5%. The average trademark competitive stress of 2008 was 0.63. In terms of the level
of overlap, most of the industries had excellent trademark identifiability, especially the car industry,
the drinks and food industry, the entertainment, apparel, and luxury industry, and the personal care
and medical industry. Please refer to Figure 3.
Journal of Asian Business Strategy, 6(12)2016: 267-285
274
Figure 3: 2008 Trademark map of the eight major industries
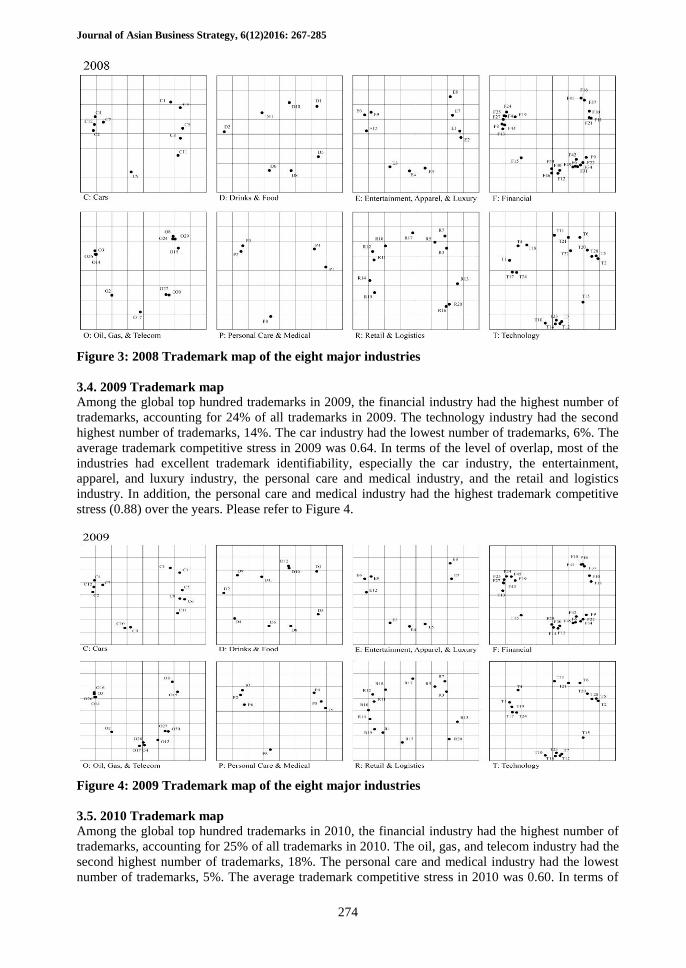
3.4. 2009 Trademark map
Among the global top hundred trademarks in 2009, the financial industry had the highest number of
trademarks, accounting for 24% of all trademarks in 2009. The technology industry had the second
highest number of trademarks, 14%. The car industry had the lowest number of trademarks, 6%. The
average trademark competitive stress in 2009 was 0.64. In terms of the level of overlap, most of the
industries had excellent trademark identifiability, especially the car industry, the entertainment,
apparel, and luxury industry, the personal care and medical industry, and the retail and logistics
industry. In addition, the personal care and medical industry had the highest trademark competitive
stress (0.88) over the years. Please refer to Figure 4.
Figure 4: 2009 Trademark map of the eight major industries
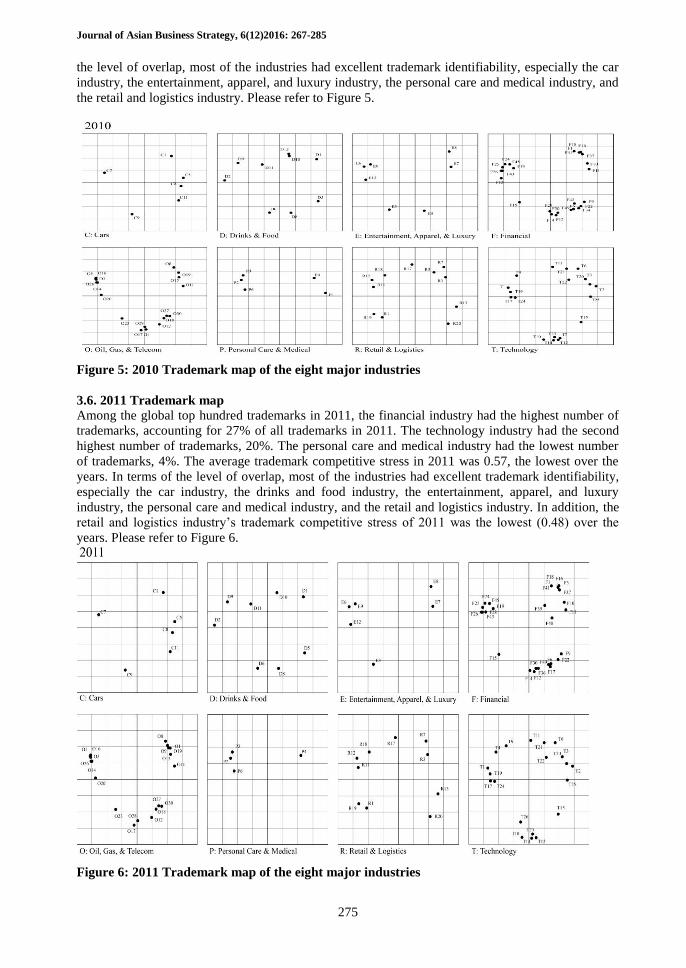
3.5. 2010 Trademark map
Among the global top hundred trademarks in 2010, the financial industry had the highest number of
trademarks, accounting for 25% of all trademarks in 2010. The oil, gas, and telecom industry had the
second highest number of trademarks, 18%. The personal care and medical industry had the lowest
number of trademarks, 5%. The average trademark competitive stress in 2010 was 0.60. In terms of
Journal of Asian Business Strategy, 6(12)2016: 267-285
275
the level of overlap, most of the industries had excellent trademark identifiability, especially the car
industry, the entertainment, apparel, and luxury industry, the personal care and medical industry, and
the retail and logistics industry. Please refer to Figure 5.
Figure 5: 2010 Trademark map of the eight major industries
3.6. 2011 Trademark map
Among the global top hundred trademarks in 2011, the financial industry had the highest number of
trademarks, accounting for 27% of all trademarks in 2011. The technology industry had the second
highest number of trademarks, 20%. The personal care and medical industry had the lowest number
of trademarks, 4%. The average trademark competitive stress in 2011 was 0.57, the lowest over the
years. In terms of the level of overlap, most of the industries had excellent trademark identifiability,
especially the car industry, the drinks and food industry, the entertainment, apparel, and luxury
industry, the personal care and medical industry, and the retail and logistics industry. In addition, the
retail and logistics industry’s trademark competitive stress of 2011 was the lowest (0.48) over the
years. Please refer to Figure 6.
Figure 6: 2011 Trademark map of the eight major industries
Journal of Asian Business Strategy, 6(12)2016: 267-285
276
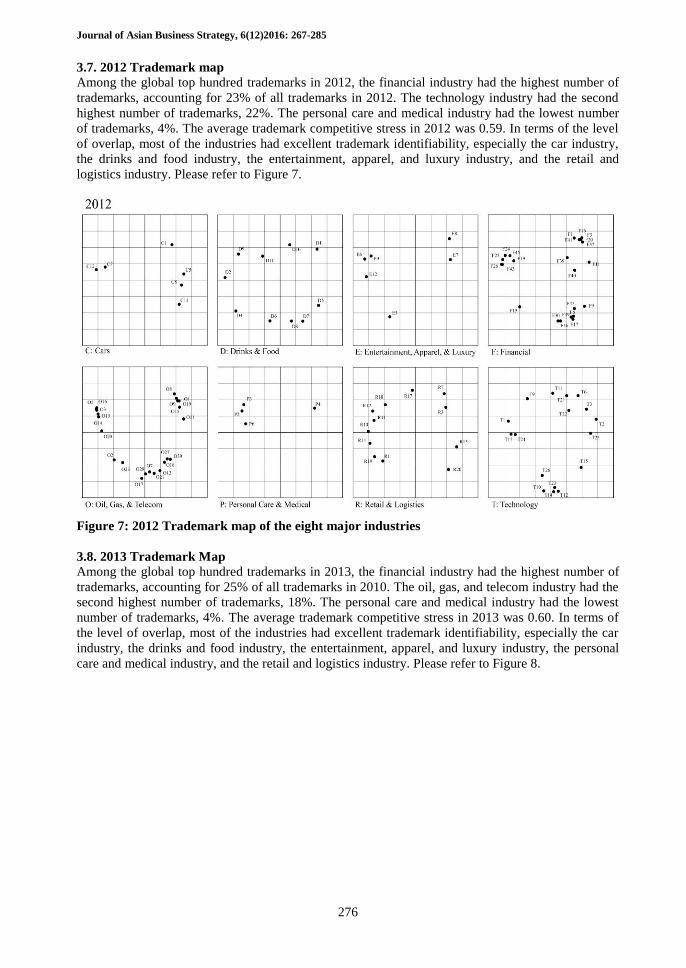
3.7. 2012 Trademark map
Among the global top hundred trademarks in 2012, the financial industry had the highest number of
trademarks, accounting for 23% of all trademarks in 2012. The technology industry had the second
highest number of trademarks, 22%. The personal care and medical industry had the lowest number
of trademarks, 4%. The average trademark competitive stress in 2012 was 0.59. In terms of the level
of overlap, most of the industries had excellent trademark identifiability, especially the car industry,
the drinks and food industry, the entertainment, apparel, and luxury industry, and the retail and
logistics industry. Please refer to Figure 7.
Figure 7: 2012 Trademark map of the eight major industries
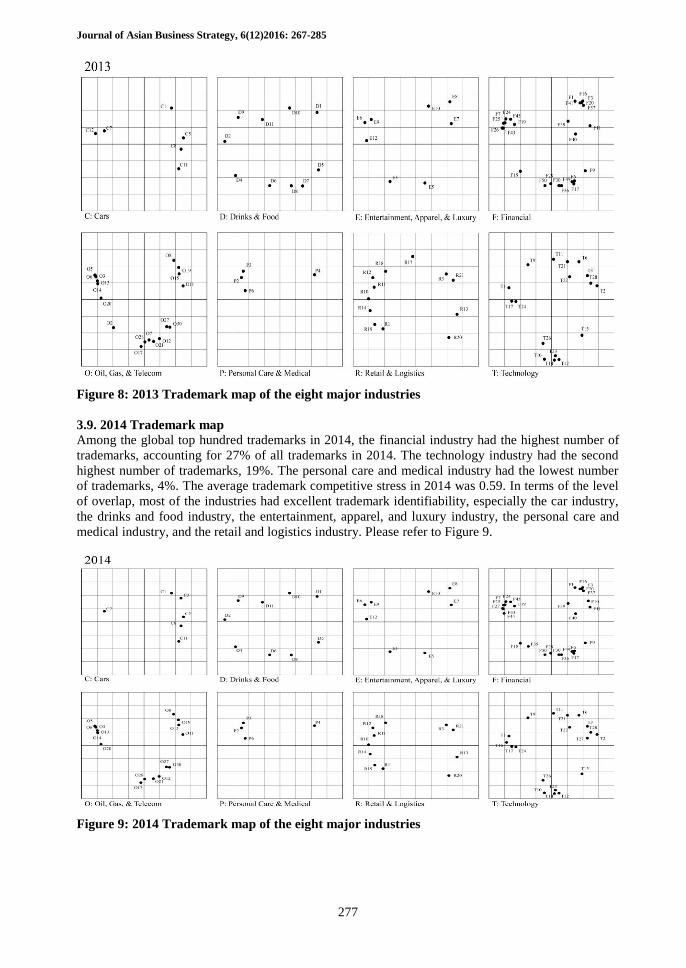
3.8. 2013 Trademark Map
Among the global top hundred trademarks in 2013, the financial industry had the highest number of
trademarks, accounting for 25% of all trademarks in 2010. The oil, gas, and telecom industry had the
second highest number of trademarks, 18%. The personal care and medical industry had the lowest
number of trademarks, 4%. The average trademark competitive stress in 2013 was 0.60. In terms of
the level of overlap, most of the industries had excellent trademark identifiability, especially the car
industry, the drinks and food industry, the entertainment, apparel, and luxury industry, the personal
care and medical industry, and the retail and logistics industry. Please refer to Figure 8.
Journal of Asian Business Strategy, 6(12)2016: 267-285
277
Figure 8: 2013 Trademark map of the eight major industries
3.9. 2014 Trademark map
Among the global top hundred trademarks in 2014, the financial industry had the highest number of
trademarks, accounting for 27% of all trademarks in 2014. The technology industry had the second
highest number of trademarks, 19%. The personal care and medical industry had the lowest number
of trademarks, 4%. The average trademark competitive stress in 2014 was 0.59. In terms of the level
of overlap, most of the industries had excellent trademark identifiability, especially the car industry,
the drinks and food industry, the entertainment, apparel, and luxury industry, the personal care and
medical industry, and the retail and logistics industry. Please refer to Figure 9.
Figure 9: 2014 Trademark map of the eight major industries

Journal of Asian Business Strategy, 6(12)2016: 267-285
278
3.10. 2015 Trademark map
Among the global top hundred trademarks in 2015, the financial industry had the highest number of
trademarks, accounting for 26% of the number of trademarks of 20015. The technology industry had
the second highest number of trademarks, 19%. The personal care and medical industry had the
lowest number of trademarks, 4%. The average trademark competitive stress in 2015 was 0.58. In
terms of the level of overlap, most of the industries had excellent identifiability, especially the car
industry, the drinks and food industry, the entertainment, apparel, and luxury industry, the personal
care and medical industry, and the retail and logistics industry. Please refer to Figure 10.
Figure 10: 2015 Trademark Map of the Eight Major Industries
4. TRADEMARK MAPS OF THE EIGHT MAJOR INDUSTRIES
Similarity judgment in this study was made based on MDS, which analyze quantitative data, such as
ratio scales . The present study examined the level of similarity of the word marks of the eight major
industries and then set up a data matrix of the similarity level. Next, a two-dimensional trademark
map was plotted. Though this kind of two-dimensional map may slightly exaggerate the stress
coefficient, it is good for visualizing the trend of trademarks over years. See Table 3 for the stress and
RSQ of the eight major industries.
Table 3: Stress and RSQ of the eight major industries
Number Industry Industry code Stress RSQ
1 Cars C 0.1549 0.9318
2 Drinks & Food D 0.2831 0.5963
3 Entertainment, Apparel, & Luxury E 0.2791 0.6692
4 Financial F 0.3170 0.6693
5 Oil, Gas, & Telecom O 0.3121 0.6304
6 Personal Care & Medical P 0.2413 0.7181
7 Retail & Logistics R 0.3030 0.6232
8 Technology T 0.3584 0.4107
The present study used the MDS approach to plot the trademarks of the eight major industries on a
plane based on trademark identifiability. Figures 11 to 18 showed the trademark maps of the
following eight industries: (1) cars, (2) drinks and food, (3) entertainment, apparel, and luxury, (4)
financial, (5) oil, gas, and telecom, (6) personal care and medical, (7) retail and logistics, and (8)
technology.

Journal of Asian Business Strategy, 6(12)2016: 267-285
279
4.1. Trademark map of car industry
For the car industry (coded C), the industry had a total of 12 trademarks in the global top hundred
between 2006 and 2015. There are three to four key competitive groups. The good identifiability
among the trademarks suggested that it was unlikely for consumer to misidentify trademarks used in
the car industry. Please refer to Figure 11.
Figure 11: Trademark map of car industry
4.2. Trademark map of drinks and food industry
For the drinks and food industry (coded D), the industry had 12 trademarks in the global top hundred
between 2006 and 2015. The non-decentralized distribution of trademarks suggests that these
trademarks had a good identifiability. Moreover, the trademark competitors were the same between
2006 and 2015, meaning that competitors in the drinks and food industry were quite stable. Please
refer to Figure 12.
Figure 12: Trademark map of drinks and food industry
Journal of Asian Business Strategy, 6(12)2016: 267-285
280
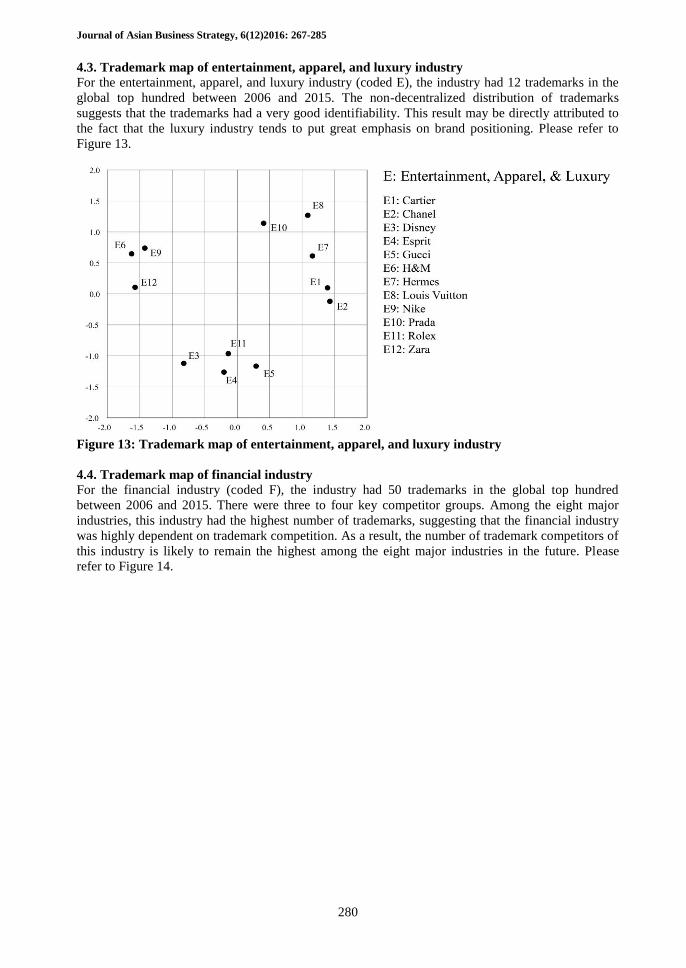
4.3. Trademark map of entertainment, apparel, and luxury industry
For the entertainment, apparel, and luxury industry (coded E), the industry had 12 trademarks in the
global top hundred between 2006 and 2015. The non-decentralized distribution of trademarks
suggests that the trademarks had a very good identifiability. This result may be directly attributed to
the fact that the luxury industry tends to put great emphasis on brand positioning. Please refer to
Figure 13.
Figure 13: Trademark map of entertainment, apparel, and luxury industry
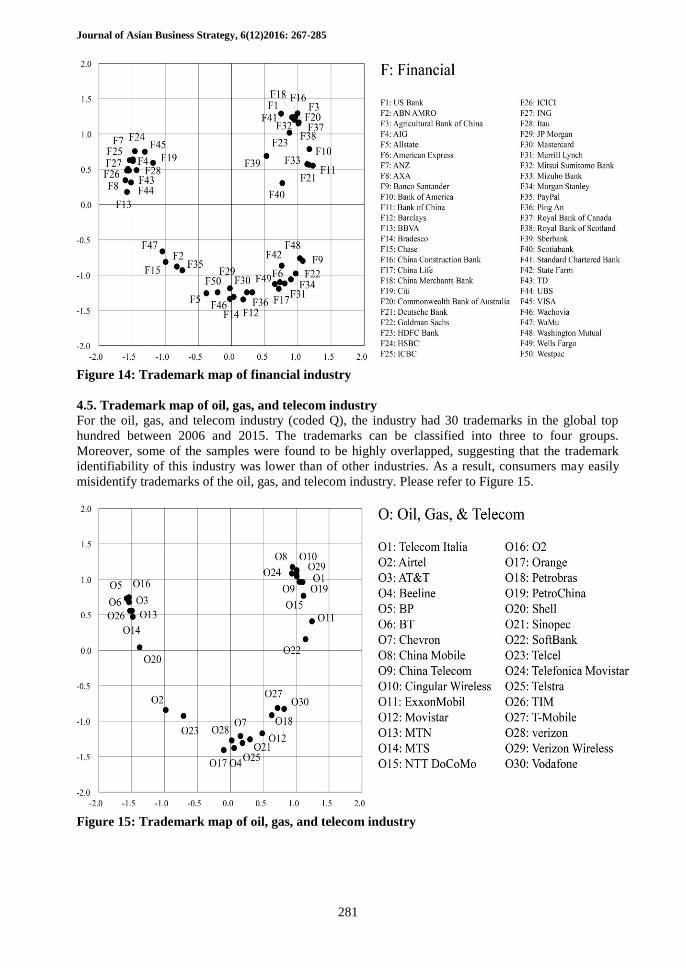
4.4. Trademark map of financial industry
For the financial industry (coded F), the industry had 50 trademarks in the global top hundred
between 2006 and 2015. There were three to four key competitor groups. Among the eight major
industries, this industry had the highest number of trademarks, suggesting that the financial industry
was highly dependent on trademark competition. As a result, the number of trademark competitors of
this industry is likely to remain the highest among the eight major industries in the future. Please
refer to Figure 14.
Journal of Asian Business Strategy, 6(12)2016: 267-285
281
Figure 14: Trademark map of financial industry
4.5. Trademark map of oil, gas, and telecom industry
For the oil, gas, and telecom industry (coded Q), the industry had 30 trademarks in the global top
hundred between 2006 and 2015. The trademarks can be classified into three to four groups.
Moreover, some of the samples were found to be highly overlapped, suggesting that the trademark
identifiability of this industry was lower than of other industries. As a result, consumers may easily
misidentify trademarks of the oil, gas, and telecom industry. Please refer to Figure 15.
Figure 15: Trademark map of oil, gas, and telecom industry
Journal of Asian Business Strategy, 6(12)2016: 267-285
282
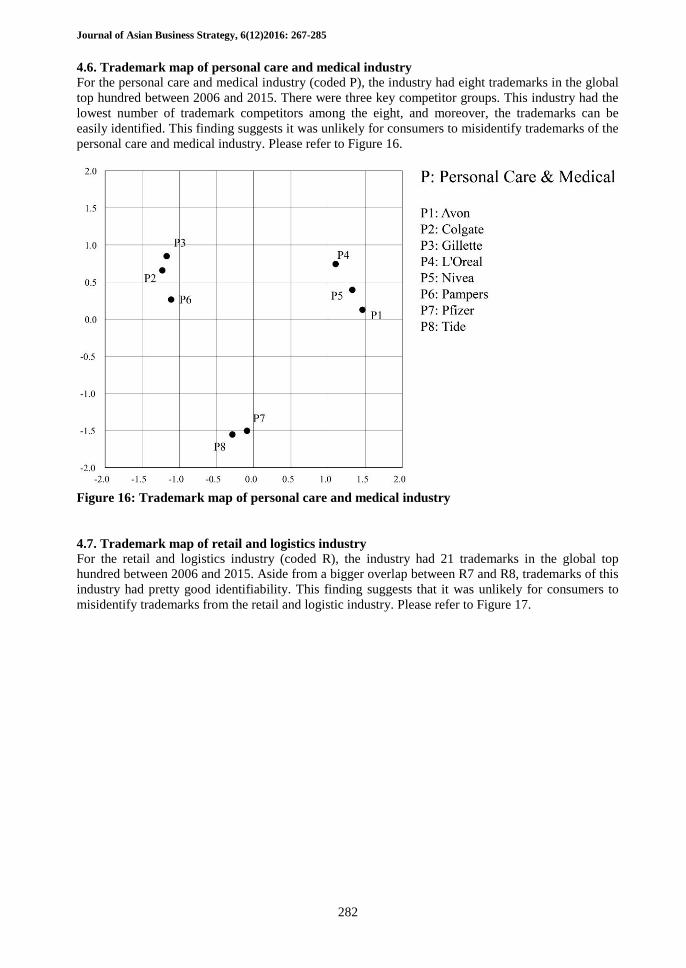
4.6. Trademark map of personal care and medical industry
For the personal care and medical industry (coded P), the industry had eight trademarks in the global
top hundred between 2006 and 2015. There were three key competitor groups. This industry had the
lowest number of trademark competitors among the eight, and moreover, the trademarks can be
easily identified. This finding suggests it was unlikely for consumers to misidentify trademarks of the
personal care and medical industry. Please refer to Figure 16.
Figure 16: Trademark map of personal care and medical industry
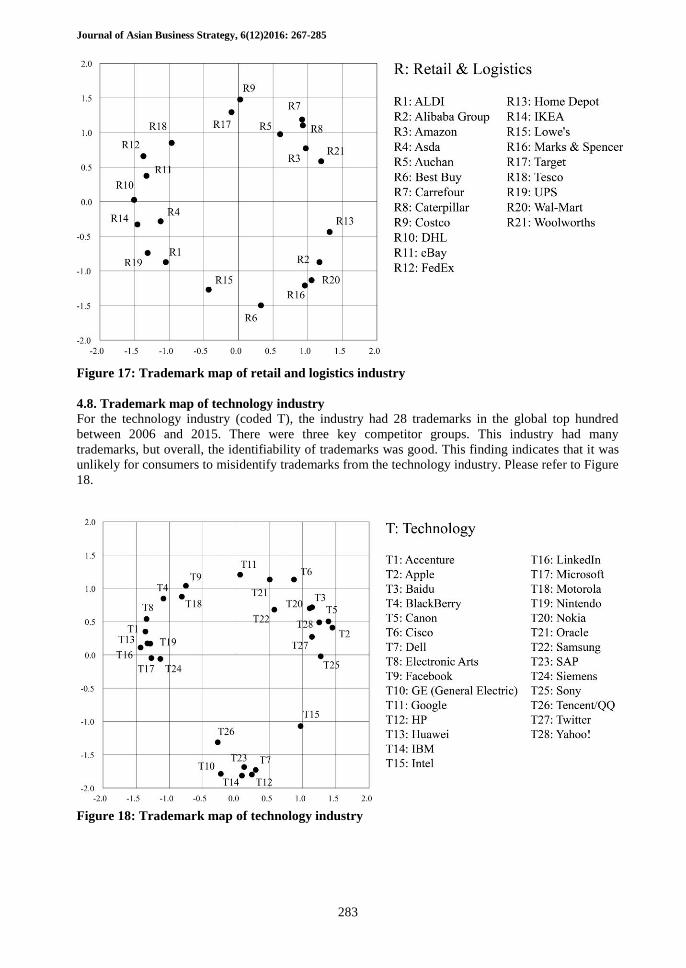
4.7. Trademark map of retail and logistics industry
For the retail and logistics industry (coded R), the industry had 21 trademarks in the global top
hundred between 2006 and 2015. Aside from a bigger overlap between R7 and R8, trademarks of this
industry had pretty good identifiability. This finding suggests that it was unlikely for consumers to
misidentify trademarks from the retail and logistic industry. Please refer to Figure 17.
Journal of Asian Business Strategy, 6(12)2016: 267-285
283
Figure 17: Trademark map of retail and logistics industry
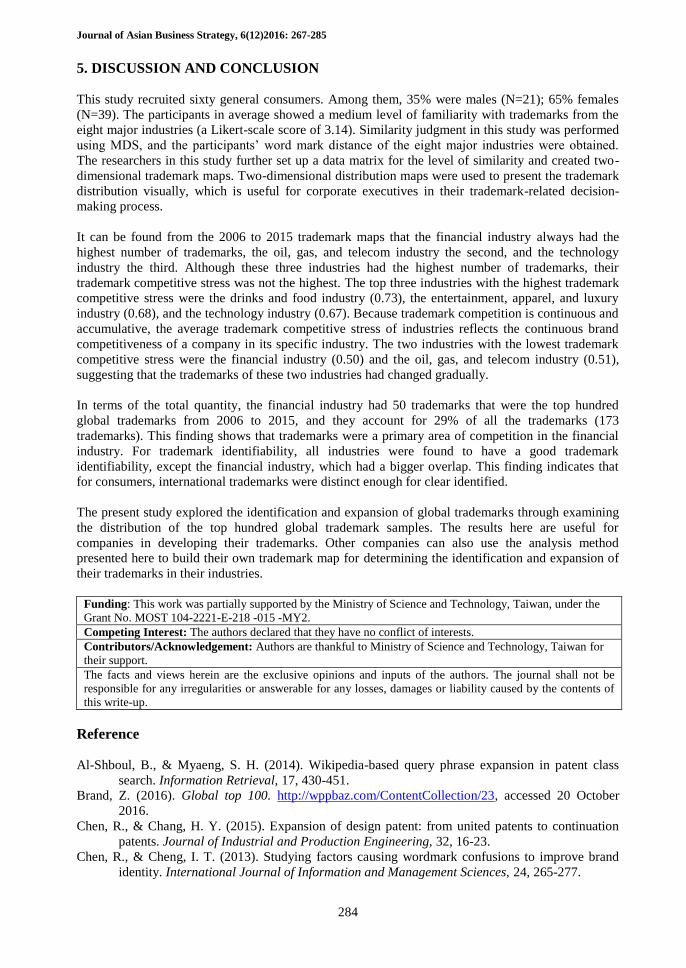
4.8. Trademark map of technology industry
For the technology industry (coded T), the industry had 28 trademarks in the global top hundred
between 2006 and 2015. There were three key competitor groups. This industry had many
trademarks, but overall, the identifiability of trademarks was good. This finding indicates that it was
unlikely for consumers to misidentify trademarks from the technology industry. Please refer to Figure
18.
Figure 18: Trademark map of technology industry
Journal of Asian Business Strategy, 6(12)2016: 267-285
284
5. DISCUSSION AND CONCLUSION
This study recruited sixty general consumers. Among them, 35% were males (N=21); 65% females
(N=39). The participants in average showed a medium level of familiarity with trademarks from the
eight major industries (a Likert-scale score of 3.14). Similarity judgment in this study was performed
using MDS, and the participants’ word mark distance of the eight major industries were obtained.
The researchers in this study further set up a data matrix for the level of similarity and created two-
dimensional trademark maps. Two-dimensional distribution maps were used to present the trademark
distribution visually, which is useful for corporate executives in their trademark-related decision-
making process.
It can be found from the 2006 to 2015 trademark maps that the financial industry always had the
highest number of trademarks, the oil, gas, and telecom industry the second, and the technology
industry the third. Although these three industries had the highest number of trademarks, their
trademark competitive stress was not the highest. The top three industries with the highest trademark
competitive stress were the drinks and food industry (0.73), the entertainment, apparel, and luxury
industry (0.68), and the technology industry (0.67). Because trademark competition is continuous and
accumulative, the average trademark competitive stress of industries reflects the continuous brand
competitiveness of a company in its specific industry. The two industries with the lowest trademark
competitive stress were the financial industry (0.50) and the oil, gas, and telecom industry (0.51),
suggesting that the trademarks of these two industries had changed gradually.
In terms of the total quantity, the financial industry had 50 trademarks that were the top hundred
global trademarks from 2006 to 2015, and they account for 29% of all the trademarks (173
trademarks). This finding shows that trademarks were a primary area of competition in the financial
industry. For trademark identifiability, all industries were found to have a good trademark
identifiability, except the financial industry, which had a bigger overlap. This finding indicates that
for consumers, international trademarks were distinct enough for clear identified.
The present study explored the identification and expansion of global trademarks through examining
the distribution of the top hundred global trademark samples. The results here are useful for
companies in developing their trademarks. Other companies can also use the analysis method
presented here to build their own trademark map for determining the identification and expansion of
their trademarks in their industries.
Funding: This work was partially supported by the Ministry of Science and Technology, Taiwan, under the
Grant No. MOST 104-2221-E-218 -015 -MY2.
Competing Interest: The authors declared that they have no conflict of interests.
Contributors/Acknowledgement: Authors are thankful to Ministry of Science and Technology, Taiwan for
their support. The facts and views herein are the exclusive opinions and inputs of the authors. The journal shall not be
responsible for any irregularities or answerable for any losses, damages or liability caused by the contents of
this write-up.
Reference
Al-Shboul, B., & Myaeng, S. H. (2014). Wikipedia-based query phrase expansion in patent class
search. Information Retrieval, 17, 430-451.
Brand, Z. (2016). Global top 100. http://wppbaz.com/ContentCollection/23, accessed 20 October
2016.
Chen, R., & Chang, H. Y. (2015). Expansion of design patent: from united patents to continuation
patents. Journal of Industrial and Production Engineering, 32, 16-23.
Chen, R., & Cheng, I. T. (2013). Studying factors causing wordmark confusions to improve brand
identity. International Journal of Information and Management Sciences, 24, 265-277.
Journal of Asian Business Strategy, 6(12)2016: 267-285
285
Chen, R., & Liang, C. (2013). The strategy tool: the trademark map of best 100 brands in the world.
Journal of Management and Strategy, 4, 21-31.
Chernyak, N., Stephan, A., Bachle, C., Genz, J., Julich, F., & Icks, A. (2016). Assessment of
information needs in diabetes: development and evaluation of a questionnaire. Primary Care
Diabetes, 10, 287-292.
Herm, S., & Moeller, J. (2014). Brand identification by product design: the impact of evaluation
mode and familiarity. Psychology & Marketing, 31, 1084-1095.
Mahdabi, P., & Crestani, F. (2014). The effect of citation analysis on query expansion for patent
retrieval. Information Retrieval, 17, 412-429.
Palumbo, F., & Herbig, P. (2000). The multicultural context of brand loyalty. European Journal of
Innovation Management, 3, 116-124.
Sharma, P., Tripathi, R., & Tripathi, R. C. (2015). Finding Similar Patents Through Semantic Query
Expansion. 11th International Conference on Data Mining and Warehousing (ICDMW).
Bangalore, India, pp.21-23.
TAPTO (2016). Trademark system in Taiwan. Taiwan advance patent & trademark office,
http://www.aipo.com.tw/tc/p4-trademark_2.asp, accessed 20 October 2016.
TIPO (2004). Examination guidelines on likelihood of confusion. Taiwan Intellectual Property Office.
http://www.tipo.gov.tw/en/AllInOne_Show.aspx?guid=91d7cea5-e737-4b18-a96a-
a676063930d3&lang=en-us&path=1466, accessed 20 October 2016.
Venugopalan, S., & Rai, V. (2015). Topic based classification and pattern identification in patents.
Technological Forecasting and Social Change, 94, 236-250.
Wang, D. C. (2008). Trademark law. Wu-Nan Culture Enterprise Co. Ltd.
WIPO (2016). What is a trademark?, http://www.wipo.int/trademarks/en/, accessed 20 October 2016.
Yu, L., & Yi, W.Y. (2011). Initial exploration to the enterprise brand strategy centering on trademark
in the minority concentrated area, Heilongjiang National Series.
Zeng, C. M. R., & Cai, M. C. (2007). Trademark law. New Sharing Culture Enterprise Co. Ltd.