trade, foreign direct investment, and openness · chapter 9 trade, foreign direct investment, and...
TRANSCRIPT

CHAPTeR 9
TRADE, fOREIGN DIRECT INVESTMENT, AND OPENNESS
9.1 introduction
Asia has a long history in international trade, spanning thousands of years.1 Over the past 50 years, in particular, Asia’s economic reemergence was driven by a system that gradually embraced open trade and investment. Developing Asia’s rapid growth in trade and foreign direct investment (FDI)—and the corresponding 42-fold increase in gross domestic product (GDP, in constant 2010 United States [US] dollars)—helped narrow the development gap with industrialized countries and contributed to reducing poverty.
In general, Asia’s economies passed through three evolutionary stages of external economic policy regimes over the past 5 decades, although with large variations in speed and substance between countries: first, many countries adopted a post-independence import substitution strategy to build self-reliance; second, many of the Asian economies became outward oriented; and third, they deepened integration into global value chains (GVCs) and embraced regional trade arrangements.
1 Pomeranz, K. 2001. The Great Divergence: China, Europe, and the Making of the Modern World Economy. Princeton: Princeton University Press; and Sugihara, K. 1996. Japan, China, and the Growth of the Asian International Economy, 1850–1949. Volume 1. Oxford: Oxford University Press.

296 | ASIA’S JOURNeY TO PROSPeRITY—CHAPTeR 9
In the 1950s and 1960s, many Asian economies adopted an import substitution strategy—but with limited success. By the mid-1960s, a few economies— Hong Kong, China; the Republic of Korea (ROK); Singapore; and Taipei,China (later the newly industrialized economies [NIEs])—started export promotion as a growth strategy. This was driven by a desire to industrialize, earn the foreign exchange needed to import capital goods, and access foreign markets. More Asian countries followed in the 1970s and 1980s because of the failure of import substitution strategies.
Special economic zones (SEZs) allowed export-led growth strategies to be tested in a controlled way for countries such as the People’s Republic of China (PRC), which had little experience with market-based policies before beginning to open its economy in 1978. Also, after the 1985 Plaza Accord and the resulting sharp appreciation of the Japanese yen, there was a surge in FDI from Japan to the region, especially Southeast Asia, helped by Japan’s substantial official development assistance in infrastructure.
Trade entered a new phase in the early 2000s, as tariffs worldwide fell dramatically, free trade agreements (FTAs) proliferated, and the PRC joined the World Trade Organization (WTO). Outward-oriented trade reforms and increased competition reinforced the increasing trend of FDI inflows to Asia and boosted the region’s trade. As a result, global and regional multinational firms intensified outsourcing production to Asia, incorporating the region’s economies more deeply into GVCs.
Asia’s rapid trade and FDI growth underscores the region’s successful transition to outward-oriented policies. Both merchandise exports and merchandise imports grew annually by 11% during 1960–2018, with the ratio of trade (exports plus imports) to GDP rising from 20% to 53%. There was also a significant shift in export composition, from mostly raw materials to manufactured goods, and from light industry to heavy industrial products, with an increasing share of high-technology exports.
Conventional trade theories by Ricardo and Heckscher-Ohlin argue that an economy benefits from trade through comparative advantage and efficiency gains from reallocating resources, especially using interindustry international trade (trade among different industries between countries). Japan’s Meiji restoration in the 19th century is an example of these classical gains from trade—around 65% of Japan’s increase in real income between 1858 (when Japan’s

TRADe, FOReIGN DIReCT INVeSTMeNT, AND OPeNNeSS | 297
self-imposed economic isolation ended) and the 1870s (when Japan embraced free trade) came from renewed trade.2
Intra-industry trade—trade in the same industry between countries, such as a horizontal trade of cars exported and imported between two countries, and the vertical trade of cars and their parts between two countries—deepened in Asian economies. This is explained by trade theory that emphasizes gains from scale economies,3 the first-mover advantage, knowledge spillovers, and greater consumer welfare from the wider variety of goods and services available.4
The more recent trade model of firm heterogeneity5 shows that trade liberalization enhances overall economic productivity, because only sufficiently productive firms can survive market competition after liberalization.6 Asian economies captured these benefits initially through interindustry trade and later through intra-industry trade. In addition, FDI inflows brought further benefits: access to capital, new technologies, and management know-how. This trend also helped trigger broad and deep domestic structural reforms in the region, including greater market competition and product innovation.
This chapter revisits the role an open economic system of trade and FDI played in driving the past 50 years of Asia’s rapid economic growth and structural transformation. Section 9.2 examines how Asia’s trade and FDI grew across economies and over time, drawing out empirical regularities between trade and FDI and economic growth. Section 9.3 discusses the evolution of Asia’s trade and FDI policies, focusing on the key policy and institutional drivers of trade and FDI
2 Huber, R. 1971. Effect on Prices of Japan’s Entry into World Commerce after 1858. Journal of Political Economy. 79 (3). pp. 614–628; and Latham, A. J. H., and H. Kawakatsu, eds. 2009. Intra-Asian Trade and Industrialization: Essays in Memory of Yasukichi Yasuba. London and New York: Routledge.
3 Ethier, W. J. 1979. Internationally Decreasing Costs and World Trade. Journal of International Economics. 9 (1). pp. 1–25; Krugman, P. R. 1979. Increasing Returns, Monopolistic Competition and International Trade. Journal of International Economics. 9 (4). pp. 469–479; and Grossman, G., and E. Helpman. 1991. Trade, Knowledge Spillovers, and Growth. European Economic Review. 35 (2–3). pp. 517–526.
4 Broda, C., and D. Weinstein. 2006. Globalization and the Gains from Variety. The Quarterly Journal of Economics. 121 (2). pp. 541–585.
5 Melitz, M. 2003. The Impact of Trade on Intra-Industry Reallocations and Aggregate Industry Productivity. Econometrica. 71 (6). pp. 1695–1725.
6 McCaig, B., and N. Pavcnik. 2018. Export Markets and Labor Allocation in a Low-Income Country. American Economic Review. 108 (7). pp. 1899–1941; Zhai, F. 2008. Armington Meets Melitz: Introducing Firm Heterogeneity in a Global CGE Model of Trade. Journal of Economic Integration. 23 (3). pp. 575–604; and Yu, M. 2015. Processing Trade, Tariff Reductions and Firm Productivity: Evidence from Chinese Firms. The Economic Journal. 125 (585). pp. 943–988.

298 | ASIA’S JOURNeY TO PROSPeRITY—CHAPTeR 9
growth. Section 9.4 focuses on the growing opportunities offered by GVCs and regional value chains (RVCs). Section 9.5 examines the growing importance of services trade. Section 9.6 discusses the proliferation of global and regional trade arrangements. Section 9.7 looks at the future of trade and FDI growth in Asia and its policy implications.
9.2 Trends in asia’s trade and foreign direct investment7
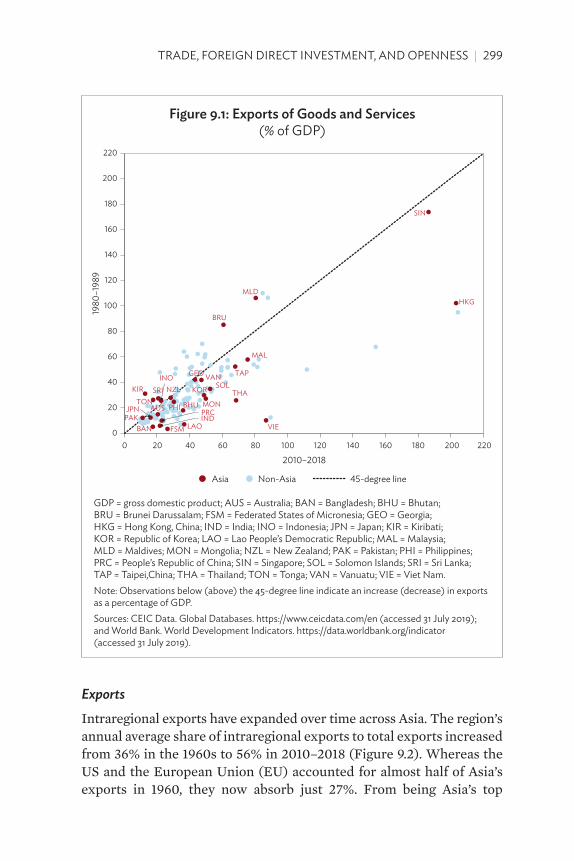
TradeAsia’s trade has grown substantially over the past 50 years, driven by the region’s proactive outward-oriented development policies. As a result, most Asian economies have seen a higher export-to-GDP share in the 2010s (shown along the horizontal axis of Figure 9.1) compared to the 1980s (shown in the vertical axis). Hong Kong, China and Singapore are the most open economies in the region and globally, given their relatively small economic size.
The PRC’s share of exports in goods and services increased from an annual average of 10% of GDP in the 1980s to a peak of 36% in 2006, stabilizing around 23% during 2010–2018 after the global financial crisis. India’s export share more than tripled from 6% in the 1980s to 22% in the 2010s. These are dramatic, especially given the size of the two economies. The PRC’s accession to the WTO in 2001 and India’s economic liberalization reform beginning in 1991 provided further impetus to their outstanding export growth. For relatively smaller economies in Southeast Asia and the Pacific, the ratio increased even more dramatically. Viet Nam’s export-to-GDP share soared almost nine times from 10% in the 1980s to 87% in the 2010s. Over the same period, the export share rose eight times (to 27%) in the Federated States of Micronesia and five times (to 37%) in the Lao People’s Democratic Republic.
While Asia’s global trade was growing fast, initial interindustry trade based on comparative advantage switched to intra-industry GVC trade spurred by scale economies as well as product differentiation and sophistication. As a corollary, while Europe and the United States (US) are important destinations for Asia’s exports, Asia’s market has continuously expanded, making it an important destination for European and US products.8
7 In this section, Asia includes developing Asia and the three advanced economies of Australia, Japan, and New Zealand.
8 Helble, M., and B. Ngiang. 2016. From Global Factory to Global Mall? East Asia’s Changing Trade Composition. Japan and the World Economy. 39 (September). pp. 37–47.
TRADe, FOReIGN DIReCT INVeSTMeNT, AND OPeNNeSS | 299
Exports
Intraregional exports have expanded over time across Asia. The region’s annual average share of intraregional exports to total exports increased from 36% in the 1960s to 56% in 2010–2018 (Figure 9.2). Whereas the US and the European Union (EU) accounted for almost half of Asia’s exports in 1960, they now absorb just 27%. From being Asia’s top
Figure 9.1: exports of goods and services (% of GDP)
HKG
SIN
VIE
MLD
MAL
THA
TAP
BRU
SOL
MON
KORVANGEO
LAO
BHUPHI
NZL
FSM
PRC
INO
IND
SRI
AUSTON
BAN
JPN
KIR
PAK
0
20
40
60
80
100
120
140
160
180
200
220
0 20 40 60 80 100 120 140 160 180 200 220
1980
–198
9
2010–2018
Non-AsiaAsia 45-degree line
GDP = gross domestic product; AUS = Australia; BAN = Bangladesh; BHU = Bhutan; BRU = Brunei Darussalam; FSM = Federated States of Micronesia; GeO = Georgia; HKG = Hong Kong, China; IND = India; INO = Indonesia; JPN = Japan; KIR = Kiribati; KOR = Republic of Korea; lAO = lao People’s Democratic Republic; MAl = Malaysia; MlD = Maldives; MON = Mongolia; NZl = New Zealand; PAK = Pakistan; PHI = Philippines; PRC = People’s Republic of China; SIN = Singapore; SOl = Solomon Islands; SRI = Sri lanka; TAP = Taipei,China; THA = Thailand; TON = Tonga; VAN = Vanuatu; VIe = Viet Nam. Note: Observations below (above) the 45-degree line indicate an increase (decrease) in exports as a percentage of GDP. Sources: CeIC Data. Global Databases. https://www.ceicdata.com/en (accessed 31 July 2019); and world Bank. world Development Indicators. https://data.worldbank.org/indicator (accessed 31 July 2019).

300 | ASIA’S JOURNeY TO PROSPeRITY—CHAPTeR 9
export destination in the 1960s with an average 23% share, the EU’s share dropped to 13% in the 2010s mainly due to the significant drop in exports to the United Kingdom. Exports to the US declined steadily from a 26% peak in the 1980s to 14% in the 2010s. Following the 2008–2009 global financial crisis, Asia’s strong intraregional exports provided a buffer amid the slowdown in demand from advanced economies.
Within Asia, Japan was the major export destination until the 1990s, accounting for around 9% of Asian exports. Then the PRC took over with an annual average share of 15% in 2010–2018, up from just 2% in the 1960s. Over the period, the PRC became the regional hub for global production networks, built on low labor costs in early years and its massive production assembly capacity.9 Asian economies quickly
9 Asian Development Bank (ADB). 2008. Emerging Asian Regionalism: A Partnership for Shared Prosperity. Manila.
Figure 9.2: Destination of asia’s Merchandise exports(% of total, average over the specified period)
Rest of EU
Rest of EU
Rest of EU
UKG
UKG
UKG
NET
NET
NET
GER
GER
GER
Rest of Asia, 10%
Rest of Asia, 7%
Restof Asia, 8%
ASEAN, 10%
ASEAN, 13%
ASEAN14%
KOR, 1%
KOR, 4%
KOR, 4%
JPN, 9%
JPN, 9%
JPN, 6%
HKG, 4%
HKG, 8%
HKG, 8%
PRC, 2%PRC, 7%
PRC, 15%
0
10
20
30
40
50
60
70
80
90
100
1960–1969 1990–1999 2010–2018
EU23%
EU16%
EU13%
Asia36%
Asia48% Asia
56%
USA14%
USA23%
USA21%
ROW20% ROW
13%ROW17%
ASeAN = Association of Southeast Asian Nations; eU = european Union (28 members); GeR = Germany; HKG = Hong Kong, China; JPN = Japan; KOR = Republic of Korea; NeT = Netherlands; PRC = People’s Republic of China; ROw = rest of the world; UKG = United Kingdom; USA = United States. Note: In 2010–2018, out of the PRC’s 15% share in Asia’s exports, 4% came from Hong Kong, China; and out of Hong Kong, China’s 8% share, 5% is from the PRC.Source: International Monetary Fund. Direction of Trade Statistics. http://data.imf.org (accessed 26 July 2019).

TRADe, FOReIGN DIReCT INVeSTMeNT, AND OPeNNeSS | 301
incorporated into global and regional supply chains and thus thrived in exports of both intermediate and final goods, which cross borders multiple times within the same industry. This was likely behind the rise in the share of the Association of Southeast Asian Nations (ASEAN) in Asian exports—from 10% in the 1960s to 14% in the 2010s. The ROK’s share likewise increased from 1% to 4%.
The composition of exports shifted from mostly labor-intensive raw materials (such as textiles and garments) in the 1960s to higher value-added, capital-intensive products (such as electrical machinery and appliances) in the 2010s. This was partly due to the shift from interindustry to intra-industry trade (Figure 9.3). Today, for instance, in automobile and electronics industries, final products, intermediate goods, and parts are traded between countries along production networks. Export product diversity also grew
Figure 9.3: asia’s Top Merchandise exports(% of total)
1960–1969 2010–2018
11
8
7
6
5
5
5
4
4
3
0 10 20
Textile yarn, fabrics,made up articles, etc.
Textile fibers,not manufactured, and waste
Transport equipment
Iron and steel
Electrical machinery,apparatus, and appliances
Crude rubber includingsynthetic and reclaimed
Cereals and cereal preparations
Miscellaneous manufacturedarticles, NES
Machinery, other than electric
Clothing
20
14
9
6
5
5
3
3
3
3
0 10 20
Electrical machinery,apparatus, and appliances
Machinery,other than electric
Transport equipment
Petroleum andpetroleum products
Clothing
Miscellaneousmanufactured articles, NES
Scientific and controlinstruments, photographyand optical goods, clocks
Chemical elementsand compounds
Textile yarn, fabrics,made up articles, etc.
Iron and steel
NeS = not elsewhere specified.Notes: Commodity classification is based on SITC Rev 1 (2-digit commodity codes). The category “miscellaneous manufactured articles, NeS” includes the following: musical instruments, sound recorders and parts; printed matter; articles of artificial plastic materials, NeS; perambulators, toys, games, and sporting goods; office and stationery supplies, NeS; works of art, collectors’ pieces, and antiques; and manufactured articles, NeS.Source: world Bank. world Integrated Trade Solution. https://wits.worldbank.org/ (accessed 4 November 2019).

302 | ASIA’S JOURNeY TO PROSPeRITY—CHAPTeR 9
dramatically. And the variety of imported products also expanded significantly. Tariff reductions allowed many previously unavailable consumer goods to enter Asian markets.
Also, there was a general positive relationship between export growth and economic growth in the world over the past 57 years (Figure 9.4). Several points are noteworthy. First, the positive relationship between export growth and economic growth is salient among the NIEs as well as other Asian economies, which have cultivated a broader manufacturing industrial base. Second, economies like the NIEs—with a high degree of economic openness (measured by
Figure 9.4: export growth and economic growth, 1960–2017
NigeriaUnited StatesVenezuela
Brazil
Colombia
Egypt
0
1
2
3
4
5
6
7
8
9
10
0 2 4 6 8 10 12 14 16 18
GD
P gr
owth
(ann
ual a
vera
ge, %
)
Growth in export of goods and services (annual average, %)
Asia
20% 420% 20% 420%
Non-Asia
Australia
Bangladesh
India
Indonesia
PRC
Japan
Pakistan
Nepal
New Zealand
Philippines
Sri Lanka
Papua New Guinea
Republic of KoreaSingapore
Hong Kong, China
Fiji
MalaysiaTaipei,China
Thailand
GDP = gross domestic product, PRC = People’s Republic of China.Bubble size: Population (2017)Color gradient: Trade/GDP (2017)Notes: GDP and exports of goods and services are in constant national 2011 prices. Trade-to-GDP ratio is based on nominal values. Trade refers to exports plus imports of goods and services.Source: Feenstra, R. C., R. Inklaar, and M. P. Timmer. 2015. The Next Generation of the Penn world Table. American Economic Review. 105 (10). pp. 3150–3182. http://www.ggdc.net/pwt.

TRADe, FOReIGN DIReCT INVeSTMeNT, AND OPeNNeSS | 303
the ratio of exports plus imports to GDP in 2017), had faster economic growth in general over the past decades. Third, countries such as the PRC and India, despite their large economic size, have a fairly high level of external openness which is associated with high economic and export growth rates.
Foreign direct investmentFDI inflows (in US dollars) to the region increased steadily, especially after the 1985 Plaza Accord, until disrupted by the 1997–1998 Asian financial crisis (Figure 9.5). Then the inflows recovered rapidly until the 2008–2009 global financial crisis, after which inflow growth remained stable. Overall, inward FDI to Asia increased from 10% of GDP in 1980 to 28% in 2017. Asia’s share of global FDI inflows likewise increased from 14% to 35%.
FDI inflows, along with tourism receipts and remittances, are now the major source of financial inflows to developing economies in the region (Chapter 7). Net portfolio investment is not large compared with these three sources. From the early official development assistance dominance as main external investment financier, the region dramatically embraced a greater openness toward FDI and other forms of financial inflows, with foreign businesses looking to reap huge benefits from FDI into Asia (Chapter 7).
Developing Asia became a natural destination for FDI because of (i) relatively low labor costs (particularly during initial phases of industrial development), (ii) an improving business climate, and (iii) large market size. Many Asian governments introduced policies on export promotion, current and capital account liberalization, SEZs, and tax incentives, all playing important roles in attracting FDI to developing Asia. Over the past few decades, the development of GVCs and regional production networks—motivated by cost reductions in outsourcing and advances in information and communication technology—were also behind rapid FDI growth.
Initially, agriculture and mining attracted most FDI, particularly in countries with abundant natural resources. Then FDI was focused on labor-intensive light industry. Liberalized FDI regulations, along with a gradually improved business environment, also spurred the acceleration of foreign capital inflows. Over time, FDI shifted toward heavy and high-technology manufacturing and services. As Asian incomes rose, its attractiveness as an FDI destination increasingly shifted toward the large and growing domestic consumption market.

304 | ASIA’S JOURNeY TO PROSPeRITY—CHAPTeR 9
In 2017, Hong Kong, China; the PRC; and Singapore remained Asia’s top FDI recipients (Figure 9.6). As a percentage of GDP, FDI was highest in the more open smaller economies, particularly Hong Kong, China (30.6%) and Singapore (19.1%). Other Asian economies—such as Cambodia, Georgia, the Lao People’s Democratic Republic, Maldives, Mongolia, and Palau—also tend to rely heavily on FDI, with FDI inflows accounting for around 10% of GDP (Figure 9.6).
Firm-level data suggest that, historically, greenfield investments were the dominant mode of entry for multinationals investing in Asia, accounting for an annual average of 65% of total investments in 2003–2017.10 Mergers and acquisitions increased rapidly in recent years, with its share of total investments more than tripling from 13% in 2003 to 48% in 2017. In terms of sectors, greenfield FDI has been the more common mode of entry in manufacturing and primary sectors since
10 ADB estimates; Financial Times. fDi Markets. https://www.fdimarkets.com (accessed 1 April 2019); and Bureau van Dijk. Zephyr M&A Database. https://www.bvdinfo.com (accessed 1 April 2019).
Figure 9.5: asia’s Foreign Direct investment inflows and outflows
0
5
10
15
20
25
30
35
40
0
100
200
300
400
500
600
1970 1975 1980 1985 1990 1995 2000 2005 2010 2015 2016 2017
$ bi
llion
Inflow (left) Outflow (left)
Inflow, % of world total (right) Outflow, % of world total (right)
Note: Asia refers to the 49 Asian Development Bank regional members for which data are available.Sources: Asian Development Bank estimates; and United Nations Conference on Trade and Development. UNCTAD Statistics. https://unctadstat.unctad.org (accessed 30 August 2019).

TRADe, FOReIGN DIReCT INVeSTMeNT, AND OPeNNeSS | 305
the early 2000s, while mergers and acquisitions gradually became prominent in business and financial services as well as transportation and communications.
Traditionally, most FDI to Asia came from Japan and advanced countries in Europe and North America (Figure 9.7). In more recent years, however, emerging Asian economies, in particular Hong Kong, China; the PRC; the ROK; and Singapore, have rapidly become important sources of FDI to Asia. In fact, intraregional FDI currently accounts for more than 45% of developing Asia’s FDI inflows.11 In 2017, East Asia accounted for the largest share of intraregional FDI (receiving 56.1%), followed by Southeast Asia (27.2%). Closer trade linkages within the region are also backed by steadily growing intraregional FDI, particularly from Japan, the PRC, and the ROK to the rest of Asia—especially ASEAN. Many investments target local or regional markets. A fast-growing middle class and strong purchasing power makes the ASEAN market a favorite. Increasingly, goods and
11 Fifty percent including Australia, Japan, and New Zealand.
Figure 9.6: Top 10 asian Foreign Direct investment Recipients
0 50 100 150
Malaysia
Japan
Viet Nam
Republic of Korea
Indonesia
India
Australia
Singapore
Hong Kong, China
PRC
FDI Inflow in 2017 ($ billion) FDI Inflow in 2017 (% of GDP)
0 10 20 30 40
Azerbaijan
Fiji
Palau
Lao PDR
Maldives
Georgia
Cambodia
Mongolia
Singapore
Hong Kong, China
FDI = foreign direct investment, lao PDR = lao People’s Democratic Republic, PRC = People’s Republic of China.Sources: Asian Development Bank estimates; and United Nations Conference on Trade and Development. UNCTAD Statistics (UNCTADSTAT). https://unctadstat.unctad.org (accessed 30 August 2019).

306 | ASIA’S JOURNeY TO PROSPeRITY—CHAPTeR 9
products produced by firms of these investing countries are produced and marketed within ASEAN, instead of being imported to ASEAN.12 This partly explains why Japan’s share of total ASEAN trade is declining.
Hong Kong, China is now the largest investor in Asia, both globally and regionally. It accounted for around 18% of Asia’s total FDI inflows in 2017, with greenfield investments mostly going to real estate, financial services, and hotels and tourism (Figure 9.7).13 The US—currently the second-largest investor in Asia—used to be the top investor with a share of around 20% of Asia’s total FDI inflows in 2001. It was overtaken by Hong Kong, China starting in 2008. By 2017, the US share of Asia’s FDI inflows more than halved to less than 10%. Japan used to be a large FDI investor, especially after the substantial yen appreciation following the 1985 Plaza Accord. It invested heavily
12 ADB. 2014. Asian Economic Integration Monitor. Manila. 13 However, considering that a significant portion of Hong Kong, China-sourced FDI to
the PRC are investments by the PRC residents round-tripping through Hong Kong, China, the FDI share of Hong Kong, China in Asia, excluding the PRC, drops to 3%.
Figure 9.7: Top global investors into asia ($ billion)
3.7
5.6
5.7
8.2
9.6
10.0
10.8
15.9
16.5
28.2
Germany
Taipei,China
Singapore
Myanmar
Netherlands
People’s Republicof China
Japan
British Virgin Islands
Hong Kong, China
United States
2001 2010 2017
7.8
11.2
11.4
11.9
21.4
23.0
29.2
42.7
45.6
65.5
Netherlands
Mauritius
Republic of Korea
United Kingdom
United States
Singapore
Japan
British Virgin Islands
People’s Republicof China
Hong Kong, China
11.7
17.3
27.5
31.8
31.9
44.7
45.9
47.2
50.1
106.1
Republic of Korea
Mauritius
Cayman Islands
Netherlands
Japan
People’s Republicof China
Singapore
British Virgin Islands
United States
Hong Kong, China
Source: Asian Development Bank, Asia Regional Integration Center. Integration Indicators. https://aric.adb.org/integrationindicators (accessed 30 August 2019).

TRADe, FOReIGN DIReCT INVeSTMeNT, AND OPeNNeSS | 307
in ASEAN, particularly Singapore and Thailand, as well as Australia in real estate, oil and natural gas, automotive industries, and electronics. Other key regional investors in Asia are the PRC and Singapore. The bulk of Singapore’s FDI went to the ASEAN real estate sector. The PRC’s FDI mostly went to East Asia and ASEAN in metals, petroleum, and plastics.
More recently, Asia also strengthened its presence as a major global outward FDI investor. Asian countries are accumulating more domestic savings, augmenting supply-chain networks, and becoming important producers of new business models and technologies.
Table 9.1: Top global investors ($ billion)
economy 1970 economy 1980 economy 1990United StatesUnited KingdomNetherlandsGermanyCanadaFranceJapanSwedenBelgiumItaly
7.6 1.7 1.3 1.1
0.9 0.4 0.4 0.2 0.2 0.1
United StatesUnited KingdomNetherlandsGermanyCanadaFranceJapanSouth AfricaItalySweden
19.2 7.9 4.8 4.7 4.1 3.1 2.4 0.8 0.7 0.6
JapanFranceUnited StatesGermanyUnited KingdomSwedenNetherlandsItalySwitzerlandBelgium
50.8 38.3 31.0
24.2 17.9 14.7 14.4
7.6 7.2 6.3
economy 2001 economy 2010 economy 2017United StatesBelgiumUnited KingdomFranceNetherlandsGermanyJapanCanadaSpainBritish Virgin
Islands
124.9100.6
57.252.850.639.938.336.033.130.1
United StatesGermanyHong Kong,
ChinaSwitzerlandPRCNetherlandsJapanBritish Virgin
IslandsFranceUnited Kingdom
277.8 125.5 86.2
86.2 68.8 68.4 56.3 56.2
48.2 48.1
United StatesJapanPRCUnited KingdomGermanyHong Kong,
ChinaCanadaBritish Virgin
IslandsSingaporeFrance
300.4 160.4 158.3 117.5 91.8 86.7
79.8 54.7
43.7 41.3
PRC = People’s Republic of China. Source: United Nations Conference on Trade and Development. UNCTAD Statistics. https://unctadstat.unctad.org (accessed 30 August 2019).

308 | ASIA’S JOURNeY TO PROSPeRITY—CHAPTeR 9
The region’s global FDI outflows increased from a mere $0.5 billion in 1970 to $540 billion in 2017, with its share of global FDI outflows growing from just 3% to 38%. Historically, Japan has been Asia’s largest outward investor, and in 2017 was the second largest globally after the US (Table 9.1). Outward FDI by firms from developing Asia also grew rapidly in recent years. The PRC’s outward investment has increased steadily since 2004, primarily going to Egypt, India, Indonesia, and the US—mostly in real estate; coal, oil, and gas; and metals. India’s outward FDI grew in recent years—mostly in coal, oil, and gas; renewable energy; and rubber. Indonesia and Thailand also increased outward investments in areas such as food products, real estate, and retail within and outside Asia, including Europe.
Development impact of openness
Asia’s outstanding growth in trade and FDI inflows had a significant impact on development in the region. Its experience provides strong empirical evidence that greater openness helps spur economic and productivity growth through gains from trade, learning effects, and the exploitation of economies of scale. In addition to a well-established positive relationship between trade openness and economic growth (Figure 9.4),14 FDI inflows helped the region’s countries grow by helping firms overcome growth constraints such as lack of management skills and access to finance.
There is also a large and growing body of empirical evidence that suggests greater openness helps reduce poverty in the region. As economic growth promotes overall poverty reduction, trade and FDI helped reduce poverty directly by generating employment and indirectly by enhancing overall economic development.
For a positive relationship between greater openness and development to materialize, Asia’s experience appears to show it is critical that countries ensure other basic conditions are in place—such as the quality of human capital and infrastructure, the level of financial and institutional development, the quality of governance, and macroeconomic stability.
14 Dollar, D. 1992. Outward-Oriented Developing Economies Really Do Grow More Rapidly: Evidence from 95 LDCs, 1976–1985. Economic Development and Cultural Change. 40 (3). pp. 523–544; Sachs, J. D., and A. Warner. 1995. Economic Reform and the Process of Global Integration. Brookings Papers on Economic Activity, 25th Anniversary Issue. 1 (January). pp. 1–18; and Edwards, S. 1998. Openness, Productivity and Growth: What Do We Really Know? The Economic Journal. 108 (447). pp. 383–398.

TRADe, FOReIGN DIReCT INVeSTMeNT, AND OPeNNeSS | 309
9.3 evolution of trade and foreign direct investment policies in asia
What allowed Asia to grow fast was in part the evolution of trade and FDI policies in the region. Policies did not change overnight. They changed gradually over the years (and sometimes decades). Experimentation often preceded changes in overarching policy frameworks. The changes were promoted by critical thinking, performance evaluation, pragmatism, and competition with neighbors. As mentioned in the introduction of this chapter, since the end of World War II, Asian economies generally have passed through three stages of international economic regimes: (i) post-independence self-reliance import substitution, (ii) outward orientation, and (iii) deepening GVCs and regional trade agreements. The development thinking and diverse country experiences are already discussed in Chapter 2. The following discussion focuses on the evolution of thinking and policy regimes regarding trade and FDI.
Import substitution
The first stage included import substitution industrialization policies. After many Asian countries gained political independence in the late 1940s and 1950s, the vast majority adopted a strategy of import substitution to create a domestic industrial base (Chapter 2). These policies were widely used in the 1950s and 1960s, and they persisted in several developing Asian economies in some form until the 1980s.
There was a nationalistic element in favoring these strategies. Before independence, many countries traded mostly bilaterally with their colonial powers, exporting commodities, raw materials, and some processed agricultural products in return for some manufactured consumer products and needed capital equipment. The sentiment following independence was to create self-reliance and develop a domestic industrial base to leave the past behind. There was also a socialist or communist idea, which emphasized state-led industrialization.
There was general pessimism about the high reliance on the export of primary goods in the 1950s, justified by the Prebisch–Singer hypothesis based on “center–periphery” or dependency theory, which argues long-run terms-of-trade deterioration of primary products (decreasing relative prices of agriculture and mining compared to industrial goods). As such, import substitution strategies were

310 | ASIA’S JOURNeY TO PROSPeRITY—CHAPTeR 9
advocated to spur industrialization, reduce dependency on external inputs, develop local industries, save on scarce foreign exchange, and insulate the economy from adverse terms of trade.
Import substitution strategies and policies were marked by high and complicated tariffs and taxes on imports. Protection for infant industries was a fundamental tool in allowing local industry to develop. The widespread and discretionary use of prohibitions and quantitative restrictions on imports were adopted to secure domestic markets for industrialization. At the same time, authorities provided preferential, often duty-free, imports of the capital and intermediate goods needed to produce import-substituting goods domestically. The exchange rate was kept overvalued. To assuage nationalist sentiment and help control competitive interference, several monopolies on imports and exports were created—mostly state owned. In tandem, there were restrictions on FDI—whether on commodity extraction, agricultural processing, or manufacturing—and on foreign exchange transactions (under the Bretton Woods system of mostly pegged exchange rates). Hence, exports were discouraged including through overvalued exchange rates.
While the “infant industry protection” argument was taken as a theoretical rationale for import substitution strategies, those that adopted these policies—such as Latin American countries and India—were plagued by poor economic results.15 Although the strategy was intended to reduce reliance on external inputs, countries still needed to import raw materials and capital equipment for domestic production. Meanwhile, trade protection, lack of competition in domestic and global markets, and artificially overvalued exchange rates made these economies inefficient. As a result, export receipts and foreign currency were rarely sufficient to purchase the imports the domestic economy needed.
This triggered periodic balance of payments crises in several countries, even in some with large commodity exports. Protectionism, combined with small-scale production due to limited domestic markets, left the economy’s overall productivity low, with high unit costs and no pressure to upgrade technology or innovate.16
15 Little, I., T. Scitovsky, and I. M. Scott. 1970. Industry and Trade in Some Developing Countries: A Comparative Study. London, New York, Toronto: Oxford University Press.
16 McCawley, P. 2017. Banking on the Future of Asia and the Pacific: 50 Years of the Asian Development Bank. Manila: Asian Development Bank.

TRADe, FOReIGN DIReCT INVeSTMeNT, AND OPeNNeSS | 311
Protection of certain industries created incentives and opportunities for unproductive rent-seeking and corruption. All these factors made it apparent that, in the end, the import substitution strategy failed to spur either industrialization or rapid economic growth.
Outward-oriented policies
The trend toward import substitution was relatively short-lived across much of Asia compared with Latin America and other regions. From early on, Japan (which adopted restrictive import policies due to severe foreign exchange constraints during the recovery period after the war) and the NIEs moved away from import substitution toward outward-oriented and market-friendly policies. The apparent failure of import substitution strategies to achieve its goals in Latin America and some Asian countries provided the impetus for Asia’s second evolutionary stage. Using the NIEs model, many developing economies in Asia began adopting outward-oriented policies. Several economies quickly saw that exports held an important advantage as a means of accelerating growth while bringing in needed foreign exchange.
Instruments used to promote exports included foreign exchange allocations for necessary inputs, subsidies, tax incentives, favorable access to credit, and the establishment of export-promotion agencies. Some countries maintained undervalued exchange rates to increase export competitiveness. These export-promotion policies aimed at shifting to a more viable path toward industrialization, which would be based on the access to large external markets, and earning sufficient foreign exchange to increase import of natural resources, capital goods, and intermediate inputs. As these policies contributed to increasing both exports and imports, they should be called “outward-oriented policies” rather than export-oriented policies.
These policies were particularly important for economies with small domestic markets, or those that lacked a natural resource base (aside from agriculture) and thus could not produce much without importing raw materials and technology. In some countries, the key element of these outward-oriented policies was “performance-based” selective support for firms and/or industries that were potentially competitive internationally.
It is worth highlighting the diversity in country experience. Although most economies in Asia (with the exception of Hong Kong, China) embraced import substitution strategies, the duration

312 | ASIA’S JOURNeY TO PROSPeRITY—CHAPTeR 9
and strength of these policies differed from economy to economy. For instance, India and the Philippines had very strong and extensive import substitution policies between the 1950s and 1980s. By contrast, Taipei,China’s import substitution policies were in place for less than a decade (in the 1950s), and they were fairly moderate compared with those in the Philippines. Mongolia, the PRC, Viet Nam, and the former Soviet economies in Central Asia initially undertook industrialization policies with strong inward orientation to achieve domestic production of not only consumer goods, but also capital goods and industrial materials.
Export orientation also involved different starting points and speeds, with some developing Asian economies approaching the reform process cautiously. The ROK; Singapore; and Taipei,China tilted toward outward-oriented policies in the 1960s. By the 1970s and 1980s, the larger ASEAN members began emulating the export-led model to achieve rapid growth and industrialization.
In South Asia, India embarked on market-oriented reforms with trade liberalization in 1991. Sri Lanka’s trade policies vacillated between open and restrictive from the time it gained independence until 1997, when restrictions were abandoned. In Central Asia, reforms began in the early 1990s after the dissolution of the Soviet Union and abandonment of centrally planned economies.
The policy mix adopted during the transition also differed, but in many countries, export-promotion policies were adopted while maintaining import substitution policies in some sectors. The shift toward export promotion did not mean the immediate dismantling of import protection. In East Asia and Southeast Asia, while tariff barriers remained in place for the economy in general, exporters were given access to inputs and capital goods at world market prices. Similarly, India’s reforms initially focused on liberalizing capital inputs for industrial expansion with a more regulated approach to importing consumer goods.
SEZs were an important part of outward-oriented policies in Southeast Asia and the PRC. They are specifically designed to promote commercial export products (Box 9.1). These SEZs, insulated from the rest of the economy, allowed authorities to test whether their export-led strategies—based on incentives and a liberal regulatory environment—could work.

TRADe, FOReIGN DIReCT INVeSTMeNT, AND OPeNNeSS | 313
box 9.1: asia’s experiment with special economic Zones
A special economic zone (SeZ) is a geographic area within a country’s national boundaries where taxation, regulations regarding investment and labor, and other rules and laws are more preferential to businesses than those in the rest of the country. SeZs are often used for attracting companies that import input from abroad, assemble products, and then export them to other countries.
The very first SeZ was established in New York in 1937 with the passing of the Free Trade Zone Act by the United States Congress in 1934. Puerto Rico was the second (in 1942) in an effort to industrialize the territory by luring in United States firms. A steady trickle of new zones appeared beginning in 1959 with the Shannon Free Zone in Ireland and others mostly in western europe amid the industrial revival after world war II. In the developing world, India was arguably the first, creating a processing zone at Kandla Port in 1965. Taipei,China’s Kaohsiung Harbor was set up in 1966.
In Asia, SeZs began as a means to test new trade and foreign direct investment (FDI) policies in isolation from the general economy. In some cases, over time they became a major engine for national development through backward and forward linkages that accelerated national structural transformation. Several success stories demonstrate the effective use of SeZs as policy tools to increase employment and exports, attract FDI, and accelerate economic growth. SeZs are often supported by factors such as skills upgrading, access to infrastructure, and favorable location, among others.
The Republic of Korea and Taipei,China began using SeZs in the 1960s to drive economic development, transitioning from labor-intensive to skill- and technology-intensive production over time. The People’s Republic of China officially launched SeZs in 1980 in Shenzhen, xiamen, Shantou, and Zhuhai. By 2007, SeZs (including all types of industrial parks and zones) in the People’s Republic of China accounted for about 22% of gross domestic product, 46% of FDI, 60% of exports, and generated more than 30 million jobs. Malaysia, Singapore, Thailand, and Viet Nam also succeeded in developing automobile and electronics industries through SeZs.Source: Asian Development Bank. 2015. Asian Economic Integration Report 2015. Manila.

314 | ASIA’S JOURNeY TO PROSPeRITY—CHAPTeR 9
Beginning in the 1980s, more and more developing countries began embarking on reforms that both promoted exports and reduced barriers to imports. In several countries, balance of payments vulnerabilities led to large stabilization and adjustment programs, funded primarily by the International Monetary Fund (IMF) and the World Bank. These also played a role in liberalizing trade regimes. Unilateral reforms were undertaken, many based on the objective to join the General Agreement on Tariffs and Trade (GATT)—and accession to the WTO, which was founded in 1995.
In addition to broader trade liberalization, developing countries also began embracing policies that improved the investment climate to attract FDI and multinational corporations (MNCs). As with trade, most Asian economies initially pursued highly restrictive policies toward FDI. While several countries with large, valuable resource-based industries—Indonesia, for example—developed joint ventures and production-sharing contracts as early as the late 1960s and 1970s, it was outward-oriented trade reforms that paved the way for the eventual easing of FDI restrictions.
Hong Kong, China and the ASEAN4—Indonesia, Malaysia, the Philippines, and Thailand—were the first Asian economies to begin liberalizing FDI, initially in a bid to attract foreign investment from Japan. But it was the 1985 Plaza Accord that played a huge role in accelerating the process.17 The sharp appreciation of the yen induced massive flows of Japanese outward investment, especially into Asian economies. The NIEs and the ASEAN4 responded by liberalizing their FDI regimes.18 Restrictions on FDI continued to decline as competition for investments increased and regional production networks began to blossom throughout the region.
Investment incentives eventually became standard in most Asian economies, coming in four types: (i) fiscal (such as tax holidays and reduced corporate tax rates), (ii) financial (preferential credit
17 The Plaza Accord was an agreement between France, Germany, Japan, the US, and the United Kingdom to intervene in exchange rates by depreciating the US dollar relative to the Japanese yen and German deutsche mark. Its purpose was to correct trade imbalances between the US and Japan (and between the US and Germany). While it did not affect the Japan–US trade imbalance much, the sharp yen appreciation did induce large flows of new outward investment.
18 Chia, S. Y. 2010. Trade and Investment Policies and Regional Economic Integration in East Asia. ADBI Working Paper Series. No. 210. Tokyo: Asian Development Bank Institute; and McCawley, P. 2017. Banking on the Future of Asia and the Pacific: 50 Years of the Asian Development Bank. Manila: Asian Development Bank.

TRADe, FOReIGN DIReCT INVeSTMeNT, AND OPeNNeSS | 315
and loan guarantees, among others), (iii) regulatory (exemptions from certain laws or regulations), or (iv) technical/business support. Over time, more developing countries began pursuing a much broader reform agenda aimed at reforming the overall investment climate. FDI spurred further economic growth through capital accumulation, and the incorporation of new inputs and foreign technologies in the production process.
9.4 emergence of global value chains
The surge of FDI inflows in Asia enabled Asian trade to transform from interindustry trade to intra-industry trade. Accordingly, most Asian economies entered GVCs. This was the third evolutionary stage of Asia’s international economic policy regime. It also underpinned the growing connectivity and economic interdependence within the region.
GVCs were driven by a steady decline in cross-border transportation costs due to liberalized trade, and advances in transport and logistics—including containerization and improvements in the design of large container vessels, a virtual revolution in air transport, and modern communication technologies. Enhanced infrastructure connectivity allowed the seamless flow of intermediate goods trade (Figure 9.8). These helped create increasingly complex, yet cost-effective, production networks. Also, expanding economies of scale and scope in mass production as well as rapid progress in standardized processes—spurred by “compartmentalization and modularization” of production flows—prompted the pervasion of GVCs globally. Homogenization of consumer tastes borne out of an ever-expanding middle class also promoted GVCs.
The GVCs that formed in the wake of the “second unbundling”19 offered opportunities for early movers to consolidate supplier relationships within the value chain. According to Richard Baldwin, the steam revolution drove a “first unbundling,” as railroads and steamships enabled the spatial separation of production and consumption. Since the 1990s, the information and communication technology revolution has fostered a geographical dispersion of production stages through the “second unbundling.” In the second unbundling, modularization of production in GVCs helped divide the production process into stages that could take place in
19 Baldwin, R. 2016. The Great Convergence: Information Technology and the New Globalization. Cambridge, MA: Belknap Press of Harvard University Press.

316 | ASIA’S JOURNeY TO PROSPeRITY—CHAPTeR 9
different locations. Meanwhile, the “third unbundling” refers to the geographical separation between labor and labor services enabled by digital technologies for “telepresence” and “telerobotics.” According to Baldwin, for the first time, globalization will mostly affect the services sector. The third unbundling can also include manufacturing GVC, through the combination of internet and robotics. For example, “Japanese engineers could repair Japanese-made capital equipment in South Africa by controlling sophisticated robots from Tokyo.”
Figure 9.8: share of asia’s intermediate goods Trade (%)
0
35
40
45
50
55
60
65
1980 1983 1986 1989 1992 1995 1998 2001 2004 2007 2010 2013 2017
Asia to Asia (% of Asia’s intraregional trade)Asia to World (% of Asia’s total trade)
Notes: Asia includes Afghanistan; Australia; Bangladesh; Bhutan; Brunei Darussalam; Cambodia; the Cook Islands; Fiji; Hong Kong, China; India; Indonesia; Japan; Kiribati; the lao People’s Democratic Republic; Malaysia; Maldives; Mongolia; Myanmar; Nauru; Nepal; New Zealand; Pakistan; Papua New Guinea; the People’s Republic of China; the Philippines; the Republic of Korea; Samoa; Singapore; Solomon Islands; Sri lanka; Taipei,China; Thailand; Timor-leste; Tonga; Tuvalu; Vanuatu; and Viet Nam. Concordance between Standard International Trade Classification (SITC) revision 2 and Broad economic Categories was used to define intermediate goods. Trade refers to the sum of exports and imports.Sources: Asian Development Bank estimates; and Growth lab at Harvard University. Atlas of economic Complexity Database. http://atlas.cid.harvard.edu/about-data/goods-data (accessed 30 August 2019).

TRADe, FOReIGN DIReCT INVeSTMeNT, AND OPeNNeSS | 317
GVC progress in Asia and around the globe went hand in hand with the increased capacity of MNCs to manage production, sourcing, product integration, and logistics across multiple locations.20 MNCs had two main, possibly overlapping, market motivations. First, MNCs relocated parts of the production process where costs were lower for reexporting intermediate and/or final goods—either to their home countries (vertical FDI) or third countries (export-platform FDI). Second, they set up affiliates in a foreign country to serve the domestic market as a substitute for exports (horizontal or market-seeking FDI), replicating the production process to avoid trade costs. In either case, MNCs played a key role in transferring frontier technologies and new business models which, in turn, promoted further GVC development (Chapter 5).
Evolving patterns of a particular economy’s participation in GVCs are also apparent in the transformation from the “flying geese” model of dynamic interindustry trade to Asia’s more complex intra-industry trade (Box 9.2). Today, the shape of Asian economic trade relations is more like networks than flying geese.
In Asia, in terms of sectors, manufacturing attracts those MNCs engaged in GVCs: almost 70% of affiliates belonging to foreign manufacturer parents engage in international trade. The semiconductor and related device manufacturing sector attracts the most GVC–FDI in Asia as a share of affiliates (Table 9.2). GVC expansion continues to benefit from the very low average tariffs applied across industry sectors using WTO most-favored nation rates—as well as preferential tariff rates under various regional and bilateral free trade agreements (FTAs).
How fast GVCs expand depends on how open markets become. Before a final product or service is shipped, intermediate goods, as well as services, cross borders multiple times. While GVCs offer substantive efficiency gains, they cannot thrive without open markets. Rising trade barriers due to intense trade tensions could cause material harm to the global production networks, undermining production efficiency and economic gains for GVC-participating countries.
20 WTO. 2008. Trade, the Location of Production and the Industrial Organization of Firms. World Trade Report 2008. Geneva; and Hummels, D. 2007. Transportation Costs and International Trade in the Second Era of Globalization. Journal of Economic Perspectives. 21 (3). pp. 131–154.

318 | ASIA’S JOURNeY TO PROSPeRITY—CHAPTeR 9
box 9.2: From Flying geese to global Value Chains
Over the past 50 years, many believed Asia’s development pattern evolved—and continues to evolve—from the so-called “flying geese” model that became popular in the 1960s.a The model proposes that certain industries and production centers will shift from a front-runner—in Asia’s case, Japan—to others that have the early economic, financial, and industrial wherewithal to attract new industries and engage in higher value-added trade. It is an encompassing view of technological convergence, trade, and foreign direct investment in a way that dynamically creates new comparative advantage. The common example is Asia’s “four tigers”—Hong Kong, China; the Republic of Korea; Singapore; and Taipei,China—also known as Asia’s newly industrialized economies. The flock grows as technology advances and spreads.b
The original flying geese analogy came from Akamatsu’s study of a sequential development pattern, mostly among today’s developed countries. He developed his idea as early as 1935 and wrote an english-language paper in 1961. According to his study, increasing imports lead to new domestic production, which, over time, naturally leads to export promotion. This sequence thus moves beyond the process of import substitution—where “infant” industries are given protection—and, ultimately, leading to export-led growth.
Akamatsu’s second flying geese pattern includes a sequence of structural changes on how industries develop. It starts with the production of consumer goods evolving into capital goods, and it also involves a progression from basic and simple labor-intensive goods to more complex and refined capital-intensive products.
The third flying geese analogy refers to the continuous relocation of industries from developed to developing countries. By trading with and attracting investment from the former, the latter can upgrade industries continuously. During this catching-up process of industrial production, less-developed economies can absorb knowledge and technology, which reinforces the catching-up process further.
while the flying geese model is powerful, especially in explaining the dynamic pattern of interindustry trade in Asia, the region began engaging in more intra-industry trade. Over the past decades, the intercountry development model has become more complex and dynamic, as regional and global value chains proliferated, with different economies sharing parts of production processes.a Akamatsu, K. 1961. A Theory of Unbalanced Growth in the world economy. Weltwirtschaftliches
Archiv. 86 (January). pp. 196–217.b Kojima, K. 2000. The “Flying Geese” Model of Asian economic Development: Origin, Theoretical
extensions, and Regional Policy Implications. Journal of Asian Economics. 11 (4). pp. 375–401.Source: Vandana, C., J. Yifu lin, and Y. wang. 2013. leading Dragon Phenomenon: New Opportunities for Catch-Up in low-Income Countries. Asian Development Review. 30 (1). pp. 52–84.

TRADe, FOReIGN DIReCT INVeSTMeNT, AND OPeNNeSS | 319
9.5 growing importance of services trade
All Asian economies have undergone a marked structural transformation over the past 50 years. While the pace of structural transformation varied across countries, there was a clear shift toward manufacturing and, more recently, toward services. The services sector contributes about 60% of the region’s economic activity and employs almost half its labor force (Chapter 3).
Table 9.2: Top Manufacturing sectors of Foreign affiliates engaging in Trade in asia, 2015
affiliated industrynumber of affiliates
number of affiliates
That export and import
share of affiliates
That export and import
(%)
Semiconductor and related device manufacturing
1,275 694 54.4
Bare printed circuit board manufacturing
819 360 44.0
Other electronic component manufacturing
3,423 1,358 39.7
Motor and generator manufacturing
960 354 36.9
ethyl alcohol manufacturing 1,302 477 36.6
Nonferrous metal (except copper and aluminum) rolling, drawing, and extruding
806 286 35.5
Motor vehicle brake system manufacturing
5,760 1,925 33.4
Motor vehicle air-conditioning manufacturing
858 270 31.5
Plastics material and resin manufacturing
1,487 465 31.3
Textile bag mills 924 275 29.8
Source: Asian Development Bank (ADB) estimates based on data from ADB. 2016. Asian Economic Integration Report 2016: What Drives Foreign Direct Investment in Asia and the Pacific? Manila.

320 | ASIA’S JOURNeY TO PROSPeRITY—CHAPTeR 9
More recently, services are increasingly traded as a part of GVCs. The share of services involved in manufacturing value added in Asia varies across countries. Regionally, it has reached 43%.21
While this share remains below the Organisation for Economic Co-operation and Development average, increasingly more complex tasks, such as research and development, are contracted to outside providers from manufacturers (Chapter 3). Indeed, more services enter the manufacturing process as intermediate inputs. For example, automobile companies increasingly outsource engineering services, logistics, and back-office operations to third-party providers. And as production is organized in regional and global value chains, services are increasingly traded. Exports of commercial services amounted to $515 billion in 2005 and more than doubled to $1,325 billion in 2017—despite the impact of the 2008–2009 global financial crisis (Figure 9.9). Continued regional integration in Asia, combined with advances in
21 Mercer-Blackman, V., and C. Ablaza. 2019. The Servicification of Manufacturing in Asia — A Conceptual Framework. In Helble, M., and B. Shepherd, eds. Leveraging Services for Development: Prospects and Policies. Tokyo: Asian Development Bank Institute.
Figure 9.9: growth in asia’s exports of goods, services, and Travel, 2005–2017
0
50
100
150
200
250
300
2005 2006 2007 2008 2009 2010 2011 2012 2013 2014 2015 2016 2017
2005
=100
Commercial Services Travel Total Merchandise
Sources: Asian Development Bank estimates; and world Trade Organization (wTO). 2018. wTO Online Database. data.wto.org (accessed 15 May 2019).

TRADe, FOReIGN DIReCT INVeSTMeNT, AND OPeNNeSS | 321
technology such as the introduction of 5G networks, will further help expand trade in services within GVCs and offer new opportunities.
Despite this strong growth, services remain a relatively small fraction of total trade. In 2017, Asia’s services export share was just 17.2% of total exports. One of the WTO’s priorities when it was created in 1995 was liberalizing services trade. However, little progress has been made since then. In contrast, an increasing number of Asian FTAs cover services, but further opening is needed to fully reap the benefits of increased services trade.
9.6 global and regional trade arrangements
GATT became effective in 1948 as an international legal agreement to reduce tariff and other trade barriers substantially. Over the following decades, many Asian countries became members of GATT and its succeeding organization, WTO (established in 1995), embracing the global trade liberalization regime (Figure 9.10). The Uruguay Round Agreements Act in 1994 set a new stage for Asia’s trade and investment policies. In accordance with the GATT and WTO rules governing tariffs, local content requirements for exports, and discriminative direct trade support including export subsidies, Asian policies shifted over time to more market-friendly support such as for research and development.
As globalization expanded in the 1990s, Asian economies became actively involved in a variety of regional trade arrangements. Broadly speaking, preferential trade arrangements (PTAs), such as free trade agreements (FTAs), have been used to strengthen cooperation in facilitating trade and investment. FTAs cover broad areas that serve as engines of trade creation, allowing them to function as “building blocks” rather than “stumbling blocks.” They could also continue to progress toward multilateralization.
The first wave of Asian FTAs that surged in the 1990s was mostly traditional. They largely emphasized trade in goods and focused on tariffs and other border measures that directly affected market access (Figure 9.11). The continued reduction of trade barriers in some parts of Asia through the GATT/WTO and FTAs—especially since the PRC joined the WTO in 2001—made East Asia and Southeast Asia, in particular, even more appealing to foreign investment.
Under the WTO framework, the Doha Round, which started in 2001, has not yet concluded. Given the slow progress in multilateral trade liberalization, Asia has shifted its focus more on FTAs. Asian

322 | ASIA’S JOURNeY TO PROSPeRITY—CHAPTeR 9
economies actively embraced bilateral FTAs, leading to a proliferation of bilateral agreements within the region and with the rest of the world—a domino effect.22 These new bilateral FTAs cover a broader range of liberalization (Figure 9.11).
By 2018, the number of Asian FTAs (signed and in effect) reached 151, of which 70 are intra-Asia FTAs and 81 with economies from outside the region. The multitude of FTAs has helped spur further economic liberalization as well as domestic structural reforms across the region. Sometimes, they created a proliferation of rules (such as
22 Baldwin, R. 1993. A Domino Theory of Regionalism. NBER Working Paper Series. No. w4465. Cambridge, MA: National Bureau of Economic Research.
Figure 9.10: asia’s World Trade organization accessions
prior to 1995 (original GATT
members)1995–2000 2001–2010 2011–present
Georgia (2000)Kyrgyz Republic (1998)Mongolia (1997)
Papua New Guinea (1994)Solomon Islands (1994)Brunei Darussalam (1993)Fiji (1993)Hong Kong, China (1986)Maldives (1983)Thailand (1982)Philippines (1979)Singapore (1973)Bangladesh (1972)Republic of Korea (1967)Malaysia (1957)Japan (1955)Indonesia (1950)Australia (1948)India (1948)Myanmar (1948)New Zealand (1948)Pakistan (1948)Sri Lanka (1948)
Viet Nam (2007)Tonga (2007)Cambodia (2004)Nepal (2004)Armenia (2003)Taipei,China (2002)PRC (2001)
Afghanistan (2016)Kazakhstan (2015)Lao PDR (2013)Tajikistan (2013)Vanuatu (2012)Samoa (2012)
GATT= General Agreement on Tariffs and Trade, lao PDR = lao People’s Democratic Republic, PRC = People’s Republic of China.Sources: world Trade Organization (wTO). WTO Accessions. https://www.wto.org/english/thewto_e/acc_e/acc_e.htm (accessed 9 November 2018); and world Trade Organization. GATT Members. https://www.wto.org/english/thewto_e/gattmem_e.htm (accessed 9 November 2018).

TRADe, FOReIGN DIReCT INVeSTMeNT, AND OPeNNeSS | 323
Figure 9.11: Content of Free Trade agreements in asia, 1992–2015
0
20
40
60
80
100
120
0
2
4
6
8
10
12
1992
1993
1994
1995
1996
1998
1999
2000
2001
2002
2003
2004
2005
2006
2007
2008
2009
2010
2011
2012
2013
2014
2015
Cum
ulat
ive
num
ber o
f fre
e tra
de a
gree
men
ts (F
TAs)
Num
ber o
f fre
e tra
de a
gree
men
ts (F
TAs)
, per
year
by g
roup
Group 1 Group 2 Group 3 Group 4
Cumulative (right axis)
Group 1 = FTAs that only have border policies. Group 2 = FTAs with less than five border policies and less than five behind-the-border policies. Group 3 = FTAs with five or more border policies and less than five behind-the-border policies. Group 4 = FTAs with five or more border policies and five or more behind-the-border policies. Notes:1. border policies cover tariff reductions in manufacturing and agriculture, anti-dumping,
countervailing measures, Agreement on Trade-Related Investment Measures, Agreement on Trade-Related Aspects of Intellectual Property Rights, customs, export taxes, sanitary and phytosanitary measures, technical barriers to trade, and the movement of capital.
2. behind-the-border policies cover state enterprises, state aid, competition policy, intellectual property rights, investment, public procurement, and the General Agreement on Trade in Services.
3. The categorization of border and behind-the-border policies is based on the methodology of Hofmann, C., A. Osnago, and M. Ruta. 2017. Horizontal Depth: A New Database on the Content of Preferential Trade Agreements. Policy Research Working Paper. No. wPS 7981. washington, DC: world Bank.
Source: world Bank. Content of Deep Trade Agreements. https://datacatalog.worldbank.org/dataset/content-deep-trade-agreements (accessed 4 June 2019).
324 | ASIA’S JOURNeY TO PROSPeRITY—CHAPTeR 9
technical standards and rules of origin) that companies must comply with, which is called the “noodle bowl” effect.
Asia is also intensifying efforts on trade facilitation, by incorporating provisions on customs clearance and technical regulations (including sanitary and phytosanitary measures) into FTAs. National single window systems have been widely adopted in the region to simplify administrative procedures and reduce trade costs for businesses, sometimes working with the World Customs Organization (WCO). The evolution into a subregional single window system as an integrated online platform is making good progress in ASEAN.
Asia is working toward more regional and super-regional arrangements. ASEAN countries launched the ASEAN Free Trade Agreement in 1992, the ASEAN Free Trade Area in 2003, and the ASEAN Economic Community in 2015 by gradually expanding coverage to include lowering barriers to services trade, reducing nontariff barriers, and harmonizing standards (Chapter 15).
Following the US withdrawal from the Trans-Pacific Partnership (TPP), the remaining 11 TPP members signed the Comprehensive and Progressive Agreement for Trans-Pacific Partnership (CPTPP) on 8 March 2018 in Chile. The CPTPP entered into force on 30 December 2018. Another “mega” trade deal, the Regional Comprehensive Economic Partnership (RCEP), remains under negotiation. The RCEP would cover the 10 ASEAN members and the 6 economies23 with existing FTAs with ASEAN. If finalized, the RCEP will be the largest FTA in the world, covering 30% of global GDP and more than 3.5 billion people.
9.7 looking ahead
Overall, by adopting market-oriented trade and investment policies, governments in the region encouraged firms to adjust to domestic and international market movements. Whether Asia will continue to reap the benefits of globalization depends on several future developments.
First, governments should continue to promote open trade and investment. Although nontariff measures, such as different rules and standards, can be justified with public policy objectives (for example, protecting public health and the environment), they may have potentially harmful effects on trade flows and undermine economic
23 Australia, India, Japan, New Zealand, the PRC, and the ROK.

TRADe, FOReIGN DIReCT INVeSTMeNT, AND OPeNNeSS | 325
efficiency. Governments should work toward lowering nontariff measures, harmonizing standards, and applying mutual recognition.
Second, further opening services trade can help improve the efficiency of service providers, enhance technological spillovers, and increase the competitiveness of the entire economy. As Asian economies increasingly rely on services, governments must think about how to incorporate them into their trade and growth strategies.
Third, governments need to continue helping small and medium-sized enterprises access international markets by improving regulations, easing access to finance, and supporting capacity building, among others. While small and medium-sized enterprises play a crucial role in economic growth and employment, their access to international trade and integration into global production networks remain below potential.
Fourth, governments must keep abreast with rapidly changing technologies and the Fourth Industrial Revolution—which is fundamentally changing how goods and services are produced, traded, and consumed, including through e-commerce and digital trade.
Finally, Asia’s governments should renew efforts to support the multilateral trading system. Under the growing challenges to existing global trade governance frameworks, concerted efforts by the international community to uphold the rules-based, multilateral system have become even more imperative.
