how does trade openness affect women’s job … · how does trade openness affect women’s job...
TRANSCRIPT

HOW DOES TRADE OPENNESS AFFECT WOMEN’S JOB
OPPORTUNITIES AND EARNINGS IN CAMEROON?
Simone Nadège ASSAH KUETE
Ministry of Trade, and University of Yaoundé II, Cameroon
Email: [email protected]
Belmondo TANANKEM VOUFO
Ministry of Economy, Planning and Regional Development, Cameroon
Email: [email protected]
Abstract
This study empirically assesses the relationship between increased openness to international
trade (resulting from trade liberalization) and changes in employment opportunities and
earnings for men and women in Cameroon. More specifically, the study aims to answer the
following two questions: (a) Does increased trade openness improve women’s employment
opportunities relative to those of men? and (b) What are the effects of increased trade
openness on the wage gender gap? The empirical analysis uses two sources produced by
Cameroon’s National Institute of Statistics: the 2005 and 2010 waves of the Employment and
Informal Sector Survey, and trade statistics from the Supply and Use Tables. The
methodology consists of: (a) comparing the evolution of trade indicators and women’s
employment shares in different sectors of the economy, and (b) estimating wage equations for
men and women, and then decomposing the wage gap in order to identify whether and how
exposure to trade can account for the component not explained by observable differences in
labour market characteristics. Three indicators were used to capture trade openness: import
penetration, export intensity, and trade share. The results show that openness to trade did not
lead to the expansion of exports in sectors where most women work, and seems not to have
increased women’s job opportunities. On the other hand, trade openness narrowed the gender
wage gap. The study concludes by proposing specific measures that should be implemented to
help women benefit from opportunities created by trade liberalization, and to head off threats
posed by trade liberalization to development and poverty alleviation. These measures should
take into consideration the important role played by the informal sector in Cameroon’s
economy.
Keywords: Trade openness, employment, gender wage gap, informal sector, Cameroon.
March 2016
The authors would like to thank David Zavaleta of the Universidad Católica Boliviana in Bolivia for his advice
and comments, and the Virtual Institute team for its feedback on this study. Financial support from the
government of Finland is also gratefully acknowledged.

2
1 Introduction
Over the past three decades, many developing countries have undertaken economic reforms
that included trade liberalization policies, and there has been growing interest in the gender
impact of these reforms. Indeed, trade policies, like any other economic policy, are likely to
have gender-differentiated effects because of women’s and men’s different access to and
control over resources, and because of their different roles in both the market economy and
households (Fontana, 2003).
In research on gender effects of trade policies, there has been a relatively large emphasis on
labour market outcomes. The impact of trade reforms and globalization on women’s relative
wages and employment opportunities has attracted particular attention. As highlighted by
Horton et al. (1991), the focus on the labour market is apposite, as it generally provides the
conduit through which reform policies affect a country’s standard of living.
Trade theory (Hecksher-Ohlin/Stolper-Samuelson) suggests that increased openness to
international trade in developing countries may provide new job opportunities in export-
oriented industries, especially for low-skilled female workers. Moreover, Black and Brainerd
(2004) argue that with increased competition in the local market due to a more open trade
regime, companies can no longer afford to discriminate against women by paying a premium
to male workers just because they are men – a result in line with Becker’s (1971) theory of
discrimination. However, trade liberalization may also bring about a deterioration of women’s
relative position in the labour market because in many developing countries women are
concentrated in only a few sectors of economic activities, have limited geographic mobility,
and have both labour market and household responsibilities that limit their availability to
work and hence their ability to accept a number of demanding, high-paying job opportunities.
Additionally, there has been a concern that women may lose out as export-oriented industries
advance to higher-value-added segments and become more skill-intensive over time.
These mixed theoretical predictions suggest that the effect of trade liberalization on women in
the labour market depends on the nature of the liberalization process and the structural
composition of the economy concerned, and hence remains largely an empirical question
(AlAzzawi, 2014).
In this context, the present study aims to contribute to the existing literature by examining the
relationship between increased openness to international trade (resulting from trade
liberalization) and the change in earnings and employment opportunities for men and women
in Cameroon, a country largely open to trade and for which this question has not been
previously researched. More specifically, the study aims to answer the following questions:
Does increased trade openness increase women’s employment opportunities relative to
those of men?
What are the effects of increased trade openness on gender wage gaps?
Cameroon started to liberalize its international trade in 1990. In the early 1990s, the country
increased its degree of international integration through numerous waves of deregulation,
reductions in tariffs, and elimination of import barriers. Cameroon’s trade liberalization policy
consists of three components: (a) reinforcement of regional and sub-regional integration; (b)
consolidation of trade with traditional partners; and (c) opening towards emerging countries.
The many trade agreements being negotiated or already implemented (such as the Economic

3
Partnership Agreement with the European Union, or trade agreements with Nigeria and
Morocco) will lead to an increase in trade openness of Cameroon.
Moreover, since 2010, Cameroon has been implementing its 10-year development plan
contained in the Growth and Employment Strategy Paper, which aims to promote strong
economic growth and create decent jobs, especially for vulnerable groups such as women and
youth (IMF, 2010). This strategy, which is gender-sensitive, insists on the inclusion of women
in all activities related to trade. It is therefore essential for the government to have an analysis
of the gender implications of trade openness.
There are at least two reasons why it is imperative to address gender inequality. First, gender
inequality matters intrinsically because the ability to live the life of one’s choosing and be
spared from absolute deprivation is a basic human right that should be available to everyone,
regardless of gender. Moreover, gender equality matters strategically, because greater equality
contributes to economic efficiency and the achievement of other key development outcomes
(World Bank, 2011: 3).
Second, as highlighted by Gamberoni and Reis (2011), gender inequality also matters and
needs to be addressed in the context of trade. Trade policies and initiatives that do not meet
the particular needs of women can aggravate existing inequalities and reverse previously
achieved gains. In addition, women typically devote a larger portion of their incomes than
men to the health and education of their families, thus enhancing human capital accumulation.
Therefore, addressing gender-specific constraints to trade can have multiplier effects on the
overall development impact.
Given that Cameroon has recently engaged in a major trade agreement with the European
Union (the Economic Partnership Agreement), a further objective of this study is to identify
possible complementary economic policy measures that may enhance the favourable effects
and offset the unfavorable effects of this agreement, as well as other agreements concluded by
the country, on gender disparities and ultimately household welfare.
The rest of the study is organized as follows. The next section reviews the main findings of
the recent literature on trade and gender. Section 3 presents the evolution of trade policies in
Cameroon, and provides a description of the main indicators of trade openness for the country
since the 1990s. Section 4 describes the evolution of the main indicators of gender gaps in
Cameroon’s labour market. Section 5 explains the empirical methodology and the data used in
the study, while Section 6 presents and discusses the results. Section 7 concludes and presents
some policy recommendations.
2 Literature review
2.1 Theoretical discussion
The theoretical framework guiding the empirical analysis of trade and gender is based on the
relative endowment theory of Hecksher-Ohlin-Stolper-Samuelson and on Becker’s (1971)
theory of discrimination. The Hecksher-Ohlin international trade theory looks at the impact of
trade liberalization on labour markets in developing countries versus developed countries via
relative factor prices, while Becker’s theory considers the effect of trade liberalization on
women’s employment relative to men’s via discrimination, and consequently the effect on
their wage gap.

4
According to the Hecksher-Ohlin-Stolper-Samuelson theory, following trade liberalization a
country specializes in the sector that uses a higher share of its relatively abundant production
factor. From that follows an increase in the demand for that factor, and consequently an
increase in its relative price. If women in developing countries (where less-skilled workers are
abundant) are relatively less skilled than men, they should gain from trade through increased
employment opportunities and higher relative wages, while women in developed countries
(where skilled labour is the abundant factor) should lose.
Moreover, according to Becker’s theory of discrimination, employers with market power are
better able to engage in discriminatory practices over longer periods of time than those in
competitive markets. Increased competition in the local market due to a more open trade
regime then reduces the incentive of firms to discriminate against women by paying a
premium to male workers just because they are men.
However, trade liberalization may also bring about a deterioration of women’s relative
position in the labour market if trade liberalization does not increase competition in the local
market. According to Darity and Williams (1985) and Williams (1987), opening to trade can
actually increase gender wage gaps in countries where female workers are segregated into
lower-paying and lower-status jobs, and where they may have less bargaining power.
2.2 Review of related empirical studies
This section provides a brief synthesis of the existing literature on the impact of trade
openness on women’s job opportunities and earnings. We first present cross-country
evidence, and then specific country evidence.
2.2.1 Cross-country evidence
Using the International Labour Organization’s (ILO) October Inquiry database,1 which covers
more than 80 countries for the period 1983–1999, Oostendorp (2009) analyses the impact of
globalization on the occupational gender wage gap. He finds that increased trade openness
and net inflows of foreign direct investment have a significantly narrowing impact on the
occupational gender wage gap for rich countries, but finds little evidence of such a narrowing
effect for poorer countries.
Using aggregated data for 35 developed and developing countries from 1960 to 1985, Wood
(1991) finds a strong relation between increased exports and increased female employment in
manufacturing in the developing countries. However, Wood finds no counterpart reduction in
the demand for female workers in developed countries.
Another study by Tejani and Millberg (2010), based on a sample of 60 high-income
developed countries and middle-income developing countries over the period 1985–2007,
finds that the relative employment of women in the manufacturing sector increased in
developing countries but decreased in high-income countries as a result of increased exports.
However, while Latin American countries continued to experience rising female intensity of
employment (because of the initial low levels of female intensity and slower industrial
upgrading in that region), most Southeast Asian and Pacific countries experienced a
1 The ILO October Inquiry (http://laborsta.ilo.org/applv8/data/labocte.html) is an annual worldwide survey of
wages and hours of work relating to 159 occupations in 49 industry groups, and of retail prices of 93 food items.

5
“defeminization” of employment (due to initial high levels of female intensity and rapid
industrial upgrading in the region).
Consequently, according to the cross-country studies, increased trade openness affects
women’s employment and earnings in different ways, depending on the income level of the
country, skills, and the economic sector.
2.2.2 Country-specific evidence
The literature on developed countries and advanced emerging economies has found mixed
results. For example, examining the effects of increased trade openness on the change in the
wage gap in the United States, Black and Brainerd (2004) find that increased competition
through imports improved women’s relative pay in previously-highly-concentrated industries,
but increased the wage gap in industries that were already competitive. Seguino (2000) and
Berik (2000) studied the effect of trade liberalization policies on gender inequality in the
Republic of Korea and Taiwan Province of China. While the first author reports that as a
consequence of trade liberalization, gender wage differentials widened in Taiwan Province of
China but narrowed in the Republic of Korea, the second author finds that greater export
orientation in Taiwan Province of China did benefit women’s relative wages.
A positive relation between trade liberalization and women’s relative wages and/or
employment is generally found in Asian developing countries, as well as in Latin American
countries (see Fontana and Wood (2000) for Bangladesh, and Ozler (2000) for Turkey). A
recent study by Banerjee and Veeramani (2015), which analyses the role of trade
liberalization and technology-related factors in determining female employment intensity in
selected manufacturing industries in India for the period 1998–2008, finds a negative effect of
import tariff rates on female employment intensity. Further, while the relative demand for
female workers increases when trade liberalization leads to more investment in unskilled,
labour-intensive industries, greater use of new technology and capital-intensive production
biases the gender composition of the workforce against women. Moreover, using Mexican
manufacturing data between 1987 and 1993, Artecona and Cunningham (2002) find that trade
liberalization is associated with higher wage gaps, largely due to an increased premium to
men’s higher experience and skills.
As far as African countries are concerned, Haouas et al. (2003) investigate the short- and
long-term employment and wage effects of trade reforms (adoption of an export promotion
strategy in 1970) in Tunisia using a panel-data estimation for 11 manufacturing industries
from 1971 to 1996. They find that trade liberalization caused an increase in women’s
participation in the formal labour market (in both the exportable and importable sectors) as
well as a rise in real wages. However, while employment and wages in exportable sectors
increased in the short run, they decreased in the long run.
Arndt et al. (2006) and Cockburn et al. (2009) examine the effects of trade liberalization
policies on gender inequality in Mozambique and Senegal for 2001 and 2004, respectively.
Both studies use computable general equilibrium models. The studies find that trade reforms
did not affect gender wage differences within skill categories in these countries, but
negatively affected women’s relative wages in the agricultural sector, where unskilled women
represent a large share of the workforce.

6
Also using a CGE model, Lulit and Claude (2008) find a negative effect of trade liberalization
on gender wage inequality in 2001 in South Africa and Ethiopia. Nicita (2008) reports a
similar result for Madagascar, where unskilled female workers in the textile sector were most
affected by export-led growth.
In Cameroon, to the best of our knowledge there is no study analysing the effects of trade
openness on women’s employment opportunities and earnings. Existing studies on the
implications of trade openness and trade liberalization are related to the impact on poverty
(Emini et al., 2010), productivity growth (Njikam and Kouty, 2012), and labour demand
(Cockburn and Njikam, 2011).
It emerges from this brief literature review that it is not feasible to draw a clear-cut conclusion
about the relation between trade openness or trade liberalization and gender in developing
countries. The effect of free trade on women depends on the sectoral composition of
liberalizing countries, the liberalization process, and initial conditions (Fontana, 2003). It also
depends on a host of country-specific factors such as resource endowment, labour market
institutions, government institutions, and consumer preferences (Aguayo-Tellez, 2011), as
well as on other socio-economic characteristics of the country concerned.
It also appears that studies on the impact of trade openness or trade liberalization have mainly
focused on the manufacturing sector. Few studies have investigated the impact of trade
openness on informal employment from a gender perspective, despite the fact that women
tend to dominate the informal sector.
3 Evolution of trade policy and recent trade patterns in Cameroon
3.1 Evolution of trade policy in Cameroon
Trade and trade policies have always played an important role in Cameroon’s development
strategy. The country’s trade policy has evolved in three main phases: (a) industrialization
through an import-substitution strategy (1960–1970), (b) export promotion policy (1970–
1990), and (c) trade liberalization (from 1990 onward).
3.1.1 Industrialization through an import-substitution strategy (1960–1970)
Like most developing countries after independence, Cameroon opted for a development
strategy based on industrialization through import substitution. The objective of this strategy,
as specified in Cameroon’s first two five-year plans (1960–1965 and 1966–1971), was to
locally produce the goods that were initially imported from developed countries. Tariff and
non-tariff measures were applied to protect domestic production from foreign competition.
Imports were subject to four taxes (customs duty, input tax, import turnover tax, and
complementary tax), while exports were subject to a tax whose amount depended on the
degree of processing of the product (with a higher rate for primary products than for locally
processed products). Furthermore, non-tariff measures – quantitative restrictions, fixing of
prices, and other direct incentives favouring local producers – were applied at the same time.
At the regional level, the Brazzaville Treaty signed in 1964 to establish the Central African
Customs and Economic Union (CACEU) imposed a set of measures to protect the CACEU
internal market.

7
During the same period, the Yaoundé I and Yaoundé II Conventions between African,
Caribbean, and Pacific countries and the European Community allowed Cameroon to export
its products duty and quota free to the European market.2 At that time, Cameroonian exports
were essentially agricultural products like cocoa, coffee, sugar, and bananas.
The strategy to industrialize through import substitution did not meet expectations, as the
country continued to import manufactured products, while its exports of these products
remained very low.
3.1.2 Export promotion policy (1970–1990)
Unlike import substitution, which aimed to satisfy local consumption through domestic
production, the export promotion policy implemented starting in 1970 aimed to conquer
foreign markets. The objective was to increase the production of exportable goods. To this
end, the General Trade Programme adopted in 1972 set out a number of tariff and non-tariff
measures to encourage industrialization through the processing of local products, but also to
promote exports. These measures included subsidies for the production of exportable goods,
removal of duties and taxes on exports of processed and semi-processed products while
keeping an export tax on exports of unprocessed commodities such as logs, and removal of
licenses on imports of intermediate products. This export promotion policy was supported by
the income from oil exports.
The policy did not help develop Cameroonian exports and industries as expected. According
to the Competitiveness Industrial Performance Index of the United Nations Industrial
Development Organization (UNIDO, 2005), Cameroon was among a group of countries that
did not succeed in orienting their production and export structures towards higher value-added
and more technology-intensive products between 1970 and 1985. At the same time, the
international environment, favourable to trade liberalization, encouraged Cameroon to adopt a
different orientation of its trade policy, namely trade liberalization.
3.1.3 Trade liberalization (from 1990 onward)
At the beginning of this period, the World Bank and the International Monetary Fund (IMF)
advocated for implementation of Structural Adjustment Programmes (SAPs), which set strict
conditions for developing countries seeking new loans at lower interest rates. The trade
liberalization policy was among the conditionalities set by the IMF for developing countries
to access such loans,3 as was the reestablishment of macroeconomic balances and the
reduction of government expenditure. These measures were expected to bring about economic
progress and make countries more competitive (Afeju, 2014).
The liberalization process in Cameroon was carried out unilaterally, regionally, bilaterally,
and multilaterally. Unilateral liberalization mainly took place in the context of SAPs. In order
to restore macroeconomic balance, Cameroon appealed to the Bretton Woods institutions,
which imposed a set of economic policy measures, including trade and price liberalization, on
the country. The trade and price liberalization was embodied in Law No. 89/011 of 8 July
1989 regarding restoration of a market economy, and Ordinance No. 90/001 of 29 January
1990 establishing the country’s export processing zone regime. The restoration of the market
2 See http://www.epg.acp.int/fileadmin/user_upload/YaoundeI.pdf and
http://www.epg.acp.int/fileadmin/user_upload/YaoundeII.pdf, respectively. 3 See Williamson (2004) for more information on the conditionalities.

8
economy meant reducing state intervention in the economy through privatization of public
enterprises and price liberalization. Thus, price controls were eliminated for all products
except petroleum products, drugs and other pharmaceutical products, school books, maritime
transport, and port services. Non-tariff barriers on imports were removed, except those on
petroleum products.
At the regional level, along with other CACEU members, Cameroon approved the tax and
customs reform adopted in February 1994 at the CACEU level. The main element of the
CACEU’s trade policy that resulted from this reform – the common external tariff – included
five bands: 0 per cent for cultural products and aviation-related products, 5 per cent for prime
necessity products, 10 per cent for raw materials and capital goods, 20 per cent for
intermediate goods, and 30 per cent for consumer goods.
A new General Trade Programme was adopted in June 1994 to consolidate import
liberalization measures, provide economic operators with a legal framework to combat illegal
trade practices and unfair competition, and improve export procedures. All of the measures
aimed to benefit from the potential effects of improved competitiveness generated by the
devaluation of the FCFA (Emini et al., 2010).4
Liberalization at the bilateral level was carried out through the country’s commitments under
various trade agreements and economic partnerships. A case in point is the interim Economic
Partnership Agreement with the European Union (EU) negotiated between the EU and Central
Africa.5 This agreement provides for duty- and quota-free access to the EU market for 100 per
cent of Cameroonian exports. For its part, Cameroon is expected to gradually open its market
to about 80 per cent of European exports (over a transitional period until 2023), while
maintaining protection of its agricultural markets and industries that it regards as sensitive.
The others bilateral agreements include preferential trade agreements with Nigeria, Morocco,
and Brazil. A number of other agreements, especially with emerging economies, are still
under negotiation.
Multilateral liberalization was carried out through Cameroon’s membership in the World
Trade Organization (WTO).The country is a founding WTO member and has participated in
the Doha Development Round negotiations and other important negotiating fora.
Finally, Cameroon is eligible to benefit from the African Growth and Opportunity Act,6 which
represents unilateral preferences awarded by the United States to African countries.
3.2 Recent trade patterns in Cameroon
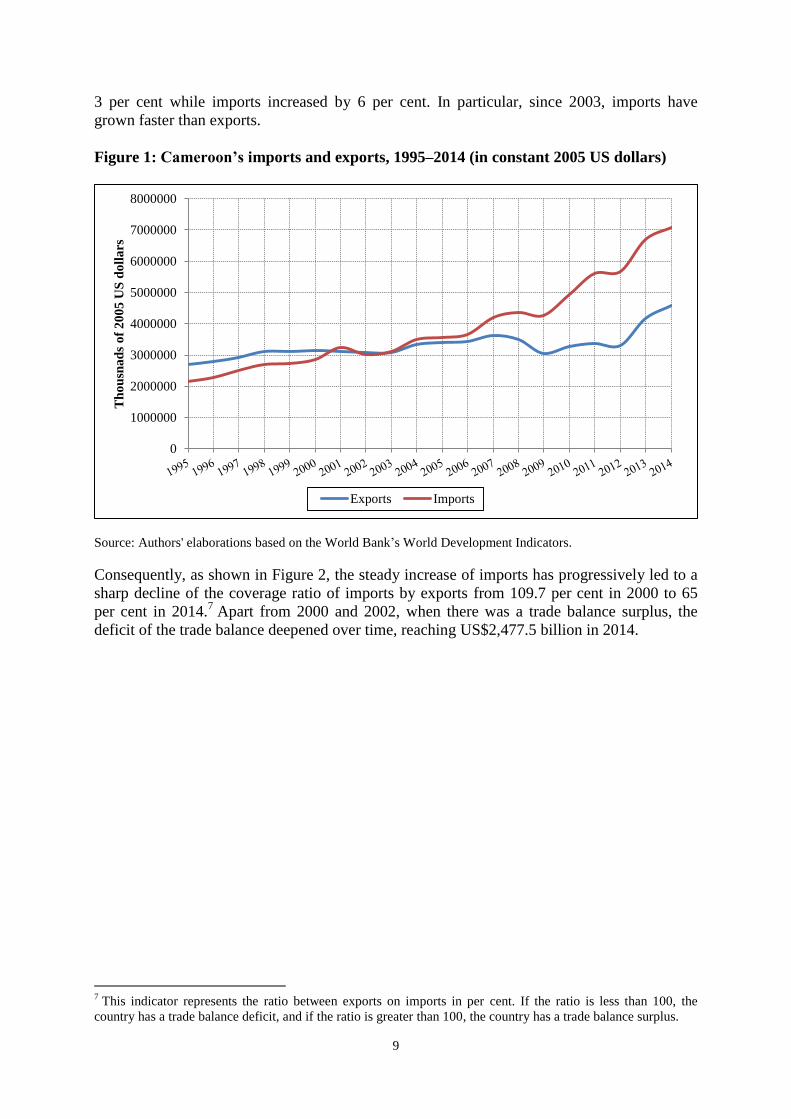
Figure 1 shows the evolution of Cameroonian trade from 1995 to 2014. Both exports and
imports increased significantly during this period. On average, exports increased annually by
4 Cameroon and other countries using the Central African CFA (Financial Cooperation in Central Africa -
Coopération financière en Afrique centrale) franc (FCFA) as their currency were subject to a 50 per cent
devaluation in 1994. 5
For more details, see the Economic Partnership Agreement fact sheet at
http://trade.ec.europa.eu/doclib/docs/2009/january/tradoc_142190.pdf.
6 See http://trade.gov/agoa/index.asp and http://agoa.info/about-agoa.html. The AGOA expands the provisions
previously available under the US Generalized System of Preferences (GSP) to provide combined AGOA/GSP
duty-free access to the US market for approximately 7,000 product tariff lines exported by eligible African
countries. Among the newly added products are items such as apparel and footwear, wine, some motor vehicle
components, a variety of agricultural products, chemicals, and steel.
9
3 per cent while imports increased by 6 per cent. In particular, since 2003, imports have
grown faster than exports.
Figure 1: Cameroon’s imports and exports, 1995–2014 (in constant 2005 US dollars)
Source: Authors' elaborations based on the World Bank’s World Development Indicators.
Consequently, as shown in Figure 2, the steady increase of imports has progressively led to a
sharp decline of the coverage ratio of imports by exports from 109.7 per cent in 2000 to 65
per cent in 2014.7 Apart from 2000 and 2002, when there was a trade balance surplus, the
deficit of the trade balance deepened over time, reaching US$2,477.5 billion in 2014.
7 This indicator represents the ratio between exports on imports in per cent. If the ratio is less than 100, the
country has a trade balance deficit, and if the ratio is greater than 100, the country has a trade balance surplus.
0
1000000
2000000
3000000
4000000
5000000
6000000
7000000
8000000
Th
ou
sna
ds
of
20
05
US
do
lla
rs
Exports Imports

10
Figure 2: Evolution of the trade balance and the coverage ratio of imports by exports,
2000–2014
Source: Authors' elaborations based on the World Bank’s World Development Indicators.
As shown in Figure 3, Cameroon has a low level of export diversification. The figure presents
the main products exported and imported by Cameroon for 2003 and 2013. The structure of
imports and exports in these years shows no major change over time. In the two years
considered, the main exported products were agricultural products or products derived from
natural resource exploitation (raw wood, crude oil, refined petroleum products). The main
imported products were hydrocarbons, electrical and mechanical machines, chemical
products, vehicles, and cereals. In sum, Cameroon mainly imports manufactured products and
exports raw products.
Figure 3 : Main Cameroonian imports and exports in 2003 and 2013 (as a percentage of
total imports and exports)
Source: Authors’ calculations based on data from the National Institute of Statistics.
4 Evolution of labour gender gaps in Cameroon
This section outlines the main stylized facts about recent changes in gender gaps in labour
participation rates, unemployment, sector specialization (segregation), and labour earnings in
Cameroon.
25
50
75
100
125
150
175
-2000.0
-1500.0
-1000.0
-500.0
0.0
500.0
1000.0
1500.0
2000.0
Co
vera
ge r
atio
(%
)
Trad
e B
alan
ce (
Bill
ion
20
05
USD
)
Trade balance Coverage ratio
4.8
8.0
14.8
49.4
8.2
9.9
13.4
15.3
17.8
Raw cotton
Cocoa beans
Wood and wood products
Hydrocarbons
Cereals
Vehicles
Chemical products
Machines
Hydrocarbons
Exp
ort
s (%
)Im
port
s (%
)
2003
3.8
12.3
10.5
55.9
2.7
5.7
9.6
15.6
23.5
Raw cotton
Cocoa beans
Wood and wood products
Hydrocarbons
Cereals
Vehicles
Chemical products
Machines
Hydrocarbons
Exp
ort
s (%
)Im
port
s (%
)
2013

11
As shown in Table 1, Cameroon’s labour market is characterized by a high participation rate
among both men and women. However, women have a lower labour participation rate than
men: 73.6 per cent for women compared with 82.8 per cent for men in 2010. In addition, the
gender differentials in labour force participation rates have increased over time (7.1
percentage points in 2005, and 9.2 percentage points in 2010).8 While the unemployment rate
decreased from 7.1 per cent in 2005 to 6.5 per cent in 2010, women generally have a higher
unemployment rate than men – the rate in 2010 was 8.7 per cent for women and 4.4 per cent
for men.9 In addition, the gap between female and male unemployment has increased slightly
over time, from 2.6 percentage points in 2005 to 4.3 percentage points in 2010.
Table 1: Labour participation and unemployment rates in 2005 and 2010 (in per cent) 2005 2010
Participation
rate
Male 84.3 82.8
Female 77.2 73.6
Total 80.5 78.0
Unemployment
rate
Male 5.8 4.4
Female 8.4 8.7
Total 7.1 6.5
Source: Authors’ calculations based on data from the Employment and Informal Sector Survey (EISS) 1 (2005)
and 2 (2010).
Note: The calculations use weighted data.
In terms of the distribution of workers by occupation, it appears from Table 2 that self-
employment represents the largest component of Cameroon’s labour market. However, the
share of self-employment decreased from 69.5 per cent in 2005 to 64.7 per cent in 2010. The
self-employment category was constantly dominated by women: 84.1 per cent and 78 per cent
of women were self-employed in 2005 and 2010, respectively, compared with 57.8 per cent
and 54.9 per cent of men in the same years. Moreover, the percentage of women among high-
ranking officials or skilled workers was in general lower compared to that of men (8.4 and 9.9
per cent for women, respectively, in 2010, versus 14.9 and 20.1 per cent for men in the same
year).
Concerning the sectoral breakdown of employment (Table 2), it is important to note the
preponderant role of agriculture as an employment generator in the country, as it represented
46.7 per cent of all jobs in 2010. In contrast, the share of extractive activities as an
employment generator was very low (about 0.2 per cent of all jobs in 2010), confirming the
low labour intensity of this Cameroonian export sector (see Figure 3 for the main
Cameroonian exports). The sectoral structure of employment thus shows the predominance of
agriculture, trade, and other services, which are generally labour-intensive, as the main
sources of employment for the Cameroonian population.
Looking at the distribution of workers by institutional sector in 2010 (Table 2), almost nine
workers out of ten were in the informal sector, including 92.9 per cent of working women and
85.6 per cent of working men. The informal sector is thus the main means of making a living
for most of the Cameroonian population, and even more so for the country’s female
workforce.
8 Calculated as the difference between male and female labour participation rates.
9 According to the International Labour Organization, an unemployed person is someone who (a) does not have a
job, (b) has not worked even for one hour during the week before the survey, (c) is available to work, and (d) has
actively searched for a job (ILO, 1983). Given the situation of the labour market in Africa in general and in
Cameroon in particular, where many jobless persons become discouraged and stop actively searching for a job,
the fourth condition is not taken into account.

12
The findings above clearly show that the assessment of the gender impact of trade and trade
policies must be centered on informal employment. The description of female employment
intensity as well as gender wage gaps at the sectoral level in this study will therefore focus on
the informal sector, and particularly on activities related to agriculture, agro-industry, the
clothing and shoe industry, and other industries. These sub-sectors are those for which enough
observations are available in the datasets used, and for which it is possible to measure trade
variables (i.e. trade variables cannot be measured for sectors like commerce, transport, and
construction).
Table 2: Distribution of workers by institutional sector, socio-professional status, and
sector, 2005 and 2010 (in per cent) 2005 2010
Male Female All Male Female All
Institutional sector
Public 9.3 5.0 8.5 8.5 4.9 6.8
Formal private 10.3 3.0 8.3 6.0 2.1 4.2
Non-agricultural informal 39.8 47.0 52.5 42.6 38.9 40.8
Agricultural informal 40.6 45.1 30.7 43.0 54.0 48.3
Total 100.0 100.0 100.0 100.0 100.0 100.0
Occupation
High-ranking official 12.7 5.8 9.7 14.9 8.4 12.2
Skilled worker 16.5 6.8 12.1 20.1 9.9 15.8
Labourer 12.9 3.2 8.6 10.0 3.6 7.3
Self-employed 57.8 84.1 69.5 54.9 78.0 64.7
Total 100.0 100.0 100.0 100.0 100.0 100.0
Sector
Agriculture 20.4 31.0 24.9 40.1 53.9 46.7
Extractive activities 0.4 0.1 0.3 0.3 0.0 0.2
Farming, forestry, hunting and fishing 3.1 0.3 1.9 3.9 0.7 2.4
Agro-industry 4.4 13.6 8.3 2.7 7.0 4.7
Clothing and shoe industry 1.8 5.4 3.4 0.9 5.1 2.9
Other industries 6.5 1.0 4.1 4.9 0.6 2.4
Construction 6.5 0.2 3.8 4.9 0.2 2.6
Commerce 19.8 19.6 19.7 13.9 12.1 13.0
Transport 11.2 0.6 6.7 8.7 0.2 4.6
Hotels and restaurants 2.0 9.2 5.1 1.6 6.1 3.7
Other services 24.1 19.0 21.9 18.2 14.2 16.2
Total 100.0 100.0 100.0 100.0 100.0 100.0
Source: Authors’ calculations based on data from the Employment and Informal Sector Survey (EISS) 1 (2005)
and 2 (2010).
Note: The calculations use weighted data.
Tables A1 and A2 in the Annex provide details on the gender gaps in hourly wages and
working hours. Regarding the allocation of working hours per week, men tend to devote more
time to work than their female counterparts. Except for the agricultural sector, where the gap
in working hours (measured as the ratio of male and female working hours) decreased from
1.17 in 2005 to 1.14 in 2010, the gap increased in other sectors (from 1.13 to 1.20 in agro-
industry, from 1.38 to 1.50 in the clothing and shoe industry, and from 1.20 to 1.45 in other
industries). Moreover, the wage differential (also measured as the ratio of male and female
hourly wages) in favour of men persisted, though it decreased in all sectors (from 1.49 to 1.28
in agriculture, from 1.49 to 1.42 in agro-industry, and from 2.14 to 1.81 in other industries),
except in the clothing and shoe industry, where it increased from 1.02 to 2.05.
The gender wage gap is further illustrated in Figure 4, which shows the distribution of wages
by gender and by sector. In general, the female wage distribution lies almost entirely to the
left of the corresponding male wage distribution.

13
5 Methodology and data
The previous section described the levels and changes in employment and gender wage gaps
in Cameroon. This section attempts to identify whether these gender gaps are somehow
associated with trade openness.
5.1 Methodology
5.1.1 Measures of trade openness
Broadly, trade openness measures can be divided into two categories: measures of openness
in practice and measures of openness in policy (UNCTAD, 2010). Measures of openness in
practice indicate the actual importance of trade in the economy, while measures of openness
in policy indicate the extent of policy measures that aim to restrict or enhance trade. While the
former mostly refer to trade-intensity ratios, the latter include import tariff rates, export taxes
on international trade, and indices of non-tariff barriers. From a policy point of view, a
comprehensive form of trade barriers appears to be best suited to ascertain the impact of trade
policy (Harrison and Hansen, 1999; Yanikkaya, 2003). Unfortunately, data about such
measures of openness in policy are rarely available for developing countries. In this study, we
therefore consider three measures of openness in practice: import penetration, export
intensity, and trade share.
Import penetration in industry 𝑘 (𝐼𝑃𝑘) is calculated as imports in industry 𝑘 as a proportion of
domestic consumption in that industry (𝐼𝑃𝑘 =𝐼𝑚𝑝𝑜𝑟𝑡𝑠𝑘
(𝑂𝑢𝑡𝑝𝑢𝑡𝑘+𝐼𝑚𝑝𝑜𝑟𝑡𝑠𝑘−𝐸𝑥𝑝𝑜𝑟𝑡𝑠𝑘)). Export intensity
( 𝐸𝐼𝑘) is calculated as exports in industry 𝑘 as a proportion of output in that industry
(𝐸𝐼𝑘 =𝐸𝑥𝑝𝑜𝑟𝑡𝑠𝑘
𝑂𝑢𝑡𝑝𝑢𝑡𝑘), while the trade share (𝑇𝑆𝑘) is measured as the sum of imports and exports
divided by total output (𝑇𝑆𝑘 =𝐼𝑚𝑝𝑜𝑟𝑡𝑠𝑘+𝐸𝑥𝑝𝑜𝑟𝑡𝑠𝑘
𝑂𝑢𝑡𝑝𝑢𝑡𝑘).
5.1.2 The effect of trade openness on women’s job opportunities
Figure 4: Kernel density estimates of (log) hourly wages by gender, 2005 and 2010
Source: Authors’ calculations based on data from Employment and Informal Sector Survey (EISS) 1 (2005) and 2 (2010).
Note: The calculations use weighted data.
0.2
.4.6
0.2
.4.6
0 5 10 0 5 10
Agriculture-2005 Agro-industry-2005
Clothes and shoes industry-2005 Other industries-2005
Male Female
Log (Hourly wage)
0.5
0.5
0 5 10 0 5 10
Agriculture - 2010 Agro industry - 2010
Clothing and Shoes industry - 2010 Others industries - 2010
Male Female
Log (Hourly Wage)

14
To ascertain the effect of trade openness on women’s job opportunities, the approach adopted
in several studies consists of regressing women’s employment shares on trade-related
variables (AlAzzawi, 2014). This approach requires the availability of time series data on
women’s employment shares, which are not available in our case. So, in this study, to have an
idea of the effect of trade openness on women’s employment opportunities, we will resort to a
descriptive analysis of the evolution of trade variables and women’s employment shares at the
sectoral level for the two years (2005 and 2010) for which labour survey data are available.
5.1.3 The effect of trade on the gender wage gap
An approach commonly used in the literature to analyse the effect of trade openness on the
gender wage gap is to proceed in a two-step process (Reilly and Dutta, 2005; AlAzzawi,
2014). First, male and female earnings equations are estimated using a Mincer specification.
The difference between the average male and female log wages in each industry is then
decomposed into two components: a component explained by observable differences in labour
market characteristics (the explained part) and a residual component potentially due to gender
labour market discrimination (the unexplained part). Second, this unexplained part
(commonly referred to as the discrimination component) is used as the dependent variable in
regressions that control for exposure to trade openness. This approach requires the availability
of labour survey data sufficiently disaggregated at the sectoral level in order to have enough
observations in the regression of the second step. Such data are not available for our case.
In this study, we will therefore adopt another approach also used in the literature (Pham et al.,
2008) consisting of (a) adopting the standard Mincerian earnings equation, augmented with
the inclusion of trade openness indicators to capture the impact of changes in trade openness
on men’s and women’s earnings; and (b) reporting the Oaxaca-Blinder decomposition
(Blinder, 1973; Oaxaca, 1973).
We first estimate separate male and female wage equations of the form:
lnwji = Xji′ βj + θjλji + Tki
′ δji + uji, (1)
where the subscript j (j = 𝑚, 𝑓) denotes males and females, respectively; and 𝑤𝑗𝑖 and 𝑋𝑗𝑖
represent, respectively, the hourly wage and the n × 1 vector of observable characteristics
(including experience and its square, as well as binary variables for the highest level of
education attained, sector of employment, and region of residence) for individual 𝑖 who
belongs to gender group 𝑗 ( 𝑗 = 𝑚, 𝑓 ). The β𝑗 are n × 1 vectors comprised of the set of
unknown wage equation parameters, while the θ𝑗 are the unknown selection parameters, and
λ𝑗𝑖 is the standard selection parameter calculated for each group as the inverse of the Mills
ratio term using estimates from gender-specific probit models following Heckman
(1979). 𝑇𝑘𝑖 represents trade openness indicators for the sector where individual 𝑖 is employed,
while δ𝑗𝑘 is a n × 1 vector of trade effects. Finally, 𝑢𝑗𝑖 is the independent and identically
distributed (i.i.d.) random regression error term with a mean of zero and a constant variance.
The male and female mean wage differential is then estimated as follows:
lnWm̂ − lnWf̂ = Xm′̅̅ ̅̅ β̂m − Xf
′̅β̂f, (2)

15
where 𝑋𝑗′̅̅ ̅ contains the mean characteristics of a worker of gender group 𝑗, mean values for
trade variables, and the selectivity coefficient (for notational simplification purposes, the
selectivity term and trade variables are all included in the vector 𝑋).
Following the Oaxaca-Blinder decomposition, the difference in average earnings can be
further decomposed as follows:
lnWm̂ − lnWf̂ = (Xm′̅̅ ̅̅ − Xf
′̅)β̂f + Xf′̅(β̂m − β̂f) + (Xm
′̅̅ ̅̅ − Xf′̅)(β̂m − β̂f). (3)
This is a “threefold decomposition,” meaning that the differential is divided into three parts
indicated on the right-hand side of equation (3):
Gender Wage Gap = E + U + I (4)
The first term
E = (Xm′̅̅ ̅̅ − Xf
′̅)β̂f (5)
is the part that is due to differences in characteristics between males and females (the
explained part of the differential).
The second term
U = Xf′̅(β̂m − β̂f) (6)
is the contribution of differences in coefficients (the discrimination component, or the
unexplained part of the differential).
The third term
𝐼 = (Xm′̅̅ ̅̅ − Xf
′̅)(β̂m − β̂f) (7)
is the interaction component accounting for the fact that differences in characteristics and
coefficients exist simultaneously between the two groups.
It is essential to note that this approach provides both the aggregate decomposition and the
detailed decomposition for each group of variables, including trade openness indicators. In
this way, it allows us to detect the impact of trade openness on the gender wage gap. This
study applies this framework in order to analyse the male-female wage differential in
Cameroon for 2005 and 2010, and to identify whether and how trade openness can account
for the unexplained portion of the differential.
5.2 Data
Our empirical analysis employs data from the Employment and Informal Sector Survey
(EISS) carried out in 2005 and 2010 by the National Institute of Statistics (NIS). This
nationwide survey is comprised of two phases. The first phase is an employment survey that
collects data on socio-demographic characteristics of individuals and on employment. The
second phase is a survey of the types of “enterprises” in the non-agricultural informal sector

16
identified during the first phase. The EISS is a variant of the 1-2-3 system of surveys for
which phase 3 on poverty is not carried out. Within the framework of this study, it is phase 1
that is used.
The EISS collects information on the activity status of the population, including information
on individual characteristics such as gender, age, work experience, and education, but also
employer and job characteristics, such as the company size, industry, ownership status,
occupation, and working conditions. Importantly for this study, the EISS includes information
on monthly wages for the main job and hours of work performed per week. Our sample
consists of individuals aged 15 to 64. We restrict our analysis to the informal sector and to
four sub-sectors (agriculture, agro-industry, clothing and shoe industry, and other industries),
for the reasons stated in Section 4.
Data on trade openness used in the study come from National Accounts (Supply and Use
Tables) produced by the NIS.
6 Results and discussions
6.1 The evolution of trade openness indicators and women’s employment shares
It is worth noting that the manufacturing sector recorded the highest values of the import-
penetration ratio, as can be seen in Figure 5. While the import-penetration ratio increased over
the period 2000–2010 in the clothing and shoe industry (by an annual average of 7.07 per
cent), agro-industry (5.08 per cent), and other industries (1.48 per cent), it decreased in
agriculture (by 8.92 per cent). The increase in the import-penetration ratio has thus been more
pronounced in the clothing and shoe industry as well as in agro-industry.
Export-intensity indicators have shown an evolution opposed to that of import-penetration
ratios. Indeed, the export-intensity ratio in agriculture increased by an average annual rate of
1.53 per cent over the period 2000–2010, while agro-industry, the clothing and shoe
industries, and other industries had average annual decreases of 8.25 per cent, 6.41 per cent,
and 1.59 per cent, respectively. Hence, the decrease in the export-intensity ratio has been
more pronounced in agro-industry and in the clothing and shoe industry.
Graphs for trade share indicators show almost the same evolution as those for import-
penetration indicators, even if trade share values are relatively higher than import penetration
ones. Trade share indicators increased at an annual average rate of 3.59 per cent, 1.73 per
cent, and 1.39 per cent in agro-industry, other industries, and the clothing and shoe industry,
respectively. Agriculture had the lowest annual average increase (0.85 per cent).
Regarding women’s employment shares at the sectoral level, women’s employment structure
did not significantly change over the period 2005–2010. Women’s employment shares in
agriculture and in other industries remained almost stable at around 47–48 per cent and 11–12
per cent, respectively. A slight decrease in women’s employment share of about 6 percentage
points was seen in agro-industry, while an increase of the same size occurred in the clothing
and shoe industry.
An econometric analysis should be performed to come to a conclusion about the relationship
between increased trade openness and changes in women’s employment shares. Such an
analysis was not possible in this study due to data constraints. Nevertheless, from the previous

17
description, one can say that openness to trade has not led to the expansion of exports in
sectors where most of women are concentrated (agro-industry, and the clothing and shoe
industry, which registered decreases in export-intensity indicators). Therefore, it seems that
increased trade openness has not increased women’s jobs opportunities in these sectors.

18
Figure 5: Evolution of trade openness indicators and women’s employment shares, 2000–2010
Source: Authors’ calculations using data from Employment and Informal Sector Survey (EISS) 1 (2005) and 2 (2010), and from the National Institute of Statistics’ Supply
and Use Tables.
0.00
0.05
0.10
0.15
0.20
0.25
0.30
0.35
0.40
0.45
0.50
2000 2001 2002 2003 2004 2005 2006 2007 2008 2009 2010
Import penetration
Agriculture Agro-industry
Clothes and shoes industry Other industries
0.00
0.05
0.10
0.15
0.20
0.25
0.30
0.35
2000 2001 2002 2003 2004 2005 2006 2007 2008 2009 2010
Export intensity
Agriculture Agro-industry
Clothes and shoes industry Other industries
0.00
0.10
0.20
0.30
0.40
0.50
0.60
0.70
0.80
0.90
1.00
2000 2001 2002 2003 2004 2005 2006 2007 2008 2009 2010
Trade Share
Agriculture Agro-industry
Clothes and shoes industry Other industries
47.9 46.9
77.1 70.9 73.1
79
10.8 11.8
0
10
20
30
40
50
60
70
80
90
2005 2010
Women's employment shares
Agriculture Agro-industry
Clothes and shoes industry Other industries

19
6.2 The effect of trade openness on the gender wage gap
6.2.1 Wage equations
Table 3 displays the pooled ordinary least square wage regression results for 2005 and 201010
for the three different trade openness indicators: (a) import penetration, (b) export intensity,
and (c) trade share. Probit regression results for selection into employment are displayed in
Table A3 in the Annex. As in the standard labour economics literature, most of the relevant
explanatory variables (age, tenure, and education) are significant with the expected sign. The
effect of age is significant in most estimations. Age, a proxy for potential experience, is
associated with higher wages for both men and women in all estimations. Age and its squared
term (though the latter is non-significant) seem to describe the expected inverted-U shaped
relationship between wage rates and potential experience.
Table 3: Regression results of earnings equations by gender Dependent variable: Log of
hourly earnings
Male Female Male Female Male Female
(1) (1) (2) (2) (3) (3)
Age 0.031**
(0.014)
0.020
(0.012)
0.031**
(0.014)
0.020*
(0.012)
0.032**
(0.014)
0.021*
(0.012)
Age squared -0.018
(0.016)
-0.017
(0.015)
-0.018
(0.016)
-0.018
(0.014)
-0.018
(0.016)
-0.018
(0.015)
Education (reference:
none/primary)
Secondary 0.241***
(0.052)
0.390***
(0.060)
0.246***
(0.052)
0.379***
(0.059)
0.242***
(0.052)
0.383***
(0.060)
Tertiary 0.588***
(0.189)
1.196***
(0.268)
0.603***
(0.200)
1.185***
(0.267)
0.590***
(0.185)
1.209***
(0.268)
Tenure 0.011***
(0.010)
0.004***
(0.012)
0.011***
(0.010)
0.005***
(0.012)
0.011***
(0.010)
0.005***
(0.012)
Tenure squared -0.023***
(0.005)
-0.013***
(0.006)
-0.023***
(0.005)
-0.015***
(0.006)
-0.023***
(0.005)
-0.014***
(0.006)
Married -0.026
(0.059)
-0.069
(0.043)
-0.029
(0.059)
-0.067
(0.043)
-0.027
(0.059)
-0.068
(0.043)
Firm size (reference: ≤10)
More than 10 0.420***
(0.096)
0.186
(0.192)
0.421***
(0.097)
0.255
(0.196)
0.423***
(0.096)
0.205
(0.193)
Occupation (reference: high-
ranking official)
Skilled worker -0.798***
(0.102)
-0.831***
(0.168)
-0.802***
(0.103)
-0.809***
(0.175)
-0.797***
(0.102)
-0.841***
(0.169)
Labourer -0.709***
(0.106)
-0.755***
(0.188)
-0.728***
(0.107)
-0.794***
(0.190)
-0.710***
(0.106)
-0.767***
(0.189)
Self-employed -0.840***
(0.094)
-0.801***
(0.118)
-0.850***
(0.094)
-0.805***
(0.120)
-0.841***
(0.094)
-0.801***
(0.118)
Branch: Agriculture -0.412***
(0.075)
-0.240***
(0.078)
-0.583***
(0.056)
-0.371***
(0.057)
-0.483***
(0.065)
-0.407***
(0.054)
Urban area 0.268***
(0.074)
0.262***
(0.059)
0.276***
(0.074)
0.252***
(0.059)
0.269***
(0.074)
0.256***
(0.059)
Capital 0.315***
(0.083)
0.477***
(0.085)
0.37***
(0.083)
0.453***
(0.085)
0.316***
(0.083)
0.466***
(0.085)
Trade openness indexes 0.006***
(0.002)
0.015***
(0.004)
0.012**
(0.003)
0.023***
(0.007)
0.003**
(0.001)
0.005*
(0.003)
Year 2010 0.202***
(0.043)
0.118***
(0.040)
0.199***
(0.043)
0.110***
(0.040)
0.199***
(0.042)
0.097***
(0.039)
10
The wage regression results for each year are available upon request.

20
Constant 5.058***
(0.290)
4.949***
(0.292)
5.247***
(0.290)
5.286***
(0.295)
5.103***
(0.290)
5.046***
(0.292)
Mills -0.456***
(0.154)
-0.458***
(0.147)
-0.469**
(0.154)
-0.465***
(0.147)
-0.458***
(0.154)
-0.459***
(0.147)
Number of observations 3,752 4,633 3,752 4,633 3,752 4,633
F Stat
(Prob > F)
57.60
(0.000)
43.79
(0.000)
57.13
(0.000)
43.21
(0.000)
57.55
(0.000)
43.65
(0.000)
R-squared 0.161 0.117 0.160 0.117 0.161 0.116
Source: Authors’ calculations based on data from Employment and Informal Sector Survey (EISS) 1 (2005) and
2 (2010).
Note: The trade variable is related to import penetration in (1), export intensity in (2), and trade share in (3).
Robust standard errors in parentheses. *Significant at 10 per cent level; **Significant at 5 per cent level;
***Significant at 1 per cent level.
The more individuals are educated, the higher are their earnings. For both males and females,
higher levels of education have an increasing positive impact on wages, and university
degrees tend to be highly rewarded. The impact of education, especially a university degree,
seems to be stronger (higher coefficients) for females than for males. These findings are
supported by Psacharopoulos (1985), who reviewed the rate of return to education for 56
countries. He noted that in developing countries the rate of return for women generally
exceeds that for men.
Tenure has a positive effect and tenure squared has a negative effect on wages. In addition,
tenure tends to be highly rewarded for males. The effect of marital status is non-significant for
both females and males, while the effect of firm size is significant only for males, and this
variable is positively associated with wages.
An interesting finding emerges when looking at the effects of industry affiliation. The
coefficient of the industry dummy suggests that there are important wage differentials per
sector of activity. In all the regressions, workers in agriculture tend to earn less than those in
manufacturing and related activities (agro-industry, clothing and shoe industry, and other
industries). In addition, this negative effect of affiliation with agriculture seems to be more
pronounced for men, indicating that men earn more when they are in manufacturing and
related activities than women.
It is worth nothing that in our regressions, we considered only one industry dummy (taking
the value 1 for those working in agriculture and 0 for the others) to deal with the
multicollinearity that we faced when controlling for all the industries. The collinearity arises
because all persons from a given industry also have the same trade openness indicator value
for a given year.
Moving to trade openness indicators, all the indicators considered have a positive and
significant effect on both male and female earnings. The positive effect of trade openness
seems to have benefited women more. A 1 per cent markup in the import-penetration ratio
corresponds to increases of 0.6 per cent and 1.5 per cent in male and female earnings,
respectively. As far as the export-intensity ratio is concerned, the reported effects are
increases of 1.2 per cent and 2.3 per cent in male and female earnings, respectively. Looking
at the effect of trade share on earnings, a 1 per cent markup in the trade share corresponds to
increases of 0.3 per cent and 0.5 per cent in male and female earnings, respectively.
Results seem to indicate that trade openness increases women’s wages more than men’s. This
positive effect is more pronounced in the case of export intensity. This result gives a first,

21
albeit rough, indication that increased trade openness has a narrowing effect on the gender
wage gap. These findings are in line with those of Greenaway and Nelson (2000). The
estimated coefficients for the selection terms are relatively large and significant in all
equations.
6.2.2 Decomposition analysis
Table 4 presents the results of the Oaxaca-Blinder decomposition. As shown in the table, the
male-female wage differential for the overall period is about 0.11 log points regardless of the
trade openness indicator.
Table 4: Oaxaca-Blinder decomposition of the gender earnings gap (1) (2) (3)
𝑤𝑚(predicted male earnings in log points) 4.577 (0.023) 4.577 (0.023) 4.577 (0.023)
𝑤𝑓(predicted female earnings in log points) 4.469 (0.046) 4.472 (0.046) 4.470 (0.046)
Gender earning gap 0.107 (0.051) 0.105 (0.051) 0.107 (0.051)
Explained part 0.011 (0.030) 0.008 (0.032) 0.012 (0.032)
Of which trade 0.024 (0.009) -0.064 (0.022) 0.024 (0.015)
Unexplained part 0.066 (0.053) 0.069 (0.054) 0.068 (0.054)
Of which trade -0.046 (0.033) -0.021 (0.078) -0.029 (0.048)
Interaction effect 0.030 (0.033) 0.032 (0.035) 0.027 (0.036)
Of which trade -0.013 (0.009) -0.016 (0.064) -0.010 (0.016)
Source: Authors’ calculations based on data from Employment and Informal Sector Survey (EISS) 1 (2005) and
2 (2010).
Note: The trade variable is related to import penetration in (1), export intensity in (2), and trade share in (3).
Robust standard errors are in parentheses. A positive number indicates male advantage while a negative number
indicates female advantage.
When decomposing this differential it can be observed that 0.07 log points correspond to
differences in coefficients (the unexplained part, or discrimination component) and 0.01 log
points correspond to differences in characteristics (the explained part). This means that the
major part of the differential (at least 64 per cent)11
remains unexplained (without considering
the interaction effect).
Trade openness, as measured by import penetration, export intensity, and the trade share,
narrowed the wage gap, resulting in the negative signs attached to both the unexplained part
and the interaction effect of the trade openness variable.
However, we should be cautious in interpreting these results and keep in mind that we are
working on the informal sector. The narrowing effect of trade openness on the gender wage
gap can to some extent be the result of disloyal competition towards the formal sector, that is,
fraud and counterfeiting. Indeed, according to the results of the Business Climate Survey
conducted in 2014 by the Ministry of Economy on formal enterprises, 66.7 per cent of formal
businesses declared that competition from the informal sector had a negative effect on their
businesses. This effect was more pronounced in agro-industry (81.6 per cent). The survey also
questioned firms about the effect of counterfeiting on their businesses, and 72 per cent
responded that the effect was negative. Counterfeiting affected all industries, but the
penetration of counterfeit products was more pronounced in the clothing and shoe industry
(86 per cent) and agro-industry (77 per cent).
11
The unexplained component as a share of the overall wage gap.

22
7 Conclusions and policy implications
There are many studies in the current labour economics literature devoted to identifying
gender differentials in the labour market. Trade openness is an important channel for
increased competition, with direct implications for how women are treated in the labour
market relative to men. According to Becker’s (1971) theory of discrimination, trade
openness, as a channel for increased competition, would drive down profit margins and
decrease the ability of employers to discriminate against women. Other authors, such as
Darity and Williams (1985) and Williams (1987), argue that more openness to trade can
increase the gender wage gap in countries where female workers have less bargaining power
and are segregated into lower-paying, lower-status jobs.
This study has empirically assessed the effect of trade openness on women in the
Cameroonian labour market and, more specifically, attempted to answer two questions: (a)
Does increased trade openness increase women’s employment opportunities relative to those
of men? and (b) What are the effects of increased trade openness on gender gaps in earnings?
For the empirical analysis, we used individual-level data from the Employment and Informal
Sector Survey conducted by Cameroon’s National Institute of Statistics (NIS) in 2005 and
2010. Trade statistics were gathered from the Supply and Use Tables produced by the NIS.
We focused our analysis on the informal sector, because this sector is the main means of
making a living for most of the Cameroonian population. The informal sector also represents
the main source of gainful occupation for the female workforce in Cameroon. Indeed, in 2010,
regardless of gender, almost nine workers out of ten worked in the informal sector. In
addition, in 2010, 92.9 per cent of working women were in the informal sector, compared to
85.6 per cent of their male counterparts. We also restricted our analysis to four sub-sectors
(agriculture, agro-industry, clothing and shoe industry, and other industries) for which enough
observations are available in the datasets used.
Our methodology consisted of (a) comparing the evolution of trade openness indicators and
women’s employment shares at the sectoral level, and (b) applying the Oaxaca-Blinder
decomposition approach to the earnings gap to identify whether and how increased trade
openness can account for the unexplained portion of the differential. Three ratios were used to
capture trade openness: import penetration, export intensity, and the trade share.
Our results show that openness to trade has not led to the expansion of exports in sectors
where most women are engaged, and seems not to have increased women’s job opportunities.
However, trade openness, as measured by import penetration, export intensity, and the trade
share, has narrowed the gender wage gap.
In the actual context of the Cameroonian economy’s considerable openness to international
trade, which will be further expanded by the entry into force of the interim Economic
Partnership Agreement with the European Union, specific measures should be envisaged to
help the country benefit from the opportunities created by globalization and to mitigate the
threats it poses to development and poverty alleviation. These measures should take into
consideration the important role played by the informal sector in the economy.
It is worth noting that, according to the results of the Business Climate Survey conducted in
2010 by the Ministry of Economy on formal enterprises, 49 per cent of firms indicated that
competition from imported goods negatively affects their businesses. Sectors that suffered

23
most from import competition are agriculture (75 per cent), agro-industry (70 per cent), and
the clothing and shoe industry (65.5 per cent). These sectors are those where most women are
employed.
In this context, this study formulates the following recommendations to maximize the positive
impact of increased trade openness while minimizing its potential adverse effects on women’s
job opportunities and earnings in Cameroon.
● Organize informal production units (especially in sectors like agro-industry and the
clothing and shoe industry, where most women are employed) into sectoral clusters
The grouping of a larger number of enterprises in the same location favours the exchange of
information and sharing of experiences. With time, it can also encourage specialization in
given aspects of the production process. Clusters may attract customers, traders, qualified
workers, suppliers of goods and services, and new enterprises that wish to benefit from the
market created.
At the moment, clusters are being created in the wood industry under the Chain
Competitiveness Growth Project, with technical and financial assistance from the World
Bank. In the textile industry, efforts are envisaged to raise awareness among the relevant
stakeholders and help them organize themselves into professional associations. This action
should also be pursued in other industries, such as agro-industry. Organization into clusters
and professional associations could facilitate dialogue with the government and help shape
intervention directed towards the industry (training, incentives, etc.) to suit stakeholders’
specific needs.
● Provide technical training to workers in these sectors (with special attention to
female workers) in order to increase their productivity
The Ministry of Employment and Professional Training has already been organizing training
sessions for young entrepreneurs. This training should be expanded. In addition, the training
will have a greater impact if the stakeholders in various industries are organized into
professional associations or grouped into clusters.
● Facilitate women’s access to productive resources such as micro-credit and land
Reports on the Business Climate in Cameroon (MINEPAT, 2015) show that the difficulty of
accessing finance is one of the major constraints faced by small and medium-size enterprises
(SMEs). In 2015, the government established the Cameroon Bank for Small and Medium-
sized Enterprises. In performing its activities, this bank should pay particular attention to
funding requests from women entrepreneurs. Moreover, the government should continue
financial support for SMEs. For example, in September 2009, it granted a subsidy of 11
billion FCFA to SMEs in all 10 regions of the country that are involved in processing and
preserving local products for mass consumption.
Land is a fundamental resource for agriculture and production in general terms, and for the
productivity of a country. In Cameroon, land acquisition is mainly through inheritance,
purchase and, at times, distribution by the state. Property rights of women remain a serious
concern, and women do not always have the purchasing power to acquire land. Policymakers
should therefore enforce the rule of law and consider gender-sensitive land reforms.

24
● Establish mechanisms to mainstream the informal sector into the formal sector
Most of the government’s interventions directed towards the private sector benefit formal
enterprises. However, the informal sector accounts for the largest share of jobs in the country.
Measures should therefore be envisaged to encourage the formalization of informal
production units. Some actions have already been initiated in this regard, namely the creation
of Enterprise Creation One-Stop-Shops, reduction of business registration costs, tax
reductions for startups, etc. However, the rate of informality remains high. The strategy
should be to educate informal business owners about the benefits of formalization, and
encourage them to organize themselves into professional associations. Support (in terms of
training, incentives, etc.) could then be granted to organized enterprises to increase their
productivity and facilitate their migration to the formal sector.

25
Annex
Table A1: Monthly and hourly earnings, and average working hours by gender, in
agriculture and agro-industry, 2005 and 2010 2005 2010
Agriculture
Monthly earnings
(in FCFA)
All 18,301 (51,308) 22,956 (35,391)
Male 22,033 (38,750) 26,984 (42,366)
Female 14,317 (19,822) 18,349 (24,340)
Wage gap (Male/Female) 1.54 1.47
Hourly earnings
(in FCFA)
All 145.45 (581.24) 190.31 (390.17)
Male 173.07 (756.47) 212.21 (428.05)
Female 115.97 (267.13) 165.26 (340.02)
Wage gap (Male/Female) 1.49 1.28
Average working hours per
week
All 38.44 (14.79) 36.64 (15.43)
Male 41.33 (15.72) 38.94 (16.21)
Female 35.35 (13.03) 34.01 (14.03)
Gap (Male/Female) 1.17 1.14
Agro-industry
Monthly earnings
(in FCFA)
All 18,324 (18,890) 45,205 (70,143)
Male 31,756 (27,035) 69,755 (104,488)
Female 15,948 (15,908) 35,093 (45,816)
Wage gap (Male/Female) 1.99 1.99
Hourly earnings
(in FCFA)
All 174.66 (320.47) 304,24 (370,26)
Male 242.01 (288.91) 384.31 (485,57)
Female 162.74 (342.29) 271.25 (304,48)
Wage gap (Male/Female) 1.49 1.42
Average working hours per
week
All 35.62 (20.00) 40.73 (20.32)
Male 39.38 (19.26) 46.23 (20.11)
Female 34.95 (20.05) 38.47 (19.98)
Gap (Male/Female) 1.13 1.20
Source: Authors’ calculations based on data from Employment and Informal Sector Survey (EISS) 1 (2005) and
2 (2010).
Note: The calculations use weighted data.
Table A2: Monthly and hourly earnings, and average working hours by gender, in the
clothing and shoe industry and in other industries, 2005 and 2010 2005 2010
Clothing and shoe industry
Monthly earnings
(in FCFA)
All 24,568 (25,135) 53,708 (84,679)
Male 32,617 (29,812) 103,609 (149,721)
Female 21,786 (22,645) 40,558 (48,211)
Wage gap (male/female) 1.50 2.55
Hourly earnings
(in FCFA)
All 172.00 (174.58) 341.16 (705.53)
Male 174.15 (162.14) 575.00 (1,382)
Female 171.25 (178.68) 279.54 (327.27)
Wage gap (male/female) 1.02 2.05
Average working hours
per week
All 38.16 (18.70) 41.74 (19.00)
Male 48.08 (16.62) 56.77 (17.39)
Female 34.73 (18.14) 37.77 (17.35)
Gap (male/female) 1.38 1.50
Other industries
Monthly earnings
(in FCFA)
All 41,338 (42,685) 84,134 (102,832)
Male 44,004 (44,248) 88,036 (104,146)
Female 20,569 (16,635) 48,524 (81,762)
Wage gap (male/female) 2.14 1.81
Hourly earnings
(in FCFA)
All 302.01 (386.74) 423.02 (500.99)
Male 300.60 (385.38) 439.49 (512.43)
Female 312.94 (396.96) 272.77 (346.57)

26
Wage gap (male/female) 0.96 1.61
Average working hours
per week
All 41.92 (19.06) 45.47 (18.21)
Male 42.75 (18.69) 46.91 (17.94)
Female 35.45 (20.61) 32.34 (15.16)
Gap (male/female) 1.20 1.45
Source: Authors’ calculations based on data from Employment and Informal Sector Survey (EISS) 1 (2005) and
2 (2010).
Note: The calculations use weighted data.
Table A3: Probit regression results for selection into employment Male Female
Age 0.082*** (0.013) 0.082*** (0.012)
Age squared -0.093*** (0.017) -0.046** (0.017)
Education (reference:
none/primary)
Secondary -0.473*** (0.057) -0.650*** (0.049)
Tertiary -1.477*** (0.111) -1.746*** (0.159)
Professional training 0.279*** (0.066) 0.340*** (0.060)
Married 0.238*** (0.071) 0.372*** (0.052)
Household head 0.753*** (0.077) 0.331*** (0.069)
Household size -0.010 (0.007) 0.007 (0.007)
Urban area -0.890*** (0.061) -0.864*** (0.051)
Capital -0.533*** (0.070) -0.697*** (0.057)
Constant -0.484** (0.233) -0.878*** (0.199)
Number of observations 4,824 6,313
Wald Chi 2 (Prob > Chi 2) 1,320 (0.000) 1,690 (0.000)
Pseudo R2 0.3975 0.4043
Source: Authors’ calculations based on data from Employment and Informal Sector Survey (EISS) 1 (2005) and
2 (2010).
Note: Robust standard errors in parentheses. *Significant at 10 per cent level; **Significant at 5 per cent level;
***Significant at 1 per cent level.

27
References
Afeju BJ (2014). Does the Impact of Trade Liberalization on the Informal Sector Have a
Gendered Dimension? A Re-examination of the Evidence. International Journal of
Economics, Commerce and Management 2(10).
Aguayo-Tellez E (2011). The Impact of Trade Liberalization Policies and FDI on Gender
Inequalities: A Literature Review. Gender Equality and Development Background Paper for
the World Development Report 2012. World Bank, Washington, DC
AlAzzawi S (2014). Trade Liberalization, Industry Concentration and Female Workers: The
Case of Egypt. IZA Journal of Labor Policy (3)20.
Arndt C, Robinson S, and Tarp F (2006). Trade Reform and Gender in Mozambique. Nordic
Journal of Political Economy 32(1): 73–89.
Artecona R, and Cunningham W (2002). Effects of Trade Liberalization on the Gender Gap in
Mexico. Policy Research Report on Gender and Development No. 21. World Bank,
Washington, DC.
Banerjee P, and Veeramani C (2015). Trade Liberalization and Women’s Employment
Intensity: Analysis of India’s Manufacturing Industries, Indira Gandhi Institute of
Development Research Working Paper-2015-018. Available at:
http://www.igidr.ac.in/pdf/publication/WP-2015-018.pdf (accessed on 10 March 2016).
Becker G (1971). The Economics of Discrimination. Chicago: University of Chicago Press.
Berik, G (2000). Mature Export-Led Growth and Gender Wage Inequality in Taiwan.
Feminist Economics 6(3): 1–26.
Black SE, and Brainerd E (2004). Importing Equality? The Impact of Globalization on
Gender Discrimination. Industrial and Labor Relations Review 57(4): 540–59.
Blinder AS (1973). Wage Discrimination: Reduced Form and Structural Elements. Journal of
Human Resources 8(4): 436–55.
Cockburn J, and Njikam O (2011). Trade Liberalization and Productivity Growth: Firm-Level
Evidence from Cameroon. The Journal of Developing Areas 44(2): 279–302.
Cockburn J, Decaluwe B, Fofana I, and Robichaud V (2009). Trade, Growth, and Gender in
Developing Countries: A Comparison of Ghana, Honduras, Senegal, and Uganda. In Gender
Aspects of the Trade and Poverty Nexus: A Macro-Micro Approach, edited by Bussolo M,
and De Hoyos RE. Washington, DC: Palgrave MacMillan and the World Bank.
Darity W, and Williams R (1985). Peddlers Forever? Culture, Competition, and
Discrimination. American Economic Review 75(2): 256–61.
Emini A, Kamgnia Dia B, Nembot Ndeffo L, Cockburn J, Decaluwe B, and Fofana I
(2010). Libéralisation commerciale et pauvreté en Afrique: le cas du Cameroun. In
Libéralisation commerciale et pauvreté en Afrique, edited by Cockburn J, Decaluwé B, and
Fofana I. Quebec: Presses de l’Université de Laval.

28
Fontana M (2003). The Gender Effect of Trade Liberalization in Developing Countries: A
Review of the Literature. Department of Economics, University of Sussex Discussion Paper
No. 101.
Fontana M, and Wood A (2000). Modeling the Effects of Trade on Women, at Work and at
Home. World Development 28(7): 1173–190.
Gamberoni E, and Reis J (2011). Gender-Informing Aid for Trade: Entry Point and Initial
Lessons Learned from the World Bank. Economic Premise 62 (July): 1–4.
Greenaway D, and Nelson RR (2000). The Assessment: Globalization and Labour Market
Adjustment. Oxford Review of Economics Policy 16.
Haouas I, Yagoubi M, and Heshmati A (2003). The Impacts of Trade Liberalization on
Employment and Wages in Tunisian Industries. IZA Discussion Paper No. 688. Institute for
the Study of Labor, Bonn.
Harrison A, and Hanson G (1999). Who Gains from Trade Reforms? Some Remaining
Puzzles. Journal of Development Economics 59(1): 125–54.
Heckman JJ (1979). Sample selection bias as a specification error. Econometrica 47(1): 153-
161.
Horton S, Kanbur R, and Mazumdar D (1991). Labor Markets in an Era of Adjustment:
Evidence from 12 Developing Countries. International Labor Review 130: 531–58.
International Labour Organization (ILO) (1983). Thirteenth International Conference of
Labour Statisticians, Resolution Concerning Statistics of the Economically Active Population,
Employment, Unemployment and Underemployment. ILO Bulletin of Labour Statistics 1983-
3: 11–15.
International Monetary Fund (IMF) 2010. Cameroon: Poverty Reduction Strategy Paper. IMF
Country Report No. 10/257. International Monetary Fund, Washington, DC. Available at:
http://www.imf.org/external/pubs/ft/scr/2010/cr10257.pdf
Lulit M, and Claude B (2008). L’impact de la liberalisation commerciale sur le travail des
femmes. Une analyse comparative entre l’Afrique du Sud et l’Ethiopie a l’aide d’une
approche en Equilibre General Calculable. Panoeconomicus 55(1) : 69–88.
Ministère de l’Economie, de la Planification et de l’Aménagement du Territoire (MINEPAT)
(2015). Rapport sur le climat des affaires au Cameroun en 2014.
Nicita A (2008). Who Benefits from Export-led Growth? Evidence from Madagascar’s
Textile and Apparel Industry. Journal of African Economies 17(3): 465–89.
Njikam O, and Kouty M (2012). Foreign Competition and the Demand for Labour: Evidence
from Cameroon. CSAE 2013 Conference Paper 224, Centre for the Study of African
Economics, St. Catherine College, Oxford, 17–19 March.
Oaxaca R (1973). Male-Female Wage Differentials in Urban Labor Markets. International
Economic Review 14(3): 693–709.

29
Oostendorp, RH (2009). Globalization and the Gender Wage Gap. World Bank Economic
Review 23(1): 141–61.
Ozler S (2000). Export Orientation and Female Share of Employment: Evidence from Turkey.
World Development 28: 1239–248.
Pham TH, Le Thai TQ, Nguyen TTV, and Ngo QT (2008). Gender Inequality and Labour
Market Segmentation under Trade Reform: Evidence of the Gender Wage Gap from Vietnam,
1993-2004. PEP Research Report No. 11029.
Psacharopoulos G (1985). Returns to Education: A Further International Update and
Implications. The Journal of Human Resources 20(4): 583–604.
Reilly B, and Dutta PV (2005). The Gender Pay Gap and Trade Liberalization: Evidence for
India. PRUS Working Paper No. 32, Poverty Research Unit at Sussex, University of Sussex.
Seguino S (2000). The Effects of Structural Change and Economic Liberalisation on Gender
Wage Differentials in South Korea and Taiwan. Cambridge Journal of Economics 24(4):
437–59.
Tejani S, and Milberg W (2010). Global Defeminization? Industrial Upgrading, Occupational
Segmentation and Manufacturing Employment in Middle Income Countries. SCEPA Working
Paper 1010-1, Schwartz Center for Economic Policy Analysis, The New School, New York.
United Nations Conference on Trade and Development (UNCTAD) (2010). Virtual Institute
Teaching Material on Trade and Poverty. UNCTAD, New York and Geneva.
United Nations Industrial Development Organization (UNIDO) (2005). Industrial
Performance and Capabilities of Cameroon: Analysis of the Industrial Sector. Ministry of
Mines, Industry, and Technological Development (MINMIDT), Republic of Cameroon,
December.
Williams R (1987). Capital, Competition, and Discrimination: A Reconsideration of Racial
Earnings Inequality. Review of Radical Political Economics 19(2):1–15.
Williamson J (2004). The Washington Consensus as Policy Prescription for Development.
Practitioners of Development Lecture, World Bank, Washington, DC, January 13.
Wood A (1991). North-South Trade and Female Labour in Manufacturing: An Asymmetry.
Journal of Development Studies 27(2): 168–89.
World Bank (2011). Gender Equality and Development. World Development Report 2012.
Washington, DC: World Bank.
Yanikkaya H (2003). Trade Openness and Economic Growth: a Cross-country Empirical
Investigation. Journal of Development Economics 72(1): 57–89.