towards decent work in lebanon: issues and challenges in ... · pdf filetowards decent work in...
TRANSCRIPT
Towards Decent Work in Lebanon:
Issues and Challenges in Light of the
Syrian Refugee Crisis
International Labour Organization
Regional Office for Arab States
Towards Decent Work in Lebanon:
Issues and Challenges in Light of the
Syrian Refugee Crisis
Salem Ajluni and Mary Kawar
International Labour Organization
Regional Office for Arab States
Copyright © International Labour Organization 2015
First published 2015
Publications of the International Labour Office enjoy copyright under Protocol 2 of the Universal Copyright
Convention. Nevertheless, short excerpts from them may be reproduced without authorization, on condition that the
source is indicated. For rights of reproduction or translation, application should be made to ILO Publications (Rights
and Permissions) at the below address or by email: [email protected]. The International Labour Office welcomes
such applications.
Libraries, institutions and other users registered with reproduction rights organizations may make copies in
accordance with the licences issued to them for this purpose. Visit www.ifrro.org to find the reproduction rights
organization in your country.
ILO Cataloguing in Publication Data
Ajluni, Salem; Kawar, Mary
Towards decent work in Lebanon : issues and challenges in light of the Syrian refugee crisis / Salem Ajluni and
Mary Kawar ; International Labour Organization, ILO Regional Office for Arab States. - Beirut: ILO, 2015
ISBN: 9789221299530 (webpdf)
International Labour Organization; ILO Regional Office for Arab States
labour market analysis / decent work / labour force participation / macroeconomics / demographic aspect / labour
market / working conditions / migration policy / refugee / migrant worker / unskilled worker / Lebanon / Syrian
Arab Republic
13.01.1
The designations employed in ILO publications, which are in conformity with United Nations practice, and the
presentation of material therein do not imply the expression of any opinion whatsoever on the part of the
International Labour Office concerning the legal status of any country, area or territory or of its authorities, or
concerning the delimitation of its frontiers.
The responsibility for opinions expressed in signed articles, studies and other contributions rests solely with their
authors, and publication does not constitute an endorsement by the International Labour Office of the opinions
expressed in them.
Reference to names of firms and commercial products and processes does not imply their endorsement by the
International Labour Office, and any failure to mention a particular firm, commercial product or process is not a sign
of disapproval.
ILO publications can be obtained through major booksellers or ILO local offices in many countries, or direct from
ILO Publications, International Labour Office, CH-1211 Geneva 22, Switzerland. Catalogues or lists of new
publications are available free of charge from the above address, or by email: [email protected] Visit our website:
www.ilo.org/publns
For ILO Regional Office for Arab States publications, please contact:
ILO Regional Office for Arab States P.O.Box 11-4088 Riad El Solh 1107-2150
Beirut – Lebanon
Publications are available on: www.ilo.org/arabstates
Contents
List of tables .................................................................................................................................................. 1
Preface .......................................................................................................................................................... 2
Executive Summary ....................................................................................................................................... 3
6. Syrian Refugees: Livelihoods and Access to Work ................................................................................ 7
Introduction .................................................................................................................................................. 8
I. MACROECONOMIC CONDITIONS ............................................................................................................... 8
1. Macroeconomic Evolution .................................................................................................................... 9
2. Explaining stagnant growth and productivity ..................................................................................... 12
3. Macroeconomic impacts of the Syrian crisis ...................................................................................... 13
II. DEMOGRAPHIC CONDITIONS .................................................................................................................. 13
1. Population and demography in Lebanon ............................................................................................ 13
2. Dependency ratio ................................................................................................................................ 16
3. Emigration and immigration ............................................................................................................... 16
4. The Lebanese diaspora ....................................................................................................................... 18
III. LABOUR MARKET CONDITIONS .............................................................................................................. 19
1. Lebanon’s labour force ....................................................................................................................... 19
2. Employment and unemployment ....................................................................................................... 21
3. Education and skills of the labour force .............................................................................................. 22
4. Activity composition of employment .................................................................................................. 23
5. Informality in Lebanon’s labour market ............................................................................................. 24
6. Wages .................................................................................................................................................. 26
7. Social protection ................................................................................................................................. 28
8. Child Labour ........................................................................................................................................ 29
IV. REFUGEES AND MIGRANTS IN THE LEBANESE LABOUR MARKET ......................................................... 29
1. The Palestinian refugee population and labour force in Lebanon ..................................................... 30
2. Syrian refugee population and labour force in Lebanon .................................................................... 33
3. Assessing the aggregate impact of Syrian refugees on the labour market ........................................ 38
V. ADDRESSING DECENT WORK DEFICITS IN LEBANON .............................................................................. 39
1. Macroeconomic policies ..................................................................................................................... 40
2. Job creation ......................................................................................................................................... 40
3. The role of the Ministry of Labour ...................................................................................................... 41
4. Social protection policies .................................................................................................................... 42
5. Social dialogue at the national level ................................................................................................... 43
6. Syrian Refugees: Livelihoods and access to work .............................................................................. 43
APPENDIX .................................................................................................................................................... 45

1
List of tables
Table 1: Estimated GDP for Lebanon
Table 2: Estimated index of GDP growth for Lebanon
Table 3: Estimated index of per capita GDP growth for Lebanon
Table 4: Estimated index of growth in output per worker for Lebanon
Table 5: Population estimates for Lebanon, 1990–2013
Table 6: Demographic profile of Lebanon, neighbouring Arab countries and more/less developed regions of the world, 2010
Table 7: Estimated Lebanese dependency ratios by governorate in Lebanon 2009
Table 8: Estimated net emigration and immigration for Lebanon, 1960–2010
Table 9: Estimate of the stock of Lebanese migrants, 2013
Table 10: Estimated population, labour force and employment trends in Lebanon, 1990–2010
Table 11: Estimated activity distribution of employment in Lebanon, 2004 and 2009
Table 12: Estimated employment status of all employed in Lebanon, 2009
Table 13: Estimated informality of employment by main economic activity in Lebanon, 2009
Table 14: Estimated median monthly earnings by employment status in the private sector of Lebanon, 2010
Table 15: Estimated Palestinian labour force profile in Lebanon, 2010–2011
Table 16: Estimates of Palestinian employment in Lebanon by activity, 2010–2011
Table 17: Syrian refugees registered by UNHCR in Lebanon, end-2012 to mid-2014
Table 18: Estimated Syrian refugee population by governorate in Lebanon, mid-2014
Table 19: Estimated dependency and sex ratios for registered Syrian refugees in Lebanon, mid-2014
Table 20: Estimated Syrian refugee labour force profile in Lebanon, 2013–2014
Table 21: Estimated Syrian refugee economic activity distribution in Lebanon, 2013–2014
2
Preface
Since the outbreak of the civil war in Syria, the Government of Lebanon has been struggling to deal with
the economic, social and other consequences of the conflict, including refugee inflows of
unprecedented magnitude. Lebanon, already the region’s most densely populated country, has become
the largest host nation, both in absolute terms and considering the limited size of its territory and its
small population. Among the negative impacts, the labour market has particularly been stretched as
Syrian refugees seek work in order to survive. Yet, Lebanon was already suffering from pre-exiting
labour market challenges, pertaining to the limited creation of decent jobs and deteriorating labour
standards in many employment sectors.
This report focuses on both the quantity and quality of jobs in Lebanon in the wake of the Syrian refugee
crisis. Its purpose is to bring attention to the fact that unemployment rates are only one part of the
problem in Lebanon and that it is important to focus on decent work in tandem with the reduction of
unemployment. Decent work has been defined by the International Labour Organization and endorsed
by the international community as being productive work in conditions of freedom, equity, security and
human dignity. Decent work delivers a fair income, provides security in the workplace and social
protection for workers and their families, encourages social integration, gives people the freedom to
express their concerns, collectively organize and participate in decisions that affect their lives, and
guarantees equal opportunities for all. This is what Lebanon needs today.
The main author of this report is Salem Ajluni, ILO consultant, with overall management and the
addition of several sections by Mary Kawar, Senior Employment Policy specialist at the Regional Office of
the ILO. The report benefitted from comments and reviews by Patrick Daru, Ursula Kulke and Zafiris
Tzannatos. Aya Jaafar, research economist, provided substantial and invaluable statistical and analytical
support throughout this process.
3
Executive Summary
The objective of this report is to review labour market and employment conditions in Lebanon in the
wake of the Syrian refugee crisis. The basic premise is that major challenges in the Lebanese labour
market include not only high unemployment rates but also poor working conditions, which are caused
by increasing demand for a low-skilled work force. The outcome is a ‘downward spiral’ towards
increasingly dire working conditions in low productivity sectors. While an absence of decent work is not
new to Lebanon, the addition of hundreds of thousands of largely low-skilled Syrian workers is
exacerbating an already fragile situation. Therefore, one of the reasons why the situation in Lebanon has
not imploded with the unlimited supply of unskilled irregular Syrian workers is precisely because this is
how the labour market is structured.
This report attempts to highlight labour market fragility and vulnerability. However, in the absence of
regular statistics such as labour force surveys, it is based on existing data from national and international
sources such as the World Bank, UNDESDA and UNHCR. This is in addition to ILO surveys on Syrian and
Palestinian refugees and child labour to assess specific labour market exclusions. An analysis of these
secondary sources aims to provide an intermediate understanding of the situation until a fuller, regular
labour force survey is available in Lebanon.
Political uncertainty continues to hold back economic growth
Lebanon may be in a “slow growth trap,” with relatively low rates of real economic growth and weak
competitiveness vis-à-vis the global market. Slow growth has been attributed to relatively low levels of
private and public investment and insufficient business competition in the domestic market. Underlying
the deceleration in growth may be political uncertainties, which have biased investment into shorter-
term financial instruments and real estate. Such non-productive investment does little to enhance
labour productivity. After two decades of mediocre growth, average growth in worker productivity
turned negative after 2010, suggesting increasing employment in relatively low quality, low-paying jobs
in informal activities. Among the anticipated spillover effects of the conflict in Syria are a US$7.5 billion
reduction in output and incomes through end-2014, a loss of government revenues estimated at US$1.6
billion and increased government expenditures to cope with the influx of refugees of US$1.2 billion.
Furthermore, the crisis has severely damaged the Syrian economy, a historically large and close trading
partner of Lebanon, and the source of relatively low-cost food products and consumer goods for
Lebanon.
Shifts in the distribution of employment and productivity in favour of demand for low skills
During the past decade, while there were some employment gains in all economic activities, growth in
productive activities such as agriculture and manufacturing was very slow. Overall, trade accounted for
about 47.3 per cent of all new employment, public and private services for 34.7 per cent, and
construction for nearly 10 per cent. Thus, relatively low productivity activities dominated employment
growth as higher productivity activities such as transport, communications and financial services have
not grown proportionally.
4
The influx of Syrian refugees has had a dramatic effect on the Lebanese population, which has been undergoing a demographic transition with decreasing fertility rates
Lebanon’s demography increasingly resembles that of a more developed country. Natural population
growth has fallen to below 1 per cent per year. Estimates suggest that about two-thirds of population
growth in Lebanon since the year 2000 has been from in-migration, much of which has consisted of
either refugees or migrant workers. The recent influx of Syrian refugees is the latest, largest and perhaps
most consequential episode in the history of immigration in Lebanon. According to some estimates, one
in every four persons in Lebanon is a Syrian refugee.
High unemployment persists, indicating its structural nature
Population growth, fuelled by immigration and combined with disproportionate growth of the working-
age population and growing participation rates (especially among women), resulted in an estimated
doubling of the labour force in Lebanon over the period 1990–2010. In tandem, employment grew such
that unemployment rates averaged below 9 per cent throughout this period, although the absolute
number of unemployed nearly doubled. Unemployment rates among women were about twice the
average and, for youth in the 15–24 cohort, more than three times the average.
Young Lebanese are ‘discouraged’ from working and aspire for out-migration
Inactivity rates of the youth in Lebanon are high, registering 70 per cent in 2013 compared to a global
average of 52.6 per cent. This suggests a serious problem of discouragement that may impact the future
personal, social and economic development of individuals. Indeed, incentives play a major role in
shaping young people’s decisions and aspirations; lack of demand for a skilled educated workforce,
together with prevailing low-standard working conditions, discourages youth from participating.
According to a Gallup survey in 2010, as many as 37 per cent of Lebanese youth expressed their
willingness to emigrate permanently.
For those who work, a large proportion is working informally in insecure working conditions
About 44 per cent of those employed fell into these categories: self-employed; paid hourly, daily,
weekly, or on a productivity basis; or working (paid or unpaid) for family. Most of these workers lack
formal work contracts or social protection. If employers who are mainly owners of small, mostly
informal enterprises are included, the share of informally-employed persons in Lebanon would even be
higher.
Wages remain low with more than half of those informally employed earning less than the minimum wage
While wage data for Lebanon is scarce, some relatively recent survey data on private sector wages
indicate that the average median monthly earnings was about US$616 in 2010. Those employed in the
formal private sector, as well as the self-employed, were found to have above-average earnings
(US$667) and those in the informal economy had below-average earnings (US$442). In other words,
approximately half of those in informal employment earned less than the legal minimum wage of
US$450 per month. In addition, some portion of those formally employed and self-employed likewise
have earnings below the monthly legal minimum.
5
Moreover, social security remains limited in scope and coverage
Given the high level of informality, a significant number of Lebanese workers do not have access to
formal social protection. About 38 per cent of the Lebanese population do not benefit from any type of
health insurance. More than 80 per cent of Lebanon’s over-65 population have no pension or health
coverage – with Lebanon probably being the only upper middle income country without pensions for
private sector workers. The End-of-Service-Indemnity programme for formal private-sector employees,
which is managed by the National Social Security Fund (NSSF), covers only around 30 per cent of the
labour force. Fragmentation and discontinuities in the system of social protection translates into
vulnerability, marginalization and poverty for a significant share of the working and retired population in
Lebanon.
Child labour is a re-emerging issue after some recent progress
Combating child labour has been one area that has received government commitment in Lebanon and,
while exact numbers are not available, progress was being made. Nevertheless, it is a re-emerging
phenomenon with the large influx of Syrian refugees, the majority of whom are children (53 per cent
below the age of 18), with 73 per cent of these not attending school and thus, in principle, available to
supplement their families’ earnings through work. A recent survey of 1,500 street children found that
the majority were Syrians and were engaging in petty trade.
A significant part of the labour market is composed of non-Lebanese and vulnerable workers, indicating high levels of exclusion
The Lebanese labour market has historically had an open-door policy to migrant workers. Almost all
these workers are engaged in low-skilled jobs from services to construction to domestic work, where
most lack access to minimum labour standards. Beyond this have been the significant refugee
populations who remain vulnerable. The largest group are Palestinian refugees, who do not have the
right to work in many professions under Lebanese law since 1948, and, of course, Syrian refugees who,
as a result of their large presence, can face hardships and exploitation in the labour market. According
to ILO surveys, both populations work almost exclusively in the informal economy, with no social
protection, long hours and, on average, earning less than the minimum wage.
ADDRESSING DECENT WORK DEFICITS IN LEBANON 1. Strengthening macroeconomic policies for economic growth and job creation
For promoting decent work in Lebanon it is necessary to address macroeconomic conditions for
continued growth. This includes fiscal prudence to insure macroeconomic stability, as well as necessary
public infrastructure spending supported by a more rational system of taxation. Likewise, improved
access to credit for the large number of self-employed would give incentives for many entrepreneurs to
increase the scale of their enterprises and enhance the employment of more educated and skilled
labour. Another medium- to long-term growth strategy might be the development of private-public
collaborations that would take advantage of Lebanon’s educated and skilled workforce to produce high

6
value-added goods and services. Fostering competition through controlling corruption and regulating
anti-competitive activities would also go a long way to enhancing employment-creating growth.
2. Creating new jobs with a focus on value-added new sectors
The high unemployment and low economic activity rates among youth point to a serious deficit in the
creation of decent jobs. Efforts can be targeted to create the type of jobs that provide decent living
standards. For example, the very large number of small businesses in the country can form the basis for
policies designed to consolidate and scale up production processes and modernize marketing. These can
be achieved by increasing the number of entrepreneurship and self-employment development and
training programmes, market-relevant skills development (including vocational education) and credit
facilities. In addition, it is necessary to create the proper regulatory framework that is both conducive to
the formalization of enterprises and, at the same time, able to expand market access for goods and
services produced by such enterprises. Over and above, it is essential to look into new non-traditional
sectors which are attractive to young people. For example, encouraging the development of solar, wind
and other alternative sources of energy would diversify the base of sustainable productive employment
in the country and serve several labour market (and macroeconomic) objectives, including engaging a
relatively large number of semi-skilled and skilled people, as well as a large number of small businesses.
3. Strengthening the Ministry of Labour so that it is better enabled to enforce compliance with labour standards
The Ministry of Labour has, potentially, a pivotal role to play. It is responsible for employment
conditions, labour relations, labour inspection and for shaping employment policy, including the
employment of foreigners and domestic workers. These areas all correspond to the critical challenges
that Lebanon is currently facing. The Ministry, as the central administrative authority in the field of
labour, could be strengthened so that it can become the driving force in elaborating and implementing
labour policies within its mandate. While humanitarian assistance and job-creation programmes are
needed to stabilize the impact of the Syrian refugee crisis in Lebanon in the short term, addressing the
medium-term and long-term labour market governance challenges are just as important and they will
require substantial reform of all labour market institutions, updating of the regulatory framework and
ensuring the production and use of reliable labour market data.
4. Promoting more equitable social protection policies
A vast number of workers in Lebanon are vulnerable and suffer from social exclusion. High rates of informality, low female labour market participation and high levels of unemployment further contribute to the effectively low social protection coverage. In addition, the social protection system is very fragmented and provides only a limited range of benefits. When broader schemes were available, such as various subsidies, they were often poorly targeted. Social security is not only a universal human right and a necessity, but also plays a pivotal role in alleviating poverty, facilitating economic and social development and fostering decent work. When some categories of workers are excluded this creates labour market distortions which are likely to jeopardize the functioning of the whole labour market and the productivity of the workers themselves. What is needed in Lebanon today is a new approach towards social protection; one which is based on social solidarity, redistribution. In this regard, it is essential that Lebanon develops a coherent national social security system which brings together under
7
one policy framework the different types of programmes, target groups and modes of provision. As a first step in this direction, Lebanon should consider adopting a national social protection floor which would ensure a minimum set of social protection guarantees for all those who are not covered by any social security system. These guarantees should comprise, at least, essential health care; basic income security for children; basic income security for persons in active age who are unable to earn sufficient income; and basic income security for older persons.
5. Building consensus through social dialogue at the national level
In recent years, the Lebanese Government has been unable to play an effective role in the face of weak
institutions, outdated laws and a political impasse, which has put a freeze on passing the necessary laws,
regulations and policies through Parliament. At the same time, workers’ and employers’ organizations
are struggling to respond to the needs of workers and enterprises alike. In addressing the interest and
needs of workers and enterprises, social dialogue can be an effective tool which opens doors for
achieving mutual trust among the different economic actors and the Government, preventing social
unrest and maintaining social cohesion. Social dialogue can take different forms, from the simple
exchange of information or consultations to full-fledged negotiations for developing policies or agreeing
on regulations. For this to happen, workers’ and employers’ organizations must play a central role in
reaching out to workers and owners of enterprises, particularly those in SMEs and the informal
economy.
6. Syrian Refugees: Livelihoods and access to work
The influx of Syrian refugees into the Lebanese labour market has severely affected an already fragile
situation. While there are currently significant humanitarian efforts to address the subsistence needs of
the refugees in addition to the Lebanese Crisis Response Plan 2015-2016 (LCRP) which address
Lebanese host community needs, both need to be scaled up substantially. Moreover, if humanitarian
assistance is reduced with no sign of resolution to the conflict in Syria and a return of refugees to their
homes, greater number of Syrian refugees will continue to enter the labour market and drive working
conditions and wages down.
Therefore, it is necessary to address the livelihoods and employment needs of Syrian refugees and
Lebanese host communities alike. Moreover, it is advised that the Lebanese Government looks into the
procedures limiting the access of Syrian refugees to work. It is possible to ease this access in specific
sectors according to the prevailing laws and which are not likely to significantly affect Lebanese Labour.
Providing Syrian refugees access to work under clarified procedures can only be beneficial for the
following reasons: it allows the Lebanese authorities more control of the labour market and protecting
some sectors for the Lebanese; it addresses the labour shortages which exists in some sectors and which
is always supplied by non-Lebanese workers; improved earnings of Syrians means improved
consumption levels which will positively affect the economy and finally, income security for Syrians will
lead to improved social cohesion.
8
Introduction
The objective of this report is to provide insights into Lebanon’s labour market four years after the onset
of the Syrian refugee crisis. The impacts of the crisis on the demand side of the labour market are
considered within the contexts of the macroeconomic trajectory of the Lebanese economy prior to the
crisis and the macroeconomic impact of the Syrian conflict. The supply side of the labour market is
related to population and demographic developments, not least of which is significant migration. A
review of the general situation of Lebanon’s labour force is augmented by a discussion of the Palestinian
and Syrian refugee populations, their demography and their labour market participation, which
demonstrates existing labour market vulnerability.
In terms of methodology, and in the absence of regular Lebanese labour force data, the report relies on
existing sources from international organizations such as the World Bank, UNHCR and UNDESA. It also
uses available ILO reports and surveys, particularly on Syrian and Palestinian refugees and child labour,
to assess specific exclusions from the labour market. An analysis of these secondary sources aims to
provide an intermediate understanding of the situation until a fuller regular labour force survey is
available in Lebanon.
The report is structured around five sections. First, it reviews macroeconomic policies that may help
accelerate employment growth. Second, it focuses on the demographic conditions that influence labour
supply. Third, it highlights labour market conditions, focusing on the structure of employment as well as
the existing deficits in working conditions. Section 4 then concentrates on the working conditions of
both Syrian and Palestinian refugees as a means to demonstrate the fragility and vulnerability of large
segments of the Lebanese labour market. Finally, section 5 provides policy recommendations that
address macroeconomic conditions, job generation, the role of the Ministry of Labour, the importance
of social protection policies, the need for social dialogue at the national level and social cohesion at the
local level, while expanding and sustaining emergency interventions to address the Syrian refugee crisis
and simultaneously support host communities.
I. MACROECONOMIC CONDITIONS
The Lebanese economy is being profoundly affected by the crisis in Syria. While slowing output and
employment growth and declining worker productivity and per capita GDP were pre-existing trends, the
disruption of trade routes and tourism, the influx of refugees and greater political instability caused by
the crisis have created added burdens. Among these are greater fiscal pressures and reduced spending
in construction and tourist-related activities, which had been the main sources of growth in recent
years.
9
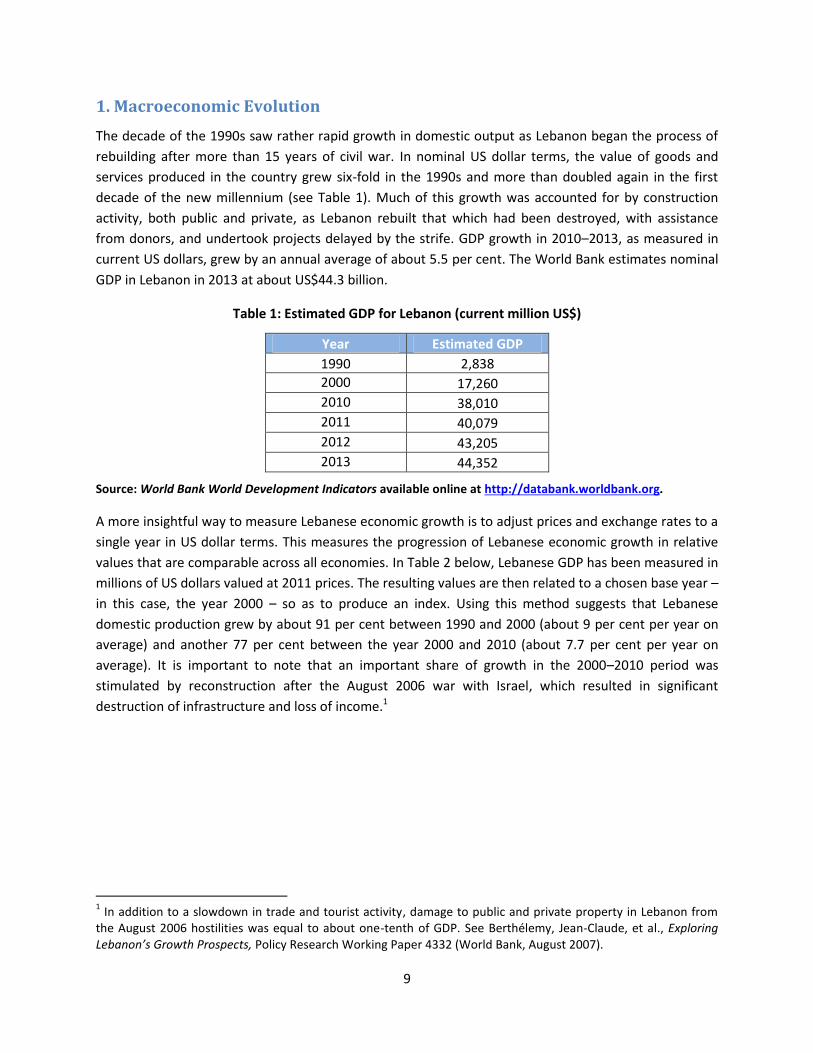
1. Macroeconomic Evolution
The decade of the 1990s saw rather rapid growth in domestic output as Lebanon began the process of
rebuilding after more than 15 years of civil war. In nominal US dollar terms, the value of goods and
services produced in the country grew six-fold in the 1990s and more than doubled again in the first
decade of the new millennium (see Table 1). Much of this growth was accounted for by construction
activity, both public and private, as Lebanon rebuilt that which had been destroyed, with assistance
from donors, and undertook projects delayed by the strife. GDP growth in 2010–2013, as measured in
current US dollars, grew by an annual average of about 5.5 per cent. The World Bank estimates nominal
GDP in Lebanon in 2013 at about US$44.3 billion.
Table 1: Estimated GDP for Lebanon (current million US$)
Year Estimated GDP
1990 2,838
2000 17,260
2010 38,010
2011 40,079
2012 43,205
2013 44,352
Source: World Bank World Development Indicators available online at http://databank.worldbank.org.
A more insightful way to measure Lebanese economic growth is to adjust prices and exchange rates to a
single year in US dollar terms. This measures the progression of Lebanese economic growth in relative
values that are comparable across all economies. In Table 2 below, Lebanese GDP has been measured in
millions of US dollars valued at 2011 prices. The resulting values are then related to a chosen base year –
in this case, the year 2000 – so as to produce an index. Using this method suggests that Lebanese
domestic production grew by about 91 per cent between 1990 and 2000 (about 9 per cent per year on
average) and another 77 per cent between the year 2000 and 2010 (about 7.7 per cent per year on
average). It is important to note that an important share of growth in the 2000–2010 period was
stimulated by reconstruction after the August 2006 war with Israel, which resulted in significant
destruction of infrastructure and loss of income.1
1 In addition to a slowdown in trade and tourist activity, damage to public and private property in Lebanon from
the August 2006 hostilities was equal to about one-tenth of GDP. See Berthélemy, Jean-Claude, et al., Exploring Lebanon’s Growth Prospects, Policy Research Working Paper 4332 (World Bank, August 2007).
10
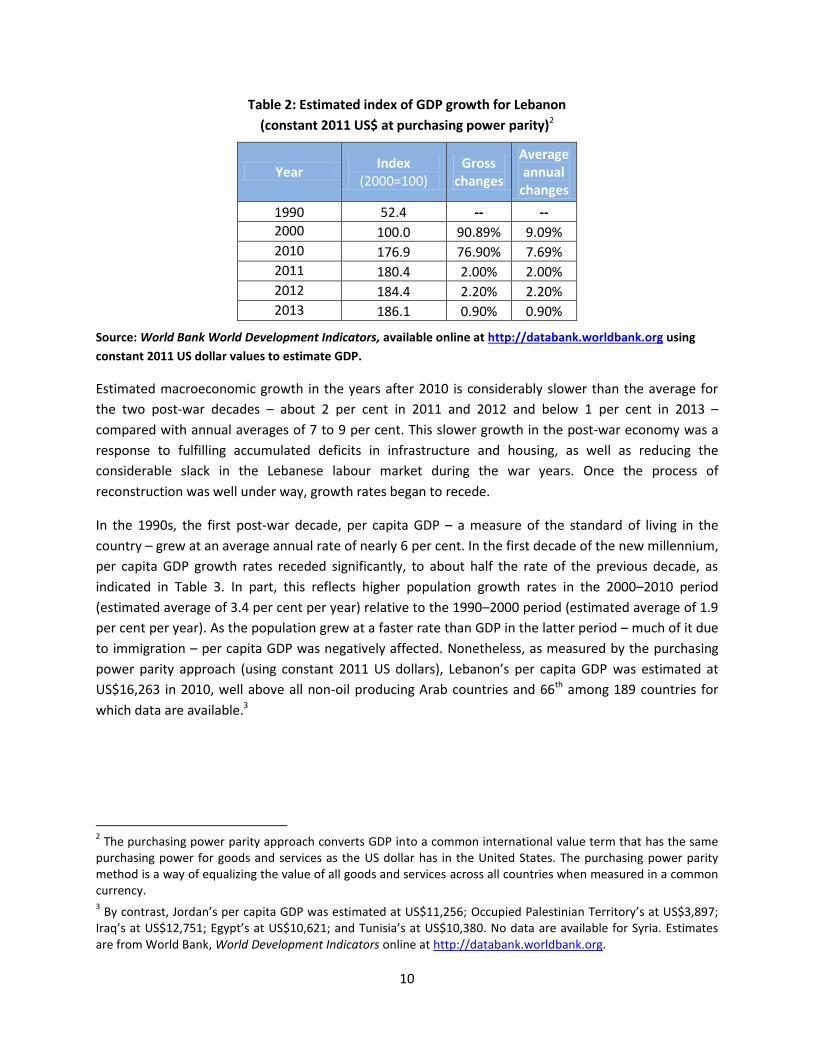
Table 2: Estimated index of GDP growth for Lebanon
(constant 2011 US$ at purchasing power parity)2
Year Index
(2000=100) Gross
changes
Average annual
changes
1990 52.4 -- --
2000 100.0 90.89% 9.09%
2010 176.9 76.90% 7.69%
2011 180.4 2.00% 2.00%
2012 184.4 2.20% 2.20%
2013 186.1 0.90% 0.90%
Source: World Bank World Development Indicators, available online at http://databank.worldbank.org using
constant 2011 US dollar values to estimate GDP.
Estimated macroeconomic growth in the years after 2010 is considerably slower than the average for
the two post-war decades – about 2 per cent in 2011 and 2012 and below 1 per cent in 2013 –
compared with annual averages of 7 to 9 per cent. This slower growth in the post-war economy was a
response to fulfilling accumulated deficits in infrastructure and housing, as well as reducing the
considerable slack in the Lebanese labour market during the war years. Once the process of
reconstruction was well under way, growth rates began to recede.
In the 1990s, the first post-war decade, per capita GDP – a measure of the standard of living in the
country – grew at an average annual rate of nearly 6 per cent. In the first decade of the new millennium,
per capita GDP growth rates receded significantly, to about half the rate of the previous decade, as
indicated in Table 3. In part, this reflects higher population growth rates in the 2000–2010 period
(estimated average of 3.4 per cent per year) relative to the 1990–2000 period (estimated average of 1.9
per cent per year). As the population grew at a faster rate than GDP in the latter period – much of it due
to immigration – per capita GDP was negatively affected. Nonetheless, as measured by the purchasing
power parity approach (using constant 2011 US dollars), Lebanon’s per capita GDP was estimated at
US$16,263 in 2010, well above all non-oil producing Arab countries and 66th among 189 countries for
which data are available.3
2 The purchasing power parity approach converts GDP into a common international value term that has the same
purchasing power for goods and services as the US dollar has in the United States. The purchasing power parity method is a way of equalizing the value of all goods and services across all countries when measured in a common currency. 3 By contrast, Jordan’s per capita GDP was estimated at US$11,256; Occupied Palestinian Territory’s at US$3,897;
Iraq’s at US$12,751; Egypt’s at US$10,621; and Tunisia’s at US$10,380. No data are available for Syria. Estimates are from World Bank, World Development Indicators online at http://databank.worldbank.org.
11
Table 3: Estimated index of per capita GDP growth for Lebanon
(constant 2011 US$ at purchasing power parity)4
Year Index
(2000= 100) Gross
changes
Average annual change
1990 62.70 – –
2000 100.00 59.48% 5.95%
2010 131.84 31.84% 3.18%
2011 133.21 1.03% 1.03%
2012 134.84 1.23% 1.23%
2013 134.76 -0.06% -0.06%
Slower per capita GDP growth also reflected the declining average productivity of Lebanese labour
generally, i.e. the value of output produced by the average worker. Table 4 below indicates that the
growth rate of value added by Lebanese workers was barely positive in the two post-civil war decade.
After 2010, growth in worker productivity is estimated to be negative.
Table 4: Estimated index of growth in output per worker for Lebanon
(constant 2011 US$ at purchasing power parity)5
Year Output per
worker index (2000= 100)
Gross changes
Average annual change
1991 95.02 – –
2000 100.00 5.24% 0.58%
2010 110.09 10.09% 1.01%
2011 107.84 -2.05% -2.05%
2012 103.31 -4.21% -4.21%
This suggests that during the reconstruction phase of the Lebanese development process, output rose
faster than employment. The annual estimates suggest this was the case until the year 2000. After that
year average growth in worker productivity turned negative, meaning that output grew more slowly
than the level of employment. This trend was temporarily reversed after the August 2006 war with
Israel, but average productivity growth once again turned negative after 2010. This suggests that the
4 The data in this table are derived by dividing the underlying GDP estimates used as the basis for the previous
table by the total estimated Lebanese population for each year. Population data were taken from World Bank, World Development Indicators online at http://databank.worldbank.org. 5 The data in this table are derived by dividing the underlying GDP estimates used as the basis in previous tables by
the total estimated employed workforce in Lebanon for each year. Employment estimates are from ILO, Key Indicators for the Labour Market 2013, database online at http://kilm.ilo.org. Data for 1990 and 2013 are not yet available in this database.
12
types of employment available in Lebanon over the past two decades have been, on average, of
relatively low productivity, usually indicative of low-quality, low-paying jobs in informal activities.
2. Explaining stagnant growth and productivity
Lebanon may be in a “slow growth trap,” with relatively low rates of real economic growth and weak
competitiveness vis-à-vis the global market of which it is a part.6 This is despite the fact that Lebanon
has relatively well-functioning – that is, relatively efficient – labour and capital markets by developing-
country standards. The country produces a surplus of educated and skilled labour but has been unable
to fully absorb the mostly young and educated labour force, resulting in high rates of emigration. Slow
growth has been attributed to relatively low levels of private and public investment and insufficient
business competition in the domestic market.
In particular, private capital is biased towards short-term, relatively liquid financial instruments (e.g.
short-term government bonds) and real estate, which could be as much as two-thirds of all investment
in the country. Foreign direct investment in Lebanon, mainly accounted for by Lebanese expatriates, is
almost entirely the purchase of land or real property. This has bolstered the existing, non-productive
character of investment.
Meanwhile, investment in productive activities, in particular those that would bolster the country’s
capacity to export goods and services, is relatively low due to the existence of oligopolies that dominate
the local market. The domestic market power of such oligopolies – sometimes accompanied by exclusive
import agencies – as well as widespread corruption, raises barriers to entry, making it difficult or
prohibitively expensive for other firms to compete. This has made the domestic market less competitive
and hampered productive investment in the private sector, resulting in stagnant labour productivity,
slower macroeconomic growth and lethargic employment and income growth.
Another important element in Lebanon’s economic malaise has been the secondary effects of
substantial capital inflows (e.g. remittances, foreign direct investment, official assistance to the
Lebanese Government) since the 1990s. Personal remittances plus foreign direct investment alone
averaged about one-third of Lebanon’s GDP in the 2002–2012 period.7 While these have supported the
incomes of many families and bolstered domestic investment, these inflows have also served to raise
the demand for the Lebanese pound and its relative value vis-à-vis major currencies like the US dollar.
The higher real exchange rate of the Lebanese pound has had the effect of increasing demand for
imported goods, some of which compete with domestic goods, as well as the demand for domestic
services such as housing, health care, education, transportation, etc. This has had the tendency to raise
the costs of such services and to draw labour and capital towards producing more of such services and
away from export-oriented activities like manufacturing and agriculture, where the potential for
productivity gains is greatest. Domestic producers, including exporters, also face higher costs for
6 The following analysis is taken from Berthélemy, Jean-Claude, et al Exploring Lebanon’s Growth Prospects, Policy
Research Working Paper 4332 (World Bank, August 2007). 7 See World Development Indicators online at http://databank.worldbank.org.
13
services. Thus, the higher real exchange rate not only makes Lebanese goods relatively expensive in
external markets, it also makes exporters of both goods and services less cost-competitive in the
international market. The evidence suggests that domestic producers have not, on the whole, invested
in modern productivity-enhancing technologies that would counter the loss of competitiveness.
3. Macroeconomic impacts of the Syrian crisis
An extensive study, conducted in 2013,8 estimated that the spillover effects of the conflict in Syria would
be a US$7.5 billion reduction in output and income during the 2012–2014 period. Underlying this loss is
an estimated real GDP growth of 2.8 percentage points below what would have occurred in the absence
of conflict. During the same period, government revenues were estimated to decline by US$1.6 billion,
while government expenditures would rise by US$1.2 billion to cope with the influx of refugees and
increased demand for public services. Thus, after years of generally improving public finances, the crisis
is causing rising fiscal deficits, of the order of US$2.8 billion during 2012–2014.
The losses estimated above include those due to greater insecurity and uncertainty, and have resulted in
a slowdown in construction and other investment activity in the country – key sources of growth in
recent years. Likewise, the disruption of Lebanon’s normal overland trade routes through Syria have had
serious negative effects on the cross-border trade of goods and services, particularly for tourism,
another key income source. Furthermore, the crisis has severely damaged the Syrian economy, a
historically large and close trading partner of Lebanon, and the source of relatively low-cost food
products and consumer goods for Lebanon. The loss of Syrian sources of basic commodities threatens to
raise their costs, a phenomenon that would especially impact the poor in Lebanon.
II. DEMOGRAPHIC CONDITIONS
Underlying Lebanon’s macroeconomic evolution and conditions are those in its labour force. Population
growth and demographic dynamics – including migration – explain, to a large extent, the character of
the country’s labour market and the trends that have dominated that market in recent years. Given the
significant gaps in Lebanon’s official statistics, this section relies on population and migration data
generated by the United Nations to put Lebanon’s situation into context. This serves as the backdrop for
a discussion of the Lebanese labour market.
1. Population and demography in Lebanon
Lebanon’s natural population growth rate has receded as its age distribution increasingly resembles that
of a more developed country. As Lebanon lacks an official population database, the present analysis
relies on United Nations Population Division, Department of Social and Economic Affairs (UNDESA)
estimates.9 UNDESA estimates that, starting from 2.7 million persons in 1990, average population
8 World Bank, Lebanon: Economic and Social Impact Assessment of the Syrian Conflict, September 5, 2013. This
section relies on this source unless otherwise indicated. 9 UN Population Division, Department of Economic and Social Affairs (DESA), June 2013 at:
http://esa.un.org/unpd/wpp/index.htm. DESA maintains population estimates from global official statistical
14
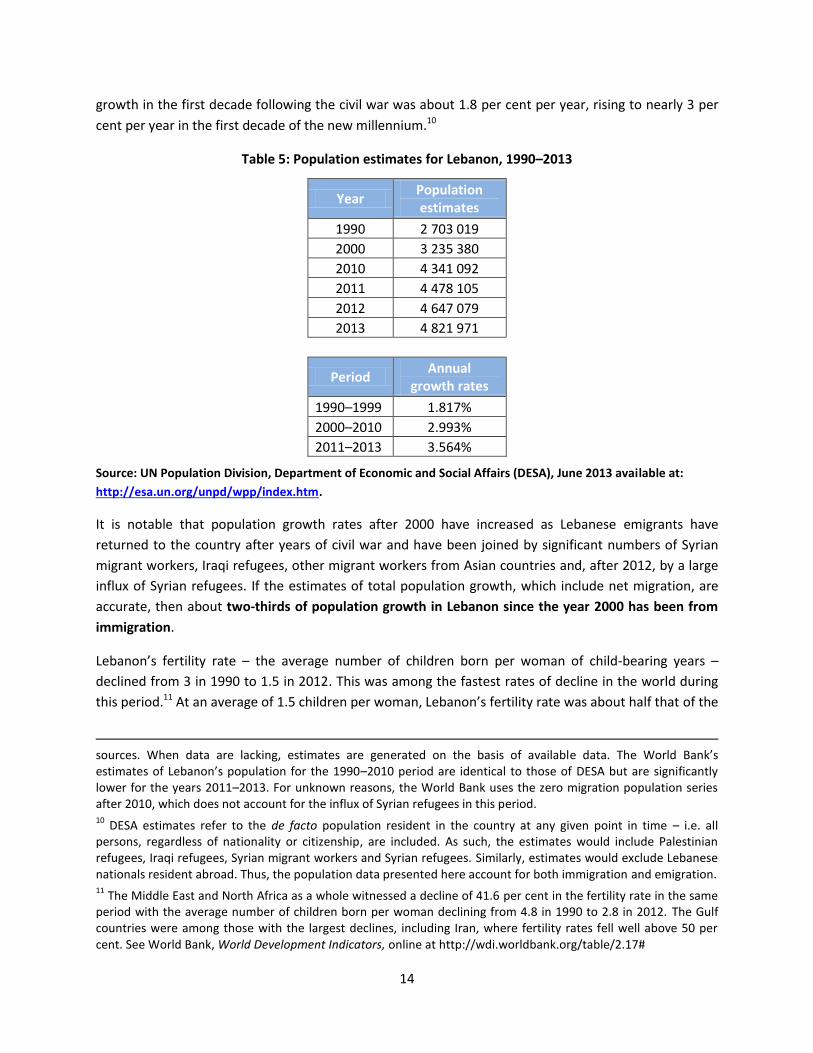
growth in the first decade following the civil war was about 1.8 per cent per year, rising to nearly 3 per
cent per year in the first decade of the new millennium.10
Table 5: Population estimates for Lebanon, 1990–2013
Year Population estimates
1990 2 703 019
2000 3 235 380
2010 4 341 092
2011 4 478 105
2012 4 647 079
2013 4 821 971
Period Annual
growth rates
1990–1999 1.817%
2000–2010 2.993%
2011–2013 3.564%
Source: UN Population Division, Department of Economic and Social Affairs (DESA), June 2013 available at:
http://esa.un.org/unpd/wpp/index.htm.
It is notable that population growth rates after 2000 have increased as Lebanese emigrants have
returned to the country after years of civil war and have been joined by significant numbers of Syrian
migrant workers, Iraqi refugees, other migrant workers from Asian countries and, after 2012, by a large
influx of Syrian refugees. If the estimates of total population growth, which include net migration, are
accurate, then about two-thirds of population growth in Lebanon since the year 2000 has been from
immigration.
Lebanon’s fertility rate – the average number of children born per woman of child-bearing years –
declined from 3 in 1990 to 1.5 in 2012. This was among the fastest rates of decline in the world during
this period.11 At an average of 1.5 children per woman, Lebanon’s fertility rate was about half that of the
sources. When data are lacking, estimates are generated on the basis of available data. The World Bank’s estimates of Lebanon’s population for the 1990–2010 period are identical to those of DESA but are significantly lower for the years 2011–2013. For unknown reasons, the World Bank uses the zero migration population series after 2010, which does not account for the influx of Syrian refugees in this period. 10
DESA estimates refer to the de facto population resident in the country at any given point in time – i.e. all persons, regardless of nationality or citizenship, are included. As such, the estimates would include Palestinian refugees, Iraqi refugees, Syrian migrant workers and Syrian refugees. Similarly, estimates would exclude Lebanese nationals resident abroad. Thus, the population data presented here account for both immigration and emigration. 11
The Middle East and North Africa as a whole witnessed a decline of 41.6 per cent in the fertility rate in the same period with the average number of children born per woman declining from 4.8 in 1990 to 2.8 in 2012. The Gulf countries were among those with the largest declines, including Iran, where fertility rates fell well above 50 per cent. See World Bank, World Development Indicators, online at http://wdi.worldbank.org/table/2.17#
15
Middle East and North Africa in 2012, below the average for high-income countries and among the 35
lowest rates in the world. Lebanon now has a fertility rate below what is necessary to replace the
current population.12 The natural population growth rate, calculated as the crude birth rate minus the
crude death rate, fell accordingly from 1.8 per cent in 1990 to 0.9 per cent in 2012.13 At the same time
life expectancy in Lebanon grew from 70 in 1990 (5 years below the average for high income countries)
to 80 in 2012 (1 year above the average for high income countries).
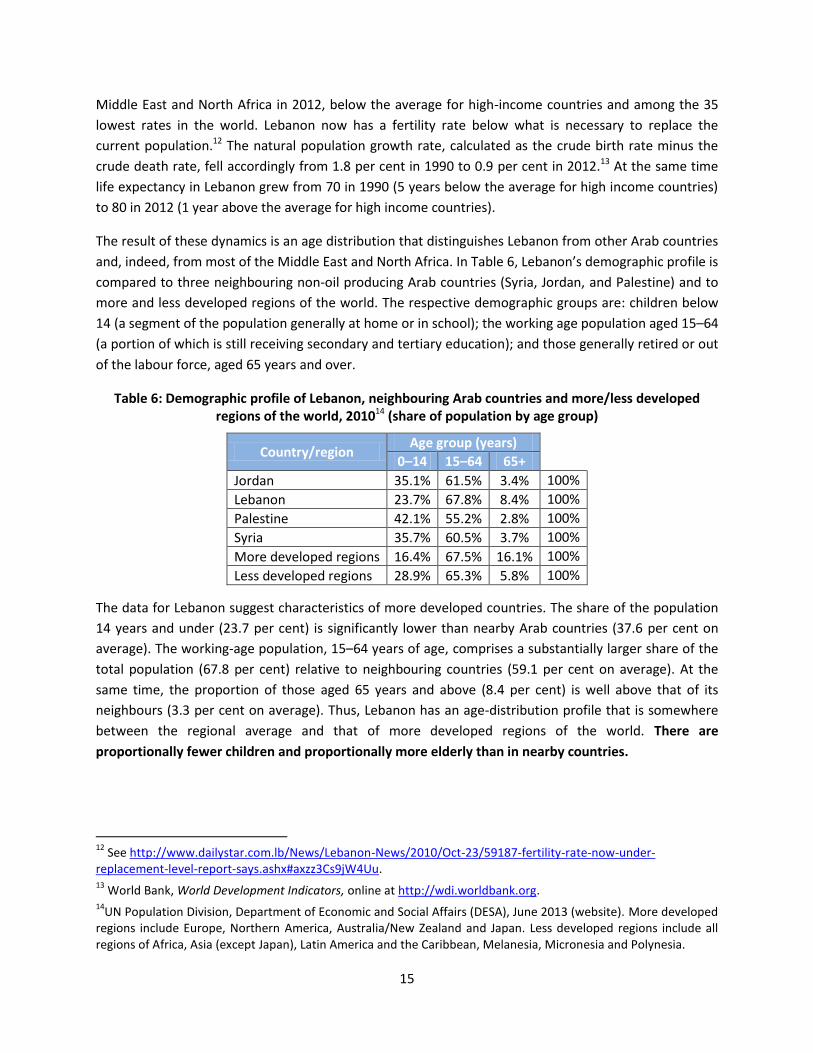
The result of these dynamics is an age distribution that distinguishes Lebanon from other Arab countries
and, indeed, from most of the Middle East and North Africa. In Table 6, Lebanon’s demographic profile is
compared to three neighbouring non-oil producing Arab countries (Syria, Jordan, and Palestine) and to
more and less developed regions of the world. The respective demographic groups are: children below
14 (a segment of the population generally at home or in school); the working age population aged 15–64
(a portion of which is still receiving secondary and tertiary education); and those generally retired or out
of the labour force, aged 65 years and over.
Table 6: Demographic profile of Lebanon, neighbouring Arab countries and more/less developed regions of the world, 201014 (share of population by age group)
Country/region Age group (years)
0–14 15–64 65+
Jordan 35.1% 61.5% 3.4% 100%
Lebanon 23.7% 67.8% 8.4% 100%
Palestine 42.1% 55.2% 2.8% 100%
Syria 35.7% 60.5% 3.7% 100%
More developed regions 16.4% 67.5% 16.1% 100%
Less developed regions 28.9% 65.3% 5.8% 100%
The data for Lebanon suggest characteristics of more developed countries. The share of the population
14 years and under (23.7 per cent) is significantly lower than nearby Arab countries (37.6 per cent on
average). The working-age population, 15–64 years of age, comprises a substantially larger share of the
total population (67.8 per cent) relative to neighbouring countries (59.1 per cent on average). At the
same time, the proportion of those aged 65 years and above (8.4 per cent) is well above that of its
neighbours (3.3 per cent on average). Thus, Lebanon has an age-distribution profile that is somewhere
between the regional average and that of more developed regions of the world. There are
proportionally fewer children and proportionally more elderly than in nearby countries.
12
See http://www.dailystar.com.lb/News/Lebanon-News/2010/Oct-23/59187-fertility-rate-now-under-replacement-level-report-says.ashx#axzz3Cs9jW4Uu. 13
World Bank, World Development Indicators, online at http://wdi.worldbank.org. 14
UN Population Division, Department of Economic and Social Affairs (DESA), June 2013 (website). More developed regions include Europe, Northern America, Australia/New Zealand and Japan. Less developed regions include all regions of Africa, Asia (except Japan), Latin America and the Caribbean, Melanesia, Micronesia and Polynesia.

16
2. Dependency ratio
Lebanon’s dependency ratio – defined as the number of children under 15 years of age plus those above
65 years of age divided by the working-age population (15–64 years of age) – is the lowest among
comparable Arab neighbours and also in line with more developed regions of the world.15 Thus, in 2009
there were about two Lebanese of working age for every dependent. In general, the implication here is
that the proportional collateral impact of gains or losses in incomes on non-working dependents of the
working population would be smaller compared with populations with higher dependency ratios.
On a governorate basis, dependency ratios exhibit wide variation in Lebanon. Beirut and Mount Lebanon
have below average ratios while North Lebanon, South Lebanon and Nabatieh (areas of the country with
higher rates of poverty)16 have higher than average ratios (see Table 7).
Table 7: Estimated Lebanese dependency ratios by governorate in Lebanon 200917
Beirut 40.9%
Mount Lebanon 42.7%
North Lebanon 58.5%
Bekaa 49.5%
South Lebanon 53.1%
Nabatieh 59.5%
Total 48.4%
3. Emigration and immigration
Emigration has been a longstanding feature of Lebanon’s history, a process that began in the latter half
of the 19th century with migratory movements mainly to Europe and North and South America.
Emigration continued in the 20th century and was accompanied by immigration, initially of refugees,
into Lebanon. Among the first wave were Armenians fleeing persecution and famine in Anatolia during
the First World War; later, Palestinians expelled from their homes arrived from northern Palestine in
1948–1949. These were joined by more Palestinians fleeing the civil conflict in Jordan in 1970–1971. The
Lebanese civil war period (1975–1990) was accompanied by accelerated emigration and much reduced
immigration. In the post-war 1990s, the balance shifted in favour of immigration, a process that
accelerated rapidly in the first decade of the new millennium.
A significant share of immigration in that decade was, presumably, accounted for by refugees from Iraq
and by Syrian migrant labourers.
15
Using UNDESA figures, the dependency ratio for Lebanon here is 47.4% compared with 48.1% in more developed countries and an average of 69.6% in neighbouring Arab countries. 16
The North, South and Nabatieh governorates had the highest shares of population whose basic needs were unsatisfied in 2004. See Government of Lebanon and UNDP Lebanon Millennium Development Goals Report 2013, December 2013, p. 22. 17
Calculations are based on data from the Central Administration of Statistics Multiple Indicators Cluster Survey, 2009 (Beirut).
17
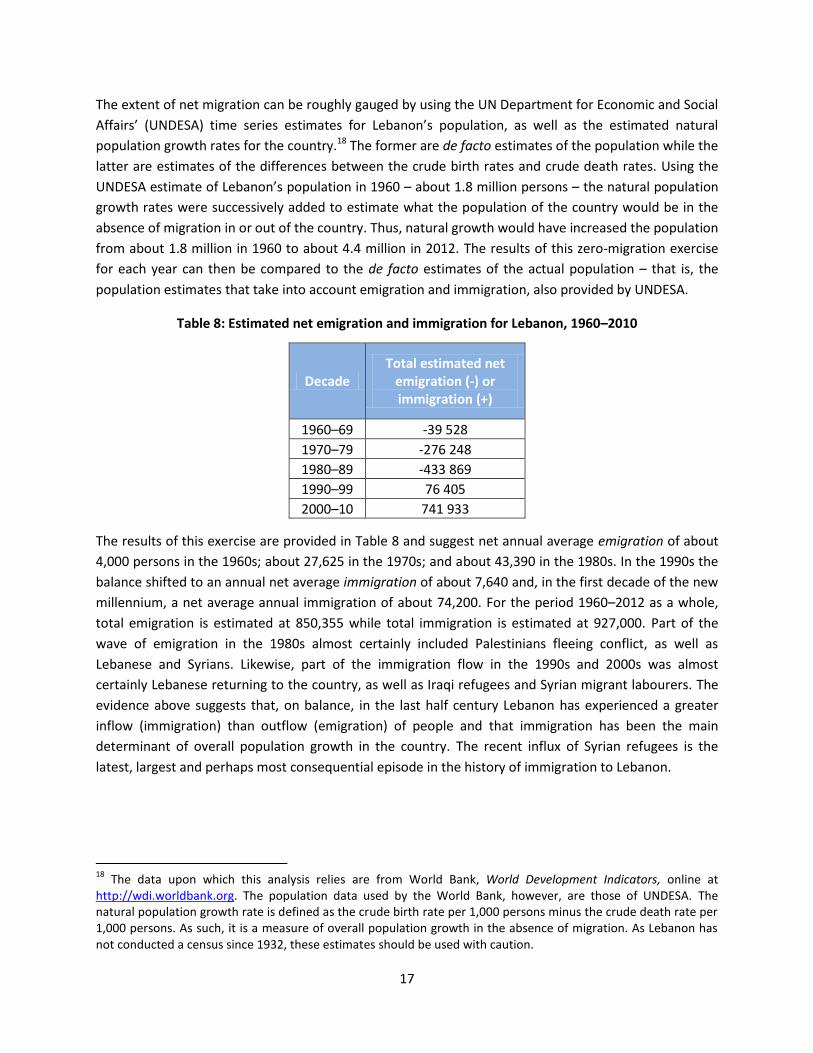
The extent of net migration can be roughly gauged by using the UN Department for Economic and Social
Affairs’ (UNDESA) time series estimates for Lebanon’s population, as well as the estimated natural
population growth rates for the country.18 The former are de facto estimates of the population while the
latter are estimates of the differences between the crude birth rates and crude death rates. Using the
UNDESA estimate of Lebanon’s population in 1960 – about 1.8 million persons – the natural population
growth rates were successively added to estimate what the population of the country would be in the
absence of migration in or out of the country. Thus, natural growth would have increased the population
from about 1.8 million in 1960 to about 4.4 million in 2012. The results of this zero-migration exercise
for each year can then be compared to the de facto estimates of the actual population – that is, the
population estimates that take into account emigration and immigration, also provided by UNDESA.
Table 8: Estimated net emigration and immigration for Lebanon, 1960–2010
Decade Total estimated net
emigration (-) or immigration (+)
1960–69 -39 528
1970–79 -276 248
1980–89 -433 869
1990–99 76 405
2000–10 741 933
The results of this exercise are provided in Table 8 and suggest net annual average emigration of about
4,000 persons in the 1960s; about 27,625 in the 1970s; and about 43,390 in the 1980s. In the 1990s the
balance shifted to an annual net average immigration of about 7,640 and, in the first decade of the new
millennium, a net average annual immigration of about 74,200. For the period 1960–2012 as a whole,
total emigration is estimated at 850,355 while total immigration is estimated at 927,000. Part of the
wave of emigration in the 1980s almost certainly included Palestinians fleeing conflict, as well as
Lebanese and Syrians. Likewise, part of the immigration flow in the 1990s and 2000s was almost
certainly Lebanese returning to the country, as well as Iraqi refugees and Syrian migrant labourers. The
evidence above suggests that, on balance, in the last half century Lebanon has experienced a greater
inflow (immigration) than outflow (emigration) of people and that immigration has been the main
determinant of overall population growth in the country. The recent influx of Syrian refugees is the
latest, largest and perhaps most consequential episode in the history of immigration to Lebanon.
18
The data upon which this analysis relies are from World Bank, World Development Indicators, online at http://wdi.worldbank.org. The population data used by the World Bank, however, are those of UNDESA. The natural population growth rate is defined as the crude birth rate per 1,000 persons minus the crude death rate per 1,000 persons. As such, it is a measure of overall population growth in the absence of migration. As Lebanon has not conducted a census since 1932, these estimates should be used with caution.
18
4. The Lebanese diaspora
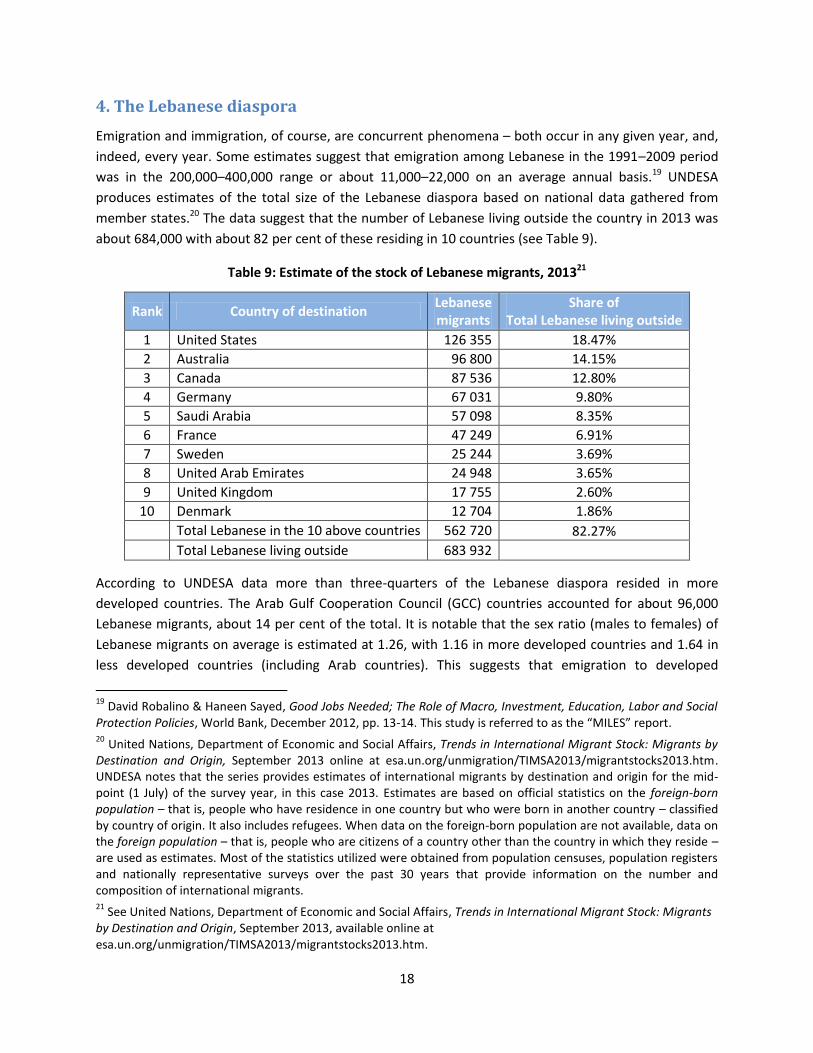
Emigration and immigration, of course, are concurrent phenomena – both occur in any given year, and,
indeed, every year. Some estimates suggest that emigration among Lebanese in the 1991–2009 period
was in the 200,000–400,000 range or about 11,000–22,000 on an average annual basis.19 UNDESA
produces estimates of the total size of the Lebanese diaspora based on national data gathered from
member states.20 The data suggest that the number of Lebanese living outside the country in 2013 was
about 684,000 with about 82 per cent of these residing in 10 countries (see Table 9).
Table 9: Estimate of the stock of Lebanese migrants, 201321
Rank Country of destination Lebanese migrants
Share of Total Lebanese living outside
1 United States 126 355 18.47%
2 Australia 96 800 14.15%
3 Canada 87 536 12.80%
4 Germany 67 031 9.80%
5 Saudi Arabia 57 098 8.35%
6 France 47 249 6.91%
7 Sweden 25 244 3.69%
8 United Arab Emirates 24 948 3.65%
9 United Kingdom 17 755 2.60%
10 Denmark 12 704 1.86%
Total Lebanese in the 10 above countries 562 720 82.27%
Total Lebanese living outside 683 932
According to UNDESA data more than three-quarters of the Lebanese diaspora resided in more
developed countries. The Arab Gulf Cooperation Council (GCC) countries accounted for about 96,000
Lebanese migrants, about 14 per cent of the total. It is notable that the sex ratio (males to females) of
Lebanese migrants on average is estimated at 1.26, with 1.16 in more developed countries and 1.64 in
less developed countries (including Arab countries). This suggests that emigration to developed
19
David Robalino & Haneen Sayed, Good Jobs Needed; The Role of Macro, Investment, Education, Labor and Social Protection Policies, World Bank, December 2012, pp. 13-14. This study is referred to as the “MILES” report. 20
United Nations, Department of Economic and Social Affairs, Trends in International Migrant Stock: Migrants by Destination and Origin, September 2013 online at esa.un.org/unmigration/TIMSA2013/migrantstocks2013.htm. UNDESA notes that the series provides estimates of international migrants by destination and origin for the mid-point (1 July) of the survey year, in this case 2013. Estimates are based on official statistics on the foreign-born population – that is, people who have residence in one country but who were born in another country – classified by country of origin. It also includes refugees. When data on the foreign-born population are not available, data on the foreign population – that is, people who are citizens of a country other than the country in which they reside – are used as estimates. Most of the statistics utilized were obtained from population censuses, population registers and nationally representative surveys over the past 30 years that provide information on the number and composition of international migrants. 21
See United Nations, Department of Economic and Social Affairs, Trends in International Migrant Stock: Migrants by Destination and Origin, September 2013, available online at esa.un.org/unmigration/TIMSA2013/migrantstocks2013.htm.
19
countries is more likely to consist of whole families, whereas migrants to the GCC are more likely to be
single males.
As noted by the World Bank, emigration has created a situation in which a relatively large number of,
presumably, young and well-educated people have left the country, creating a relative scarcity of skills.
Over time, it has also led to vacancies in the Lebanese labour market, including jobs requiring a
relatively low level of skills – gaps that have been filled by immigrants from Syria and elsewhere.
Another impact of emigration has been the development of a large and steady stream of remittance
income. Remittances received by residents of Lebanon from people living outside the country totalled
about US$6.9 billion in 2013 (about 16 per cent of Lebanon’s GDP), among the highest in the world.22 It
has been theorized that these significant inflows of remittances to family members in Lebanon has had
the effect of reducing the activity rates of working-age people and, thus, limited the rate of
unemployment in the country. With the outflow of relatively well-educated Lebanese, those remaining
comprise a relatively less-educated domestic workforce, encouraging the expansion of low productivity
economic activities in the country.23
III. LABOUR MARKET CONDITIONS
Given the population, demographic and migration trends presented above, the dynamics of the
Lebanese labour market in recent years are outlined in this section. The extent and effects of informality
in the labour market are highlighted.
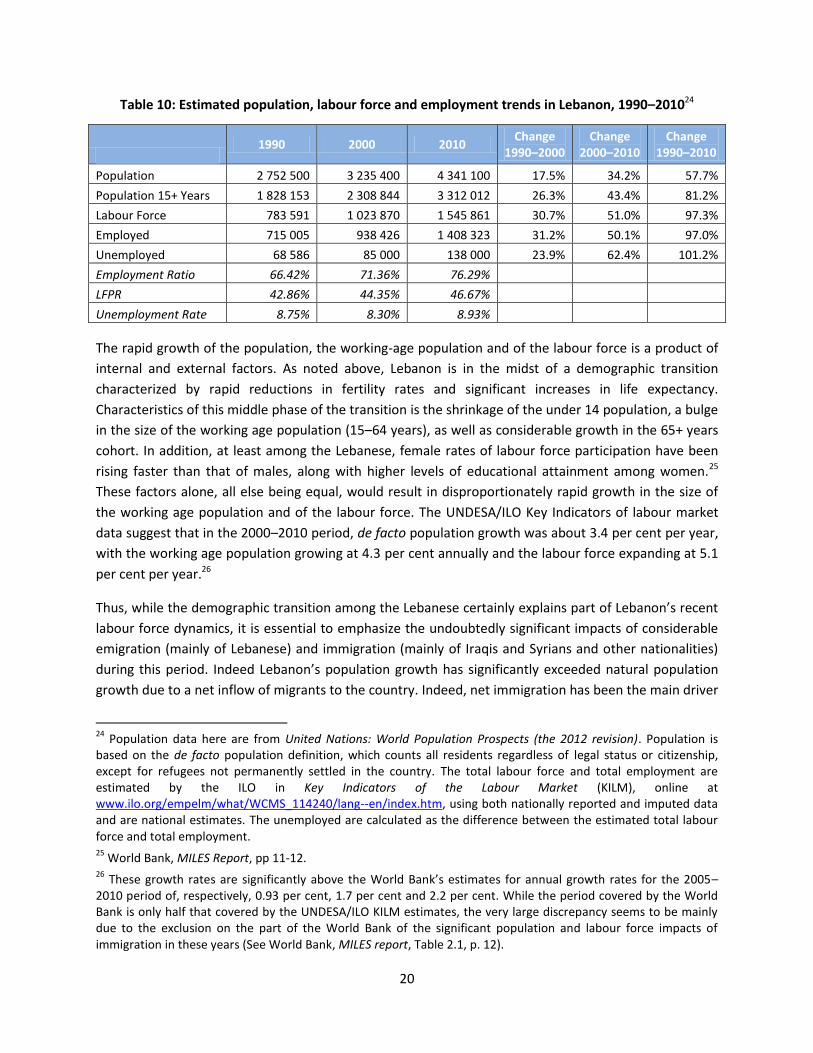
1. Lebanon’s labour force
Population growth in Lebanon, inclusive of net migration, and as estimated for the 20-year period 1990–
2010, was nearly 58 per cent or about 2.8 per cent per year on average. The working age population (15
years of age and above) grew considerably faster, by an estimated 81 per cent in absolute terms or
about 4 per cent on an annual average basis. In addition to above-average growth of the working age
population, there was an upward trend in the proportion of those 15 and above seeking work. The
labour force participation rate (the share of the working age population employed or seeking
employment) grew from under 43 per cent in 1990 to about 46.6 per cent in 2010. This resulted in the
near doubling of the size of the labour force, estimated at more than 1.5 million in 2010 (see Table 10).
22
See World Bank, World Development Indicators, online. Remittance inflows refer to the sum of workers' remittances, and compensation of employees and migrants' transfers received by residents of Lebanon. 23
Mary Kawar & Zafiris Tzannatos, Youth employment in Lebanon: Skilled and jobless, The Lebanese Center for Policy Studies, October 2012, p. 5.
20
Table 10: Estimated population, labour force and employment trends in Lebanon, 1990–201024
1990 2000 2010
Change 1990–2000
Change 2000–2010
Change 1990–2010
Population 2 752 500 3 235 400 4 341 100 17.5% 34.2% 57.7%
Population 15+ Years 1 828 153 2 308 844 3 312 012 26.3% 43.4% 81.2%
Labour Force 783 591 1 023 870 1 545 861 30.7% 51.0% 97.3%
Employed 715 005 938 426 1 408 323 31.2% 50.1% 97.0%
Unemployed 68 586 85 000 138 000 23.9% 62.4% 101.2%
Employment Ratio 66.42% 71.36% 76.29%
LFPR 42.86% 44.35% 46.67%
Unemployment Rate 8.75% 8.30% 8.93%
The rapid growth of the population, the working-age population and of the labour force is a product of
internal and external factors. As noted above, Lebanon is in the midst of a demographic transition
characterized by rapid reductions in fertility rates and significant increases in life expectancy.
Characteristics of this middle phase of the transition is the shrinkage of the under 14 population, a bulge
in the size of the working age population (15–64 years), as well as considerable growth in the 65+ years
cohort. In addition, at least among the Lebanese, female rates of labour force participation have been
rising faster than that of males, along with higher levels of educational attainment among women.25
These factors alone, all else being equal, would result in disproportionately rapid growth in the size of
the working age population and of the labour force. The UNDESA/ILO Key Indicators of labour market
data suggest that in the 2000–2010 period, de facto population growth was about 3.4 per cent per year,
with the working age population growing at 4.3 per cent annually and the labour force expanding at 5.1
per cent per year.26
Thus, while the demographic transition among the Lebanese certainly explains part of Lebanon’s recent
labour force dynamics, it is essential to emphasize the undoubtedly significant impacts of considerable
emigration (mainly of Lebanese) and immigration (mainly of Iraqis and Syrians and other nationalities)
during this period. Indeed Lebanon’s population growth has significantly exceeded natural population
growth due to a net inflow of migrants to the country. Indeed, net immigration has been the main driver
24
Population data here are from United Nations: World Population Prospects (the 2012 revision). Population is based on the de facto population definition, which counts all residents regardless of legal status or citizenship, except for refugees not permanently settled in the country. The total labour force and total employment are estimated by the ILO in Key Indicators of the Labour Market (KILM), online at www.ilo.org/empelm/what/WCMS_114240/lang--en/index.htm, using both nationally reported and imputed data and are national estimates. The unemployed are calculated as the difference between the estimated total labour force and total employment. 25
World Bank, MILES Report, pp 11-12. 26
These growth rates are significantly above the World Bank’s estimates for annual growth rates for the 2005–2010 period of, respectively, 0.93 per cent, 1.7 per cent and 2.2 per cent. While the period covered by the World Bank is only half that covered by the UNDESA/ILO KILM estimates, the very large discrepancy seems to be mainly due to the exclusion on the part of the World Bank of the significant population and labour force impacts of immigration in these years (See World Bank, MILES report, Table 2.1, p. 12).
21
of population growth in the country in the last decade. The population inflow has no doubt contributed
to the disproportionately rapid growth of the labour force.27
2. Employment and unemployment
Over the 20-year period (1990–2010), on average the number of employed and the number of
unemployed persons approximately doubled in absolute numbers. Seen from another angle, more than
90 per cent of the increase in the labour force was accounted for by people finding some type of work
with less than 10 per cent of labour force growth accounted for by increases in the number of the
unemployed. The average unemployment rate, at nearly 9 per cent, was not appreciably changed in this
period.
Unemployment in Lebanon, as elsewhere, is especially high among youth and disproportionately high
for women, a rapidly growing component of the labour force.28 Youth 15–24 had an unemployment rate
estimated at 34 per cent in 2010. This is largely due to the demographic dynamics that have produced a
surge in the numbers of youth. While youth are generally able to find work faster than other groups, the
informal nature of their work, including self-employment, is also of generally short duration. Following
short periods of work, they continue to search for jobs, thus maintaining the unemployment rate.29
The unemployment rate for women, estimated at 18 per cent (versus 9 per cent for males) is due, in
part, to the fact that they are more likely to leave jobs for childbearing prior to further job searching.
Leaving and returning to the labour market results in more search time (i.e. unemployment). However,
women, in general, find work faster than men and have higher levels of educational achievement and
are less likely to be employed informally. More educated workers also have higher than average
unemployment rates but shorter unemployment spells. Labour market entry rises with education level
and this leads to higher unemployment rates. Educated workers seem to find work more quickly, either
because their skills are in higher demand or they are willing to move to new jobs; they are also able to
afford a more comprehensive job search.
Also, as elsewhere, unemployment rates are positively correlated to education levels. This is in part due
to the earlier entry of the less educated into the labour market, partly because the economy does not
27
Demographic data indicate particularly low male-female sex ratios – in the range of 80% to 92% – for the Lebanese (and Palestinian) population in Lebanon in the 25–64 year age distribution. This is, presumably, the result of male emigration. See ILO and the Committee for the Employment of Palestinian Refugees Palestinian Employment in Lebanon: Facts and Challenges, Beirut, 2012, pp. 28-29. The corresponding UNDESA estimated male-female sex ratios for immigrants in Lebanon in the same age cohorts were in the range of 101%-130%. See United Nations Department of Economic and Social Affairs, Trends in International Migrant Stock: Migrants by Age and Sex, 2013 at http://esa.un.org/unmigration/TIMSA2013/migrantstocks2013.htm?msax. Thus, the outflow of working age males has been compensated for, in part, by inflows of males, although the education and skill levels of the latter, as well as the quality of the work they have found in Lebanon, have been decidedly lower. 28
Mary Kawar & Zafiris Tzannatos, Youth employment in Lebanon: Skilled and jobless, The Lebanese Center for Policy Studies, October 2012, pp. 20-21. 29
World Bank, MILES Report, pp. 16-18.
22
produce work opportunities commensurate with the types of tertiary education that the Lebanese
attain, and partly due to the lack of skills among the educated.
3. Education and skills of the labour force
The profile of the labour market is that of an educated workforce. One fifth of Lebanese men have a
university degree. The corresponding figure for women is even higher, with 40% of working women
holding a university degree. Thus, the profile of the unemployed suggests that Lebanon is in no short
supply of young and (over) qualified job seekers. In fact, the highest rates of unemployment are
observed at the secondary and university levels, 7.7 per cent and 8.8 per cent respectively, compared
with only 4.4 per cent for those who are illiterate.30
On another note, although there is no significant difference in the average duration of first-time job
search among jobseekers with different educational levels, the duration of unemployment among the
most educated (aged below 35) is equivalent to that of the less educated, , especially that some 80 per
cent of the unemployed find jobs through connections, irrespective of their education level.31
Another major problem of education in Lebanon is the inequality among citizens of different income
groups to access quality education at all levels. This is mainly due to the low public sector spending on
education, resulting in low-quality education opportunities for poor families, as they are unable to
afford private sector schools and universities. The dichotomy between wealthy students accessing
expensive education while the poor are limited to public sector schools and universities is probably
responsible for the low levels of international performance32 and the prevailing mismatch of skills to
those required in the job market. Income disparities and families’ wealth also lie behind regional
disparities in completion and dropout rates, with North Lebanon, for example, having the highest rate of
students who drop out of school after they complete the elementary level (around 43 per cent).33
Indeed, although Lebanon is constantly increasing in its educated labour force, returns to education, i.e.
what the individual gets in return to his investment in human capital in terms of employment
opportunities or wages, remain low and the Lebanese economy still relies on low-productivity sectors.
30
Mary Kawar & Zafiris Tzannatos, Youth employment in Lebanon: Skilled and jobless, The Lebanese Center for Policy Studies, October 2012, pp. 20-21. On another note, although there is no particular difference in the average duration of first time job search among jobseekers with different educational levels, the duration of unemployment among the most educated (below 35) is similar to that of the less educated, suggesting no real value added of education, especially given that some 80% of the unemployed find jobs through connections, irrespective of their education level. 31
ibid 32
Lebanon has taken part in different international tests including the Trends in International Mathematics and Science Study (TIMSS). The 2007 and 2011 scores for 8th grade students in mathematics and sciences indicate Lebanon’s performance has been almost unchanged over this 4 year period. This suggests a failure of the education system to keep up with international systems, especially in sciences. A more focused study in 2011 suggests that Lebanon performs extremely low in sciences when compared to other Arab countries, namely, the UAE, Jordan, Tunisia, KSA, Syria, Oman and Qatar, but is second in mathematics in the region following the UAE. 33
Kawar & Tzannatos, 2013.
23
Entry-level opportunities for young educated people in productive sectors are scarce, with a continuous
mismatch between workers’ wage expectations and the low market rates available. According to the
World Bank, the median monthly wage of a university graduate is US$800.34 High levels of skilled
emigration out of Lebanon – the so-called ‘brain drain’ – is one of the main effects of the low financial
returns for education, alongside the country’s political instability.According to a Gallup survey in 2010,
as much as 37 per cent of the Lebanese youth expressed their willingness to emigrate permanently.
Out-migration is one available option for the young Lebanese who cannot find a job in their home
country. But there are also a lot of young people who become ‘discouraged’ and decide to drop out of
the labour force. Statistics show that inactivity rates of the youth in Lebanon registered as high as 70 per
cent in 2013 compared to a world average of 52.6 per cent.35 This masks a serious problem of
discouragement of Lebanese youth that can of course impact the future personal, social and economic
development of an individual. Indeed incentives play a major role in shaping youth decisions and
aspirations and lack of demand for a skilled educated workforce together with the prevalent low
standard working conditions are disincentives.
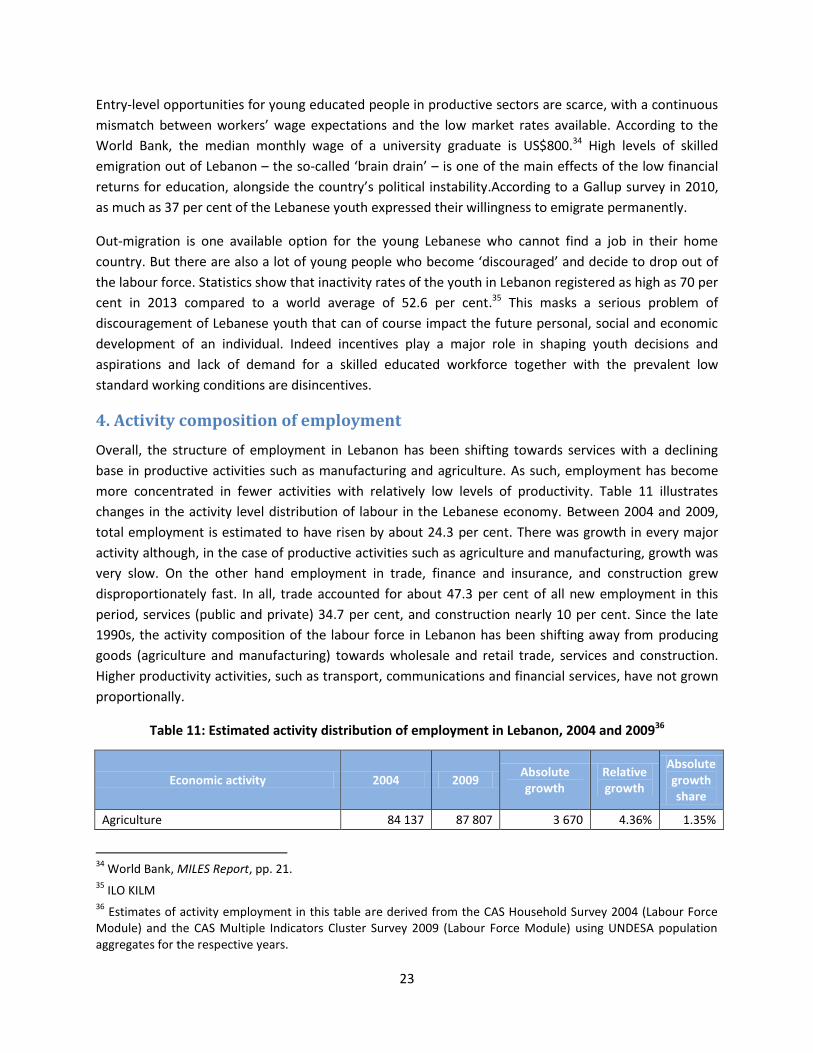
4. Activity composition of employment
Overall, the structure of employment in Lebanon has been shifting towards services with a declining
base in productive activities such as manufacturing and agriculture. As such, employment has become
more concentrated in fewer activities with relatively low levels of productivity. Table 11 illustrates
changes in the activity level distribution of labour in the Lebanese economy. Between 2004 and 2009,
total employment is estimated to have risen by about 24.3 per cent. There was growth in every major
activity although, in the case of productive activities such as agriculture and manufacturing, growth was
very slow. On the other hand employment in trade, finance and insurance, and construction grew
disproportionately fast. In all, trade accounted for about 47.3 per cent of all new employment in this
period, services (public and private) 34.7 per cent, and construction nearly 10 per cent. Since the late
1990s, the activity composition of the labour force in Lebanon has been shifting away from producing
goods (agriculture and manufacturing) towards wholesale and retail trade, services and construction.
Higher productivity activities, such as transport, communications and financial services, have not grown
proportionally.
Table 11: Estimated activity distribution of employment in Lebanon, 2004 and 200936
Economic activity 2004 2009 Absolute growth
Relative growth
Absolute growth share
Agriculture 84 137 87 807 3 670 4.36% 1.35%
34
World Bank, MILES Report, pp. 21. 35
ILO KILM 36
Estimates of activity employment in this table are derived from the CAS Household Survey 2004 (Labour Force Module) and the CAS Multiple Indicators Cluster Survey 2009 (Labour Force Module) using UNDESA population aggregates for the respective years.
24
Manufacturing 167 369 167 727 359 0.21% 0.13%
Construction 97 746 124 387 26 641 27.26% 9.77%
Trade 246 744 375 940 129 197 52.36% 47.38%
Transport, post, telecommunications 83 633 94 267 10 633 12.71% 3.90%
Services 418 265 513 022 94 756 22.65% 34.75%
Finance, insurance 20 392 27 792 7 400 36.29% 2.71%
Total 1 118 286 1 390 942 272 656 24.38% 100.00%
A survey conducted by the World Bank in 2010 found that only about 17.6 per cent of wage
employment in Lebanon was in productive or transformative activities (i.e. agriculture, mining,
manufacturing, production of utilities) while about 79 per cent of employment was in private and public
services (i.e. wholesale and retail trade, repair of motor vehicles, transportation and storage, hotels and
restaurants, real estate activities, information and communication, finance and insurance, professional,
business, scientific and technical services, health, education, public administration, and defence). Of the
very large service economy, only about 18 per cent – 14.5 per cent of all wage employment – was
considered of high productivity.37
5. Informality in Lebanon’s labour market
Informality in the labour market is defined, among other things, by the absence of explicit and
registered work contracts and/or the absence of social security coverage for workers on the job.38 The
available and most recent (2009) labour market data from the Central Administration of Statistics (CAS)
suggests relatively high levels of work informality. Data in Table 12 illustrate the working status of all
employed persons in Lebanon in 2009. About half received monthly salaries, suggestive of more formal
arrangements, while the remainder were self-employed, paid hourly, daily, weekly or on a productivity
basis, or worked for their families.39 It is also the case that the bulk of employers were owners of small
enterprises, mostly informal in nature. If such employers are included, the share of informally-employed
persons in Lebanon is estimated at about half.
37
The information here is based on the World Bank Employer-Employee Survey. Calculations in this paragraph are taken from the results presented in the MILES report, p. 16. High productivity is associated with higher concentrations of relatively well-educated employees. 38
See General Conference of the International Labour Organization, 90th Session, 2002, Conclusions, paragraph 3, Geneva, for a more elaborated definition of informality. 39
Both the CAS Household Survey 2004 (Labour Force Module) and the CAS Multiple Indicators Cluster Survey 2009 (Labour Force Module) yield a 44 per cent informality ratio using these definitions and excluding employers. The MILES report estimates that 19 per cent of wage workers are employed informally; in addition, the vast bulk of the self-employed work with very limited access to social security or health insurance coverage. On a combined basis, these two groups account for about 50 per cent of all employed persons in Lebanon in 2010. See MILES report, p. 19.
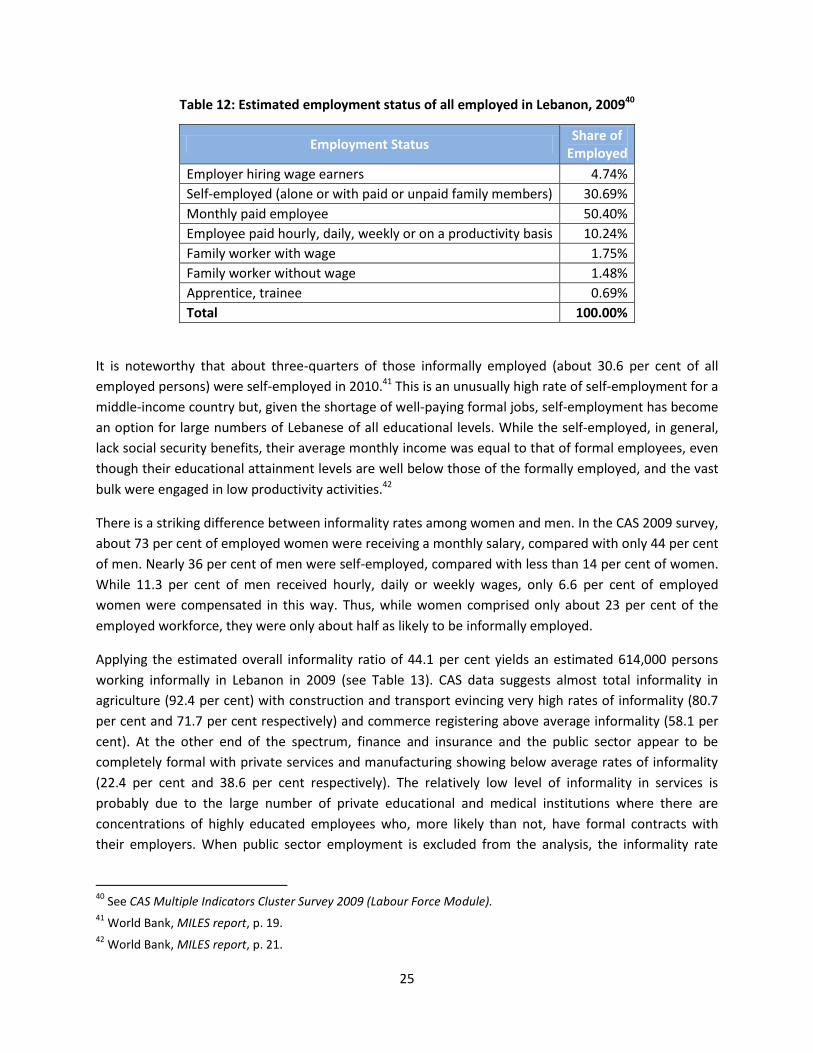
25
Table 12: Estimated employment status of all employed in Lebanon, 200940
Employment Status Share of
Employed
Employer hiring wage earners 4.74%
Self-employed (alone or with paid or unpaid family members) 30.69%
Monthly paid employee 50.40%
Employee paid hourly, daily, weekly or on a productivity basis 10.24%
Family worker with wage 1.75%
Family worker without wage 1.48%
Apprentice, trainee 0.69%
Total 100.00%
It is noteworthy that about three-quarters of those informally employed (about 30.6 per cent of all
employed persons) were self-employed in 2010.41 This is an unusually high rate of self-employment for a
middle-income country but, given the shortage of well-paying formal jobs, self-employment has become
an option for large numbers of Lebanese of all educational levels. While the self-employed, in general,
lack social security benefits, their average monthly income was equal to that of formal employees, even
though their educational attainment levels are well below those of the formally employed, and the vast
bulk were engaged in low productivity activities.42
There is a striking difference between informality rates among women and men. In the CAS 2009 survey,
about 73 per cent of employed women were receiving a monthly salary, compared with only 44 per cent
of men. Nearly 36 per cent of men were self-employed, compared with less than 14 per cent of women.
While 11.3 per cent of men received hourly, daily or weekly wages, only 6.6 per cent of employed
women were compensated in this way. Thus, while women comprised only about 23 per cent of the
employed workforce, they were only about half as likely to be informally employed.
Applying the estimated overall informality ratio of 44.1 per cent yields an estimated 614,000 persons
working informally in Lebanon in 2009 (see Table 13). CAS data suggests almost total informality in
agriculture (92.4 per cent) with construction and transport evincing very high rates of informality (80.7
per cent and 71.7 per cent respectively) and commerce registering above average informality (58.1 per
cent). At the other end of the spectrum, finance and insurance and the public sector appear to be
completely formal with private services and manufacturing showing below average rates of informality
(22.4 per cent and 38.6 per cent respectively). The relatively low level of informality in services is
probably due to the large number of private educational and medical institutions where there are
concentrations of highly educated employees who, more likely than not, have formal contracts with
their employers. When public sector employment is excluded from the analysis, the informality rate
40
See CAS Multiple Indicators Cluster Survey 2009 (Labour Force Module). 41
World Bank, MILES report, p. 19. 42
World Bank, MILES report, p. 21.
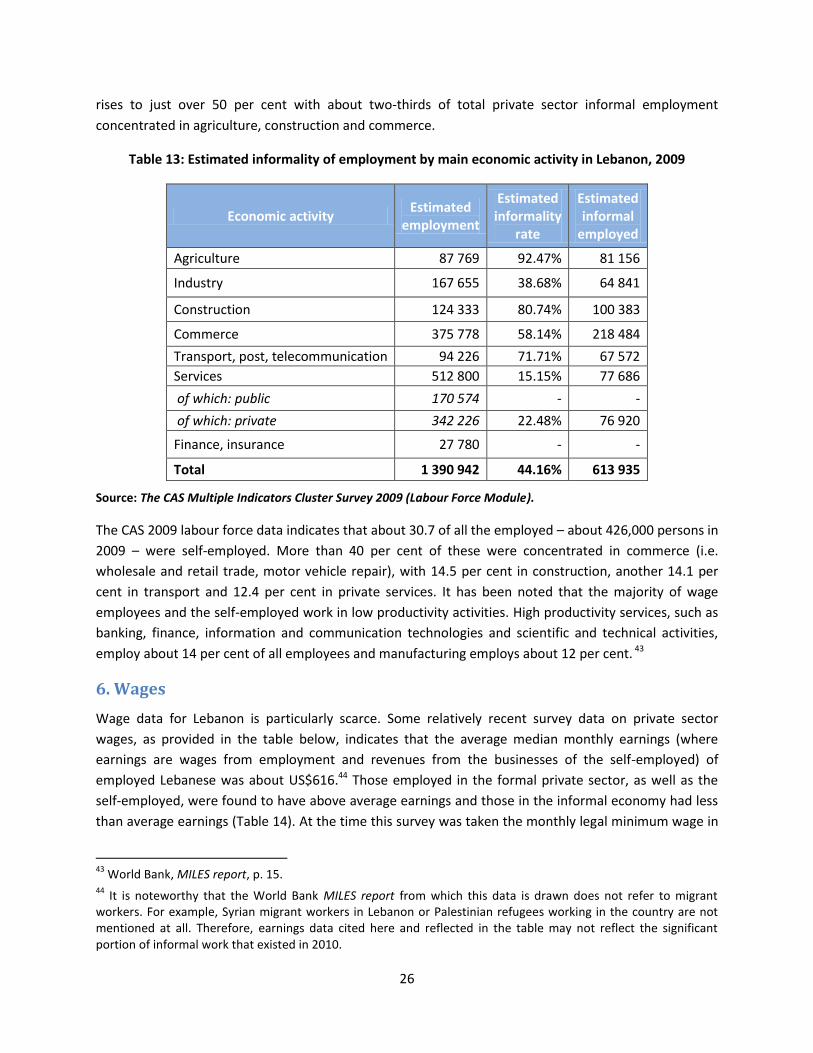
26
rises to just over 50 per cent with about two-thirds of total private sector informal employment
concentrated in agriculture, construction and commerce.
Table 13: Estimated informality of employment by main economic activity in Lebanon, 2009
Economic activity Estimated
employment
Estimated informality
rate
Estimated informal
employed
Agriculture 87 769 92.47% 81 156
Industry 167 655 38.68% 64 841
Construction 124 333 80.74% 100 383
Commerce 375 778 58.14% 218 484
Transport, post, telecommunication 94 226 71.71% 67 572
Services 512 800 15.15% 77 686
of which: public 170 574 - -
of which: private 342 226 22.48% 76 920
Finance, insurance 27 780 - -
Total 1 390 942 44.16% 613 935
Source: The CAS Multiple Indicators Cluster Survey 2009 (Labour Force Module).
The CAS 2009 labour force data indicates that about 30.7 of all the employed – about 426,000 persons in
2009 – were self-employed. More than 40 per cent of these were concentrated in commerce (i.e.
wholesale and retail trade, motor vehicle repair), with 14.5 per cent in construction, another 14.1 per
cent in transport and 12.4 per cent in private services. It has been noted that the majority of wage
employees and the self-employed work in low productivity activities. High productivity services, such as
banking, finance, information and communication technologies and scientific and technical activities,
employ about 14 per cent of all employees and manufacturing employs about 12 per cent. 43
6. Wages
Wage data for Lebanon is particularly scarce. Some relatively recent survey data on private sector
wages, as provided in the table below, indicates that the average median monthly earnings (where
earnings are wages from employment and revenues from the businesses of the self-employed) of
employed Lebanese was about US$616.44 Those employed in the formal private sector, as well as the
self-employed, were found to have above average earnings and those in the informal economy had less
than average earnings (Table 14). At the time this survey was taken the monthly legal minimum wage in
43
World Bank, MILES report, p. 15. 44
It is noteworthy that the World Bank MILES report from which this data is drawn does not refer to migrant workers. For example, Syrian migrant workers in Lebanon or Palestinian refugees working in the country are not mentioned at all. Therefore, earnings data cited here and reflected in the table may not reflect the significant portion of informal work that existed in 2010.
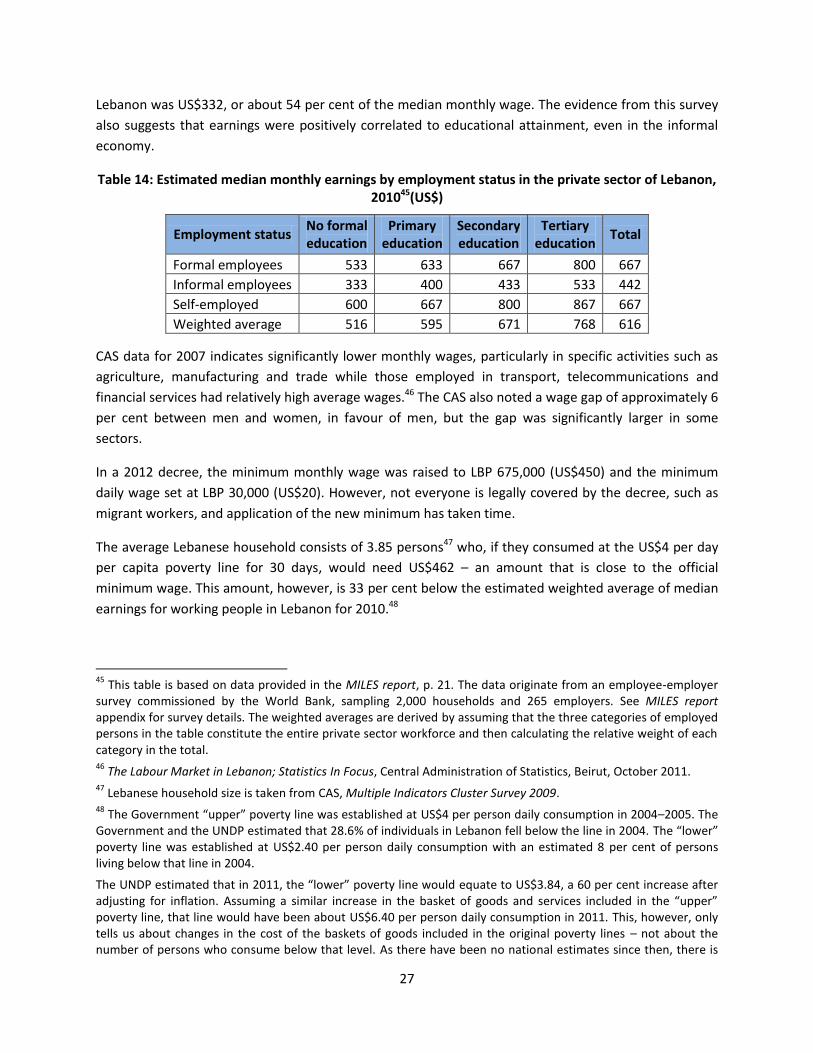
27
Lebanon was US$332, or about 54 per cent of the median monthly wage. The evidence from this survey
also suggests that earnings were positively correlated to educational attainment, even in the informal
economy.
Table 14: Estimated median monthly earnings by employment status in the private sector of Lebanon, 201045(US$)
Employment status No formal education
Primary education
Secondary education
Tertiary education
Total
Formal employees 533 633 667 800 667
Informal employees 333 400 433 533 442
Self-employed 600 667 800 867 667
Weighted average 516 595 671 768 616
CAS data for 2007 indicates significantly lower monthly wages, particularly in specific activities such as
agriculture, manufacturing and trade while those employed in transport, telecommunications and
financial services had relatively high average wages.46 The CAS also noted a wage gap of approximately 6
per cent between men and women, in favour of men, but the gap was significantly larger in some
sectors.
In a 2012 decree, the minimum monthly wage was raised to LBP 675,000 (US$450) and the minimum
daily wage set at LBP 30,000 (US$20). However, not everyone is legally covered by the decree, such as
migrant workers, and application of the new minimum has taken time.
The average Lebanese household consists of 3.85 persons47 who, if they consumed at the US$4 per day
per capita poverty line for 30 days, would need US$462 – an amount that is close to the official
minimum wage. This amount, however, is 33 per cent below the estimated weighted average of median
earnings for working people in Lebanon for 2010.48
45
This table is based on data provided in the MILES report, p. 21. The data originate from an employee-employer survey commissioned by the World Bank, sampling 2,000 households and 265 employers. See MILES report appendix for survey details. The weighted averages are derived by assuming that the three categories of employed persons in the table constitute the entire private sector workforce and then calculating the relative weight of each category in the total. 46
The Labour Market in Lebanon; Statistics In Focus, Central Administration of Statistics, Beirut, October 2011. 47
Lebanese household size is taken from CAS, Multiple Indicators Cluster Survey 2009. 48
The Government “upper” poverty line was established at US$4 per person daily consumption in 2004–2005. The Government and the UNDP estimated that 28.6% of individuals in Lebanon fell below the line in 2004. The “lower” poverty line was established at US$2.40 per person daily consumption with an estimated 8 per cent of persons living below that line in 2004.
The UNDP estimated that in 2011, the “lower” poverty line would equate to US$3.84, a 60 per cent increase after adjusting for inflation. Assuming a similar increase in the basket of goods and services included in the “upper” poverty line, that line would have been about US$6.40 per person daily consumption in 2011. This, however, only tells us about changes in the cost of the baskets of goods included in the original poverty lines – not about the number of persons who consume below that level. As there have been no national estimates since then, there is
28
7. Social protection
The high rate of informality in the Lebanese economy is another way of saying that there is inadequate
social protection for working people or retirees (i.e. health insurance, old-age, disability and death
pensions, unemployment insurance, maternity benefits, employment injury benefits and support for the
poor, etc.). While total national expenditures on social protection and education are substantial, the
vast bulk of it comes from private household sources, not the government budget. Moreover, much of
public expenditures on social protection and education are channeled through private providers and
non-governmental organizations.
The fragmentation of the social protection system in Lebanon is also expressed through the low
coverage rates. While retires from the public sector and the armed forces have their own pension and
health care schemes, more than 80 per cent of Lebanon’s over-65 population has no pension coverage,
most of these previously employed in the private sector and informal. The End-of-Service-Indemnity
(EOSI) programme for formal private sector employees, which is managed by the National Social
Security Fund (NSSF), covers only around 30 per cent of the labour force. Moreover, this programme is
a one-off payment amounting to one month’s salary for each year worked based on the worker’s final
salary. Such a scheme means retirees would never enjoy a decent standard of living for the rest of their
lives. 49
In addition to the inadequate social security coverage in old-age, social protection mechanisms in
Lebanon lack both coherence and coordination. For example, there are currently seven public
institutions which offer health insurance programs including: Ministry of Public Health (MOPH), National
Social Security Fund (NSSF), Fund for Civil Servants, Fund for the Military, Fund for Teachers and two
funds for security forces. Despite these many institutions, more than 80 per cent of Lebanon’s over-65
population lacks health coverage.50 The estimated share of Lebanese residents not formally covered by
any health insurance, whether public or private is over 50 per cent which equates to over two million
people. This half of the population relies solely on the services of the Ministry of Public Health (MoPH)
or personal out-of-pocket expenditures which has negative social and economic impacts on individuals
and families. For citizens not covered by any scheme the MoPH does provide a 85% direct payment to
hospitals/health care providers for treatment, with a 15 per cent co-payment by the individual. The
no update on the poverty rates in Lebanon. See Government of Lebanon and UNDP, Lebanon Millennium Development Goals Report 2013, December 2013, pp. 23. 49
For example, an employee who retires after 25 years of service and whose last monthly salary is equivalent to US$1,000 would receive a lump sum of US$25,000. Assuming the retiree is 65 years old, and given an average life expectancy in Lebanon of 80 years, the US$25,000 indemnity would have to cover an average of 15 years of expenditures and unforeseen contingencies. Excluding interest payments, such a sum would allow for expenditures of only US$1,667 per year (US$139 per month) through to age 80. Such a scheme does not provide the security of receiving an annuity but expects retirees and their dependents to live their remaining years on an inadequate amount of lump sum received at the end of their working life, making it difficult to maintain a decent standard of living 50
Available at ILO website: http://www.ilo.org/global/about-the-ilo/newsroom/features/WCMS_207664/lang--en/index.htm.
29
coordination between the several publically financed insurance providers, however, is very weak, and
the use of public subsides mandates are not yet well defined.
The fragmentation and discontinuities in the system of social protection translates into vulnerability,
marginalization and poverty for a significant share of the working population in Lebanon. The majority
of those not covered or badly covered by social protection will ultimately rely on family and informal
means in an attempt to meet their needs. Unfortunately, existing government social policies make it
more difficult for vulnerable groups to emerge from the cycle of poverty
8. Child Labour
While statistics on child labour in Lebanon do not exist, anecdotal evidence suggests it has been a
persistent phenomenon, augmented by recurring influxes of immigrants. The Government has
committed to combating the problem by ratifying, in 1991, the Convention on the Rights of the Child
(CRC), and in 2001, the Worst Forms of Child Labour Convention, 1999 (No. 182), as well as pledging the
National Action Plan to Eliminate the Worst Forms of Child Labour by 2016,51 launched in 2013.
Nevertheless, despite the Government’s efforts, child labour remains an issue with the large influx of
Syrian refugees, 53 per cent of whom are under 18 years of age. Of these, some 73 per cent do not
attend school and are therefore at risk of working.
In Lebanon, children who work are mainly employed in the informal sector and face harsh and insecure
working conditions. One recent study52 found that a total of 1,510 children across the 18 districts of
Lebanon were working and/or living in the streets, mainly in greater Beirut and Tripoli. The majority of
these children (73 per cent) were Syrians. Some 46 per cent were street vendors. Younger children were
more likely to engage in begging activities with a small number engaged in illicit activities such as
prostitution. On average they work 8.5 hours per day over 6 days a week and are subject to various
occupational hazards, with only a few of them having recourse to report abuse. Begging generated the
lowest level of income whereas illicit activities, especially prostitution, generated the highest income
levels.
IV. REFUGEES AND MIGRANTS IN THE LEBANESE LABOUR MARKET
It is not possible to adequately analyse the Lebanese labour market without addressing migrant and
refugee workers. Significant population movements – both emigration and immigration – have been a
central feature of the Lebanese labour market for decades. In addition to Palestinian refugees and their
offspring, who have resided in the country for more than 65 years, there have been a large number of
Syrian migrant workers in the past few decades, recently augmented with an unprecedented influx of
Syrian refugees since 2011. This is in addition to a large number of migrant workers from other Arab,
51
ILO, National Action Plan to Eliminate the Worst Forms of Child Labour in Lebanon by 2016. Beirut, Lebanon. 52
ILO, UNICEF & SCI. 2015, Children Living and Working on The Streets in Lebanon: Profile and Magnitude. Beirut, Lebanon.
30
Asian and African countries. Almost all these workers are engaged in low-skilled jobs from services to
construction to domestic work53 and most lack access to minimum labour standards. For the most part,
these groups have augmented the ranks of the informal labour supply in the country and, in the process,
have exacerbated pre-existing challenges with regard to creating decent work in Lebanon.
Due to a lack of data on the number and employment profile of migrant workers and given that this
greatly impacts the basic structure of employment in the country, this section focuses specifically on the
participation of Palestinian and Syrian refugees in the Lebanese labour market, using existing survey
data. The aim is to highlight the characteristics of these two relatively large groups and quantify their
size as they relate to the wider Lebanese labour market.
1. The Palestinian refugee population and labour force in Lebanon
Official UNRWA registration data indicates there was a total Palestinian refugee population in Lebanon
of 453,840 in 2010.54 That count excludes unregistered deaths and, more importantly, excludes
significant emigration of Palestinians from the country, especially in the 1980s and 1990s. The de facto
Palestinian refugee population in the country was estimated in a field survey at upwards of 280,000 in
2010 – about 6.4 per cent of Lebanon’s population – of whom an estimated 206,360 were of working
age.55
In 2012 the Palestinian dependency ratio was estimated at 52.4 per cent,56somewhat higher than the
48.4 per cent for the Lebanese host community. Moreover, the average Palestinian refugee household
size was estimated at 5.4 persons compared with 3.85 persons for the average Lebanese household.57
All else being equal, this suggests that the impact on Palestinian refugees of unemployment or job loss
would be greater than for Lebanese.
Given an estimated activity rate for the working age population of about 42.3 per cent, the size of the
Palestinian labour force in Lebanon is estimated at about 86,670. Palestinian employment is therefore
estimated to constitute about 5.6 per cent of total employment in Lebanon for those 15 years and older
(see Table 15).
53
According to the ILO and Human Rights Watch, the number of domestic workers range between 150,000 and 220,00. Many face difficult working conditions, often including forced labour and lacking access to minimum legal rights. http://ilo.dataflow.com.lb/MDWs_report_final_full.pdf and http://www.hrw.org/world-report/2013/country-chapters/lebanon?page=2. See also http://www.ilo.org/beirut/publications/WCMS_325243/lang--en/index.htm. 54
See UNRWA, UNRWA Statistics 2010: Selected Indicators, November 2011, Amman. 55
See Jad Chaaban et al., Socio-Economic Survey of Palestinian Refugees in Lebanon, American University of Beirut, December 2010 and ILO & the Committee for the Employment of Palestinian Refugees, Palestinian Employment in Lebanon: Facts and Challenges, Beirut, 2012. 56
See Jad Chaaban et al., Socio-Economic Survey of Palestinian Refugees in Lebanon, American University of Beirut, December 2010, p. 32. 57
Lebanese household size is taken from CAS, Multiple Indicators Cluster Survey 2009. The Palestinian refugee household size is from ILO & the Committee for the Employment of Palestinian Refugees, Palestinian Employment in Lebanon: Facts and Challenges. Beirut, 2012.
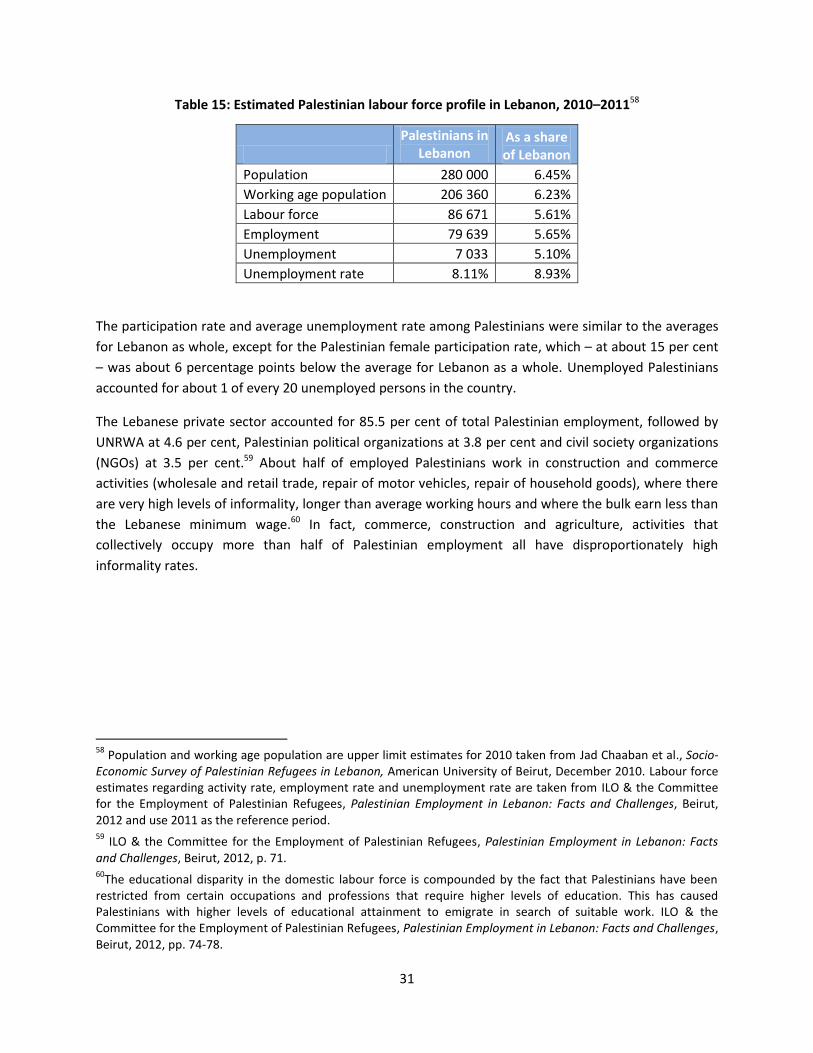
31
Table 15: Estimated Palestinian labour force profile in Lebanon, 2010–201158
Palestinians in Lebanon
As a share of Lebanon
Population 280 000 6.45%
Working age population 206 360 6.23%
Labour force 86 671 5.61%
Employment 79 639 5.65%
Unemployment 7 033 5.10%
Unemployment rate 8.11% 8.93%
The participation rate and average unemployment rate among Palestinians were similar to the averages
for Lebanon as whole, except for the Palestinian female participation rate, which – at about 15 per cent
– was about 6 percentage points below the average for Lebanon as a whole. Unemployed Palestinians
accounted for about 1 of every 20 unemployed persons in the country.
The Lebanese private sector accounted for 85.5 per cent of total Palestinian employment, followed by
UNRWA at 4.6 per cent, Palestinian political organizations at 3.8 per cent and civil society organizations
(NGOs) at 3.5 per cent.59 About half of employed Palestinians work in construction and commerce
activities (wholesale and retail trade, repair of motor vehicles, repair of household goods), where there
are very high levels of informality, longer than average working hours and where the bulk earn less than
the Lebanese minimum wage.60 In fact, commerce, construction and agriculture, activities that
collectively occupy more than half of Palestinian employment all have disproportionately high
informality rates.
58
Population and working age population are upper limit estimates for 2010 taken from Jad Chaaban et al., Socio-Economic Survey of Palestinian Refugees in Lebanon, American University of Beirut, December 2010. Labour force estimates regarding activity rate, employment rate and unemployment rate are taken from ILO & the Committee for the Employment of Palestinian Refugees, Palestinian Employment in Lebanon: Facts and Challenges, Beirut, 2012 and use 2011 as the reference period. 59
ILO & the Committee for the Employment of Palestinian Refugees, Palestinian Employment in Lebanon: Facts and Challenges, Beirut, 2012, p. 71. 60
The educational disparity in the domestic labour force is compounded by the fact that Palestinians have been restricted from certain occupations and professions that require higher levels of education. This has caused Palestinians with higher levels of educational attainment to emigrate in search of suitable work. ILO & the Committee for the Employment of Palestinian Refugees, Palestinian Employment in Lebanon: Facts and Challenges, Beirut, 2012, pp. 74-78.
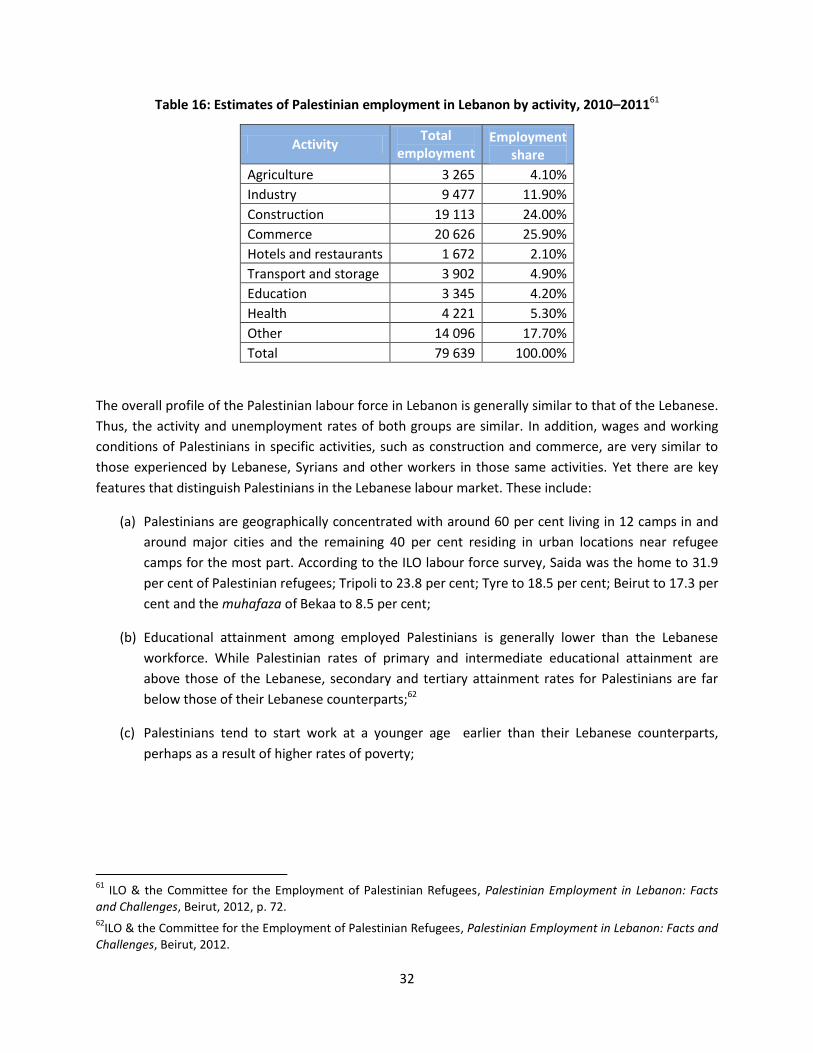
32
Table 16: Estimates of Palestinian employment in Lebanon by activity, 2010–201161
Activity Total
employment Employment
share
Agriculture 3 265 4.10%
Industry 9 477 11.90%
Construction 19 113 24.00%
Commerce 20 626 25.90%
Hotels and restaurants 1 672 2.10%
Transport and storage 3 902 4.90%
Education 3 345 4.20%
Health 4 221 5.30%
Other 14 096 17.70%
Total 79 639 100.00%
The overall profile of the Palestinian labour force in Lebanon is generally similar to that of the Lebanese.
Thus, the activity and unemployment rates of both groups are similar. In addition, wages and working
conditions of Palestinians in specific activities, such as construction and commerce, are very similar to
those experienced by Lebanese, Syrians and other workers in those same activities. Yet there are key
features that distinguish Palestinians in the Lebanese labour market. These include:
(a) Palestinians are geographically concentrated with around 60 per cent living in 12 camps in and
around major cities and the remaining 40 per cent residing in urban locations near refugee
camps for the most part. According to the ILO labour force survey, Saida was the home to 31.9
per cent of Palestinian refugees; Tripoli to 23.8 per cent; Tyre to 18.5 per cent; Beirut to 17.3 per
cent and the muhafaza of Bekaa to 8.5 per cent;
(b) Educational attainment among employed Palestinians is generally lower than the Lebanese
workforce. While Palestinian rates of primary and intermediate educational attainment are
above those of the Lebanese, secondary and tertiary attainment rates for Palestinians are far
below those of their Lebanese counterparts;62
(c) Palestinians tend to start work at a younger age earlier than their Lebanese counterparts,
perhaps as a result of higher rates of poverty;
61
ILO & the Committee for the Employment of Palestinian Refugees, Palestinian Employment in Lebanon: Facts and Challenges, Beirut, 2012, p. 72. 62
ILO & the Committee for the Employment of Palestinian Refugees, Palestinian Employment in Lebanon: Facts and Challenges, Beirut, 2012.
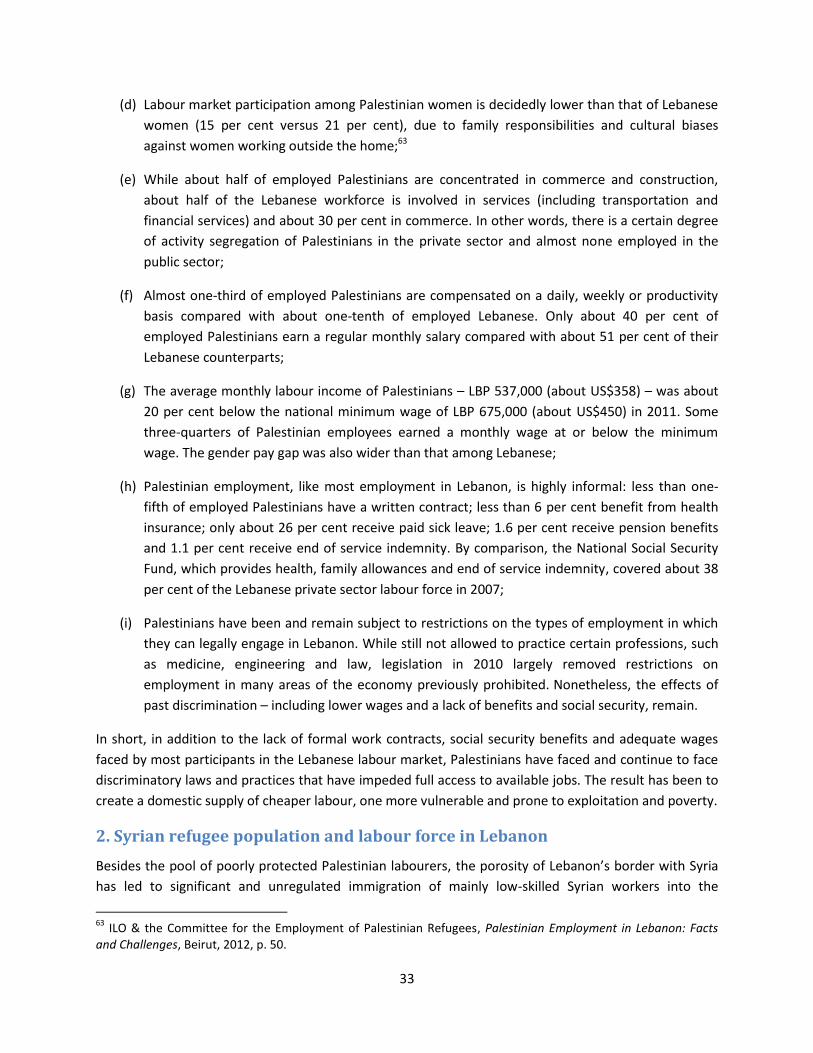
33
(d) Labour market participation among Palestinian women is decidedly lower than that of Lebanese
women (15 per cent versus 21 per cent), due to family responsibilities and cultural biases
against women working outside the home;63
(e) While about half of employed Palestinians are concentrated in commerce and construction,
about half of the Lebanese workforce is involved in services (including transportation and
financial services) and about 30 per cent in commerce. In other words, there is a certain degree
of activity segregation of Palestinians in the private sector and almost none employed in the
public sector;
(f) Almost one-third of employed Palestinians are compensated on a daily, weekly or productivity
basis compared with about one-tenth of employed Lebanese. Only about 40 per cent of
employed Palestinians earn a regular monthly salary compared with about 51 per cent of their
Lebanese counterparts;
(g) The average monthly labour income of Palestinians – LBP 537,000 (about US$358) – was about
20 per cent below the national minimum wage of LBP 675,000 (about US$450) in 2011. Some
three-quarters of Palestinian employees earned a monthly wage at or below the minimum
wage. The gender pay gap was also wider than that among Lebanese;
(h) Palestinian employment, like most employment in Lebanon, is highly informal: less than one-
fifth of employed Palestinians have a written contract; less than 6 per cent benefit from health
insurance; only about 26 per cent receive paid sick leave; 1.6 per cent receive pension benefits
and 1.1 per cent receive end of service indemnity. By comparison, the National Social Security
Fund, which provides health, family allowances and end of service indemnity, covered about 38
per cent of the Lebanese private sector labour force in 2007;
(i) Palestinians have been and remain subject to restrictions on the types of employment in which
they can legally engage in Lebanon. While still not allowed to practice certain professions, such
as medicine, engineering and law, legislation in 2010 largely removed restrictions on
employment in many areas of the economy previously prohibited. Nonetheless, the effects of
past discrimination – including lower wages and a lack of benefits and social security, remain.
In short, in addition to the lack of formal work contracts, social security benefits and adequate wages
faced by most participants in the Lebanese labour market, Palestinians have faced and continue to face
discriminatory laws and practices that have impeded full access to available jobs. The result has been to
create a domestic supply of cheaper labour, one more vulnerable and prone to exploitation and poverty.
2. Syrian refugee population and labour force in Lebanon
Besides the pool of poorly protected Palestinian labourers, the porosity of Lebanon’s border with Syria
has led to significant and unregulated immigration of mainly low-skilled Syrian workers into the
63
ILO & the Committee for the Employment of Palestinian Refugees, Palestinian Employment in Lebanon: Facts and Challenges, Beirut, 2012, p. 50.
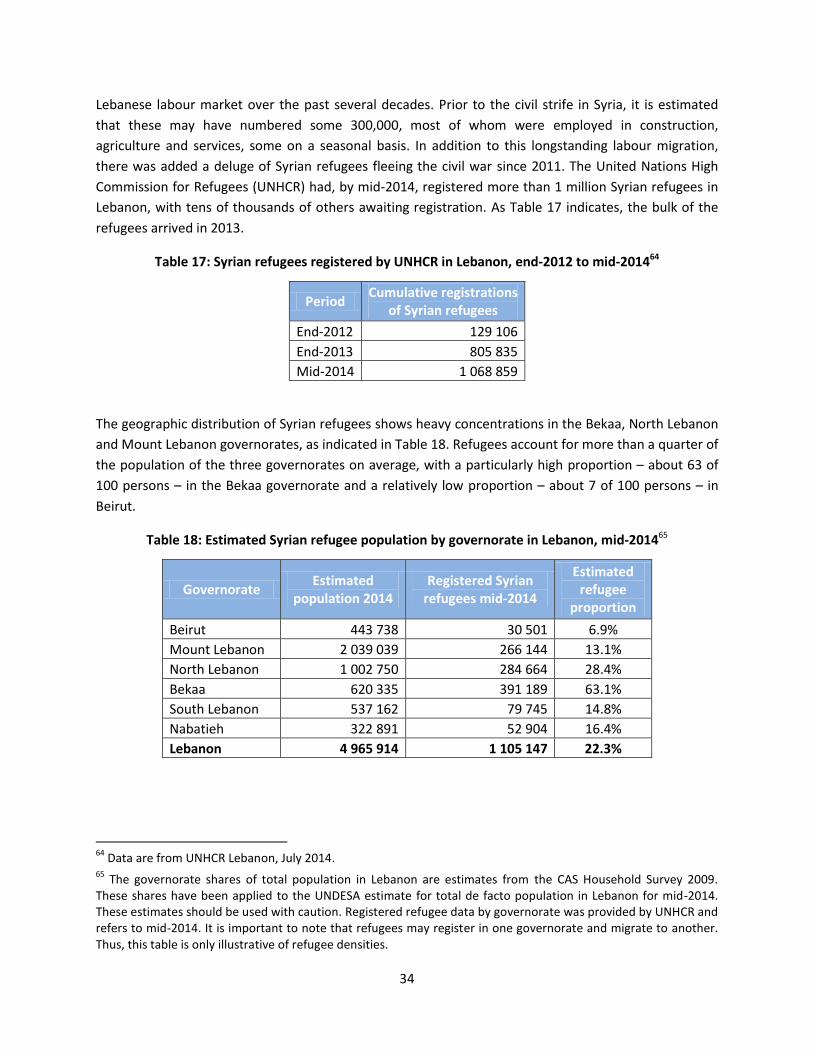
34
Lebanese labour market over the past several decades. Prior to the civil strife in Syria, it is estimated
that these may have numbered some 300,000, most of whom were employed in construction,
agriculture and services, some on a seasonal basis. In addition to this longstanding labour migration,
there was added a deluge of Syrian refugees fleeing the civil war since 2011. The United Nations High
Commission for Refugees (UNHCR) had, by mid-2014, registered more than 1 million Syrian refugees in
Lebanon, with tens of thousands of others awaiting registration. As Table 17 indicates, the bulk of the
refugees arrived in 2013.
Table 17: Syrian refugees registered by UNHCR in Lebanon, end-2012 to mid-201464
Period Cumulative registrations
of Syrian refugees
End-2012 129 106
End-2013 805 835
Mid-2014 1 068 859
The geographic distribution of Syrian refugees shows heavy concentrations in the Bekaa, North Lebanon
and Mount Lebanon governorates, as indicated in Table 18. Refugees account for more than a quarter of
the population of the three governorates on average, with a particularly high proportion – about 63 of
100 persons – in the Bekaa governorate and a relatively low proportion – about 7 of 100 persons – in
Beirut.
Table 18: Estimated Syrian refugee population by governorate in Lebanon, mid-201465
Governorate Estimated
population 2014 Registered Syrian
refugees mid-2014
Estimated refugee
proportion
Beirut 443 738 30 501 6.9%
Mount Lebanon 2 039 039 266 144 13.1%
North Lebanon 1 002 750 284 664 28.4%
Bekaa 620 335 391 189 63.1%
South Lebanon 537 162 79 745 14.8%
Nabatieh 322 891 52 904 16.4%
Lebanon 4 965 914 1 105 147 22.3%
64
Data are from UNHCR Lebanon, July 2014. 65
The governorate shares of total population in Lebanon are estimates from the CAS Household Survey 2009. These shares have been applied to the UNDESA estimate for total de facto population in Lebanon for mid-2014. These estimates should be used with caution. Registered refugee data by governorate was provided by UNHCR and refers to mid-2014. It is important to note that refugees may register in one governorate and migrate to another. Thus, this table is only illustrative of refugee densities.
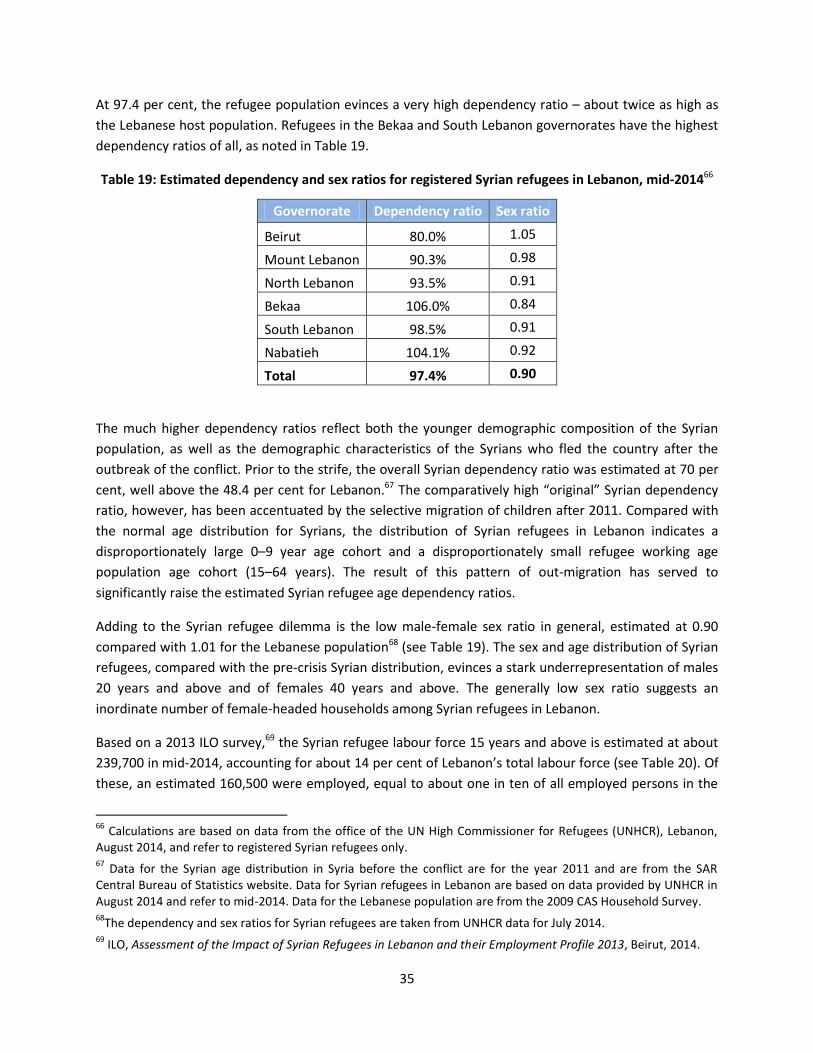
35
At 97.4 per cent, the refugee population evinces a very high dependency ratio – about twice as high as
the Lebanese host population. Refugees in the Bekaa and South Lebanon governorates have the highest
dependency ratios of all, as noted in Table 19.
Table 19: Estimated dependency and sex ratios for registered Syrian refugees in Lebanon, mid-201466
Governorate Dependency ratio Sex ratio
Beirut 80.0% 1.05
Mount Lebanon 90.3% 0.98
North Lebanon 93.5% 0.91
Bekaa 106.0% 0.84
South Lebanon 98.5% 0.91
Nabatieh 104.1% 0.92
Total 97.4% 0.90
The much higher dependency ratios reflect both the younger demographic composition of the Syrian
population, as well as the demographic characteristics of the Syrians who fled the country after the
outbreak of the conflict. Prior to the strife, the overall Syrian dependency ratio was estimated at 70 per
cent, well above the 48.4 per cent for Lebanon.67 The comparatively high “original” Syrian dependency
ratio, however, has been accentuated by the selective migration of children after 2011. Compared with
the normal age distribution for Syrians, the distribution of Syrian refugees in Lebanon indicates a
disproportionately large 0–9 year age cohort and a disproportionately small refugee working age
population age cohort (15–64 years). The result of this pattern of out-migration has served to
significantly raise the estimated Syrian refugee age dependency ratios.
Adding to the Syrian refugee dilemma is the low male-female sex ratio in general, estimated at 0.90
compared with 1.01 for the Lebanese population68 (see Table 19). The sex and age distribution of Syrian
refugees, compared with the pre-crisis Syrian distribution, evinces a stark underrepresentation of males
20 years and above and of females 40 years and above. The generally low sex ratio suggests an
inordinate number of female-headed households among Syrian refugees in Lebanon.
Based on a 2013 ILO survey,69 the Syrian refugee labour force 15 years and above is estimated at about
239,700 in mid-2014, accounting for about 14 per cent of Lebanon’s total labour force (see Table 20). Of
these, an estimated 160,500 were employed, equal to about one in ten of all employed persons in the
66
Calculations are based on data from the office of the UN High Commissioner for Refugees (UNHCR), Lebanon, August 2014, and refer to registered Syrian refugees only. 67
Data for the Syrian age distribution in Syria before the conflict are for the year 2011 and are from the SAR Central Bureau of Statistics website. Data for Syrian refugees in Lebanon are based on data provided by UNHCR in August 2014 and refer to mid-2014. Data for the Lebanese population are from the 2009 CAS Household Survey. 68
The dependency and sex ratios for Syrian refugees are taken from UNHCR data for July 2014. 69
ILO, Assessment of the Impact of Syrian Refugees in Lebanon and their Employment Profile 2013, Beirut, 2014.
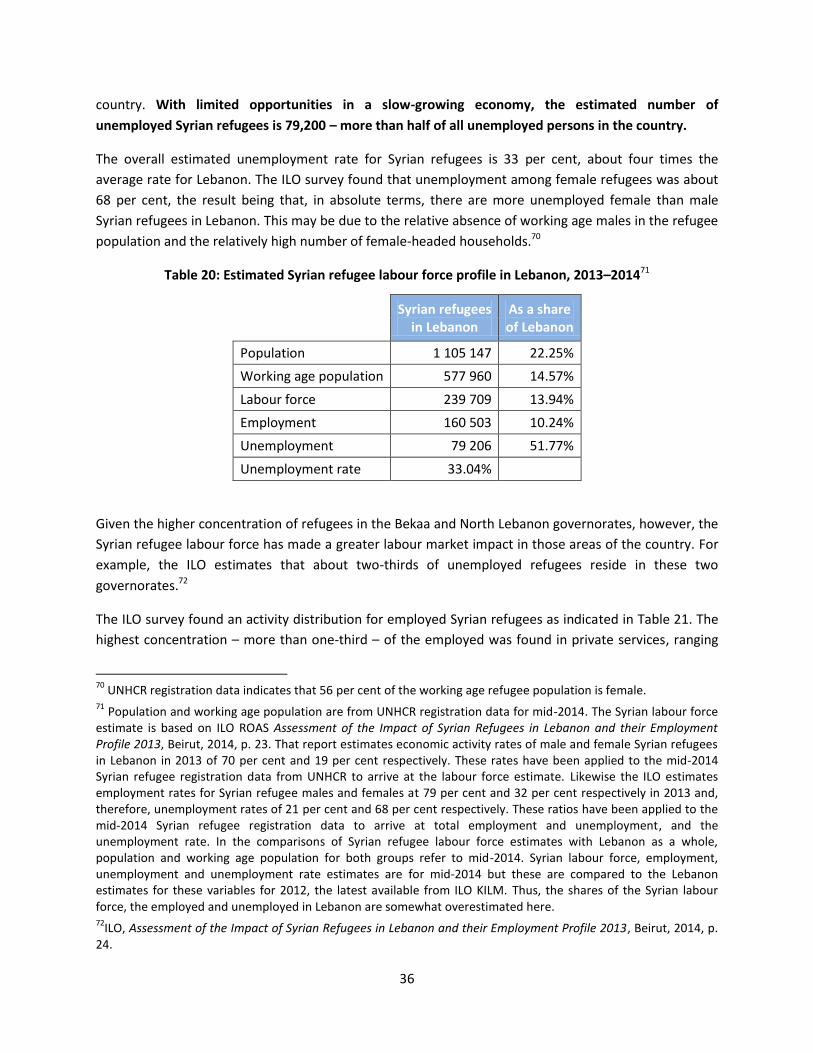
36
country. With limited opportunities in a slow-growing economy, the estimated number of
unemployed Syrian refugees is 79,200 – more than half of all unemployed persons in the country.
The overall estimated unemployment rate for Syrian refugees is 33 per cent, about four times the
average rate for Lebanon. The ILO survey found that unemployment among female refugees was about
68 per cent, the result being that, in absolute terms, there are more unemployed female than male
Syrian refugees in Lebanon. This may be due to the relative absence of working age males in the refugee
population and the relatively high number of female-headed households.70
Table 20: Estimated Syrian refugee labour force profile in Lebanon, 2013–201471
Syrian refugees in Lebanon
As a share of Lebanon
Population 1 105 147 22.25%
Working age population 577 960 14.57%
Labour force 239 709 13.94%
Employment 160 503 10.24%
Unemployment 79 206 51.77%
Unemployment rate 33.04%
Given the higher concentration of refugees in the Bekaa and North Lebanon governorates, however, the
Syrian refugee labour force has made a greater labour market impact in those areas of the country. For
example, the ILO estimates that about two-thirds of unemployed refugees reside in these two
governorates.72
The ILO survey found an activity distribution for employed Syrian refugees as indicated in Table 21. The
highest concentration – more than one-third – of the employed was found in private services, ranging
70
UNHCR registration data indicates that 56 per cent of the working age refugee population is female. 71
Population and working age population are from UNHCR registration data for mid-2014. The Syrian labour force estimate is based on ILO ROAS Assessment of the Impact of Syrian Refugees in Lebanon and their Employment Profile 2013, Beirut, 2014, p. 23. That report estimates economic activity rates of male and female Syrian refugees in Lebanon in 2013 of 70 per cent and 19 per cent respectively. These rates have been applied to the mid-2014 Syrian refugee registration data from UNHCR to arrive at the labour force estimate. Likewise the ILO estimates employment rates for Syrian refugee males and females at 79 per cent and 32 per cent respectively in 2013 and, therefore, unemployment rates of 21 per cent and 68 per cent respectively. These ratios have been applied to the mid-2014 Syrian refugee registration data to arrive at total employment and unemployment, and the unemployment rate. In the comparisons of Syrian refugee labour force estimates with Lebanon as a whole, population and working age population for both groups refer to mid-2014. Syrian labour force, employment, unemployment and unemployment rate estimates are for mid-2014 but these are compared to the Lebanon estimates for these variables for 2012, the latest available from ILO KILM. Thus, the shares of the Syrian labour force, the employed and unemployed in Lebanon are somewhat overestimated here. 72
ILO, Assessment of the Impact of Syrian Refugees in Lebanon and their Employment Profile 2013, Beirut, 2014, p. 24.
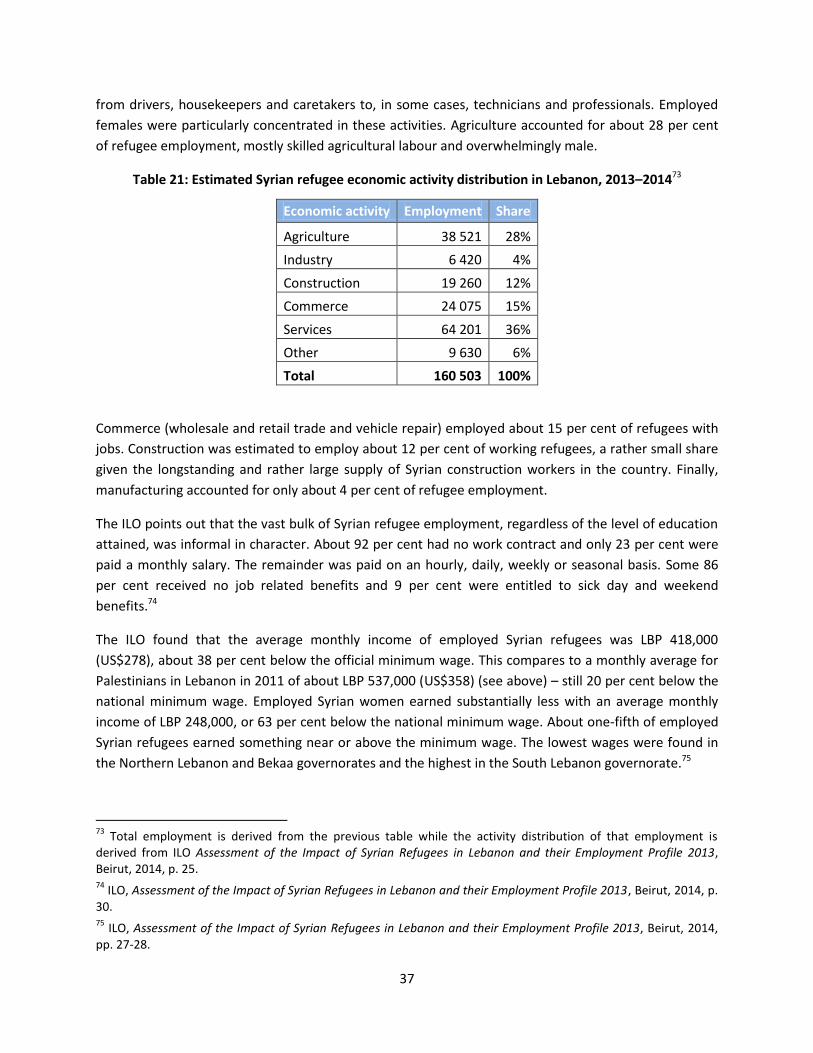
37
from drivers, housekeepers and caretakers to, in some cases, technicians and professionals. Employed
females were particularly concentrated in these activities. Agriculture accounted for about 28 per cent
of refugee employment, mostly skilled agricultural labour and overwhelmingly male.
Table 21: Estimated Syrian refugee economic activity distribution in Lebanon, 2013–201473
Economic activity Employment Share
Agriculture 38 521 28%
Industry 6 420 4%
Construction 19 260 12%
Commerce 24 075 15%
Services 64 201 36%
Other 9 630 6%
Total 160 503 100%
Commerce (wholesale and retail trade and vehicle repair) employed about 15 per cent of refugees with
jobs. Construction was estimated to employ about 12 per cent of working refugees, a rather small share
given the longstanding and rather large supply of Syrian construction workers in the country. Finally,
manufacturing accounted for only about 4 per cent of refugee employment.
The ILO points out that the vast bulk of Syrian refugee employment, regardless of the level of education
attained, was informal in character. About 92 per cent had no work contract and only 23 per cent were
paid a monthly salary. The remainder was paid on an hourly, daily, weekly or seasonal basis. Some 86
per cent received no job related benefits and 9 per cent were entitled to sick day and weekend
benefits.74
The ILO found that the average monthly income of employed Syrian refugees was LBP 418,000
(US$278), about 38 per cent below the official minimum wage. This compares to a monthly average for
Palestinians in Lebanon in 2011 of about LBP 537,000 (US$358) (see above) – still 20 per cent below the
national minimum wage. Employed Syrian women earned substantially less with an average monthly
income of LBP 248,000, or 63 per cent below the national minimum wage. About one-fifth of employed
Syrian refugees earned something near or above the minimum wage. The lowest wages were found in
the Northern Lebanon and Bekaa governorates and the highest in the South Lebanon governorate.75
73
Total employment is derived from the previous table while the activity distribution of that employment is derived from ILO Assessment of the Impact of Syrian Refugees in Lebanon and their Employment Profile 2013, Beirut, 2014, p. 25. 74
ILO, Assessment of the Impact of Syrian Refugees in Lebanon and their Employment Profile 2013, Beirut, 2014, p. 30. 75
ILO, Assessment of the Impact of Syrian Refugees in Lebanon and their Employment Profile 2013, Beirut, 2014, pp. 27-28.
38
3. Assessing the aggregate impact of Syrian refugees on the labour market76
The World Bank has estimated that, assuming 1.7 million Syrian refugees in Lebanon by end-2014, the
labour supply would increase by between 30 and 50 per cent with the largest impacts on women, youth
and unskilled workers. Under such conditions, the World Bank estimated that an additional 220,000–
320,000 Lebanese would become unemployed (compared with a no-refugee situation), most of them
unskilled youth, raising the Lebanese unemployment rate by up to 10 percentage points. Likewise, the
share of informal work in the Lebanese labour market would increase by up to 10 percentage points.
The labour market impact of the Syrian influx, the World Bank estimated, would result in an increase in
the total number of Lebanese living below the poverty line (US$4 per day per person) from about 1
million to 1.17 million and would push the existing poor deeper below the poverty threshold by end-
2014. Greater poverty would be especially felt in regions of higher pre-existing poverty.
However, the World Bank figures have assumed a Syrian refugee population of 1.7 million, considerably
greater than the UNHCR registration data for mid-2014 (1.06 million). Likewise, as noted elsewhere in
this report, the World Bank has also underestimated the total size of the de facto Lebanese population.
Therefore, the World Bank’s simulation overstates both the absolute size of the refugee labour force
and its relative size vis-à-vis the pre-existing Lebanese labour force.
Estimates produced in this report – using UNHCR 2014 population and demographic data and ILO 2013
estimates of activity rates – suggest that the active Syrian labour force in Lebanon was about 239,700 in
mid-2014. As such, the total labour supply in Lebanon would have increased by less than 15 per cent
(excluding children below age 15) – well below World Bank estimates. This report estimates Syrian
refugee employment in mid-2014 at about 160,500. If it is assumed that Syrians took jobs that would
have only been filled by Lebanese, then the argument could be made that Syrians have “disemployed”
this many Lebanese. This, however, would also be well below World Bank estimates of Lebanese job
losses to competition from Syrian refugees.
On the other hand, if the presence of refugees (materially supported, in part, with their own savings
and, in part, by assistance from humanitarian organizations) generated additional demand for goods and
services in local markets, as is likely, then at least some of the jobs occupied by Syrian refugees did not
come at the expense of Lebanese workers.77 If we assume that Syrian refugee employment was entirely
in informal activities – as is likely – then the World Bank’s estimate of a 10 percentage point increase in
the informality rate in Lebanon seems entirely reasonable, given the CAS informality data reviewed
above.
76
Unless otherwise indicated, the data and analysis in this section are from World Bank, Lebanon: Economic and Social Impact Assessment of the Syrian Conflict, September 5, 2013. 77
There is evidence that such a phenomenon has been occurring in areas of heavy Syrian refugee concentrations. See IRC, Save the Children, DRC, OXFAM, UKaid, Lebanon Emergency Market Mapping and Analysis (EMMA): Executive Briefing for Analyses of the Construction, Service Sector and Agricultural Labor Systems, April 2013, p. 7.
39
This report’s estimate of 79,200 unemployed Syrian refugees in mid-2014 has perhaps the most
significant implications for the Lebanese labour market. Representing as much as half of all unemployed
in the country, they would tend to generate significant competitive pressures on local informal labour
markets, particularly in the North Lebanon and Bekaa governorates.78 They would also increase the
overall unemployment rate from about 9 per cent in 2012 to perhaps 12 per cent in 2014.79 While this is
a significant increase in unemployment, it is considerably less dire than the 10 percentage point increase
projected by the World Bank.
V. ADDRESSING DECENT WORK DEFICITS IN LEBANON
The working populations in Lebanon – whether Lebanese, Palestinian or Syrian – share many common
features. In the vast informal economy, significant numbers and portions of each population face
inadequate working conditions characterized by low wages, relatively long working hours, irregularity of
work availability (seasonality), no formal contracts, no health, retirement or other benefits and, too
often, hazardous job conditions. Even before the Syrian refugee crisis one of the main issues facing the
Lebanese labour market was the low quality of work, itself a result of the laissez faire approach to
immigration and labour market management on the part of the Government.
For the most part, formal employment has remained off limits to Palestinians and Syrians due to the lack
of such employment as well as Lebanon’s labour laws. Among Lebanese nationals, about half the
working population have formal wage contract arrangements, with more than half of these in the public
sector (including the security forces). For the most part, this half of the Lebanese workforce (public
sector workers plus formal private sector workers), has a modicum of job and social security. The other
half of the Lebanese work force, as well as Palestinians and Syrians, do not.
For policy-makers seeking to raise the quality of life in Lebanon, adopting an effective strategy cannot be
easy. Lebanon is a small, open economy in a region of the world subject to significant political
uncertainty and instability, particularly in the last decade, and the country has been subject to repeated
and significant spillover effects.
It is undeniable that Lebanon’s labour market needs an expanded base to create better jobs and this
requires a comprehensive mix of policies including macroeconomic, industrial social and labour policies.
Nevertheless, the presentation below provides some selected policy elements that require
consideration and which relate to the attainment of decent work and equal opportunity in Lebanon.
78
Ibid. The EMMA found significant downward daily wage pressures in agriculture and construction in the North Lebanon and Bekaa governorates. 79
This calculation is based on the ILO KILM estimate for total labour force and unemployment for Lebanon in 2012. To this estimate has been added the total estimated Syrian refugee labour force and unemployed. The assumption here is that the Lebanese unemployment rate did not change substantially in 2013.
40
1. Macroeconomic policies
In securing decent work for all Lebanese, ensuring the macroeconomic conditions for continued growth
is essential. To this end, a continued commitment to reducing fiscal deficits would relieve the
Government of the need to offer relatively high interest rates on government debt as a way of
compensating investors for higher levels of political risk. The relatively high rates offered by the
Government have had the effect of raising interest rates across the board, including interest rates on
bank deposits in the country, and increasing inflows of short-term capital from abroad. This has led to an
overvaluation of the Lebanese pound, thereby reducing export competitiveness. Lower interest rates
would reduce the costs for, and therefore shift incentives in favour of, longer term and more innovative
or productive investment. They would also reduce the upward pressure on the value of the Lebanese
currency.
Necessary public infrastructure spending, which has declined as a share of GDP in the last decade, can
be enhanced by the imposition of additional taxes to finance it. In particular, taxes on real estate
activities, which are presently very low, could be increased without much negative impact on those
activities. Likewise, increased taxes on individuals’ capital gains from real estate would allow the
Government to finance needed infrastructural spending – particularly in electricity, a bottleneck for the
whole economy – without significant negative impacts on the activity or the fiscal standing of the state.
The current tax structure, in which labour income is taxed at a higher rate than property income, and
the activities of non-tradable activities (e.g. real estate) are taxed less than tradable activities (e.g.
manufacturing) could likewise be modified to make them fairer. In the process, incentives for greater
and more productive use of labour would be enhanced.
Improved access to credit for the large number of self-employed would give incentives for many
entrepreneurs to increase the scale of their enterprises and enhance the employment of more educated
and skilled labour. One of the ways to do this is to further develop the domestic stock market to allow
small enterprises to incorporate and gain access to investment funding from such a market. Another
medium- to long-term growth strategy might be the development of private-public collaborations that
would take advantage of Lebanon’s educated and skilled workforce to produce high value added goods
and services similar to what Ireland, Taiwan and other small open economies have achieved.
Fostering competition through controlling corruption and regulating anti-competitive activities would
also go a long way to enhancing employment-creating growth. An environment where corrupt practices
are reduced or eliminated will give greater confidence to smaller and newer investors, as well as to
foreign investors by reducing the costs and uncertainty of undertaking projects. Enforcement of
competition norms would also result in the entry of small enterprises into Lebanon’s mainly oligopolistic
markets, thereby necessitating innovation and higher levels of productivity. These would make the
country’s goods and services more competitive on world markets.
2. Job creation
The high unemployment rates and low economic activity rates, especially among youth, point to a
serious deficit in the creation of decent jobs. Efforts can be targeted to create the type of jobs which

41
provide a decent living standard. For example, the very large number of small businesses in the country
– including agricultural holdings, manufacturers and service providers – can form the basis for policies
designed to consolidate and scale up production processes and modernize marketing. These can be
achieved by increasing the number of entrepreneurship and self-employment development and training
programmes, market-relevant skills development (including vocational education) and credit facilities. In
addition, it is necessary to create the proper regulatory framework that is both conducive to the
formalization of enterprises and, at the same time, able to expand market access for goods and services
produced by such enterprises. Syrian and Palestinian refugees should be included in such programmes,
especially when they have specific skills or capacities that are in high demand. Special attention to
women and youth in such programmes would address their exceptionally high unemployment levels.
Beyond this, when it comes to actual job creation it is essential to look into new, non-traditional
activities. For example, in Lebanon electricity generation from Électricité du Liban (EdL) has become a
major bottleneck for economic growth and a significant burden on state finances. Encouraging the
development of solar, wind and other alternative sources of energy would diversify the base of
sustainable productive employment in the country and serve several labour market (and
macroeconomic) objectives. First, such new techniques could engage a relatively large number of semi-
skilled and skilled people, as well as a large number of small businesses, in a relatively short period of
time (1–3 years). Talent and capital would be needed in developing business models for the design,
production (assembly), sale, installation and maintenance of alternative energy systems. Second,
adoption of such systems by residential builders in Lebanon would cut the demand for expensive
electricity as currently produced. This could, over the medium term, mitigate the production and
distribution crisis currently faced by EdL. Third, Lebanese skills and education, as well as business savvy
and entrepreneurship, could be put to work in developing alternative energy goods and services that
could be exported to other countries in the region where, like Lebanon, sun and wind are in plentiful
supply and customs and practices are similar. In particular, the potential for solar energy development in
Lebanon and elsewhere is increasingly significant as the cost of photovoltaic cells and other inputs
continue to decline,80 making its adoption increasingly cost-competitive.
3. The role of the Ministry of Labour
The Ministry of Labour has a potentially pivotal role to play. It is responsible for employment conditions,
labour relations, labour inspection and for shaping the employment policy, including the employment of
foreign and domestic workers. All these areas correspond to the critical challenges currently facing
Lebanon. The key role of the Ministry as the central administrative authority in the field of labour should
be strengthened so that it can become the driving force in elaborating and implementing labour policies
within its mandate. Obviously, the Ministry is also in charge of many day-to-day activities and services,
80
Reported installed prices of US residential and commercial photovoltaic systems declined an average of 5–7 per cent per year during 1998–2011 and by 11–14 per cent from 2010–2011, depending on system size. Preliminary data suggest that the price reductions continued in 2012. Specifically, systems prices quoted in Q4 2011 (and installed in 2012) indicate installed prices corresponding to a 25–29 per cent year-on-year reduction compared to Q4 2010 benchmarks. See David Feldman, et al., Photovoltaic (PV) Pricing Trends: Historical, Recent, and Near-Term Projections US Department of Energy SunShot Initiative, Washington, DC, November 2012, p. v.
42
such as the issuing of work permits, registration of enterprises or inspection of employment conditions.
The population’s attitude towards the labour administration largely depends on whether these services
are implemented in an impartial and ethical way by competent and helpful public servants. However,
the major responsibility of the Ministry is in the policy-making field. Long-term strategies, as well as
operational policies, should be elaborated and adopted by the Ministry and should be based on reliable
data and on analysis of underlying economic and social trends. As labour policies concern the public and
have to deal with contradictory interests of social partners, they must be based on wide-ranging
consultations.
Greater enforcement of labour standards would include greater enforcement of work safety standards
and the full implementation of the February 2012 decree to raise the minimum wage from LBP 500,000
(US$333) to LBP 675,000 (US$450). As the evidence above indicates, some three-quarters of Palestinians
and Syrians employed in Lebanon earned a monthly wage at or below the minimum wage and thus
crowd out unskilled Lebanese workers. Considered thus, a significant number of Lebanese employed in
agriculture, commerce and some services would benefit from enforcement of the new minimum wage.
In short, while humanitarian assistance and job creation programmes would help to stabilize the impact
of the Syrian refugee crisis in Lebanon in the short term, addressing the medium - and long-term
challenges of employment and living standards are just as important and they will require substantial
reform of all labour market institutions, updating the regulatory framework and ensuring the production
and use of reliable labour market data.
4. Social protection policies
This paper if anything revealed the vulnerability in the Lebanese Labour market for a vast number of
Workers. Indeed effective social security coverage remains low as most social insurance systems cater
only for public and private sector workers with regular contracts. Other categories of workers are
excluded from legal social security coverage. High rates of informality, low female labour market
participation and high levels of unemployment further contribute to the effectively low coverage. In
addition, the social protection system is very fragmented and neither provides pensions, nor
unemployment insurance benefits for private sector workers. Also, retired private sector workers are
excluded under the health coverage of the NSSF. When broader schemes are available, such as various
subsidies, they are often poorly targeted and require substantial public financing. What is needed in
Lebanon today is a new approach one which is based on social redistribution, equity and efficiency.
First, Lebanon should consider adopting the Social Protection Floor which would guarantee a minimum
set of social protection guarantees for all the population.81 Experiences from other parts of the world
show that social security programmes which aim at building a social protection floor (including social
pensions, child benefits, benefits for the unemployed and poor, and better access to essential health
81
Social protection floors are nationally defined sets of basic social security guarantees that should ensure, as a minimum that, over the life cycle, all in need have access to essential health care and to basic income security which together secure effective access to goods and services defined as necessary at the national level. http://www.ilo.org/secsoc/areas-of-work/policy-development-and-applied-research/social-protection-floor/lang--en/index.htm
43
service for all), have contributed to enhancing income security, education and health outcomes,
reducing the incidence of child labour, and encouraged engagement in productive activities). Second, it
is necessary to adopt the long-expected old-age, disability and death pensions scheme for private sector
workers and to extend health coverage to retired workers under the NSSF. Third, it is essential to
develop a coherent national social security system which brings together different types of programmes
and target groups and modes of provision under one policy framework. This is the only way to address
the fragmented and poorly targeted system which exists now. Third is the fact that social security is a
pre-condition for more productivity. When some categories of workers are excluded this creates labour
market distortion which are likely to jeopardise the functioning of the labour market and the
productivity of the workers themselves.
5. Social dialogue at the national level
Social dialogue includes all types of negotiation and consultation among representatives of the
Government, employers and workers on issues of common concerns. Social dialogue is crucial to build
and maintain mutual trust among the different economic actors, prevent social unrest and maintain
social cohesion. While there is an overall political impasse in Lebanon today, it is not impossible to open
doors through social dialogue. For this to happen, social partners have a vital role to play in reaching out
to workers and owners of enterprises, particularly among SMEs and the informal economy.
The Government of Lebanon has been unable to play an effective role in the face of weak institutions,
outdated laws and a political impasse, which has put a freeze on passing the necessary laws, regulations
and policies through Parliament. At the same time, workers and employers organizations are struggling
to address the needs of workers and enterprises alike. In addressing the interests and needs of workers,
various forms of dialogue, from simple exchanges of information or consultations to fully-fledged
negotiations, are badly needed as these can contribute to better, more transparent and more efficient
labour market governance. More than ever, mutual trust and cooperation are prerequisites for
achieving effective, balanced and viable policies.
6. Syrian Refugees: Livelihoods and access to work
Given the Syrian refugee crisis and the relative concentrations of Syrian refugees in areas of the country
already afflicted with high levels of unemployment and poverty, continuing humanitarian support for
Syrian refugees in the form of food and cash assistance is necessary and in fact should be intensified.
Nevertheless, if humanitarian assistance is reduced with no sign of resolution to the conflict in Syria and
a return of refugees to their homes, greater number of Syrian refugees will need to enter the labour
market.
As such and as the crisis is protracted, it is necessary to address the livelihoods and employment needs
of Syrian refugees and Lebanese host communities alike. While there are currently significant efforts by
the international community and under the Lebanese Crisis Response Plan 2015-2016 (LCRP) which
addresses Lebanese host communities, existing programmes must be scaled up substantially. Moreover,
it is advised that the Lebanese Government looks into the procedures limiting the access of Syrian
44
refugees to work. It is possible to ease this access in specific sectors according to the prevailing laws
related to migrant workers and which are not likely to significantly affect Lebanese Labour. Otherwise
the unregulated labour supply will continue to negatively affect the Lebanese labour market as a whole.
Granting work permits to Syrian refugees using limitations to restrict certain sectors of the market
would indeed allow the Lebanese government to maintain control over the labour market while
providing Syrian refugees with the ability to work under clear regulations. Such efforts should be exerted
through close cooperation between the government, employers’ and workers’ organizations in addition
to civil society actors so as to ensure fair working conditions for Syrian workers, avoid any further
depression of wages and consequently limit the impact of Syrian refugees on low-skilled Lebanese
workers.
Moreover, livelihoods and jobs are critical for social cohesion which is at risk in many parts of Lebanon.
As such efforts needs to be intensified to ensure that host communities have access to jobs and income
and at the time ensure that refugees have access to livelihoods. A local economic development
approach which addresses the needs of both communities should also encourage dialogue and social
cohesion between communities in order to ensure social peace.

45
APPENDIX
A methodological note on population and economic analysis of Lebanon
The particular method used by the World Bank to estimate population, labour force and employment
for Lebanon for the period after 2010 yields lower aggregates relative to estimates produced by UNDESA
and the ILO. In particular, the UNDESA population data, combined with the ILO KILM labour force data,
result in estimates of labour force and employment growth well above those produced by the World
Bank “MILES” report.82 The latter relies on CAS data for 2004, 2007 and 2009. The UNDESA/ILO KILM
estimates used in this report, and which are modelled on the basis of available national data, suggest
total average employment gains of about 47,000 annually during 2000–2010 or about 5 per cent
employment growth per year on average. On the other hand, the MILES report suggests employment
growth in the period 2004–2009 of about 32,350 jobs per year or about 2.9 per cent average
employment growth for this period.83
This rather large discrepancy can be explained by two factors. First, the comparison periods used by the
World Bank and those from UNDESA/ILO KILM are different, the latter covering an entire decade, the
former a five-year period within that decade. Second, and more importantly, the underlying population
estimates used by the World Bank apparently exclude non-Lebanese residents.84 This leads the World
Bank to likewise underestimate the size and growth rates of the working age population and also results
in a significantly smaller estimate of the size of the labour force. As the labour force is the sum of the
number of employed and the number of unemployed, these indicators are likewise underestimated.85
Thus, due to an unusually low estimate of population size and growth, the magnitudes of the labour
market aggregates in the MILES report are underestimated.
82
David Robalino & Haneen Sayed, Good Jobs Needed; The Role of Macro, Investment, Education, Labor and Social Protection Policies, World Bank, December 2012. 83
See World Bank, MILES report, Table 2.4, p. 15. 84
The World Bank MILES report gives an average annual population growth estimate for 2005–2010 of 0.93 per cent. See Table 2.1 on page 12. This compares to the World Bank World Development Indicators and UNDESA’s 1.71 per cent average annual population growth estimate for the same period as taken from the respective websites. Thus the underlying population growth rates used in the MILES report are apparently natural population growth – i.e. crude birth rate minus crude death rate per 1,000 of estimated population. Such an estimate excludes emigration and immigration and thus significantly underestimates the de facto population in the country. It is important to note that the World Development Indicators and UNDESA population estimates for Lebanon are identical through 2010 and those estimates are de facto ones. After 2010, the World Development Indicators population estimates diverge markedly from those of UNDESA with the former applying natural growth rates to the 2010 population base and the latter taking into account estimates of the influx of Syrian refugees. 85
Table 2.1 in the MILES report estimates labour force growth of 2.2 per cent per year on average for 2004–2010. This is compared with a 5.1 average annual labour force growth rate estimate in the UNDESA/ILO KILM database for the period 2000–2010.
46
Smaller employment estimates leads to another misleading result. In particular, the World Bank
estimates the employment elasticity of GDP growth for the period 1997–2009 at 0.2 but admits that the
estimate excludes “non-surveyed foreign labour.”86 Using the more inclusive population and labour
force estimates produces a higher employment-output elasticity. Measuring GDP in constant purchasing
power parity for the period 2000–2010, there is an estimated 50.1 per cent increase in employment and
a 76.9 per cent increase in GDP. This yields an employment-output elasticity of 0.651, significantly above
that estimated by the World Bank for roughly the same period.
For the period 1999–2003, the ILO has estimated the employment elasticity of output (GDP) for Lebanon
at 1.46. This indicates that employment rose more quickly than output in this period, evidence that
suggests negative labour productivity (employment rising faster than output). For the Middle East as a
whole, the ILO estimated an employment-output elasticity of 0.91 for the period 1999–2003.87
86
See World Bank, MILES report, p. 14 and footnote 11. 87
Steven Kapsos, The Employment Intensity of Growth: Trends and Macroeconomic Determinants, International Labour Office, Geneva, December 2005, p. 19.
47
For more information, contact: International Labour Organization Regional Office for the Arab States Aresco Center, Justinien Street, Kantari P.O.Box 11-4088 Riad El Solh 1107-2150 Beirut – Lebanon Tel: +961-1-752400 Fax: +961-1-752405 Email: [email protected] Website: www.ilo.org/arabstates Follow ILO in Arab States on Twitter: @iloarabstates