total return chart monthlyreturns -...
TRANSCRIPT

The performance data shown represent past performance. Past performance and especially short-term past performance is not a guarantee of future results. Investment returns and principal value will fluctuate, soinvestors’ shares, when sold, may be worth more or less than their original cost. Current performance may be lower or higher than the performance data cited. For performance data current to the most recent month-end,visit our website at vanguard.com/performance. Some funds assess purchase, redemption, and/or account maintenance fees. The performance data shown do not reflect deduction of these fees. If they did, performancewould be lower. Adjusted performance figures can be found in the Standardized Returns section beginning on page 21.Standardized Returns. In accordance with SEC regulations, the returns presented on pages 21 through 41 are as of the most recent calendar quarter and take into account fees that may apply to certain Vanguard funds.These fees are detailed in the table below. For some funds, fees are levied on purchases or redemptions to offset the costs of buying and selling portfolio securities. For others, fees are assessed on redemptions made within certaintime periods after a purchase to discourage short-term trading. All purchase or redemption fees are paid directly to the fund to compensate long-term shareholders for the costs of trading activity. Note that one-year performance figuresare not fee-adjusted for fees incurred on shares held less than one year. In addition, Vanguard funds apply a $20 annual account service fee, which is not reflected in the figures, to all funds with balances below $10,000 inmany types of accounts. If these fees were included, performance would be lower.
Fee CodesR1—0.25% purchase fee and 0.25% redemption fee.R2—0.75% purchase fee.R3—0.50% purchase fee.R4—0.25% purchase fee.R5—1.00% purchase fee.
Total Returns | May 31, 2018
Vanguard Total Returns | May 31, 2018
Vanguard Total Return ChartAverage Annual Total Returns*
for Periods Ended May 31, 2018
Vanguard Fund NameFund
No.Ticker
SymbolInception
Date FeesExpense
Ratio Month QuarterYear
to Date 1 Year 3 Years 5 Years 10 YearsSince
Inception**
Stock Funds All values displayed as %
500 Index Fund Investor Shares 40 VFINX 08/31/1976 — 0.14 2.39 0.15 1.96 14.23 10.83 12.82 9.01 11.05
500 Index Fund Admiral™ Shares 540 VFIAX 11/13/2000 — 0.04 2.40 0.18 2.00 14.35 10.94 12.94 9.13 6.09500 Index Fund Institutional Select Shares 1940 VFFSX 06/24/2016 — 0.01 2.41 0.19 2.02 14.38 — — — 18.18
S&P 500 ETF 968 VOO 09/07/2010 — 0.04
Return based on Net Asset Value 2.40 0.16 1.99 14.33 10.93 12.93 — 14.81
Return based on Market Price 2.39 0.15 1.98 14.35 10.93 12.92 — 14.81
Capital Opportunity Fund Investor Shares ¯¯ 111 VHCOX 08/14/1995 — 0.44 5.06 1.44 5.14 19.18 13.52 16.23 11.21 12.71
Capital Opportunity Fund Admiral™ Shares ̄ ¯ 5111 VHCAX 11/12/2001 — 0.37 5.07 1.45 5.18 19.25 13.60 16.32 11.29 11.36
Capital Value Fund 328 VCVLX 12/17/2001 — 0.27 0.92 0.61 -1.20 8.29 1.25 6.86 8.26 6.37
Communication Services Index Fund Admiral™ Shares 5488 VTCAX 03/11/2005 — 0.10 -2.80 -4.21 -8.53 -8.85 1.52 4.99 5.17 6.62
Communication Services ETF 959 VOX 09/23/2004 — 0.10
Return based on Net Asset Value -2.79 -4.23 -8.54 -8.86 1.52 4.97 5.16 6.91
Return based on Market Price -2.58 -4.10 -8.55 -8.69 1.62 4.99 5.21 6.93
Consumer Discretionary Index Fund Admiral™ Shares 5483 VCDAX 07/14/2005 — 0.10 2.22 1.80 6.25 17.06 11.83 14.32 13.91 10.32
Consumer Discretionary ETF 954 VCR 01/26/2004 — 0.10
Return based on Net Asset Value 2.22 1.80 6.25 17.05 11.83 14.32 13.91 9.95
Return based on Market Price 2.22 1.75 6.23 17.06 11.82 14.31 13.93 9.96
Consumer Staples Index Fund Admiral™ Shares 5484 VCSAX 01/30/2004 — 0.10 -1.14 -5.40 -10.87 -8.68 3.40 7.49 9.00 9.09
1

Vanguard Total Returns | May 31, 2018
Average Annual Total Returns*for Periods Ended May 31, 2018
Vanguard Fund NameFund
No.Ticker
SymbolInception
Date FeesExpense
Ratio Month QuarterYear
to Date 1 Year 3 Years 5 Years 10 YearsSince
Inception**
Consumer Staples ETF 955 VDC 01/26/2004 — 0.10
Return based on Net Asset Value -1.15 -5.41 -10.87 -8.68 3.40 7.48 9.00 9.06
Return based on Market Price -1.15 -5.41 -10.92 -8.67 3.39 7.47 9.01 9.06
Developed Markets Index Fund Investor Shares
1397 VDVIX 12/19/2013 — 0.17 -1.61 -0.56 -1.27 9.34 5.12 — — 4.95
Developed Markets Index Fund Admiral™ Shares 127 VTMGX 08/17/1999 — 0.07 -1.60 -0.54 -1.16 9.53 5.22 6.66 2.45 4.40
Developed Markets Index Fund Institutional Shares 137 VTMNX 01/04/2001 — 0.06 -1.59 -0.53 -1.15 9.52 5.25 6.68 2.49 4.65
Developed Markets Index Fund Institutional Plus Shares 1457 VDIPX 04/01/2014 — 0.05 -1.64 -0.56 -1.22 9.50 5.23 — — 4.32
Diversified Equity Fund
608 VDEQX 06/10/2005 — 0.36†† 2.85 1.65 4.29 17.03 9.92 12.62 9.14 8.59
Dividend Appreciation Index Fund Investor Shares
602 VDAIX 04/27/2006 — 0.15 1.75 -0.59 0.31 11.65 10.14 10.78 8.67 8.14
Dividend Appreciation Index Fund Admiral™ Shares 5702 VDADX 12/19/2013 — 0.08 1.73 -0.57 0.33 11.75 10.23 — — 9.73
Dividend Appreciation ETF 920 VIG 04/21/2006 — 0.08
Return based on Net Asset Value 1.77 -0.56 0.33 11.74 10.23 10.88 8.78 8.26
Return based on Market Price 1.73 -0.59 0.29 11.72 10.22 10.86 8.80 8.26
Dividend Growth Fund ¯ 57 VDIGX 05/15/1992 — 0.26 1.25 1.11 1.50 11.03 9.55 11.16 9.23 8.47
Emerging Markets Stock Index Fund Investor Shares
533 VEIEX 05/04/1994 — 0.32 -2.86 -5.99 -2.92 11.95 4.13 3.77 0.98 6.64
Emerging Markets Stock Index Fund Admiral™ Shares 5533 VEMAX 06/23/2006 — 0.14 -2.83 -5.98 -2.85 12.12 4.31 3.95 1.14 5.96
Emerging Markets Stock Index Fund Institutional Shares 239 VEMIX 06/22/2000 — 0.11 -2.83 -5.98 -2.84 12.16 4.34 3.98 1.18 7.83
Emerging Markets Index Fund Institutional Plus Shares 1865 VEMRX 12/15/2010 — 0.09 -2.83 -5.95 -2.83 12.20 4.36 4.01 — 1.98
FTSE Emerging Markets ETF 964 VWO 03/04/2005 — 0.14
Return based on Net Asset Value -2.84 -5.96 -2.85 12.13 4.32 3.96 1.14 6.90
Return based on Market Price -2.28 -5.29 -2.63 12.27 4.51 4.24 1.14 6.92
Emerging Markets Select Stock Fund
752 VMMSX 06/27/2011 — 0.92 -3.27 -6.17 -2.50 11.74 6.13 4.10 — 2.84
Energy Fund Investor Shares
51 VGENX 05/23/1984 — 0.38 0.49 11.63 6.32 19.94 4.03 1.63 -0.82 10.77
Energy Fund Admiral™ Shares 551 VGELX 11/12/2001 — 0.30 0.50 11.65 6.35 20.02 4.11 1.70 -0.75 9.80
Energy Index Fund Admiral™ Shares 5480 VENAX 10/07/2004 — 0.10 3.56 15.83 6.76 20.80 1.25 0.83 0.35 7.16
Energy ETF 951 VDE 09/23/2004 — 0.10
Return based on Net Asset Value 3.54 15.83 6.76 20.78 1.25 0.82 0.34 7.59
Return based on Market Price 3.51 15.80 6.68 20.75 1.22 0.81 0.37 7.59
Equity Income Fund Investor Shares
65 VEIPX 03/21/1988 — 0.26 1.30 -0.30 -1.29 10.53 9.58 11.06 9.10 10.23
Equity Income Fund Admiral™ Shares 565 VEIRX 08/13/2001 — 0.17 1.32 -0.28 -1.25 10.62 9.68 11.16 9.21 7.98
European Stock Index Fund Investor Shares
79 VEURX 06/18/1990 — 0.26 -2.66 -0.87 -1.80 5.76 3.74 5.77 1.77 7.24
European Stock Index Fund Admiral™ Shares 579 VEUSX 08/13/2001 — 0.10 -2.66 -0.83 -1.75 5.91 3.90 5.93 1.91 5.86
European Stock Index Fund Institutional Shares 235 VESIX 05/15/2000 — 0.08 -2.65 -0.82 -1.74 5.94 3.93 5.96 1.94 4.17
European Stock Index Fund Institutional Plus Shares 1863 VEUPX 12/05/2014 — 0.07 -2.67 -0.82 -1.75 5.99 3.95 — — 4.49
FTSE Europe ETF 963 VGK 03/04/2005 — 0.10
Return based on Net Asset Value -2.66 -0.82 -1.76 5.91 3.92 5.95 1.92 4.81
Return based on Market Price -2.42 -0.74 -1.51 6.06 3.94 5.96 1.93 4.81
Explorer™ Fund Investor Shares
24 VEXPX 12/11/1967 — 0.44 5.94 7.63 10.63 25.70 11.24 13.05 10.16 9.48
Explorer™ Fund Admiral™ Shares 5024 VEXRX 11/12/2001 — 0.32 5.95 7.67 10.69 25.86 11.38 13.21 10.33 9.64
2
Vanguard Total Returns | May 31, 2018
Average Annual Total Returns*for Periods Ended May 31, 2018
Vanguard Fund NameFund
No.Ticker
SymbolInception
Date FeesExpense
Ratio Month QuarterYear
to Date 1 Year 3 Years 5 Years 10 YearsSince
Inception**
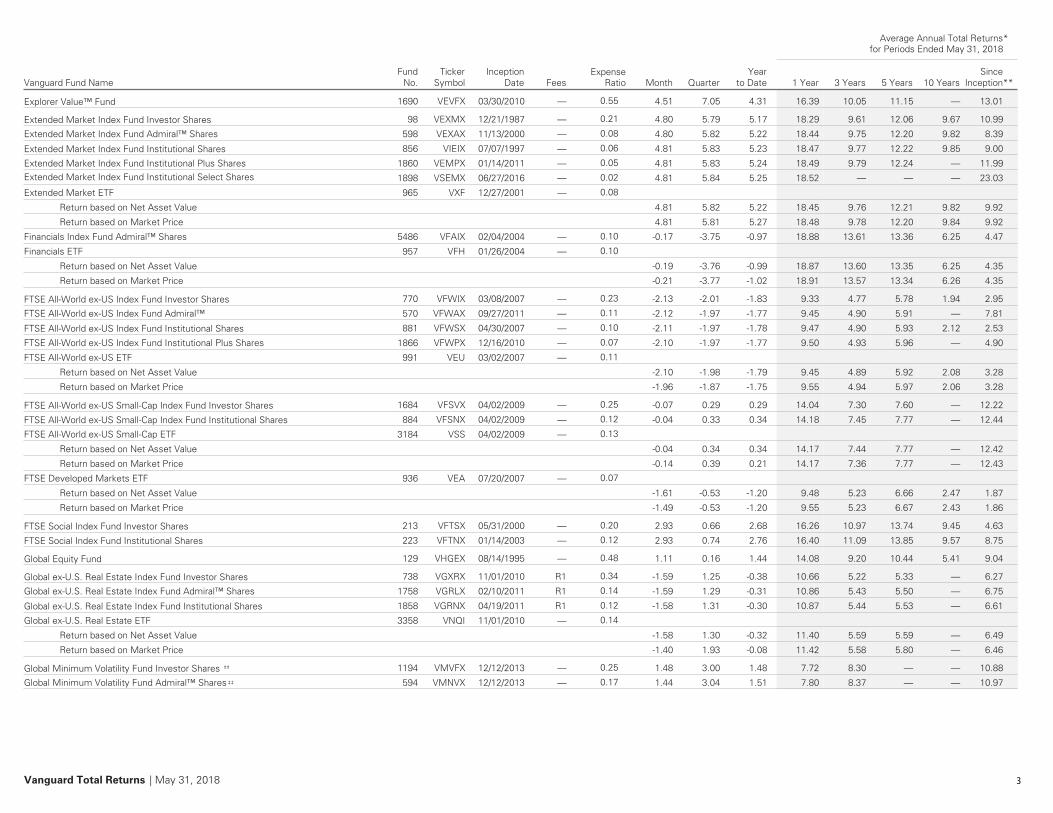
Explorer Value™ Fund
1690 VEVFX 03/30/2010 — 0.55 4.51 7.05 4.31 16.39 10.05 11.15 — 13.01
Extended Market Index Fund Investor Shares
98 VEXMX 12/21/1987 — 0.21 4.80 5.79 5.17 18.29 9.61 12.06 9.67 10.99
Extended Market Index Fund Admiral™ Shares 598 VEXAX 11/13/2000 — 0.08 4.80 5.82 5.22 18.44 9.75 12.20 9.82 8.39
Extended Market Index Fund Institutional Shares 856 VIEIX 07/07/1997 — 0.06 4.81 5.83 5.23 18.47 9.77 12.22 9.85 9.00
Extended Market Index Fund Institutional Plus Shares 1860 VEMPX 01/14/2011 — 0.05 4.81 5.83 5.24 18.49 9.79 12.24 — 11.99Extended Market Index Fund Institutional Select Shares 1898 VSEMX 06/27/2016 — 0.02 4.81 5.84 5.25 18.52 — — — 23.03
Extended Market ETF 965 VXF 12/27/2001 — 0.08
Return based on Net Asset Value 4.81 5.82 5.22 18.45 9.76 12.21 9.82 9.92
Return based on Market Price 4.81 5.81 5.27 18.48 9.78 12.20 9.84 9.92
Financials Index Fund Admiral™ Shares 5486 VFAIX 02/04/2004 — 0.10 -0.17 -3.75 -0.97 18.88 13.61 13.36 6.25 4.47
Financials ETF 957 VFH 01/26/2004 — 0.10
Return based on Net Asset Value -0.19 -3.76 -0.99 18.87 13.60 13.35 6.25 4.35
Return based on Market Price -0.21 -3.77 -1.02 18.91 13.57 13.34 6.26 4.35
FTSE All-World ex-US Index Fund Investor Shares
770 VFWIX 03/08/2007 — 0.23 -2.13 -2.01 -1.83 9.33 4.77 5.78 1.94 2.95
FTSE All-World ex-US Index Fund Admiral™ 570 VFWAX 09/27/2011 — 0.11 -2.12 -1.97 -1.77 9.45 4.90 5.91 — 7.81
FTSE All-World ex-US Index Fund Institutional Shares 881 VFWSX 04/30/2007 — 0.10 -2.11 -1.97 -1.78 9.47 4.90 5.93 2.12 2.53
FTSE All-World ex-US Index Fund Institutional Plus Shares 1866 VFWPX 12/16/2010 — 0.07 -2.10 -1.97 -1.77 9.50 4.93 5.96 — 4.90
FTSE All-World ex-US ETF 991 VEU 03/02/2007 — 0.11
Return based on Net Asset Value -2.10 -1.98 -1.79 9.45 4.89 5.92 2.08 3.28
Return based on Market Price -1.96 -1.87 -1.75 9.55 4.94 5.97 2.06 3.28
FTSE All-World ex-US Small-Cap Index Fund Investor Shares
1684 VFSVX 04/02/2009 — 0.25 -0.07 0.29 0.29 14.04 7.30 7.60 — 12.22
FTSE All-World ex-US Small-Cap Index Fund Institutional Shares 884 VFSNX 04/02/2009 — 0.12 -0.04 0.33 0.34 14.18 7.45 7.77 — 12.44
FTSE All-World ex-US Small-Cap ETF 3184 VSS 04/02/2009 — 0.13
Return based on Net Asset Value -0.04 0.34 0.34 14.17 7.44 7.77 — 12.42
Return based on Market Price -0.14 0.39 0.21 14.17 7.36 7.77 — 12.43
FTSE Developed Markets ETF 936 VEA 07/20/2007 — 0.07
Return based on Net Asset Value -1.61 -0.53 -1.20 9.48 5.23 6.66 2.47 1.87
Return based on Market Price -1.49 -0.53 -1.20 9.55 5.23 6.67 2.43 1.86
FTSE Social Index Fund Investor Shares
213 VFTSX 05/31/2000 — 0.20 2.93 0.66 2.68 16.26 10.97 13.74 9.45 4.63
FTSE Social Index Fund Institutional Shares 223 VFTNX 01/14/2003 — 0.12 2.93 0.74 2.76 16.40 11.09 13.85 9.57 8.75
Global Equity Fund
129 VHGEX 08/14/1995 — 0.48 1.11 0.16 1.44 14.08 9.20 10.44 5.41 9.04
Global ex-U.S. Real Estate Index Fund Investor Shares
738 VGXRX 11/01/2010 R1 0.34 -1.59 1.25 -0.38 10.66 5.22 5.33 — 6.27
Global ex-U.S. Real Estate Index Fund Admiral™ Shares 1758 VGRLX 02/10/2011 R1 0.14 -1.59 1.29 -0.31 10.86 5.43 5.50 — 6.75
Global ex-U.S. Real Estate Index Fund Institutional Shares 1858 VGRNX 04/19/2011 R1 0.12 -1.58 1.31 -0.30 10.87 5.44 5.53 — 6.61
Global ex-U.S. Real Estate ETF 3358 VNQI 11/01/2010 — 0.14
Return based on Net Asset Value -1.58 1.30 -0.32 11.40 5.59 5.59 — 6.49
Return based on Market Price -1.40 1.93 -0.08 11.42 5.58 5.80 — 6.46
Global Minimum Volatility Fund Investor Shares ‡‡ 1194 VMVFX 12/12/2013 — 0.25 1.48 3.00 1.48 7.72 8.30 — — 10.88
Global Minimum Volatility Fund Admiral™ Shares ‡‡ 594 VMNVX 12/12/2013 — 0.17 1.44 3.04 1.51 7.80 8.37 — — 10.97
3

Vanguard Total Returns | May 31, 2018
Average Annual Total Returns*for Periods Ended May 31, 2018
Vanguard Fund NameFund
No.Ticker
SymbolInception
Date FeesExpense
Ratio Month QuarterYear
to Date 1 Year 3 Years 5 Years 10 YearsSince
Inception**
Growth and Income Fund Investor Shares
93 VQNPX 12/10/1986 — 0.34 2.78 0.75 2.50 15.26 10.90 13.07 8.63 10.22
Growth and Income Fund Admiral™ Shares 593 VGIAX 05/14/2001 — 0.23 2.80 0.79 2.54 15.41 11.03 13.20 8.76 6.59
Growth Index Fund Investor Shares
9 VIGRX 11/02/1992 — 0.17 4.36 2.02 5.84 17.24 12.12 14.46 10.12 9.72
Growth Index Fund Admiral™ Shares 509 VIGAX 11/13/2000 — 0.05 4.36 2.03 5.88 17.38 12.25 14.61 10.27 6.10
Growth Index Fund Institutional Shares 868 VIGIX 05/14/1998 — 0.04 4.36 2.04 5.89 17.38 12.26 14.62 10.29 6.78
Growth ETF 967 VUG 01/26/2004 — 0.05
Return based on Net Asset Value 4.35 2.05 5.89 17.39 12.26 14.62 10.27 9.10
Return based on Market Price 4.36 2.02 5.92 17.42 12.26 14.61 10.29 9.10
Health Care Fund Investor Shares
52 VGHCX 05/23/1984 — 0.38 2.18 -0.26 -0.01 4.84 2.39 13.53 12.36 16.25
Health Care Fund Admiral™ Shares 552 VGHAX 11/12/2001 — 0.33 2.18 -0.26 0.01 4.90 2.44 13.59 12.42 10.44
Health Care Index Fund Admiral™ Shares 5485 VHCIX 02/05/2004 — 0.10 1.55 -0.04 2.28 13.11 5.50 14.05 12.72 9.69
Health Care ETF 956 VHT 01/26/2004 — 0.10
Return based on Net Asset Value 1.56 -0.04 2.30 13.12 5.51 14.04 12.72 9.69
Return based on Market Price 1.51 -0.06 2.28 13.14 5.49 14.02 12.72 9.69
High Dividend Yield Index Fund Investor Shares
623 VHDYX 11/16/2006 — 0.15 1.59 -0.52 -1.22 10.89 9.67 11.33 8.95 7.60
High Dividend Yield ETF 923 VYM 11/10/2006 — 0.08
Return based on Net Asset Value 1.60 -0.49 -1.19 10.96 9.74 11.41 9.05 7.78
Return based on Market Price 1.58 -0.51 -1.23 10.98 9.72 11.40 9.07 7.78
Industrials Index Fund Admiral™ Shares 5482 VINAX 05/08/2006 — 0.10 3.32 -1.48 -1.34 12.03 11.55 13.00 8.71 8.18
Industrials ETF 953 VIS 09/23/2004 — 0.10
Return based on Net Asset Value 3.32 -1.48 -1.35 12.02 11.55 12.99 8.71 9.74
Return based on Market Price 3.33 -1.49 -1.39 12.04 11.54 12.98 8.72 9.74
Information Technology Index Fund Admiral™ Shares 5487 VITAX 03/25/2004 — 0.10 7.04 3.38 11.32 27.53 19.90 20.59 13.32 11.22
Information Technology ETF 958 VGT 01/26/2004 — 0.10
Return based on Net Asset Value 7.05 3.38 11.33 27.53 19.90 20.58 13.32 10.27
Return based on Market Price 7.04 3.35 11.38 27.59 19.89 20.58 13.33 10.27
Institutional Index Fund Institutional Shares 94 VINIX 07/31/1990 — 0.035 2.41 0.18 2.01 14.35 10.95 12.95 9.14 9.85
Institutional Index Fund Institutional Plus Shares 854 VIIIX 07/07/1997 — 0.02 2.41 0.18 2.01 14.37 10.97 12.97 9.16 7.39
Institutional Total Stock Market Index Fund Institutional Shares 870 VITNX 08/31/2001 — 0.035 2.82 1.18 2.59 15.12 10.73 12.86 9.37 8.14
Institutional Total Stock Market Index Fund Institutional Plus Shares 871 VITPX 05/31/2001 — 0.02 2.82 1.17 2.60 15.12 10.75 12.89 9.39 7.44
International Dividend Appreciation Index Fund Investor Shares
2015 VIAIX 02/25/2016 R1 0.35 0.65 2.23 -0.43 7.44 — — — 14.12
International Dividend Appreciation Index Fund Admiral™ Shares 515 VIAAX 03/02/2016 R1 0.25 0.66 2.30 -0.34 7.58 — — — 12.91
International Dividend Appreciation ETF 4415 VIGI 02/25/2016 — 0.25
Return based on Net Asset Value 0.66 2.27 -0.37 8.09 — — — 14.49
Return based on Market Price 0.87 2.35 -0.28 8.32 — — — 14.68
International Explorer™ Fund
126 VINEX 11/04/1996 — 0.38 -0.84 -0.88 0.00 14.51 9.76 11.24 5.95 9.96
International Growth Fund Investor Shares
81 VWIGX 09/30/1981 — 0.45 1.10 -0.29 4.26 20.74 11.11 10.58 5.20 10.80
International Growth Fund Admiral™ Shares 581 VWILX 08/13/2001 — 0.32 1.13 -0.24 4.32 20.92 11.25 10.73 5.35 7.93
International High Dividend Yield Index Fund Investor Shares
1530 VIHIX 02/25/2016 R1 0.42 -3.65 -3.65 -3.54 4.86 — — — 14.46
International High Dividend Yield Index Fund Admiral™ Shares 530 VIHAX 03/02/2016 R1 0.32 -3.63 -3.60 -3.48 5.00 — — — 13.05
4

Vanguard Total Returns | May 31, 2018
Average Annual Total Returns*for Periods Ended May 31, 2018
Vanguard Fund NameFund
No.Ticker
SymbolInception
Date FeesExpense
Ratio Month QuarterYear
to Date 1 Year 3 Years 5 Years 10 YearsSince
Inception**
International High Dividend Yield ETF 4430 VYMI 02/25/2016 — 0.32
Return based on Net Asset Value -3.63 -3.60 -3.50 5.47 — — — 14.83
Return based on Market Price -3.40 -3.46 -3.46 5.64 — — — 15.06
International Value Fund
46 VTRIX 05/16/1983 — 0.40 -2.41 -3.09 -2.43 8.90 4.00 5.66 1.88 8.89
Large-Cap Index Fund Investor Shares
307 VLACX 01/30/2004 — 0.17 2.36 0.15 1.99 14.27 10.63 12.74 9.01 8.59
Large-Cap Index Fund Admiral™ Shares 5307 VLCAX 02/02/2004 — 0.05 2.38 0.19 2.06 14.41 10.76 12.88 9.16 8.70
Large-Cap Index Fund Institutional Shares 807 VLISX 06/30/2005 — 0.04 2.37 0.19 2.06 14.43 10.77 12.89 9.18 9.00
Large-Cap ETF 961 VV 01/27/2004 — 0.05
Return based on Net Asset Value 2.37 0.19 2.06 14.43 10.77 12.89 9.16 8.64
Return based on Market Price 2.40 0.23 2.08 14.48 10.78 12.89 9.18 8.64
Market Neutral Fund Investor Shares ‡ 634 VMNFX 11/11/1998 — 1.54 2.05 0.65 2.38 2.06 1.83 2.70 0.40 2.73
Market Neutral Fund Institutional Shares ‡ 734 VMNIX 10/19/1998 — 1.46 2.06 0.68 2.41 2.07 1.93 2.81 0.49 2.93
Materials Index Fund Admiral™ Shares 5481 VMIAX 02/11/2004 — 0.10 2.40 -0.92 -2.67 12.72 8.10 10.06 5.56 8.90
Materials ETF 952 VAW 01/26/2004 — 0.10
Return based on Net Asset Value 2.39 -0.92 -2.66 12.73 8.11 10.06 5.56 9.17
Return based on Market Price 2.36 -0.94 -2.71 12.75 8.10 10.06 5.57 9.17
Mega Cap Index Fund Institutional Shares 828 VMCTX 02/22/2008 — 0.06 2.49 -0.07 2.13 14.93 11.30 13.11 9.17 9.33
Mega Cap ETF 3137 MGC 12/17/2007 — 0.07
Return based on Net Asset Value 2.50 -0.07 2.14 14.93 11.29 13.08 9.14 8.48
Return based on Market Price 2.49 -0.09 2.11 14.95 11.28 13.06 9.16 8.48
Mega Cap Growth Index Fund Institutional Shares 838 VMGAX 04/03/2008 — 0.06 4.62 1.73 6.26 18.34 13.25 15.27 10.68 11.13
Mega Cap Growth ETF 3138 MGK 12/17/2007 — 0.07
Return based on Net Asset Value 4.62 1.74 6.27 18.34 13.24 15.26 10.66 10.24
Return based on Market Price 4.63 1.73 6.25 18.37 13.25 15.26 10.68 10.25
Mega Cap Value Index Fund Institutional Shares 839 VMVLX 03/05/2008 — 0.06 0.68 -1.65 -1.37 12.03 9.59 11.31 7.81 7.89
Mega Cap Value ETF 3139 MGV 12/17/2007 — 0.07
Return based on Net Asset Value 0.67 -1.64 -1.36 12.04 9.58 11.29 7.78 6.84
Return based on Market Price 0.65 -1.63 -1.44 12.04 9.54 11.28 7.80 6.84
Mid-Cap Growth Fund
301 VMGRX 12/31/1997 — 0.36 4.17 4.78 8.71 20.43 7.44 11.45 9.31 10.36
Mid-Cap Growth Index Fund Investor Shares
832 VMGIX 08/24/2006 — 0.19 3.70 2.98 4.52 14.27 8.12 11.76 8.17 9.10
Mid-Cap Growth Index Fund Admiral™ 5832 VMGMX 09/27/2011 — 0.07 3.72 3.02 4.59 14.42 8.25 11.90 — 14.12
Mid-Cap Growth ETF 932 VOT 08/17/2006 — 0.07
Return based on Net Asset Value 3.71 3.01 4.59 14.42 8.24 11.90 8.31 9.10
Return based on Market Price 3.70 2.99 4.59 14.42 8.23 11.90 8.29 9.10
Mid-Cap Index Fund Investor Shares
859 VIMSX 05/21/1998 — 0.17 1.76 1.48 1.58 11.65 8.09 11.69 8.98 9.84
Mid-Cap Index Fund Admiral™ Shares 5859 VIMAX 11/12/2001 — 0.05 1.78 1.51 1.64 11.80 8.22 11.83 9.13 10.09
Mid-Cap Index Fund Institutional Shares 864 VMCIX 05/21/1998 — 0.04 1.78 1.51 1.63 11.80 8.23 11.84 9.15 10.01
Mid-Cap Index Fund Institutional Plus Shares 1859 VMCPX 12/15/2010 — 0.03 1.79 1.52 1.65 11.82 8.24 11.86 — 12.34
5

Vanguard Total Returns | May 31, 2018
Average Annual Total Returns*for Periods Ended May 31, 2018
Vanguard Fund NameFund
No.Ticker
SymbolInception
Date FeesExpense
Ratio Month QuarterYear
to Date 1 Year 3 Years 5 Years 10 YearsSince
Inception**
Mid-Cap ETF 939 VO 01/26/2004 — 0.05
Return based on Net Asset Value 1.79 1.53 1.65 11.81 8.22 11.83 9.13 9.72
Return based on Market Price 1.78 1.50 1.64 11.80 8.22 11.82 9.11 9.72
Mid-Cap Value Index Fund Investor Shares
835 VMVIX 08/24/2006 — 0.19 0.05 0.15 -0.99 9.30 8.02 11.58 9.59 8.77
Mid-Cap Value Index Fund Admiral™ 5835 VMVAX 09/27/2011 — 0.07 0.05 0.16 -0.93 9.43 8.15 11.72 — 15.47
Mid-Cap Value ETF 935 VOE 08/17/2006 — 0.07
Return based on Net Asset Value 0.05 0.18 -0.92 9.44 8.16 11.72 9.74 8.85
Return based on Market Price 0.05 0.16 -0.94 9.47 8.16 11.72 9.73 8.85
Morgan™ Growth Fund Investor Shares
26 VMRGX 12/31/1968 — 0.38 4.42 2.33 8.13 22.13 13.09 15.17 9.63 10.56
Morgan™ Growth Fund Admiral™ Shares 526 VMRAX 05/14/2001 — 0.28 4.40 2.34 8.19 22.22 13.21 15.31 9.78 7.62
Pacific Stock Index Fund Investor Shares
72 VPACX 06/18/1990 — 0.26 -1.00 -1.17 -0.24 14.25 7.32 7.69 3.44 2.92
Pacific Stock Index Fund Admiral™ Shares 572 VPADX 08/13/2001 — 0.10 -1.04 -1.14 -0.17 14.44 7.47 7.83 3.58 6.00
Pacific Stock Index Fund Institutional Shares 237 VPKIX 05/15/2000 — 0.08 -1.01 -1.13 -0.12 14.47 7.50 7.86 3.62 3.54
Pacific Stock Index Fund Institutional Plus Shares 1864 VPAPX 12/13/2010 — 0.07 — — — — — — — —
FTSE Pacific ETF 962 VPL 03/04/2005 — 0.10
Return based on Net Asset Value -1.04 -1.14 -0.16 14.45 7.48 7.84 3.58 5.45
Return based on Market Price -1.05 -1.04 -0.40 14.15 7.47 7.83 3.54 5.44
Precious Metals and Mining Fund
53 VGPMX 05/23/1984 — 0.36 -0.71 2.26 -7.69 -2.87 2.11 -3.12 -9.19 4.20
PRIMECAP Core Fund ¯¯ 1220 VPCCX 12/09/2004 — 0.46 3.01 -1.05 1.75 14.63 12.39 14.81 11.13 10.86
PRIMECAP Fund Investor Shares ¯¯ 59 VPMCX 11/01/1984 — 0.39 4.37 1.36 5.56 20.88 14.42 16.56 11.34 13.86
PRIMECAP Fund Admiral™ Shares ̄ ¯ 559 VPMAX 11/12/2001 — 0.32 4.38 1.37 5.59 20.96 14.50 16.65 11.43 10.81
Real Estate Index Fund Investor Shares
123 VGSIX 05/13/1996 — 0.26 3.60 8.47 -4.05 0.14 4.29 6.47 6.21 9.95
Real Estate Index Fund Admiral™ Shares 5123 VGSLX 11/12/2001 — 0.12 3.61 8.50 -3.97 0.30 4.44 6.62 6.36 10.16
Real Estate Index Fund Institutional Shares 3123 VGSNX 12/02/2003 — 0.10 3.59 8.51 -3.96 0.31 4.46 6.64 6.38 8.82
Real Estate ETF 986 VNQ 09/23/2004 — 0.12
Return based on Net Asset Value 3.63 8.48 -3.98 0.31 4.43 6.62 6.35 8.28
Return based on Market Price 3.64 8.53 -3.99 0.35 4.43 6.61 6.37 8.28
Russell 1000 Growth Index Fund Institutional Shares 1850 VRGWX 12/06/2010 — 0.08 4.37 1.85 6.18 20.93 13.85 15.61 — 14.91
Russell 1000 Growth ETF 3350 VONG 09/20/2010 — 0.12
Return based on Net Asset Value 4.37 1.85 6.18 20.89 13.80 15.56 — 15.92
Return based on Market Price 4.38 1.81 6.15 20.91 13.79 15.54 — 15.93
Russell 1000 Index Fund Institutional Shares 1848 VRNIX 10/15/2010 — 0.08 2.54 0.55 2.16 14.51 10.57 12.80 — 13.81
Russell 1000 ETF 3348 VONE 09/20/2010 — 0.12
Return based on Net Asset Value 2.54 0.55 2.15 14.47 10.52 12.75 — 14.10
Return based on Market Price 2.53 0.51 2.16 14.49 10.52 12.75 — 14.10
Russell 1000 Value Index Fund Institutional Shares 1849 VRVIX 12/10/2010 — 0.08 0.59 -0.87 -1.97 8.17 7.33 9.99 — 11.54
Russell 1000 Value ETF 3349 VONV 09/20/2010 — 0.12
Return based on Net Asset Value 0.59 -0.87 -1.97 8.14 7.29 9.94 — 12.20
Return based on Market Price 0.56 -0.90 -2.04 8.13 7.27 9.94 — 12.20
Russell 2000 Growth Index Fund Institutional Shares 1853 VRTGX 05/25/2011 — 0.08 6.31 7.86 8.89 25.17 10.96 13.49 — 12.65
6

Vanguard Total Returns | May 31, 2018
Average Annual Total Returns*for Periods Ended May 31, 2018
Vanguard Fund NameFund
No.Ticker
SymbolInception
Date FeesExpense
Ratio Month QuarterYear
to Date 1 Year 3 Years 5 Years 10 YearsSince
Inception**
Russell 2000 Growth ETF 3353 VTWG 09/20/2010 — 0.20
Return based on Net Asset Value 6.30 7.83 8.83 25.01 10.83 13.35 — 14.91
Return based on Market Price 6.30 7.92 8.89 25.09 10.85 13.34 — 14.92
Russell 2000 Index Fund Institutional Shares 1851 VRTIX 12/22/2010 — 0.08 6.09 8.41 6.95 20.89 11.09 12.29 — 11.84
Russell 2000 ETF 3351 VTWO 09/20/2010 — 0.15
Return based on Net Asset Value 6.08 8.39 6.92 20.80 11.01 12.21 — 13.82
Return based on Market Price 6.05 8.46 6.92 20.93 11.05 12.24 — 13.82
Russell 2000 Value Index Fund Institutional Shares 1852 VRTVX 07/13/2012 — 0.08 5.82 8.99 4.84 16.41 11.07 10.96 — 13.39
Russell 2000 Value ETF 3352 VTWV 09/20/2010 — 0.20
Return based on Net Asset Value 5.81 8.96 4.79 16.27 10.93 10.83 — 12.48
Return based on Market Price 5.88 9.02 4.83 16.45 11.00 10.84 — 12.50
Russell 3000 Index Fund Institutional Shares 1854 VRTTX 11/01/2010 — 0.08 2.82 1.13 2.53 14.98 10.62 12.76 — 13.75
Russell 3000 ETF 3354 VTHR 09/20/2010 — 0.15
Return based on Net Asset Value 2.81 1.12 2.51 14.91 10.54 12.68 — 14.05
Return based on Market Price 2.84 1.13 2.48 14.97 10.51 12.67 — 14.06
S&P 500 Growth Index Fund Institutional Shares 1841 VSPGX 09/09/2010 — 0.08 0.00 — — — — — — —
S&P 500 Growth ETF 3341 VOOG 09/07/2010 — 0.15
Return based on Net Asset Value 4.32 1.45 6.56 19.24 13.34 15.27 — 16.47
Return based on Market Price 4.30 1.41 6.54 19.24 13.30 15.25 — 16.47
S&P 500 Value Index Fund Institutional Shares 1840 VSPVX 03/03/2015 — 0.08 0.26 -1.31 -2.85 8.88 7.81 — — 7.43
S&P 500 Value ETF 3340 VOOV 09/07/2010 — 0.15
Return based on Net Asset Value 0.25 -1.34 -2.89 8.78 7.72 9.95 — 12.64
Return based on Market Price 0.24 -1.36 -2.99 8.80 7.72 9.93 — 12.64
S&P Mid-Cap 400 Growth Index Fund Institutional Shares 1843 VMFGX 03/28/2011 — 0.08 4.02 3.90 4.24 16.46 10.77 12.42 — 12.04
S&P Mid-Cap 400 Growth ETF 3343 IVOG 09/07/2010 — 0.20
Return based on Net Asset Value 4.01 3.87 4.19 16.33 10.64 12.28 — 14.96
Return based on Market Price 4.00 3.93 4.20 16.40 10.66 12.28 — 14.97
S&P Mid-Cap 400 Index Fund Institutional Shares 1842 VSPMX 03/28/2011 — 0.08 4.12 4.80 3.03 14.79 10.18 12.11 — 11.89
S&P Mid-Cap 400 ETF 3342 IVOO 09/07/2010 — 0.15
Return based on Net Asset Value 4.11 4.78 2.99 14.70 10.10 12.03 — 14.61
Return based on Market Price 4.14 4.79 2.98 14.78 10.11 12.02 — 14.61
S&P Mid-Cap 400 Value Index Fund Institutional Shares 1844 VMFVX 11/02/2010 — 0.08 4.23 5.77 1.74 13.04 9.23 11.52 — 13.00
S&P Mid-Cap 400 Value ETF 3344 IVOV 09/07/2010 — 0.20
Return based on Net Asset Value 4.22 5.75 1.69 12.90 9.10 11.38 — 13.98
Return based on Market Price 4.22 5.75 1.66 13.05 9.11 11.37 — 13.98
S&P Small-Cap 600 Growth Index Fund Institutional Shares 1847 VSGNX 09/09/2010 — 0.08 0.00 — — — — — — —
S&P Small-Cap 600 Growth ETF 3347 VIOG 09/07/2010 — 0.20
Return based on Net Asset Value 7.07 10.21 10.02 24.20 14.25 14.94 — 17.29
Return based on Market Price 7.04 10.26 10.09 24.30 14.30 14.95 — 17.30
S&P Small-Cap 600 Index Fund Institutional Shares 1845 VSMSX 04/01/2011 — 0.08 6.46 9.73 8.15 22.73 13.82 14.29 — 13.40
7

Vanguard Total Returns | May 31, 2018
Average Annual Total Returns*for Periods Ended May 31, 2018
Vanguard Fund NameFund
No.Ticker
SymbolInception
Date FeesExpense
Ratio Month QuarterYear
to Date 1 Year 3 Years 5 Years 10 YearsSince
Inception**
S&P Small-Cap 600 ETF 3345 VIOO 09/07/2010 — 0.15
Return based on Net Asset Value 6.45 9.71 8.11 22.66 13.75 14.21 — 16.60
Return based on Market Price 6.43 9.74 8.13 22.79 13.78 14.21 — 16.60
S&P Small-Cap 600 Value Index Fund Institutional Shares 1846 VSMVX 11/19/2014 — 0.08 5.87 9.22 6.21 21.01 13.10 — — 12.35
S&P Small-Cap 600 Value ETF 3346 VIOV 09/07/2010 — 0.20
Return based on Net Asset Value 5.86 9.18 6.15 20.85 12.95 13.21 — 15.74
Return based on Market Price 5.85 9.25 6.24 21.02 12.99 13.22 — 15.76
Selected Value Fund
934 VASVX 02/15/1996 — 0.39 0.17 -2.30 -5.02 7.43 6.77 10.29 9.49 8.99
Small-Cap Growth Index Fund Investor Shares
861 VISGX 05/21/1998 — 0.19 5.80 7.64 8.23 22.28 9.94 11.79 10.11 9.01
Small-Cap Growth Index Fund Admiral™ 5861 VSGAX 09/27/2011 — 0.07 5.81 7.69 8.30 22.43 10.07 11.93 — 15.41
Small-Cap Growth Index Fund Institutional Shares 866 VSGIX 05/24/2000 — 0.06 5.81 7.68 8.30 22.46 10.08 11.94 10.28 9.62
Small-Cap Growth ETF 938 VBK 01/26/2004 — 0.07
Return based on Net Asset Value 5.80 7.69 8.31 22.44 10.07 11.93 10.26 9.71
Return based on Market Price 5.78 7.68 8.30 22.50 10.09 11.92 10.29 9.71
Small-Cap Index Fund Investor Shares
48 NAESX 10/03/1960 — 0.17 5.07 6.59 5.16 18.10 9.74 11.87 10.01 10.76
Small-Cap Index Fund Admiral™ Shares 548 VSMAX 11/13/2000 — 0.05 5.08 6.64 5.22 18.23 9.87 12.01 10.16 9.50
Small-Cap Index Fund Institutional Shares 857 VSCIX 07/07/1997 — 0.04 5.10 6.64 5.22 18.26 9.88 12.03 10.18 9.24
Small-Cap Index Fund Institutional Plus Shares 1861 VSCPX 12/17/2010 — 0.03 5.09 6.64 5.23 18.27 9.89 12.04 — 12.48
Small-Cap ETF 969 VB 01/26/2004 — 0.05
Return based on Net Asset Value 5.09 6.64 5.23 18.25 9.87 12.02 10.16 9.64
Return based on Market Price 5.08 6.67 5.24 18.27 9.90 12.02 10.20 9.64
Small-Cap Value Index Fund
860 VISVX 05/21/1998 — 0.19 4.50 5.73 2.67 14.71 9.54 11.92 9.73 8.90
Small-Cap Value Index Fund Admiral™ 5860 VSIAX 09/27/2011 — 0.07 4.50 5.76 2.73 14.84 9.68 12.06 — 16.03
Small-Cap Value Index Fund Institutional Shares 865 VSIIX 12/07/1999 — 0.06 4.49 5.75 2.73 14.83 9.68 12.06 9.90 10.61
Small-Cap Value ETF 937 VBR 01/26/2004 — 0.07
Return based on Net Asset Value 4.50 5.76 2.74 14.84 9.68 12.06 9.88 9.36
Return based on Market Price 4.50 5.79 2.72 14.95 9.69 12.06 9.92 9.37
Strategic Equity Fund
114 VSEQX 08/14/1995 — 0.18 4.34 3.91 4.15 15.58 9.15 13.28 9.59 10.94
Strategic Small-Cap Equity Fund
615 VSTCX 04/24/2006 — 0.29 6.38 7.43 6.68 17.91 9.78 12.81 9.81 8.01
Tax-Managed Capital Appreciation Fund Admiral™ Shares 5102 VTCLX 09/06/1994 — 0.09 2.31 0.48 2.17 14.84 10.98 13.17 9.28 9.86
Tax-Managed Capital Appreciation Fund Institutional Shares 135 VTCIX 02/24/1999 — 0.06 2.31 0.48 2.17 14.87 11.01 13.21 9.32 6.69
Tax-Managed Small-Cap Fund Admiral™ Shares 116 VTMSX 03/25/1999 — 0.09 6.25 9.45 7.99 22.40 13.46 14.18 11.20 11.36
Tax-Managed Small-Cap Fund Institutional Shares 118 VTSIX 04/21/1999 — 0.06 6.27 9.46 8.01 22.44 13.50 14.22 11.26 11.07
Total International Stock Index Fund Investor Shares
113 VGTSX 04/29/1996 — 0.17 -1.92 -1.73 -1.57 9.87 5.04 5.98 1.93 4.96
Total International Stock Index Fund Admiral™ Shares 569 VTIAX 11/29/2010 — 0.11 -1.90 -1.74 -1.58 9.95 5.11 6.05 — 5.57
Total International Stock Index Fund Institutional Shares 1869 VTSNX 11/29/2010 — 0.09 -1.92 -1.75 -1.58 9.94 5.13 6.07 — 5.60
Total International Stock Index Fund Institutional Plus Shares 1870 VTPSX 11/30/2010 — 0.07 -1.92 -1.75 -1.56 9.97 5.16 6.10 — 5.78Total International Stock Index Fund Institutional Select Shares 1969 VTISX 06/24/2016 — 0.045 -1.91 -1.74 -1.55 9.99 — — — 17.27
8

Vanguard Total Returns | May 31, 2018
Average Annual Total Returns*for Periods Ended May 31, 2018
Vanguard Fund NameFund
No.Ticker
SymbolInception
Date FeesExpense
Ratio Month QuarterYear
to Date 1 Year 3 Years 5 Years 10 YearsSince
Inception**
Total International Stock ETF 3369 VXUS 01/26/2011 — 0.11
Return based on Net Asset Value -1.92 -1.76 -1.58 9.91 5.12 6.06 — 4.44
Return based on Market Price -1.65 -1.61 -1.39 10.09 5.16 6.12 — 4.48
Total Stock Market Index Fund Investor Shares
85 VTSMX 04/27/1992 — 0.14 2.79 1.12 2.53 14.98 10.58 12.70 9.20 9.72
Total Stock Market Index Fund Admiral™ Shares 585 VTSAX 11/13/2000 — 0.04 2.82 1.16 2.59 15.11 10.70 12.83 9.32 6.69
Total Stock Market Index Fund Institutional Shares 855 VITSX 07/07/1997 — 0.035 2.82 1.16 2.59 15.11 10.70 12.84 9.33 7.76
Total Stock Market Index Fund Institutional Plus Shares 1871 VSMPX 04/28/2015 — 0.02 2.81 1.16 2.59 15.11 10.72 — — 10.34Total Stock Market Index Fund Institutional Select Shares 1785 VSTSX 06/27/2016 — 0.01 2.81 1.17 2.59 15.12 — — — 20.01
Total Stock Market ETF 970 VTI 05/24/2001 — 0.04
Return based on Net Asset Value 2.80 1.17 2.59 15.10 10.70 12.83 9.32 7.14
Return based on Market Price 2.74 1.11 2.53 15.08 10.70 12.82 9.34 7.14
Total World Stock Index Fund Investor Shares
628 VTWSX 06/26/2008 — 0.19 0.50 -0.36 0.50 12.44 7.84 9.28 — 6.35
Total World Stock Index Fund Institutional Shares 826 VTWIX 10/09/2008 — 0.09 0.50 -0.34 0.52 12.53 7.96 9.41 — 11.28
Total World Stock ETF 3141 VT 06/24/2008 — 0.10
Return based on Net Asset Value 0.50 -0.35 0.51 12.49 7.95 9.40 — 6.33
Return based on Market Price 0.57 -0.31 0.52 12.49 7.93 9.39 — 6.33
U.S. Growth Fund Investor Shares
23 VWUSX 01/06/1959 — 0.43 4.48 2.78 9.31 24.50 13.24 16.08 10.55 10.55
U.S. Growth Fund Admiral™ Shares 523 VWUAX 08/13/2001 — 0.30 4.48 2.81 9.39 24.64 13.39 16.24 10.71 6.40U.S. Liquidity Factor ETF ‡‡ 4420 VFLQ 02/13/2018 — 0.13
Return based on Net Asset Value 4.13 5.80 7.19 — — — — 7.19
Return based on Market Price 4.09 5.77 7.23 — — — — 7.23U.S. Minimum Volatility ETF ‡‡ 4419 VFMV 02/13/2018 — 0.13
Return based on Net Asset Value 2.00 5.82 6.99 — — — — 6.99
Return based on Market Price 1.99 5.80 7.05 — — — — 7.05U.S. Momentum Factor ETF ‡‡ 4418 VFMO 02/13/2018 — 0.13
Return based on Net Asset Value 5.97 5.68 8.35 — — — — 8.35
Return based on Market Price 5.94 5.65 8.39 — — — — 8.39
U.S. Multifactor Fund Admiral™ Shares ‡‡ 516 VFMFX 02/15/2018 — 0.18 3.32 4.41 3.28 — — — — 3.28U.S. Multifactor ETF ‡‡ 4421 VFMF 02/13/2018 — 0.18
Return based on Net Asset Value 3.55 3.95 5.85 — — — — 5.85
Return based on Market Price 3.53 3.94 5.91 — — — — 5.91U.S. Quality Factor ETF ‡‡ 4417 VFQY 02/13/2018 — 0.13
Return based on Net Asset Value 4.24 4.80 7.17 — — — — 7.17
Return based on Market Price 4.25 4.77 7.23 — — — — 7.23
U.S. Value Fund
124 VUVLX 06/29/2000 — 0.23 2.19 1.64 0.10 12.54 8.12 11.01 7.90 7.54U.S. Value Factor ETF ‡‡ 4416 VFVA 02/13/2018 — 0.13
Return based on Net Asset Value 1.85 2.99 4.12 — — — — 4.12
Return based on Market Price 1.84 2.98 4.17 — — — — 4.17
Utilities Index Fund Admiral™ Shares 5489 VUIAX 04/28/2004 — 0.10 -0.37 6.25 -1.31 -0.15 9.28 10.47 6.69 9.73
9

Vanguard Total Returns | May 31, 2018
Average Annual Total Returns*for Periods Ended May 31, 2018
Vanguard Fund NameFund
No.Ticker
SymbolInception
Date FeesExpense
Ratio Month QuarterYear
to Date 1 Year 3 Years 5 Years 10 YearsSince
Inception**
Utilities ETF 960 VPU 01/26/2004 — 0.10
Return based on Net Asset Value -0.37 6.25 -1.33 -0.16 9.27 10.47 6.69 9.59
Return based on Market Price -0.31 6.28 -1.31 -0.11 9.28 10.47 6.69 9.59
Value Index Fund Investor Shares 6 VIVAX 11/02/1992 — 0.17 0.62 -1.49 -1.30 11.77 9.34 11.27 8.00 9.52
Value Index Fund Admiral™ Shares 506 VVIAX 11/13/2000 — 0.05 0.62 -1.46 -1.25 11.90 9.47 11.42 8.14 6.42
Value Index Fund Institutional Shares 867 VIVIX 07/02/1998 — 0.04 0.64 -1.46 -1.25 11.91 9.48 11.43 8.16 6.49
Value ETF 966 VTV 01/26/2004 — 0.05
Return based on Net Asset Value 0.63 -1.45 -1.22 11.90 9.47 11.42 8.14 8.01
Return based on Market Price 0.60 -1.46 -1.28 11.91 9.45 11.41 8.16 8.01
Windsor™ Fund Investor Shares 22 VWNDX 10/23/1958 — 0.31 0.13 -0.72 0.04 11.44 7.47 10.74 8.42 11.37
Windsor™ Fund Admiral™ Shares 5022 VWNEX 11/12/2001 — 0.21 0.15 -0.68 0.09 11.53 7.57 10.85 8.54 7.60
Windsor™ II Fund Investor Shares 73 VWNFX 06/24/1985 — 0.34 0.81 -1.08 -1.19 9.32 7.16 9.64 7.54 10.66
Windsor™ II Fund Admiral™ Shares 573 VWNAX 05/14/2001 — 0.26 0.82 -1.07 -1.16 9.39 7.25 9.72 7.63 6.81
Balanced Funds All values displayed as %
Balanced Index Fund Investor Shares 2 VBINX 11/09/1992 — 0.19 1.93 0.89 0.92 8.62 6.90 8.31 7.23 8.17
Balanced Index Fund Admiral™ Shares 502 VBIAX 11/13/2000 — 0.07 1.96 0.92 0.98 8.75 7.04 8.46 7.37 6.18
Balanced Index Fund Institutional Shares 869 VBAIX 12/01/2000 — 0.06 1.93 0.92 0.98 8.75 7.04 8.47 7.39 6.34
Convertible Securities Fund 82 VCVSX 06/17/1986 — 0.35 1.78 1.81 2.42 7.66 3.03 5.31 6.00 8.06
Global Wellesley® Income Fund Investor Shares 1496 VGWIX 11/02/2017 — 0.42 -0.30 -0.25 -1.44 — — — — -0.51
Global Wellesley® Income Fund Admiral™ Shares 1896 VGYAX 11/02/2017 — 0.32 -0.28 -0.24 -1.43 — — — — -0.47
Global Wellington™ Fund Investor Shares 1567 VGWLX 11/02/2017 — 0.45 -0.59 -0.63 -0.97 — — — — 0.93
Global Wellington™ Fund Admiral™ Shares 1767 VGWAX 11/02/2017 — 0.35 -0.55 -0.61 -0.88 — — — — 1.01
Institutional Target Retirement 2015 Fund 1663 VITVX 06/26/2015 — 0.09†† 0.64 0.36 0.09 5.77 — — — 5.05
Institutional Target Retirement 2020 Fund 1664 VITWX 06/26/2015 — 0.09†† 0.71 0.31 0.22 7.30 — — — 5.96
Institutional Target Retirement 2025 Fund 1665 VRIVX 06/26/2015 — 0.09†† 0.75 0.26 0.35 8.37 — — — 6.53
Institutional Target Retirement 2030 Fund 1666 VTTWX 06/26/2015 — 0.09†† 0.78 0.17 0.43 9.30 — — — 6.95
Institutional Target Retirement 2035 Fund 1667 VITFX 06/26/2015 — 0.09†† 0.81 0.17 0.60 10.31 — — — 7.41
Institutional Target Retirement 2040 Fund 1668 VIRSX 06/26/2015 — 0.09†† 0.85 0.13 0.72 11.23 — — — 7.83
Institutional Target Retirement 2045 Fund 1669 VITLX 06/26/2015 — 0.09†† 0.88 0.08 0.76 11.70 — — — 8.11
Institutional Target Retirement 2050 Fund 1670 VTRLX 06/26/2015 — 0.09†† 0.84 0.08 0.76 11.71 — — — 8.11
Institutional Target Retirement 2055 Fund 1671 VIVLX 06/26/2015 — 0.09†† 0.88 0.08 0.80 11.72 — — — 8.12
Institutional Target Retirement 2060 Fund 1672 VILVX 06/26/2015 — 0.09†† 0.84 0.04 0.75 11.66 — — — 8.08
Institutional Target Retirement 2065 Fund 1792 VSXFX 07/12/2017 — 0.09†† 0.88 0.09 0.83 — — — — 10.34
Institutional Target Retirement Income Fund 1673 VITRX 06/26/2015 — 0.09†† 0.56 0.50 -0.06 4.11 — — — 4.20
LifeStrategy® Conservative Growth Fund 724 VSCGX 09/30/1994 — 0.12†† 0.66 0.35 -0.10 5.29 4.57 5.61 4.85 6.89
LifeStrategy® Growth Fund 122 VASGX 09/30/1994 — 0.14†† 0.83 0.15 0.59 10.36 7.22 8.85 6.08 8.15
LifeStrategy® Income Fund 723 VASIX 09/30/1994 — 0.11†† 0.59 0.52 -0.51 2.75 3.15 3.93 4.10 6.18
LifeStrategy® Moderate Growth Fund 914 VSMGX 09/30/1994 — 0.13†† 0.74 0.26 0.26 7.84 5.94 7.26 5.63 7.66
10

Vanguard Total Returns | May 31, 2018
Average Annual Total Returns*for Periods Ended May 31, 2018
Vanguard Fund NameFund
No.Ticker
SymbolInception
Date FeesExpense
Ratio Month QuarterYear
to Date 1 Year 3 Years 5 Years 10 YearsSince
Inception**
Managed Payout Fund
1498 VPGDX 05/02/2008 — 0.34†† 0.31 0.03 0.12 7.31 5.33 6.73 5.17 5.16
STAR® Fund
56 VGSTX 03/29/1985 — 0.32†† 1.23 0.26 0.97 9.92 6.98 8.34 6.96 9.51
Target Retirement 2015 Fund
303 VTXVX 10/27/2003 — 0.13†† 0.66 0.39 0.07 5.75 4.63 6.07 5.37 6.17
Target Retirement 2020 Fund
682 VTWNX 06/07/2006 — 0.13†† 0.67 0.26 0.19 7.20 5.53 7.08 5.79 6.32
Target Retirement 2025 Fund
304 VTTVX 10/27/2003 — 0.14†† 0.76 0.22 0.27 8.30 6.13 7.76 6.01 6.86
Target Retirement 2030 Fund
695 VTHRX 06/07/2006 — 0.14†† 0.78 0.18 0.45 9.29 6.62 8.35 6.20 6.73
Target Retirement 2035 Fund
305 VTTHX 10/27/2003 — 0.14†† 0.78 0.14 0.53 10.25 7.08 8.95 6.48 7.54
Target Retirement 2040 Fund
696 VFORX 06/07/2006 — 0.15†† 0.84 0.08 0.70 11.21 7.55 9.43 6.81 7.19
Target Retirement 2045 Fund
306 VTIVX 10/27/2003 — 0.15†† 0.85 0.04 0.71 11.65 7.82 9.60 6.88 8.02
Target Retirement 2050 Fund
699 VFIFX 06/07/2006 — 0.15†† 0.86 0.05 0.75 11.64 7.81 9.60 6.88 7.30
Target Retirement 2055 Fund
1487 VFFVX 08/18/2010 — 0.15†† 0.87 0.05 0.74 11.66 7.77 9.56 — 11.08
Target Retirement 2060 Fund
1691 VTTSX 01/19/2012 — 0.15†† 0.84 0.03 0.75 11.65 7.77 9.57 — 10.88
Target Retirement 2065 Fund
1791 VLXVX 07/12/2017 — 0.15†† 0.88 0.05 0.74 — — — — 10.15
Target Retirement Income Fund
308 VTINX 10/27/2003 — 0.13†† 0.60 0.47 -0.05 4.07 3.73 4.47 4.85 5.22
Tax-Managed Balanced Fund Admiral™ Shares ̃ ˜ 103 VTMFX 09/06/1994 — 0.09 1.68 0.77 0.94 7.34 6.49 7.62 6.80 7.54
Wellesley® Income Fund Investor Shares
27 VWINX 07/01/1970 — 0.22 0.65 -0.12 -2.31 3.42 5.05 5.75 6.98 9.71
Wellesley® Income Fund Admiral™ Shares 527 VWIAX 05/14/2001 — 0.15 0.67 -0.10 -2.27 3.48 5.13 5.83 7.06 6.80
Wellington™ Fund Investor Shares
21 VWELX 07/01/1929 — 0.25 0.61 -0.21 -1.01 7.71 7.24 8.51 7.45 8.27
Wellington™ Fund Admiral™ Shares 521 VWENX 05/14/2001 — 0.17 0.61 -0.21 -1.00 7.77 7.31 8.59 7.54 7.58
Bond Funds All values displayed as %
California Intermediate-Term Tax-Exempt Fund Investor Shares ˜ 100 VCAIX 03/04/1994 — 0.19 1.18 1.10 -0.19 0.88 2.47 2.84 3.98 4.68
California Intermediate-Term Tax-Exempt Fund Admiral™ Shares ̃ 5100 VCADX 11/12/2001 — 0.09 1.19 1.13 -0.15 0.98 2.57 2.93 4.07 3.89
California Long-Term Tax-Exempt Fund Investor Shares ˜ 75 VCITX 04/07/1986 — 0.19 1.47 1.60 -0.45 2.03 3.44 3.82 4.60 5.90
California Long-Term Tax-Exempt Fund Admiral™ Shares ̃ 575 VCLAX 11/12/2001 — 0.09 1.47 1.62 -0.41 2.13 3.54 3.91 4.69 4.41
Core Bond Fund Investor Shares
1320 VCORX 03/28/2016 — 0.25 0.56 0.42 -1.79 -0.61 — — — 0.99
Core Bond Fund Admiral™ Shares 1520 VCOBX 03/28/2016 — 0.15 0.62 0.45 -1.74 -0.55 — — — 1.11
Emerging Markets Bond Fund Investor Shares
1431 VEMBX 03/10/2016 — 0.60 -0.50 -0.92 -1.55 4.18 — — — 9.37
Emerging Markets Bond Fund Admiral™ Shares 1531 VEGBX 12/06/2017 — 0.45 -0.53 -0.90 -1.53 — — — — -1.10
Emerging Markets Government Bond Index Fund Investor Shares
1120 VGOVX 05/31/2013 R2 0.49 -0.79 -1.82 -3.70 -1.96 3.48 3.26 — 3.26
Emerging Markets Government Bond Index Fund Admiral™ Shares 520 VGAVX 05/31/2013 R2 0.32 -0.77 -1.77 -3.58 -1.84 3.65 3.41 — 3.41
Emerging Markets Government Bond Index Fund Institutional Shares 2020 VGIVX 02/11/2015 R2 0.29 -0.82 -1.81 -3.62 -1.84 3.66 — — 4.46
Emerging Markets Government Bond ETF 3820 VWOB 05/31/2013 — 0.32
Return based on Net Asset Value -0.79 -1.79 -3.61 -1.12 3.89 3.55 — 3.55
Return based on Market Price -0.58 -1.63 -3.77 -1.27 3.76 3.65 — 3.65
Extended Duration Treasury Index Fund Institutional Shares 1 1275 VEDTX 11/28/2007 R3 0.06 2.45 3.95 -4.78 0.84 2.85 5.46 8.34 7.19
Extended Duration Treasury Index Fund Institutional Plus Shares 1 1276 VEDIX 08/28/2013 R3 0.04 2.46 3.96 -4.77 0.87 2.88 — — 8.28
1 The U.S. government backs the fund’s underlying investments but not its shares’ net asset value.
11

Vanguard Total Returns | May 31, 2018
Average Annual Total Returns*for Periods Ended May 31, 2018
Vanguard Fund NameFund
No.Ticker
SymbolInception
Date FeesExpense
Ratio Month QuarterYear
to Date 1 Year 3 Years 5 Years 10 YearsSince
Inception**
Extended Duration Treasury ETF 1 930 EDV 12/06/2007 — 0.07
Return based on Net Asset Value 2.45 3.94 -4.78 1.35 3.02 5.54 8.36 7.43
Return based on Market Price 2.27 3.52 -5.21 0.88 2.95 5.53 8.38 7.44
GNMA Fund Investor Shares 1
36 VFIIX 06/27/1980 — 0.21 0.73 0.92 -0.84 -0.49 1.06 2.03 3.62 7.13
GNMA Fund Admiral™ Shares 1 536 VFIJX 02/12/2001 — 0.11 0.74 0.94 -0.80 -0.39 1.17 2.13 3.72 4.41
High-Yield Corporate Fund Investor Shares
29 VWEHX 12/27/1978 — 0.23 -0.40 -0.51 -1.42 0.93 3.85 4.28 6.57 8.31
High-Yield Corporate Fund Admiral™ Shares 529 VWEAX 11/12/2001 — 0.13 -0.39 -0.49 -1.38 1.03 3.95 4.38 6.68 6.57
High-Yield Tax-Exempt Fund Investor Shares ˜ 44 VWAHX 12/27/1978 — 0.19 1.31 1.58 -0.03 3.32 4.07 3.97 4.99 6.51
High-Yield Tax-Exempt Fund Admiral™ Shares ̃ 5044 VWALX 11/12/2001 — 0.09 1.31 1.60 0.01 3.42 4.17 4.06 5.07 4.81
Inflation-Protected Securities Fund Investor Shares
119 VIPSX 06/29/2000 — 0.20 0.23 1.08 -0.78 0.15 1.25 0.59 2.86 5.12
Inflation-Protected Securities Fund Admiral™ Shares 5119 VAIPX 06/10/2005 — 0.10 0.28 1.16 -0.74 0.31 1.35 0.69 2.96 3.52
Inflation-Protected Securities Fund Institutional Shares 1190 VIPIX 12/12/2003 — 0.07 0.29 1.21 -0.73 0.35 1.39 0.73 3.00 3.86
Intermediate-Term Bond Index Fund Investor Shares
314 VBIIX 03/01/1994 — 0.15 0.69 0.24 -2.26 -1.73 1.18 1.85 4.55 5.70
Intermediate-Term Bond Index Fund Admiral™ Shares 5314 VBILX 11/12/2001 — 0.07 0.79 0.26 -2.22 -1.66 1.26 1.94 4.64 4.82
Intermediate-Term Bond Index Fund Institutional Shares 504 VBIMX 01/26/2006 — 0.05 0.79 0.27 -2.22 -1.64 1.28 1.96 4.68 4.85
Intermediate-Term Bond Index Fund Institutional Plus 1874 VBIUX 11/30/2011 — 0.04 0.80 0.27 -2.21 -1.63 1.29 1.98 — 2.76
Intermediate-Term Bond ETF 925 BIV 04/03/2007 — 0.07
Return based on Net Asset Value 0.73 0.25 -2.21 -1.65 1.24 1.94 4.64 4.79
Return based on Market Price 0.78 0.22 -2.20 -1.72 1.25 1.98 4.59 4.78
Intermediate-Term Corporate Bond Index Fund Admiral™ Shares 1946 VICSX 03/02/2010 R4 0.07 0.57 -0.32 -2.79 -1.33 2.13 2.83 — 4.96
Intermediate-Term Corporate Bond Index Fund Institutional Shares 1646 VICBX 11/19/2009 R4 0.05 0.56 -0.30 -2.74 -1.32 2.14 2.85 — 5.10
Intermediate-Term Corporate Bond ETF 3146 VCIT 11/19/2009 — 0.07
Return based on Net Asset Value 0.55 -0.33 -2.77 -1.09 2.20 2.88 — 5.09
Return based on Market Price 0.56 -0.25 -2.89 -1.21 2.22 2.92 — 5.08
Intermediate-Term Treasury Index Fund Admiral™ Shares 1 1943 VSIGX 08/04/2010 — 0.07 0.74 0.59 -1.31 -1.76 0.49 1.04 — 2.03
Intermediate-Term Treasury Index Fund Institutional Shares 1 1643 VIIGX 03/19/2010 — 0.05 0.78 0.62 -1.27 -1.73 0.51 1.06 — 2.65
Intermediate-Term Treasury ETF 1 3143 VGIT 11/19/2009 — 0.07
Return based on Net Asset Value 0.76 0.59 -1.30 -1.79 0.48 1.03 — 2.51
Return based on Market Price 0.80 0.62 -1.31 -1.75 0.48 1.05 — 2.52
Intermediate-Term Investment-Grade Fund Investor Shares
71 VFICX 11/01/1993 — 0.20 0.58 0.04 -2.06 -1.00 1.83 2.40 4.81 5.54
Intermediate-Term Investment-Grade Fund Admiral™ Shares 571 VFIDX 02/12/2001 — 0.10 0.59 0.06 -2.02 -0.90 1.93 2.50 4.92 5.28
Intermediate-Term Tax-Exempt Fund Investor Shares ˜ 42 VWITX 09/01/1977 — 0.19 1.04 0.92 -0.42 0.53 2.33 2.49 3.80 5.33
Intermediate-Term Tax-Exempt Fund Admiral™ Shares ̃ 542 VWIUX 02/12/2001 — 0.09 1.04 0.95 -0.38 0.63 2.43 2.59 3.89 4.02
Intermediate-Term Treasury Fund Investor Shares 1
35 VFITX 10/28/1991 — 0.20 0.76 0.58 -1.47 -2.02 0.42 0.95 3.24 5.53
Intermediate-Term Treasury Fund Admiral™ Shares 1 535 VFIUX 02/12/2001 — 0.10 0.77 0.60 -1.43 -1.93 0.52 1.06 3.35 4.46
Limited-Term Tax-Exempt Fund Investor Shares ˜ 31 VMLTX 08/31/1987 — 0.19 0.52 0.35 0.16 0.06 1.08 1.05 1.96 3.99
Limited-Term Tax-Exempt Fund Admiral™ Shares ̃ 531 VMLUX 02/12/2001 — 0.09 0.53 0.37 0.20 0.16 1.18 1.14 2.05 2.64
Long-Term Bond Index Fund
522 VBLTX 03/01/1994 — 0.15 0.92 0.31 -4.83 0.14 3.12 4.04 6.75 7.09
Long-Term Bond Index Fund Institutional Shares 545 VBLLX 02/02/2006 — 0.05 0.93 0.33 -4.79 0.24 3.22 4.15 6.88 6.35
1 The U.S. government backs the fund’s underlying investments but not its shares’ net asset value.
12

Vanguard Total Returns | May 31, 2018
Average Annual Total Returns*for Periods Ended May 31, 2018
Vanguard Fund NameFund
No.Ticker
SymbolInception
Date FeesExpense
Ratio Month QuarterYear
to Date 1 Year 3 Years 5 Years 10 YearsSince
Inception**
Long-Term Bond Index Fund Institutional Plus 1872 VBLIX 10/06/2011 — 0.04 0.93 0.34 -4.79 0.25 3.23 4.17 — 4.44
Long-Term Bond ETF 927 BLV 04/03/2007 — 0.07
Return based on Net Asset Value 0.90 0.30 -4.85 0.22 3.19 4.12 6.83 6.53
Return based on Market Price 1.17 0.57 -4.74 0.29 3.39 4.19 6.86 6.55
Long-Term Corporate Bond Index Fund Admiral™ Shares 1947 VLTCX 01/19/2010 R5 0.07 0.21 -1.28 -5.90 -0.65 3.86 4.46 — 6.76
Long-Term Corporate Bond Index Fund Institutional Shares 1647 VLCIX 11/19/2009 R5 0.05 0.22 -1.27 -5.87 -0.65 3.87 4.47 — 6.78
Long-Term Corporate Bond ETF 3147 VCLT 11/19/2009 — 0.07
Return based on Net Asset Value 0.24 -1.27 -5.88 0.33 4.19 4.66 — 6.87
Return based on Market Price 0.51 -1.11 -5.94 0.08 4.37 4.77 — 6.87
Long-Term Treasury Index Fund Admiral™ Shares 1 1944 VLGSX 03/01/2010 — 0.07 1.86 2.54 -3.71 -0.36 1.97 3.59 — 6.05
Long-Term Treasury Index Fund Institutional Shares 1 1644 VLGIX 07/30/2010 — 0.05 1.87 2.54 -3.68 -0.33 1.99 3.62 — 5.11
Long-Term Treasury ETF 1 3144 VGLT 11/19/2009 — 0.07
Return based on Net Asset Value 1.87 2.55 -3.68 -0.33 1.97 3.60 — 5.68
Return based on Market Price 1.84 2.63 -3.69 -0.33 1.99 3.60 — 5.69
Long-Term Investment-Grade Fund Investor Shares
28 VWESX 07/09/1973 — 0.22 0.46 -0.62 -5.89 0.35 4.13 4.73 7.40 8.25
Long-Term Investment-Grade Fund Admiral™ Shares 568 VWETX 02/12/2001 — 0.12 0.47 -0.60 -5.85 0.45 4.23 4.83 7.52 6.93
Long-Term Tax-Exempt Fund Investor Shares ˜ 43 VWLTX 09/01/1977 — 0.19 1.27 1.31 -0.57 1.79 3.40 3.56 4.52 5.82
Long-Term Tax-Exempt Fund Admiral™ Shares ̃ 543 VWLUX 02/12/2001 — 0.09 1.27 1.33 -0.53 1.89 3.50 3.65 4.61 4.66
Long-Term Treasury Fund Investor Shares 1
83 VUSTX 05/19/1986 — 0.20 1.79 2.47 -3.88 -0.61 1.80 3.50 5.93 7.42
Long-Term Treasury Fund Admiral™ Shares 1 583 VUSUX 02/12/2001 — 0.10 1.80 2.49 -3.84 -0.51 1.90 3.60 6.05 6.27
Massachusetts Tax-Exempt Fund ˜ 168 VMATX 12/09/1998 — 0.15 1.21 1.34 -0.80 1.28 2.89 3.21 4.12 4.35
Mortgage-Backed Securities Index Fund Admiral™ Shares 1948 VMBSX 12/03/2009 — 0.07 0.68 0.75 -1.05 -0.41 1.02 1.91 — 2.50
Mortgage-Backed Securities Index Fund Institutional Shares 1648 VMBIX 10/31/2013 — 0.05 0.67 0.70 -1.05 -0.41 1.03 — — 1.95
Mortgage-Backed Securities ETF 3148 VMBS 11/19/2009 — 0.07
Return based on Net Asset Value 0.64 0.70 -1.07 -0.42 1.01 1.91 — 2.51
Return based on Market Price 0.73 0.82 -0.99 -0.41 1.06 1.94 — 2.52
New Jersey Long-Term Tax-Exempt Fund Investor Shares ˜ 14 VNJTX 02/03/1988 — 0.19 1.32 1.66 -0.36 3.69 4.21 3.67 4.40 5.82
New Jersey Long-Term Tax-Exempt Fund Admiral™ Shares ̃ 514 VNJUX 05/14/2001 — 0.09 1.32 1.68 -0.32 3.79 4.31 3.77 4.49 4.63
New York Long-Term Tax-Exempt Fund Investor Shares ˜ 76 VNYTX 04/07/1986 — 0.19 1.24 1.17 -0.73 1.07 3.08 3.43 4.24 5.63
New York Long-Term Tax-Exempt Fund Admiral™ Shares ̃ 576 VNYUX 05/14/2001 — 0.09 1.25 1.19 -0.69 1.17 3.18 3.52 4.33 4.55
Ohio Long-Term Tax-Exempt Fund ˜ 97 VOHIX 06/18/1990 — 0.15 1.26 1.31 -0.66 1.81 3.44 3.69 4.55 5.75
Pennsylvania Long-Term Tax-Exempt Fund Investor Shares ˜ 77 VPAIX 04/07/1986 — 0.19 1.36 1.50 -0.39 2.13 3.46 3.65 4.41 5.84
Pennsylvania Long-Term Tax-Exempt Fund Admiral™ Shares ̃ 577 VPALX 05/14/2001 — 0.09 1.37 1.53 -0.35 2.23 3.56 3.74 4.50 4.64
Short-Term Bond Index Fund Investor Shares
132 VBISX 03/01/1994 — 0.15 0.45 0.37 -0.42 -0.43 0.61 0.83 2.08 3.99
Short-Term Bond Index Fund Admiral™ Shares 5132 VBIRX 11/12/2001 — 0.07 0.46 0.39 -0.39 -0.36 0.69 0.92 2.18 2.80
Short-Term Bond Index Fund Institutional Shares 732 VBITX 09/27/2011 — 0.05 0.46 0.39 -0.38 -0.34 0.71 0.94 — 1.09
Short-Term Bond Index Fund Institutional Plus 733 VBIPX 09/29/2011 — 0.04 0.46 0.39 -0.37 -0.33 0.72 0.96 — 1.11
1 The U.S. government backs the fund’s underlying investments but not its shares’ net asset value.
13

Vanguard Total Returns | May 31, 2018
Average Annual Total Returns*for Periods Ended May 31, 2018
Vanguard Fund NameFund
No.Ticker
SymbolInception
Date FeesExpense
Ratio Month QuarterYear
to Date 1 Year 3 Years 5 Years 10 YearsSince
Inception**
Short-Term Bond ETF 924 BSV 04/03/2007 — 0.07
Return based on Net Asset Value 0.43 0.37 -0.37 -0.37 0.70 0.92 2.17 2.61
Return based on Market Price 0.36 0.36 -0.42 -0.46 0.69 0.92 2.14 2.60
Short-Term Corporate Bond Index Fund Admiral™ Shares 1945 VSCSX 11/18/2010 — 0.07 0.41 0.33 -0.52 0.10 1.47 1.71 — 2.28
Short-Term Corporate Bond Index Fund Institutional Shares 1645 VSTBX 11/19/2009 — 0.05 0.42 0.32 -0.49 0.15 1.50 1.73 — 2.75
Short-Term Corporate Bond ETF 3145 VCSH 11/19/2009 — 0.07
Return based on Net Asset Value 0.42 0.34 -0.48 0.13 1.47 1.71 — 2.72
Return based on Market Price 0.37 0.38 -0.51 -0.02 1.45 1.68 — 2.71
Short-Term Federal Fund Investor Shares 1 49 VSGBX 12/31/1987 — 0.20 0.35 0.36 -0.24 -0.31 0.52 0.67 1.84 4.75
Short-Term Federal Fund Admiral™ Shares 1 549 VSGDX 02/12/2001 — 0.10 0.36 0.38 -0.20 -0.21 0.62 0.77 1.94 3.05
Short-Term Treasury Index Fund Admiral™ Shares 1 1942 VSBSX 12/28/2009 — 0.07 0.34 0.36 -0.03 -0.12 0.34 0.48 — 0.76
Short-Term Treasury Index Fund Institutional Shares 1 1642 VSBIX 08/23/2010 — 0.05 0.34 0.37 0.00 -0.12 0.37 0.50 — 0.58
Short-Term Treasury ETF 1 3142 VGSH 11/19/2009 — 0.07
Return based on Net Asset Value 0.34 0.34 -0.04 -0.17 0.34 0.48 — 0.70
Return based on Market Price 0.39 0.39 0.03 -0.09 0.35 0.49 — 0.70
Short-Term Inflation-Protected Securities Index Fund Investor Shares 1967 VTIPX 10/16/2012 — 0.15 0.29 0.78 0.45 0.60 0.89 0.31 — 0.19
Short-Term Inflation-Protected Securities Index Fund Admiral™ Shares 567 VTAPX 10/16/2012 — 0.06 0.33 0.82 0.49 0.70 0.98 0.41 — 0.28
Short-Term Inflation-Protected Securities Index Fund Institutional Shares 1867 VTSPX 10/17/2012 — 0.04 0.29 0.78 0.49 0.71 1.01 0.43 — 0.31
Short-Term Inflation-Protected Securities ETF 3365 VTIP 10/12/2012 — 0.06
Return based on Net Asset Value 0.31 0.80 0.47 0.70 0.98 0.41 — 0.28
Return based on Market Price 0.31 0.80 0.43 0.67 0.96 0.40 — 0.29
Short-Term Investment-Grade Fund Investor Shares 39 VFSTX 10/29/1982 — 0.20 0.41 0.27 -0.39 0.18 1.38 1.55 2.70 5.95
Short-Term Investment-Grade Fund Admiral™ Shares 539 VFSUX 02/12/2001 — 0.10 0.42 0.30 -0.35 0.28 1.48 1.65 2.80 3.51
Short-Term Investment-Grade Fund Institutional Shares 858 VFSIX 09/30/1997 — 0.07 0.42 0.30 -0.34 0.31 1.51 1.68 2.84 4.01
Short-Term Tax-Exempt Fund Investor Shares ˜ 41 VWSTX 09/01/1977 — 0.19 0.25 0.22 0.49 0.49 0.75 0.63 1.19 3.85
Short-Term Tax-Exempt Fund Admiral™ Shares ̃ 541 VWSUX 02/12/2001 — 0.09 0.25 0.24 0.53 0.59 0.85 0.72 1.27 1.96
Short-Term Treasury Fund Investor Shares 1 32 VFISX 10/28/1991 — 0.20 0.36 0.35 -0.18 -0.42 0.34 0.48 1.39 3.90
Short-Term Treasury Fund Admiral™ Shares 1 532 VFIRX 02/13/2001 — 0.10 0.37 0.37 -0.14 -0.32 0.44 0.58 1.50 2.81
Tax-Exempt Bond Index Fund Investor Shares ˜ 1491 VTEBX 08/21/2015 R4 0.19 1.17 1.02 -0.52 0.73 — — — 2.34
Tax-Exempt Bond Index Fund Admiral™ Shares ̃ 591 VTEAX 08/25/2015 R4 0.09 1.12 1.05 -0.48 0.78 — — — 2.47
Tax-Exempt Bond ETF ˜ 4391 VTEB 08/21/2015 — 0.09
Return based on Net Asset Value 1.14 1.05 -0.46 1.03 — — — 2.51
Return based on Market Price 1.14 1.21 -0.58 1.05 — — — 2.52
Total Bond Market Index Fund Investor Shares 84 VBMFX 12/11/1986 — 0.15 0.61 0.40 -1.72 -0.65 1.22 1.74 3.55 5.80
Total Bond Market Index Fund Admiral™ Shares 584 VBTLX 11/12/2001 — 0.05 0.62 0.42 -1.68 -0.54 1.32 1.85 3.66 3.99
Total Bond Market Index Fund Institutional Shares 222 VBTIX 09/18/1995 — 0.04 0.62 0.43 -1.68 -0.54 1.33 1.86 3.68 5.02
Total Bond Market Index Fund Institutional Plus Shares 2 850 VBMPX 09/18/1995 — 0.03 0.62 0.43 -1.67 -0.53 1.34 1.87 3.69 5.03Total Bond Market Index Fund Institutional Select Shares 1884 VTBSX 06/24/2016 — 0.01 0.62 0.43 -1.66 -0.51 — — — -0.19
1 The U.S. government backs the fund’s underlying investments but not its shares’ net asset value.
14
2 The inception date of the Institutional Plus Shares is February 5, 2010; returns since that date are Institutional Plus Shares historical returns. All other returns are blended returns of the historical performance of the InstitutionalPlus Shares and the fund’s Institutional Shares (for periods prior to the inception date of the Institutional Plus Shares). The inception date shown in the table is that of the fund’s Institutional Shares and since-inceptionperformance is from that date.

Vanguard Total Returns | May 31, 2018
Average Annual Total Returns*for Periods Ended May 31, 2018
Vanguard Fund NameFund
No.Ticker
SymbolInception
Date FeesExpense
Ratio Month QuarterYear
to Date 1 Year 3 Years 5 Years 10 YearsSince
Inception**
Total Bond Market ETF 928 BND 04/03/2007 — 0.05
Return based on Net Asset Value 0.62 0.42 -1.68 -0.53 1.31 1.87 3.66 3.86
Return based on Market Price 0.71 0.52 -1.73 -0.55 1.35 1.89 3.63 3.86
Total Bond Market II Index Fund Investor Shares ¯ 635 VTBIX 01/26/2009 — 0.09 0.61 0.38 -1.74 -0.59 1.24 1.78 — 3.42
Total Bond Market II Index Fund Institutional Shares ¯ 660 VTBNX 02/17/2009 — 0.02 0.62 0.40 -1.71 -0.52 1.31 1.85 — 3.45
Total Corporate Bond ETF 985 VTC 11/07/2017 — 0.07
Return based on Net Asset Value 0.49 -0.25 -2.94 — — — — -2.46
Return based on Market Price 0.60 -0.12 -2.89 — — — — -2.34
Total International Bond Index Fund Investor Shares 1231 VTIBX 05/31/2013 — 0.13 0.08 1.00 0.79 2.23 2.74 3.47 — 3.47
Total International Bond Index Fund Admiral™ Shares 511 VTABX 05/31/2013 — 0.11 0.09 1.00 0.85 2.21 2.77 3.50 — 3.50
Total International Bond Index Fund Institutional Shares 2011 VTIFX 05/31/2013 — 0.07 0.06 1.01 0.82 2.20 2.81 3.55 — 3.55Total International Bond Index Fund Institutional Select Shares 1831 VSIBX 03/29/2016 — 0.025 0.00 — — — — — — —
Total International Bond ETF 3711 BNDX 05/31/2013 — 0.11
Return based on Net Asset Value 0.08 1.01 0.83 2.20 2.77 3.49 — 3.49
Return based on Market Price -0.20 0.77 0.55 1.88 2.70 3.49 — 3.49
Ultra-Short-Term Bond Fund Investor Shares 1492 VUBFX 02/24/2015 — 0.20 0.27 0.50 0.56 1.22 1.06 — — 1.00
Ultra-Short-Term Bond Fund Admiral™ Shares 592 VUSFX 02/24/2015 — 0.10 0.28 0.53 0.61 1.36 1.15 — — 1.09
15

1 The U.S. government backs the fund’s underlying investments but not its shares’ net asset value.
3 7-day yield for money market funds (as of May 31, 2018). The money market yields listed more closely reflect the current earnings of the fund or portfolio than do the average annual total returns shown.
4 The fund is only available to retail investors (natural persons). You could lose money by investing in the fund. Although the fund seeks to preserve the value of your investment at $1.00 per share, it cannot guarantee it will do so. The fund may impose a fee upon sale of your shares or may temporarily suspend your ability to sell shares if the fund’s liquidity falls below required minimums because of market conditions or other factors. An investment in the fund is not insured or guaranteed by the Federal Deposit Insurance Corporation or any other government agency. The fund’s sponsor has no legal obligation to provide financial support to the fund, and you should not expect that the sponsor will provide financial support to the fund at any time.
5 You could lose money by investing in the fund. Although the fund seeks to preserve the value of your investment at $1.00 per share, it cannot guarantee it will do so. An investment in the fund is not insured or guaranteed by the Federal Deposit Insurance Corporation or any other government agency. The fund’s sponsor has no legal obligation to provide financial support to the fund, and you should not expect that the sponsor will provide financial support to the fund at any time.
Vanguard Total Returns | May 31, 2018
Average Annual Total Returns*for Periods Ended May 31, 2018
Vanguard Fund NameFund
No.Ticker
SymbolInception
DateExpense
Ratio Month QuarterYear
to Date 1 Year 3 Years 5 Years10
YearsSince
Inception**7-Day
SEC Yield3
Money Market Funds All values displayed as %
Vanguard Treasury Money Market Fund 1,5 11 VUSXX 12/14/1992 0.09 0.15 0.40 0.61 1.18 0.56 0.34 0.29 2.48 1.75
California Municipal Money Market Fund 4˜ 62 VCTXX 06/01/1987 0.16 0.10 0.31 0.47 0.91 0.48 0.29 0.30 2.25 1.02
Federal Money Market Fund 5 33 VMFXX 07/13/1981 0.11 0.14 0.39 0.60 1.18 0.58 0.35 0.34 4.22 1.71
New Jersey Municipal Money Market Fund 4˜ 95 VNJXX 02/03/1988 0.16 0.10 0.31 0.47 0.91 0.48 0.29 0.31 2.23 1.07
New York Municipal Money Market Fund 4˜ 163 VYFXX 09/03/1997 0.16 0.11 0.32 0.49 0.95 0.50 0.31 0.31 1.46 1.04
Pennsylvania Municipal Money Market Fund 4˜ 63 VPTXX 06/13/1988 0.16 0.10 0.32 0.48 0.92 0.48 0.29 0.33 2.26 1.01
Prime Money Market Fund 4 30 VMMXX 06/04/1975 0.16 0.16 0.44 0.68 1.35 0.74 0.45 0.43 5.00 1.90Prime Money Market Fund Admiral™ Shares 4 66 VMRXX 10/03/1989 0.10 0.16 0.46 0.70 1.41 0.81 0.51 0.51 3.16 1.96
Municipal Money Market Fund 4˜ 45 VMSXX 06/10/1980 0.15 0.11 0.33 0.50 0.97 0.52 0.32 0.35 2.95 1.11
16

6 The investment contract funds and collective trusts are managed by Vanguard Fiduciary Trust Company, a subsidiary of The Vanguard Group, Inc.
Collective trust returns are computed taking into account all trading costs, but do not reflect the deduction of other costs or fees, including investment advisory fees.
Vanguard Total Returns | May 31, 2018
Average Annual Total Returns*for Periods Ended May 31, 2018
Vanguard Fund NameFund
No.Inception
Date Month QuarterYear
to Date 1 Year 3 Years 5 Years 10 YearsSince
Inception**
Investment Contract Funds6 All values displayed as %
Retirement Savings Trust 34 01/02/1989 0.17 0.50 0.81 1.87 1.85 1.82 2.35 4.69
Retirement Savings Trust II 338 08/30/2001 0.19 0.55 0.90 2.08 2.05 2.02 2.55 3.40
Retirement Savings Trust III 340 09/05/2001 0.18 0.54 0.88 2.03 2.00 1.97 2.50 3.35
Retirement Savings Trust IV 348 10/31/2003 0.18 0.53 0.85 1.98 1.95 1.92 2.45 3.04
Retirement Savings Trust V 339 02/03/2003 0.18 0.52 0.83 1.92 1.90 1.87 2.40 3.05
Retirement Savings Trust VIII 376 09/30/2004 0.16 0.48 0.77 1.77 1.74 1.72 2.24 2.77
Collective Trusts6 All values displayed as %
Employee Benefit Index Fund 528 09/30/1985 2.41 0.19 2.02 14.39 11.00 12.99 9.20 11.13
European Stock Index Trust 735 01/26/2006 -2.79 -0.83 -1.83 5.45 3.69 5.83 1.97 4.30
Institutional 500 Index Trust 2040 06/24/2016 2.42 0.19 2.02 14.39 — — — 18.18
Institutional Extended Market Index Trust 1998 06/27/2016 4.81 5.85 5.25 18.52 — — — 23.03
Institutional Total Bond Market Index Trust 1984 06/24/2016 0.62 0.43 -1.67 -0.52 — — — -0.21
Institutional Total International Stock Market Index Trust 2069 06/24/2016 -1.91 -1.74 -1.55 9.99 — — — 17.27
Institutional Total Stock Market Index Trust 1885 06/27/2016 2.82 1.17 2.59 15.12 — — — 20.01
Pacific Stock Index Trust 737 01/26/2006 -0.65 -1.36 0.17 13.90 6.58 7.57 3.56 3.99
Russell 1000 Growth Index Trust 291 09/30/2003 4.38 1.87 6.22 21.02 13.94 15.70 10.92 10.22
Russell 1000 Value Index Trust 191 09/30/2003 0.60 -0.85 -1.93 8.27 7.48 10.12 7.43 8.72
Russell 2000 Growth Index Trust 296 09/30/2003 6.32 7.88 8.92 25.29 11.07 13.61 10.81 10.66
Russell 2000 Value Index Trust 295 09/30/2003 5.84 9.04 4.90 16.54 11.18 11.09 8.89 9.71
Target Retirement 2015 Trust I 1463 06/28/2007 0.63 0.37 0.10 5.76 4.72 6.16 5.47 5.05
Target Retirement 2020 Trust I 1464 06/22/2007 0.70 0.28 0.23 7.31 5.62 7.18 5.89 5.37
Target Retirement 2025 Trust I 1465 06/28/2007 0.73 0.22 0.32 8.38 6.23 7.86 6.12 5.45
Target Retirement 2030 Trust I 1466 06/28/2007 0.76 0.19 0.45 9.33 6.71 8.45 6.28 5.53
Target Retirement 2035 Trust I 1467 06/28/2007 0.82 0.15 0.58 10.31 7.20 9.05 6.58 5.74
Target Retirement 2040 Trust I 1468 06/28/2007 0.87 0.11 0.71 11.28 7.65 9.54 6.91 6.06
Target Retirement 2045 Trust I 1469 06/28/2007 0.88 0.07 0.76 11.74 7.91 9.69 6.99 6.10
Target Retirement 2050 Trust I 1470 06/28/2007 0.88 0.09 0.79 11.75 7.89 9.69 7.00 6.16
Target Retirement 2055 Trust I 1488 10/05/2010 0.86 0.07 0.77 11.74 7.87 9.66 — 10.45
Target Retirement 2060 Trust I 1692 03/01/2012 0.88 0.08 0.79 11.75 7.88 9.68 — 10.30
Target Retirement 2065 Trust I 1793 07/21/2017 0.84 0.13 0.84 — — — — 13.17
Target Retirement Income Trust I 1461 06/22/2007 0.55 0.45 -0.08 4.13 3.79 4.54 4.92 5.01
Target Retirement 2015 Trust II 1473 02/29/2008 0.62 0.37 0.06 5.77 4.70 6.13 5.44 5.70
Target Retirement 2020 Trust II 1474 02/29/2008 0.70 0.27 0.21 7.28 5.61 7.16 5.86 6.16
Target Retirement 2025 Trust II 1475 02/29/2008 0.76 0.24 0.30 8.37 6.23 7.83 6.08 6.43
Target Retirement 2030 Trust II 1476 02/29/2008 0.77 0.18 0.43 9.33 6.69 8.42 6.24 6.65
Target Retirement 2035 Trust II 1477 02/29/2008 0.82 0.15 0.57 10.28 7.18 9.03 6.55 6.97
Target Retirement 2040 Trust II 1478 02/29/2008 0.85 0.12 0.70 11.29 7.63 9.52 6.87 7.30
Target Retirement 2045 Trust II 1479 02/29/2008 0.87 0.06 0.75 11.71 7.90 9.67 6.95 7.35
Target Retirement 2050 Trust II 1480 02/29/2008 0.90 0.09 0.78 11.76 7.88 9.67 6.95 7.37
17

6 The investment contract funds and collective trusts are managed by Vanguard Fiduciary Trust Company, a subsidiary of The Vanguard Group, Inc.
Collective trust returns are computed taking into account all trading costs, but do not reflect the deduction of other costs or fees, including investment advisory fees.
Vanguard Total Returns | May 31, 2018
Average Annual Total Returns*for Periods Ended May 31, 2018
Vanguard Fund NameFund
No.Inception
Date Month QuarterYear
to Date 1 Year 3 Years 5 Years 10 YearsSince
Inception**
Collective Trusts6 All values displayed as %
Target Retirement 2055 Trust II 1489 08/31/2010 0.86 0.06 0.75 11.72 7.85 9.63 — 11.68
Target Retirement 2060 Trust II 1693 03/01/2012 0.88 0.08 0.77 11.74 7.86 9.66 — 10.27
Target Retirement 2065 Trust II 1794 07/17/2017 0.89 0.13 0.89 — — — — 13.40
Target Retirement Income Trust II 1471 02/29/2008 0.56 0.44 -0.09 4.11 3.77 4.51 4.89 4.89
Target Retirement 2015 Trust Plus 1652 08/15/2011 0.64 0.37 0.10 5.79 4.73 6.17 — 7.30
Target Retirement 2020 Trust Plus 1653 08/15/2011 0.68 0.29 0.23 7.29 5.63 7.19 — 8.37
Target Retirement 2025 Trust Plus 1654 08/15/2011 0.76 0.24 0.33 8.39 6.24 7.87 — 9.12
Target Retirement 2030 Trust Plus 1655 08/15/2011 0.78 0.18 0.44 9.33 6.71 8.45 — 9.82
Target Retirement 2035 Trust Plus 1656 08/15/2011 0.84 0.15 0.60 10.33 7.22 9.06 — 10.51
Target Retirement 2040 Trust Plus 1657 08/15/2011 0.86 0.10 0.71 11.28 7.66 9.55 — 11.01
Target Retirement 2045 Trust Plus 1658 08/15/2011 0.89 0.08 0.77 11.75 7.93 9.71 — 11.13
Target Retirement 2050 Trust Plus 1659 08/15/2011 0.87 0.07 0.77 11.74 7.90 9.70 — 11.14
Target Retirement 2055 Trust Plus 1660 11/30/2011 0.87 0.08 0.77 11.76 7.88 9.68 — 11.49
Target Retirement 2060 Trust Plus 1695 03/23/2012 0.87 0.08 0.79 11.77 7.89 9.69 — 10.32
Target Retirement 2065 Trust Plus 1796 07/24/2017 0.88 0.13 0.88 — — — — 13.20
Target Retirement Income Trust Plus 1661 08/15/2011 0.55 0.45 -0.07 4.12 3.80 4.54 — 5.16
Target Retirement 2015 Trust Select 1675 06/30/2015 0.64 0.38 0.09 5.79 — — — 5.41
Target Retirement 2020 Trust Select 1676 06/30/2015 0.71 0.31 0.25 7.33 — — — 6.42
Target Retirement 2025 Trust Select 1677 06/30/2015 0.75 0.25 0.33 8.42 — — — 7.07
Target Retirement 2030 Trust Select 1678 06/30/2015 0.77 0.19 0.47 9.35 — — — 7.59
Target Retirement 2035 Trust Select 1679 06/30/2015 0.84 0.16 0.60 10.35 — — — 8.14
Target Retirement 2040 Trust Select 1680 06/30/2015 0.86 0.11 0.70 11.31 — — — 8.62
Target Retirement 2045 Trust Select 1681 06/30/2015 0.88 0.08 0.77 11.78 — — — 8.90
Target Retirement 2050 Trust Select 1682 06/30/2015 0.88 0.08 0.77 11.78 — — — 8.88
Target Retirement 2055 Trust Select 1683 06/30/2015 0.88 0.08 0.77 11.76 — — — 8.87
Target Retirement 2060 Trust Select 1685 06/30/2015 0.88 0.11 0.80 11.78 — — — 8.88
Target Retirement 2065 Trust Select 1795 07/24/2017 0.84 0.09 0.84 — — — — 13.17
Target Retirement Income Trust Select 1686 06/30/2015 0.56 0.44 -0.06 4.12 — — — 4.35
Total Stock Market Index Trust 125 06/30/2000 2.83 1.15 2.58 15.13 10.73 12.83 9.39 6.22
18
3 7-day yield for money market funds (as of May 31, 2018). The money market yields listed more closely reflect the current earnings of the fund or portfolio than do the average annual total returns shown.
Vanguard Total Returns | May 31, 2018
Average Annual Total Returns*for Periods Ended May 31, 2018
Vanguard Fund NameFund
No.Inception
Date Month QuarterYear
to Date 1 Year 3 Years 5 Years 10 YearsSince
Inception**7-Day
SEC Yield3
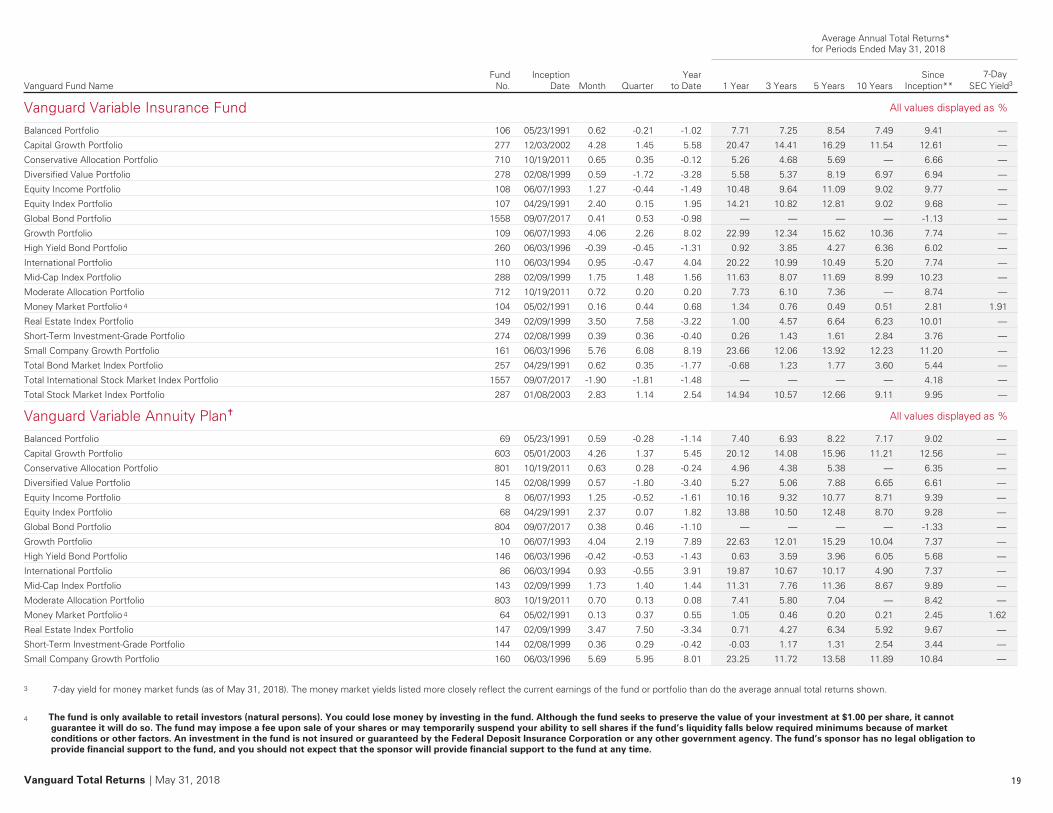
Vanguard Variable Insurance Fund All values displayed as %
Balanced Portfolio 106 05/23/1991 0.62 -0.21 -1.02 7.71 7.25 8.54 7.49 9.41 —
Capital Growth Portfolio 277 12/03/2002 4.28 1.45 5.58 20.47 14.41 16.29 11.54 12.61 —
Conservative Allocation Portfolio 710 10/19/2011 0.65 0.35 -0.12 5.26 4.68 5.69 — 6.66 —
Diversified Value Portfolio 278 02/08/1999 0.59 -1.72 -3.28 5.58 5.37 8.19 6.97 6.94 —
Equity Income Portfolio 108 06/07/1993 1.27 -0.44 -1.49 10.48 9.64 11.09 9.02 9.77 —
Equity Index Portfolio 107 04/29/1991 2.40 0.15 1.95 14.21 10.82 12.81 9.02 9.68 —
Global Bond Portfolio 1558 09/07/2017 0.41 0.53 -0.98 — — — — -1.13 —
Growth Portfolio 109 06/07/1993 4.06 2.26 8.02 22.99 12.34 15.62 10.36 7.74 —
High Yield Bond Portfolio 260 06/03/1996 -0.39 -0.45 -1.31 0.92 3.85 4.27 6.36 6.02 —
International Portfolio 110 06/03/1994 0.95 -0.47 4.04 20.22 10.99 10.49 5.20 7.74 —
Mid-Cap Index Portfolio 288 02/09/1999 1.75 1.48 1.56 11.63 8.07 11.69 8.99 10.23 —
Moderate Allocation Portfolio 712 10/19/2011 0.72 0.20 0.20 7.73 6.10 7.36 — 8.74 —
Money Market Portfolio 4 104 05/02/1991 0.16 0.44 0.68 1.34 0.76 0.49 0.51 2.81 1.91
Real Estate Index Portfolio 349 02/09/1999 3.50 7.58 -3.22 1.00 4.57 6.64 6.23 10.01 —
Short-Term Investment-Grade Portfolio 274 02/08/1999 0.39 0.36 -0.40 0.26 1.43 1.61 2.84 3.76 —
Small Company Growth Portfolio 161 06/03/1996 5.76 6.08 8.19 23.66 12.06 13.92 12.23 11.20 —
Total Bond Market Index Portfolio 257 04/29/1991 0.62 0.35 -1.77 -0.68 1.23 1.77 3.60 5.44 —
Total International Stock Market Index Portfolio 1557 09/07/2017 -1.90 -1.81 -1.48 — — — — 4.18 —
Total Stock Market Index Portfolio 287 01/08/2003 2.83 1.14 2.54 14.94 10.57 12.66 9.11 9.95 —
Vanguard Variable Annuity Plan… All values displayed as %
Balanced Portfolio 69 05/23/1991 0.59 -0.28 -1.14 7.40 6.93 8.22 7.17 9.02 —
Capital Growth Portfolio 603 05/01/2003 4.26 1.37 5.45 20.12 14.08 15.96 11.21 12.56 —
Conservative Allocation Portfolio 801 10/19/2011 0.63 0.28 -0.24 4.96 4.38 5.38 — 6.35 —
Diversified Value Portfolio 145 02/08/1999 0.57 -1.80 -3.40 5.27 5.06 7.88 6.65 6.61 —
Equity Income Portfolio 8 06/07/1993 1.25 -0.52 -1.61 10.16 9.32 10.77 8.71 9.39 —
Equity Index Portfolio 68 04/29/1991 2.37 0.07 1.82 13.88 10.50 12.48 8.70 9.28 —
Global Bond Portfolio 804 09/07/2017 0.38 0.46 -1.10 — — — — -1.33 —
Growth Portfolio 10 06/07/1993 4.04 2.19 7.89 22.63 12.01 15.29 10.04 7.37 —
High Yield Bond Portfolio 146 06/03/1996 -0.42 -0.53 -1.43 0.63 3.59 3.96 6.05 5.68 —
International Portfolio 86 06/03/1994 0.93 -0.55 3.91 19.87 10.67 10.17 4.90 7.37 —
Mid-Cap Index Portfolio 143 02/09/1999 1.73 1.40 1.44 11.31 7.76 11.36 8.67 9.89 —
Moderate Allocation Portfolio 803 10/19/2011 0.70 0.13 0.08 7.41 5.80 7.04 — 8.42 —
Money Market Portfolio 4 64 05/02/1991 0.13 0.37 0.55 1.05 0.46 0.20 0.21 2.45 1.62
Real Estate Index Portfolio 147 02/09/1999 3.47 7.50 -3.34 0.71 4.27 6.34 5.92 9.67 —
Short-Term Investment-Grade Portfolio 144 02/08/1999 0.36 0.29 -0.42 -0.03 1.17 1.31 2.54 3.44 —
Small Company Growth Portfolio 160 06/03/1996 5.69 5.95 8.01 23.25 11.72 13.58 11.89 10.84 —
19
The fund is only available to retail investors (natural persons). You could lose money by investing in the fund. Although the fund seeks to preserve the value of your investment at $1.00 per share, it cannot guarantee it will do so. The fund may impose a fee upon sale of your shares or may temporarily suspend your ability to sell shares if the fund’s liquidity falls below required minimums because of market conditions or other factors. An investment in the fund is not insured or guaranteed by the Federal Deposit Insurance Corporation or any other government agency. The fund’s sponsor has no legal obligation to provide financial support to the fund, and you should not expect that the sponsor will provide financial support to the fund at any time.
4
Vanguard Total Returns | May 31, 2018
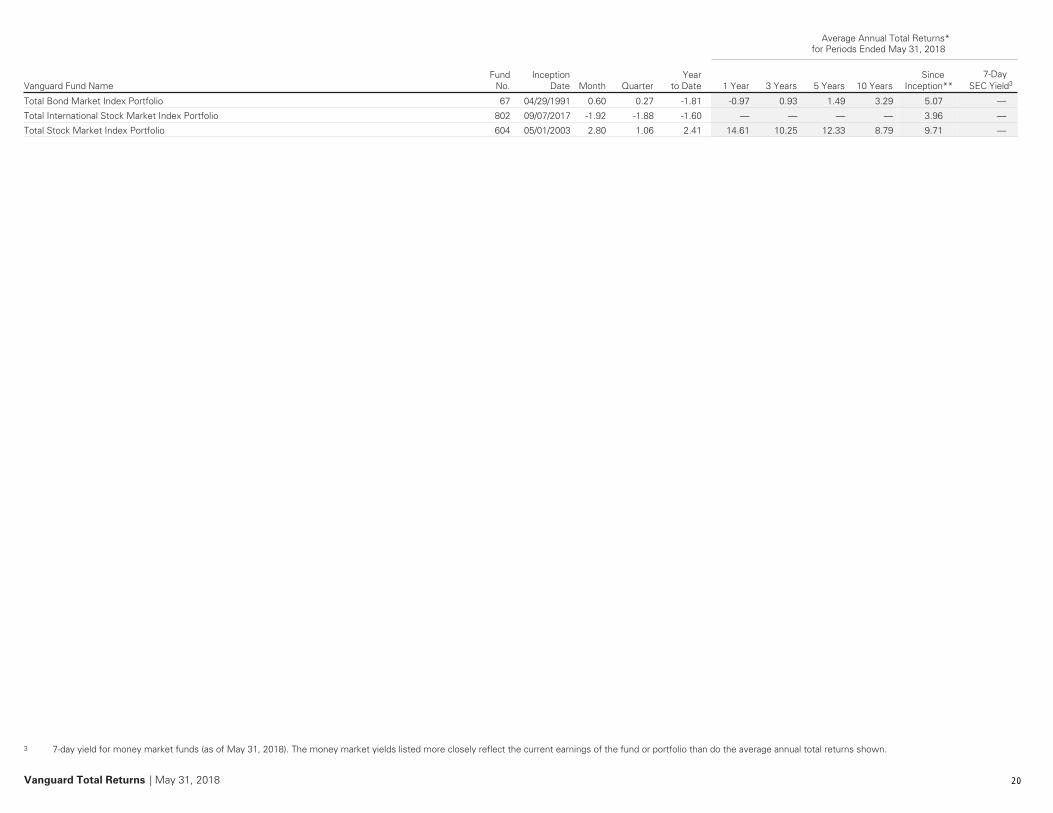
3 7-day yield for money market funds (as of May 31, 2018). The money market yields listed more closely reflect the current earnings of the fund or portfolio than do the average annual total returns shown.
Average Annual Total Returns*for Periods Ended May 31, 2018
Vanguard Fund NameFund
No.Inception
Date Month QuarterYear
to Date 1 Year 3 Years 5 Years 10 YearsSince
Inception**7-Day
SEC Yield3
Total Bond Market Index Portfolio 67 04/29/1991 0.60 0.27 -1.81 -0.97 0.93 1.49 3.29 5.07 —
Total International Stock Market Index Portfolio 802 09/07/2017 -1.92 -1.88 -1.60 — — — — 3.96 —
Total Stock Market Index Portfolio 604 05/01/2003 2.80 1.06 2.41 14.61 10.25 12.33 8.79 9.71 —
20

Standardized Returns. In accordance with SEC regulations, the returns presented on pages 21 through 41 are as of the most recent calendar quarter and take into account fees that may apply to certain Vanguard funds.These fees are detailed in the table below. For some funds, fees are levied on purchases or redemptions to offset the costs of buying and selling portfolio securities. For others, fees are assessed on redemptions made within certaintime periods after a purchase to discourage short-term trading. All purchase or redemption fees are paid directly to the fund to compensate long-term shareholders for the costs of trading activity. Note that one-year performance figuresare not fee-adjusted for fees incurred on shares held less than one year. In addition, Vanguard funds apply a $20 annual account service fee, which is not reflected in the figures, to all funds with balances below $10,000 inmany types of accounts. If these fees were included, performance would be lower.
Fee CodesR1—0.25% purchase fee and 0.25% redemption fee.R2—0.75% purchase fee.R3—0.50% purchase fee.R4—0.25% purchase fee.R5—1.00% purchase fee.
Vanguard Total Returns | May 31, 2018
Standardized Average Annual Total Returns*for Periods Ended March 31, 2018
Vanguard Fund NameFund
No.Ticker
SymbolInception
Date FeesExpense
Ratio 1 Year 3 Years 5 Years 10 YearsSince
Inception**
Stock Funds All values displayed as %
500 Index Fund Investor Shares
40 VFINX 08/31/1976 — 0.14 13.84 10.63 13.14 9.37 11.02
500 Index Fund Admiral™ Shares 540 VFIAX 11/13/2000 — 0.04 13.95 10.75 13.27 9.49 5.98500 Index Fund Institutional Select Shares
1940 VFFSX 06/24/2016 — 0.01 13.99 — — — 18.20
S&P 500 ETF 968 VOO 09/07/2010 — 0.04
Return based on Net Asset Value 13.94 10.74 13.26 — 14.74
Return based on Market Price 14.00 10.74 13.28 — 14.75
Capital Opportunity Fund Investor Shares ¯¯ 111 VHCOX 08/14/1995 — 0.44 21.14 12.64 16.81 11.90 12.64
Capital Opportunity Fund Admiral™ Shares ̄ ¯ 5111 VHCAX 11/12/2001 — 0.37 21.22 12.72 16.89 11.98 11.26
Capital Value Fund
328 VCVLX 12/17/2001 — 0.27 6.39 1.94 8.24 8.80 6.34
Consumer Discretionary Index Fund Admiral™ Shares 5483 VCDAX 07/14/2005 — 0.10 15.96 10.67 14.84 14.02 10.11
Consumer Discretionary ETF 954 VCR 01/26/2004 — 0.10
Return based on Net Asset Value 15.95 10.66 14.83 14.02 9.76
Return based on Market Price 16.03 10.66 14.84 14.04 9.76
Consumer Staples Index Fund Admiral™ Shares 5484 VCSAX 01/30/2004 — 0.10 -0.93 5.10 8.82 9.71 9.58
Consumer Staples ETF 955 VDC 01/26/2004 — 0.10
Return based on Net Asset Value -0.91 5.11 8.81 9.71 9.55
Return based on Market Price -0.86 5.11 8.82 9.72 9.55
Developed Markets Index Fund Investor Shares
1397 VDVIX 12/19/2013 — 0.17 15.83 6.48 — — 5.17
Developed Markets Index Fund Admiral™ Shares 127 VTMGX 08/17/1999 — 0.07 15.95 6.60 7.10 3.12 4.44
Developed Markets Index Fund Institutional Shares 137 VTMNX 01/04/2001 — 0.06 16.03 6.62 7.13 3.17 4.70
Developed Markets Index Fund Institutional Plus Shares 1457 VDIPX 04/01/2014 — 0.05 15.98 6.63 — — 4.53
Diversified Equity Fund
608 VDEQX 06/10/2005 — 0.36†† 16.32 9.48 12.95 9.65 8.43
Dividend Appreciation Index Fund Investor Shares
602 VDAIX 04/27/2006 — 0.15 14.50 10.00 11.20 8.91 8.18
Dividend Appreciation Index Fund Admiral™ Shares 5702 VDADX 12/19/2013 — 0.08 14.58 10.11 — — 9.93
Dividend Appreciation ETF 920 VIG 04/21/2006 — 0.08
Return based on Net Asset Value 14.56 10.11 11.30 9.02 8.31
Return based on Market Price 14.57 10.09 11.30 9.03 8.31
Dividend Growth Fund ¯ 57 VDIGX 05/15/1992 — 0.26 11.53 8.91 11.54 9.54 8.42
21

Vanguard Total Returns | May 31, 2018
Standardized Average Annual Total Returns*for Periods Ended March 31, 2018
Vanguard Fund NameFund
No.Ticker
SymbolInception
Date FeesExpense
Ratio 1 Year 3 Years 5 Years 10 YearsSince
Inception**
Emerging Markets Stock Index Fund Investor Shares
533 VEIEX 05/04/1994 — 0.32 20.72 7.30 4.28 2.46 6.91
Emerging Markets Stock Index Fund Admiral™ Shares 5533 VEMAX 06/23/2006 — 0.14 20.97 7.49 4.47 2.62 6.49
Emerging Markets Stock Index Fund Institutional Shares 239 VEMIX 06/22/2000 — 0.11 20.97 7.53 4.50 2.67 8.20
Emerging Markets Index Fund Institutional Plus Shares 1865 VEMRX 12/15/2010 — 0.09 21.01 7.55 4.52 — 2.71
FTSE Emerging Markets ETF 964 VWO 03/04/2005 — 0.14
Return based on Net Asset Value 20.95 7.51 4.47 2.62 7.40
Return based on Market Price 21.20 7.60 4.64 2.64 7.43
Emerging Markets Select Stock Fund
752 VMMSX 06/27/2011 — 0.92 21.68 9.87 4.94 — 3.76
Energy Fund Investor Shares
51 VGENX 05/23/1984 — 0.38 4.88 2.24 0.16 0.22 10.54
Energy Fund Admiral™ Shares 551 VGELX 11/12/2001 — 0.30 4.97 2.32 0.23 0.29 9.33
Energy Index Fund Admiral™ Shares 5480 VENAX 10/07/2004 — 0.10 -1.40 -2.42 -1.44 0.67 6.25
Energy ETF 951 VDE 09/23/2004 — 0.10
Return based on Net Asset Value -1.43 -2.42 -1.45 0.67 6.68
Return based on Market Price -1.41 -2.44 -1.45 0.67 6.68
Equity Income Fund Investor Shares
65 VEIPX 03/21/1988 — 0.26 10.37 10.09 11.65 9.29 10.25
Equity Income Fund Admiral™ Shares 565 VEIRX 08/13/2001 — 0.17 10.43 10.19 11.75 9.40 7.98
European Stock Index Fund Investor Shares
79 VEURX 06/18/1990 — 0.26 15.99 5.41 6.78 2.38 7.31
European Stock Index Fund Admiral™ Shares 579 VEUSX 08/13/2001 — 0.10 16.19 5.59 6.94 2.52 5.95
European Stock Index Fund Institutional Shares 235 VESIX 05/15/2000 — 0.08 16.23 5.61 6.96 2.55 4.24
European Stock Index Fund Institutional Plus Shares 1863 VEUPX 12/05/2014 — 0.07 16.28 5.64 — — 4.87
FTSE Europe ETF 963 VGK 03/04/2005 — 0.10
Return based on Net Asset Value 16.19 5.60 6.95 2.53 4.92
Return based on Market Price 16.00 5.56 6.97 2.46 4.90
Explorer™ Fund Investor Shares
24 VEXPX 12/11/1967 — 0.44 20.61 8.98 12.89 10.62 9.38
Explorer™ Fund Admiral™ Shares 5024 VEXRX 11/12/2001 — 0.32 20.76 9.12 13.04 10.79 9.34
Explorer Value™ Fund
1690 VEVFX 03/30/2010 — 0.55 11.68 8.31 10.94 — 12.70
Extended Market Index Fund Investor Shares
98 VEXMX 12/21/1987 — 0.21 12.97 7.92 11.71 10.25 10.87
Extended Market Index Fund Admiral™ Shares 598 VEXAX 11/13/2000 — 0.08 13.13 8.06 11.86 10.41 8.16
Extended Market Index Fund Institutional Shares 856 VIEIX 07/07/1997 — 0.06 13.14 8.08 11.88 10.44 8.81
Extended Market Index Fund Institutional Plus Shares 1860 VEMPX 01/14/2011 — 0.05 13.15 8.10 11.90 — 11.52Extended Market Index Fund Institutional Select Shares
1898 VSEMX 06/27/2016 — 0.02 13.19 — — — 21.99
Extended Market ETF 965 VXF 12/27/2001 — 0.08
Return based on Net Asset Value 13.11 8.07 11.86 10.41 9.69
Return based on Market Price 13.17 8.06 11.85 10.41 9.69
Financials Index Fund Admiral™ Shares 5486 VFAIX 02/04/2004 — 0.10 16.79 14.26 14.93 6.38 4.55
Financials ETF 957 VFH 01/26/2004 — 0.10
Return based on Net Asset Value 16.78 14.26 14.93 6.39 4.43
Return based on Market Price 16.96 14.29 14.95 6.41 4.44
FTSE All-World ex-US Index Fund Investor Shares
770 VFWIX 03/08/2007 — 0.23 16.67 6.57 6.18 2.85 3.12
FTSE All-World ex-US Index Fund Admiral™ 570 VFWAX 09/27/2011 — 0.11 16.80 6.70 6.33 — 8.24
FTSE All-World ex-US Index Fund Institutional Shares 881 VFWSX 04/30/2007 — 0.10 16.79 6.71 6.34 3.04 2.70
22

Vanguard Total Returns | May 31, 2018
Standardized Average Annual Total Returns*for Periods Ended March 31, 2018
Vanguard Fund NameFund
No.Ticker
SymbolInception
Date FeesExpense
Ratio 1 Year 3 Years 5 Years 10 YearsSince
Inception**
FTSE All-World ex-US Index Fund Institutional Plus Shares 1866 VFWPX 12/16/2010 — 0.07 16.83 6.74 6.37 — 5.20
FTSE All-World ex-US ETF 991 VEU 03/02/2007 — 0.11
Return based on Net Asset Value 16.78 6.70 6.33 3.00 3.45
Return based on Market Price 16.88 6.74 6.35 2.97 3.47
FTSE All-World ex-US Small-Cap Index Fund Investor Shares
1684 VFSVX 04/02/2009 — 0.25 19.48 9.27 7.61 — 12.40
FTSE All-World ex-US Small-Cap Index Fund Institutional Shares 884 VFSNX 04/02/2009 — 0.12 19.61 9.42 7.79 — 12.63
FTSE All-World ex-US Small-Cap ETF 3184 VSS 04/02/2009 — 0.13
Return based on Net Asset Value 19.60 9.41 7.78 — 12.61
Return based on Market Price 19.57 9.34 7.73 — 12.65
FTSE Developed Markets ETF 936 VEA 07/20/2007 — 0.07
Return based on Net Asset Value 15.96 6.60 7.11 3.14 1.90
Return based on Market Price 15.95 6.62 7.12 3.09 1.90
FTSE Social Index Fund Investor Shares
213 VFTSX 05/31/2000 — 0.20 15.01 10.53 14.21 9.92 4.47
FTSE Social Index Fund Institutional Shares 223 VFTNX 01/14/2003 — 0.12 15.08 10.62 14.33 10.04 8.60
Global Equity Fund
129 VHGEX 08/14/1995 — 0.48 19.37 9.55 10.89 6.23 9.06
Global ex-U.S. Real Estate Index Fund Investor Shares
738 VGXRX 11/01/2010 R1 0.34 18.10 6.43 4.95 — 6.52
Global ex-U.S. Real Estate Index Fund Admiral™ Shares 1758 VGRLX 02/10/2011 R1 0.14 18.34 6.66 5.14 — 7.02
Global ex-U.S. Real Estate Index Fund Institutional Shares 1858 VGRNX 04/19/2011 R1 0.12 18.36 6.67 5.16 — 6.88
Global ex-U.S. Real Estate ETF 3358 VNQI 11/01/2010 — 0.14
Return based on Net Asset Value 18.91 6.82 5.22 — 6.74
Return based on Market Price 19.04 6.79 5.16 — 6.73
Global Minimum Volatility Fund Investor Shares ‡‡ 1194 VMVFX 12/12/2013 — 0.25 9.40 7.84 — — 10.74
Global Minimum Volatility Fund Admiral™ Shares ‡‡ 594 VMNVX 12/12/2013 — 0.17 9.53 7.94 — — 10.83
Growth and Income Fund Investor Shares
93 VQNPX 12/10/1986 — 0.34 13.82 10.44 13.34 9.06 10.17
Growth and Income Fund Admiral™ Shares 593 VGIAX 05/14/2001 — 0.23 13.95 10.57 13.47 9.19 6.46
Growth Index Fund Investor Shares
9 VIGRX 11/02/1992 — 0.17 17.84 10.94 14.15 10.64 9.59
Growth Index Fund Admiral™ Shares 509 VIGAX 11/13/2000 — 0.05 17.98 11.07 14.30 10.79 5.88
Growth Index Fund Institutional Shares 868 VIGIX 05/14/1998 — 0.04 17.99 11.09 14.31 10.82 6.60
Growth ETF 967 VUG 01/26/2004 — 0.05
Return based on Net Asset Value 17.99 11.08 14.31 10.80 8.86
Return based on Market Price 18.05 11.08 14.32 10.81 8.87
Health Care Fund Investor Shares
52 VGHCX 05/23/1984 — 0.38 8.39 3.88 14.60 12.94 16.34
Health Care Fund Admiral™ Shares 552 VGHAX 11/12/2001 — 0.33 8.44 3.93 14.65 13.00 10.57
Health Care Index Fund Admiral™ Shares 5485 VHCIX 02/05/2004 — 0.10 12.71 5.74 14.56 12.84 9.61
Health Care ETF 956 VHT 01/26/2004 — 0.10
Return based on Net Asset Value 12.71 5.74 14.55 12.84 9.62
Return based on Market Price 12.90 5.78 14.58 12.87 9.63
High Dividend Yield Index Fund Investor Shares
623 VHDYX 11/16/2006 — 0.15 9.40 9.90 11.79 9.01 7.56
High Dividend Yield ETF 923 VYM 11/10/2006 — 0.08
Return based on Net Asset Value 9.46 9.97 11.86 9.12 7.74
Return based on Market Price 9.50 9.97 11.87 9.13 7.74
23

Vanguard Total Returns | May 31, 2018
Standardized Average Annual Total Returns*for Periods Ended March 31, 2018
Vanguard Fund NameFund
No.Ticker
SymbolInception
Date FeesExpense
Ratio 1 Year 3 Years 5 Years 10 YearsSince
Inception**
Industrials Index Fund Admiral™ Shares 5482 VINAX 05/08/2006 — 0.10 14.29 11.27 13.72 9.18 8.26
Industrials ETF 953 VIS 09/23/2004 — 0.10
Return based on Net Asset Value 14.30 11.27 13.71 9.18 9.83
Return based on Market Price 14.33 11.27 13.71 9.19 9.83
Information Technology Index Fund Admiral™ Shares 5487 VITAX 03/25/2004 — 0.10 27.51 18.83 20.11 14.03 10.83
Information Technology ETF 958 VGT 01/26/2004 — 0.10
Return based on Net Asset Value 27.50 18.82 20.10 14.03 9.87
Return based on Market Price 27.48 18.81 20.10 14.03 9.87
Institutional Index Fund Institutional Shares 94 VINIX 07/31/1990 — 0.035 13.96 10.75 13.28 9.50 9.81
Institutional Index Fund Institutional Plus Shares 854 VIIIX 07/07/1997 — 0.02 13.97 10.77 13.30 9.52 7.30
Institutional Total Stock Market Index Fund Institutional Shares 870 VITNX 08/31/2001 — 0.035 13.84 10.23 13.06 9.78 8.02
Institutional Total Stock Market Index Fund Institutional Plus Shares 871 VITPX 05/31/2001 — 0.02 13.86 10.25 13.08 9.81 7.31
International Dividend Appreciation Index Fund Investor Shares
2015 VIAIX 02/25/2016 R1 0.35 13.27 — — — 14.06
International Dividend Appreciation Index Fund Admiral™ Shares 515 VIAAX 03/02/2016 R1 0.25 13.42 — — — 12.74
International Dividend Appreciation ETF 4415 VIGI 02/25/2016 — 0.25
Return based on Net Asset Value 13.95 — — — 14.44
Return based on Market Price 14.10 — — — 14.64
International Explorer™ Fund
126 VINEX 11/04/1996 — 0.38 26.53 11.54 12.07 6.47 10.07
International Growth Fund Investor Shares
81 VWIGX 09/30/1981 — 0.45 31.18 12.28 10.94 5.93 10.83
International Growth Fund Admiral™ Shares 581 VWILX 08/13/2001 — 0.32 31.37 12.43 11.08 6.08 7.95
International High Dividend Yield Index Fund Investor Shares
1530 VIHIX 02/25/2016 R1 0.42 12.22 — — — 17.26
International High Dividend Yield Index Fund Admiral™ Shares 530 VIHAX 03/02/2016 R1 0.32 12.33 — — — 15.70
International High Dividend Yield ETF 4430 VYMI 02/25/2016 — 0.32
Return based on Net Asset Value 12.85 — — — 17.65
Return based on Market Price 12.98 — — — 17.95
International Value Fund
46 VTRIX 05/16/1983 — 0.40 17.67 6.05 6.76 2.86 8.99
Large-Cap Index Fund Investor Shares
307 VLACX 01/30/2004 — 0.17 14.02 10.39 13.04 9.44 8.49
Large-Cap Index Fund Admiral™ Shares 5307 VLCAX 02/02/2004 — 0.05 14.13 10.51 13.18 9.58 8.60
Large-Cap Index Fund Institutional Shares 807 VLISX 06/30/2005 — 0.04 14.15 10.53 13.19 9.60 8.89
Large-Cap ETF 961 VV 01/27/2004 — 0.05
Return based on Net Asset Value 14.15 10.53 13.19 9.58 8.54
Return based on Market Price 14.23 10.53 13.21 9.60 8.54
Market Neutral Fund Investor Shares ‡ 634 VMNFX 11/11/1998 — 1.54 -1.05 1.40 2.80 0.34 2.71
Market Neutral Fund Institutional Shares ‡ 734 VMNIX 10/19/1998 — 1.46 -0.97 1.49 2.89 0.41 2.91
Materials Index Fund Admiral™ Shares 5481 VMIAX 02/11/2004 — 0.10 10.13 8.10 9.91 6.45 8.80
Materials ETF 952 VAW 01/26/2004 — 0.10
Return based on Net Asset Value 10.13 8.11 9.91 6.45 9.07
Return based on Market Price 10.17 8.12 9.90 6.45 9.07
Mega Cap Index Fund Institutional Shares 828 VMCTX 02/22/2008 — 0.06 14.49 11.09 13.38 9.47 9.18
24

Vanguard Total Returns | May 31, 2018
Standardized Average Annual Total Returns*for Periods Ended March 31, 2018
Vanguard Fund NameFund
No.Ticker
SymbolInception
Date FeesExpense
Ratio 1 Year 3 Years 5 Years 10 YearsSince
Inception**
Mega Cap ETF 3137 MGC 12/17/2007 — 0.07
Return based on Net Asset Value 14.49 11.07 13.36 9.45 8.31
Return based on Market Price 14.57 11.07 13.37 9.46 8.32
Mega Cap Growth Index Fund Institutional Shares 838 VMGAX 04/03/2008 — 0.06 18.81 12.03 14.92 — 10.78
Mega Cap Growth ETF 3138 MGK 12/17/2007 — 0.07
Return based on Net Asset Value 18.80 12.02 14.91 11.06 9.89
Return based on Market Price 18.86 12.01 14.92 11.07 9.90
Mega Cap Value Index Fund Institutional Shares 839 VMVLX 03/05/2008 — 0.06 10.71 10.22 12.11 7.96 7.90
Mega Cap Value ETF 3139 MGV 12/17/2007 — 0.07
Return based on Net Asset Value 10.71 10.21 12.09 7.94 6.82
Return based on Market Price 10.81 10.22 12.12 7.96 6.84
Mid-Cap Growth Fund
301 VMGRX 12/31/1997 — 0.36 19.64 6.13 11.27 9.93 10.21
Mid-Cap Growth Index Fund Investor Shares
832 VMGIX 08/24/2006 — 0.19 15.44 7.13 11.68 9.26 8.97
Mid-Cap Growth Index Fund Admiral™ 5832 VMGMX 09/27/2011 — 0.07 15.58 7.26 11.82 — 14.01
Mid-Cap Growth ETF 932 VOT 08/17/2006 — 0.07
Return based on Net Asset Value 15.58 7.26 11.82 9.41 8.96
Return based on Market Price 15.65 7.27 11.85 9.42 8.97
Mid-Cap Index Fund Investor Shares
859 VIMSX 05/21/1998 — 0.17 12.19 7.75 12.11 9.99 9.84
Mid-Cap Index Fund Admiral™ Shares 5859 VIMAX 11/12/2001 — 0.05 12.31 7.86 12.26 10.14 10.09
Mid-Cap Index Fund Institutional Shares 864 VMCIX 05/21/1998 — 0.04 12.34 7.88 12.27 10.16 10.01
Mid-Cap Index Fund Institutional Plus Shares 1859 VMCPX 12/15/2010 — 0.03 12.35 7.89 12.28 — 12.39
Mid-Cap ETF 939 VO 01/26/2004 — 0.05
Return based on Net Asset Value 12.33 7.87 12.26 10.14 9.72
Return based on Market Price 12.38 7.87 12.26 10.15 9.72
Mid-Cap Value Index Fund Investor Shares
835 VMVIX 08/24/2006 — 0.19 9.39 8.26 12.24 10.48 8.86
Mid-Cap Value Index Fund Admiral™ 5835 VMVAX 09/27/2011 — 0.07 9.53 8.40 12.39 — 15.82
Mid-Cap Value ETF 935 VOE 08/17/2006 — 0.07
Return based on Net Asset Value 9.54 8.41 12.39 10.63 8.94
Return based on Market Price 9.57 8.40 12.40 10.64 8.94
Morgan™ Growth Fund Investor Shares
26 VMRGX 12/31/1968 — 0.38 22.53 12.19 15.16 10.17 10.49
Morgan™ Growth Fund Admiral™ Shares 526 VMRAX 05/14/2001 — 0.28 22.63 12.30 15.28 10.32 7.39
Pacific Stock Index Fund Investor Shares
72 VPACX 06/18/1990 — 0.26 18.53 8.68 7.35 4.44 2.96
Pacific Stock Index Fund Admiral™ Shares 572 VPADX 08/13/2001 — 0.10 18.71 8.83 7.50 4.59 6.10
Pacific Stock Index Fund Institutional Shares 237 VPKIX 05/15/2000 — 0.08 18.71 8.84 7.51 4.62 3.61
Pacific Stock Index Fund Institutional Plus Shares 1864 VPAPX 12/13/2010 — 0.07 — — — — —
FTSE Pacific ETF 962 VPL 03/04/2005 — 0.10
Return based on Net Asset Value 18.70 8.83 7.50 4.59 5.57
Return based on Market Price 18.46 8.78 7.41 4.61 5.57
Precious Metals and Mining Fund
53 VGPMX 05/23/1984 — 0.36 -6.68 4.43 -5.71 -8.26 4.17
PRIMECAP Core Fund ¯¯ 1220 VPCCX 12/09/2004 — 0.46 17.27 11.95 15.44 11.86 10.84
PRIMECAP Fund Investor Shares ¯¯ 59 VPMCX 11/01/1984 — 0.39 21.56 13.46 16.76 11.93 13.80
25
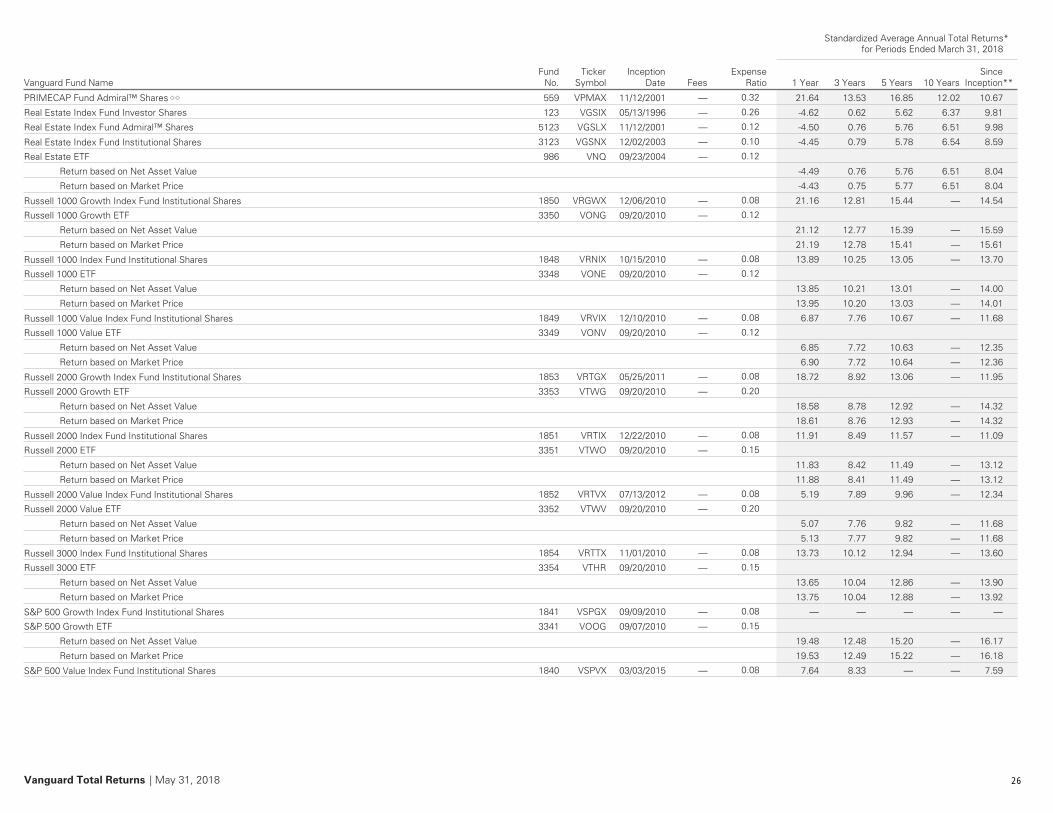
Vanguard Total Returns | May 31, 2018
Standardized Average Annual Total Returns*for Periods Ended March 31, 2018
Vanguard Fund NameFund
No.Ticker
SymbolInception
Date FeesExpense
Ratio 1 Year 3 Years 5 Years 10 YearsSince
Inception**
PRIMECAP Fund Admiral™ Shares ̄ ¯ 559 VPMAX 11/12/2001 — 0.32 21.64 13.53 16.85 12.02 10.67
Real Estate Index Fund Investor Shares
123 VGSIX 05/13/1996 — 0.26 -4.62 0.62 5.62 6.37 9.81
Real Estate Index Fund Admiral™ Shares 5123 VGSLX 11/12/2001 — 0.12 -4.50 0.76 5.76 6.51 9.98
Real Estate Index Fund Institutional Shares 3123 VGSNX 12/02/2003 — 0.10 -4.45 0.79 5.78 6.54 8.59
Real Estate ETF 986 VNQ 09/23/2004 — 0.12
Return based on Net Asset Value -4.49 0.76 5.76 6.51 8.04
Return based on Market Price -4.43 0.75 5.77 6.51 8.04
Russell 1000 Growth Index Fund Institutional Shares 1850 VRGWX 12/06/2010 — 0.08 21.16 12.81 15.44 — 14.54
Russell 1000 Growth ETF 3350 VONG 09/20/2010 — 0.12
Return based on Net Asset Value 21.12 12.77 15.39 — 15.59
Return based on Market Price 21.19 12.78 15.41 — 15.61
Russell 1000 Index Fund Institutional Shares 1848 VRNIX 10/15/2010 — 0.08 13.89 10.25 13.05 — 13.70
Russell 1000 ETF 3348 VONE 09/20/2010 — 0.12
Return based on Net Asset Value 13.85 10.21 13.01 — 14.00
Return based on Market Price 13.95 10.20 13.03 — 14.01
Russell 1000 Value Index Fund Institutional Shares 1849 VRVIX 12/10/2010 — 0.08 6.87 7.76 10.67 — 11.68
Russell 1000 Value ETF 3349 VONV 09/20/2010 — 0.12
Return based on Net Asset Value 6.85 7.72 10.63 — 12.35
Return based on Market Price 6.90 7.72 10.64 — 12.36
Russell 2000 Growth Index Fund Institutional Shares 1853 VRTGX 05/25/2011 — 0.08 18.72 8.92 13.06 — 11.95
Russell 2000 Growth ETF 3353 VTWG 09/20/2010 — 0.20
Return based on Net Asset Value 18.58 8.78 12.92 — 14.32
Return based on Market Price 18.61 8.76 12.93 — 14.32
Russell 2000 Index Fund Institutional Shares 1851 VRTIX 12/22/2010 — 0.08 11.91 8.49 11.57 — 11.09
Russell 2000 ETF 3351 VTWO 09/20/2010 — 0.15
Return based on Net Asset Value 11.83 8.42 11.49 — 13.12
Return based on Market Price 11.88 8.41 11.49 — 13.12
Russell 2000 Value Index Fund Institutional Shares 1852 VRTVX 07/13/2012 — 0.08 5.19 7.89 9.96 — 12.34
Russell 2000 Value ETF 3352 VTWV 09/20/2010 — 0.20
Return based on Net Asset Value 5.07 7.76 9.82 — 11.68
Return based on Market Price 5.13 7.77 9.82 — 11.68
Russell 3000 Index Fund Institutional Shares 1854 VRTTX 11/01/2010 — 0.08 13.73 10.12 12.94 — 13.60
Russell 3000 ETF 3354 VTHR 09/20/2010 — 0.15
Return based on Net Asset Value 13.65 10.04 12.86 — 13.90
Return based on Market Price 13.75 10.04 12.88 — 13.92
S&P 500 Growth Index Fund Institutional Shares 1841 VSPGX 09/09/2010 — 0.08 — — — — —
S&P 500 Growth ETF 3341 VOOG 09/07/2010 — 0.15
Return based on Net Asset Value 19.48 12.48 15.20 — 16.17
Return based on Market Price 19.53 12.49 15.22 — 16.18
S&P 500 Value Index Fund Institutional Shares 1840 VSPVX 03/03/2015 — 0.08 7.64 8.33 — — 7.59
26

Vanguard Total Returns | May 31, 2018
Standardized Average Annual Total Returns*for Periods Ended March 31, 2018
Vanguard Fund NameFund
No.Ticker
SymbolInception
Date FeesExpense
Ratio 1 Year 3 Years 5 Years 10 YearsSince
Inception**
S&P 500 Value ETF 3340 VOOV 09/07/2010 — 0.15
Return based on Net Asset Value 7.55 8.25 10.72 — 12.82
Return based on Market Price 7.55 8.23 10.73 — 12.83
S&P Mid-Cap 400 Growth Index Fund Institutional Shares 1843 VMFGX 03/28/2011 — 0.08 15.60 9.72 12.56 — 11.90
S&P Mid-Cap 400 Growth ETF 3343 IVOG 09/07/2010 — 0.20
Return based on Net Asset Value 15.47 9.59 12.43 — 14.89
Return based on Market Price 15.59 9.63 12.45 — 14.90
S&P Mid-Cap 400 Index Fund Institutional Shares 1842 VSPMX 03/28/2011 — 0.08 10.91 8.90 11.90 — 11.59
S&P Mid-Cap 400 ETF 3342 IVOO 09/07/2010 — 0.15
Return based on Net Asset Value 10.83 8.82 11.82 — 14.38
Return based on Market Price 10.95 8.85 11.84 — 14.40
S&P Mid-Cap 400 Value Index Fund Institutional Shares 1844 VMFVX 11/02/2010 — 0.08 6.07 7.71 10.95 — 12.59
S&P Mid-Cap 400 Value ETF 3344 IVOV 09/07/2010 — 0.20
Return based on Net Asset Value 5.95 7.59 10.82 — 13.59
Return based on Market Price 6.04 7.60 10.81 — 13.60
S&P Small-Cap 600 Growth Index Fund Institutional Shares 1847 VSGNX 09/09/2010 — 0.08 — — — — —
S&P Small-Cap 600 Growth ETF 3347 VIOG 09/07/2010 — 0.20
Return based on Net Asset Value 14.56 11.27 14.13 — 16.59
Return based on Market Price 14.63 11.26 14.13 — 16.59
S&P Small-Cap 600 Index Fund Institutional Shares 1845 VSMSX 04/01/2011 — 0.08 12.73 10.78 13.54 — 12.56
S&P Small-Cap 600 ETF 3345 VIOO 09/07/2010 — 0.15
Return based on Net Asset Value 12.66 10.72 13.46 — 15.87
Return based on Market Price 12.71 10.71 13.45 — 15.87
S&P Small-Cap 600 Value Index Fund Institutional Shares 1846 VSMVX 11/19/2014 — 0.08 10.57 10.02 — — 10.57
S&P Small-Cap 600 Value ETF 3346 VIOV 09/07/2010 — 0.20
Return based on Net Asset Value 10.43 9.88 12.52 — 15.00
Return based on Market Price 10.55 9.87 12.51 — 15.00
Selected Value Fund
934 VASVX 02/15/1996 — 0.39 8.08 8.10 11.43 10.32 9.10
Small-Cap Growth Index Fund Investor Shares
861 VISGX 05/21/1998 — 0.19 17.25 7.99 11.29 10.82 8.77
Small-Cap Growth Index Fund Admiral™ 5861 VSGAX 09/27/2011 — 0.07 17.39 8.12 11.44 — 14.79
Small-Cap Growth Index Fund Institutional Shares 866 VSGIX 05/24/2000 — 0.06 17.41 8.13 11.45 11.00 9.35
Small-Cap Growth ETF 938 VBK 01/26/2004 — 0.07
Return based on Net Asset Value 17.39 8.12 11.44 10.97 9.37
Return based on Market Price 17.47 8.13 11.44 10.97 9.38
Small-Cap Index Fund Investor Shares
48 NAESX 10/03/1960 — 0.17 11.69 7.93 11.52 10.57 10.69
Small-Cap Index Fund Admiral™ Shares 548 VSMAX 11/13/2000 — 0.05 11.82 8.06 11.66 10.72 9.26
Small-Cap Index Fund Institutional Shares 857 VSCIX 07/07/1997 — 0.04 11.83 8.07 11.67 10.74 9.04
Small-Cap Index Fund Institutional Plus Shares 1861 VSCPX 12/17/2010 — 0.03 11.84 8.08 11.69 — 11.96
Small-Cap ETF 969 VB 01/26/2004 — 0.05
Return based on Net Asset Value 11.82 8.06 11.67 10.72 9.35
Return based on Market Price 11.86 8.06 11.67 10.72 9.35
27

Vanguard Total Returns | May 31, 2018
Standardized Average Annual Total Returns*for Periods Ended March 31, 2018
Vanguard Fund NameFund
No.Ticker
SymbolInception
Date FeesExpense
Ratio 1 Year 3 Years 5 Years 10 YearsSince
Inception**
Small-Cap Value Index Fund
860 VISVX 05/21/1998 — 0.19 7.27 7.85 11.52 10.13 8.72
Small-Cap Value Index Fund Admiral™ 5860 VSIAX 09/27/2011 — 0.07 7.35 7.96 11.66 — 15.61
Small-Cap Value Index Fund Institutional Shares 865 VSIIX 12/07/1999 — 0.06 7.36 7.97 11.67 10.31 10.43
Small-Cap Value ETF 937 VBR 01/26/2004 — 0.07
Return based on Net Asset Value 7.36 7.97 11.66 10.28 9.11
Return based on Market Price 7.44 7.98 11.67 10.28 9.11
Strategic Equity Fund
114 VSEQX 08/14/1995 — 0.18 10.96 8.12 13.46 10.35 10.84
Strategic Small-Cap Equity Fund
615 VSTCX 04/24/2006 — 0.29 8.51 7.13 12.11 10.09 7.54
Tax-Managed Capital Appreciation Fund Admiral™ Shares 5102 VTCLX 09/06/1994 — 0.09 14.67 10.80 13.47 9.78 9.81
Tax-Managed Capital Appreciation Fund Institutional Shares 135 VTCIX 02/24/1999 — 0.06 14.72 10.84 13.52 9.82 6.60
Tax-Managed Small-Cap Fund Admiral™ Shares 116 VTMSX 03/25/1999 — 0.09 12.70 10.50 13.50 11.35 11.06
Tax-Managed Small-Cap Fund Institutional Shares 118 VTSIX 04/21/1999 — 0.06 12.74 10.54 13.54 11.41 10.76
Communication Services Index Fund Admiral™ Shares 5488 VTCAX 03/11/2005 — 0.10 -8.35 2.69 6.13 6.51 6.83
Communication Services ETF 959 VOX 09/23/2004 — 0.10
Return based on Net Asset Value -8.35 2.69 6.12 6.50 7.12
Return based on Market Price -8.29 2.68 6.13 6.51 7.12
Total International Stock Index Fund Investor Shares
113 VGTSX 04/29/1996 — 0.17 16.96 6.84 6.33 2.78 5.05
Total International Stock Index Fund Admiral™ Shares 569 VTIAX 11/29/2010 — 0.11 17.05 6.92 6.41 — 5.87
Total International Stock Index Fund Institutional Shares 1869 VTSNX 11/29/2010 — 0.09 17.08 6.95 6.43 — 5.89
Total International Stock Index Fund Institutional Plus Shares 1870 VTPSX 11/30/2010 — 0.07 17.11 6.97 6.45 — 6.08Total International Stock Index Fund Institutional Select Shares
1969 VTISX 06/24/2016 — 0.045 17.14 — — — 19.81
Total International Stock ETF 3369 VXUS 01/26/2011 — 0.11
Return based on Net Asset Value 17.03 6.92 6.41 — 4.71
Return based on Market Price 17.12 6.94 6.42 — 4.76
Total Stock Market Index Fund Investor Shares
85 VTSMX 04/27/1992 — 0.14 13.74 10.09 12.89 9.62 9.65
Total Stock Market Index Fund Admiral™ Shares 585 VTSAX 11/13/2000 — 0.04 13.85 10.20 13.02 9.74 6.56
Total Stock Market Index Fund Institutional Shares 855 VITSX 07/07/1997 — 0.035 13.85 10.20 13.02 9.75 7.66
Total Stock Market Index Fund Institutional Plus Shares 1871 VSMPX 04/28/2015 — 0.02 13.88 — — — 9.77Total Stock Market Index Fund Institutional Select Shares
1785 VSTSX 06/27/2016 — 0.01 13.88 — — — 19.94
Total Stock Market ETF 970 VTI 05/24/2001 — 0.04
Return based on Net Asset Value 13.87 10.20 13.02 9.74 7.01
Return based on Market Price 13.92 10.20 13.03 9.75 7.02
Total World Stock Index Fund Investor Shares
628 VTWSX 06/26/2008 — 0.19 15.27 8.53 9.55 — 6.35
Total World Stock Index Fund Institutional Shares 826 VTWIX 10/09/2008 — 0.09 15.35 8.64 9.66 — 11.37
Total World Stock ETF 3141 VT 06/24/2008 — 0.10
Return based on Net Asset Value 15.33 8.63 9.65 — 6.33
Return based on Market Price 15.45 8.64 9.64 — 6.34
U.S. Growth Fund Investor Shares
23 VWUSX 01/06/1959 — 0.43 26.05 12.26 15.61 11.04 10.49
U.S. Growth Fund Admiral™ Shares 523 VWUAX 08/13/2001 — 0.30 26.19 12.41 15.76 11.20 6.17
28

Vanguard Total Returns | May 31, 2018
Standardized Average Annual Total Returns*for Periods Ended March 31, 2018
Vanguard Fund NameFund
No.Ticker
SymbolInception
Date FeesExpense
Ratio 1 Year 3 Years 5 Years 10 YearsSince
Inception**
U.S. Liquidity Factor ETF ‡‡ 4420 VFLQ 02/13/2018 — 0.13
Return based on Net Asset Value — — — — 2.15
Return based on Market Price — — — — 2.19
U.S. Minimum Volatility ETF ‡‡ 4419 VFMV 02/13/2018 — 0.13
Return based on Net Asset Value — — — — 3.41
Return based on Market Price — — — — 3.48
U.S. Momentum Factor ETF ‡‡ 4418 VFMO 02/13/2018 — 0.13
Return based on Net Asset Value — — — — 1.93
Return based on Market Price — — — — 2.01
U.S. Multifactor Fund Admiral™ Shares ‡‡ 516 VFMFX 02/15/2018 — 0.18 — — — — -0.56
U.S. Multifactor ETF ‡‡ 4421 VFMF 02/13/2018 — 0.18
Return based on Net Asset Value — — — — 1.88
Return based on Market Price — — — — 1.99
U.S. Quality Factor ETF ‡‡ 4417 VFQY 02/13/2018 — 0.13
Return based on Net Asset Value — — — — 1.88
Return based on Market Price — — — — 1.95
U.S. Value Fund 124 VUVLX 06/29/2000 — 0.23 7.38 7.82 11.19 8.34 7.44
U.S. Value Factor ETF ‡‡ 4416 VFVA 02/13/2018 — 0.13
Return based on Net Asset Value — — — — 1.20
Return based on Market Price — — — — 1.25
Utilities Index Fund Admiral™ Shares 5489 VUIAX 04/28/2004 — 0.10 2.41 8.43 9.34 7.41 9.69
Utilities ETF 960 VPU 01/26/2004 — 0.10
Return based on Net Asset Value 2.42 8.43 9.34 7.41 9.55
Return based on Market Price 2.43 8.43 9.33 7.42 9.55
Value Index Fund Investor Shares 6 VIVAX 11/02/1992 — 0.17 10.68 9.92 12.06 8.27 9.54
Value Index Fund Admiral™ Shares 506 VVIAX 11/13/2000 — 0.05 10.81 10.06 12.21 8.41 6.42
Value Index Fund Institutional Shares 867 VIVIX 07/02/1998 — 0.04 10.82 10.07 12.22 8.44 6.49
Value ETF 966 VTV 01/26/2004 — 0.05
Return based on Net Asset Value 10.83 10.06 12.21 8.42 8.03
Return based on Market Price 10.92 10.07 12.23 8.44 8.03
Windsor™ Fund Investor Shares 22 VWNDX 10/23/1958 — 0.31 11.99 8.27 11.89 8.99 11.39
Windsor™ Fund Admiral™ Shares 5022 VWNEX 11/12/2001 — 0.21 12.12 8.36 12.00 9.11 7.64
Windsor™ II Fund Investor Shares 73 VWNFX 06/24/1985 — 0.34 8.15 7.58 10.38 8.06 10.66
Windsor™ II Fund Admiral™ Shares 573 VWNAX 05/14/2001 — 0.26 8.25 7.67 10.47 8.15 6.77
Balanced Funds All values displayed as %
Balanced Index Fund Investor Shares 2 VBINX 11/09/1992 — 0.19 8.62 6.51 8.37 7.43 8.14
Balanced Index Fund Admiral™ Shares 502 VBIAX 11/13/2000 — 0.07 8.74 6.65 8.52 7.58 6.13
Balanced Index Fund Institutional Shares 869 VBAIX 12/01/2000 — 0.06 8.75 6.65 8.52 7.60 6.29
Convertible Securities Fund 82 VCVSX 06/17/1986 — 0.35 6.27 2.93 5.60 6.34 8.03
Global Wellesley® Income Fund Investor Shares 1496 VGWIX 11/02/2017 — 0.42 — — — — -0.41
Global Wellesley® Income Fund Admiral™ Shares 1896 VGYAX 11/02/2017 — 0.32 — — — — -0.39
29

Vanguard Total Returns | May 31, 2018
Standardized Average Annual Total Returns*for Periods Ended March 31, 2018
Vanguard Fund NameFund
No.Ticker
SymbolInception
Date FeesExpense
Ratio 1 Year 3 Years 5 Years 10 YearsSince
Inception**
Global Wellington™ Fund Investor Shares 1567 VGWLX 11/02/2017 — 0.45 — — — — 0.88
Global Wellington™ Fund Admiral™ Shares 1767 VGWAX 11/02/2017 — 0.35 — — — — 0.89
Institutional Target Retirement 2015 Fund 1663 VITVX 06/26/2015 — 0.09†† 7.32 — — — 5.14
Institutional Target Retirement 2020 Fund 1664 VITWX 06/26/2015 — 0.09†† 8.98 — — — 6.02
Institutional Target Retirement 2025 Fund 1665 VRIVX 06/26/2015 — 0.09†† 10.18 — — — 6.58
Institutional Target Retirement 2030 Fund 1666 VTTWX 06/26/2015 — 0.09†† 11.25 — — — 7.00
Institutional Target Retirement 2035 Fund 1667 VITFX 06/26/2015 — 0.09†† 12.24 — — — 7.43
Institutional Target Retirement 2040 Fund 1668 VIRSX 06/26/2015 — 0.09†† 13.25 — — — 7.82
Institutional Target Retirement 2045 Fund 1669 VITLX 06/26/2015 — 0.09†† 13.74 — — — 8.11
Institutional Target Retirement 2050 Fund 1670 VTRLX 06/26/2015 — 0.09†† 13.74 — — — 8.11
Institutional Target Retirement 2055 Fund 1671 VIVLX 06/26/2015 — 0.09†† 13.71 — — — 8.11
Institutional Target Retirement 2060 Fund 1672 VILVX 06/26/2015 — 0.09†† 13.70 — — — 8.08
Institutional Target Retirement 2065 Fund 1792 VSXFX 07/12/2017 — 0.09†† — — — — 8.93
Institutional Target Retirement Income Fund 1673 VITRX 06/26/2015 — 0.09†† 5.38 — — — 4.28
LifeStrategy® Conservative Growth Fund 724 VSCGX 09/30/1994 — 0.12†† 6.91 4.53 5.64 5.11 6.92
LifeStrategy® Growth Fund 122 VASGX 09/30/1994 — 0.14†† 12.28 7.44 9.07 6.60 8.16
LifeStrategy® Income Fund 723 VASIX 09/30/1994 — 0.11†† 4.25 2.97 3.85 4.21 6.21
LifeStrategy® Moderate Growth Fund 914 VSMGX 09/30/1994 — 0.13†† 9.60 6.03 7.38 6.01 7.68
Managed Payout Fund 1498 VPGDX 05/02/2008 — 0.34†† 8.77 5.62 6.92 — 5.20
STAR® Fund 56 VGSTX 03/29/1985 — 0.32†† 12.32 6.99 8.59 7.34 9.52
Target Retirement 2015 Fund 303 VTXVX 10/27/2003 — 0.13†† 7.30 4.73 6.17 5.74 6.20
Target Retirement 2020 Fund 682 VTWNX 06/07/2006 — 0.13†† 8.99 5.66 7.26 6.22 6.34
Target Retirement 2025 Fund 304 VTTVX 10/27/2003 — 0.14†† 10.20 6.30 7.96 6.48 6.87
Target Retirement 2030 Fund 695 VTHRX 06/07/2006 — 0.14†† 11.19 6.83 8.60 6.71 6.73
Target Retirement 2035 Fund 305 VTTHX 10/27/2003 — 0.14†† 12.23 7.35 9.22 7.02 7.54
Target Retirement 2040 Fund 696 VFORX 06/07/2006 — 0.15†† 13.25 7.86 9.73 7.34 7.18
Target Retirement 2045 Fund 306 VTIVX 10/27/2003 — 0.15†† 13.68 8.10 9.88 7.40 8.02
Target Retirement 2050 Fund 699 VFIFX 06/07/2006 — 0.15†† 13.69 8.11 9.88 7.41 7.29
Target Retirement 2055 Fund 1487 VFFVX 08/18/2010 — 0.15†† 13.69 8.05 9.85 — 11.14
Target Retirement 2060 Fund 1691 VTTSX 01/19/2012 — 0.15†† 13.72 8.06 9.85 — 10.97
Target Retirement 2065 Fund 1791 VLXVX 07/12/2017 — 0.15†† — — — — 8.69
Target Retirement Income Fund 308 VTINX 10/27/2003 — 0.13†† 5.35 3.68 4.33 4.93 5.25
Tax-Managed Balanced Fund Admiral™ Shares ̃ ˜ 103 VTMFX 09/06/1994 — 0.09 7.96 6.12 7.65 7.07 7.52
Wellesley® Income Fund Investor Shares 27 VWINX 07/01/1970 — 0.22 5.18 5.13 5.95 7.03 9.74
Wellesley® Income Fund Admiral™ Shares 527 VWIAX 05/14/2001 — 0.15 5.24 5.20 6.02 7.11 6.85
Wellington™ Fund Investor Shares 21 VWELX 07/01/1929 — 0.25 8.82 7.42 8.94 7.73 8.28
Wellington™ Fund Admiral™ Shares 521 VWENX 05/14/2001 — 0.17 8.90 7.51 9.03 7.82 7.60
Bond Funds All values displayed as %
California Intermediate-Term Tax-Exempt Fund Investor Shares ̃ 100 VCAIX 03/04/1994 — 0.19 2.34 1.98 2.62 4.03 4.68
California Intermediate-Term Tax-Exempt Fund Admiral™ Shares ̃ 5100 VCADX 11/12/2001 — 0.09 2.44 2.08 2.71 4.12 3.88
California Long-Term Tax-Exempt Fund Investor Shares ̃ 75 VCITX 04/07/1986 — 0.19 3.65 2.75 3.52 4.70 5.90
30

Vanguard Total Returns | May 31, 2018
Standardized Average Annual Total Returns*for Periods Ended March 31, 2018
Vanguard Fund NameFund
No.Ticker
SymbolInception
Date FeesExpense
Ratio 1 Year 3 Years 5 Years 10 YearsSince
Inception**
California Long-Term Tax-Exempt Fund Admiral™ Shares ̃ 575 VCLAX 11/12/2001 — 0.09 3.75 2.84 3.62 4.78 4.39
Core Bond Fund Investor Shares
1320 VCORX 03/28/2016 — 0.25 0.98 — — — 1.14
Core Bond Fund Admiral™ Shares 1520 VCOBX 03/28/2016 — 0.15 1.10 — — — 1.26
Emerging Markets Bond Fund Investor Shares
1431 VEMBX 03/10/2016 — 0.60 8.02 — — — 10.79
Emerging Markets Bond Fund Admiral™ Shares 1531 VEGBX 12/06/2017 — 0.45 — — — — 0.04
Emerging Markets Government Bond Index Fund Investor Shares
1120 VGOVX 05/31/2013 R2 0.49 1.97 4.67 — — 3.78
Emerging Markets Government Bond Index Fund Admiral™ Shares 520 VGAVX 05/31/2013 R2 0.32 2.13 4.86 — — 3.95
Emerging Markets Government Bond Index Fund Institutional Shares 2020 VGIVX 02/11/2015 R2 0.29 2.15 4.89 — — 5.36
Emerging Markets Government Bond ETF 3820 VWOB 05/31/2013 — 0.32
Return based on Net Asset Value 2.89 5.11 — — 4.09
Return based on Market Price 2.92 5.02 — — 4.22
Extended Duration Treasury Index Fund Institutional Shares 1 1275 VEDTX 11/28/2007 R3 0.06 5.71 -0.29 4.74 7.44 7.32
Extended Duration Treasury Index Fund Institutional Plus Shares 1 1276 VEDIX 08/28/2013 R3 0.04 5.69 -0.27 — — 8.60
Extended Duration Treasury ETF 1 930 EDV 12/06/2007 — 0.07
Return based on Net Asset Value 6.21 -0.14 4.81 7.46 7.56
Return based on Market Price 6.24 -0.08 4.91 7.52 7.61
GNMA Fund Investor Shares 1
36 VFIIX 06/27/1980 — 0.21 0.42 0.96 1.61 3.50 7.16
GNMA Fund Admiral™ Shares 1 536 VFIJX 02/12/2001 — 0.11 0.52 1.06 1.71 3.61 4.43
High-Yield Corporate Fund Investor Shares
29 VWEHX 12/27/1978 — 0.23 3.16 4.26 4.43 6.92 8.35
High-Yield Corporate Fund Admiral™ Shares 529 VWEAX 11/12/2001 — 0.13 3.26 4.37 4.53 7.03 6.63
High-Yield Tax-Exempt Fund Investor Shares ˜ 44 VWAHX 12/27/1978 — 0.19 4.99 3.45 3.76 5.10 6.51
High-Yield Tax-Exempt Fund Admiral™ Shares ̃ 5044 VWALX 11/12/2001 — 0.09 5.09 3.55 3.86 5.19 4.80
Inflation-Protected Securities Fund Investor Shares
119 VIPSX 06/29/2000 — 0.20 0.45 1.07 -0.17 2.63 5.16
Inflation-Protected Securities Fund Admiral™ Shares 5119 VAIPX 06/10/2005 — 0.10 0.58 1.18 -0.06 2.74 3.55
Inflation-Protected Securities Fund Institutional Shares 1190 VIPIX 12/12/2003 — 0.07 0.63 1.20 -0.03 2.77 3.89
Intermediate-Term Bond Index Fund Investor Shares
314 VBIIX 03/01/1994 — 0.15 0.43 1.07 1.67 4.35 5.75
Intermediate-Term Bond Index Fund Admiral™ Shares 5314 VBILX 11/12/2001 — 0.07 0.51 1.14 1.76 4.45 4.89
Intermediate-Term Bond Index Fund Institutional Shares 504 VBIMX 01/26/2006 — 0.05 0.53 1.17 1.78 4.48 4.94
Intermediate-Term Bond Index Fund Institutional Plus 1874 VBIUX 11/30/2011 — 0.04 0.54 1.18 1.80 — 2.87
Intermediate-Term Bond ETF 925 BIV 04/03/2007 — 0.07
Return based on Net Asset Value 0.51 1.14 1.76 4.44 4.89
Return based on Market Price 0.46 1.10 1.76 4.34 4.88
Intermediate-Term Corporate Bond Index Fund Admiral™ Shares 1946 VICSX 03/02/2010 R4 0.07 1.13 2.04 2.75 — 5.11
Intermediate-Term Corporate Bond Index Fund Institutional Shares 1646 VICBX 11/19/2009 R4 0.05 1.16 2.06 2.77 — 5.24
Intermediate-Term Corporate Bond ETF 3146 VCIT 11/19/2009 — 0.07
Return based on Net Asset Value 1.38 2.12 2.79 — 5.23
Return based on Market Price 1.41 2.15 2.77 — 5.25
Intermediate-Term Treasury Index Fund Admiral™ Shares 1 1943 VSIGX 08/04/2010 — 0.07 -0.40 0.41 0.85 — 2.09
Intermediate-Term Treasury Index Fund Institutional Shares 1 1643 VIIGX 03/19/2010 — 0.05 -0.35 0.43 0.88 — 2.72
1 The U.S. government backs the fund’s underlying investments but not its shares’ net asset value.
31

Vanguard Total Returns | May 31, 2018
Standardized Average Annual Total Returns*for Periods Ended March 31, 2018
Vanguard Fund NameFund
No.Ticker
SymbolInception
Date FeesExpense
Ratio 1 Year 3 Years 5 Years 10 YearsSince
Inception**
Intermediate-Term Treasury ETF 1 3143 VGIT 11/19/2009 — 0.07
Return based on Net Asset Value -0.37 0.41 0.85 — 2.58
Return based on Market Price -0.42 0.41 0.86 — 2.58
Intermediate-Term Investment-Grade Fund Investor Shares
71 VFICX 11/01/1993 — 0.20 0.92 1.77 2.31 4.71 5.58
Intermediate-Term Investment-Grade Fund Admiral™ Shares 571 VFIDX 02/12/2001 — 0.10 1.02 1.87 2.41 4.82 5.34
Intermediate-Term Tax-Exempt Fund Investor Shares ˜ 42 VWITX 09/01/1977 — 0.19 1.95 1.83 2.28 3.88 5.34
Intermediate-Term Tax-Exempt Fund Admiral™ Shares ̃ 542 VWIUX 02/12/2001 — 0.09 2.05 1.93 2.37 3.97 4.02
Intermediate-Term Treasury Fund Investor Shares 1
35 VFITX 10/28/1991 — 0.20 -0.52 0.37 0.76 2.90 5.57
Intermediate-Term Treasury Fund Admiral™ Shares 1 535 VFIUX 02/12/2001 — 0.10 -0.42 0.47 0.86 3.01 4.51
Limited-Term Tax-Exempt Fund Investor Shares ˜ 31 VMLTX 08/31/1987 — 0.19 0.66 0.85 0.96 1.97 4.00
Limited-Term Tax-Exempt Fund Admiral™ Shares ̃ 531 VMLUX 02/12/2001 — 0.09 0.76 0.95 1.05 2.06 2.64
Long-Term Bond Index Fund
522 VBLTX 03/01/1994 — 0.15 4.74 1.94 3.90 6.63 7.19
Long-Term Bond Index Fund Institutional Shares 545 VBLLX 02/02/2006 — 0.05 4.85 2.04 4.01 6.76 6.53
Long-Term Bond Index Fund Institutional Plus 1872 VBLIX 10/06/2011 — 0.04 4.86 2.06 4.03 — 4.73
Long-Term Bond ETF 927 BLV 04/03/2007 — 0.07
Return based on Net Asset Value 4.83 2.02 3.98 6.71 6.75
Return based on Market Price 4.84 2.07 4.02 6.68 6.76
Long-Term Corporate Bond Index Fund Admiral™ Shares 1947 VLTCX 01/19/2010 R5 0.07 4.72 2.89 4.59 — 7.13
Long-Term Corporate Bond Index Fund Institutional Shares 1647 VLCIX 11/19/2009 R5 0.05 4.72 2.90 4.60 — 7.14
Long-Term Corporate Bond ETF 3147 VCLT 11/19/2009 — 0.07
Return based on Net Asset Value 5.76 3.22 4.79 — 7.23
Return based on Market Price 5.86 3.35 4.90 — 7.27
Long-Term Treasury Index Fund Admiral™ Shares 1 1944 VLGSX 03/01/2010 — 0.07 3.27 0.30 3.11 — 6.21
Long-Term Treasury Index Fund Institutional Shares 1 1644 VLGIX 07/30/2010 — 0.05 3.25 0.32 3.14 — 5.25
Long-Term Treasury ETF 1 3144 VGLT 11/19/2009 — 0.07
Return based on Net Asset Value 3.25 0.29 3.11 — 5.83
Return based on Market Price 3.24 0.31 3.17 — 5.84
Long-Term Investment-Grade Fund Investor Shares
28 VWESX 07/09/1973 — 0.22 5.54 3.04 4.77 7.37 8.32
Long-Term Investment-Grade Fund Admiral™ Shares 568 VWETX 02/12/2001 — 0.12 5.64 3.14 4.87 7.48 7.09
Long-Term Tax-Exempt Fund Investor Shares ˜ 43 VWLTX 09/01/1977 — 0.19 3.58 2.80 3.34 4.66 5.82
Long-Term Tax-Exempt Fund Admiral™ Shares ̃ 543 VWLUX 02/12/2001 — 0.09 3.68 2.89 3.43 4.75 4.65
Long-Term Treasury Fund Investor Shares 1
83 VUSTX 05/19/1986 — 0.20 2.99 0.11 3.01 5.54 7.47
Long-Term Treasury Fund Admiral™ Shares 1 583 VUSUX 02/12/2001 — 0.10 3.10 0.21 3.11 5.65 6.35
Massachusetts Tax-Exempt Fund ˜ 168 VMATX 12/09/1998 — 0.15 3.18 2.32 2.96 4.26 4.35
Mortgage-Backed Securities Index Fund Admiral™ Shares 1948 VMBSX 12/03/2009 — 0.07 0.60 0.98 1.67 — 2.53
Mortgage-Backed Securities Index Fund Institutional Shares 1648 VMBIX 10/31/2013 — 0.05 0.60 1.00 — — 1.99
Mortgage-Backed Securities ETF 3148 VMBS 11/19/2009 — 0.07
Return based on Net Asset Value 0.64 0.99 1.68 — 2.55
Return based on Market Price 0.55 0.97 1.66 — 2.55
New Jersey Long-Term Tax-Exempt Fund Investor Shares ˜ 14 VNJTX 02/03/1988 — 0.19 5.38 3.21 3.40 4.48 5.82
New Jersey Long-Term Tax-Exempt Fund Admiral™ Shares ̃ 514 VNJUX 05/14/2001 — 0.09 5.48 3.31 3.49 4.56 4.61
1 The U.S. government backs the fund’s underlying investments but not its shares’ net asset value.
32

Vanguard Total Returns | May 31, 2018
Standardized Average Annual Total Returns*for Periods Ended March 31, 2018
Vanguard Fund NameFund
No.Ticker
SymbolInception
Date FeesExpense
Ratio 1 Year 3 Years 5 Years 10 YearsSince
Inception**
New York Long-Term Tax-Exempt Fund Investor Shares ˜ 76 VNYTX 04/07/1986 — 0.19 2.79 2.56 3.18 4.39 5.63
New York Long-Term Tax-Exempt Fund Admiral™ Shares ̃ 576 VNYUX 05/14/2001 — 0.09 2.90 2.66 3.27 4.48 4.55
Ohio Long-Term Tax-Exempt Fund ˜ 97 VOHIX 06/18/1990 — 0.15 3.43 2.90 3.45 4.65 5.76
Pennsylvania Long-Term Tax-Exempt Fund Investor Shares ˜ 77 VPAIX 04/07/1986 — 0.19 3.82 2.85 3.40 4.49 5.85
Pennsylvania Long-Term Tax-Exempt Fund Admiral™ Shares ̃ 577 VPALX 05/14/2001 — 0.09 3.92 2.94 3.50 4.58 4.63
Short-Term Bond Index Fund Investor Shares
132 VBISX 03/01/1994 — 0.15 0.09 0.61 0.77 1.94 4.01
Short-Term Bond Index Fund Admiral™ Shares 5132 VBIRX 11/12/2001 — 0.07 0.17 0.69 0.86 2.03 2.83
Short-Term Bond Index Fund Institutional Shares 732 VBITX 09/27/2011 — 0.05 0.19 0.71 0.88 — 1.10
Short-Term Bond Index Fund Institutional Plus 733 VBIPX 09/29/2011 — 0.04 0.20 0.72 0.90 — 1.12
Short-Term Bond ETF 924 BSV 04/03/2007 — 0.07
Return based on Net Asset Value 0.13 0.69 0.85 2.03 2.64
Return based on Market Price 0.06 0.67 0.84 1.99 2.63
Short-Term Corporate Bond Index Fund Admiral™ Shares 1945 VSCSX 11/18/2010 — 0.07 0.70 1.43 1.64 — 2.30
Short-Term Corporate Bond Index Fund Institutional Shares 1645 VSTBX 11/19/2009 — 0.05 0.67 1.45 1.66 — 2.77
Short-Term Corporate Bond ETF 3145 VCSH 11/19/2009 — 0.07
Return based on Net Asset Value 0.69 1.43 1.64 — 2.73
Return based on Market Price 0.61 1.40 1.59 — 2.73
Short-Term Federal Fund Investor Shares 1
49 VSGBX 12/31/1987 — 0.20 -0.03 0.52 0.59 1.71 4.77
Short-Term Federal Fund Admiral™ Shares 1 549 VSGDX 02/12/2001 — 0.10 0.07 0.62 0.69 1.82 3.07
Short-Term Treasury Index Fund Admiral™ Shares 1 1942 VSBSX 12/28/2009 — 0.07 -0.07 0.33 0.43 — 0.76
Short-Term Treasury Index Fund Institutional Shares 1 1642 VSBIX 08/23/2010 — 0.05 -0.02 0.35 0.46 — 0.57
Short-Term Treasury ETF 1 3142 VGSH 11/19/2009 — 0.07
Return based on Net Asset Value -0.05 0.32 0.43 — 0.69
Return based on Market Price -0.05 0.34 0.44 — 0.70
Short-Term Inflation-Protected Securities Index Fund Investor Shares
1967 VTIPX 10/16/2012 — 0.15 0.27 0.98 -0.03 — 0.15
Short-Term Inflation-Protected Securities Index Fund Admiral™ Shares 567 VTAPX 10/16/2012 — 0.06 0.34 1.08 0.06 — 0.24
Short-Term Inflation-Protected Securities Index Fund Institutional Shares 1867 VTSPX 10/17/2012 — 0.04 0.34 1.11 0.08 — 0.27
Short-Term Inflation-Protected Securities ETF 3365 VTIP 10/12/2012 — 0.06
Return based on Net Asset Value 0.33 1.08 0.06 — 0.24
Return based on Market Price 0.29 1.07 0.05 — 0.25
Short-Term Investment-Grade Fund Investor Shares
39 VFSTX 10/29/1982 — 0.20 0.66 1.40 1.50 2.67 5.98
Short-Term Investment-Grade Fund Admiral™ Shares 539 VFSUX 02/12/2001 — 0.10 0.76 1.50 1.60 2.78 3.54
Short-Term Investment-Grade Fund Institutional Shares 858 VFSIX 09/30/1997 — 0.07 0.79 1.53 1.63 2.81 4.04
Short-Term Tax-Exempt Fund Investor Shares ˜ 41 VWSTX 09/01/1977 — 0.19 0.68 0.65 0.58 1.21 3.86
Short-Term Tax-Exempt Fund Admiral™ Shares ̃ 541 VWSUX 02/12/2001 — 0.09 0.78 0.75 0.67 1.29 1.96
Short-Term Treasury Fund Investor Shares 1
32 VFISX 10/28/1991 — 0.20 -0.20 0.36 0.42 1.24 3.93
Short-Term Treasury Fund Admiral™ Shares 1 532 VFIRX 02/13/2001 — 0.10 -0.10 0.46 0.52 1.34 2.84
Tax-Exempt Bond Index Fund Investor Shares ˜ 1491 VTEBX 08/21/2015 R4 0.19 2.10 — — — 2.20
Tax-Exempt Bond Index Fund Admiral™ Shares ̃ 591 VTEAX 08/25/2015 R4 0.09 2.15 — — — 2.34
1 The U.S. government backs the fund’s underlying investments but not its shares’ net asset value.
33

2 The inception date of the Institutional Plus Shares is February 5, 2010; returns since that date are Institutional Plus Shares historical returns. All other returns are blended returns of the historical performance of the InstitutionalPlus Shares and the fund’s Institutional Shares (for periods prior to the inception date of the Institutional Plus Shares). The inception date shown in the table is that of the fund’s Institutional Shares and since-inceptionperformance is from that date.
Vanguard Total Returns | May 31, 2018
Standardized Average Annual Total Returns*for Periods Ended March 31, 2018
Vanguard Fund NameFund
No.Ticker
SymbolInception
Date FeesExpense
Ratio 1 Year 3 Years 5 Years 10 YearsSince
Inception**
Tax-Exempt Bond ETF ˜ 4391 VTEB 08/21/2015 — 0.09
Return based on Net Asset Value 2.42 — — — 2.38
Return based on Market Price 2.32 — — — 2.37
Total Bond Market Index Fund Investor Shares 84 VBMFX 12/11/1986 — 0.15 1.01 1.02 1.62 3.46 5.84
Total Bond Market Index Fund Admiral™ Shares 584 VBTLX 11/12/2001 — 0.05 1.11 1.12 1.73 3.57 4.04
Total Bond Market Index Fund Institutional Shares 222 VBTIX 09/18/1995 — 0.04 1.12 1.13 1.74 3.59 5.07
Total Bond Market Index Fund Institutional Plus Shares 2 850 VBMPX 09/18/1995 — 0.03 1.13 1.14 1.76 3.60 5.07
Total Bond Market Index Fund Institutional Select Shares 1884 VTBSX 06/24/2016 — 0.01 1.15 — — — -0.09
Total Bond Market ETF 928 BND 04/03/2007 — 0.05
Return based on Net Asset Value 1.13 1.11 1.73 3.56 3.94
Return based on Market Price 1.13 1.10 1.73 3.53 3.94
Total Bond Market II Index Fund Investor Shares ̄ 635 VTBIX 01/26/2009 — 0.09 0.97 1.01 1.63 — 3.50
Total Bond Market II Index Fund Institutional Shares ¯ 660 VTBNX 02/17/2009 — 0.02 1.04 1.08 1.70 — 3.53
Total Corporate Bond ETF 985 VTC 11/07/2017 — 0.07
Return based on Net Asset Value — — — — -1.80
Return based on Market Price — — — — -1.82
Total International Bond Index Fund Investor Shares 1231 VTIBX 05/31/2013 — 0.13 3.27 2.25 — — 3.60
Total International Bond Index Fund Admiral™ Shares 511 VTABX 05/31/2013 — 0.11 3.35 2.28 — — 3.63
Total International Bond Index Fund Institutional Shares 2011 VTIFX 05/31/2013 — 0.07 3.38 2.33 — — 3.69Total International Bond Index Fund Institutional Select Shares 1831 VSIBX 03/29/2016 — 0.025 — — — — —
Total International Bond ETF 3711 BNDX 05/31/2013 — 0.11
Return based on Net Asset Value 3.37 2.28 — — 3.64
Return based on Market Price 3.34 2.29 — — 3.68
Ultra-Short-Term Bond Fund Investor Shares 1492 VUBFX 02/24/2015 — 0.20 1.19 0.97 — — 0.95
Ultra-Short-Term Bond Fund Admiral™ Shares 592 VUSFX 02/24/2015 — 0.10 1.18 1.03 — — 1.02
34

Vanguard Total Returns | May 31, 2018
1 The U.S. government backs the fund’s underlying investments but not its shares’ net asset value.
3 7-day yield for money market funds (as of March 31, 2018). The money market yields listed more closely reflect the current earnings of the fund or portfolio than do the average annual total returns shown.
4 The fund is only available to retail investors (natural persons). You could lose money by investing in the fund. Although the fund seeks to preserve the value of your investment at $1.00 per share, it cannot guarantee it will do so. The fund may impose a fee upon sale of your shares or may temporarily suspend your ability to sell shares if the fund’s liquidity falls below required minimums because of market conditions or other factors. An investment in the fund is not insured or guaranteed by the Federal Deposit Insurance Corporation or any other government agency. The fund’s sponsor has no legal obligation to provide financial support to the fund, and you should not expect that the sponsor will provide financial support to the fund at any time.
5 You could lose money by investing in the fund. Although the fund seeks to preserve the value of your investment at $1.00 per share, it cannot guarantee it will do so. An investment in the fund is not insured or guaranteed by the Federal Deposit Insurance Corporation or any other government agency. The fund’s sponsor has no legal obligation to provide financial support to the fund, and you should not expect that the sponsor will provide financial support to the fund at any time.
Standardized Average Annual Total Returns*for Periods Ended March 31, 2018
Vanguard Fund NameFund
No.Ticker
SymbolInception
DateExpense
Ratio 1 Year 3 Years 5 Years 10 YearsSince
Inception**7-Day
SEC Yield3
Money Market Funds All values displayed as %
Vanguard Treasury Money Market Fund 1,5 11 VUSXX 12/14/1992 0.09 1.01 0.47 0.28 0.30 2.49 1.50
California Municipal Money Market Fund 4˜ 62 VCTXX 06/01/1987 0.16 0.80 0.41 0.25 0.31 2.26 1.18
Federal Money Market Fund 5 33 VMFXX 07/13/1981 0.11 1.02 0.49 0.30 0.35 4.23 1.50
New Jersey Municipal Money Market Fund 4˜ 95 VNJXX 02/03/1988 0.16 0.80 0.40 0.25 0.32 2.23 1.19
New York Municipal Money Market Fund 4˜ 163 VYFXX 09/03/1997 0.16 0.84 0.43 0.26 0.32 1.46 1.24
Pennsylvania Municipal Money Market Fund 4˜ 63 VPTXX 06/13/1988 0.16 0.81 0.41 0.25 0.34 2.26 1.20
Prime Money Market Fund 4 30 VMMXX 06/04/1975 0.16 1.20 0.64 0.39 0.44 5.01 1.68
Prime Money Market Fund Admiral™ Shares 4 66 VMRXX 10/03/1989 0.10 1.26 0.70 0.44 0.53 3.17 1.74
Municipal Money Market Fund 4˜ 45 VMSXX 06/10/1980 0.15 0.86 0.45 0.27 0.36 2.95 1.25
35

6 The investment contract funds and collective trusts are managed by Vanguard Fiduciary Trust Company, a subsidiary of The Vanguard Group, Inc.
Collective trust returns are computed taking into account all trading costs, but do not reflect the deduction of other costs or fees, including investment advisory fees.
Vanguard Total Returns | May 31, 2018
Standardized Average Annual Total Returns*for Periods Ended March 31, 2018
Vanguard Fund NameFund
No.Inception
Date 1 Year 3 Years 5 Years 10 YearsSince
Inception**
Investment Contract Funds6 All values displayed as %
Retirement Savings Trust 34 01/02/1989 1.82 1.84 1.81 2.39 4.70
Retirement Savings Trust II 338 08/30/2001 2.03 2.05 2.02 2.59 3.41
Retirement Savings Trust III 340 09/05/2001 1.97 2.00 1.97 2.54 3.36
Retirement Savings Trust IV 348 10/31/2003 1.92 1.94 1.92 2.49 3.05
Retirement Savings Trust V 339 02/03/2003 1.87 1.89 1.87 2.44 3.06
Retirement Savings Trust VIII 376 09/30/2004 1.72 1.74 1.71 2.29 2.78
Collective Trusts6 All values displayed as %
Employee Benefit Index Fund 528 09/30/1985 14.00 10.80 13.32 9.56 11.10
European Stock Index Trust 735 01/26/2006 15.44 5.36 6.84 2.59 4.40
Institutional 500 Index Trust 2040 06/24/2016 13.99 — — — 18.20
Institutional Extended Market Index Trust 1998 06/27/2016 13.18 — — — 21.99
Institutional Total Bond Market Index Trust 1984 06/24/2016 1.12 — — — -0.12
Institutional Total International Stock Market Index Trust 2069 06/24/2016 17.14 — — — 19.81
Institutional Total Stock Market Index Trust 1885 06/27/2016 13.88 — — — 19.94
Pacific Stock Index Trust 737 01/26/2006 16.53 7.83 7.17 4.51 4.06
Russell 1000 Growth Index Trust 291 09/30/2003 21.25 12.91 15.54 11.37 9.99
Russell 1000 Value Index Trust 191 09/30/2003 6.98 7.91 10.81 7.83 8.76
Russell 2000 Growth Index Trust 296 09/30/2003 18.86 9.02 13.19 11.29 10.32
Russell 2000 Value Index Trust 295 09/30/2003 5.27 7.99 10.08 8.79 9.27
Target Retirement 2015 Trust I 1463 06/28/2007 7.33 4.81 6.26 5.85 5.07
Target Retirement 2020 Trust I 1464 06/22/2007 9.07 5.74 7.36 6.31 5.38
Target Retirement 2025 Trust I 1465 06/28/2007 10.26 6.40 8.07 6.59 5.45
Target Retirement 2030 Trust I 1466 06/28/2007 11.28 6.92 8.70 6.80 5.52
Target Retirement 2035 Trust I 1467 06/28/2007 12.30 7.46 9.33 7.13 5.73
Target Retirement 2040 Trust I 1468 06/28/2007 13.34 7.96 9.83 7.45 6.03
Target Retirement 2045 Trust I 1469 06/28/2007 13.78 8.20 9.98 7.50 6.07
Target Retirement 2050 Trust I 1470 06/28/2007 13.79 8.18 9.97 7.53 6.13
Target Retirement 2055 Trust I 1488 10/05/2010 13.78 8.15 9.94 — 10.50
Target Retirement 2060 Trust I 1692 03/01/2012 13.78 8.17 9.97 — 10.36
Target Retirement 2065 Trust I 1793 07/21/2017 — — — — 11.73
Target Retirement Income Trust I 1461 06/22/2007 5.44 3.73 4.41 5.01 5.05
Target Retirement 2015 Trust II 1473 02/29/2008 7.31 4.79 6.24 5.81 5.73
Target Retirement 2020 Trust II 1474 02/29/2008 9.06 5.72 7.34 6.28 6.18
Target Retirement 2025 Trust II 1475 02/29/2008 10.28 6.38 8.05 6.55 6.45
Target Retirement 2030 Trust II 1476 02/29/2008 11.27 6.91 8.68 6.77 6.66
Target Retirement 2035 Trust II 1477 02/29/2008 12.28 7.45 9.31 7.09 6.98
Target Retirement 2040 Trust II 1478 02/29/2008 13.31 7.93 9.80 7.41 7.29
Target Retirement 2045 Trust II 1479 02/29/2008 13.74 8.18 9.96 7.46 7.34
Target Retirement 2050 Trust II 1480 02/29/2008 13.75 8.16 9.94 7.47 7.35
36

6 The investment contract funds and collective trusts are managed by Vanguard Fiduciary Trust Company, a subsidiary of The Vanguard Group, Inc.
Collective trust returns are computed taking into account all trading costs, but do not reflect the deduction of other costs or fees, including investment advisory fees.
Vanguard Total Returns | May 31, 2018
Standardized Average Annual Total Returns*for Periods Ended March 31, 2018
Vanguard Fund NameFund
No.Inception
Date 1 Year 3 Years 5 Years 10 YearsSince
Inception**
Collective Trusts6 All values displayed as %
Target Retirement 2055 Trust II 1489 08/31/2010 13.77 8.14 9.92 — 11.76
Target Retirement 2060 Trust II 1693 03/01/2012 13.77 8.14 9.94 — 10.33
Target Retirement 2065 Trust II 1794 07/17/2017 — — — — 11.90
Target Retirement Income Trust II 1471 02/29/2008 5.40 3.71 4.38 4.97 4.93
Target Retirement 2015 Trust Plus 1652 08/15/2011 7.34 4.81 6.27 — 7.39
Target Retirement 2020 Trust Plus 1653 08/15/2011 9.08 5.75 7.37 — 8.47
Target Retirement 2025 Trust Plus 1654 08/15/2011 10.29 6.41 8.08 — 9.22
Target Retirement 2030 Trust Plus 1655 08/15/2011 11.28 6.93 8.71 — 9.92
Target Retirement 2035 Trust Plus 1656 08/15/2011 12.31 7.47 9.34 — 10.60
Target Retirement 2040 Trust Plus 1657 08/15/2011 13.32 7.97 9.84 — 11.09
Target Retirement 2045 Trust Plus 1658 08/15/2011 13.79 8.21 9.99 — 11.21
Target Retirement 2050 Trust Plus 1659 08/15/2011 13.80 8.19 9.99 — 11.22
Target Retirement 2055 Trust Plus 1660 11/30/2011 13.78 8.16 9.96 — 11.58
Target Retirement 2060 Trust Plus 1695 03/23/2012 13.80 8.18 9.99 — 10.38
Target Retirement 2065 Trust Plus 1796 07/24/2017 — — — — 11.71
Target Retirement Income Trust Plus 1661 08/15/2011 5.42 3.74 4.42 — 5.22
Target Retirement 2015 Trust Select 1675 06/30/2015 7.34 — — — 5.52
Target Retirement 2020 Trust Select 1676 06/30/2015 9.11 — — — 6.53
Target Retirement 2025 Trust Select 1677 06/30/2015 10.30 — — — 7.17
Target Retirement 2030 Trust Select 1678 06/30/2015 11.30 — — — 7.67
Target Retirement 2035 Trust Select 1679 06/30/2015 12.31 — — — 8.20
Target Retirement 2040 Trust Select 1680 06/30/2015 13.34 — — — 8.68
Target Retirement 2045 Trust Select 1681 06/30/2015 13.79 — — — 8.95
Target Retirement 2050 Trust Select 1682 06/30/2015 13.80 — — — 8.93
Target Retirement 2055 Trust Select 1683 06/30/2015 13.81 — — — 8.92
Target Retirement 2060 Trust Select 1685 06/30/2015 13.81 — — — 8.91
Target Retirement 2065 Trust Select 1795 07/24/2017 — — — — 11.73
Target Retirement Income Trust Select 1686 06/30/2015 5.44 — — — 4.46
Total Stock Market Index Trust 125 06/30/2000 13.89 10.25 13.04 9.82 6.09
37

After-tax returns are calculated using the highest individual federal income tax rate in effect at the time of each distribution; they do not reflect the impact of state and local taxes. Your after-tax return depends on yourindividual tax situation and, therefore, may differ from the return presented here. In addition, the after-tax returns for Vanguard funds reflect the reduced tax rates on ordinary income, qualified dividend income, andshort-term and long-term capital gains that went into effect in 2003. If you own fund or exchange-traded fund (ETF) shares in a tax-deferred account such as an individual retirement account or 401(k) plan, this informationdoes not apply to your investment because these accounts are not subject to current taxes. After-tax returns for most funds are calculated using the tax liability implied by each fund’s declared distributions. However, theexact tax characteristics of many distributions are not known until after the close of the calendar year. For Vanguard Tax-Managed Balanced Fund, conservative estimates are used based on fund history until final amountsbecome available.
Vanguard Total Returns | May 31, 2018
Standardized Average Annual Total Returns*for Periods Ended March 31, 2018
Vanguard Fund Name Inception DateExpense
Ratio 1 Year 3 Year 5 Year 10 YearSince
Inception**
Tax-Managed Funds All values displayed as %
Tax-Managed Capital Appreciation Admiral Shares 09/06/1994 0.09
Return Before Taxes 14.67 10.80 13.47 9.78 9.81
Return After Taxes on Distributions 14.22 10.31 13.01 9.40 9.51
Return After Taxes on Distributions and Sale of Fund Shares 8.98 8.35 10.73 7.99 8.57
Tax-Managed Capital Appreciation Institutional Shares 02/24/1999 0.06
Return Before Taxes 14.72 10.84 13.52 9.82 6.60
Return After Taxes on Distributions 14.27 10.34 13.04 9.44 6.29
Return After Taxes on Distributions and Sale of Fund Shares 9.02 8.38 10.76 8.03 5.47
Tax-Managed Small-Cap Admiral Shares 03/25/1999 0.09
Return Before Taxes 12.70 10.50 13.50 11.35 11.06
Return After Taxes on Distributions 12.41 10.16 13.18 11.10 10.84
Return After Taxes on Distributions and Sale of Fund Shares 7.69 8.12 10.76 9.40 9.62
Tax-Managed Small-Cap Institutional Shares 04/21/1999 0.06
Return Before Taxes 12.74 10.54 13.54 11.41 10.76
Return After Taxes on Distributions 12.44 10.20 13.21 11.15 10.53
Return After Taxes on Distributions and Sale of Fund Shares 7.72 8.15 10.80 9.45 9.33
Tax-Managed Balanced Admiral Shares ̃ ˜ 09/06/1994 0.09
Return Before Taxes 7.96 6.12 7.65 7.07 7.52
Return After Taxes on Distributions 7.61 5.86 7.42 6.88 7.36
Return After Taxes on Distributions and Sale of Fund Shares 5.26 4.96 6.27 5.99 6.74
38

3 7-day yield for money market funds (as of March 31, 2018). The money market yields listed more closely reflect the current earnings of the fund or portfolio than do the average annual total returns shown.
4 The fund is only available to retail investors (natural persons). You could lose money by investing in the fund. Although the fund seeks to preserve the value of your investment at $1.00 per share, it cannot guarantee it will do so. The fund may impose a fee upon sale of your shares or may temporarily suspend your ability to sell shares if the fund’s liquidity falls below required minimums because of market conditions or other factors. An investment in the fund is not insured or guaranteed by the Federal Deposit Insurance Corporation or any other government agency. The fund’s sponsor has no legal obligation to provide financial support to the fund, and you should not expect that the sponsor will provide financial support to the fund at any time.
Vanguard Total Returns | May 31, 2018
Standardized Average Annual Total Returns*for Periods Ended March 31, 2018
Vanguard Fund NameFund
No.Inception
Date 1 Year 3 Years 5 Years 10 YearsSince
Inception**7-Day
SEC Yield3
Vanguard Variable Insurance Fund All values displayed as %
Balanced Portfolio 106 05/23/1991 8.82 7.43 8.98 7.77 9.44 —
Capital Growth Portfolio 277 12/03/2002 21.11 13.44 16.47 12.16 12.47 —
Conservative Allocation Portfolio 710 10/19/2011 6.98 4.68 5.74 — 6.76 —
Diversified Value Portfolio 278 02/08/1999 3.38 5.97 8.84 7.51 6.91 —
Equity Income Portfolio 108 06/07/1993 10.34 10.19 11.70 9.24 9.79 —
Equity Index Portfolio 107 04/29/1991 13.84 10.63 13.15 9.38 9.63 —
Global Bond Portfolio 1558 09/07/2017 — — — — -0.98 —
Growth Portfolio 109 06/07/1993 24.90 11.58 15.31 10.91 7.62 —
High Yield Bond Portfolio 260 06/03/1996 3.13 4.24 4.39 6.72 6.06 —
International Portfolio 110 06/03/1994 30.85 12.21 10.89 5.96 7.76 —
Mid-Cap Index Portfolio 288 02/09/1999 12.20 7.74 12.11 10.00 10.23 —
Moderate Allocation Portfolio 712 10/19/2011 9.56 6.22 7.51 — 8.84 —
Money Market Portfolio 4 104 05/02/1991 1.19 0.66 0.43 0.52 2.82 1.66
Real Estate Index Portfolio 349 02/09/1999 -3.21 1.12 5.93 6.46 9.89 —
Short-Term Investment-Grade Portfolio 274 02/08/1999 0.74 1.46 1.55 2.81 3.78 —
Small Company Growth Portfolio 161 06/03/1996 18.35 10.31 13.74 12.40 11.00 —
Total Bond Market Index Portfolio 257 04/29/1991 1.04 1.03 1.64 3.49 5.48 —
Total International Stock Market Index Portfolio 1557 09/07/2017 — — — — 5.44 —
Total Stock Market Index Portfolio 287 01/08/2003 13.71 10.10 12.87 9.52 9.84 —
Vanguard Variable Annuity Plan… All values displayed as %
Balanced Portfolio 69 05/23/1991 8.51 7.12 8.67 7.46 9.04 —
Capital Growth Portfolio 603 05/01/2003 20.76 13.12 16.13 11.84 12.43 —
Conservative Allocation Portfolio 801 10/19/2011 6.67 4.38 5.44 — 6.45 —
Diversified Value Portfolio 145 02/08/1999 3.02 5.64 8.51 7.19 6.58 —
Equity Income Portfolio 8 06/07/1993 10.03 9.87 11.37 8.92 9.41 —
Equity Index Portfolio 68 04/29/1991 13.51 10.31 12.82 9.06 9.23 —
Global Bond Portfolio 804 09/07/2017 — — — — -1.13 —
Growth Portfolio 10 06/07/1993 24.54 11.26 14.98 10.58 7.25 —
High Yield Bond Portfolio 146 06/03/1996 2.83 3.94 4.09 6.40 5.72 —
International Portfolio 86 06/03/1994 30.52 11.90 10.56 5.65 7.40 —
Mid-Cap Index Portfolio 143 02/09/1999 11.87 7.43 11.79 9.68 9.89 —
Moderate Allocation Portfolio 803 10/19/2011 9.25 5.92 7.19 — 8.52 —
Money Market Portfolio 4 64 05/02/1991 0.90 0.37 0.14 0.22 2.45 1.37
Real Estate Index Portfolio 147 02/09/1999 -3.49 0.83 5.62 6.14 9.55 —
Short-Term Investment-Grade Portfolio 144 02/08/1999 0.45 1.17 1.25 2.50 3.46 —
39

Vanguard Total Returns | May 31, 2018
3 7-day yield for money market funds (as of March 31, 2018). The money market yields listed more closely reflect the current earnings of the fund or portfolio than do the average annual total returns shown.
Standardized Average Annual Total Returns*for Periods Ended March 31, 2018
Vanguard Fund NameFund
No.Inception
Date 1 Year 3 Years 5 Years 10 YearsSince
Inception**7-Day
SEC Yield3
Small Company Growth Portfolio 160 06/03/1996 18.01 9.99 13.41 12.07 10.64 —
Total Bond Market Index Portfolio 67 04/29/1991 0.75 0.74 1.36 3.20 5.11 —
Total International Stock Market Index Portfolio 802 09/07/2017 — — — — 5.27 —
Total Stock Market Index Portfolio 604 05/01/2003 13.39 9.78 12.54 9.19 9.60 —
40

For more information about The Vanguard 529 College Savings Plan, call 866-734-4530 or visit vanguard.com to obtain a Program Description, which includes investment objectives, risks, charges, expenses, and otherinformation; read and consider it carefully before investing. Vanguard Marketing Corporation, Distributor and Underwriter. If you are not a Nevada taxpayer, consider before investing whether your or the designatedbeneficiary’s home state offers any state tax or other benefits that are only available for investments in such state’s qualified tuition program. The Vanguard 529 College Savings Plan is a Nevada Trust administered by the Boardof Trustees of the College Savings Plans of Nevada, chaired by State Treasurer Daniel M. Schwartz. The Vanguard Group, Inc., serves as the Investment Manager and through its affiliate, Vanguard Marketing Corporation, markets anddistributes the Plan. Upromise Investments, Inc., serves as Program Manager and has overall responsibility for the day-to-day operations, including effecting transactions. The Plan’s portfolios, although they invest in Vanguard mutualfunds, are not mutual funds. Investment returns are not guaranteed and you could lose money by investing in the Plan.
Vanguard Total Returns | May 31, 2018
Standardized Average Annual Total Returns*for Periods Ended March 31, 2018
Vanguard Fund NameFund
No.Inception
Date 1 Year 3 Years 5 Years 10 YearsSince
Inception**
Vanguard 529 College Savings Plan All values displayed as %
500 Index Portfolio 4515 12/17/2002 13.80 10.58 13.08 9.23 9.07Aggressive Growth Portfolio 4509 12/12/2002 15.08 8.94 10.78 7.58 8.92Conservative Growth Portfolio 4512 12/16/2002 4.88 3.22 4.06 4.74 5.47Growth Portfolio 4510 12/16/2002 11.61 7.12 8.61 6.87 7.59Growth Index Portfolio 4517 12/17/2002 17.74 10.85 14.07 10.52 9.65High Yield Bond Portfolio 4524 12/11/2002 3.00 4.14 4.31 6.73 6.56Income Portfolio 4513 12/16/2002 1.51 1.01 0.90 2.50 3.18Inflation-Protected Securities Portfolio 4523 12/11/2002 0.45 1.02 -0.23 2.49 3.92Interest Accumulation Portfolio 4528 10/15/2004 1.49 0.97 0.61 0.78 1.53Mid-Cap Index Portfolio 4516 12/17/2002 12.14 7.67 12.06 9.89 11.02Moderate Growth Portfolio 4511 12/11/2002 8.31 5.24 6.38 5.94 6.57Morgan Growth Portfolio 4541 12/01/2006 22.38 12.10 15.05 10.03 8.63STAR Portfolio 4543 12/01/2006 12.21 6.85 8.42 7.11 6.20Small-Cap Index Portfolio 4519 12/16/2002 11.63 7.86 11.46 10.45 11.28Total International Bond Index Portfolio 4401 03/17/2017 3.18 — — — 3.66Total International Stock Index Portfolio 4520 12/11/2002 16.91 6.70 6.13 2.51 8.04Total Stock Market Portfolio 4514 12/11/2002 13.68 10.06 12.87 9.51 9.52Total Bond Market Index Portfolio 4522 12/16/2002 0.88 0.93 1.54 3.29 3.62Value Index Portfolio 4518 12/11/2002 10.60 9.83 11.98 8.14 9.13Windsor™ Portfolio 4542 12/01/2006 11.86 8.15 11.78 8.83 6.22
41

7 Figures for periods of less than one year are cumulative returns. All other figures represent annual total returns.8 Spliced Developed ex US Index: 100% MSCI EAFE Index through May 28, 2013; 100% FTSE Developed ex North America Idx through December 20, 2015; 100% FTSE Developed ACap ex US Trans Idx through May 31, 2016;
100% FTSE Developed All Cap ex US Index thereafter.9 Spliced European Stock Index: MSCI Europe Index through March 23, 2013; FTSE Developed Europe Index thereafter.
10 Spliced Extended Market Index: Dow Jones Wilshire 4500 Completion Index through July 17, 2005, S&P Transitional Completion Index through September 16, 2005, S&P Completion Index thereafter.11 Spliced Growth Index: S&P 500 Growth Index (formerly known as the S&P 500/Barra Growth Index) through May 16, 2003; MSCI US Prime Market Growth Index through April 16, 2013; and CRSP US
Large Cap Growth Index thereafter.12 Spliced Large Cap Index: MSCI US Prime Market 750 Index through January 30, 2013; CRSP US Large Cap Index thereafter.13 Spliced Mega Cap Index: MSCI US Large Cap 300 Index through January 30, 2012; CRSP US Mega Cap Index thereafter.14 Spliced Mega Cap Growth Index: MSCI US Large Cap Growth Index through April 16, 2013; CRSP US Mega Cap Growth Index thereafter.15 Spliced Mega Cap Value Index: MSCI US Large Cap Value Index through April 16, 2013; CRSP US Mega Cap Value Index thereafter.16 Spliced Mid Cap Index: S&P MidCap 400 Index through May 16, 2003; the MSCI US Mid Cap 450 Index through January 30, 2013; and the CRSP US Mid Cap Index thereafter.17 Spliced Pacific Stock Index: MSCI Pacific Index through March 26, 2013; FTSE Developed Asia Pacific Index thereafter.
Vanguard Total Returns | May 31, 2018
Average Annual Total Returnsfor Periods Ended May 31, 2018
Index Name Month QuarterYear to
Date 1 Year 3 Years 5 Years 10 Years
Comparative Indexes7 All values displayed as %
Bloomberg Barclays 10 Year Municipal Bond Index 1.06 1.19 -0.79 0.38 2.74 3.00 4.63
Bloomberg Barclays Global Aggregate U.S. Government Bond Index 0.89 1.01 -1.07 -0.80 0.72 1.25 2.98
Bloomberg Barclays U.S. 1-5 Year Government Bond Index 0.49 0.45 -0.26 -0.52 0.46 0.71 1.85
Bloomberg Barclays U.S. 1-5 Year Government/Credit Bond Index 0.47 0.43 -0.30 -0.28 0.79 1.03 2.26
Bloomberg Barclays U.S. 1-5 Year Government/Credit Float Adjusted Index 0.47 0.43 -0.30 -0.28 0.79 1.03 —
Bloomberg Barclays U.S. 5-10 Year Government/Credit Bond Index 0.84 0.43 -2.05 -1.47 1.34 2.07 4.68
Bloomberg Barclays U.S. 5-10 Year Government/Credit Float Adjusted Index 0.84 0.43 -2.05 -1.47 1.34 2.07 —
Bloomberg Barclays U.S. Aggregate Float Adjusted Index 0.71 0.58 -1.54 -0.38 1.40 1.97 —
Bloomberg Barclays U.S. Aggregate Bond Index 0.71 0.61 -1.50 -0.37 1.39 1.98 3.72
Bloomberg Barclays U.S. Treasury Inflation Protected Securities Index 0.43 1.42 -0.42 0.74 1.46 0.86 3.15
Institutional Money Market Funds Average 0.15 0.40 0.60 1.15 0.57 0.34 0.34
Money Market Funds Average 0.12 0.33 0.49 0.91 0.40 0.24 0.23
MSCI World Index in USD 0.63 -0.44 0.48 11.57 7.65 9.40 5.38
Russell 1000 Growth Index 4.38 1.88 6.23 21.02 13.93 15.69 10.89
Russell 1000 Value Index 0.59 -0.85 -1.93 8.25 7.45 10.09 7.38
Russell 3000 Growth Index 4.53 2.32 6.43 21.32 13.69 15.51 10.86
Russell 3000 Index 2.82 1.14 2.55 15.06 10.72 12.85 9.21
Russell 3000 Value Index 0.99 -0.14 -1.43 8.85 7.71 10.15 7.48
Russell Midcap Growth Index 3.74 2.59 4.99 18.42 9.99 13.00 9.58
S&P 500 Index 2.41 0.19 2.02 14.38 10.97 12.98 9.14
Spliced Developed ex US Index 8 -1.82 -1.04 -1.39 9.56 5.27 6.53 2.40
Spliced European Stock Index 9 -3.04 -1.42 -2.11 5.86 4.06 5.86 1.80
Spliced Extended Market Index 10 4.77 5.75 5.15 18.39 9.63 12.11 9.71
Spliced Growth Index 11 4.36 2.04 5.90 17.41 12.30 14.67 10.34
Spliced Large Cap Index 12 2.38 0.19 2.07 14.45 10.82 12.95 9.22
Spliced Mega Cap Index 13 2.50 -0.06 2.15 14.96 11.34 13.16 9.22
Spliced Mega Cap Growth Index 14 4.62 1.73 6.27 18.38 13.31 15.35 10.75
Spliced Mega Cap Value Index 15 0.67 -1.64 -1.35 12.07 9.61 11.36 7.83
Spliced Mid Cap Index 16 1.78 1.53 1.66 11.82 8.25 11.88 9.17
Spliced Pacific Stock Index 17 -0.99 -1.54 -0.03 14.79 7.39 7.65 3.66
42

18 Spliced Small Cap Index: Russell 2000 Index through May 16, 2003; the MSCI US Small Cap 1750 Index through January 30, 2013; and the CRSP US Small Cap Index thereafter.19 Spliced Total International Stock Index: Consists of the Total International Composite Index through August 31, 2006; MSCI EAFE + Emerging Markets Index through December 15, 2010; MSCI ACWI ex USA IMI Index through
June 2, 2013; and FTSE Global All Cap ex US Index thereafter. Returns for the MSCI indexes are adjusted for withholding taxes.20 Spliced Total Stock Market Index: Dow Jones U.S. Total Stock Market Index (formerly known as the Dow Jones Wilshire 5000 Index) through May 31, 2005; MSCI US Broad Market Index through June 2, 2013; and CRSP US
Total Market Index thereafter.21 Spliced Value Index: S&P 500 Value Index (formerly known as the S&P 500/Barra Value Index) through May 16, 2003; MSCI US Prime Market Value Index through April 16, 2013; CRSP US Large Cap Value Index thereafter.
Vanguard Total Returns | May 31, 2018
Average Annual Total Returnsfor Periods Ended May 31, 2018
Index Name Month QuarterYear to
Date 1 Year 3 Years 5 Years 10 Years
Spliced Small Cap Index 18 5.07 6.61 5.19 18.21 9.84 12.00 10.09
Spliced Total International Stock Index 19 -2.12 -2.22 -1.70 10.10 5.23 6.02 2.07
Spliced Total Stock Market Index 20 2.81 1.16 2.58 15.11 10.70 12.84 9.32
Spliced Value Index 21 0.63 -1.45 -1.23 11.91 9.51 11.47 8.16
43

This page intentionally left blank
Vanguard Total Returns | May 31, 2018 44

This page intentionally left blank
Vanguard Total Returns | May 31, 2018 45

This page intentionally left blank
Vanguard Total Returns | May 31, 2018 46

With respect to contracts issued in New York State, performance figures shown in this report are based on the actual performance of Vanguard Variable Insurance Fund as if the contracts were being offered in New York prior to their first NewYork offering date in November 1992.Comparative indexes represent unmanaged indexes or average returns on various financial assets that can be compared with the funds’ total returns for the purpose of measuring relative performance.BLOOMBERG® is a trademark and service mark of Bloomberg Financial L.P. BARCLAYS® is a trademark and service mark of Barclays Bank Plc, used under license. Bloomberg Finance L.P. and its affiliates, including Bloomberg Index ServicesLimited ("BISL") (collectively, "Bloomberg"), or Bloomberg's licensors own all proprietary rights in the Bloomberg Barclays Indices.The products are not sponsored, endorsed, issued, sold, or promoted by "Bloomberg or Barclays." Bloomberg and Barclays make no representation or warranty, express or implied, to the owners or purchasers of the products or any member ofthe public regarding the advisability of investing in securities generally or in the products particularly or the ability of the Bloomberg Barclays Indices to track general bond market performance. Neither Bloomberg nor Barclays has passed on thelegality or suitability of the products with respect to any person or entity. Bloomberg's only relationship to Vanguard and the products are the licensing of the Bloomberg Barclays Indices which are determined, composed, and calculated by BISLwithout regard to Vanguard or the products or any owners or purchasers of the products. Bloomberg has no obligation to take the needs of the products or the owners of the products into consideration in determining, composing, or calculatingthe Bloomberg Barclays Indices. Neither Bloomberg nor Barclays is responsible for and has not participated in the determination of the timing of, prices at, or quantities of the products to be issued. Neither Bloomberg nor Barclays has anyobligation or liability in connection with the administration, marketing or trading of the products.The index is a product of S&P Dow Jones Indices LLC (“SPDJI”), and has been licensed for use by Vanguard. Standard & Poor’s® and S&P® are registered trademarks of Standard & Poor’s Financial Services LLC (“S&P”); Dow Jones® is aregistered trademark of Dow Jones Trademark Holdings LLC (“Dow Jones”); S&P® and S&P 500® are trademarks of S&P; and these trademarks have been licensed for use by SPDJI and sublicensed for certain purposes by Vanguard.Vanguard product(s) are not sponsored, endorsed, sold, or promoted by SPDJI, Dow Jones, S&P, or their respective affiliates and none of such parties make any representation regarding the advisability of investing in such product(s) nor dothey have any liability for any errors, omissions, or interruptions of the index.London Stock Exchange Group companies include FTSE International Limited ("FTSE"), Frank Russell Company ("Russell"), MTS Next Limited ("MTS"), and FTSE TMX Global Debt Capital Markets Inc. ("FTSE TMX"). All rights reserved. "FTSE®","Russell®", "MTS®", "FTSE TMX®" and "FTSE Russell" and other service marks and trademarks related to the FTSE or Russell Indexes are trademarks of the London Stock Exchange Group companies and are used by FTSE, MTS, FTSE TMX, andRussell under license. All information is provided for information purposes only. No responsibility or liability can be accepted by the London Stock Exchange Group companies nor its licensors for any errors or for any loss from use of thispublication. Neither the London Stock Exchange Group companies nor any of its licensors make any claim, prediction, warranty or representation whatsoever, expressly or impliedly, either as to the results to be obtained from the use of theFTSE Indexes or the fitness or suitability of the Indexes for any particular purpose to which they might be put.The funds or securities referred to herein are not sponsored, endorsed, or promoted by MSCI, and MSCI bears no liability with respect to any such funds or securities. The prospectus or the Statement of Additional Information contains a moredetailed description of the limited relationship MSCI has with Vanguard and any related funds.The Russell Indexes and Russell® are registered trademarks of Russell Investments and have been licensed for use by The Vanguard Group, Inc. The products are not sponsored, endorsed, sold, or promoted by Russell Investments and RussellInvestments makes no representation regarding the advisability of investing in the products.Vanguard ETF® Shares are not redeemable with the issuing fund other than in very large aggregations worth millions of dollars. Instead, investors must buy or sell Vanguard ETF Shares in the secondary market and hold thoseshares in a brokerage account. In doing so, the investor may incur brokerage commissions and may pay more than net asset value when buying and receive less than net asset value when selling.Investments in Target Retirement Funds are subject to the risks of their underlying funds. The year in the fund name refers to the approximate year (the target date) when an investor in the fund would retire and leave the workforce. The fundwill gradually shift its emphasis from more aggressive investments to more conservative ones based on its target date. An investment in the Target Retirement Fund is not guaranteed at any time, including on or after the target date.Collective trusts are not mutual funds. Vanguard collective trusts are available only to tax-qualified plans and their eligible participants. These collective trust mandates are managed by Vanguard Fiduciary Trust Company, a subsidiary of TheVanguard Group, Inc.All investing is subject to risk, including the possible loss of the money you invest.For more information about Vanguard funds, visit vanguard.com or call 800-662-7447 to obtain a prospectus or, if available, a summary prospectus. For more information about Vanguard annuity products, visit vanguard.comor call 800-522-5555 to obtain fund and variable annuity contract prospectuses or, if available, summary prospectuses. Investment objectives, risks, charges, expenses, and other important information are contained in theprospectus; read and consider it carefully before investing.
© 2018 The Vanguard Group, Inc. All rights reserved. Managed Payout Fund U.S. Patent Nos. 8,180,695; 8,185,464; and 8,571,963. Vanguard ETFs U.S. Patent Nos. 6,879,964; 7,337,138; 7,720,749; 7,925,573; 8,090,646; and 8,417,623.Vanguard Marketing Corporation, Distributor.
* Performance figures include the reinvestment of all dividends and any capital gains distributions, and are pre-tax and are net of expenses. Figures for periods of less than one year are cumulative returns. All other figures represent annualtotal returns.
** Performance figures since fund inception as listed next to fund name. Inception date is the date on which performance measurement began. Funds may have had subscription periods during which they were invested in short-term/moneymarket instruments. Returns do not reflect these subscription periods.
˜Although the income from a municipal bond fund is exempt from federal tax, capital gains realized either through a fund’s trading or from your redemption of shares are taxable. For some investors, a portion of the fund’s income may besubject to state and local taxes, as well as the alternative minimum tax.
˜˜For some investors, a portion of the fund’s income may be subject to state and local taxes, as well as the alternative minimum tax.¯Closed to new investor accounts.
¯¯Fund is closed to new accounts. In addition, a $25,000 annual investment limit has been placed on existing retail accounts.…Share prices for the Vanguard Variable Annuity are accumulation unit values that reflect the investment results of the respective portfolios as well as the reinvestment of all dividends and capital gains, reduced by daily mortality, expense
risk, and administrative expense charges. The one-year, three-year, five-year, ten-year, and since-inception period returns, considered “Standardized,” are adjusted for the $25 annual fee charged on contracts valued at less than $25,000. TheVanguard Variable Annuity is a flexible-premium variable annuity issued by Transamerica Premier Life Insurance Company, Cedar Rapids, Iowa (NAIC No. 66281), Form No. VVAP U 1101 (in Florida, Form No. VVAP U 1101 (FL), and inOregon, Form No. VVAP U 1101 (OR)(R)), without agent representation. This insurance policy is not available in all states and may vary by state. In New York State only, the Vanguard Variable Annuity is issued by Transamerica Financial LifeInsurance Company, Harrison, New York (NAIC No. 70688), Form No. VVA NY 0208, without agent representation. The Vanguard Group administers the Vanguard Variable Annuity for the issuer. Its variable annuity and investment costs rankamong the lowest in the industry according to Morningstar, Inc., May 2018. The Vanguard Group, Transamerica Premier Life Insurance Company, and Transamerica Financial Life Insurance Company do not provide tax advice. Investors areencouraged to consult a tax advisor for information on how annuity taxation applies to their individual situations.
……The acquired fund fees and expenses based on the fees and expenses of the underlying funds.‡ Laudus Rosenberg U.S. Large/Mid Capitalization Long/Short Equity Fund, which was sponsored and managed by Charles Schwab Investment Management Inc. and subadvised by AXA Rosenberg Investment Management LLC, was
reorganized into Vanguard Market Neutral Fund on November 30, 2007.‡‡ Factor funds are subject to investment style risk, which is the chance that returns from the types of stocks in which the fund invests will trail returns from the stock market. Factor funds are subject to manager risk, which is the chance
that poor security selection will cause the fund to underperform relevant benchmarks or other funds with a similar investment objective.
47

P.O. Box 2900Valley Forge, PA 19482-2900
RTRC 062018