total quality management and an application in the …
TRANSCRIPT

TOTAL QUALITY MANAGEMENT AND AN APPLICATION IN THETURKISH INFANTRY BATTALION
The Institute of Economics and Social Sciencesof
Bilkent University
by
GÖKHAN KASIMLIOĞLU
In Partial Fulfillment of the Requirements for the Degree ofMASTER OF BUSINESS ADMINISTRATION
in
THE DEPARTMENT OFBUSINESS ADMINISTRATION
BILKENT UNIVERSITYANKARA
August 2001

I certify that I have read this thesis and have found that it is fully adequate, in scopeand in quality, as a thesis for the degree of Master of Business Administration.
Assoc. Prof. Erdal EREL
I certify that I have read this thesis and have found that it is fully adequate, in scopeand in quality, as a thesis for the degree of Master of Business Administration.
Assoc. Prof. İhsan Sabuncuoğlu
I certify that I have read this thesis and have found that it is fully adequate, in scopeand in quality, as a thesis for the degree of Master of Business Administration.
Assist. Prof. Doğan SEREL
Approval of the Institute of Economics and Social Sciences
Assoc. Prof. Kürşat AYDOĞANDirector

TABLE OF CONTENTS
Abstract.....................................................……………..........................…………. i
Özet.............................................................................................……………......... ii
Acknowledgement......................................................................………….............. iii
List of Figures and Tables……….…………………………………..…………… iv
List of Tables……….…………………………………..………………………… v
1.Introduction…………………………………………………………………….. 1
1.1. Thesis Scope…..……………………………………………………….. 4
1.2. Thesis Outline………………………………………………………….. 4
2. Total Quality Management…………………………………………………….. 5
2.1. Key Elements of Total Quality…………………………………...……… 5
3. Quality Improvement Process……..…………………………………………… 13
3.1. Process Improvement. …………………………………………………… 14
3.2. Overview of Total Quality Tools……………………….………………... 21
4.Quality Improvement Application In Turkish Army Brigade...…..……………. 26
4.1 Cost Related Issues In Nutrition System………………….……………... 37
4.2.Further Studies On The Problems Of Nutrition System.….…………….. 39
4.3.A Benchmarking Study…………………………………..…..………….. 42
4.4.Summary of 13 steps quality improvement….……..….…..……..……… 46
5. Conclusion and Further Research…………………………….….…………….. 49
6. References…………………………………………………..….…………..…... 52
7. Appendices…………………………………………………………..……..….. 59
Appendix A .........................................................………………………….. 60
Appendix B ...............................……....................………………………… 61

Appendix C ..................................……………………....………………….. 64
Appendix D ..................................................................…………………….. 66
Appendix E ..................................................................……………..…........ 68
Appendix F ............................................................………………………… 70

i
BILKENT UNIVERSITYAbstract
TOTAL QUALITY MANAGEMENT ANDAN APPLICATION IN THE TURKISH
INFANTRY BATTALION
By
GÖKHAN KASIMLIOĞLUM.B.A.
ADVISOR: ASSOC.PROF. ERDAL EREL
This study presents a brief summary of total quality management, its history
and its tools; offers an overview of a process improvement procedure by U.S.
Department of Defense; and a sample process improvement application in nutrition
system of a Turkish Infantry battalion.
The main purpose of the study is to show the advantages of using Total
Quality Management tools in military processes. For this purpose, a quality
improvement team established in a Turkish Infantry Battalion, consisting of 9
enlisted soldiers and a lieutenant, improved the nutrition system by using seven tools
of the Total Quality Management. Project related with contracting nutrition system to
a civilian catering firm -which is also in trial period in some of Turkish Army Units -
is benchmarked cooperatively.
Key Words: Total quality, quality training, nutrition process, quality improvement

ii
ÖZETTOPLAM KALİTE YÖNETİMİ VE
BİR PİYADE TABURUNDA UYGULAMASI
GÖKHAN KASIMLIOĞLU
BİLKENT ÜNİVERSİTESİ
YÜKSEK LİSANS TEZİ, İŞLETME FAKÜLTESİ
TEZ DANIŞMANI: ASSOC.PROF. ERDAL EREL
AGUSTOS 2001
Bu çalışma ile toplam kalite yönetiminin tanımları, kısa geçmişi, araçları ve
Amerika Birleşik Devletleri Savunma Bakanlığında uygulanmakta olan süreç
iyileştirme yöntemi incelenmiş ve bir Türk piyade taburu beslenme sistemine süreç
iyileştirmesinin uygulaması gerçekleştirilmiştir.
Tezin amacı toplam kalite yönetimi araçlarının askeri birliklerin yaşadığı
süreçlere uyarlamanın faydalarını göstermektir. Bu maksatla 1 üsteğmen ve 9
askerden olaşan bir iyileştirme takımı piyade taburunda tesis edilmiştir. İyileştirme
takımının amacı toplam kalitenin yönetiminin 7 aracını kullanılarak beslenme
sisteminde iyileştirme sağlamaktır. Türk ordusunda deneme aşamasında olan
beslenme sisteminin sivil firmalara ihale edilmesi yöntemi de işbirlikçi
kıyaslama(cooperative benchmarking) tekniği ile incelenmiştir.
Anahtar kelimeler: Toplam Kalite yönetimi, kalite eğitimi, süreç iyileştirme.

iii
ACKNOWLEDGEMENT
I would like to thank to associate professors Erdal EREL for his supervision,
kind interest, patience, and constructive comments throughout our study. I am also
grateful to the examining committee members; Assoc. Prof. İhsan Sabuncuoğlu and
Assist. Prof. Doğan Serel for their valuable contributions.

iv
LIST of FIGURES
1. Figure 4.1. : Flowchart of nutrition system in a Turkish Infantry Battalion. 28
2. Figure 5.2. : Cause-and-effect diagram for dissatisfaction in nutritionsystem in Turkish Infantry battalion………………………………………. 32
v
LIST of TABLES
1. Table 5.1. : Success factors and Benchmarks……………………………. 45

1
1. INTRODUCTION
“Each passing day proves that global competitive market environment will no
longer accept organizations and companies that are not knitted with quality. One or
two decades ago they were competing with their internal market rivals only, but
nowadays the market is all around the world.” (Scherkenbach, 1998).
The previous sentence from William Scherkenbach describes today’s market
phenomenon very well. In conformity with this phenomenon, a Turkish customer
would demand a Chinese bicycle instead of a Turkish one; would purchase French
cheese from the nearest store, and would award a contract for his/her company’s
advertisement to a Swedish company.
If a company is not efficient and successful on serving to a high range of
customers demanding high quality products, it is destined to die. U.S. Federal quality
Institute published a survey result on how unqualified products and services affect
U.S. companies. Survey results can be summarized as below:
“Since 1960, the United States has lost 40 percent of its market share to
foreign competitors. During the same period, Japan has increased the size of its
foreign market by 500 percent. The nine largest banks in the world are now Japanese.
The United States used to make 90 percent of the color TVs in the world, now U.S.

2
makes only 5 percent. There were no American-made VCRs, compact disc players,
or single-lens reflex cameras in 1990s in the U.S.”
While in the market place U.S. companies were losing blood on the military
side, there were also some changes. Altunes (1994) describes that the Army
transformed from a threat-based, forward-positioned force to a capabilities-based,
strategically positioned, power-projection and mission-adaptive force. The numerous
post closings, force structure and infrastructure reductions had major impacts on the
lives and careers of every Army soldier and civilian. While there were increases in
operational deployments, there were also huge reductions in limited resources that
require greater emphasis on effectiveness and efficiency. U.S. Army has embarked
upon a bold journey to transform and reshape itself into a force fully prepared for the
next century.
Turkish Army is also very well aware of the today's challenging,
multidimensional environment. In the near future, it is inevitable to face environment
of reduced budgets and personnel. Army must find creative and innovative ways of
doing its tasks. To this end, Turkish Army is introducing quality and quality
improvement terms into military processes.
Quality is an approach that seeks for meeting customer needs and
expectations that involves all managers and employees in using quantitative methods
to improve continuously the organization’s processes, products, and services. Quality
improvement distinguishes duplication of effort, and initiates actions that eliminate
waste. Quality improvement asks for analysis of the processes within each task that
would highlight the implementation of value added and non-value-added work.

3
Turkish Army introduced ISO 9000 Systems and NATO Quality Assurance
Systems (AQAP), as a starting point and from 1996 to present, Total Quality
Management (TQM) philosophy to its units and institutions.
ISO 9000 Series Quality Assurance Systems introduced yearly costs for
military units in order to preserve a quality assurance certificate. TQM philosophy
does not need any certificate and does not seek any fee to be paid in order to have the
certificate. This phenomenon drove most of the Turkish Army units to drop their ISO
9000 certificates. Every military unit established continuous quality improvement
departments to welcome TQM philosophy.
“TQM consist of continuous improvement activities involving everyone in
the organization-managers and workers-in a totally integrated effort toward
improving performance at every level. This improved performance is directed toward
satisfying such cross-functional goals as quality cost, schedule, mission need, and
suitability. TQM integrates fundamental management techniques, existing
improvement efforts, and technical tools under a disciplined approach focused on
continued process improvement. This activities are ultimately focused on increased
customer/user satisfaction.” (U.S. Department of the Army, 1990).
TQM philosophy was born and became popular after World War II (WW II).
After WWII, the only economy capable of producing goods was the American one.
Asian and European economies had been destructed by the war. Without
competition, United States quickly became the leading producer of goods.
The emphasis in mass production system was to produce more and more to
meet the demand. Quality was not the issue that needed a remedy. The focus was on
high-volume output that would meet minimal standards. Producing and selling the

4
products immediately with the highest profit was the way of conducting business
operation. Today global competition does not allow organizations to survive without
adopting quality needs.
1.1. SCOPE
The objective of this thesis is studying TQM tools in a Turkish Infantry
Battalion. The scope of the study is to present possible advantages of introducing
TQM tools into Turkish Infantry Battalion’s Processes. For this purpose, we
established a quality improvement team in an infantry battalion, showed
improvement in the nutrition system after the application of Total Quality
Management’s seven tools.
1.2. THESIS OUTLINE
This study is comprised of five chapters:
In the first chapter, we will discuss TQM philosophy along with the
definitions of some related concepts. In the following chapter, we will examine the
key elements of TQM. In the third chapter, Quality Improvement Process and TQM
tools are summarized. In the fourth chapter, we will describe an application of
process improvement in a Turkish Army Battalion. In the last part of this study, an
analysis of the results and a brief summary of the findings and conclusions are
provided.

5
2.Total Quality Management
2.1. KEY ELEMENTS OF TQM
There is no consensus on key elements of the TQM philosophy, but people
seek and adopt key areas to work in order to establish TQM philosophy in their
organizations. One such approach in Davis and Goetsch’s book (1997) “Introduction
to Total Quality” gives a concise description of the key elements of the Total Quality
as listed below:
• Strategically based,
• Customer focus (Internal and external),
• Obsession with quality,
• Scientific approach to decision making and problem solving,
• Long-term commitment,
• Teamwork,
• Continual process improvement,
• Education and training,
• Freedom through control,
• Unity of purpose,
• Employee involvement and empowerment,

6
In the following pages, we explain TQM's eleven critical elements step by
step in order to demonstrate each of the applications' benefits.
2.1.1. Strategically Based
TQM organizations have a comprehensive strategic plan that contains at least
the following elements: vision, mission, broad objectives, and objectives that must be
completed in order to accomplish the broad objectives. The strategic plan of a Total
Quality Organization (TQO) is designed to give it a sustainable competitive
advantage between the same level organizations. The competitive advantages of a
TQO are geared toward achieving world leading quality and improving on it
continually forever.
For an Infantry Battalion mission and vision is clearly identified strategically.
The vision of a Turkish Infantry Battalion is envisaged as “to be the best among the
same types of battalions” and the mission of the infantry battalion is accepted as
"improving effectiveness and productivity of the unit in the battlefield"
2.1.2. Customer Focus
In TQM philosophy, the customer is the driving factor. This applies to both
internal and external customers. External customer defines the quality of product or
service delivered. Internal customer helps to define the quality of people, processes,
and environments associated with the products or services.
For an Infantry Battalion, the brigade (the senior level of command), the officers of
the battalion, the non-commissioned officers (NCOs), and the soldiers of the
battalion are internal customers. The Turkish citizens are the external customers of
theBattalion.

7
2.1.3. Obsession with Quality
In TQM internal and external customers define quality. After defining and
achieving priorities in quality organization should go on to meet and exceed this
definition. This means all personnel at all levels should be obsessed with quality.
When an organization is obsessed with quality, good enough is never good enough.
In a Turkish Infantry Battalion the structure and command/control procedures
are defined strictly. All tasks are defined very well. Nevertheless it would not be
possible to carry out a successful operation without the contributions of the
motivated soldiers and mission would not be completed if the higher command
would not approve it. Customers have to be satisfied with the outcome. For this
reason, Obsession with quality is a critical topic in the Army.
TQM’s tools would arouse subordinates’ desires toward a more satisfactory
work environment. In this TQM environment, subordinates would look for ways in
order to increase their performance.
2.1.4. Scientific Approach
“TQM is a two-part equation. While first part consist of people skills,
involvement, and empowerment another important part of the equation is the use of
scientific approach in structuring work and in decision-making and problem solving
that relates to the work. This means that hard data are used in establishing
benchmarks, monitoring performance, and making improvements.”(Davis and
Goetsch, 1997).

8
In Turkish Army commanders in every level allow their subordinates to take
part in decision-making process but most of the time scientific tools and techniques
are neglected. In Chapter 4 seven tools of TQM are introduced.
2.1.5. Long-Term Commitment
“TQM is not just another management innovation; it is a new way of doing
business that requires a whole new corporate culture. For that reason too few
organizations begin to implementation of TQM with the long-term commitment to
change that is necessary for success. Organizations obviously do not understand the
approach; hire an expert and throw some money at a particular department and wait
for achievement immediately. Their evaluation about the TQM is obviously
nonsense.”(Davis and Goetsch, 1997).
Company and battalion commanders' belief on the TQM philosophy could
create great effectiveness in the units. In the long run, commanders without futile
ideas such as "TQM is a new way of apple-polish", or "temporary management myth"
would generate great energy for the establishment of TQM. U.S. Navy got better
outputs from the qualified processes after having implemented TQM philosophy for
15 years.
2.1.6. Teamwork
"In traditionally managed organizations, the best competitive efforts are often
between departments within the organization. Internal competition should be focused
on improving quality, and, in turn, external competitiveness. “Where once there may
have been barriers, rivalries, and distrust, the quality company fosters teamwork and
partnership with the workforce and representatives. This partnership is not a

9
pretense, a new look to an old battle. It is a common struggle for the customer, not
separate struggles for power. The nature of a common struggle for quality also
applies to relationship with suppliers, regulating agencies, and local
communities.”(Scholtes, 1996).
In companies and battalions of the Army, commanders are familiar with
teamwork but without methodology. Infantry units always have to cooperate with
support units such as artillery and quartermaster units. Effective teamwork skills
would produce better results. At the same time company and battalion commanders
have to always work together with their subordinates.
2.1.7. Continual Improvement of …………………..Systems
"Products are developed and services delivered by people using processes
with environment (systems). In order to improve the quality of products or services
continuously which is fundamental goal in a total-quality management, it is
necessary to continually improve systems." (Davis and Goetsch, 1997).
Turkish people start every work with a great enthusiasm. This enthusiasm
goes on until initial success generates. In the next phase, without getting the big pie,
they feel satisfied with what they achieved and they stop. Greater successes would be
realized if the organizations choose to improve process consistently.

10
2.1.8. Education and Training
“Education and training are fundamental to TQM, because they represent the
best way to improve people on a continual basis. According to Scholtes, “In a quality
organization everyone is constantly learning. Management encourages employees to
constantly elevate their level of technical skill and professional expertise. People
gain an ever-greater mastery of their jobs and learn to broaden their
capabilities.”(Davis and Goetsch, 1997).
People will learn how to work smart through education and training. If there
is no education and training for scientific procedures of TQM then it will not be
possible to create a TQM philosophy.
2.1.9. Freedom through Control
“Involving and empowering employees is fundamental to TQM as a way to
simultaneously bring more minds to bear on the decision-making process and
increase the ownership employees feel in decisions that are made. Employee
involvement is not a loss of management control; in fact control is fundamental to
TQM. The freedoms enjoyed in a TQM setting are actually the result of well planned
and carried out controls.”(Davis and Goetsch , 1997).
In Turkish war history there are good and bad examples about the issue
“control on people." Enver Pasha’s (Full general in Turkish Army in WW I) bad
decision, which caused approximately a hundred of thousand people’s sacrifice in
Sarıkamış, was generated after an extensive inspection. Enver Pasha made an

11
inspection on troops in order to check the combat readiness but his subordinate
commanders and headquarter misled him and made him to believe everything is as
desired. The cost of this bad decision due to a misguided inspection was the lives of
140,000 people.
On the other hand Turkish history has many examples that show even an
individual could affect the results of a combat or even a war, without taking even an
order from the headquarter. These examples show that control on people does not
always prove success.
2.1.10. Unity of Purpose
“Historically, management and labor have had an adversarial relationship.
From the perspective of TQM, who or what is to blame for adversarial management-
labor relations is irrelevant. What is most important is this; in order to apply the
TQM approach, organizations must have unity of purpose. This means that internal
politics has no place in a TQM organization. Rather, collaboration should be the
norm.”(Davis and Goetsch ,1997).
Commanders should explain their coworkers that TQM is not a temporary
managerial tool tested. A shared vision would make everything easier. Officer,
NCOs, and soldiers should believe that TQM is philosophy that works for them and
for the Army’s goodness.
2.1.11.Employee…Involvement…and Empowerment
“The basis for involving employees is twofold. First, it increases the
likelihood of a good decision, a better plan, or a more effective improvement by

12
bringing more minds to bear on the situation-not just any minds, the minds of the
people who are closest to the work in question. Second, it promotes ownership of
decisions by involving the people who will have to implement them.”(Davis and
Goetsch 1997).
Quality circles, brainstorming and cause-effect diagrams are just a few tools
of TQM that targets the employee involvement and empowerment. In a hierarchical
organization, such as army, maybe it is not possible to empower subordinates in
every decision making process, but commanders should find ways to allow more
brains to generate creative ideas in decision-making process.

13
3.Quality Improvement … ….
Process
TQM provide many constructive tools for organizations, which face great
challenges in the years ahead. The challenges are complex and require contribution
of everyone involved in the organization. Deming presage that equipping a
community to address change in an efficient and productive manner can be
accomplished using the knowledge and tools of TQM.
Quality improvement represents a key principle of TQM, and quality
improvement can be achieved by improvement of work processes. Spain (1996)
defines process and work process as “Conversion of measurable inputs into
measurable outputs through an organized sequence of steps or transformations. A
work process can be defined as the sequential integration of inputs or objects
(people, ideas, materials, methods, and machines) so as to produce value-added
outputs for some other process or for delivery to internal or external customers."
(Spain & Wishoff 1996).
Every work process is part of a larger process and, may be made up of
smaller ones, everyone engages in a work process. Even though most work processes
have been developed in long periods of time and have been modified by people with
varying degrees of management status, work processes are rarely understood.
Anyone of us may have said at some point “Sure, my policy is always try to
do things the right way. So show me what can actually be done differently to

14
improve the quality of my work.” Quality Improvement Process (QIP), is described
in following pages would help us to find those different ways of doing things.
TQM philosophy desires continuous improvement in all processes
accomplished by the organizations. While Deming was teaching Japanese how to
improve and how to introduce this continual philosophy into the people’s mind,
people in the U.S. were in comfort. After Japanese entrance into the world market
U.S. was any more at ease.
Today companies have to live as G.A. Pavlov described, “ Live everyday like
your hair’s on fire.” That is why TQM gained great emphasis on today’s global
world.
3.1. PROCESS IMPROVEMENT
Process improvement constitutes the nucleus part of the TQM philosophy.
For this reason we will explain steps in improvement process. In explaining the issue
M. Brassard’s “guide for continuous improvement in U.S. Navy, 1991” and
Department of Navy’s “system approach to process improvement lecture notes,
1993” were the main sources.
3.1.1.Step 1: "Select the process to be improved and establish a well-
defined process improvement objective.”(Brassard, 1991).
“A standardized process improvement model allows organizations to look at
how it performs work. When all of the major players are involved in process
improvement, they can collectively focus on eliminating waste of money, people,
materials, time, and opportunities. The ideal outcome is that jobs can be done
cheaper, quicker, easier, and safer.”(Brassard, 1991).

15
Quality improvement process begins once it has been identified and
documented. Documentation of the process means defining the area where the
quality improvement is most needed.
In addition to the quality improvement researchers, we observed in the
questionnaire we applied in a Turkish battalion, selected process, team’s vision,
mission and strategic objectives have to be supported by the upper management level
in the beginning of the process improvement. Shop floor workers or the subordinates
must also agree that the chosen process needs to be improved in the first phase.
3.1.2.Step 2: “Organize a team to improve the process.” (Brassard, 1991).
“This involves selecting the “right” people to serve on the team; identifying
the resources available for the improvement effort, such as people, time, money, and
materials; setting reporting requirements; and determining the team’s level of
authority.” (www.dod.gov/qualityimprovement.html).
In designing the team also the unit commanders have to take into
consideration the following issues:
• The team must consist of right people.
• The team must consist of 5 to 7 members not more.
• The environment must generate trust for the team members.
• They must be encouraged that they would do something in favor of the
organization.
These elements may be formalized in a written charter. In Appendix D we
added a formalized a sample written charter. A written charter would help
commanders who intended to institute a TQM philosophy in their units.

16
3.1.3.Step 3: “Define the current process using a flowchart.”
(www.dod.gov/fundamental.html).
This tool is used to generate a step-by-step map of the activities, actions, and
decisions, which occurs between the starting and stopping points of the process.
Before a team can improve a process, the members must understand how it works.
The most useful tools for studying the current process are: flowchart, run/control
chart, Pareto chart and cheek sheet. Most of the quality gurus recommend starting
with flowcharts in order to see the whole picture of the process. To develop an
accurate flowchart the team assigns one or two members to observe the flow of work
through the process. It may be necessary for the observers to follow the flow of
activity through the process several times before they can see and chart what actually
occurs.
As an example, “launching a helicopter” is a cross-functional process
involving contributing processes performed by bridge personnel, controllers,
firefighting teams, the fueling team, engineers, the cargo handling team, flight deck
personnel, and others. Each of these contributing processes has to be accurately
flowcharted and clearly understood before the larger process can be improved.
3.1.4.Step 4: “Simplify the process by removing redundant or unnecessary
activities.”(Brassard, 1991).
People may have seen the process on paper entirely for the first time in Step
3. This can be a real eye-opener, which prepares them to take these first steps in
improving the process. Team member would identify similar steps, which do not
affect the output and which can be eliminated. They would compare activity needs
with its performer’s abilities and if the step adds value to the product or service
produced by the process. If they decide that activity would be eliminated in the
17
process, the team should create a flowchart of the simplified process and search for if
the simplified process produces products or services acceptable to customers and in
compliance with applicable existing directives.
If the answer is yes, and the team has the authority to make changes, they
should present the new simplified flowchart.
3.1.5.Step 5: "Develop a plan for collecting data and collect baseline
data." (Brassard, 1991).
“Data collected according to a plan established by the team will be used as
the yardstick for comparison later in the model. This begins the evaluation of the
process against the process improvement objective established in Step1. When the
team develops a data collection plan, they must first identify the characteristic of the
product or service that has to be hanged in order to meet the objective."
(www.dod.gov/fundamental.html).
Collecting data would enable commanders’ studies to shift to a more
scientific implementation. Data can help them to define and focus more on the real
problems. As an example, if a company commander senses that his subordinates'
motivation is not at the desired level he has to take measures to increase it. Data
collection by using questionnaires, interviews or observations can allow the company
commander to figure out the real problems.
3.1.6.Step 6: “Assess whether the process is stable.”(Brassard, 1991).
“Control chart or run chart are the main tools in assessing whether the process
is stable and help the team to gain better understanding of what is happening in the
process.”(www.dod.gov/fundamental.html).
The collected data provide opportunity to set up control and run charts. Both
of these tools organize the data and allow the team to make a sense of a mass of

18
confusing information. Both of these two tools are important because they help the
team to identify special cause variation in the process. Whenever an individual or a
team repeats a sequence of actions, there will be some variation in the process.
Depending on the nature of the variation -special cause-, the team may choose to act
in two directions.
3.1.7.Step 7: “Assess whether the process is capable.” (Brassard, 1991).
In this step team goes on to identify the root causes of the process
inefficiency. The team plots a histogram to compare the data collected against the
process improvement objective established in Step 1. Usually the process
simplification actions in Step 4 are not enough to make the process capable of
meeting the objective and the team will have to continue on search of root causes.
Once the process has been stabilized, the data collected in Step 5 is used
again. This time the team plots the individual data points to produce a bar graph
called a histogram. To prepare the histogram, the team superimposes the target value
for the process on the bar graph. The target value was established in Step 1 as the
process improvement objective. If there are upper and/or lower specification limits
for the process, the team should plot them too.
After examining the shape created by plotting the data on the histogram, the
team has to decide whether the shape is satisfactory and whether the data points are
close enough to the target value. These are subjective decisions. If the team is
satisfied with both the shape and the clustering of data points, they can choose to
standardize the simplified process or to continue through the steps of the Basic
Process Improvement Model.

19
3.1.8.Step 8: “Identify the root causes which prevent the process from meeting
the objective.” (Brassard, 1991).
In this step the team begins the PDCA Cycle by identifying the root causes of
a lack of process capability. Deming developed the PDCA cycle and it consists of
steps as mentioned below:
P: Plan
D: Do
C: Check
A: Act
The data the team has looked for so far measure the output of the process. To
improve the process, the team must find what causes the product or the service to be
unsatisfactory. The team uses a cause-and-effect diagram to recognize root causes.
“Once the team recognize possible root causes, it is important to collect data
to determine how much these causes actually affect the results. The team can use a
Pareto chart to show the relative importance of the causes they have identified. At the
end of the chapter information in designing a Pareto charts in a step by step approach
are added.” (www.dod.gov/fundamental.html).
3.1.9.Step 9: “Develop a plan for implementing a change based on the
possible reasons for the process’s inability to meet the objective set for it.”(Brassard,
1991).
In Step 9, planning phase of the model starts. The team picks one of the root
causes to work, which is the most voted cause or the highest item in the Pareto
analysis. They then develop a plan to implement a change in the process to reduce or
eliminate the root cause. The major features of the plan include changing the

20
simplified flowchart created in Step 4 and making all of the preparations required
implementing the change.
3.1.10.Step 10: “Test the changed process and collect data.”
(Brassard, 1991).
It is mostly recommended that, if it is feasible, the change should be
implemented on a limited basis before it is applied to the entire organization. The
changed process could be instituted in a single office or work center while the rest of
the command continues to use the old process.
Whatever method the team applies, the goals are to prove the effectiveness of
the change, avoid widespread failure, and maintain command-wide support. In some
situations, a small-scale test is not feasible. If that is the case, the team will have to
inform everyone involved of the nature and expected effects of the change and
conduct training adequate to support a full-scale test.
3.1.11.Step 11: “Assess whether the changed process is stable.”
(Brassard, 1991).
Steps 11 and 12 together comprise the Check phase of the PDCA cycle. The
team uses a control chart or run chart in order to determine new process’ stability. If
the process is stable, the team can move on to Step 12; if not, the team must return
the process to its former state and plan another change.
3.1.12.Step 12: “Assess whether the change improved the process.”
(Brassard, 1991).
Using the data collected in Step 11 and a histogram, the team determines
whether the process is closer to meeting the process improvement objective
established in Step 1. If the objective is met, the team can progress to Step 13; if not,
the team must decide whether to keep or discard the change.

21
3.1.13.Step 13: “Determine whether additional process improvements are
feasible.” (Brassard, 1991).
The team is faced with this decision following process improvement has the
choice of embarking on continuous process improvement by re-entering the model or
simply monitoring the performance of the process until further improvement is
feasible.
1. Identifying possibilities for making further process changes by reviewing the
process improvement model.
2. Standardizing the changed process without making further efforts to improve
it.
If the second decision is made, the team is still involved in documenting the
changes, monitoring process performance, and institutionalizing the process
improvement.
Quality improvement tools are needed in most of the process improvement
phases. We summarized the following TQM tools:
• Run and Control Charts.
• Pareto Charts.
• Fishbone Diagrams.
• Check Sheet.
• Histograms.
• Scatter Diagrams.
• Stratification.

22
3.2. OVERVIEW OF TQM TOOLS
In the following section a brief summary of the TQM tools is submitted.
3.2.1.Run Charts:
A run chart is the most basic tool used to display how a process performs over
time. It is a line graph of data points plotted in chronological order—that is, the
sequence in which process events occurred. These data points represent
measurements, counts, or percentages of process output. Run Charts are used to
assess and achieve process stability by highlighting signals of special causes of
variation. In order to prepare a run chart:
3.2.2.Control Charts:
Control chart is a graphical display of a quality characteristic that has been
measured or computed from a sample versus the sample number or time. The chart
contains a centerline that represents the average value of the quality characteristic
corresponding to the in-control state. Two other horizontal lines, called the upper
control limit (UCL) and the lower control limit (LCL) are also drawn. These control
limits are chosen so that if the process is in control, nearly all of the sample points
will fall between them. As long as the points plot within the control limits, the
process is assumed to be in control, and no action is necessary problem with the run
charts, and in fact, many of the other tools, is that it does not help us understand
whether the variation is the result of special causes-things like changes in the
material used, machine problems, lack of employee training-or common causes that
are purely random. Dr. Walter Stewart develops the control chart to separate the
“special causes” from “common causes.”

23
A point that plots outside of the control limits is interpreted as evidence that
the process is out of control, and investigation and corrective action is required to
find and eliminate the assignable causes responsible for this behavior. The control
points are connected with straight-line segments for easy visualization. Even if all
the points plot inside the control limits, if they behave in a systematic or nonrandom
manner, then this is an indication that the process is out of control.
3.2.3. Pareto Charts
A Pareto chart is a very useful tool whoever needs to separate the important
from the trivial. It is used to establish priorities. It is particularly effective in helping
sort out what problems or causes of problems to pursue first. By cascading Pareto
charts user determine the most significant category in the first chart, then making a
second chart related only that category, and repeating this as far as possible, to three,
four times. If the cascading were done properly, root causes of problems would be
determined rather easily.
3.2.4. Fishbone Diagram
It is used to identify and isolate causes of a problem. It is not based on
statistics. This chart is simply a means of visualizing how the varies factors
associated with a process affect the process’ output. It provides a graphical view of
the entire process under investigation.
3.2.5. Check Sheet
The check sheet is a useful tool for variety of application. Many organizations
are literally drowning in their own data, while at the same time not knowing what is
actually going on; they are data rich and information poor. Having access to data is

24
essential. However, problems arise when data cannot be winnowed from the
important and when there is so much of it that it cannot be easily translated into
useful information. Check sheets help deal with this problem. Its utility is restricted
only by the imagination of the person seeking information. Check sheet can take any
form. The only rules are that data collection must be equivalent of entering a check
mark and that the displayed data be easily translated into useful information.
3.2.6. Histograms
The histogram evolved to meet the need for evaluating data that occurs at a
certain frequency. This is possible because the histogram allows for a concise
portrayal of information in a bar graph format.
The histogram clearly portrays information on location, spread, and shape
that enables the user to perceive subtleties regarding the functioning of the physical
process that is generating the data. It can also help suggest both the nature of, and
possible improvements for, the physical mechanisms at work in the process.
It is possible to calculate the process variability from the data and from the
frequency distribution curve. The flatter and wider the frequency distribution,
indicate greater the process variability. The taller and narrower the curve, indicates
less variability (http://deming.eng.clemson.edu/pub/tutorials/qctools/histm.htm).
3.2.7. Scatter Diagrams
The sixth of the seven tools is the scatter diagram. It is the simplest of the
seven and of the most useful. The scatter diagrams are used to determine the
correlation (relationship) between two variables. Scatter diagrams are useful in

25
testing the correlation between process factors and characteristics of output flowing
out of the process (http://deming.eng.clemson.edu/pub/tutorials/qctools/histm.htm).
3.2.8. Stratification
Stratification, is also a simple tool, involves investigating the cause of a
problem by grouping data into categories. This grouping is called stratification. The
data groups might include data relative to the environment, the people involved, the
machine(s) used in process, materials, and so on. Grouping of data by common
element or characteristic makes it easier to understand the data and pull insight from
it.
As in the case of cascading Pareto chart the power of the stratification lies in
the fact that if you stratify far enough you will arrive at a root cause of the problem.
Only when root causes are corrected will the problem be solved.

26
4. Quality Improvement ….Applicationin Turkish ….Infantry Battalion
In every quality improvement application, quality improvement team
members have to be trained on the issues we discussed in previous chapters. In this
study we did not carry out all the training needed. If we had had more time; we know
that we had to assess the training needs of the improvement team and had to prepare
a training curriculum (as used in Turkish Army military and displayed on Appendix
A) in consistence with training needs and had to carry out the training.
We carried out a questionnaire for the internal customers who are enlisted
soldiers in the Battalion. We applied 8 categories and 32-question survey in order to
assess the potential causes of quality. The survey applied to 30 enlisted soldiers who
are chosen randomly. The commanders of the soldiers were not in the area where the
survey taken place. The questions of the questionnaire are displayed on Appendix B,
but as a brief summary of the results we got the followings (Detailed results can be
seen on Appendix C). After the analysis of the survey the following potential causes
of low quality have been figured out.
• Problems with nutrition system agreed on by % 30,95 of the responders of the
survey as the most important issue.
• As a second problematic area, enlisted soldiers have chosen military canteen
service (% 19,05).
• Problems with meeting with visitors, visitors lounge ranked as 3rd in problem
list (%17,86).

27
No Code Problematic Area Votes in numbers Votes in percentages1 Ta Nutrition System 26 30.95%2 Tb Cloth-washing System 5 5.95%3 Tc Dormitory Condition 0 0.00%4 Td Bathing System 10 11.90%5 Te Equipment 5 5.95%6 Tf Visitor's Lounge 15 17.86%7 Tg Canteen 16 19.05%8 Th Soldiers' Club 2 2.38%9 Ti Barber Service 0 0.00%
10 Tj HealthCare System 5 5.95% Total 84 100.00%
After discussing these problems with steering committee members who were
higher command officers in the brigade, we agreed on establishing a quality
improvement team. The team charter can be seen on Appendix D.
At the first meeting of the quality improvement team, team members studied
on improvement process and analyzed the problem assessment survey. Nutrition
system is chosen as the most important and urgent problem to solve. In the following
meeting the team applied the suitable TQM tools.
Team members prepared a flowchart diagram in Figure 4.1. to depict the
nature and flow of the steps in the nutrition process. The team found it helpful to
compare this as-is flowchart with the way the process is supposed to work.

28
START
Provision arrive to the BattalionKitchen
Is provisionconvenient to
standards?
Report touppercommand
Wait for newprovision
Provision are processed by theenlisted soldiers
On duty NCO checks the tasteand last condition of the prepared
meal.
Is everythingconvenient tothe standards?
Assigned platoon from eachcompany is called for distribution.
All the meals are distributed
No
Yes
No
Yes
FIGURE 4.1. Flowchart of nutrition system in Turkish Infantry Battalion.

29
Yes
Distributed meals in thermoses isput in line
On duty NCO checks for theequality of distribution
Are the mealsdistributeequally
The assigned platoons take themeals to the mass halls.
Soldiers get into the line in frontof the mass hall
On duty soldiers distribute meals
Assigned platoons clean the masshall
Cooks equalize themeal distribution
Soldiers responsible from themass hall take the dishes to
industrial washing machines andprepare for later use
STOP
No
FIGURE 4.1. Flowchart of nutrition system in Turkish Infantry Battalion (Continued).

30
After the process flowchart has been drawn, the team generated many logical
and illogical ideas freely by a brainstorming session. Team members discussed the
generated ideas and while some of them canceled, remaining causes are ranked in
accordance with their importance and satisfaction status. In this phase multi-voting is
used as a main tool to create a consensus and to avoid power distance among the
members.
Brainstorming tool also facilitated cause-and-effect diagram set up. Cause
and effect diagram was the main tool for choosing a starting point. Quality
improvement team constructed the cause-and-effect diagram in Figure 4.1. Main
problems and their votes related with main 4 categories could be summarized as
below.
1. Problems related with equipment and materials;
- Provision allocated is not enough (8).
- Provision allocated is not quality assured (5).
- Stream based cooking does not produce good results (6).
- Tools used in kitchen and in mass-hall are worn out (4).
- Tools are not designed for fair distribution of the meals (5).
- Tools are not hygienic (6).
2. Problems related with environment;
- Mass-hall is too crowded (6).
- Mass-hall is too far away (10).
- Queue is too long (7).
- No music broadcasting in mass-hall (5).
- Too many units share the same mass-hall (8).

31
3. Problems related with methods;
- Meal diversification is not enough (7).
- Too long meal distribution time cause meals to loose its delicious (8).
- Meals are not delicious (7).
- Meals are not distributed fairly (9).
- Portions are not satisfactory (7).
- Strict rules (9).
4. Problems related with people;
- Service personnel favor for his friends, his own company soldiers (8).
- Service personnel do not have periodic medical check-ups (1).
- On duty officers/NCOs do not control procedures (8).
- No owner of the process (6).
- Untrained cooks (7).

32
Provision allocated Meal diversification is not enough(7) Meals are not distributed fairly(9) is not enough(8) Tools are worn out(4) Too long meal distribution time Provision allocated is Tools are not designed for the cause meals to loose its delicious(8) Portions are not satisfactory(7) not quality assured(5) fair distribution of the meal(5) Stream-based cooking(6) Tools are not hygienic(6) Meals are not delicious(7) doesn't produce good results
Strict rules(9)
No music broadcasting that Service personnel favor his Mass-hall is too crowded(6) make the environment warm(5) friends and own company(8)
Service personnel don't have No owner of the process(6)Mass-hall is too faraway(10) Too many units
share the same masshal(8) Untrained cooks(7) Queue is too long(7) On duty Officer/NCOs don't
periodic madical checkups (1)
control procedures(8)
Methods
Environment People
Equipment and .....materials
Dissatisfaction in Nutrition system
Equipment and materials

33
Most voted causes of the problems are put in the first ranks when
beginning to investigate the sub causes of the problem. As a result of this analysis
“unfair distribution of meals” which got 9 votes from team members, has emerged as
the root causes of dissatisfaction, and improvement team started with that issue.
Team used another tool of the TQM, which is cascading Pareto analysis. At
the first phase improvement team members decided on figuring out the potential root
causes of unfair distribution of meals. After a short brainstorming session, members
decided on 5 root causes of the problem with their votes and ranked them as follows:
No. Problem Root Causes Votes
1.Soldiers working in mass-hall favor and serve more to their citizen and theirown company friends more than the other enlisted soldiers 10
2. Tools are not designed for fair distribution of meals. 9 3. Soldiers working in mass-hall are not trained on fair distribution issues. 6 4. Organizational cultural issues. 8 5. On duty officers/NCOs do not control fair distribution of the meals. 10 6. Service plates are not designed for fair distribution of the meals. 5 7. The kitchen on the measures of distribution of each meal does not inform from
Service personnel. 7
Cascading Pareto Analysis Number 1
Problem Analysis
109
6
89
5
0
2
4
6
8
10
12
Problems
Vote
s
123456

34
After the initial cascading Pareto analysis we observed, “A soldier working in
mass-hall favor and serve more to their citizens and their own company friends more
than the other enlisted soldiers” constituted the main cause of the problem.
Improvement team went on trying to find out the main causes of this sub cause of
that problem.
Brainstorming again came to the picture and team members submitted their ideas
and voted as follows:
No. Problem Root Causes Votes 1. No rotation in soldiers working in mass-hall 10 2. Soldiers with psychological problems working in mass-hall 8 3. Organizational culture (citizenship force them to unfair distribution of meals. 8 4. No precautions taken to prevent unfair distributions 8 5. Battalion/Company are not aware of such a problems of the enlisted soldier 7 6. No reward and punishment for unfair / fair distribution of meals 5
Cascading Pareto Analysis Number 2
Problem Analysis
10
8 8 87
5
0
2
4
6
8
10
12
Problems
Vote
s
123456
In the second phase of the analysis, team observed that ”No rotation in
soldiers working in mass-hall” constitutes the main sub-cause of the problem.
Analysis went on by brainstorming once more in order to find out the main sub-
causes again. In the third phase we obtained the following results:

35
No. Problem Root Causes Votes1 Company commanders have intention to attain worse personnel to the mass-hall
and keep the qualified personnel within the company.7
2 No professionalism exists in these duties. 103 Service personnel stay too much in this 64 Enlisted soldiers are reluctant to be attained to this duty. 7
Cascading Pareto Analysis Number 3
Problem Analysis
7
10
67
0
2
4
6
8
10
12
Problems
Vote
s
1234
As can be seen in the last cascading Pareto analysis second choice took the
most votes and team members decided to find out solutions for this main sub-
cause. Solutions for professionalism can be achieved by three ways:
1. Whole replacement of all personnel with professional soldiers.
2. Employing civilian personnel in the kitchen and in the distribution desk.
3. Ending the military cuisine system and charging a catering service for the
nutrition system.
It was not possible to achieve the first two preferences since employment of
new personnel; and transformation to professional army requires longer procedures
and more detailed researches than the thesis time horizon can cover. In such a
challenging situation we applied again the previous 8 categories, 32-question survey,

36
and an additional comparison questionnaire to another battalion, which is in trial
period of a new system. In the second battalion a civilian-catering firm was serving
in the nutrition system.
As in the previous survey, questionnaire applied to 30 enlisted soldiers who
are chosen randomly. In the second battalion also the commanders of the soldiers
were not in the area where the survey was taken place. After the analysis the
following potential causes of low quality has been figured out
• Only 1.23 % of the responders observed the nutrition system problems as
the main problem of the battalion. This was a severe drop when compared
with the previous military unit (30.95 %), which was using military
cuisine.
• In the second military battalion that we applied the survey enlisted
soldiers chose problems soldier’s club chosen (% 30.86) as the main
problematic area.
• Problems with visitor lounge and visitors hours ranked as the second
main problem (% 27.16).
• Problems with canteen service ranked as 3rd problem (%16.05).
No Code Problematic Area Votes in numbers Votes in percentages1 Ta Nutrition System 1 1,23%2 Tb Cloth-washing System 0 0,00%3 Tc Mass hall Condition 10 12,35%4 Td Bathing System 0 0,00%5 Te Equipments 0 0,00%6 Tf Visitor's Lounge 13 16,05%7 Tg Canteen 22 27,16%8 Th Soldier’s Club 25 30,86%9 Ti Barber Service 9 11,11%
10 Tj Healthcare System 1 1,23%Total 81 100,00%

37
We applied also an additional questionnaire. This additional questionnaire
can be seen on Appendix E. We asked enlisted soldiers in the second infantry
battalion 13 additional comparison questions. Comparison of these two systems was
easy for them because they were the customers of both systems. Catering firm was
serving for two months in this battalion. After the analysis of the questionnaire we
observed great improvement as listed below. Improvement percentages are
calculated directly from the answers given to the comparison questions.
1. Satisfaction after the implementation : % 97 better
2. Portions in meals evaluation : %90 better
3. Evaluation of taste : %100 better
4. Quality of provision in meals : %93 better
5. Warmness of meals : %93 better
6. Fairness of distribution : %86 better
7. Diversity of meals : %71 better
8. Queue in meals : %100 better
9. Consistence in keeping of meals for duty personnel :%93 better
10. Crowd in mass-hall : %52 better
11. Interest of duty NCOs in mass-hall : %81 better
12. Service personnel's interest in hygienic issues : %86 better
13. Service tools' hygiene : %79 better
4.1. COST RELATED ISSUES IN NUTRITION SYSTEM
Introducing a civilian firm to the nutrition system generated
improvements. On the other hand, we thought that we had to deal with the cost
and other issues related with the new system. We interviewed officers in Army

38
headquarters and used cooperative benchmarking with a leading civilian catering
firm serving only to civilian firm in the market.
Using military cuisine system or contracting with a catering firm brings
costs for the Army.
a. Cost related with using military cuisine system;
• Human resources allocated for managing a mass hall and kitchen,
allocating cooks, service personnel, dishwasher personnel, and a duty
officer/NCOs for kitchen and mass hall.
• Time allocated by company commanders and NCOs for managing a
mass-hall and kitchen; responsibilities related with perpetuating a mass-
hall (Equipment responsibilities, hygienic rules, buying cooking and
servicing responsibility load heavy responsibilities that drive commanders
to spare time them).
• Conflicts related with distribution of meals between soldiers.
• Unsatisfied soldiers (which are main customers of the system).
• Allocated personnel to the mass-hall and kitchen do not get enough
military training (Although these personnel will be used in the battlefield
as cooks they have to get elementary military training such as surviving in
battlefield).
• Transportation of provisions from sales points to military kitchen.
• Cleaning cost of mass-hall and sustaining a military dishwashing system.
• Employing a professional cook in the military kitchen.

39
b. Cost related with using catering service;
• Cost of a soldier in military cuisine system and in contracting with
civilian catering firms can be summarized as below. (Table 4.1. and
Appendix F)
- Cost of one personnel in military cuisine system : $ 1,48
- Cost of one personnel when served with catering service : $ 2,00
• Allocated human resources for controlling the activities of the catering
company.
• Efforts for controlling security issues related with catering company.
• Efforts for battle-time readiness (In previous system cooks were doing
their own job what they will do in the battle-time; now additional training
is needed for military cuisine to function in battlefield properly).
4.2. FURTHER STUDIES ON THE OTHER PROBLEM OF NUTRITION SYSTEM
In further team meetings members discussed the other branches of the cause-
and-effect diagram and decided to advise higher command the following measures
and improvements in the nutrition system.
4.2.1. Studies related with problem of crowd in the mass-hall
Results of a short brainstorming session short and long-term solutions for this
problem suggested by the team members were as below:
1. Long-term solutions;
• Building another mass-hall.

40
• Relocating and combining some of the facilities in order to gain a new
place for redecorating a new mass-hall.
• Increasing fast-food alternatives and allowing customers to make choices
between them.
2. Short-term solutions;
• Redecorating mass-hall.
• Increasing distribution desks and increasing service personnel.
4.2.2. Studies related with tools used in distribution desk
and in kitchen;
• Putting scales (as used some of the Turkish fast-food centers) in
distribution desks would decrease complaints related with unfair
distribution of the meal.
• Using tools that are designed especially for each meal for fair distribution
of the food (As used some of the fast food centers such as serving potato
fringes). Using plates for distributing rice; using scale for distributing
meat, using scaled containers for etc.
• Replacing service tools with more elegant ones. Using porcelain service
tools instead of chrome service tools.
4.2.3. Studies related with problems in food diversification;
• Officers/NCOs responsible from nutrition system would use more data
collection methods in order to get more feedback from the customers related
with their tendencies in meal choices.

41
• Officers/NCOs responsible from nutrition system would visit commercial
catering facilities, in the market in order to benchmark the military cuisine.
• An effective quality improvement circle (obviously must be supported by the
steering committee which is the high command levels) could introduce more
creative ideas and would allow more enlisted soldiers to participate in
decision-making process.
• Different brand of provisions would be used in cooking process. Such as
different brand of cooking oil would cause different tastes.
4.2.4. Studies related with human resources in the nutrition
system;
• Attaining personnel to the system to be the owners of the process.
• In distribution and cooking process more educated enlisted soldiers can be
attained.
• In quality improvement circles studies, professional people would be invited
in order to get different perspective on the issue.
• A complaint box would be a deterrent instrument for people who are
accustomed to distribute meals unfairly.
• Rotation of the enlisted soldier who are working in the mass-hall
systematically.
• Officers and NCOs would be motivated to control cooking procedures and
distribution procedures.
• A sergeant or corporal would be attained to coordinate queue between the
distribution desks.
• Using civilian waiters/waitress as service personnel.
• Training of the personnel working in the mass-hall and in the kitchen.

42
4.2.5. Studies related with environment in the nutrition
system;
• Music broadcasting in the mass-hall would create a better atmosphere for the
customers.
• Redecorating the environment (Mass-hall’s painting, locating pictures and
plants, using tablecloths) would create a better environment.
• Locating bench and chairs outside the mass-hall for waiting.
• Locating daily newspaper pages or military lessons on the walls of mass hall
entrance.
4.2.6 Studies related with system;
• Improving relationship with suppliers on providing better provisions to the
nutrition system.
• Giving more emphasis on the standards in accepting suppliers’ service and
provisions.
4.3. A BENCHMARKING STUDY
As a last phase of our study we decided to benchmark military cuisine system
with two civilian-catering firms, one of the firms is already serving to military units,
and the other one only serves to civilian companies.
The main idea for using benchmarking was to identify deficiency in military
cuisine system and try to constitute goals for the system in specific areas that
previously do not have standards.
After the interviews with the civilian-catering companies' managers, and after
the interviews with the officers in the Army headquarters, we prepared a
benchmarking table as can be seen on Table 4.1.

43
In the benchmarking table the Goal column displays acceptable standards in the
Army. Current results column gives military cuisine systems’ data. Benchmarking I
column shows civilian catering firm’s data, which is serving, to military units (first
firm). Benchmarking II column provides a leading civilian catering firm’s data,
which is only serving to civilian companies in the market (second firm).
In the benchmarking study we observed that although first catering firm's
price is cheaper than second company’s prices in the market, it’s 30 percent higher
than military cuisine system’s costs. (Table 4.1.)
1. Cost of producing by using military cuisine : $ 1,48
2. Cost of buying the service from outside : $ 2,00
3. Price paid by civilian companies to civilian catering firm : $2,93-$ 4,00
According to a report submitted to the Ministry of Finance by Army
headquarter; additional resources are needed for applying catering system in the
whole Army. This report’s summary can be seen on Appendix F.
Satisfaction in every issue is higher than expected. In calculating the cost of
foods, which was not consumed by soldiers and wasted was not included. If we take
into consideration these two issues: contracting with a civilian catering firms seems
to be better.
1. Satisfaction rate in military cuisine figured out by questionnaire : 37 %
2. Satisfaction rate in units served by catering firms : 84 %
3. Satisfaction rate in civilian companies served by catering firms : 79 %
While the daily calorie, which, is provided by every institution, do not
change, civilian firms could achieve meal diversification.

44
1. Satisfaction rate in diversification issue in military cuisine : 40 %
2. Satisfaction rate in diversification in units served by catering firms : 68 %
3. Satisfaction rate in diversification in civilian companies : 77 %
We observed that even the service quality and the environment in the second
firm better than the first firm, we obtained higher results in the first one. This was a
controversy. After interviews with the soldiers we learned that responders of the
questionnaires tested both military cuisine system and civilian catering service
system. They had compared both the system and were pleased with the new system.
This phenomenon draw them to vote higher rates on the civilian catering firm’
services.
After the introduction of civilian catering firms to the system soldiers
observed an improvement in issues such as justice in meal distribution, satisfaction
from amount of portions, and taste.

45
Table 4.1. Success factors and BenchmarksSuccess Factors Goal Current
ResultBenchmarking 1 Benchmarking 2
Overall Satisfaction in customers’satisfaction surveys
95% 37,27 % 83,96 % 79,20 %
Daily calorie served 5700 5700 5700 4500-6000 kcalSatisfaction From Diversification In Meals 95 % 40 % 67,86 % 76,80 %Satisfaction From Portions In Meals 95 % 26,67 % 86,67 % 79,20 %Satisfaction From Meal DistributionInjustice
95 % 13,79 % 96,67 % 100 %
Satisfaction of customers from taste ofmeals.
95 % 46,67 % 84,62 % 78 %
Waiting time for a customer in the row. <10 15’-20’ 10’ – 15’ 10’ – 15’Service time in the distribution desk. N.A. 30 sec 28 sec 20 sec.Service time in every meal. 1 hour 2 hours 2 hours 2 hoursSatisfaction from hygienic issues 95 % N.A. 79 % 81,20 %Daily nutrition cost (For an employee) N.A. $ 1,48 $ 2,00 $ 2,93 - $ 4,90Highest wage for a cook N.A. N.A. $ 600 $ 545Do the distribution desk use tools withmeasurement.
Yes No Yes Yes
Satisfaction from meal warmness 95 % 72,41 % 71,43 % 100 %Is there any quality assurance license? To have No ISO 9001 ISO 9001Satisfaction feedback time interval fromcustomer
Monthly In Every 3Months
N.A. In Every 3Months
Does company benchmark regularly? Yes No No NoDoes the company have cooperativebenchmarking partner company?
Yes No No No
Does the company have competitivebenchmarking partner company?
Yes No No No
Does the suppliers work with company foralong period of time or not?
Yes Yes No Yes
Does training available for quality? Yes No Yes YesDoes training available for employees intheir professional areas?
Yes Yes Yes Yes
Does the company use MIS or not? Yes Yes Yes YesDoes the company measures mealtemperatures or not?
Yes No Yes Yes
Is there any internal training Yes Yes Yes YesIs there any outside training Yes No Yes YesIs service available for the customer notable to be on time due to unusual anactivity?
Yes Yes No Yes
Goal column : Acceptable standards by the Army.Current results column : Military cuisine systems’ data.Benchmarking I column : Civilian catering firm’s data, which is also serving military units.In benchmarking II column: A leading civilian catering firm’s data, which is only serving to civiliancompanies in the market.

46
4.4. Summary of 13 Steps Quality ……………..Improvement
4.4.1. Step 1: "Select the process to be improved and establish a well-defined
process improvement objective.”
In the thesis, we applied a survey for assessing the problem areas in the
infantry battalion. After the survey results were analyzed, the soldiers accepted
problems with the nutrition system as the most troubling issue. After establishment of
the quality improvement team, increasing the soldiers' satisfaction in nutrition
system designated as the process improvement objective.
4.4.2. Step 2: “Organize a team to improve the process.”
In Brigade X with the contributions and permission of the Brigade
Commander, a quality improvement team was established. Team was consisted of 9
soldiers and 1 Lieutenant. Assoc. Prof. Erdal EREL was the advisor for the team.
4.4.3. Step 3: “Define the current process using a flowchart.”
The quality improvement team drew the flowchart as displayed on Figure 4.1.
4.4.4.Step 4: “Simplify the process by removing redundant or unnecessary
activities.”
• Getting into the line in front of the mass hall.
• Allocating a platoon everyday for tasks related with nutrition process.
• Gathering all soldiers at the same time in front of the mass hall for
performing the meal.
• Allowing the same soldiers to distribute the meals everyday.
4.4.5.Step 5: “Develop a plan for collecting data and collect baseline data.”
• A member of the team assigned to obtain data from the leading catering
firm’s activities and processes.

47
• A member assigned to collect data from the firm, which is serving for the
Army as the catering firm. (Visiting and surveying soldiers in the
battalion.)
• A member assigned to collect data to figure out dissatisfaction issues in
the nutrition system, in the military cuisine system.
• A quality improvement team assigned in order to discuss and brainstorm
the solutions to the problematic areas.
• A member assigned to interview in Army headquarter about advantages
and disadvantages of the both military cuisine system and contracting for
a catering firm.
4.4.6.Step 6: “Assess whether the process is stable.”
With the data we collected we did not analyze if the system is stable or not.
4.4.7.Step 7: “Assess whether the process is capable.”
We did not analyze if the system was stable or not since the data collected did not allow us to
test this issue.
4.4.8.Step 8: “Identify the root causes which prevent the process from
meeting the objective.”
Problem related with the root causes discussed in Chapter 4.
4.4.9.Step 9: “Develop a plan for implementing a change based on the
possible reasons for the process’s inability to meet the objective set for it.”
According to an interview in the Army headquarter we figured out that the
cost of contracting a civilian catering firm is too much expensive, (benchmarking
table), but solutions generated by the team members in the quality improvement
process could increase satisfaction from the military cuisine system.

48
4.4.10.Step 10: “Test the changed process and collect data.”
Time limitations and hierarchical structure of the Army did not allow us to
test the all the proposals generated by the quality improvement team. Benchmarking
study has verified that the dissatisfaction from the military cuisine system is high.
Introducing a new system increases the satisfaction but causes additional cost to
Army budget.
4.4.11.Step 11: “Assess whether the changed process is stable.”
With the data we collected we did not analyze if the new system is stable or
not.
4.4.12.Step 12: “Assess whether the change improved the process.”
Introducing civilian catering system to Army nutrition system has caused
improvement in the process.
4.4.13.Step 13: “Determine whether additional process improvements are
feasible.”
Even if the civilian catering system is introduced into the Army: additional
preparations are needed in order to transform this system in the battlefield. Leading
companies operating in the market have quality departments. Military units, which
become the main customers of these firms, must cooperate with their quality
departments even have to work within these departments in order to preserve the
satisfaction level from the new system.

49
5. Conclusions and Further ….Research
Our objective in this thesis was to make a short review of the TQM
philosophy and to present what possible advantages could be gained if its tools were
introduced into Turkish Infantry Battalion’s Processes.
Related with our sample study we concluded that, at the first phase short-term
recommendations would be helpful to improve the battalion's nutrition system.
Introducing catering companies to the military nutrition system nearly load
another nearly $ 250,000 cost daily. (Nearly $ 0.50 higher cost incurs for every
soldier by choosing a catering company to contract nutrition system of 500,000-
people populated army). When we discussed with the people from Army
headquarter, they expressed that 10 percent increase in costs would be acceptable for
the Army but at the benchmarking table we faced with more than 30 percent increase
in cost.
Long term recommendations such as employing professional cooks, and
waitresses in the distribution, replacing and increasing the number of tools, building
a better environment, training soldiers who have responsibility in mass-hall and in
the kitchen would help to the process improvement.
Although the recommendations for improvement of process would go on the
solutions would be different for each military unit. The people who are close to the
problems can only observe the best solution for them. Establishment of TQM
philosophy is important for this reason.
Throughout our studies we witnessed that even uneducated enlisted soldiers
were happy that their ideas were asked. They felt they were valuable for their

50
commanders. They were too much enthusiastic with the issues because the result
would affect their daily activities. For this reason we would say that motivation was
the byproduct.
We observed that this philosophy can also a be a perfect tool for the
commanders who want to reduce power distance between their themselves and their
subordinates.
The commander was pleased with the activities performed because the
decisions are already taken by the improvement team would be realized easier since
the decisions already taken by the enlisted soldiers themselves.
There was no cost related with introducing TQM if we neglect training costs.
The other quality assurance systems induce monetary costs.
TQM philosophy seeks continuous improvement and it is accepted an endless
journey. This feature forces all the members of the organizations to improve
themselves continuously and makes TQM different from other quality philosophies.
TQM needs continuous effort to search for the best. If it were not such an effort it
would be nonsense for the Army to adapt such a philosophy since its members
change in every 18 months periods and its service does not have customer directly
experiencing it.
With benchmarking tool TQM allow commanders to see their own units’
deficiencies and take measurement related with it. Having a cooperative
benchmarking partner would provide a communication channel with the outside.
TQM served itself as a perfect communication channel between layers of the
organization too. While we were carrying out our studies, Army branches that have
to cooperate in battlefield found opportunity to communicate freely without barriers.

51
We advise researchers that they must allocate more time for training of the
team. If training is not sufficient for each member of the team, two or three members
carry out most of the workload and rest of the team members’ loose enthusiasm.
In order to obtain better results, we believe such studies need more time.
Although we stressed that 4 or 5 months is sufficient for a process improvement, in
hierarchical organizations, resistance to innovations needs more time to overcome.
Involvement of senior officials in such teams could be effective in
overcoming the resistance to innovations.
Team leader and members must not loose their enthusiasms even they could
not convert their findings into the real life.

52
BIBLIOGRAPHY
1. Addey, J. 2000. Quality Myths and Legends. Journal of Total Quality
Management, Vol.11, pp. 680-685.Yorkshire: Carfax Publishing.
2. Aksit, C. Staff Colonel. 1998. Total Quality Management Applications in
Turkish Army. Ankara: General Staff Headquarter Publications.
3. Ammons, D. 1999. A Proper Mentality for Bencmarking. Public
Administration Review, Mar/Apr99, Vol.59 Issue 2, p.105. North California.
4. Aspinwall, E. & Sha’ri Mohd, Y. 2000. Critical Success Factors In Small and
Medium Enterprises: Survey Results. Journal of Total Quality Management
Vol.11 p.448. Birmingham: Carfax Publishing.
5. Altunes, J. 1994. Total Army Quality Handbook. Texas: Army Logistics
Management College Publications.
6. Berling, C. 2000. Continuous Improvement as Seen from Groups and
Improvement agents. Journal of Total Quality Management, Vol.11, pp. 484-
489. Sweden: Carfax Publishing.
7. Brassard, M. 1991. Managing the Total Quality Transformation. New York:
McGraw-Hill.
8. Bennett, J. B. 1999. Change, Transfer Climate, and Customer Orientation; A
Conceptual Model And Analysis of Change-Driven Training. Journal of
Group & Organization Management, Vol.24, Issue 2, p.188. Carfax
Publishing.

53
9. Boydell, T. & Malcolm, L. 1996. Identifying Training Needs. London:
Institute of personnel and development.
10. Cortada, J. W. and Woods, J.A. 1994 Quality Yearbook, New York:
McGraw-Hill.
11. Davis, S.B. and Goetsch, D.L. 1997. Introduction to Total Quality. New
Jersey: Prentice Hall.
12. Deming W. E. 1982.Out of The Crises. Boston: Massachusetts Institute of
Technology.
13. Duncan, W.L. 1997. Total Quality; Key Terms and Concepts. New York:
Amacom.
14. Juran, J.M. and Gryna, F.M. 1993.Quality Planning and Analysis. New York:
McGraw-Hill.
15. Gabor, A. 1990.The Man Who Discovered Quality- W. Edward Deming. New
York: Random House.
16. Gitlow H., Oppenheim A. & Oppenheim R. 1998. Quality Management Tools
and methods for Improvement. Sydney: Irwin.
17. Hall, T. J. 1992.The Quality Manual. Wiltshire; Dotesios.
18. Imai, M. 1986.Kaizen; The Japan’s Competitive Success. New York:
McGraw-Hill.
19. Kalder. 2000.Training Catalog. Ankara: Rota Publications.

54
20. Kanji, G.K. & Asher M. 1993.Education and Training for Total Quality
Management. Journal of Total Quality Management Vol.4 p.77. Washington
D.C.: Carfax Publishing.
21. KKY 380-3. 1995. Improvements and Developments Activities in Army
Directive. Ankara: General Staff Headquarter Publications.
22. Kondo, Y. 1990. Key points in Quality Control Training Courses for
Managers. Journal of Total Quality Management Vol.1 Issue 3, p.309. Japan:
Carfax Publishing.
23. Lin, B. & Goodrich, H. W. 1995. Air Force Total Quality Management: An
Assessment of Its Effectiveness. Journal of Total Quality Management Vol.6
pp. 243-253. Barksdale: Carfax Publishing.
24. Lincoln, E. J. 1999. Job Security in Japan is Lifetime Employment on the Way
Out? Japan: Brookings Review Vol.17 Issue 44 p. 44.
25. Milakovich, M. E. 1995. Improving Service Quality: Achieving High
Performance in the Public and Private Sectors. New York.
26. Military Academy (KHO). 1998.Quality Handbook. Ankara: Military
Academy. Publications.
27. Military Academy (KHO). 1999.Quality Assurance System Procedures.
Ankara: Military Academy Publications.
28. Neves, J.S. 1993.The Baldrige Award Framework for teaching Total Quality
Management Pennsylvania: Journal of Education for Business Vol.69, Issue 2
p. 121.

55
29. Oaklands. J. & Waterworth D. R. 1995.Total Quality Management Training:
a review and suggested framework Journal of Total Quality Management
Vol.6 pp.299-315.West Yorkshire: Carfax Publishing.
30. Pavlov, Y. 1994.Soviet-Cuban Alliances. New Brunswick: Transaction
Publishers.
31. Robson, M. 1984.Quality Circles in Action. Worcester; Billings and Sons.
32. Rogers, R. E. 1997.Implementation of TQM; A Comprehensive Training
Program Binghamton: The Haworth Press-Hill.
33. Saylor, J. H. 1996.TQM Simplified; A practical Guide. New York: McGraw-
Hill.
34. Scholtes, P. R. 1996.The Team Handbook: New York: Oriel Inc.
35. Scherkenbach, W. 1991.Deming Route to Quality and Productivity; Road
Maps and Roadblocks. New York: Mercury Press.
36. Shewhart, W.E. 1931.Economic Control of Manufactured Product. New
York: Van Nostrand Press.
37. Spain, C.A. & Wishnoff, R. 1996.Chart Your Own Course: Strategic
Planning Tools for Business Leader. New York: Applied So Press.
38. Spencer, J. 1994.Total Army Quality Handbook Preliminary Draft. Austin:
University of Texas.
39. Spendolini M. & Friedel D. 2000Benchmarking: Devising Best Practices
From Others. Birmingham: Carfax Publishing.

56
40. Terziovski M. Sohal A. & Samson D. 1996.Best implementation of Total
Quality Management: Multiple cross-case analyses of manufacturing and
service organizations. Journal of Total Quality Management Vol.7 pp.450-
481. Melbourne: Carfax Publishing.
41. Tonnessen, T. 2000.Process Improvement and the Human Factor. Journal of
Total Quality Management, Vol.11, pp. 773-778.Norway: Carfax Publishing.
42. U.S. Department of Defense. 1998.Data Collection. Washington D.C.: Office
of. Secretary of Defense Quality Management Office Publications.
43. U.S. Department of Defense. 1998.Small Business Guide To Quality
Management. . Washington D.C.: Office of Secretary of Defense Quality
Management Office. Publications.
44. U.S. Office of Personnel Management. 1991.Federal Total Quality
Handbook Series. #TQMHB, 1991. Washington D.C.: U.S. Office of
Personnel Management Department Publications.
45. U.S. Department of Defense. 1990.A Two-Volume Guide for Defense
Organizations, Vol: 2. Washington D.C.: U.S. Department of Defense
Publications.
46. U.S. Department of Defense. 1998.Process Improvement. Washington D.C.:
Office of Secretary of Defense Quality Management Office Publications.
47. U.S. Department of Navy. 1990.System Approach To Process Improvement
Lecture Notes: Washington D.C.: U.S. Department of Navy Publications.
57
48. U.S. Department of the Army. 1990.Concepts of Quality and Quality
Improvement Process. Washington D.C.: U.S. Department of Defense
Publications.
49. Yong, J. & Wilkinson, A. 2001. Rethinking Total Quality Management.
Journal of Total Quality Management Vol.12 pp.247-258. Leicester: Carfax
Publishing.
50. White, A. 1996.Continues Quality Improvement. London; Judy Piatkus
Publisher.

58
WEBLIOGRAPHY
1. Crosby Institution
http://www.phlipcrosby.com/mainhtm
2. Deming Institution
http://www.deming.org
3. Efqm (European Foundations for Quality Management).
http://www.efqm.org
4. Kalder (Quality Institution in Turkey)
http://www.kalder.org
5. Library of Department of Defense of U.S.
http://www.dtic.mil/c3i/bprcd
6. Office of Defense Quality in U.S.
http://web5.whs.osd.mil
http://www.dod.gov
7. U.S. of America Quality Production Library
http://www.apqc.org
8. World Quality Awards
http://www.americanquality.com/qualityawards.htm

59
APPENDICES
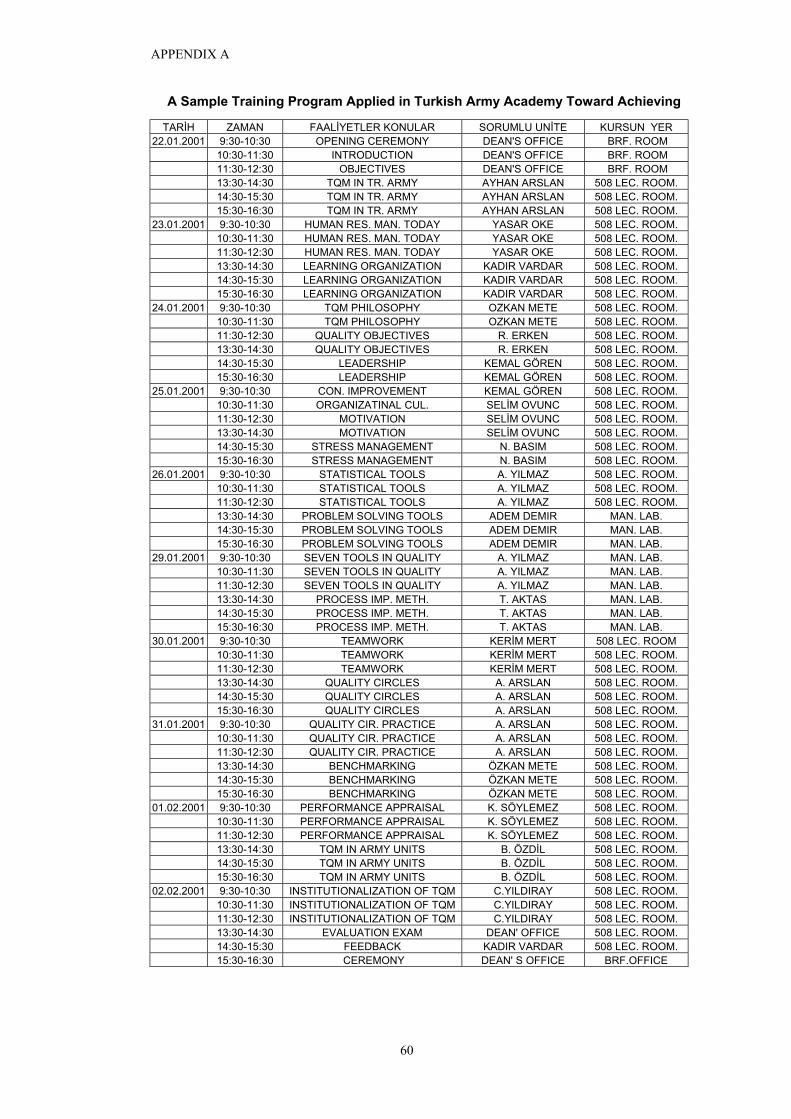
APPENDIX A
60
A Sample Training Program Applied in Turkish Army Academy Toward Achieving
TARİH ZAMAN FAALİYETLER KONULAR SORUMLU UNİTE KURSUN YER22.01.2001 9:30-10:30 OPENING CEREMONY DEAN'S OFFICE BRF. ROOM
10:30-11:30 INTRODUCTION DEAN'S OFFICE BRF. ROOM 11:30-12:30 OBJECTIVES DEAN'S OFFICE BRF. ROOM 13:30-14:30 TQM IN TR. ARMY AYHAN ARSLAN 508 LEC. ROOM. 14:30-15:30 TQM IN TR. ARMY AYHAN ARSLAN 508 LEC. ROOM. 15:30-16:30 TQM IN TR. ARMY AYHAN ARSLAN 508 LEC. ROOM.
23.01.2001 9:30-10:30 HUMAN RES. MAN. TODAY YASAR OKE 508 LEC. ROOM. 10:30-11:30 HUMAN RES. MAN. TODAY YASAR OKE 508 LEC. ROOM. 11:30-12:30 HUMAN RES. MAN. TODAY YASAR OKE 508 LEC. ROOM. 13:30-14:30 LEARNING ORGANIZATION KADIR VARDAR 508 LEC. ROOM. 14:30-15:30 LEARNING ORGANIZATION KADIR VARDAR 508 LEC. ROOM. 15:30-16:30 LEARNING ORGANIZATION KADIR VARDAR 508 LEC. ROOM.
24.01.2001 9:30-10:30 TQM PHILOSOPHY OZKAN METE 508 LEC. ROOM. 10:30-11:30 TQM PHILOSOPHY OZKAN METE 508 LEC. ROOM. 11:30-12:30 QUALITY OBJECTIVES R. ERKEN 508 LEC. ROOM. 13:30-14:30 QUALITY OBJECTIVES R. ERKEN 508 LEC. ROOM. 14:30-15:30 LEADERSHIP KEMAL GÖREN 508 LEC. ROOM. 15:30-16:30 LEADERSHIP KEMAL GÖREN 508 LEC. ROOM.
25.01.2001 9:30-10:30 CON. IMPROVEMENT KEMAL GÖREN 508 LEC. ROOM. 10:30-11:30 ORGANIZATINAL CUL. SELİM OVUNC 508 LEC. ROOM. 11:30-12:30 MOTIVATION SELİM OVUNC 508 LEC. ROOM. 13:30-14:30 MOTIVATION SELİM OVUNC 508 LEC. ROOM. 14:30-15:30 STRESS MANAGEMENT N. BASIM 508 LEC. ROOM. 15:30-16:30 STRESS MANAGEMENT N. BASIM 508 LEC. ROOM.
26.01.2001 9:30-10:30 STATISTICAL TOOLS A. YILMAZ 508 LEC. ROOM. 10:30-11:30 STATISTICAL TOOLS A. YILMAZ 508 LEC. ROOM. 11:30-12:30 STATISTICAL TOOLS A. YILMAZ 508 LEC. ROOM. 13:30-14:30 PROBLEM SOLVING TOOLS ADEM DEMIR MAN. LAB. 14:30-15:30 PROBLEM SOLVING TOOLS ADEM DEMIR MAN. LAB. 15:30-16:30 PROBLEM SOLVING TOOLS ADEM DEMIR MAN. LAB.
29.01.2001 9:30-10:30 SEVEN TOOLS IN QUALITY A. YILMAZ MAN. LAB. 10:30-11:30 SEVEN TOOLS IN QUALITY A. YILMAZ MAN. LAB. 11:30-12:30 SEVEN TOOLS IN QUALITY A. YILMAZ MAN. LAB. 13:30-14:30 PROCESS IMP. METH. T. AKTAS MAN. LAB. 14:30-15:30 PROCESS IMP. METH. T. AKTAS MAN. LAB. 15:30-16:30 PROCESS IMP. METH. T. AKTAS MAN. LAB.
30.01.2001 9:30-10:30 TEAMWORK KERİM MERT 508 LEC. ROOM 10:30-11:30 TEAMWORK KERİM MERT 508 LEC. ROOM. 11:30-12:30 TEAMWORK KERİM MERT 508 LEC. ROOM. 13:30-14:30 QUALITY CIRCLES A. ARSLAN 508 LEC. ROOM. 14:30-15:30 QUALITY CIRCLES A. ARSLAN 508 LEC. ROOM. 15:30-16:30 QUALITY CIRCLES A. ARSLAN 508 LEC. ROOM.
31.01.2001 9:30-10:30 QUALITY CIR. PRACTICE A. ARSLAN 508 LEC. ROOM. 10:30-11:30 QUALITY CIR. PRACTICE A. ARSLAN 508 LEC. ROOM. 11:30-12:30 QUALITY CIR. PRACTICE A. ARSLAN 508 LEC. ROOM. 13:30-14:30 BENCHMARKING ÖZKAN METE 508 LEC. ROOM. 14:30-15:30 BENCHMARKING ÖZKAN METE 508 LEC. ROOM. 15:30-16:30 BENCHMARKING ÖZKAN METE 508 LEC. ROOM.
01.02.2001 9:30-10:30 PERFORMANCE APPRAISAL K. SÖYLEMEZ 508 LEC. ROOM. 10:30-11:30 PERFORMANCE APPRAISAL K. SÖYLEMEZ 508 LEC. ROOM. 11:30-12:30 PERFORMANCE APPRAISAL K. SÖYLEMEZ 508 LEC. ROOM. 13:30-14:30 TQM IN ARMY UNITS B. ÖZDİL 508 LEC. ROOM. 14:30-15:30 TQM IN ARMY UNITS B. ÖZDİL 508 LEC. ROOM. 15:30-16:30 TQM IN ARMY UNITS B. ÖZDİL 508 LEC. ROOM.
02.02.2001 9:30-10:30 INSTITUTIONALIZATION OF TQM C.YILDIRAY 508 LEC. ROOM. 10:30-11:30 INSTITUTIONALIZATION OF TQM C.YILDIRAY 508 LEC. ROOM. 11:30-12:30 INSTITUTIONALIZATION OF TQM C.YILDIRAY 508 LEC. ROOM. 13:30-14:30 EVALUATION EXAM DEAN' OFFICE 508 LEC. ROOM. 14:30-15:30 FEEDBACK KADIR VARDAR 508 LEC. ROOM. 15:30-16:30 CEREMONY DEAN' S OFFICE BRF.OFFICE

APPENDIX B
61
X PİYADE TUGAYI PROBLEM ANALIZ ANKETI1. Taburda veya tugayda size sunulan hizmetlerden en çok
sıkıntıçektiğiniz 3 tanesini işaretleyiniz.a. (.......) Yemek sistemib. (.......) Çamaşırhane sitemic. (.......) Koğuşların durumud. (.......) Banyo durumue. (.......) İstihkakların dağıtımıf. (.......) Nizamiye-ziyaretçi kabul yeri.g. (.......) Kantin hizmetih. (.......) Mehmetçik gazinosui. (.......) Berber hizmetij. (.......) Revir hizmetik. .....................................................l. .....................................................
2. Yemeklerle ilgili aşağıdaki soruları cevaplandırınız ?
a. Yemekler az çıkıyor mu ?. Doyuyor musunuz ? Doyuyoruz Doymuyoruzb. Yemekler lezzetli mi ? Lezzetli Lezzetli değilc. Yemekler soğuk çıkıyor mu ? Soğuk Soğuk değild. Yemeklerin dağıtımı adil oluyor mu ?
Adil Adil değile. Yemeklerin çeşidi yeterli mi ?
Çeşit yeterli Hep aynı yemekler çıkıyorf. Yemek almak için çok sıra bekliyor musunuz?
Çok sıra var Sıra var ama uzun sürmüyor.
Diğer ........................................................................................................................
3. Çamaşırhane sistemi ile ilgili sıkıntılarınızı belirtiniz
a. Çamaşırlar iyi yıkanıyor mu ? Yıkanıyor Yıkanmıyor, elde yıkıyoruz.
b. Çamaşırlar kayboluyor mu ? Kayboluyor Tam olarak geri geliyor.
c. Çamaşır yıkama sırası çok uzun zamanda mı geliyor ? Normal Yeterli değil
d. Çamaşırlarınız yıkamadan sonra yıpranıyor mu? Normal Çok yıpranıyor Diğer ...................................................................................................................

APPENDIX B
62
4. Koğuşlar ile ilgili sıkıntılarınızı belirtiniz.
a. Koğuşlar kalabalık mı ? Kalabalık Koğuşlar yeterlib. Koğuşlar bölgesinde hava ağır mı / kokuyor mu. Doğru Yanlışc. Koğuşlarda gürültü oluyor mu ? Gürültülü Gürültülü değil.d. Diğer ............................................................................................
5. Banyo hizmeti ile ilgili sıkıntılarınızı belirtiniz.
a. Banyo kabinleri temizliği yeterli mi ? Temiz Temiz değilb. Sıcak su herkese yetiyor mu ? Yeterli Yetersizc. Banyo kabinleri yeterli geliyor mu ? Yeterli Yetersizd. Görevli personel uygun davranış gösteriyor mu ? Gösteriyor Göstermiyor.
Diğer ............................................................................................
6. Mehmetçik gazinosu/kantin hizmetleri ile ilgili sıkıntılarınızı belirtiniz.
a. Gazino/kantin çalışma saatlerinden memnun musunuz? Memnunum Memnun değilimb. Çalışan personelden memnun musunuz? Memnunum Memnun değilimc. Satılan malların kalitesi ve fiyatı hakkında ne düşünüyorsunuz? Kaliteli-pahalı Kaliteli-ucuz Kalitesiz-pahalı Kalitesiz-ucuzd. Kantin ve gazino ihtiyaçlarımıza cevap veriyor mu İhtiyacımı karşılıyor İhtiyacımı karşılamıyore. Satılan malların çeşitleri yeterli mi ? Yeterli Yetersizf. Kantinde ve gazinoda devamlı istenen (sigara vs) mallar her zaman
var mı ? Her zaman bulunuyor Bulunmuyor
Diğer ............................................................................................
7. Revir hizmetinin işleyişi ile ilgili sıkıntılarınızı belirtiniz.a. Hastalara yeterli zaman ayrılıyor mu? Yeterli ilgi var Hastaya ilgi azb. İlaçlarınızı zamanında alabiliyor musunuz? Zamanında alırız Zamanında gelmiyor.c. Revirde çok sıra bekleniyor mu? Normal Çok sıra oluyor.

APPENDIX B
63
d. Sivil hayatınızla karşılaştırırsanız size sunulan sağlık hizmeti? Daha iyi Daha kötü
Diğer ............................................................................................
8. İstihkaklar ile ilgili sıkıntılarınızı belirtiniz.
a. Bütün İstihkaklarınız alabiliyor musunuz ? Evet, alıyoruz Hayır, alamıyoruz
b. Dağıtılan istihkaklar yeterli mi ? Yeterli Yeterli değilc. Dağıtılan istihkamlar size uyan ölçülerde(bedende) mi dağılıyor ? Uymuyor Uygund. Dağıtılan istihkak dayanıklı ve kullanışlı mı? Değil Dayanıklı ve kullanışlı
Diğer ..........................................................................
9. ŞİMDİ sizden istenen yukarıdaki belirtilen veya belirtilmeyen (siz yazın)aksaklıklardan en önemlisini ve nedenlerini varsa tekliflerinizle birlikteyazınız.
En önemli sıkıtımız şudur; .....................................................................
Sonraki sıkıntımız ...................................................................................
Sonraki sıkıntımız....................................................................................
Bu sorunların halledilmesi için benim tekliflerim şunlardır;
1............................................................................................................................................................................................................................
2................................................................................................................ .............................................................................................................
3................................................................................................................ . .............................................................................................................

APPENDIX C
64
X ARMORED BRIGADE PROBLEM ASSESSMENT SURVEY RESULTS
1. Main problem analysis related with nutrition system
• Portions in meals are not satisfactory: % 73.33
• Meals are not delicious: % 53. 33
• Meals are cold: % 27.59
• Meals are not distributed fairly: % 86.21
• Meal diversification is not enough: % 60
• Meals queue is long: % 75
2. Main problem analysis related with cloth-washing system
• Clothes washed by the soldiers themselves: % 54.17
• Clothes don't return as they handed in number: % 12.75
• Cloth washing turn come late: % 52.38
• Washing machines makes the clothes worn out: % 11. 11
3. Main problem analysis related with dormitories system
• Dormitories are crowded: % 45.83
• Dormitories have bad air-conditioning: % 87.50
• Dormitories are noisy: % 52.38
4. Main problem analysis related with bathing system
• Shower cabins are not clean enough: % 53.85
• Hot water are not sufficient for all of them: % 89.66
• Shower cabins are not enough: % 96.43
• People responsible from the shower system don't serve well: % 15.38
No Code Problematic Area Votes in numbers Votes in percentages1 Ta Nutrition System 26 30.95%2 Tb Cloth-washing System 5 5.95%3 Tc Dormitory Condition 0 0.00%4 Td Bathing System 10 11.90%5 Te Equipment 5 5.95%6 Tf Visitor's Lounge 15 17.86%7 Tg Canteen 16 19.05%8 Th Soldiers' Club 2 2.38%9 Ti Barber Service 0 0.00%
10 Tj HealthCare System 5 5.95%Total 84 100.00%

APPENDIX C
65
5. Main problem analysis related with canteen and soldier's club
• Working hours of canteen and club not as expected: % 46.63
• People serving there are not appropriate: % 48.28
• Products can be judged as qualified and expensive: % 61.90
• Products sold don't satisfy needs: % 57.14
• Product diversity is not enough: % 72.41
• It is not possible to find basic needs (Such as cigarette) every time: % 79.31
6. Main problem analysis related with HealthCare
• Time allocated for diagnosis is not enough: % 78.57
• Our medicine don't arrive on time: % 20
• Too much time spent on queue: % 48.15
• Current HealthCare is worse than civilian life: % 76
7. Main problem analysis related with equipment
• Too much time spent on queue: % 48.15
• Not get all equipments allocated: % 23. 33
• Equipments are not enough: % 63. 33
• Equipments don't fit: % 80
• Equipments are not qualified and durable: % 24.14

APPENDIX D 20 / 05 / 2001
66
QUALITY TEAM CHARTER
Name :Team HarmonyChartered By : X th. Armored Brigade _____________________Team Leader : Org./Unit/Code PhoneCaptain G.Kasımlıoğlu Infantry Battalion 2045
Team Facilitator : Org./Unit/Code PhoneMajor A. Yılmaz Infantry Battalion 2018
Team Link : Org./Unit/Code PhoneSergent K. Korkmaz Signal Battalion 2222
Name Org./Unit/Code Phone
1. Ahmet Karslı Infantry Battalion 2115
2. Ali Yurdakul Infantry Battalion 2115
3. Tayfun Kılıç Infantry Battalion 2115
4. Ahmet Fidan Infantry Battalion 2115
5. Murat Süslü Infantry Battalion 2115
6. İlhami Aslan Infantry Battalion 2115
7. Kültigin Canıtez Infantry Battalion 2115
8. Ayhan İşbilir Infantry Battalion 2115
9. Orhan Kanlıer Infantry Battalion 2115
10. Cemil Utku Infantry Battalion 2115

APPENDIX D 20 / 05 / 2001
67
QUALITY TEAM CHARTER (Continued)
Military Nutrition System of X Infantry Battalion.
1. Improvement in tastes.2. Improvement in satisfaction of soldiers from the meals.3. Improvement in cost (if possible)
1. Military cooking system in infantry battalion’s barracks.2. Civilian catering services.3. Human resources of Infantry battalion. (For measuring satisfaction)
1. Current satisfaction and trial of each alternatives will be reported in weeklyperiods.
2. Cost analysis of each alternative will be reported in monthly period.3. quality improvement teams every meeting will be reported after each
meeting.
1. Every alternatives tried and proposal will be submitted following theimprovement team establishment due.
PROCESS SELECTED FOR IMPROVEMENT
PROCESS IMPROVEMENT GOALS
RESOURCES
REPORTING REQUIREMENTS
SUGGESTED TIMELINE

APPENDIX E
68
İAŞE SİSTEMLERİ KIYASLAMA ANKETİA. Daha önce kendi mutfağımızla pişen yemekle kıyaslayarak aşağıdaki
soruları cevaplayınız.
1. Doyuruculuk açısından değerlendirin. (Assess the satisfactionfrom the meals)
Eskiden daha çok doyuyorduk Şimdi daha çok doyuyoruz
2. Porsiyonları değerlendirin.(Assess portions)
Eskiden daha iyiydi Şimdi daha iyi, yeterli
3. Lezzet açısından değerlendirin (Assess meals taste)
Eskiden daha lezzetliydi Şimdi daha lezzetli
4. Sizce yemeklerde kullanılan malzemeyi kaliteli mi (Assess theprovision quality)
Eskiden daha kaliteliydi. Şimdi daha kaliteli
5. Yemeklerin sıcaklığını değerlendirin. (Assess the warmness ofmeals)
Eskiden daha memnunduk Şimdi memnunuz.
6. Yemeklerin dağıtımı adil oluyor mu?(Is the meal distributedfairly?)
Adil Adil değil
7. Yemeklerin çeşidi yeterli mi ? (Assess the diversification in meals)
Çeşit yeterli Hep aynı yemekler çıkıyor
8. Yemek almak için çok sıra bekliyor musunuz? (Assess the timewaited in line before the meals)
Eskiden daha az sıra olurdu Şimdi daha az sıra var
9. Dış görev, nöbet durumunda yemekleriniz muhafaza ediliyormu? (Is your meal kept for you when you are away for a task ?)
Yemeğimiz ayrılmıyor. Yemeğimiz ayrılıyor
10. Yemekhane kalabalık mı? (Is mass hall crowded?)
Normal Kalabalık

APPENDIX E
69
11. Yemekhanede yemek dağıtımı ile nöbetçi subay / astsubaylarınızilgileniyor mu ? (Is your commander interested in your mealsdistribution?)
Evet ilgileniyor. Hayır ilgilenilmiyor.
12. Servis yapan personel temizliğine dikkat ediyor mu? (Do theservice personnels obey the hygienic rules?)
Evet ediyor. Hayır etmiyor.
13. Yemekhanedeki servisler temiz(hijyenik) mi ? (Do service toolsclean enough ?)
Evet ediyor. Hayır etmiyor.

APPENDIX F
70
MSB.LIĞINCA BİLDİRİLEN YILLIK ORTALAMA GÜNLÜK YEMEK
MALİYET ÇİZELGESİ
ERBAŞ VE ER ORTA DERECE
AS. ÖĞC.
YÜKSEK DERECE
AS.ÖĞC.
YİYECEK BEDELİ 1,506,734 1,868,918 2,230,660
Elektrik Bedeli 16,183 16,183 16,183
Su Miktarı 58,033 58,033 58,033
Isıtma Bedeli 55,636 55,636 55,636
Pişirme Bedeli 1,205 1,205 1,205
PERSONEL
Astsubay 3,466 3,466 3,466
Sivil Memur 19,494 19,494 19,494
Erbaş-Er 184,104 184,104 184,104
Bakım Onarım Bedeli 11,019 11,019 11,019
Temizlik Bedeli 17,735 17,735 17,735
Nakliye Bedeli 11,058 11,058 11,058
Depolama Bedeli 113 113 113
Genel Giderler Toplamı 378,046 378,046 378,046
GENEL TOPLAM 1,884,780 2,246,964 2,605,706
Uygun Bedel 2,350,000 2,950,000 3,500,000
Fark 465,220 703,036 891,294