total company-wide management system: case · pdf filetotal company-wide management system:...
TRANSCRIPT

The Official Electronic Publication of The Association of Technology, Management, and Applied Engineering • www.atmae.org
© 2010
Total Company-Wide Management System: Case Studies
By Dr. Souraj Salah, Professor Abdur Rahim, and Dr. Juan A. Carretero
Volume 26, Number 1 - January 2010 through March 2010
Peer-RefereedApplied Papers
LeadershipLean Manufacturing / Six Sigma
ManagementManufacturing
Project ManagementQuality
Quality Control
KeyWord SearCh

2
Journal of Industrial Technology • Volume 26, Number 1 • January 2010 through March 2010 • www.atmae.org
Total Company-Wide Management System: Case StudiesBy Dr. Souraj Salah, Professor Abdur Rahim, & Dr. Juan A. Carretero
AbstractFor organizations to be successful, the use of well-structured management systems (MSs), a quality management (QM) approach and continuous im-provement (CI) methodologies, such as Lean Six Sigma (LSS), are essential. In many industries, CI methodologies and MSs are separately implemented, either formally or informally. The effective integration of MSs with CI interventions ensures strategic align-ment of all activities and provides an industry with a competitive advantage. LSS is a modern and widely accepted methodology for CI. It can fit under the umbrella of total quality management (TQM), as both methodologies share the goals of pursuing customer satis-faction and business profit. MSs are structured approaches to manage the various aspects of business in an orga-nization. Recently, different MSs have gained more attention as they form a critical infrastructure for improving and controlling the different areas of operating an organization. Classi-cally, different CI methodologies are implemented without being properly integrated with MSs. This is one of the main reasons why lots of implementa-tion efforts of CI methodologies fail. The recently proposed Total Company-Wide Management System (TCWMS) is a comprehensive system that repre-sents a new evolution in QM and covers different aspects of the management disciplines including strategic manage-ment, initiative management, process management, daily management and performance management. It provides a solid structure and a foundation for all activities of a business, core value chain and value-enabling activities to ensure the proper alignment of all people and processes. This will lead to the optimi-
zation of resources and enhancement of performance. In this paper, this integration is illustrated in a practi-cal way through two empirical case studies, at Company A and Company B. These case studies will demonstrate and prove quantitatively, how effective the TCWMS integration is, through the comparison of both the pre-application status and the post-application status. This paper will discuss the two case studies, including survey results of employees in an effort to verify the theoretical TCWMS model.
Introduction The effective execution of continuous improvement (CI) methodologies is an important success factor for any organi-zation. As competition gets tougher, the rate of improvement and optimization of processes determines the survival of most organizations. Among vari-ous quality management (QM) and CI methodologies, Six Sigma and Lean stand out as excellent methodologies that are widely used by various indus-tries. They are currently referred to as the state of the art (Arnheiter and Maleyeff, 2005) and as the method-ologies yielding the greatest impact (Kumar et al., 2008). The integration of the two into Lean Six Sigma (LSS) has created a strong methodology that is well-known and accepted (Bhuiyan and Baghel, 2005; Bendell, 2006; Snee and Hoerl, 2007). However, even with the best methodologies in place, numer-ous studies have pointed out that most industries are failing in their CI efforts (Devane, 2004; Bhasin and Burcher, 2006). Two of the reasons why deploy-ment fails, are organizational misalign-ment and ad-hoc approach, as they lead to scattered projects across the organi-zation (Martin, 2007).
Souraj Salah is a Ph.D. Candidate studying at the Department of Mechan-ical Engineering at the University of New Brunswick, Canada. He received Graduate Student Award for 2007/2008 and 2008/2009. He is also a certified Lean Six Sigma Master Black Belt and a registered professional engineer.
Abdur Rahim is a Professor of Quantita-tive Methods, Quality Control, Inventory Control, Reliability, Production Manage-ment, Operations Management and Total Quality Management at the Faculty of Business Administration at the Univer-sity of New Brunswick, Canada.
Juan A. Carretero is an Associate Professor of Computer Simulation of Mechanical Systems, Optimization in Design, and Robotics at the Department of Mechanical Engineering at the Uni-versity of New Brunswick, Canada.

3
Journal of Industrial Technology • Volume 26, Number 1 • January 2010 through March 2010 • www.atmae.org
Many industrial organizations are not realizing the full potential of what QM and CI methodologies, integrated together, along with a proper compre-hensive management system (MS) can achieve for them. There are several cas-es of failure in implementing improve-ment projects and maintaining their benefits (Devane, 2004; Bhasin and Burcher, 2006). These failures result in the tremendous waste of energy, re-sources and in some cases, the closure of industrial facilities. Success is likely to be in the proper total integration of various MSs and CI methodologies. This will achieve the goal of aligned and optimal CI leading to optimal quality, productivity, efficiency, etc., which is expected to make a significant contribution to all stakeholders, includ-ing owners, workers, customers and society in general. Different researchers have indicated that there is a need for a comprehensive MS that will serve as a foundation to ensure proper alignment and optimization of all resources in an industry (Chapman and Hyland, 1997; Kaye and Anderson, 1999; Stankard, 2002; McAdam and Evans, 2004; Dahlgaard and Dahlgaard-Park, 2006). Only a few researchers have started looking into this topic and this work is an attempt to pave the way towards this integration. Recent studies on the integration of CI and MSs can be found in (Friday-Stroud and Sutterfield, 2007; Cheng, 2008; Salah et al., 2010).
In this paper, an investigation of the im-plementation of Total Company-Wide Management System (TCWMS) is carried out through two empirical-case studies to explore its effectiveness. This proposed holistic MS focuses on pro-viding benefits across the supply chain for all stakeholders, such as, customer satisfaction and economic production. The two empirical studies, including the comparative evaluation of TCWMS effect on the performance of the com-panies, are significant from a practical system reengineering and management point of view. They provide insight into how a company can implement a total company-wide quality culture as well as a solid infrastructure for managing and improving its processes.
Total Company-Wide Management System (TCWMS)The traditional way of doing business is to have two (or more) separate enti-ties: one is managing the business and the other is improving the business. However, there is great advantage in integrating these two entities with each other. In the TCWMS environment proposed here, a strong integration can be achieved where everyone becomes aligned with the CI objectives such that they find out how to improve the pro-cess as they work inside that process. The proposed TCWMS is a compre-hensive system that encompasses many different aspects of the management disciplines. It mainly draws on five MSs which are grouped into strategic management, project management, daily management, process manage-ment (which incorporates total quality management (TQM) and CI method-ologies) and performance management. These five MSs may be further detailed to include various MS sub-components such as financial, customer relations, culture, resources, communication, CI, documentation, etc.
In the 18-organization study of Kaye and Anderson (1999), some displayed weaknesses such as: CI activities were insufficiently integrated, time was wasted on blaming people instead of dealing with problems, a low-level of empowerment existed and people seemed to always be in crisis (trying to fight problems and their symptoms by quick fixes without paying proper attention to root causes). TCWMS promotes “effective asking and listen-ing”; it focuses on achieving consensus among everyone in the team regarding the decision made. Everyone is guaran-teed the right to express agreement or disagreement. This fosters the proper attitude, boosts morale for success in any change initiative and establishes a sense of ownership. Every individual becomes accountable, through their actions, for what the customer and busi-ness require. This leads to operational excellence. TCWMS can be considered as an organization governance system. It provides organizations the ability to
align people and operations in the same strategic direction. This can be done through the integration of different MSs to achieve control in an “entrepreneur-ial and ethical way” (Hilb, 2006) in or-der to satisfy the desired targets. Also, TCWMS promotes participative man-agement, which involves and empowers employees and builds a culture of total quality and cooperation. The proposed system’s name (TCWMS) was partially derived from the well-known Japanese company-wide quality control (CWQC) system to stress the importance of creating a comprehensive system that ensures optimum quality from the per-spective of the whole society.
The TCWMS provides a solid structure and a foundation for all activities of a business, the core value chain and the value-enabling activities, to ensure their proper alignment which will result in the optimization of resources and enhancement of performance. Organi-zations running without a robust MS like TCWMS show symptoms such as: initiatives failure, lack of focus on processes and people, quick decisions which are not based on data, and people frustration (Kaye and Anderson, 1999).
TCWMS helps establish an infra-structure plus a CI supportive culture of learning, information sharing, and empowerment with accountability. It increases the rate of improvement, by faster implementation of more projects along with better selection of the proper teams and projects of highest impact. It also reduces risks and compensates for the weaknesses of an individual methodology or system.
Components of TCWMSIn the literature, different components of management are found under differ-ent names. These components have not necessarily been used together. The five components of TCWMS are within dif-ferent sub-disciplines of management and the tools used, within these com-ponents, are generally acknowledged. However, the grouping and connection of these components with each other represents the novelty of the TCWMS. It is because of these groupings and

4
Journal of Industrial Technology • Volume 26, Number 1 • January 2010 through March 2010 • www.atmae.org
connections that the TCWMS provides a solid infrastructure for running and improving processes. The five TCWMS components are strategic manage-ment, project management, operation management, process management and performance management. Following, is a short description of each of these components.
1. Strategic managementStrategic management is a process for developing achievable strategic plans and deploying them, to be implemented at all levels, to ensure the proper align-ment of the organization as a whole. The strategic management approach promoted by TCWMS is a participa-tive approach, where management-by-objective is successful by adding a bottom-up approach to convey the ac-tions or method of achievement. So, the focus is on the “how” and not only on the “who”, which can shift people from being demoralized to being encouraged to express, through transparent system thinking, their concerns and ideas. An important tool used within strategic management is the balanced score card (BSC), which is also a performance management tool used to enhance the application of QM tools, such as ISO, LSS, TQM and business excellence models (Anderson et al., 2004). A step-by-step approach to strategic manage-ment is explained as follows: Form a cross-functional team, benchmark against competitors, perform PEST (i.e., political, economic, social and technological) analysis, perform SWOT (strengths, weaknesses, opportuni-ties and threats) analysis, use quality function deployment (QFD) to identify enabling strategies (based on customer and employee surveys, financial and operational reports), establish a vi-sion, mission and strategic goals, link the strategic goals to the BSC using KPIs, identify obstacles preventing the organization from achieving its strate-gic goals, develop initiatives to over-come these obstacles using the Hoshin X-matrix and transform them into operations, assign initiatives to teams, and ensure alignment of the goals with operational tasks.
2. Initiative managementAlso referred to as project manage-ment or cross-functional management, initiative management is about manag-ing the execution or deployment of the strategy. It depends on clear account-ability (Kaplan and Norton, 2006). The key goal for strategic initiatives is to improve the business, in the right direction, which satisfies the strategic objectives. The evaluation of strategic initiatives includes continuous re-views of progress against plan, using feedback systems (Friday-Stroud and Sutterfield, 2007). Another key part of project management is the manage-ment of information flow across an organization. This is essential for the implementation and improvement of quality management systems (QMSs) (Zeng et al., 2007). A step-by-step approach to project management is explained as follows: Select initiatives and teams, involve and empower the team members, train and support teams, clarify roles and set-up clear measur-able targets, manage the execution of initiatives and monitor progress, focus on the technical and human aspects of change including culture, and develop a strategy to capture knowledge and transfer learning.
3. Daily managementDaily or operations management is about following-up with the people who execute the assigned tasks (which are related to projects and operations plans) on a daily or regular basis, to ensure they are being done properly and on time. It ensures that people understand how their daily activities contribute to the satisfaction of the stra-tegic goals and eventually the custom-ers of the company. A lot of companies have incorporated TQM and other CI approaches into their daily management (Yang, 2004). Deming emphasized the importance of daily CI (Walton, 1990). The check-act part of the Deming cycle (i.e., Plan-Do-Check-Act or PDCA) is the focus of daily management, where the check part of the cycle is about evaluating the results and understand-ing the reasons for any deviations from expectations and the act part is about taking corrective actions. A step-by-
step approach to daily management is explained as follows: follow-up with the people who execute tasks, ensure that all people understand how their work affects the strategic goals, set-up a communication plan and a real-time reporting system to support decision-making, set-up meetings at all levels of the organization including agendas, KPIs, actions and variances, incorpo-rate CI approaches into daily activities, and implement a visual management approach.
4. Process managementAs known from the basic concepts of TQM, most activities done in busi-ness can be defined, or thought of, as processes connected together to form a system for work (Snee, 2004). These processes and their variations must be measured and understood before they can be controlled and improved. Also, processes should be looked at from the perspective of the customer and there should be equal attention given to the process and the results. Process management can be defined as a group of practices that provide better stew-ardship of business processes, through the use of process measures, tools and documentation (Motwani et al., 2004). Process Management is a method for managers to select, organize, and man-age the design, standardization, stabili-zation, and improvement of processes. A step-by-step approach to process management is explained as follows: assign process owners, define operating polices and responsibilities, select pri-oritized processes to start improvement using CI methodologies such as LSS and process flow charts, and develop standardized procedures.
5. Performance managementPerformance management is concerned with defining what employees should be doing and the ongoing communi-cation during the year that links the individual performance to the organi-zational needs (which lead to customer satisfaction) along with the evaluation and appraisal of performance.
Basu (2004) included the selection and application of key performance indi-

5
Journal of Industrial Technology • Volume 26, Number 1 • January 2010 through March 2010 • www.atmae.org
cators (KPIs) as part of performance management. The successful imple-mentation of measures of performance, through cultural change, can lead to a management style that is more partici-pative and consultative and can drive CI (Bititci et al., 2006). Incentives are a key part of performance management and improvement. The main purpose for incentives is to motivate employ-ees. They should reward, in a balanced way, based on individual and team performance, to encourage improve-ments and team spirit. Out of different aspects of individual human resources management, Yang (2006) found that training, incentives and development had the greatest impact on TQM. Simi-larly, TCWMS heavily depends on the social aspect of human resources, as it strengthens human relations and facili-tates cultural change. A step-by-step approach to performance management is explained as follows: define employ-ees’ job responsibilities and measurable objectives, define a performance-based incentive program, conduct interim per-formance review as well as a year-end review to build-up a development plan, and develop the organization’s human capabilities.
Auditing of TCWMSThe establishment of an assessment method is critical to success in imple-menting the TCWMS. It can simply take the form of an assessment sheet, where scoring criteria can be used to guide an organization through the implementation and maintenance process of the system. The following is a description of the criteria for each component of the system:1. Strategic management: The crite-
ria include the documentation and understanding of the vision, mission, values, strategies and objectives. They also include the use of BSC, by the people at different levels of the organization, as well as, the continu-ous communication and commit-ment.
2. Project management: The criteria include the chartering and execu-tion of initiatives including proper project and team selection. They also include the application of change
or transformation methodology, the involvement of people in establish-ing initiatives, conducting regular reviews, the documentation of the MS and the proper communication.
3. Process management: The criteria include process documentation and mapping across the different busi-ness levels (containing the identifica-tion of responsibilities and policies, as well as, the use of points of measurements including KPIs). They also include the use of CI method-ologies and tools, the monitoring of processes and the overall standard-ization and certification.
4. Operations management: The criteria include the documentation and execution of daily plans, the sched-uled meetings (for KPIs and progress reviews) conducted at all organiza-tional levels and the understanding of how people’s daily work can impact the business.
5. Performance management: The criteria include the documentation of individual performance improve-ment plans, conducting performance reviews at all levels of organization regularly, management evaluation by employees, the communication of commitments, training plans and their application, performance-based salary increases and the standardiza-tion of all processes.
Based on these criteria, a scoring sys-tem can be easily developed to indicate how an organization is performing, with regards to TCWMS, using an index that is based on a five-point scale. Each MS of the five listed above is assigned a score out of five points. The total audit score is the average of the
five scores of these five MSs. Table 1 shows an index which can be used in the auditing process. This index repre-sents a quantitative and objective as-sessment of how close a company is to fully achieve TCWMS culture. The use of this index has an advantage over the use of subjective questionnaire assess-ments, which may include some bias from the participants. This index also helps in understanding and translating the definition of TCWMS into a road-map format to facilitate its implementa-tion. Next, the research questions and prepositions are developed in prepara-tion for the two case studies.
Research questions development:The reason for developing a set of research questions is to refine and focus the research. The main questions of this research are:Research question no. 1: Does the ap-
propriate integration of CI method-ologies and MSs into TCWMS align people and operations in the strategic direction to achieve better financial performance results?
Research question no. 2: Does the implementation of TCWMS produce a better productivity improvement than what is obtained in the same period of time at the same company when TCWMS is not applied?
Research question no. 3: Does the ap-propriate integration of CI method-ologies and MSs into TCWMS align people and operations in the strategic direction to achieve better customer satisfaction results?
Research question no. 4: Does the ap-propriate integration of CI method-ologies and MSs into TCWMS align people and operations in the strategic
TCWMS Index Performance Level
1 not existing, not established or not communicated
2 partially established and partially communicated
3 mostly developed to a good and steady level
4 developed, mostly understood and evolving
5 standardized best practices documented, understood and followed
Table 1. The TCWMS five-level index

6
Journal of Industrial Technology • Volume 26, Number 1 • January 2010 through March 2010 • www.atmae.org
direction to achieve better employee satisfaction results?
Research question no. 5: Does the implementation of the TCWMS achieve better performance results than what is obtained in the same period of time at the same company when TCWMS is not applied?
Research question no. 6: Does the appropriate integration of CI meth-odologies and MSs into TCWMS establish a culture of alignment, communication, cooperation, mo-tivation, CI, trust, engagement and empowerment?
The first three research questions will be mainly tested through BSC KPIs in the two case studies. Research ques-tions no. 4, 5 and 6 will be tested through the CEO interview in the case of Company A and an employee survey in the case of Company B. The em-ployee survey utilized four prepositions as follows.
Research Propositions:The research prepositions (which can be thought of as success factors) and the corresponding research questions regarding the proposed TCWMS model are described as follows:
Proposition A: AlignmentA successful organization should en-sure alignment of all people and opera-tions across the whole business where all individuals participate in strategic management. Employees should un-derstand the business strategy and how their work contributes to the strategic goals of the organization. They should be encouraged to work on CI. Their supervisors should provide them with feedback on their performance and identify training opportunities for them (Preposition A corresponds to Research questions no. 4 and 6).
Proposition B: CommunicationA successful organization should ensure effective communication exists across the whole business where all in-dividuals are well- informed. Employ-ees should be provided with timely in-formation about the company and own unit performance updates. They should
be kept informed about the different challenges faced, corrective actions taken and the achievements and con-tributions made by the company. They should be receiving information that helps CI (Preposition B corresponds to Research questions no. 5 and 6).
Proposition C: LeadershipSupervisors should provide employees with performance expectations and the assistance needed to enable them to do their work. Employees should feel free to express opinions to their supervisors. Employees should be treated fairly and respectfully by their supervisors. Supervisors should provide good coaching, listen to employees concerns and should ask for their ideas and opinions for CI. Supervisors should inform employees when they do some-thing good. Supervisors should inform employees about company challenges, performance and their career develop-ment plans (Preposition C corresponds to Research questions no. 4 and 6).
Proposition D: MotivationEmployees should feel proud of work-ing for the company, feel good about its future and their future with it. They should feel good about the amount of work assigned to them and satisfied with work conditions and safety. They should receive sufficient training, be equipped with sufficient resources and acquire sufficient knowledge to per-form their jobs. They should be work-ing in teams involved in CI. Rules and regulations should not interfere with their jobs (Preposition D corresponds to Research questions no. 5 and 6).
Case studiesThe comparison of measurements of performance (i.e., KPIs), before and after improvements is very important to objectively assess a change process (Seen et al., 2001). Two case studies, at Company A and Company B, are used to verify the theoretical model quanti-tatively. This is done through a contrast of the scenarios before and after the TCWMS implementation. BSC KPIs are selected and monitored, to be used in the benchmarking and comparison of the standing, prior and after the
implementation of the integrated model proposed here (i.e., TCWMS). Also, the index for measuring the maturity of an organization’s application of all aspects of TCWMS is audited and the survey results are analyzed to test the above research questions. These case studies will further prove how practical this integration is to different organizations. For proprietary reasons, the names of the two companies and some specifics on the processes are not mentioned. Notwithstanding, very few details were changed as not to have the actual facts and experiences misrepresented. According to contingency theory, there is not one single method for business operation, which can be applied to all situations (Foster, 2007). These two case studies are an attempt to validate the TCWMS effectiveness and how helpful it can be to the performance of an organization if properly imple-mented.
Case study 1The first case study is about Company A, which is a Canadian manufacturer of specific fabricated wood products. The company was established 50 years ago. It is one of the largest regional pro-ducers which serves mainly the North American market and employs about 150 people. The company started the implementation of all of the elements of TCWMS, including process reen-gineering and LSS, in 2004. Prior to that, the company only had a few Six Sigma projects implemented, but no formal MS. In addition to manufactur-ing processes, this empirical study also includes the application of TCWMS to transactional or service-providing processes, such as purchasing and warrantee. Factors chosen are the BSC KPIs since they are used to measure the performance of the company. The data required for the validation was obtained from the company records over a period of about four years. Data was collected from sources that included production records, sales records and accounting.
The BSC has KPIs which are listed under four categories: financial, cus-tomer, process and people. Each KPI has a weight of points that add up to the

7
Journal of Industrial Technology • Volume 26, Number 1 • January 2010 through March 2010 • www.atmae.org
total 200 points of the BSC. Achiev-ing the baseline performance, which is the same as last year performance for a KPI, gets the company a score of half the points assigned to that KPI. Achiev-ing the target score for the current year gets a company three quarters of the total points and achieving the stretch goal set by the company gets it the full points. The second row of Table 2 shows the rates of improvement for two reporting periods (i.e., 2004-2005 and 2006-2007). It clearly shows that the rate of improvement (which is calculated from the total BSC results of one year compared to the past year) significantly increased after the imple-mentation of TCWMS started. More particularly, in 2006 and 2007, the company started exceeding its targeted performance for the year (score is > 150 points). Also, Table 2 (see rows 3-8) lists some actual results provided by the company CEO. These outstand-ing results were accomplished after the implementation of TCWMS. It shows a snap-shot of the actual values before and after the deployment (i.e., 2004 baseline and the end of 2007). These items were selected to demonstrate effectiveness of TCWMS since they were outstanding. A key indicator for self-assessment against competition is measuring the rate of improvement or rate of change.
In general, the weights assigned to each individual KPI may change from one year to the next as well as some KPIs may be deleted or replaced. On the other hand, for a comparison to be more accurate from one year to an-other, it is suggested to use a weighted average for each parameter for all of the years within the comparison period (four years in the present case). This results in an absolute comparison as opposed to a customary comparison of the year by year rate of improvement based on a different weight for each year. Additionally, since in the present case some KPIs were not collected for every year, some KPIs with missing data were taken off the comparison (see Table 2, rows 9-16). Some data was not available for other KPIs in some years due to the fact that some
Table 2. Comparison of measures results before and after the implementation of TCWMS and which research questions they positively support (Company A)
Measures Data sources Before After
Positively supporting research question no.
Rate of improvement above last year
BSC overall score
31% (the aver-age for 2004 and 2005 is 131/200)
56%( the av-erage for 2006 and 2007 is 156/200)
5
Financial standing CEO interview
Losing money in the order of hundreds of thousands of dollars
Making money in the order of millions of dollars
1
Productivity CEO interview Baseline 20% improve-
ment 2
On-time delivery CEO interview 26% 98% 3
Customer satisfaction
CEO interview 60% 96% 3
Employee survey for motivation
CEO interview 55% 71% 4 and 6
Employee turnover CEO interview 30% 7% 4 and 6
Return on invest-ment
BSC (absolute) 83% 87% (i.e., 4%
improvement) 1
Gross margin % BSC (absolute) 83%
100% (i.e., 21% improvement)
1
Regional market share
BSC (absolute) 45%
75% (i.e., 67% improvement)
3 and 5
Customer satisfac-tion
BSC (absolute) 75%
85% (i.e., 13% improvement)
3
Fleet utilization BSC (absolute) 65%
85% (i.e., 31% improvement)
5
Turnover - indirect employees
BSC (absolute) 0% 90% 4 and 6
Employee survey results
BSC (absolute) 37%
50% (i.e., 36% improvement)
4 and 6
% score achieved out of the total weighted average (only for the seven KPIs above)
BSC (absolute) 56%
82% (i.e., 46% improvement)
5
8
Journal of Industrial Technology • Volume 26, Number 1 • January 2010 through March 2010 • www.atmae.org
KPIs were removed from the list as new KPIs got introduced. As a result, only seven KPIs are listed, as they all had data available for the listed years. These BSC KPIs were tracked since the start of the TCWMS implementation in 2004 and the next three years after. These KPIs were collected over time and summaries of their results are listed in the table.
Table 2 (see rows 9-16) shows a per-centage improvement in the average weighted score for 2004 and 2005 (be-fore and during the start of implementa-tion) compared to the average weighted scores for 2006 and 2007 (after imple-mentation). It is also important to note that if a KPI had a score of 5.0 out of 10.0 points for a year, its percentage improvement above the previous year is 0 % since the mid score is the same as the score for the previous year. A score of 7.5 is equivalent to 50% improve-ment and so on.
It is obvious from the data in general in Table 2 that major changes and improvements were achieved once the new system was implemented. For example, the financial situation of the company turned from being non-profitable in the order of hundreds of thousands of dollars into becoming profitable in the order of millions of dollars while the regional market share improved by 67% despite the fact that the market demand decreased by about 14% over the same period (Canada Mortgage and Housing Corporation, 2009; National Association of Home Builders, 2009). In addition, great cost reduction was realized which is seen through the 21% improvement in gross margin and the 20% improvement in productivity. Also, there were improve-ments of 13% in customer satisfaction and 36% in employee survey results.
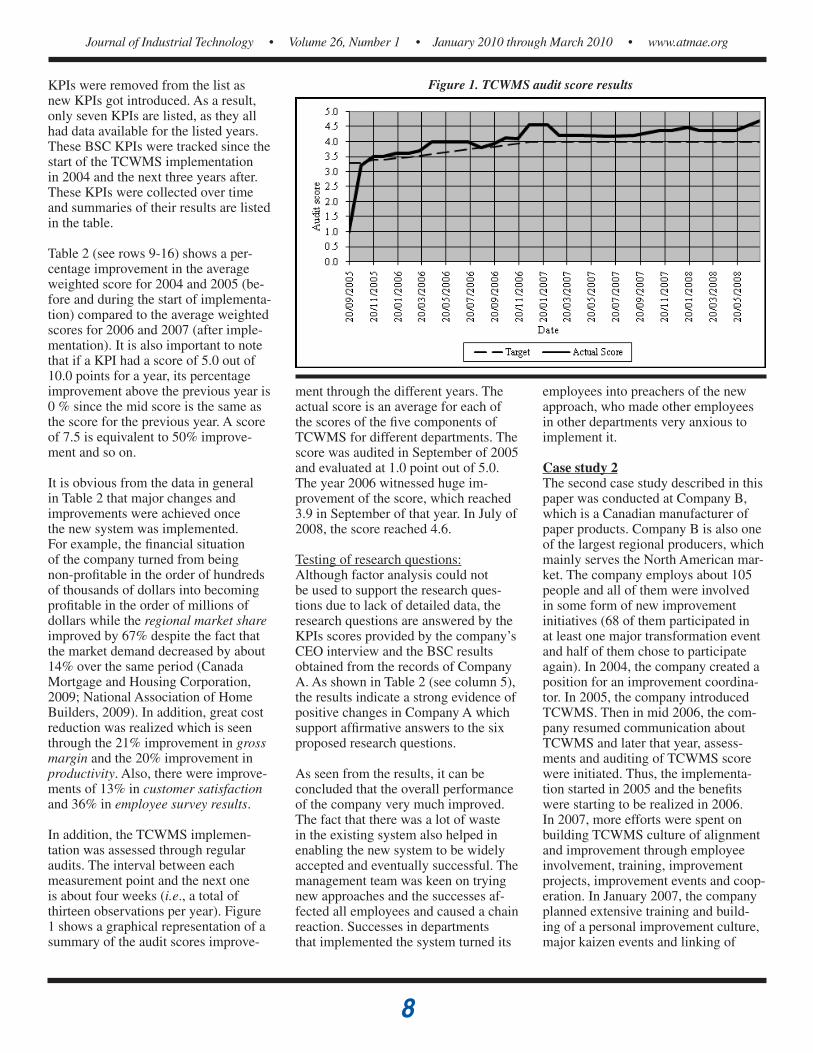
In addition, the TCWMS implemen-tation was assessed through regular audits. The interval between each measurement point and the next one is about four weeks (i.e., a total of thirteen observations per year). Figure 1 shows a graphical representation of a summary of the audit scores improve-
ment through the different years. The actual score is an average for each of the scores of the five components of TCWMS for different departments. The score was audited in September of 2005 and evaluated at 1.0 point out of 5.0. The year 2006 witnessed huge im-provement of the score, which reached 3.9 in September of that year. In July of 2008, the score reached 4.6.
Testing of research questions:Although factor analysis could not be used to support the research ques-tions due to lack of detailed data, the research questions are answered by the KPIs scores provided by the company’s CEO interview and the BSC results obtained from the records of Company A. As shown in Table 2 (see column 5), the results indicate a strong evidence of positive changes in Company A which support affirmative answers to the six proposed research questions.
As seen from the results, it can be concluded that the overall performance of the company very much improved. The fact that there was a lot of waste in the existing system also helped in enabling the new system to be widely accepted and eventually successful. The management team was keen on trying new approaches and the successes af-fected all employees and caused a chain reaction. Successes in departments that implemented the system turned its
employees into preachers of the new approach, who made other employees in other departments very anxious to implement it.
Case study 2The second case study described in this paper was conducted at Company B, which is a Canadian manufacturer of paper products. Company B is also one of the largest regional producers, which mainly serves the North American mar-ket. The company employs about 105 people and all of them were involved in some form of new improvement initiatives (68 of them participated in at least one major transformation event and half of them chose to participate again). In 2004, the company created a position for an improvement coordina-tor. In 2005, the company introduced TCWMS. Then in mid 2006, the com-pany resumed communication about TCWMS and later that year, assess-ments and auditing of TCWMS score were initiated. Thus, the implementa-tion started in 2005 and the benefits were starting to be realized in 2006. In 2007, more efforts were spent on building TCWMS culture of alignment and improvement through employee involvement, training, improvement projects, improvement events and coop-eration. In January 2007, the company planned extensive training and build-ing of a personal improvement culture, major kaizen events and linking of
Figure 1. TCWMS audit score results

9
Journal of Industrial Technology • Volume 26, Number 1 • January 2010 through March 2010 • www.atmae.org
TCWMS to critical issues and business planning. The company introduced white belt training to include people at the shop floor and train them on TCWMS and CI tools. Thus, the whole company was prepared to adapt for the requirements of TCWMS, without forcing TCWMS into the company or people. The deployment process also included training of the manage-ment team. The business experience of the deployment leaders was a key asset through the implementation. The circumstances were helpful as people were willing to try the new system in hope for a major improvement and change from the inferior circumstances they were experiencing.
BSC data was obtained from different accounting and production records. Table 3 shows the BSC results for sev-en years, including the milestones and rates of improvement. It clearly shows that the rate of improvement (which is calculated from the total BSC results of one year compared to the past year) significantly increased after the imple-mentation of TCWMS started. More particularly, in 2006, 2007 and 2008, the company started exceeding its tar-geted performance for every year (score is > 150 points). The overall score for 2004, prior to the implementation of TCWMS, was 128/200 points whereas the score for 2008, after the implemen-tation of TCWMS was 178/200 points.
In general, the weights assigned to each individual KPI may change from one year to the next and some KPIs may be deleted or replaced. On the other hand, for a comparison to be more accurate from one year to another, it is suggested to use a weighted average for all of the years within the comparison period (four years in the present case). This results in an absolute comparison as opposed to the customary comparison of the year by year rate of improve-ment based on a different weight for each year. As it was the case for the first case study, some KPIs were not collected for every year. Therefore, as it was done before, the KPIs with missing data were taken off the comparison to allow for the desired absolute com-
parison (see Table 4). As a result, only five KPIs in the two reporting periods (i.e., 2004-2005 and 2006-2007) were listed as these years had data avail-able for these KPIs. It is obvious from the data in Table 4 that major changes and improvements were achieved once the new system was implemented. For instance, the % of flexible budget
improved by 10%, in-house rejects improved by 30% whereas people recorded safety incident rate improved by 182%.
Employee survey:To present an additional understanding of the effect of TCWMS on a company and its employees, this case study
Year Mile stonesBSC results out of 200 points
Rate of improvement above previous year
Before2002 Management and supervisors
changes 114 14%
2003 Production line rebuilt 76 -24%
Starting2004 Improvement and TCWMS
Coordinator assigned 128 28%
2005 Started implementation of TCWMS 139 39%
After
2006TCWMS culture deployment and communication. Started realizing gains.
163 63%
2007
Continued TCWMS deploy-ment at all levels through training, Kaizen events, CI integration, business planning, etc.
161 61%
2008 Continued TCWMS deploy-ment including CI 178 78%
Measures Before After% Improvement (af-ter implementation compared to before)
Supporting research question no.
% of flexible budget 86% 95% 10% 1
Total suspended solids 58% 75% 30% 5
Production line in-house rejects 90% 100% 11% 3 and 5
Production/operating day 77% 79% 3% 2
People recorded safety incident rate 26% 73% 182% 4 and 5
Total BSC Score 66% 82% 23% 5
Table 3. BSC results achieved at Company B out of 200 points (Note: All data for 2008 are as of September, 6)
Table 4. Comparison of the BSC absolute results for same KPIs before and after the implementation of TCWMS and which research questions they positively support
(Company B)

10
Journal of Industrial Technology • Volume 26, Number 1 • January 2010 through March 2010 • www.atmae.org
utilized a quantitative research method. This method used data collected through self-administered question-naire survey studies, in addition to the archived records of KPIs. These questionnaires were filled by both hourly and staff employees and were believed to be more appropriate than other forms of surveys, such as face-to-face interviews due to the associated costs (see Table 5 for details on the population and sample sizes). These
Items 2004 2007 % improve-ment
Positively support research question no.
I receive regular performance feedback. 47% 81% 73% 4 and 6I know the business strategies and KPIs very well. 84% 85% 2% 4 and 6I have got sufficient training to improve my skills and do my job. 47% 65% 38% 4 and 6Total alignment score 59% 77% 30% 4 and 6I receive regular feedback on company and own unit performance. 88% 91% 4% 6The communication flows effectively through the company and I receive the information and timely updates about business issues. 71% 70% -1%
I receive updates on company contributions to the community. 49% 66% 35% 6The business information I receive assists me and my team to continuously improve. 59% 60% 1% 5
I receive regular updates about the challenges facing the company and the actions taken. 63% 63% 0%
Total communication score 66% 70% 6% 5 and 6My manager always communicates my expected performance level. 65% 83% 26% 6Members of my team are treated fairly. 45% 81% 81% 4 and 6My manager regularly supports and assists me to do a better job. 67% 80% 19% 4 and 6My manager regularly encourages me to offer ideas or suggestions. 61% 72% 18% 4 and 6My manager pays attention to my concerns and problems. 69% 80% 15% 4 and 6I am satisfied with the respect I receive from my manager. 73% 89% 21% 4 and 6My manager provides a positive role model. 57% 79% 38% 4 and 6My manager recognizes me when I do a good job. 71% 75% 5% Total leadership score 64% 80% 25% 4 and 6I am proud to say that I work for the company. 78% 71% -8% I comfortably believe the company has an exciting future. 84% 88% 5% 6I am contented with the training and resources I got to do my job. 74% 77% 4% 6I am satisfied with the amount of work I am expected to do. 59% 62% 6% 6There is a good team spirit among employees at the company. 71% 86% 21% 6Safety procedures are a common practice at the company. 82% 83% 1% 6My team is committed to excellence and continuous improvement. 61% 70% 14% 5 and 6I am contented with my working conditions. 77% 77% 0% Total motivation score 73% 77% 5% 5 and 6Average for all 66% 76% 15% 4, 5 and 6Total employees 106 97 Participants in survey 49 80 Participation ratio 46% 82%
employee surveys were conducted to assess total alignment, leadership, communication and motivation. Each of these categories or survey sections had a list of several related questions or items ranging from three to eight items (i.e., 3 items in Alignment, 5 items in communication, 8 items in leadership and 8 items in motivation). The respon-dents were asked to rate the agreement level for each item. There are a total of 24 questions or items. The questions
are in the common five-level Likert scale format. One of the main purposes for this survey is to evaluate the type of environment and culture the employees are encompassed by at Company B. The format of a typical five-level Likert item is: (1) strongly disagree, (2) disagree, (3) neither agree nor disagree, (4) agree, and (5) strongly Agree.
In this case study, the coverage of the proposed survey to the studied matter
Table 5. Summary of detailed survey measures and which research question they positively support (Company B). Note: The first column items were adapted from (Human Resources Development Council, 1992; Stat Pac, 1997; Peter Barron Stark Companies, 2004)

11
Journal of Industrial Technology • Volume 26, Number 1 • January 2010 through March 2010 • www.atmae.org
has been validated by the researchers and industry experts. It is evident from the data presented in Table 5, that all of the four sections in the survey demon-strated an improvement in the evalu-ation by the employees, from 2004 to 2007. However, it is worth noting that the survey has limitations, due to participants’ subjectivity, participation rates and turnover. Overall, the average evaluation score increased by 15% to point toward a quite meaningful favor-able response which reveals another evident indication of the TCWMS effectiveness.
Testing of research questions:Although detailed factor analysis could not be performed to support the re-search questions due to lack of detailed data (except for the case of statistically testing the means of the employee survey results), the research questions are supported by the scores provided by the company employee survey and the BSC KPIs results. As shown in Tables 4 and 5, the results indicate a strong evidence of positive changes in Company B which support the ac-ceptance of affirmative answers to the six proposed research questions (23% improvement in the BSC KPIs results and 15% improvement in the employee survey results). Also, Table 5 shows the detailed employee survey studies results of a survey done in 2004 before the implementation of TCWMS and the same done in 2007 after the imple-mentation. The first column of the table shows a list of 24 items distributed in four sections (i.e., alignment, commu-nication, leadership and motivation), as adapted from (Human Resources Development Council, 1992; Stat Pac, 1997; Peter Barron Stark Companies, 2004). The table clearly shows that ev-ery item of the list of 24 has improved with the exception of only two items that demonstrated some declining re-sult. This, however, is countered by the positive results of multiple other items within the same sections which demon-strated greater improvements where the overall results show 15% improvement for all survey items. Moreover, the 24 survey items or data points of 2004 were compared to the 24 data points of
2007 to investigate if the means of the 2007 survey results were significantly greater than those for 2004 or not for the same questions (paired). Normality tests of the 2004 and 2007 means were conducted respectively using Minitab and the results indicated that there was not enough statistical evidence to reject the null hypothesis (Ho: data is normal) versus the alternative hypothesis (Ha:
data is not normal) since the P-value in each case was greater than 0.05 (i.e., 0.7 and 0.5 respectively). Then, a paired t-test was used to compare the differences between the two means of 2004 means and 2007 means. The data provided sufficient statistical evidence to reject the null hypothesis (Ho: µ1= µ2) in favor of the alternative hypoth-esis (Ha: µ1< µ2) and indicate that the
Table 6. Paired t-test results for the means of 2004 and 2007 survey results (using Minitab)
0.0-0.1-0.2-0.3-0.4
X_
Ho
Differences
Boxplot of Differences(with Ho and 95% t-confidence interval for the mean)
N Mean Standard of deviation Standard error mean
2004 24 0.6675 0.1239 0.0253
2007 24 0.7642 0.09 0.0184
Differences 24 -0.0967 0.1087 0.0222
95% upper bound for mean difference: -0.0587
T-test of mean difference = 0 (versus < 0): T-value = -4.36, P-value = 0.000
TCWMS component End of 2006 Quarter1 2007 Quarter2 2007Strategic management 4.33 4.33 5.00Daily management 3.00 3.00 3.00Initiative management 2.60 5.00 5.00Process management 2.00 2.00 2.33Performance management 2.83 2.83 4.00TCWMS total score (out of 5 points)
2.95 3.43 3.87
Table 7. TCWMS audit score results
Figure 2. Box plot results for the differences between the means of 2004 and 2007 survey results (using Minitab)

12
Journal of Industrial Technology • Volume 26, Number 1 • January 2010 through March 2010 • www.atmae.org
mean of the means of 2007 is greater than the one for 2004 since the P-value was less than 0.05. This is another indication of the effectiveness of the implementation of TCWMS (See Table 6). Also, box plot of the difference between the means provide visual evi-dence of the same result (See Figure 2).
Furthermore, the implementation of the TCWMS was assessed through regular audits. The interval between each measurement point and the next one is about thirteen weeks (i.e. a total of four observations per year). Table 7 presents a summary of the audit scores improvement through three different years. These audits or reports were filled by department managers and inspected by the process improvement head to ensure validity. The score was first audited in 2005 and evaluated at a baseline of 1.0 point out of 5.0. The year 2006 witnessed huge improvement of the score, which reached 2.95 at the end of that year.
Summary and conclusionsThe TCWMS presents a new QM evolution, which provides a solid foun-dation for all activities of a business, to ensure that proper alignment and communication exist. This leads to the optimization of the resources and en-hances the performance of an organiza-tion. The TCWMS is a comprehensive MS, which includes aspects of business management and improvement, with the goal of business and people align-ment and excellence. The use of such a well-structured system, that engages the entire organization into CI, is essential to survive and stay competitive.
The TCWMS consists of five main MS groups: strategic management, proj-ect management, daily management, process management and performance management. TCWMS can be seen as an extension and expansion for TQM. CI methodologies such as LSS, QMS, ISO 9001, safety MS, Malcolm Baldri-ge National Quality Award or MBNQA, TQM, etc., are all encompassed by the process MS. Process management is the base component of TCWMS, as every-thing runs as a process and quality does
encompass everything that happens in an organization. TCWMS achieves the integration of management prin-ciples, improvement methodologies, implementation practices and cultural change.
The two case studies of focus in this work provide a valuable reference for researchers and practitioner who consider implementing the TCWMS in other industries. The evidence from these case studies strongly suggests that TCWMS can be implemented to achieve alignment, optimize perfor-mance, reduce costs and improve the business. In each case study, several KPIs were used to validate the theo-retical model by comparisons of their statuses prior and after implementation. In addition, results from the CEO inter-view in the case of Company A and the employee survey in the case of Compa-ny B, were analyzed to test the research questions concerning the implementa-tion of TCWMS. The results clearly imply that TCWMS helps improve the overall business performance, financial health, productivity, customer and em-ployee satisfaction, strategic alignment, employee motivation and the rates of improvement.
Additionally, in this work, a verification method was developed and deployed at two Canadian manufacturing compa-nies. However, more empirical tests are required to provide further perspective regarding practical execution problems in other industries. The two case stud-ies helped in assessing the effects of the TCWMS implementation through performance contrasts. The assump-tion that the TCWMS will solve all industrial problems, wherever they are, is a limitation since it may not hold at another organization with different structure and culture or under other cir-cumstances, which may not have been included in the study. Other limitations lie in the choice of relevant indicators for the comparison, the measurement and recording of data, difficulties in controlling the organizations’ environ-ments from the effects of other events, and the lack of resources to conduct more surveys and collect detailed
data. Organization situations affect the implementation either in favor or against. However, this system requires and helps culture change and spreads a culture of innovation and flexibility, where everyone in the organization thinks of improvements, as they do their jobs. It is important to note that the management commitment, orga-nization effort, culture management, proper deployment and strong leader-ship are key critical success factors for the TCWMS implementation. An equal effort should be spent on the people in order to transform the culture (people improvement) and not only on process improvement projects. The implemen-tation of TCWMS in two companies provides an illustration of the signifi-cant advantages that can be achieved by this comprehensive system. There are some key lessons learned from the case studies. They show that with the implementation of TCWMS, significant performance improvement results can be accomplished. They also show that TCWMS can help companies improve faster by creating a strong foundation for all activities supporting the business management and improvement.
There is a wide variety of influential factors that may or may not contribute to the success of the TCWMS imple-mentation at a company. Also, the improvement rates are influenced by factors such as the implementation time interval and the level of success. In these two case studies, an attempt was made to assess the TCWMS effective-ness. However, the use of data from two companies only, is a limitation as it may not be robust enough to make a generalization about the benefits of TCWMS to all companies in differ-ent industries. The results of these two studies can be more reliable and less bi-ased by the use of more experiments in other companies. In sum, it is important to emphasize that the results of these two empirical studies evidently indicate that this TCWMS does indeed optimize the performance of the organization and achieves better improvements and lower costs and that the results obtained can be replicated elsewhere in the fu-ture, by adopting this TCWMS.

13
Journal of Industrial Technology • Volume 26, Number 1 • January 2010 through March 2010 • www.atmae.org
Finally, the TCWMS requires fur-ther evolution in the future to be more robust and comprehensive to all aspects of business management and improve-ment. A new mathematical model needs to be developed to present the quan-titative aspect of this integration that is aimed at achieving optimal CI. The model needs to address the problem of slow rates of CI, by integrating a total company-wide management structure to the CI structure, so that the rate of improvement is maximized, profit is maximized and cost of running an orga-nization is minimized.
AcknowledgmentThe authors would like to acknowledge the reviewers for their constructive comments and thank Kim Wilson for her help in proof editing.
ReferencesAmerican Productivity and Quality Cen-
ter (APQC). (2008). Retrieved April 11, from http://www.apqc.org/portal/apqc/site.
Andersen, H. V., Lawrie, G. and Savic, N. (2004). Effective quality man-agement through third-generation balanced scorecard. International Journal of Productivity and Perfor-mance Management, 53(7), 634-645.
Anderson, R., Eriksson, H. and Torstens-son, H. (2006). Similarities and dif-ferences between TQM, Six Sigma and Lean. The TQM Magazine, 18(3), 282-296.
Arnheiter, E. D. and Maleyeff, J. (2005). Research and concepts: The integra-tion of Lean Management and Six Sigma. The TQM Magazine, 17(1), 5-18.
Basu, R. (2004). Six-Sigma to opera-tional excellence: Role of tools and techniques. International Journal of Six Sigma and Competitive Advan-tage, 1(1), 44-64.
Bendell, T. (2006). A review and com-parison of Six Sigma and the Lean organizations. The TQM Magazine, 18(3), 255-262.
Bhasin, S. and Burcher, P. (2006). Lean viewed as a philosophy. Journal of Manufacturing Technology Manage-ment, 17(1), 56-72.
Bhuiyan, N. and Baghel, A. (2005). An overview of continuous improve-ment: From the past to the present. Management Decision, 43(5), 761-771.
Bititci, U. S., Mendibil, K., Nuduru-pati, S., Garengo, P. And Turner, T. (2006). Dynamics of performance measurement and organizational culture. International Journal of Operations and Production Manage-ment, 26(12), 1325-1350.
Canada Mortgage and Housing Corpo-ration (2009). Retrieved April 15, from www.cmhc.ca (Housing market information, Housing observer and housing market outlook highlights reports for Atlantic region between 2004-2007).
Carnegie Mellon Software Engineering Institute. (2002). Capability Maturity Model Integration. Retrieved March 18, 2009, from http://www.sei.cmu.edu/pub/documents/02.reports/pdf/02tr012.pdf.
Chapman, R. L. and Hyland, P. W. (1997). Continuous improvement strategies across selected Australian manufacturing sectors. Benchmark-ing for Quality Management and Technology, 4(3), 175-188.
Cheng, J. - L. (2008). Implementing Six Sigma via TQM improvement: An empirical study in Taiwan. The TQM Journal, 20(3), 182-195.
Dahlgaard, J. J. and Dahlgaard-Park, S. M. (2006). Lean production, Six Sigma, TQM and company culture. The TQM Magazine, 18(3), 263-281.
Devane, T. (2004). Integrating Lean Six Sigma and high performance organi-zations. San Francisco, CA: Pfeiffer-A Wiley Imprint.
Foster, S. T. (2007). Managing Quality: Integrating the supply chain. Upper Saddle River, New Jersey: Pearson Education-Prentice Hall.
Friday-Stroud, S. S. and Sutterfield, J. S. (2007). A conceptual framework for integrating six-sigma and strate-gic management methodologies to quantify decision making. The TQM Magazine, 19(6), 561-571.
Hilb, M. (2006). New corporate gover-nance. Berlin, Germany: Springer.
Human Resources Development Coun-cil. (1992). Guide to conducting an employee opinion survey in the federal public service. Canada: Hu-man Resources Development Council Publication.
Jitpaiboon, T. and Rao, S. S. (2007). A meta-analysis of quality measures in manufacturing system. International Journal of Quality and Reliability Management, 24(1), 78-102.
Kaplan, R. S. and Norton, D. P. (2006). Alignment: Using the balanced scorecard to create corporate syner-gies. Boston, MA: Harvard Business School Publication Corporation.
Kaye, M. and Anderson, R. (1999). Con-tinuous improvement: The ten essen-tial criteria. International Journal of Quality and Reliability Management, 16(5), 485-506.
Kumar, U. D., Nowicki, D., Ramírez-Márquez, J. E. and Verma, D. (2008). On the optimal selection of process alternatives in a Six Sigma imple-mentation. International Journal of Production Economics, 111(2), 456-467.
Martin, J. W. (2007). Lean Six Sigma for supply chain management: The 10-step solution process. New York, NY: The McGraw-Hill Companies, Inc.
McAdam, R. and Evans, A. (2004). The organizational contextual factors affecting the implementation of Six Sigma in a high technology mass-manufacturing environment. Inter-national Journal of Six Sigma and Competitive Advantage, 1(1), 29-43.
Motwani, J., Kumar, A. and Antony, J. (2004). A business process change framework for examining the implementation of Six Sigma: A case study of Dow Chemicals. The TQM Magazine, 16(4), 273-283
National Association of Home Build-ers. (2009). Retrieved April 15, from www.nahb.org/generic.aspx?genericcontentid=45409 (Housing starts and housing fore-casts report for North Eastern region between 2004-2007).

14
Journal of Industrial Technology • Volume 26, Number 1 • January 2010 through March 2010 • www.atmae.org
Peter Barron Stark and Associates, Inc. (2004). Today Corporation - Em-ployee Opinion Survey- sample EOS sheets. Retrieved March 15, 2009, from www.employeeopinionsur-veys.com/pdf/Sample%20EOS%20Sheets.pdf.
Salah, S., Rahim, A. and Carretero, J. A. (2010). The integration of quality management and continuous im-provement methodologies with man-agement systems. Int. J. Productivity and Quality Management, to appear.
Sat Pac Inc. (1997). Employee Opinion and Satisfaction Survey. Retrieved March 15, 2009, from http://www.statpac.com/online-surveys/Employ-ee_Satisfaction.htm
Seen, M., Beaumont, N. and Mingins, C. (2001). Benchmarking business processes in software production: A case study. Benchmarking, an Inter-national Journal, 8(4), 262-280.
Snee, R. D. (2004). Six-Sigma: The evolution of a 100 years of business improvement methodology. Inter-national Journal of Six Sigma and Competitive Advantage, 1(1), 4-20.
Snee, R. D. and Hoerl, R. W. (2007). Integrating Lean and Six Sigma – a holistic approach. Six Sigma Forum Magazine, May, 15-21.
Stankard, M., F. (2002). Management system and organization perfor-mance: the search for excellence beyond ISO 9000. West Port, CT: Greenwood Publishing Group, Inc.
Wallace, T. F. and Bennett, S. J. (1994). The instant access guide to world class manufacturing. Essex Junction, VT: Oliver Wight Publications, Inc.
Walton, M. (1990). Deming manage-ment at work. New York, NY: G. P. Putnam’s Sons.
Yang, C. - C. (2004). An integrated model of TQM and GE-Six Sigma. International Journal of Six Sigma and Competitive Advantage, 1(1), 97-111.
Yang, C. - C. (2006). The impact of human resource management prac-tices on the implementation of total quality management – an empirical study on high-tech firms. The TQM Magazine, 18(2), 162-173.
Zeng, A. X., Lou, G. X. and Tam, V. W. Y. (2007). Managing information flows for quality improvement of projects. Measuring Business Excel-lence, 11(3), 30-40.