toolkit for the indicators of resilience
TRANSCRIPT

Toolkit for the
Indicators of Resilience in Socio-ecological Production Landscapes and Seascapes
RESEARCH PROGRAM ON
Water, Land and Ecosystems
For more information contact the Secretariat of IPSI, UNU-IAS
E-Mail: [email protected]
http://satoyama-initiative.org/
Toolkit for the
Indicators of Resilience in Socio-ecological Production Landscapes and Seascapes
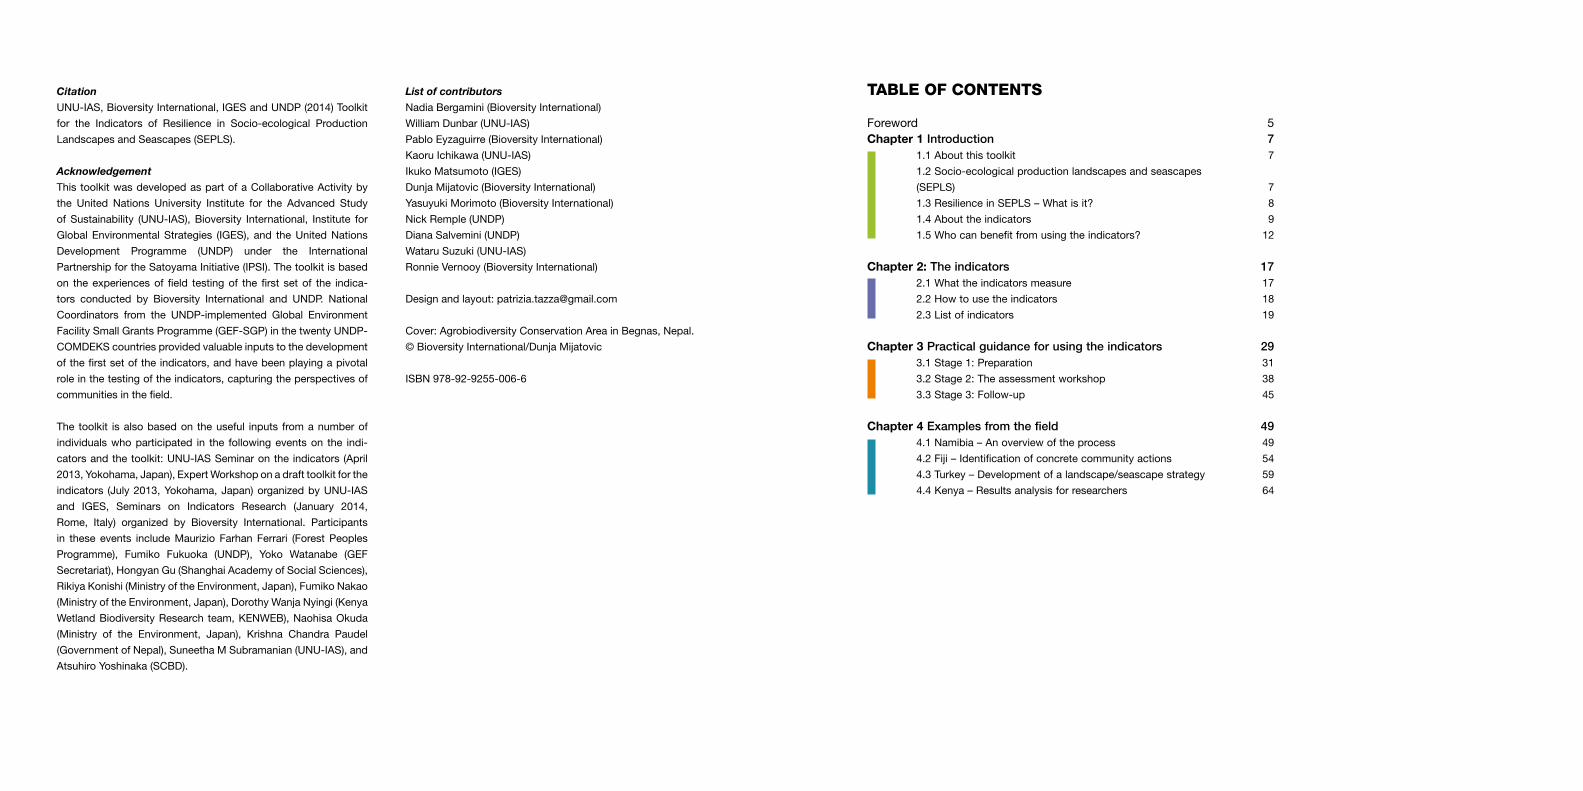
Table of conTenTs
Foreword 5Chapter 1 Introduction 7 1.1Aboutthistoolkit 7
1.2Socio-ecologicalproductionlandscapesandseascapes
(SEPLS) 7
1.3ResilienceinSEPLS–Whatisit? 8
1.4Abouttheindicators 9
1.5Whocanbenefitfromusingtheindicators? 12
Chapter 2: The indicators 17 2.1Whattheindicatorsmeasure 17
2.2Howtousetheindicators 18
2.3Listofindicators 19
Chapter 3 Practical guidance for using the indicators 29 3.1Stage1:Preparation 31
3.2Stage2:Theassessmentworkshop 38
3.3Stage3:Follow-up 45
Chapter 4 Examples from the field 49 4.1Namibia–Anoverviewoftheprocess 49
4.2Fiji–Identificationofconcretecommunityactions 54
4.3Turkey–Developmentofalandscape/seascapestrategy 59
4.4Kenya–Resultsanalysisforresearchers 64
Citation
UNU-IAS,BioversityInternational,IGESandUNDP(2014)Toolkit
for the Indicators of Resilience in Socio-ecological Production
LandscapesandSeascapes(SEPLS).
Acknowledgement
ThistoolkitwasdevelopedaspartofaCollaborativeActivityby
the United Nations University Institute for the Advanced Study
of Sustainability (UNU-IAS), Bioversity International, Institute for
GlobalEnvironmentalStrategies (IGES), and theUnitedNations
Development Programme (UNDP) under the International
PartnershipfortheSatoyamaInitiative(IPSI).Thetoolkitisbased
on theexperiencesof field testingof thefirst setof the indica-
tors conducted by Bioversity International and UNDP. National
Coordinators from the UNDP-implemented Global Environment
FacilitySmallGrantsProgramme(GEF-SGP)inthetwentyUNDP-
COMDEKScountriesprovidedvaluableinputstothedevelopment
ofthefirstsetoftheindicators,andhavebeenplayingapivotal
roleinthetestingoftheindicators,capturingtheperspectivesof
communitiesinthefield.
The toolkit isalsobasedon theuseful inputs fromanumberof
individualswhoparticipated in the followingeventson the indi-
catorsandthetoolkit:UNU-IASSeminarontheindicators(April
2013,Yokohama,Japan),ExpertWorkshoponadrafttoolkitforthe
indicators (July2013,Yokohama,Japan)organizedbyUNU-IAS
and IGES, Seminars on Indicators Research (January 2014,
Rome, Italy) organized by Bioversity International. Participants
in these events include Maurizio Farhan Ferrari (Forest Peoples
Programme), Fumiko Fukuoka (UNDP), Yoko Watanabe (GEF
Secretariat),HongyanGu(ShanghaiAcademyofSocialSciences),
RikiyaKonishi(MinistryoftheEnvironment,Japan),FumikoNakao
(MinistryoftheEnvironment,Japan),DorothyWanjaNyingi(Kenya
WetlandBiodiversityResearchteam,KENWEB),NaohisaOkuda
(Ministry of the Environment, Japan), Krishna Chandra Paudel
(GovernmentofNepal),SuneethaMSubramanian(UNU-IAS),and
AtsuhiroYoshinaka(SCBD).
List of contributors
NadiaBergamini(BioversityInternational)
WilliamDunbar(UNU-IAS)
PabloEyzaguirre(BioversityInternational)
KaoruIchikawa(UNU-IAS)
IkukoMatsumoto(IGES)
DunjaMijatovic(BioversityInternational)
YasuyukiMorimoto(BioversityInternational)
NickRemple(UNDP)
DianaSalvemini(UNDP)
WataruSuzuki(UNU-IAS)
RonnieVernooy(BioversityInternational)
Designandlayout:[email protected]
Cover:AgrobiodiversityConservationAreainBegnas,Nepal.
©BioversityInternational/DunjaMijatovic
ISBN978-92-9255-006-6
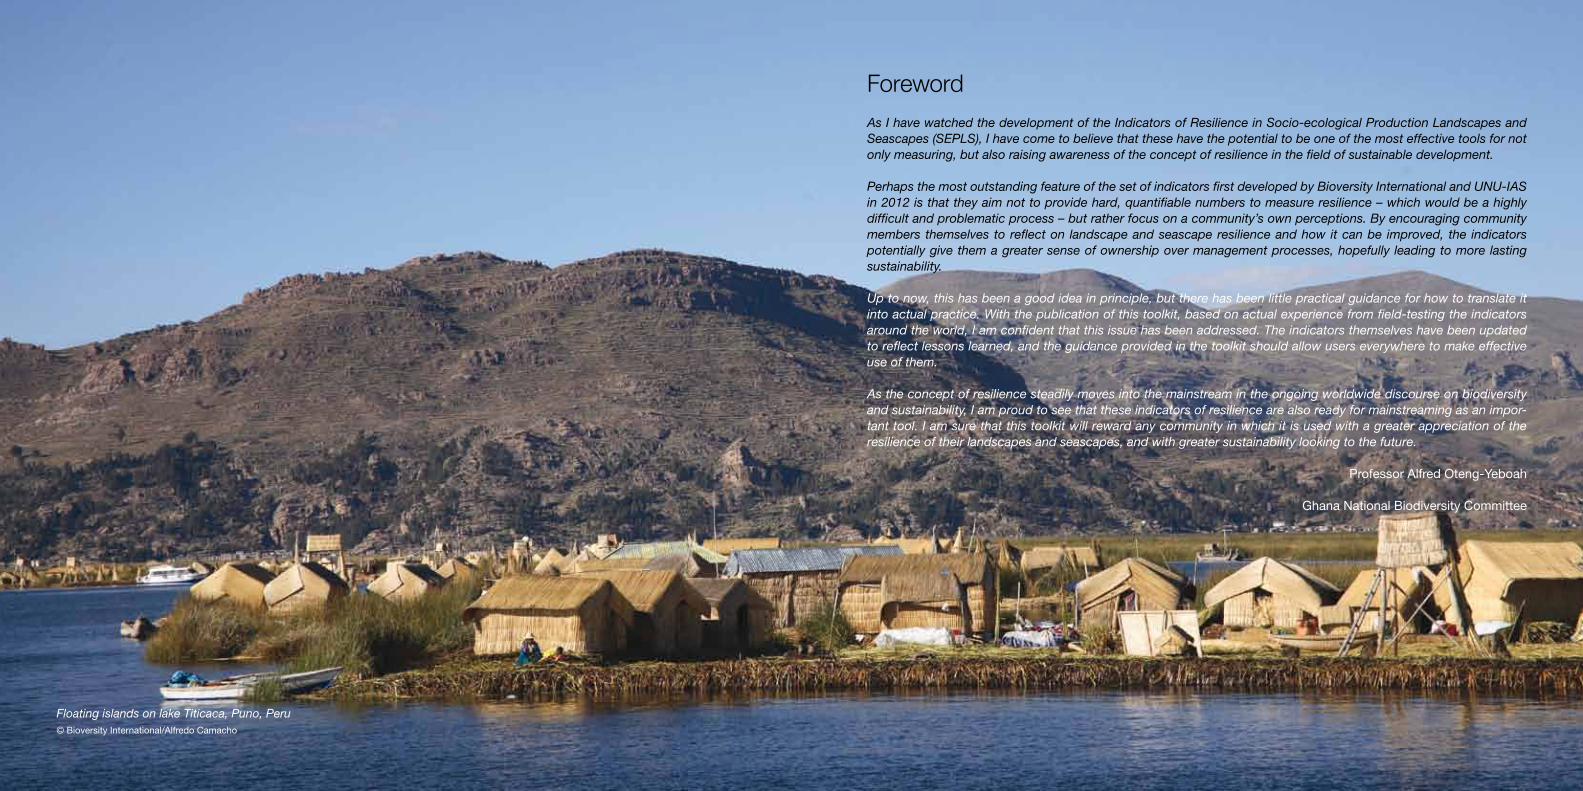
Foreword As I have watched the development of the Indicators of Resilience in Socio-ecological Production Landscapes and Seascapes (SEPLS), I have come to believe that these have the potential to be one of the most effective tools for not only measuring, but also raising awareness of the concept of resilience in the field of sustainable development.
Perhaps the most outstanding feature of the set of indicators first developed by Bioversity International and UNU-IAS in 2012 is that they aim not to provide hard, quantifiable numbers to measure resilience – which would be a highly difficult and problematic process – but rather focus on a community’s own perceptions. By encouraging community members themselves to reflect on landscape and seascape resilience and how it can be improved, the indicators potentially give them a greater sense of ownership over management processes, hopefully leading to more lasting sustainability.
Up to now, this has been a good idea in principle, but there has been little practical guidance for how to translate it into actual practice. With the publication of this toolkit, based on actual experience from field-testing the indicators around the world, I am confident that this issue has been addressed. The indicators themselves have been updated to reflect lessons learned, and the guidance provided in the toolkit should allow users everywhere to make effective use of them.
As the concept of resilience steadily moves into the mainstream in the ongoing worldwide discourse on biodiversity and sustainability, I am proud to see that these indicators of resilience are also ready for mainstreaming as an impor-tant tool. I am sure that this toolkit will reward any community in which it is used with a greater appreciation of the resilience of their landscapes and seascapes, and with greater sustainability looking to the future.
ProfessorAlfredOteng-Yeboah
GhanaNationalBiodiversityCommittee
Floating islands on lake Titicaca, Puno, Peru©BioversityInternational/AlfredoCamacho

6 | Toolkit for the Indicators of Resilience in Socio-ecological Production Landscapes and Seascapes (SEPLS) Chapter 1: Introduction | 7
Chapter 1: Introduction
1.1 about this toolkit
This toolkit provides practical guidance for makinguseofthe“IndicatorsofResilienceinSocio-ecologicalProduction Landscapes and Seascapes (SEPLS)” inthefield.The indicatorsarea tool for engaging localcommunities in adaptive management of the land-scapesandseascapesinwhichtheylive.Byusingthetested methods presented in this toolkit, communi-ties can increase their capacity to respond to social,economic,andenvironmentalpressuresandshocks,toimprovetheirenvironmentalandeconomicconditions,thus increasingthesocialandecologicalresilienceoftheirlandscapesandseascapes,andultimatelymakeprogress towards realizing a society in harmony withnature.
The approach presented here is centred on holdingparticipatory“assessmentworkshops”.These involvediscussion and a scoring process for the set oftwenty indicators designed to capture communities’perceptionsof factorsaffecting the resilienceof theirlandscapesandseascapes.Theparticipants in these
workshopsaremembersof the localcommunityandstakeholdersinthelocalarea.Theirparticipationallowsthem to evaluate current conditions across the land-scape and identify and reach agreement on priorityactions, contributing to enhanced communicationamongstakeholdersandempowered localcommuni-ties. Workshops may be planned and implementedbypeople fromwithinoroutside thecommunity.Theguidanceprovided in this toolkit isprimarily intendedfororganizersandfacilitatorsofresilienceassessmentworkshops.
The toolkit is divided into four chapters. Chapter 1explains the conceptual background, the purpose,usesandbenefitsof the indicators.Chapter2 intro-duces the twenty indicators themselves. Chapter 3providespracticalguidanceonhow touse the indi-cators inanassessmentworkshopheldbythe localcommunity. This involves steps to be taken before,duringandaftertheworkshopitself,includingfollow-up discussions and repeated workshops, encour-agingacontinuing, long-term,adaptiveapproach tomanagement. Chapter 4 presents examples of pastuseoftheindicatorstohighlightcertainaspectsoftheassessmentprocess.
Tounderstandtherationaleandpurposeoftheindica-tors, the toolkit reviews two basic concepts: “socio-ecological production landscapes and sea-scapes(SEPLS)”and“resilience”.
1.2 socio-ecological production landscapes and seascapes (sePls)
Humanshave influencedmostof theEarth’secosys-temsthroughproductionactivitiessuchasagriculture,forestry, fisheries, herding and livestock production.Whilehumanimpactsareoftenthoughtofasharmfultotheenvironment,manysuchhuman-natureinteractionsareinfactfavourabletoorsynergisticwithbiodiversity
1
Semau island, Indonesia
©COMDEKSIndonesia/CatharinaDwihastarini
8 | Toolkit for the Indicators of Resilience in Socio-ecological Production Landscapes and Seascapes (SEPLS) Chapter 1: Introduction | 9
conservation. Around the world, local communities’efforts over many years to adapt to the surroundingenvironment and enjoy its bounty for the long termhavecreateduniqueandsustainable landscapesandseascapes that have provided humans with goodssuchasfoodandfuel,andservicessuchaswaterpuri-ficationandrichsoil,whilehostingadiversityofanimalandplantspecies.
These landscapes and seascapes vary widely dueto their unique local climatic, geographic, cultural,and socio-economic conditions. However, they arecommonly characterized as dynamic bio-culturalmosaicsofhabitatsandlandandseauseswheretheinteractionbetween people and the landscape main-tainsorenhancesbiodiversitywhileprovidinghumanswith the goods and services needed for their well-being.Avarietyofdifferentnamesexistfortheseareasacross countries and languages, including dehesa inSpain,ahupua’ainHawaii,andsatoyama inJapan,sotheterm“socio-ecologicalproductionlandscapesandseascapes”(SEPLS)hasbeencoinedtorefertothemcollectively.
SEPLShaveprotectedbiodiversityandprovidedlocalcommunities with ecosystem services around theworld for many years. However, with rapidly-growinghuman demands for food and other goods in recentyears,aswellaschangesinsocio-economicsystemsdue to industrialization, urbanization and globaliza-tion,diverseproductionareashavebeentransformedtowards more uniform systems requiring intensiveuse of external inputs such as chemical fertilizers,pesticides, and herbicides. Over time, this has hadsignificant impacts on the associated biodiversityandecosystemsthatunderpinagriculturalproductionactivities.Theseimpactscanbemeasuredintermsoflossofresilienceandsustainabilityinproductionareastoanextent that threatenshumanwell-being,due tothedegradationofnaturalresourcesandreductionsinecosystemservices.
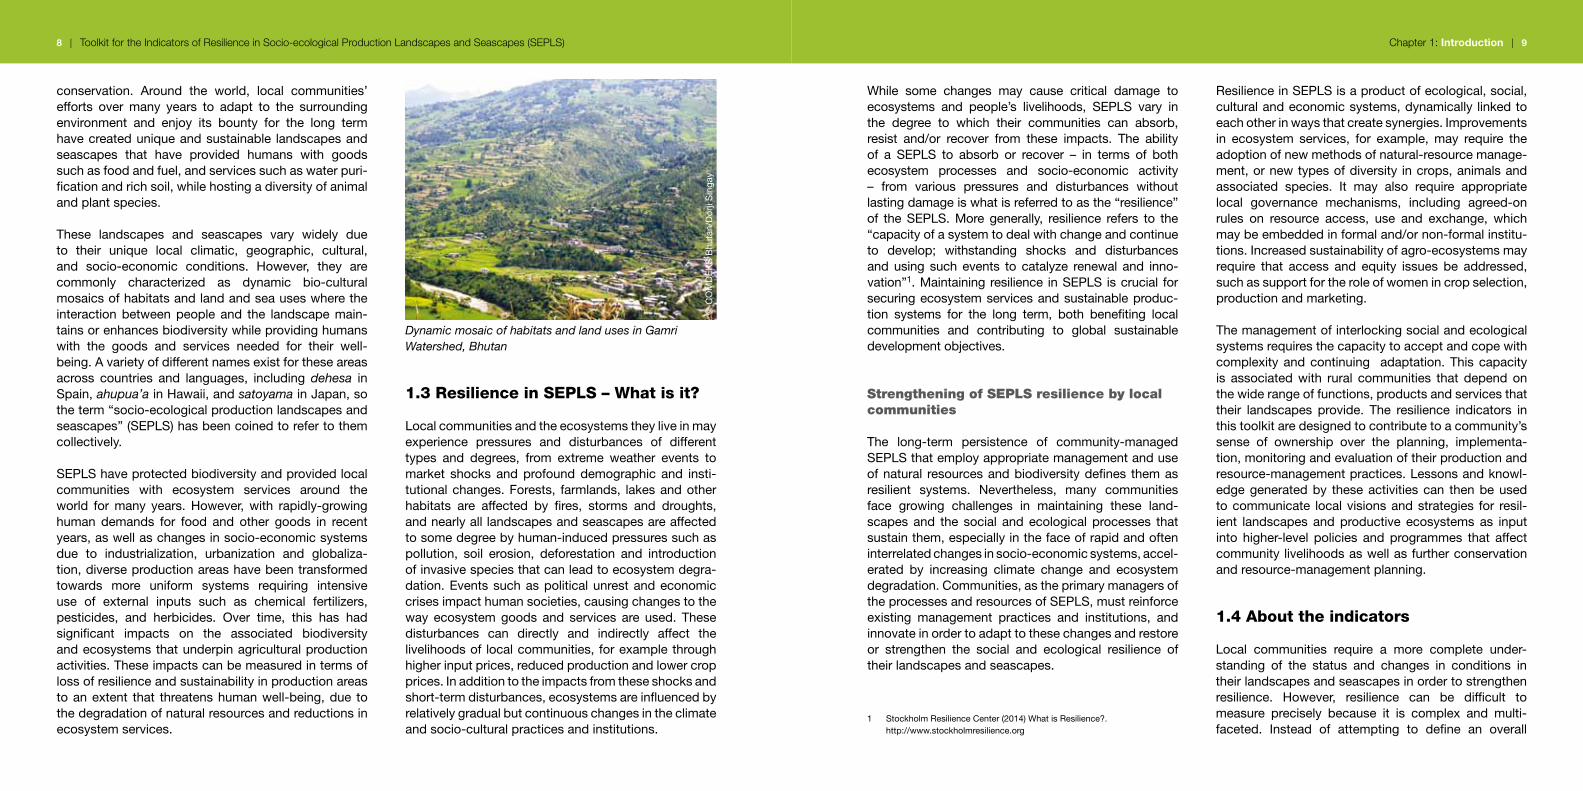
Dynamic mosaic of habitats and land uses in Gamri Watershed, Bhutan
1.3 Resilience in sePls – What is it?
Localcommunitiesandtheecosystemstheyliveinmayexperience pressures and disturbances of differenttypes and degrees, from extreme weather events tomarket shocks and profound demographic and insti-tutionalchanges.Forests, farmlands, lakesandotherhabitats are affected by fires, storms and droughts,andnearlyalllandscapesandseascapesareaffectedtosomedegreebyhuman-inducedpressuressuchaspollution, soil erosion, deforestation and introductionofinvasivespeciesthatcanleadtoecosystemdegra-dation.Eventssuchaspoliticalunrestandeconomiccrisesimpacthumansocieties,causingchangestotheway ecosystem goods and services are used. Thesedisturbances can directly and indirectly affect thelivelihoodsof localcommunities, forexamplethroughhigherinputprices,reducedproductionandlowercropprices.Inadditiontotheimpactsfromtheseshocksandshort-termdisturbances,ecosystemsareinfluencedbyrelativelygradualbutcontinuouschangesintheclimateandsocio-culturalpracticesandinstitutions.
While some changes may cause critical damage toecosystems and people’s livelihoods, SEPLS vary inthe degree to which their communities can absorb,resist and/or recover from these impacts. The abilityof a SEPLS to absorb or recover – in terms of bothecosystem processes and socio-economic activity– from various pressures and disturbances withoutlastingdamageiswhatisreferredtoasthe“resilience”of the SEPLS. More generally, resilience refers to the“capacityofasystemtodealwithchangeandcontinueto develop; withstanding shocks and disturbancesand using such events to catalyze renewal and inno-vation”1.Maintainingresilience inSEPLS iscrucial forsecuringecosystemservicesandsustainableproduc-tion systems for the long term, both benefiting localcommunities and contributing to global sustainabledevelopmentobjectives.
Strengthening of SEPLS resilience by local communities
The long-term persistence of community-managedSEPLSthatemployappropriatemanagementanduseofnatural resourcesandbiodiversitydefines themasresilient systems. Nevertheless, many communitiesface growing challenges in maintaining these land-scapes and the social and ecological processes thatsustainthem,especiallyinthefaceofrapidandofteninterrelatedchangesinsocio-economicsystems,accel-erated by increasing climate change and ecosystemdegradation.Communities,astheprimarymanagersoftheprocessesandresourcesofSEPLS,mustreinforceexisting management practices and institutions, andinnovateinordertoadapttothesechangesandrestoreor strengthen the social and ecological resilience oftheirlandscapesandseascapes.
ResilienceinSEPLSisaproductofecological,social,culturalandeconomicsystems,dynamically linkedtoeachotherinwaysthatcreatesynergies.Improvementsin ecosystem services, for example, may require theadoptionofnewmethodsofnatural-resourcemanage-ment,ornewtypesofdiversity incrops,animalsandassociated species. It may also require appropriatelocal governance mechanisms, including agreed-onrules on resource access, use and exchange, whichmaybeembeddedinformaland/ornon-formalinstitu-tions.Increasedsustainabilityofagro-ecosystemsmayrequire that access and equity issues be addressed,suchassupportfortheroleofwomenincropselection,productionandmarketing.
Themanagementofinterlockingsocialandecologicalsystemsrequiresthecapacitytoacceptandcopewithcomplexityandcontinuing adaptation.Thiscapacityis associated with rural communities that depend onthewiderangeoffunctions,productsandservicesthattheir landscapes provide. The resilience indicators inthistoolkitaredesignedtocontributetoacommunity’ssense of ownership over the planning, implementa-tion,monitoringandevaluationoftheirproductionandresource-managementpractices.Lessonsandknowl-edgegeneratedby theseactivitiescan thenbeusedtocommunicate localvisionsandstrategies for resil-ient landscapes and productive ecosystems as inputinto higher-level policies and programmes that affectcommunity livelihoodsaswellasfurtherconservationandresource-managementplanning.
1.4 about the indicators
Local communities require a more complete under-standing of the status and changes in conditions intheirlandscapesandseascapesinordertostrengthenresilience. However, resilience can be difficult tomeasure precisely because it is complex and multi-faceted. Instead of attempting to define an overall
1 StockholmResilienceCenter(2014)WhatisResilience?.http://www.stockholmresilience.org
©C
OM
DE
KS
Bhu
tan/
Dor
jiS
inga
y
10 | Toolkit for the Indicators of Resilience in Socio-ecological Production Landscapes and Seascapes (SEPLS) Chapter 1: Introduction | 11
measureofresilienceforSEPLS,thistoolkitintroducesanapproachformonitoringSEPLSusingasetofindi-catorsdesignedtocapturetheiressentialattributes.
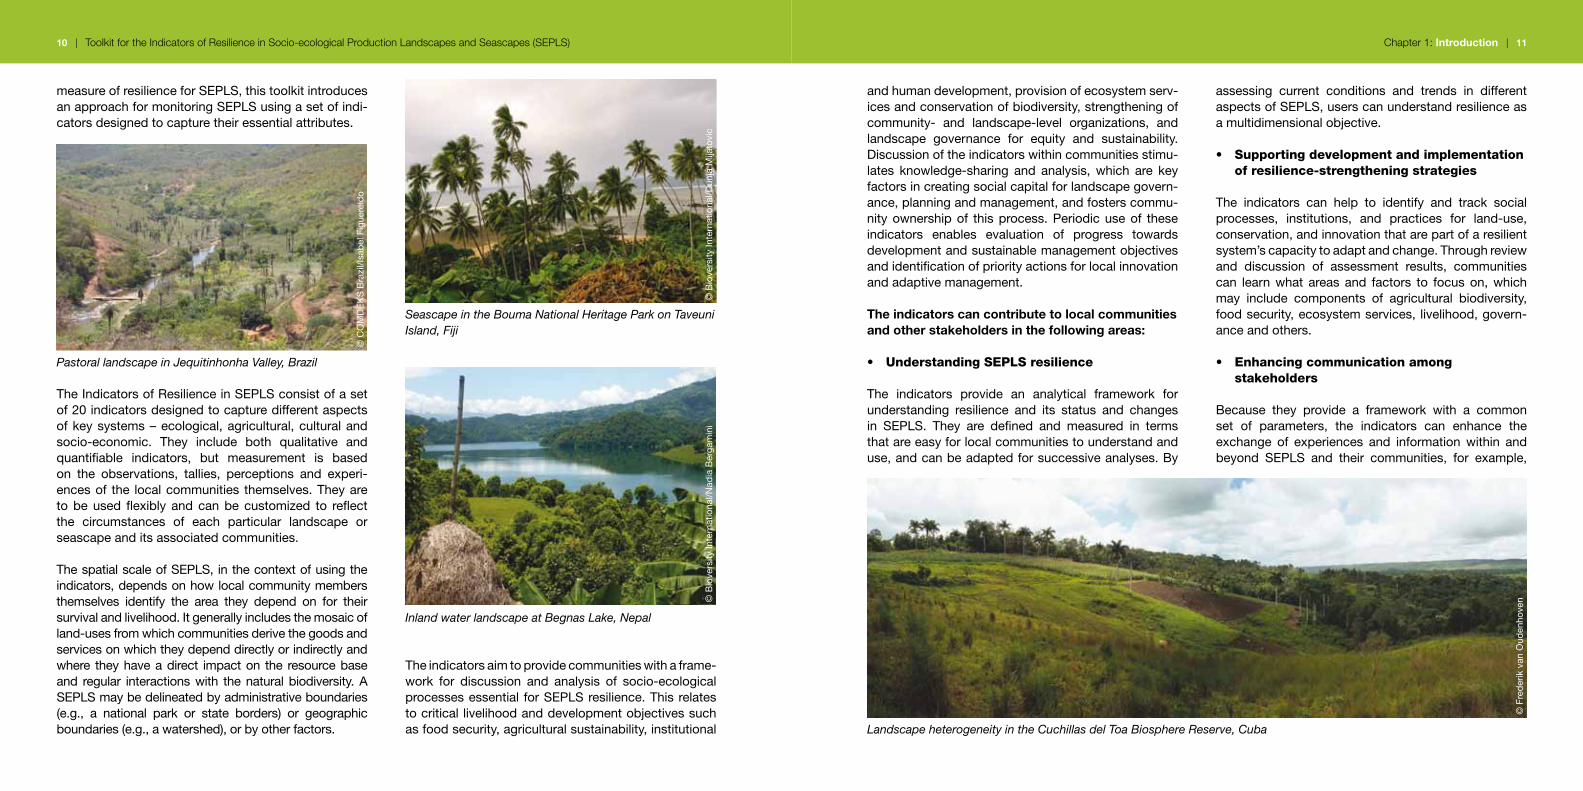
Pastoral landscape in Jequitinhonha Valley, Brazil
TheIndicatorsofResilienceinSEPLSconsistofasetof20indicatorsdesignedtocapturedifferentaspectsofkeysystems–ecological,agricultural,culturalandsocio-economic. They include both qualitative andquantifiable indicators, but measurement is basedon the observations, tallies, perceptions and experi-encesof the localcommunities themselves.Theyareto be used flexibly and can be customized to reflectthe circumstances of each particular landscape orseascapeanditsassociatedcommunities.
ThespatialscaleofSEPLS,inthecontextofusingtheindicators,dependsonhowlocalcommunitymembersthemselves identify the area they depend on for theirsurvivalandlivelihood.Itgenerallyincludesthemosaicofland-usesfromwhichcommunitiesderivethegoodsandservicesonwhichtheydependdirectlyorindirectlyandwhere theyhaveadirect impacton the resourcebaseand regular interactionswith thenaturalbiodiversity.ASEPLSmaybedelineatedbyadministrativeboundaries(e.g., a national park or state borders) or geographicboundaries(e.g.,awatershed),orbyotherfactors.
Theindicatorsaimtoprovidecommunitieswithaframe-work for discussion and analysis of socio-ecologicalprocessesessential forSEPLSresilience.Thisrelatestocriticallivelihoodanddevelopmentobjectivessuchasfoodsecurity,agriculturalsustainability,institutional
Seascape in the Bouma National Heritage Park on Taveuni Island, Fiji
Inland water landscape at Begnas Lake, Nepal
©C
OM
DE
KS
Bra
zil/I
sab
elF
igue
reid
o
©B
iove
rsity
Inte
rnat
iona
l/Dun
jaM
ijato
vic
©B
iove
rsity
Inte
rnat
iona
l/Nad
iaB
erga
min
i
andhumandevelopment,provisionofecosystemserv-icesandconservationofbiodiversity,strengtheningofcommunity- and landscape-level organizations, andlandscape governance for equity and sustainability.Discussionoftheindicatorswithincommunitiesstimu-lates knowledge-sharing and analysis, which are keyfactorsincreatingsocialcapitalforlandscapegovern-ance,planningandmanagement,andfosterscommu-nityownershipof thisprocess.Periodicuseof theseindicators enables evaluation of progress towardsdevelopmentandsustainablemanagementobjectivesandidentificationofpriorityactionsforlocalinnovationandadaptivemanagement.
The indicators can contribute to local communities and other stakeholders in the following areas:
• Understanding sePls resilience
The indicators provide an analytical framework forunderstanding resilience and its status and changesin SEPLS. They are defined and measured in termsthatareeasyforlocalcommunitiestounderstandanduse,andcanbeadaptedforsuccessiveanalyses.By
assessing current conditions and trends in differentaspectsofSEPLS,userscanunderstandresilienceasamultidimensionalobjective.
• supporting development and implementation of resilience-strengthening strategies
The indicators can help to identify and track socialprocesses, institutions, and practices for land-use,conservation,andinnovationthatarepartofaresilientsystem’scapacitytoadaptandchange.Throughreviewand discussion of assessment results, communitiescan learn what areas and factors to focus on, whichmay include components of agricultural biodiversity,foodsecurity,ecosystemservices, livelihood,govern-anceandothers.
• enhancing communication among stakeholders
Because they provide a framework with a commonset of parameters, the indicators can enhance theexchange of experiences and information within andbeyond SEPLS and their communities, for example,
Landscape heterogeneity in the Cuchillas del Toa Biosphere Reserve, Cuba
©F
red
erik
van
Oud
enho
ven

12 | Toolkit for the Indicators of Resilience in Socio-ecological Production Landscapes and Seascapes (SEPLS) Chapter 1: Introduction | 13
betweenupstreamanddownstreamcommunitiesandamongcommunitiesindifferentgeographicregions.
• empowering communities in decision-making processes and adaptive management
Useoftheindicatorsfacilitatesacontinuousprocessofdiscussionandparticipationwithinlocalcommunities,leadingtoknowledgeofwhatworksandwhatdoesnot.ThiskindofadaptivemanagementmodelpromotesagreatersenseofownershipamongthepeoplelivinginSEPLS,encouraging them tobeactiveat thepolicy-makinglevel.Usingtheindicatorsasaframeworkfordiscussionalsohelpscreateconsensusonwhatneedstobedone tobuildor enhance resilienceacross thelandscapeandguidedecisionsandimplementation.
1.5 Who can benefit from using the indicators?
Whiletheindicatorsareprimarilydesignedtobeusedby local communities, they have the potential to bevaluabletoolsforotherssuchasNGOs,developmentagencies,andpolicy-makers.Theindicatorsmayalsobe helpful for researchers to understand SEPLS andhow communities see their landscape or seascape.The roleof facilitatormaybemore important in situ-ationswhere it isdifficult forcommunities touse theindicatorsontheirown.
The followingaresomepossiblebenefits fordifferentusers.
Local communities: • Increase common understanding of SEPLS (e.g.,
conditionsandthreatstothem)amongandbeyondcommunitymembers
• Identify priority issues and actions for sustainingSEPLSthatbenefitlivelihoodsandwell-being,andtoevaluatepasteffortsthatcommunityhasmade
• Contributetoenhancingtrustandsocialcapital incommunitiesandresolvingconflicts
• Inform policymakers, donors, and relevant stake-holdersonthesituationoftheirSEPLSandneces-saryareasforsupportinamoreefficientmanner
• Exchangeexperienceswithcommunitieswhohavetriedtheindicators
NGOs and development agencies implementing projects in SEPLS:• Enhance understanding of resilience from the
perspectiveoflocalcommunities• Promoteparticipatoryprocesses• Monitorandevaluateprojectinterventionsonresil-
ience and biodiversity conservation and identifyareasforsupport
• Communicate with policymakers and donors onthe situation of the SEPLS they are working withandnecessaryareasforsupportinamoreefficientmanner
Policymakers and project planners:• Better understand local conditions from the
perspectiveoflocalcommunities• Improvecommunicationwithlocalcommunities• Identifyareasthatneedtobeimprovedandreflect
theseinpolicymaking,planning,andotherdecision-makingprocesses
• Increasecoherenceacrossdifferentprojectsitesbyapplyingacommonanalyticalframeworkandtools
Researchers:• Enhance multi-dimensional understanding of local
conditionsfromtheperspectiveoflocalcommunities• Deepen the understanding of resilience by exam-
iningresultsfromdifferentsites• Identifyresearchgaps
IndIcatoR aPPRoachES at dIffEREnt LEvELS
Indicator approaches are used increasingly invarious sectors and contexts. At the global andnational scales they play important roles in moni-toringprogresstowardachievingspecificgoalsandtargets. For example, around 100 indicators havebeen listed1 to monitor the progress of implemen-tationofthe Strategic Plan for Biodiversity 2011-20202 andtheAichi Biodiversity Targets3,adoptedduringtheCBDCOP10inJapanin2010toprovideaframeworkforactionbyallstakeholderstoprotectbiodiversityandenhanceitsbenefitsforpeople.The Millennium Development Goals Indicators4areasetof60indicatorsforthemeasurementofprogresstowardtheMillenniumDevelopmentGoals(MDGs)5,eightinternationaldevelopmenttargetstobemetby2015foraddressingextremepoverty.TheUNagreedattheRio+20Conferencein2012todevelopasetof Sustainable Development Goals (SDGs)6 andiscurrentlyworkingtodefinethegoalsandrelevantindicatorstobeadoptedin2015.
National- and global-scale indicators need to bequantitative forcomparisonacrossspaceandtimeand to be able to aggregate data at larger spatialscales. They also must be scientifically valid andobjective, with assessment often conducted byexperts. Unlike these higher-level indicators, theIndicatorsofResilienceinSEPLSintroducedinthistoolkitareforuseatthelocallevel.Theyincludebothqualitativeandquantifiableindicators,butmeasure-mentisbasedontheobservations,perceptionsandexperience of the local communities themselves.These local observations can be complementedby scientific data and information from global andnationalobservationsanddatasetsaswellaspriorstudies.However,externaldatashouldbeabletobe
adoptedintothelocalknowledgebase.Theindica-torsinthistoolkitprovidelocalcommunitieswithaframeworktodiscussbothcurrentconditionsofresil-ienceandpotentialareasforimprovementaspartoftheprocessofadaptivemanagement.Thiscanleadtoquickandproactiveeffortsbylocalcommunitiestostrengthentheresilienceoftheirproductionland-scapesandseascapes.Italsoprovidesaconsistentprocess for monitoring resilience of the landscapeor seascape and the implementation of measuresto address components and factors that lead toreducedresilience.
TheIndicatorsofResilienceinSEPLSpartiallyoverlapandcomplementsomeofthehigher-levelindicators.Moreresilientlandscapesresultingfromtheuseoftheindicators and implementation of actions identifiedfromtheirusewillalsocontributetoglobalandnationaltargets, such as those of the CBD (e.g., the AichiBiodiversityTargetsandNationalBiodiversityStrategicAction Plans), and the FAO International Treaty onPlant Genetic Resources for Food and Agriculture.
1 UNEP/CBD/COP/DEC/XI/3(www.cbd.int/doc/decisions/cop-11/cop-11-dec-03-en.doc)
2 www.cbd.int/sp/3 www.cbd.int/sp/targets/4 mdgs.un.org/unsd/mdg/Host.aspx?Content=Indicators/OfficialList.htm5 www.unmillenniumproject.org/goals/6 sustainabledevelopment.un.org/index.php?menu=1300
14 | Toolkit for the Indicators of Resilience in Socio-ecological Production Landscapes and Seascapes (SEPLS) Chapter 1: Introduction | 15
BackgRound
The Indicators of Resilience in Socio-ecologicalProduction Landscapes and Seascapes (SEPLS)and this toolkit were developed as a collaborativeactivity under the International Partnership for theSatoyamaInitiative(IPSI).
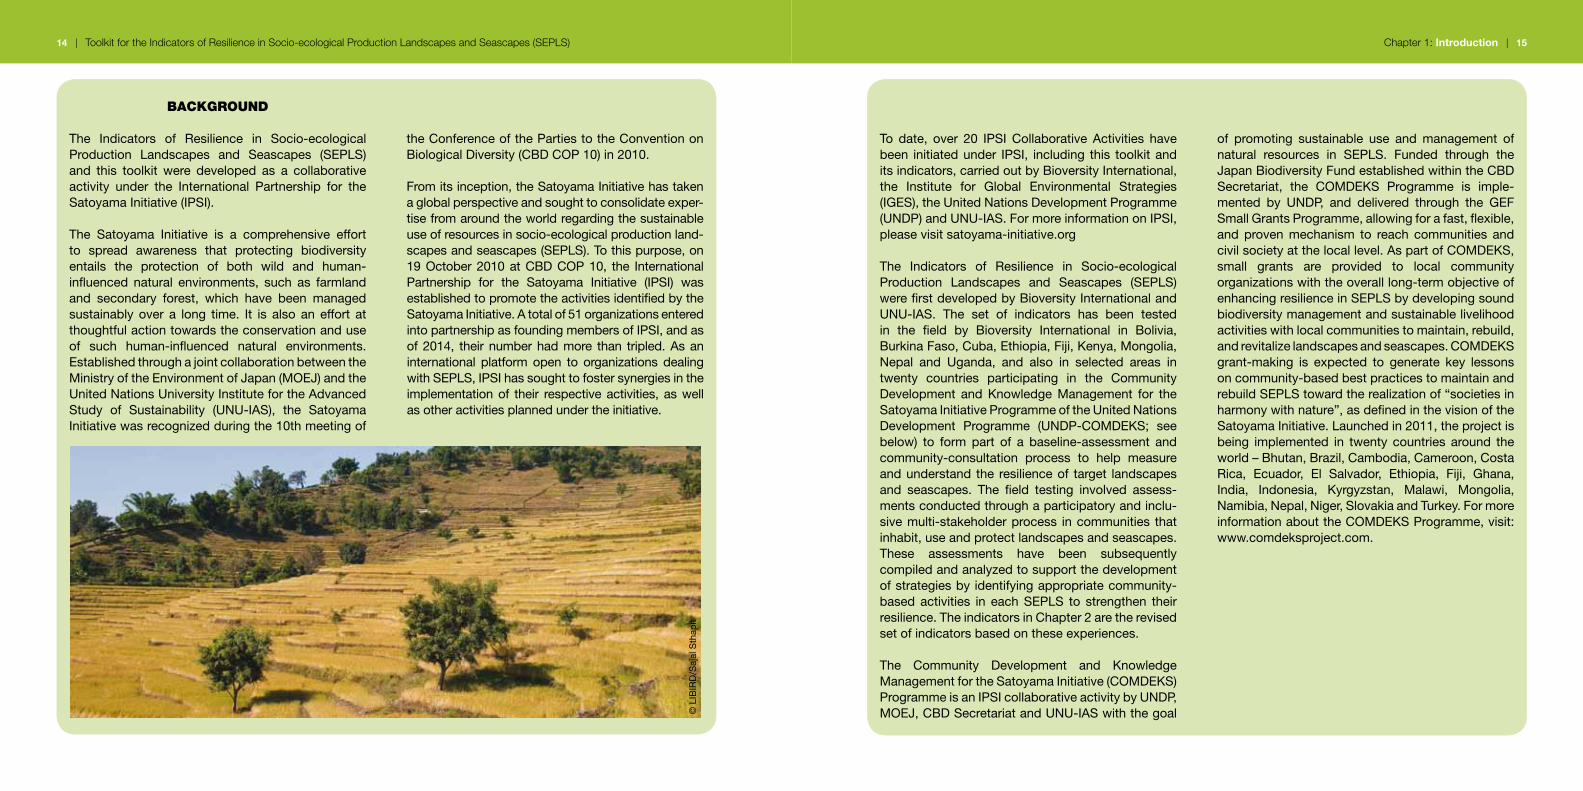
The Satoyama Initiative is a comprehensive effortto spread awareness that protecting biodiversityentails the protection of both wild and human-influenced natural environments, such as farmlandand secondary forest, which have been managedsustainably over a long time. It is also an effort atthoughtfulactiontowardstheconservationanduseof such human-influenced natural environments.EstablishedthroughajointcollaborationbetweentheMinistryoftheEnvironmentofJapan(MOEJ)andtheUnitedNationsUniversityInstitutefortheAdvancedStudy of Sustainability (UNU-IAS), the SatoyamaInitiativewasrecognizedduringthe10thmeetingof
theConferenceofthePartiestotheConventiononBiologicalDiversity(CBDCOP10)in2010.
Fromitsinception,theSatoyamaInitiativehastakenaglobalperspectiveandsoughttoconsolidateexper-tisefromaroundtheworldregardingthesustainableuseofresourcesinsocio-ecologicalproductionland-scapesandseascapes(SEPLS).Tothispurpose,on19October2010atCBDCOP10, the InternationalPartnership for the Satoyama Initiative (IPSI) wasestablishedtopromotetheactivitiesidentifiedbytheSatoyamaInitiative.Atotalof51organizationsenteredintopartnershipasfoundingmembersofIPSI,andasof2014, theirnumberhadmore than tripled.Asaninternational platform open to organizations dealingwithSEPLS,IPSIhassoughttofostersynergiesintheimplementationof their respectiveactivities, aswellasotheractivitiesplannedundertheinitiative.
To date, over 20 IPSI Collaborative Activities havebeen initiatedunder IPSI, including this toolkitanditsindicators,carriedoutbyBioversityInternational,the Institute for Global Environmental Strategies(IGES),theUnitedNationsDevelopmentProgramme(UNDP)andUNU-IAS.FormoreinformationonIPSI,pleasevisitsatoyama-initiative.org
The Indicators of Resilience in Socio-ecologicalProduction Landscapes and Seascapes (SEPLS)werefirstdevelopedbyBioversityInternationalandUNU-IAS. The set of indicators has been testedin the field by Bioversity International in Bolivia,BurkinaFaso,Cuba,Ethiopia,Fiji,Kenya,Mongolia,Nepal and Uganda, and also in selected areas intwenty countries participating in the CommunityDevelopment and Knowledge Management for theSatoyamaInitiativeProgrammeoftheUnitedNationsDevelopment Programme (UNDP-COMDEKS; seebelow) to form part of a baseline-assessment andcommunity-consultation process to help measureandunderstand the resilienceof target landscapesand seascapes. The field testing involved assess-mentsconductedthroughaparticipatoryandinclu-sivemulti-stakeholderprocess incommunities thatinhabit,useandprotectlandscapesandseascapes.These assessments have been subsequentlycompiledandanalyzedtosupportthedevelopmentofstrategiesbyidentifyingappropriatecommunity-based activities in each SEPLS to strengthen theirresilience.TheindicatorsinChapter2aretherevisedsetofindicatorsbasedontheseexperiences.
The Community Development and KnowledgeManagementfortheSatoyamaInitiative(COMDEKS)ProgrammeisanIPSIcollaborativeactivitybyUNDP,MOEJ,CBDSecretariatandUNU-IASwiththegoal
of promoting sustainable use and management ofnatural resources in SEPLS. Funded through theJapanBiodiversityFundestablishedwithintheCBDSecretariat, the COMDEKS Programme is imple-mented by UNDP, and delivered through the GEFSmallGrantsProgramme,allowingforafast,flexible,and proven mechanism to reach communities andcivilsocietyatthelocallevel.AspartofCOMDEKS,small grants are provided to local communityorganizationswiththeoveralllong-termobjectiveofenhancingresilienceinSEPLSbydevelopingsoundbiodiversitymanagementandsustainablelivelihoodactivitieswithlocalcommunitiestomaintain,rebuild,andrevitalizelandscapesandseascapes.COMDEKSgrant-making is expected to generate key lessonsoncommunity-basedbestpracticestomaintainandrebuildSEPLStowardtherealizationof“societiesinharmonywithnature”,asdefinedinthevisionoftheSatoyamaInitiative.Launchedin2011,theprojectisbeing implemented in twenty countries around theworld–Bhutan,Brazil,Cambodia,Cameroon,CostaRica, Ecuador, El Salvador, Ethiopia, Fiji, Ghana,India, Indonesia, Kyrgyzstan, Malawi, Mongolia,Namibia,Nepal,Niger,SlovakiaandTurkey.FormoreinformationabouttheCOMDEKSProgramme,visit:www.comdeksproject.com.
©L
IBIR
D/S
ajal
Sth
apit

16 | Toolkit for the Indicators of Resilience in Socio-ecological Production Landscapes and Seascapes (SEPLS) Chapter 1: Introduction | 17
2Chapter 2: The indicators
2.1 What the indicators measure
The indicatorsmeasureelementsofSEPLSresiliencethatare,almostbydefinition,stronglyinterrelated.Thepractices and institutions that they describe can begroupedinfiveareas:
• Landscape/seascape diversity and ecosystemprotection
• Biodiversity(includingagriculturalbiodiversity)• Knowledgeandinnovation• Governanceandsocialequity• Livelihoodsandwell-being
Landscape/seascape diversity and ecosystem protection
Heterogeneous landscapes and seascapes thatresemblenaturalpatternsprovidegreaterbiodiversitybenefits than intensively-managed monocultures ormarine environments where natural ecosystems likemangroves, seagrass beds or coral reefs have been
heavilytransformedbyextractivepractices.ResultingSEPLS are likely to support higher levels of biodi-versity andbemore resilient to external shocks thanmore simplified systems. In the context of climatechange,theprotectionandrestorationofwatersheds,forestsandcostalecosystemsinSEPLShelpregulatehydrologyandmicroclimate,therebyprovidingabufferagainstextremeweatherevents,floodsanddroughts.
Biodiversity (including agricultural biodiversity)
Thehealthofalandscapeorseascapeandtheecosys-temsitsupports isreflectedinpart inthediversityofspecies living in itand their interactions. Italsooftenforms the physical, cultural and spiritual bases ofcommunities’ well-being. Biodiversity contributes tocommunity and landscape/seascape resilience byprovidingecosystemservices,whicharesustainedordegradedbythepracticesandinstitutionsthatregulatethe use of natural resources. Agricultural biodiversityincludesspeciesusedforfood,fodder,fiberandfuel,aswellasthelargenumberofnon-harvestedspeciesinthewiderlandscapethatbenefitcommunitiesthroughthe services they provide, such as pollinators, soilbiotaandregulatorsofpestsanddiseases.Agriculturalbiodiversity provides material for experimentation,innovationandadaptation.Thegeneticdiversityfoundin local crop varieties and animal breeds, expressedin important traits such as drought, cold and salinetoleranceandresistancetopestsanddiseases,helpsthemadapttovarioussoilandclimateconditions.Lossin diversity of these traits decreases options for riskmanagementandadaptation.
knowledge and innovation
Communitiesstrengthentheirownresiliencebyexperi-menting, innovatingand learningwithinandbetween
Participants score their landscape using indicators for resilience during a workshop, Bhutan©COMDEKSBhutan/DorjiSingay

18 | Toolkit for the Indicators of Resilience in Socio-ecological Production Landscapes and Seascapes (SEPLS)18 | Toolkit for the Indicators of Resilience in Socio-ecological Production Landscapes and Seascapes (SEPLS) Chapter 2: The indicators | 19
differentknowledgesystems,culturesandagegroups.Adaptationstrategiesmaybenovelorold,butgener-allybuildonbio-culturalortraditionalknowledge.Thisknowledgeisspecifictothelocationsandculturesofgiven socio-ecological interactions. It is embodied inresource-use customs, agricultural traditions, locallanguages, cultural values and social institutions.Manycommunitiesarelosingtheirknowledgeoflocalresources, biodiversity and the historical events thathave shaped their landscapes and seascapes. Themaintenance of this knowledge increasingly dependsontheabilityofelders,parentsandtheyoungergener-ationsinacommunitytodocumentandshareit.
governance and social equity
Genderinequalities,socialexclusionandmarginaliza-tioncanhindertheabilityofwomen,indigenousgroupsand others to strengthen the resilience of their land-scapes or seascapes. Women, youth and the elderlyholdspecificknowledgeandskillsrelatedtobiodiver-sity.Forindigenouscommunities,resilienceisintrinsi-cally linked with efforts to protect traditional ways ofsubsistenceandculturalheritage.Theabilitytoaccessancestral lands and engage in traditional land useandagriculturalpracticesareimportantconditionsforcommunities to maintain biodiversity and associatedtraditionalknowledge.
Livelihoods and well-being
Theresilienceofaproductionlandscapeorseascapeis also dependent on the availability of efficient andfunctioning infrastructure such as communication,health and education to meet various communityneeds and aspirations. Livelihood improvement canbedirectly linked to theoptionsandopportunitiesofcommunitymemberstoengageinavarietyofsustain-able income-generating activities developed through
peoples’ ingenuity and the biodiversity portfolio theyhaveavailable.
2.2 How to use the indicators
Theindicatorspresentedinthetablebelowhavebeendevelopedtoguidetheassessmentofresilienceduringassessment workshops participated in by communitymembersandothers.Assessmententails assigningascore and trend to each indicator in response to thequestionsinthetable’ssecondcolumn.Ascorecanbeassignedtoallindicatorsusingthe5-pointscalegiveninthetable’sthirdcolumn,andinformationabouttrendscanbecapturedusingthecategoriesshownhere:
Scores trends
(5)Veryhigh↑Upward trend
(4)High
(3)Medium →No change
(2)Low↓Downward trend
(1)Verylow
The other columns in the table are meant to facili-tate understanding of the questions for scoring andto capture additional information during the groupdiscussion. The first column gives an explanation ofthequestion forscoringandsomeexamplesofwhatismeantbysomeoftheterminology.Thelastcolumncontains, where relevant, additional questions whichcanbeaskedafter individual scoringhasbeendoneand the group is engaged in reaching a consensus.Thesequestionsarenotfixedandcanvaryaccordingtothesituationatthediscretionofthefacilitator.
Notescanbefoundinthefirstcolumnofsomeoftheindicators. Theseare intended to facilitate answeringthequestions for scoring. For example,when talkingabout landscape and seascape diversity it may beusefultorefertoaparticipatorymappingexercise,orthe timelineused toexplain theconceptof resilience
mayhelpscoringwhentalkingaboutthecapacityforrecovery and regeneration of the SEPLS. For morespecific advice on how to carry out an assessmentworkshop, see Chapter 3, where the mapping exer-ciseand timeline formpartof the introductionof theworkshop.
2.3 list of indicators
Indicator description Questions for scoring
Scores discussion questions
Landscape/seascape diversity and ecosystem protection
(1) Landscape/seascape diversity
Thelandscapeorseascapeiscomposedofadiversity/mosaicofnaturalecosystems(terrestrialandaquatic)andlanduses.
Examples:Natural ecosystems: mountains,forests,grasslands,wetlands,lakes,rivers,coastallagoons,estuaries,coralreefs,seagrassmeadowsandmangroveforests.
Land uses:homegardens,cultivatedfields,orchards,(seasonal)pastures,haymakinglands,aquaculture,forestryandagro-forestry,irrigationcanals,waterwells.
Note:Landscape/seascapediversityandlandusescanbedemonstratedthroughamappingexercise.
Isthelandscape/seascapecomposedofdiversenaturalecosystems(terrestrialandaquatic)andlanduses?
(5)
(4)
(3)
(2)
(1)
Veryhigh(Thereisalargenumberofnaturalecosystemsandlanduses)
High
Medium
Low
Verylow(Thereisonlyoneoraverysmallnumberofnaturalecosystemsandlanduses)
(2) Ecosystem protection
Areaswithinthelandscapeorseascapeareprotectedfortheirecologicaland/orculturalimportance.
Note: Protectionmaybeformalorinformalandincludetraditionalformsofprotectionsuchassacredsites.
Examples:Strictnaturereserves,nationalparks,wildernessareas,heritagesites,communityconservedareas,marineprotectedareas,limited-useareas,sacredsites,grazingreserveareas,rulesandregulationstoexcludeoutsidersfromthe(seasonal)useofnaturalresources,etc.
Arethereareasinthelandscapeorseascapewhereecosystemsareprotectedunderformalorinformalformsofprotection?
(5)
(4)
(3)
(2)
(1)
Veryhigh(Keyresourcesareundersomeformofprotection)
High
Medium
Low
Verylow(Therearenoareasunderprotection)
Whichecosystemsareprotectedandwhatistheformofprotection?
20 | Toolkit for the Indicators of Resilience in Socio-ecological Production Landscapes and Seascapes (SEPLS) Chapter 2: The indicators | 21
Indicator description Questions for scoring
Scores discussion questions
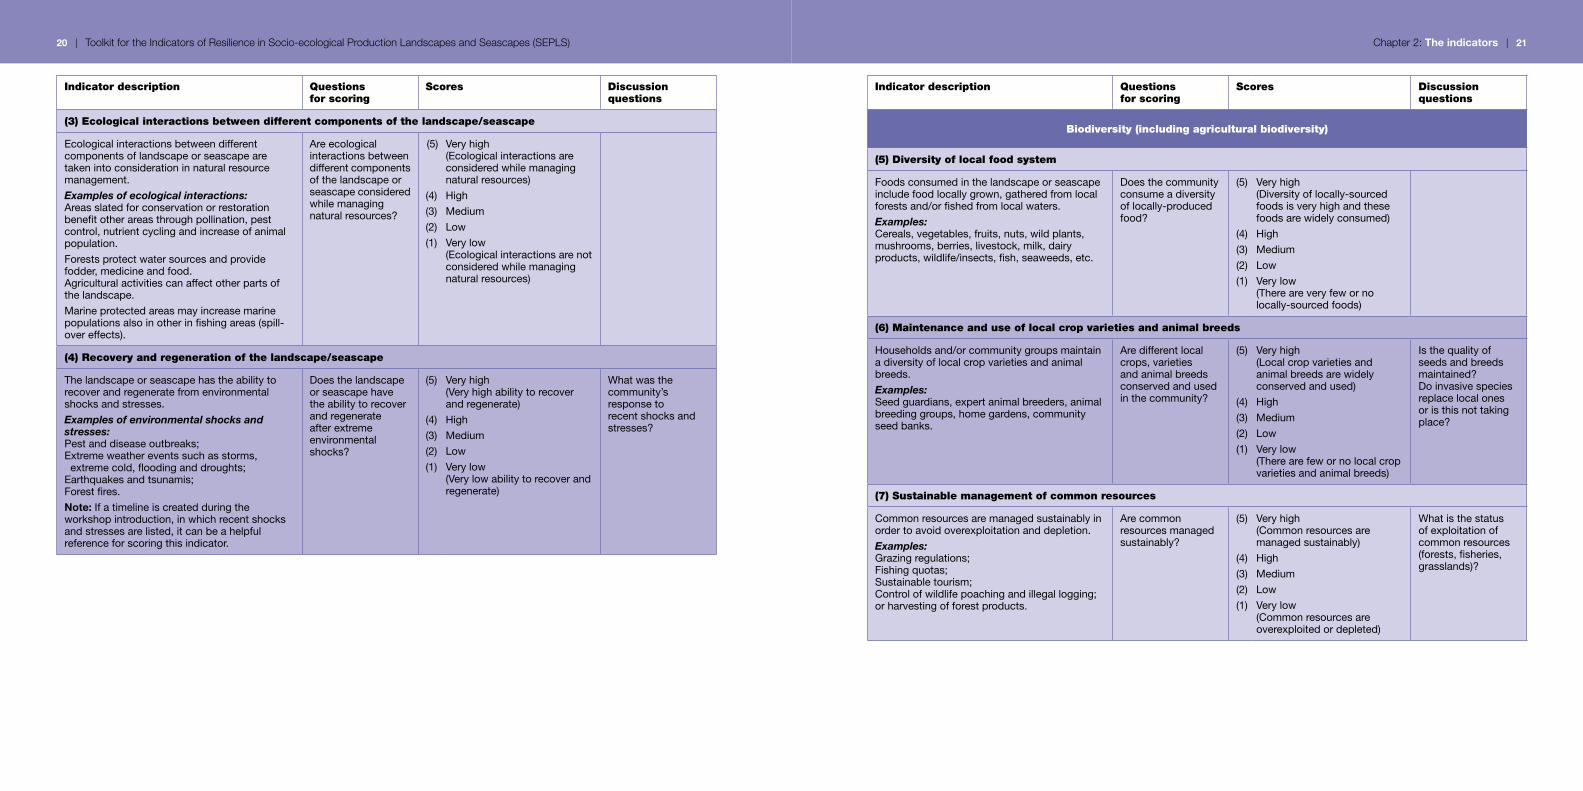
(3) Ecological interactions between different components of the landscape/seascape
Ecologicalinteractionsbetweendifferentcomponentsoflandscapeorseascapearetakenintoconsiderationinnaturalresourcemanagement.
Examples of ecological interactions: Areasslatedforconservationorrestorationbenefitotherareasthroughpollination,pestcontrol,nutrientcyclingandincreaseofanimalpopulation.
Forestsprotectwatersourcesandprovidefodder,medicineandfood.Agriculturalactivitiescanaffectotherpartsofthelandscape.
Marineprotectedareasmayincreasemarinepopulationsalsoinotherinfishingareas(spill-overeffects).
Areecologicalinteractionsbetweendifferentcomponentsofthelandscapeorseascapeconsideredwhilemanagingnaturalresources?
(5)
(4)
(3)
(2)
(1)
Veryhigh(Ecologicalinteractionsareconsideredwhilemanagingnaturalresources)
High
Medium
Low
Verylow(Ecologicalinteractionsarenotconsideredwhilemanagingnaturalresources)
(4) Recovery and regeneration of the landscape/seascape
Thelandscapeorseascapehastheabilitytorecoverandregeneratefromenvironmentalshocksandstresses.
Examples of environmental shocks and stresses:Pestanddiseaseoutbreaks;Extremeweathereventssuchasstorms,extremecold,floodinganddroughts;Earthquakesandtsunamis;Forestfires.
Note:Ifatimelineiscreatedduringtheworkshopintroduction,inwhichrecentshocksandstressesarelisted,itcanbeahelpfulreferenceforscoringthisindicator.
Doesthelandscapeorseascapehavetheabilitytorecoverandregenerateafterextremeenvironmentalshocks?
(5)
(4)
(3)
(2)
(1)
Veryhigh(Veryhighabilitytorecoverandregenerate)
High
Medium
Low
Verylow(Verylowabilitytorecoverandregenerate)
Whatwasthecommunity’sresponsetorecentshocksandstresses?
Indicator description Questions for scoring
Scores discussion questions
Biodiversity (including agricultural biodiversity)
(5) diversity of local food system
Foodsconsumedinthelandscapeorseascapeincludefoodlocallygrown,gatheredfromlocalforestsand/orfishedfromlocalwaters.
Examples:Cereals,vegetables,fruits,nuts,wildplants,mushrooms,berries,livestock,milk,dairyproducts,wildlife/insects,fish,seaweeds,etc.
Doesthecommunityconsumeadiversityoflocally-producedfood?
(5)
(4)
(3)
(2)
(1)
Veryhigh(Diversityoflocally-sourcedfoodsisveryhighandthesefoodsarewidelyconsumed)
High
Medium
Low
Verylow(Thereareveryfewornolocally-sourcedfoods)
(6) Maintenance and use of local crop varieties and animal breeds
Householdsand/orcommunitygroupsmaintainadiversityoflocalcropvarietiesandanimalbreeds.
Examples:Seedguardians,expertanimalbreeders,animalbreedinggroups,homegardens,communityseedbanks.
Aredifferentlocalcrops,varietiesandanimalbreedsconservedandusedinthecommunity?
(5)
(4)
(3)
(2)
(1)
Veryhigh(Localcropvarietiesandanimalbreedsarewidelyconservedandused)
High
Medium
Low
Verylow(Therearefewornolocalcropvarietiesandanimalbreeds)
Isthequalityofseedsandbreedsmaintained?Doinvasivespeciesreplacelocalonesoristhisnottakingplace?
(7) Sustainable management of common resources
Commonresourcesaremanagedsustainablyinordertoavoidoverexploitationanddepletion.
Examples: Grazingregulations;Fishing quotas;Sustainabletourism;Controlofwildlifepoachingandillegallogging;orharvestingofforestproducts.
Arecommonresourcesmanagedsustainably?
(5)
(4)
(3)
(2)
(1)
Veryhigh(Commonresourcesaremanagedsustainably)
High
Medium
Low
Verylow(Commonresourcesareoverexploitedordepleted)
Whatisthestatusofexploitationofcommonresources(forests,fisheries,grasslands)?

22 | Toolkit for the Indicators of Resilience in Socio-ecological Production Landscapes and Seascapes (SEPLS) Chapter 2: The indicators | 23
Indicator description Questions for scoring
Scores discussion questions
knowledge and innovation
(8) Innovation in agriculture and conservation practices
Newpracticesinagriculture,fisheriesandforestryaredeveloped,adoptedandimprovedand/ortraditionalpracticesarerevitalized.
Examples:Adoptionofwaterconservationmeasuressuchasdripirrigationorwaterharvesting;Diversificationoffarmingsystems;Introductionorre-introductionofdrought-orsaline-tolerantcrops;Organicagriculture;Terracing;Reintroductionofnativespecies;Shiftingandrotationofgrasslands;Reforestation;Replantingofcorals,seagrassandmangroves;Fishhouses;Selectivefishinggear.
Doesthecommunitydevelop,improveandadoptnewagricultural,fisheries,forestry,andconservationpracticesand/orrevitalizetraditionalonestoadapttochangingconditions,includingclimatechange?
(5)
(4)
(3)
(2)
(1)
Veryhigh(Thecommunityisreceptivetochangeandadjustsitspractices)
High
Medium
Low
Verylow(Thecommunityisnotreceptivetochangeandmakesfewinnovations)
Whichinnovativepracticesareusedinmanagingagriculture,fisheriesandforestry?
(9) traditional knowledge related to biodiversity
Localknowledgeandculturaltraditionsrelatedtobiodiversityaretransmittedfromeldersandparentstoyoungpeopleinthecommunity.
Examples:Songs,dances,rituals,festivals,stories,localterminologyrelatedtolandandbiodiversity;Specificknowledgeaboutfishing,cropplantingandharvesting,andtheprocessingandcookingoffood;Knowledgeincludedinschoolcurricula.
Arelocalknowledgeandculturaltraditionsrelatedtobiodiversitytransmittedfromeldersandparentstoyoungpeopleinthecommunity?
(5)
(4)
(3)
(2)
(1)
Veryhigh(Localknowledgeandculturaltraditionsaretransmittedtoyoungpeople)
High
Medium
Low
Verylow(Localknowledgeandculturaltraditionsarelost)
Indicator description Questions for scoring
Scores discussion questions
(10) documentation of biodiversity-associated knowledge
Thebiodiversityinthelandscapeorseascape,includingagriculturalbiodiversity,andknowledgeassociatedwithitisdocumented,storedandmadeavailabletocommunitymembers.
Examples: Traditionalknowledgeregisters;Resourceclassificationsystems;Communitybiodiversityregisters;Farmers’fieldschools;Animalbreedinggroups;Pastureco-managementgroups;Seedexchangenetworks(animalandseedfairs);Seasonalcalendars.
Isagriculturalbiodiversity,andassociatedknowledgedocumentedandexchanged?
(5)
(4)
(3)
(2)
(1)
Veryhigh(Documentationisrobust)
High
Medium
Low
Verylow(Thereislittleornodocumentationinthecommunity)
(11) Women’s knowledge
Women’sknowledge,experiencesandskillsarerecognizedandrespectedinthecommunity.Womenoftenhavespecificknowledge,experienceandskillsaboutbiodiversity,itsuseandmanagement,whicharedifferentfromthoseofmen.
Examples of women specific knowledge:Know-howabouttheproductionofparticularcrops;Collectionanduseofmedicinalplants;Caringforanimals.
Arewomen’sknowledge,experiencesandskillsrecognizedandrespectedathousehold,communityandlandscapelevels?
(5)
(4)
(3)
(2)
(1)
Veryhigh(Women’sknowledge,experiencesandskillsrecognizedandrespectedatalllevels)
High
Medium
Low
Verylow(Women’sknowledge,experiencesandskillsarenotrecognizedandrespected)
24 | Toolkit for the Indicators of Resilience in Socio-ecological Production Landscapes and Seascapes (SEPLS) Chapter 2: The indicators | 25
Indicator description Questions for scoring
Scores discussion questions
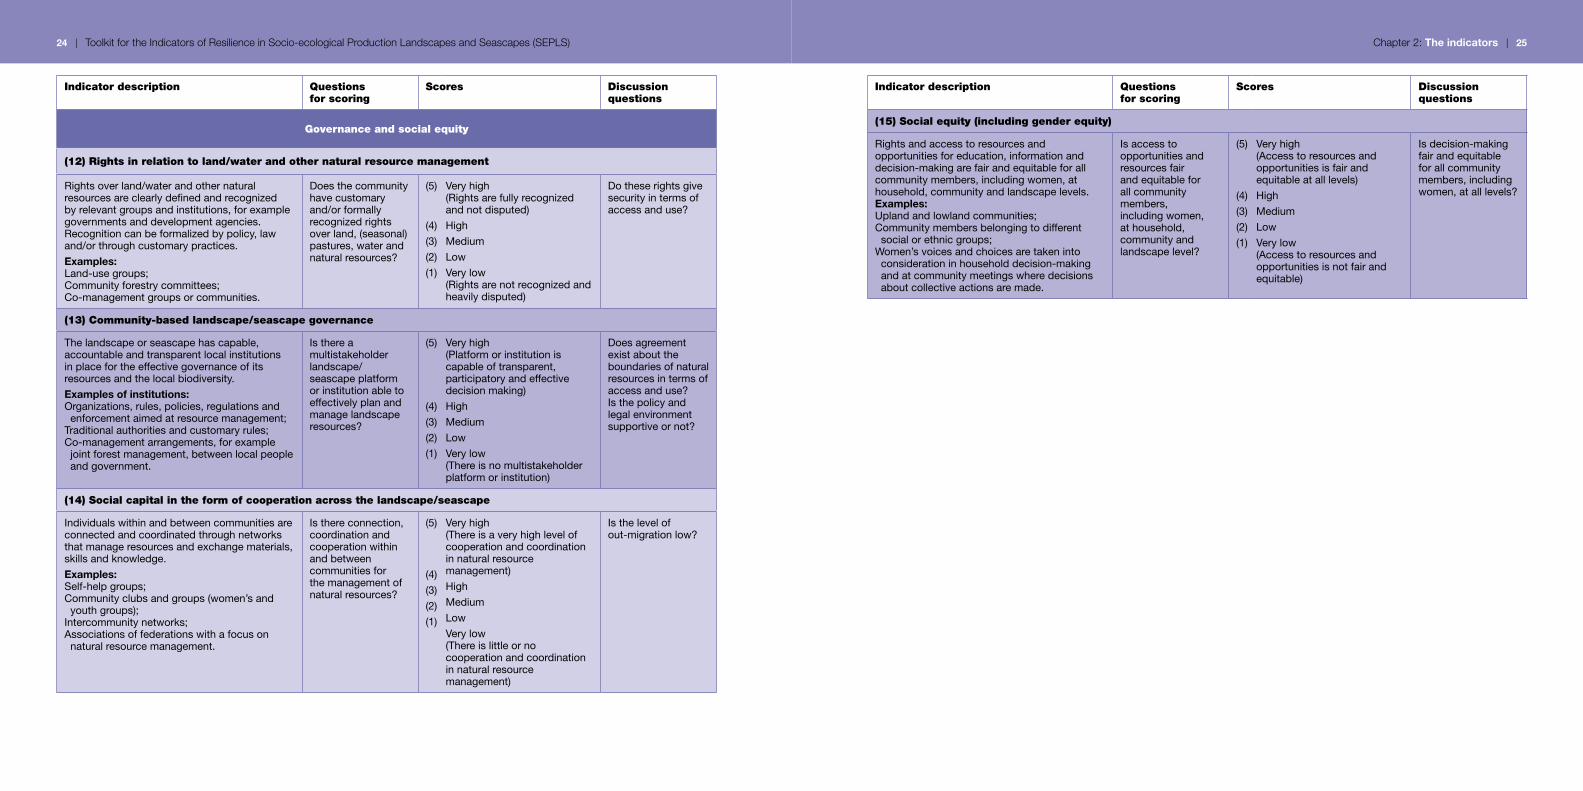
governance and social equity
(12) Rights in relation to land/water and other natural resource management
Rightsoverland/waterandothernaturalresourcesareclearlydefinedandrecognizedbyrelevantgroupsandinstitutions,forexamplegovernmentsanddevelopmentagencies.Recognitioncanbeformalizedbypolicy,lawand/orthroughcustomarypractices.
Examples: Land-usegroups;Communityforestrycommittees;Co-managementgroupsorcommunities.
Doesthecommunityhavecustomaryand/orformallyrecognizedrightsoverland,(seasonal)pastures,waterandnaturalresources?
(5)
(4)
(3)
(2)
(1)
Veryhigh(Rightsarefullyrecognizedandnotdisputed)
High
Medium
Low
Verylow(Rightsarenotrecognizedandheavilydisputed)
Dotheserightsgivesecurityintermsofaccessanduse?
(13) community-based landscape/seascape governance
Thelandscapeorseascapehascapable,accountableandtransparentlocalinstitutionsinplacefortheeffectivegovernanceofitsresourcesandthelocalbiodiversity.
Examples of institutions:Organizations,rules,policies,regulationsandenforcementaimedatresourcemanagement;Traditionalauthoritiesandcustomaryrules;Co-managementarrangements,forexamplejointforestmanagement,betweenlocalpeopleandgovernment.
Isthereamultistakeholderlandscape/seascapeplatformorinstitutionabletoeffectivelyplanandmanagelandscaperesources?
(5)
(4)
(3)
(2)
(1)
Veryhigh(Platformorinstitutioniscapableoftransparent,participatoryandeffectivedecisionmaking)
High
Medium
Low
Verylow(Thereisnomultistakeholderplatformorinstitution)
Doesagreementexistabouttheboundariesofnaturalresourcesintermsofaccessanduse?Isthepolicyandlegalenvironmentsupportiveornot?
(14) Social capital in the form of cooperation across the landscape/seascape
Individualswithinandbetweencommunitiesareconnectedandcoordinatedthroughnetworksthatmanageresourcesandexchangematerials,skillsandknowledge.
Examples:Self-helpgroups;Communityclubsandgroups(women’sandyouthgroups);Intercommunitynetworks;Associationsoffederationswithafocusonnaturalresourcemanagement.
Isthereconnection,coordinationandcooperationwithinandbetweencommunitiesforthemanagementofnaturalresources?
(5)
(4)
(3)
(2)
(1)
Veryhigh(Thereisaveryhighlevelofcooperationandcoordinationinnaturalresourcemanagement)
High
Medium
Low
Verylow(Thereislittleornocooperationandcoordinationinnaturalresourcemanagement)
Isthelevelofout-migrationlow?
Indicator description Questions for scoring
Scores discussion questions
(15) Social equity (including gender equity)
Rightsandaccesstoresourcesandopportunitiesforeducation,informationanddecision-makingarefairandequitableforallcommunitymembers,includingwomen,athousehold,communityandlandscapelevels.Examples:Uplandandlowlandcommunities;Communitymembersbelongingtodifferentsocialorethnicgroups;Women’svoicesandchoicesaretakenintoconsiderationinhouseholddecision-makingandatcommunitymeetingswheredecisionsaboutcollectiveactionsaremade.
Isaccesstoopportunitiesandresourcesfairandequitableforallcommunitymembers,includingwomen,athousehold,communityandlandscapelevel?
(5)
(4)
(3)
(2)
(1)
Veryhigh(Accesstoresourcesandopportunitiesisfairandequitableatalllevels)
High
Medium
Low
Verylow(Accesstoresourcesandopportunitiesisnotfairandequitable)
Isdecision-makingfairandequitableforallcommunitymembers,includingwomen,atalllevels?

26 | Toolkit for the Indicators of Resilience in Socio-ecological Production Landscapes and Seascapes (SEPLS) Chapter 2: The indicators | 27
Indicator description Questions for scoring
Scores discussion questions
Livelihoods and well-being
(16) Socio-economic infrastructure
Socio-economicinfrastructureisadequateforcommunityneeds.
Examples of socio-economic infrastructure:Schools,hospitals,roadsandtransport;Safedrinkingwater;Markets;Electricityandcommunicationinfrastructure.
Isthesocio-economicinfrastructureadequatefortheneedsofthecommunity?
(5)
(4)
(3)
(2)
(1)
Veryhigh(Socio-economicinfrastructuremeetsallcommunityneeds)
High
Medium
Low
Verylow(Socio-economicinfrastructuredoesnotmeetcommunityneeds)
(17) human health and environmental conditions
Theoverallstateofhumanhealthinthecommunityissatisfactory,alsoconsideringtheprevailingenvironmentalconditions.
Examples:Absenceorregularoccurrenceofdiseases;Frequencyofdiseaseoutbreaksthataffectalargenumberofpeople;Absence/presenceofenvironmentalstresseslikepollution,lackofcleanwater,exposuretoextremeweatherevents.
Whatisthegeneralhealthsituationoflocalpeoplealsoconsideringtheprevailingenvironmentalconditions?
(5)
(4)
(3)
(2)
(1)
Veryhigh(Thehealthsituationandtheenvironmentalconditionsaregood)
High
Medium
Low
Verylow(Thehealthandtheenvironmentalconditionsarebad)
Whatarethemainrisks?Whattypesofmedicineareused?(i.e.traditionalhealingmethods,modernmedicine)
(18) Income diversity
Peopleinthelandscapeorseascapeareinvolvedinavarietyofsustainableincome-generatingactivities.
Note:Diversityineconomicactivitiescanhelphouseholdsincaseofunexpecteddownturns,disasters,changesinenvironmentalconditions,etc.
Arehouseholdsinthecommunityinvolvedinavarietyofsustainable,income-generatingactivities?
(5)
(4)
(3)
(2)
(1)
Veryhigh(Householdsareinvolvedinavarietyofsustainable,incomegeneratingactivities)
High
Medium
Low
Verylow(Householdshavenoalternativeeconomicactivities)
Whatactivitiesgenerateincomeinthelandscapeorseascape?
Indicator description Questions for scoring
Scores discussion questions
(19) Biodiversity-based livelihoods
Livelihoodimprovementsinthelandscapeorseascapeareconcernedwithinnovativeuseoflocalbiodiversity. Examples: Handicraftsusinglocalmaterials,e.g.woodcarving,basketry,painting,weavingetc.;Eco-tourism;Processingoflocalfoods,bee-keepingetc.
Doesthecommunitydevelopinnovativeuseofthelocalbiodiversityforitslivelihoods?
(5)
(4)
(3)
(2)
(1)
Veryhigh(Livelihoodsarebeingimprovedbyinnovativeuseoflocalbiodiversity)
High
Medium
Low
Verylow(Livelihoodimprovementsarenotrelatedtolocalbiodiversity)
(20) Socio-ecological mobility
Householdsandcommunitiesareabletomovearoundtotakeadvantageofshiftsinproductionopportunitiesandavoidlanddegradationandoverexploitation.
Examples of mobility:Shiftingcultivationandcroprotationpractices;Shiftingbetweenagricultureandherding/fishing;Seasonalmigrationofherders;Shiftingfishinggrounds;Maintainingreserveareasforperiodsofhardship.
Arehouseholdsandcommunitiesabletomovearoundbetweendifferentproductionactivitiesandlocationsasnecessary?
(5)
(4)
(3)
(2)
(1)
Veryhigh(Therearesufficientopportunitiesformobility)
High
Medium
Low
Verylow(Therearenoopportunitiesformobility)
Arethereagreedrulesandregulationsforeffectivelydoingso?
28 | Toolkit for the Indicators of Resilience in Socio-ecological Production Landscapes and Seascapes (SEPLS)
3Chapter 3 Practical guidance for using the
indicators
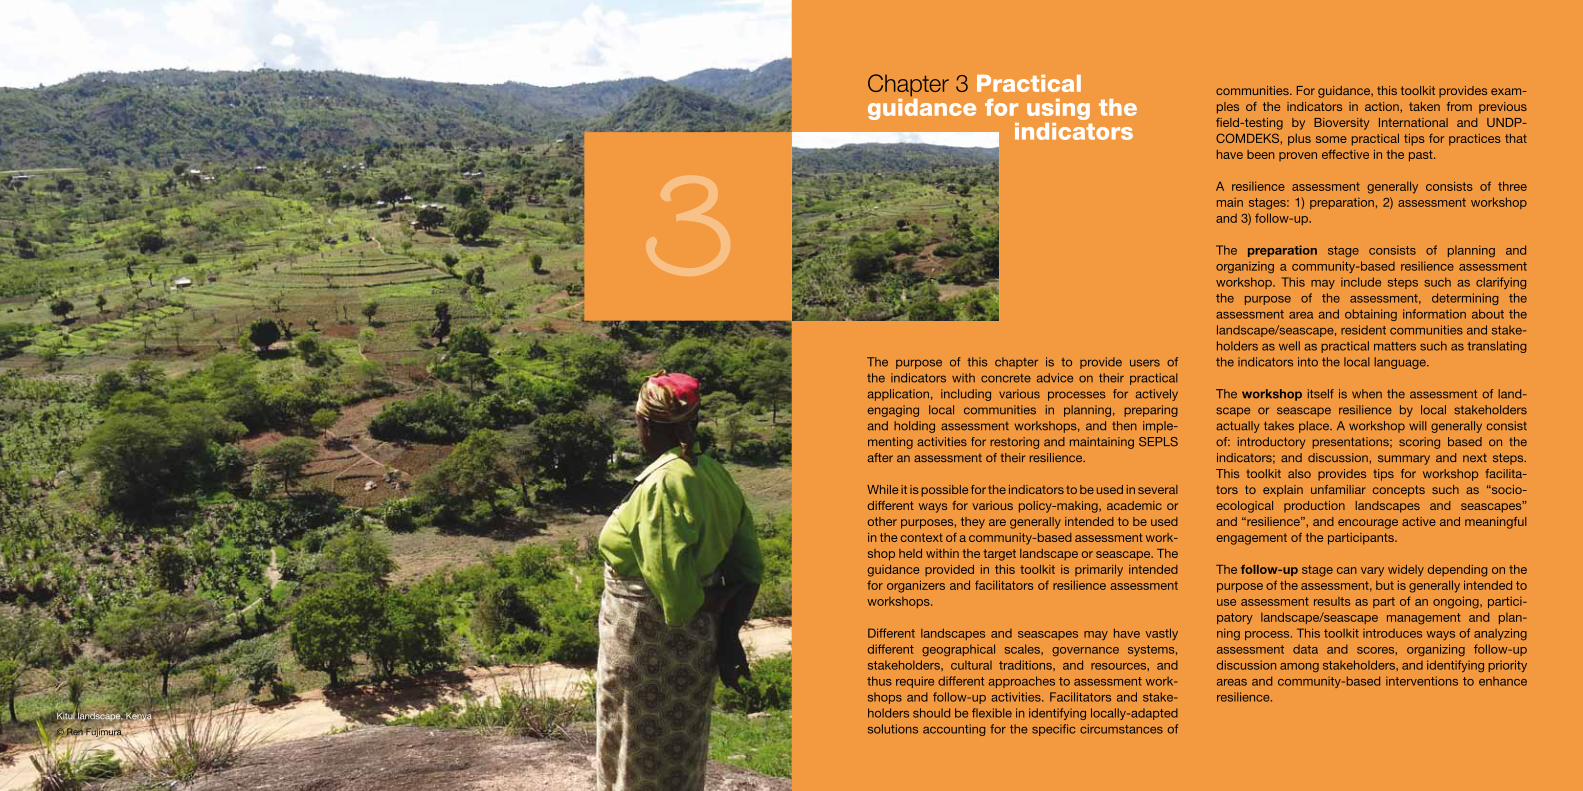
The purpose of this chapter is to provide users ofthe indicators with concrete advice on their practicalapplication, including various processes for activelyengaging local communities in planning, preparingandholdingassessmentworkshops,and then imple-mentingactivitiesforrestoringandmaintainingSEPLSafteranassessmentoftheirresilience.
Whileitispossiblefortheindicatorstobeusedinseveraldifferentwaysforvariouspolicy-making,academicorotherpurposes,theyaregenerallyintendedtobeusedinthecontextofacommunity-basedassessmentwork-shopheldwithinthetargetlandscapeorseascape.Theguidanceprovided in this toolkit isprimarily intendedfororganizersandfacilitatorsofresilienceassessmentworkshops.
Different landscapesandseascapesmayhavevastlydifferent geographical scales, governance systems,stakeholders, cultural traditions, and resources, andthusrequiredifferentapproachestoassessmentwork-shopsandfollow-upactivities.Facilitatorsandstake-holdersshouldbeflexibleinidentifyinglocally-adaptedsolutionsaccountingforthespecificcircumstancesof
communities.Forguidance,thistoolkitprovidesexam-ples of the indicators in action, taken from previousfield-testing by Bioversity International and UNDP-COMDEKS,plussomepracticaltipsforpracticesthathavebeenproveneffectiveinthepast.
A resilience assessment generally consists of threemainstages:1)preparation,2)assessmentworkshopand3)follow-up.
The preparation stage consists of planning andorganizingacommunity-based resilienceassessmentworkshop. This may include steps such as clarifyingthe purpose of the assessment, determining theassessmentareaandobtaining informationaboutthelandscape/seascape,residentcommunitiesandstake-holdersaswellaspracticalmatterssuchastranslatingtheindicatorsintothelocallanguage.
Theworkshopitselfiswhentheassessmentofland-scape or seascape resilience by local stakeholdersactuallytakesplace.Aworkshopwillgenerallyconsistof: introductory presentations; scoring based on theindicators; anddiscussion, summary and next steps.This toolkit also provides tips for workshop facilita-tors to explain unfamiliar concepts such as “socio-ecological production landscapes and seascapes”and“resilience”,andencourageactiveandmeaningfulengagementoftheparticipants.
Thefollow-up stagecanvarywidelydependingonthepurposeoftheassessment,butisgenerallyintendedtouseassessmentresultsaspartofanongoing,partici-patory landscape/seascape management and plan-ningprocess.Thistoolkitintroduceswaysofanalyzingassessment data and scores, organizing follow-updiscussionamongstakeholders,andidentifyingpriorityareasandcommunity-basedinterventionstoenhanceresilience.
Kituilandscape,Kenya
©RenFujimura
30 | Toolkit for the Indicators of Resilience in Socio-ecological Production Landscapes and Seascapes (SEPLS) Chapter 3: Practical guidance for using the indicators | 31
3.1 stage 1: Preparation
Setting the stage
Before planning the details of an assessment work-shop,itisadvisabletomakesurethereisaclearunder-standingofanumberofbasicprinciples,suchastheexact purpose of the assessment, the target SEPLS,etc.Allinvolvedpartiesshouldsharethesameunder-standingtoensurethateveryoneisworkingtowardthesamepurposes.
clarifying the purpose of the assessment
It isimportanttomakesurethateveryoneinvolvedintheplanningof theresilienceassessmenthasaclearandconsistentunderstandingofthepurpose(s)oftheassessmentandwhatitisexpectedtoaccomplish.Thepurposeoftheassessmentwillaffecthowitiscarriedout.
Tips:Some examples of purposes of an assessment mayinclude:• Gainingacommonunderstandingofthestateofthe
landscapeorseascape.• Identifyingstrengthsofandthreatstothelandscape
orseascape.• Empoweringlocalcommunitiestostrengthentheir
resilience.• Developing landscape/seascape management
strategies and identifying possible collaborativeactionsinthelandscapeorseascapetostrengthenresilience.
• Enhancing trustandsocialcapital incommunitiesandresolvingconflict.
• Monitoringresilienceofthelandscapeorseascapeanditscommunitiesovertime.
Selection of the assessment area
The target landscape or seascape should be deter-minedbasedon thepurposeof theassessment andthe available resources, and a demonstrated interestandengagementofthecommunitieslivinginthearea.
To help clarify why the landscape or seascape waschosen,itmaybeusefultodevelopanumberofparam-eters,suchasnaturalassets,socio-economicactivities,cultural heritage, threats and opportunities, and thepresenceofparticularspeciesandbiodiversityvalues.
indicators in action SELEctIon of thE aSSESSMEnt
aREa
• For Bioversity International’s study in Bolivia,a local NGO that had worked for over twodecades on the conservation, improvementand marketing of local varieties of roots andtubercropstobenefitsmallfarmersinsixteenvillages facilitated theplanningandpreparingof the resilience assessment. The NGOselected two of the villages to conduct theresilienceassessment.
• For the COMDEKS baseline assessment inNamibia, the target landscape was a newconservancy that had been created as anadministrative unit and was selected by theSGP National Steering Committee based ona number of criteria including its biodiversityvalue,ecosystemsensitivity,tourismpotential,its ranking among the most underdevelopedareas inNamibia, andUNDPpresence in thearea(seeChapter4).
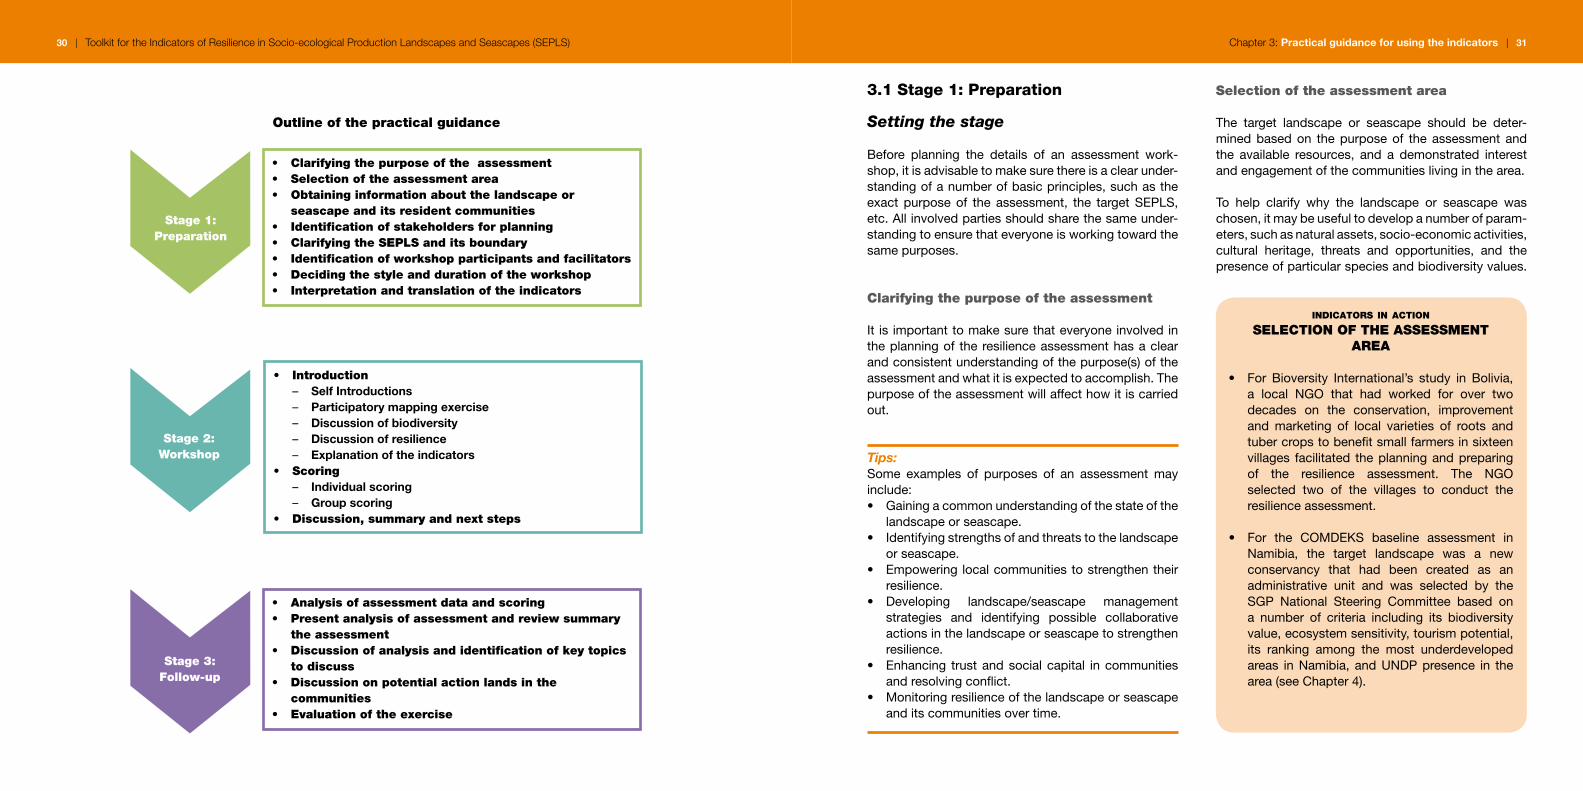
outline of the practical guidance
• clarifying the purpose of the assessment• Selection of the assessment area• obtaining information about the landscape or seascape and its resident communities• Identification of stakeholders for planning• clarifying the SEPLS and its boundary • Identification of workshop participants and facilitators• deciding the style and duration of the workshop• Interpretation and translation of the indicators
Stage 1:Preparation
• Introduction – Self Introductions – Participatory mapping exercise – Discussion of biodiversity – Discussion of resilience – Explanation of the indicators
• Scoring – Individual scoring – Group scoring
• discussion, summary and next steps
Stage 2:Workshop
• analysis of assessment data and scoring• Present analysis of assessment and review summary the assessment • discussion of analysis and identification of key topics to discuss• discussion on potential action lands in the communities • Evaluation of the exercise
Stage 3:follow-up

32 | Toolkit for the Indicators of Resilience in Socio-ecological Production Landscapes and Seascapes (SEPLS) Chapter 3: Practical guidance for using the indicators | 33
Stakeholders gather to assess boundaries of the landscape in Daman, Nepal
obtaining information about the landscape or seascape and its resident communities
Obtainingscientificandstatisticalinformationaboutthelandscapeorseascapefacilitatesbetterunderstandingoftheareaandappropriatedesignandpreparationoftheassessment.Thisinformationisalsousefulforassess-mentparticipantsandstakeholderstohaveacommonunderstandingoftheareaandtoutilizetheinformationin the resilience assessment. Information may includelanduses,population,rainfall,livelihoodsandothers,aswellasbiodiversityanditsvalue.
Wherepossible,itisagoodideatoobtaininformationondevelopmentplansandprojectsbeingundertakenin the area, capacities of key stakeholders such asgovernments,NGOsandcommunity-basedorganiza-tions and their presence in the area, and any poten-tial opportunities and synergies available to enhanceresilience.
indicators in action IdEntIfyIng StakEhoLdERS
• During theCOMDEKSassessment inMalawi,the assessment facilitators were supportedby the District Executive Committee (DEC),composed of members from the differentgovernment departments (agriculture, fish-eries,environment,education,planning,etc.).Selected members of the DEC accompaniedtheassessmentcoordinatorsastheymobilizedcommunities through local traditional authori-ties and village heads. The team conducteda participatory appraisal with relevant NGOs,local communities and front-line agriculturaland natural resources extension staff in thearea.
• InNamibia,whereanassessmentwascarriedout for an already-defined conservancy, theNGOcontractedtoruntheassessmentmadeuse of the radio, which is the major meansof wide-scale communication in the area, togatherstakeholdersfromaroundtheconserv-ancy.TheNGOthenconsultedasmanypeopleas possible to gain an understanding of thevariousactorsandinterestsinthelandscape.
Consultation and planning
Consultation with local stakeholders is a useful wayand essential requirement to learn more about theareaandcommunitiestotailortheassessmenttolocalneeds.Somedegreeofconsensusmustbereachedontheassessment’spurpose,definitionofthelandscape/seascapeanditsboundary,participants,facilitators,etc.
indicators in action InfoRMatIon coLLEctIon
• GeographicInformationSystem(GIS)mappingwasused to identify the target landscape forCOMDEKS activities in Cambodia and dividethetargetareaintoanumberofsocio-ecolog-icalareastakingintoaccounttopography,rain-fallpatterns,soiltypes,landuse,forestcoverchangeandstatutorylandtenuresystems.
• In Bhutan, the baseline assessment of thetarget landscape was carried out buildingon an existing Watershed Management Plandeveloped in 2009 by the Royal Governmentof Bhutan, which had been stalled due to alack of financial resources. In this case, theCOMDEKS landscape-wide baseline assess-mentwaspartofanefforttobuildonexistingdevelopmentplanstorebuildandrevitalizetheGamri Watershed based on the data alreadycollectedforthoseplans.
Identification of stakeholders for planning
Key stakeholders in the area should be identi-fied during the planning process for consultation inthe next phase. These should represent all relevantsectors and may include local and national NGOs;indigenous peoples’, women’s, elders’, and youthgroups; officers in forest and agricultural manage-ment;cooperativesandunions;representativesfromlocal farmers, fishermen, hotel owners and tourismoperators;andothers.
Community members are consulted before devising landscape strategy, Cambodia
Tips:Consultation with local stakeholders will facilitatelearningmoreabout:• Community priorities, the current state of the
environment and socio-economic conditions andperceivedthreats.
• Existing and potential projects and plans in thetargetarea.
• Capacities and capability of the various stake-holdersinthearea.
• Opportunitiesforcollaborationwithotheractivities.• Suitable community representatives and other
assessment participants representing differentgroups.
• Theexpected time frame for trends inchangesofthe indicatorsof resilience (forexample,10years,30years,etc.).
Thefollowingpagescoversomeoftheissuesinvolvedintheplanningofanassessmentandconsultationwithlocalstakeholders.
©C
OM
DE
KS
Nep
al/T
opB
ahad
urS
hahi
©C
OM
DE
KS
Cam
bod
ia/N
gin
Nav
irak
34 | Toolkit for the Indicators of Resilience in Socio-ecological Production Landscapes and Seascapes (SEPLS) Chapter 3: Practical guidance for using the indicators | 35
clarifying the SEPLS and its boundary
The exact landscape or seascape should be definedbased on a community perspective. The boundariesof the landscape or seascape (watershed, jurisdic-tional boundaries, social definition of the landscapeorseascape,etc.)maybedeterminedthroughconsul-tation with key local stakeholders and/or by usingsketches,maps,GISdataoftheregion,etc.Ingeneral,it ishelpful to takeaflexibleapproachdependingonlocal needs. The SEPLS and its boundary can alsobe discussed at the beginning of the assessmentworkshop.
Identification of resilience assessment workshop participants
Theparticipants in theworkshopwill varydependingon itspurposeand thebackgroundof the landscapeorseascape.Participantsmayincludekeylocalstake-holderswithavarietyofinterestssuchaslocalfarmers,fishermen, government authorities, the private sectorandothers,aswellascross-sectorexpertise if tech-nicalserviceprovidersareincluded.
Attentionshouldbepaid toensuring there is agoodgenderandagebalance.Likewise,itisvitaltoincludeindigenous peoples and minority groups if they arepresent in the landscape or seascape. For a largeor diverse landscape or seascape, it is important toincludestakeholdersfromdifferentcommunitiesinthetargetarea.
In order to identify assessment participants fromdifferent groups, it is useful to visit all communitiesin advance. Communities can suggest key repre-sentativesof thecommunity tobeparticipants in theworkshop.
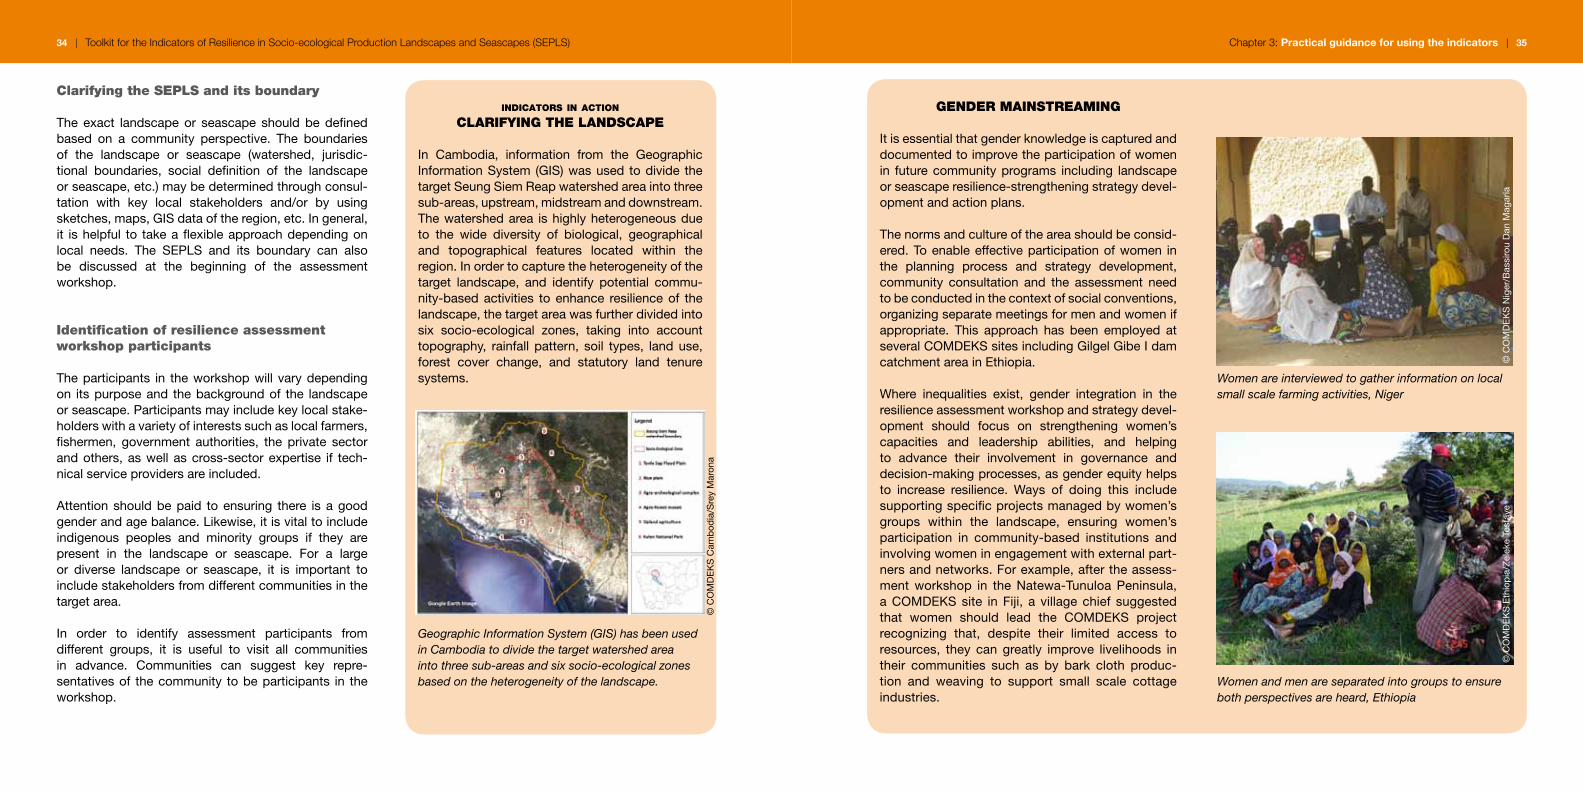
indicators in action cLaRIfyIng thE LandScaPE
In Cambodia, information from the GeographicInformationSystem (GIS)wasused todivide thetargetSeungSiemReapwatershedareaintothreesub-areas,upstream,midstreamanddownstream.Thewatershedarea ishighlyheterogeneousdueto the wide diversity of biological, geographicaland topographical features located within theregion.Inordertocapturetheheterogeneityofthetarget landscape, and identify potential commu-nity-basedactivities toenhance resilienceof thelandscape,thetargetareawasfurtherdividedintosix socio-ecological zones, taking into accounttopography, rainfall pattern, soil types, land use,forest cover change, and statutory land tenuresystems.
Geographic Information System (GIS) has been used in Cambodia to divide the target watershed area into three sub-areas and six socio-ecological zones based on the heterogeneity of the landscape.
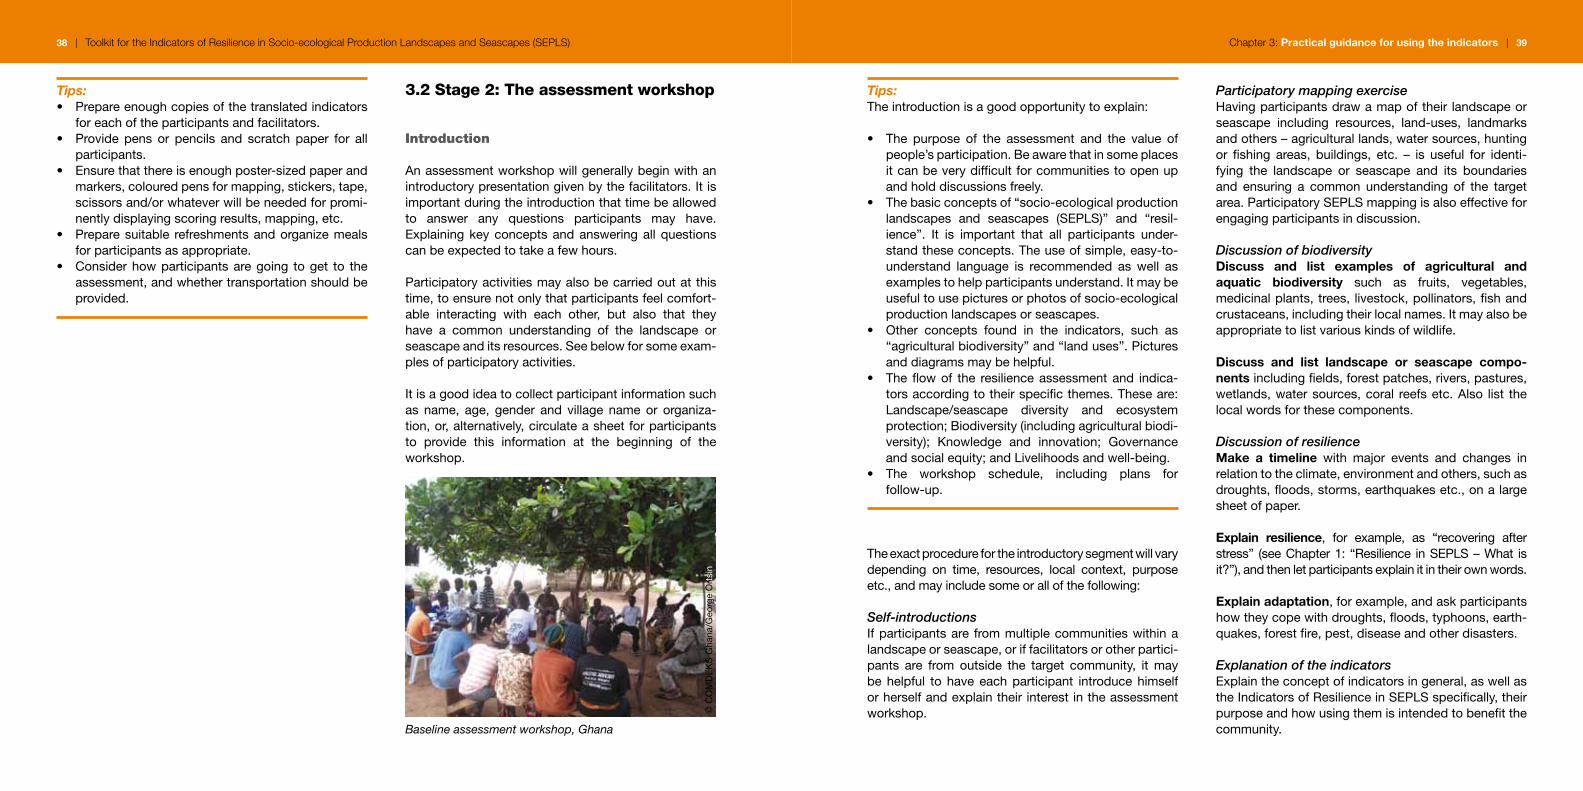
gEndER MaInStREaMIng
Itisessentialthatgenderknowledgeiscapturedanddocumentedtoimprovetheparticipationofwomenin futurecommunityprograms including landscapeorseascaperesilience-strengtheningstrategydevel-opmentandactionplans.
Thenormsandcultureoftheareashouldbeconsid-ered.Toenableeffectiveparticipationofwomen inthe planning process and strategy development,community consultation and the assessment needtobeconductedinthecontextofsocialconventions,organizingseparatemeetingsformenandwomenifappropriate. This approach has been employed atseveralCOMDEKSsitesincludingGilgelGibeIdamcatchmentareainEthiopia.
Where inequalities exist, gender integration in theresilienceassessmentworkshopandstrategydevel-opment should focus on strengthening women’scapacities and leadership abilities, and helpingto advance their involvement in governance anddecision-makingprocesses,asgenderequityhelpsto increase resilience. Ways of doing this includesupportingspecificprojectsmanagedbywomen’sgroups within the landscape, ensuring women’sparticipation in community-based institutions andinvolvingwomeninengagementwithexternalpart-nersandnetworks.Forexample,aftertheassess-ment workshop in the Natewa-Tunuloa Peninsula,aCOMDEKSsite inFiji, a villagechief suggestedthat women should lead the COMDEKS projectrecognizing that, despite their limited access toresources, they can greatly improve livelihoods intheir communities such as by bark cloth produc-tion and weaving to support small scale cottageindustries.
Women are interviewed to gather information on local small scale farming activities, Niger
Women and men are separated into groups to ensure both perspectives are heard, Ethiopia
©C
OM
DE
KS
Cam
bod
ia/S
rey
Mar
ona
©C
OM
DE
KS
Nig
er/B
assi
rou
Dan
Mag
aria
©
CO
MD
EK
SE
thio
pia
/Zel
eke
Tesf
aye

36 | Toolkit for the Indicators of Resilience in Socio-ecological Production Landscapes and Seascapes (SEPLS) Chapter 3: Practical guidance for using the indicators | 37
deciding the style and duration of the workshop
A resilienceassessmentworkshopgenerally consistsofthreemainparts:1)anintroduction;2)scoringoftheindicators;and3)discussionoftheresultsandwrap-up.Timeconstraintsmayallowformoreorlesstime,buttestinghasshownthattheintroductionandscoringmaytakeonewholeday(includinglunchandteabreak),withanotherhalfdayfordiscussionandwrap-up.
The design of an assessment workshop should bebased on information obtained in the consultations,fieldvisitsandother informationcollection,andfinal-izedtogetherwithlocalstakeholders.Forthisreason,it is important to have a good understanding of thetargetlandscapeorseascapeandthesocio-economic,cultural,andothercircumstancesofresidentcommu-nitiesduringplanning.Forexample,womenandmentend to have different perceptions because of thedifferent roles they usually have, and come up withdifferentviewsonmanyoftheindicators.Insuchcasesit is recommended to have separate groups for thescoringprocessandthenbringtheresultstogetherinthewholegroupdiscussion.Thesameprocesscanbeconsideredforcommunitymembersofdifferentsocio-economicstatus.
The number, size and duration of assessment work-shops depend on the resources available and thecapacity of the communities. In many cases localcommunitymembers,suchasfarmersandfishermen,will be busy with their work, so it is advisable thatthe assessment workshop be completed within oneor twodays,oradapted to thescheduleof the localstakeholders.
Interpretation and translation of the indicators
Prior to the assessment workshop, it is essential tomakesurethattheresilienceindicatorsareexpressedinlanguagethattheparticipantswillbeabletounder-standeasily.Thismayrequiretranslatingthemintooneormore languages.EvenfornativeEnglishspeakers,itmaybenecessarytoalterthelanguageusedintheindicatorstomakethemmoreeasilyunderstoodinthelocalcontext.
Theindicatorshavebeendevelopedtobeapplicabletodifferenttypesandsizesoflandscapesandseascapes.Therefore, facilitators and participating communitiesmayalsoneedtoadjustthecontentofthe indicatorsdependingonthelocalcircumstances.Dependingonthe context, additional indicators can be integratedwhile indicators that are not deemed relevant maybediscarded.
During a baseline assessment in Niger, stones are used as markers
indicators in action SaMPLE aSSESSMEnt WoRkShoP
tIMEtaBLE
Bioversity International held assessment work-shopsinFiji,withparticipantsfromvillagesintheBoumaNationalHeritageParkonTaveuniIsland.Around 10 villagers from each of two villagesparticipated ina1.5dayworkshop.Since therewerealargenumberofparticipants,theintroduc-tionwasdoneforthewholegroupandthegroupthendividedintotwo,witheachvillagedoingitsownmappingexerciseandscoringoftheindica-tors.Discussionswereheld separately for eachvillagethenextday.
DAY 1: Introduction and scoring 9:30-10:00 Introduction(30min.)10:00-11:00 Participatorymappingexercise(1hour)11:00-12:00 Discussionaboutdiversityand
resilienceinthecommunities(1hour)12:00-12:15 Teabreak(15min.)12:15-14:00 Scoring(Questions1-7)
(1hour45min.)14:00-14:30 Lunchbreak(30min.)14:30-16:30 Scoring(Questions8-20)(2hours)16:30-17:00 Summaryoftheassessmentandnext
steps(30min.)
DAY 2: Discussions 9:30-10:00 Analysisofscoringandreview
summaryoftheassessment(30min.)10:00-11:00 Discussionofanalysisand
identificationofkeytopicstodiscuss (1hour)
11:00-12:00 Discussionofpotentialactionplans inthevillage(1hour)
12:00-12:30 Evaluationoftheexercise(30min.)12:30-13:00 Lunch(30min.)
Identification of facilitators
Facilitatorsarethepeoplewhowillruntheworkshop,andtheirrolemayinvolveorganizing,planning,actingasemcees,following-up,andothertasks.Thefacilita-torsshouldleadthesmoothproceedingofanassess-mentworkshopandstimulateactiveandequalpartici-pationofworkshopparticipants.
It is important tohaveanote-takeramong the facili-tators, who understands local languages to be usedduringtheworkshopanddiscussion.Thenotestakenby this person will be of vital importance during thefollow-upstage.
Ideally, facilitators have a working relationship withcommunitiesinthearea.Iflocalcommunitymembersare actively engaged in SEPLS management, theythemselves can become facilitators. In such cases,theymayrequiresometraininginhowtofacilitate.
Local NGOs and project coordinators who havedeveloped a strong relationship with local communi-ties throughexistingprojectscanbegoodcandidatesto serve as facilitators. Alternatively, facilitators needto develop a relationship with the communities andlearn about the landscape or seascape through avail-able documents and discussion with key communitymembersbeforetheassessmentworkshop.Inthiscase,facilitatorsmayneedtospendsometimeinthecommu-nitiestolearnaboutthembeforehand.
The role of the facilitator during an assessment isvital for explaining the concepts of “socio-ecologicalproduction landscapes and seascapes (SEPLS)” and“resilience”tocommunitiesandworkshopparticipants.Facilitatorsshouldhaveagoodunderstandingoftheseconceptsandbeable to translate the indicators intothe local language if necessary, or reword them withvocabularyunderstoodatthelocallevel.
©C
OM
DE
KS
Nig
er/B
assi
rou
Dan
Mag
aria
38 | Toolkit for the Indicators of Resilience in Socio-ecological Production Landscapes and Seascapes (SEPLS) Chapter 3: Practical guidance for using the indicators | 39
Tips:• Prepareenoughcopiesofthetranslatedindicators
foreachoftheparticipantsandfacilitators.• Provide pens or pencils and scratch paper for all
participants.• Ensurethatthereisenoughposter-sizedpaperand
markers,colouredpensformapping,stickers,tape,scissorsand/orwhateverwillbeneededforpromi-nentlydisplayingscoringresults,mapping,etc.
• Preparesuitable refreshmentsandorganizemealsforparticipantsasappropriate.
• Considerhowparticipantsaregoing toget to theassessment,andwhethertransportationshouldbeprovided.
3.2 stage 2: The assessment workshop
Introduction
Anassessmentworkshopwillgenerallybeginwithanintroductorypresentationgivenbythefacilitators.Itisimportantduringtheintroductionthattimebeallowedto answer any questions participants may have.Explainingkeyconceptsandansweringallquestionscanbeexpectedtotakeafewhours.
Participatoryactivitiesmayalsobecarriedoutatthistime,toensurenotonlythatparticipantsfeelcomfort-able interacting with each other, but also that theyhave a common understanding of the landscape orseascapeanditsresources.Seebelowforsomeexam-plesofparticipatoryactivities.
Itisagoodideatocollectparticipantinformationsuchas name, age, gender and village name or organiza-tion,or,alternatively,circulateasheetforparticipantsto provide this information at the beginning of theworkshop.
Baseline assessment workshop, Ghana
Tips:Theintroductionisagoodopportunitytoexplain:
• The purpose of the assessment and the value ofpeople’sparticipation.Beawarethatinsomeplacesitcanbeverydifficultforcommunitiestoopenupandholddiscussionsfreely.
• Thebasicconceptsof“socio-ecologicalproductionlandscapes and seascapes (SEPLS)” and “resil-ience”. It is important that all participants under-standtheseconcepts.Theuseofsimple,easy-to-understand language is recommended as well asexamplestohelpparticipantsunderstand.Itmaybeusefultousepicturesorphotosofsocio-ecologicalproductionlandscapesorseascapes.
• Other concepts found in the indicators, such as“agriculturalbiodiversity”and“landuses”.Picturesanddiagramsmaybehelpful.
• Theflowof the resilienceassessmentand indica-torsaccordingtotheirspecificthemes.Theseare:Landscape/seascape diversity and ecosystemprotection;Biodiversity(includingagriculturalbiodi-versity); Knowledge and innovation; Governanceandsocialequity;andLivelihoodsandwell-being.
• The workshop schedule, including plans forfollow-up.
Theexactprocedurefortheintroductorysegmentwillvarydepending on time, resources, local context, purposeetc.,andmayincludesomeorallofthefollowing:
Self-introductionsIfparticipantsare frommultiplecommunitieswithinalandscapeorseascape,oriffacilitatorsorotherpartici-pants are from outside the target community, it maybehelpful to haveeachparticipant introducehimselforherselfandexplaintheirinterestintheassessmentworkshop.
Participatory mapping exerciseHavingparticipantsdrawamapoftheir landscapeorseascape including resources, land-uses, landmarksandothers–agriculturallands,watersources,huntingor fishing areas, buildings, etc. – is useful for identi-fying the landscape or seascape and its boundariesand ensuring a common understanding of the targetarea.ParticipatorySEPLSmappingisalsoeffectiveforengagingparticipantsindiscussion.
Discussion of biodiversityDiscuss and list examples of agricultural and aquatic biodiversity such as fruits, vegetables,medicinalplants,trees, livestock,pollinators,fishandcrustaceans,includingtheirlocalnames.Itmayalsobeappropriatetolistvariouskindsofwildlife.
Discuss and list landscape or seascape compo-nentsincludingfields,forestpatches,rivers,pastures,wetlands,watersources,coral reefsetc.Also list thelocalwordsforthesecomponents.
Discussion of resilienceMake a timeline with major events and changes inrelationtotheclimate,environmentandothers,suchasdroughts,floods,storms,earthquakesetc.,onalargesheetofpaper.
Explain resilience, for example, as “recovering afterstress” (seeChapter1:“Resilience inSEPLS–What isit?”),andthenletparticipantsexplainitintheirownwords.
Explain adaptation,forexample,andaskparticipantshowtheycopewithdroughts,floods,typhoons,earth-quakes,forestfire,pest,diseaseandotherdisasters.
Explanation of the indicatorsExplaintheconceptofindicatorsingeneral,aswellastheIndicatorsofResilienceinSEPLSspecifically,theirpurposeandhowusingthemisintendedtobenefitthecommunity.
©C
OM
DE
KS
Gha
na/G
eorg
eO
rtsi
n

40 | Toolkit for the Indicators of Resilience in Socio-ecological Production Landscapes and Seascapes (SEPLS) Chapter 3: Practical guidance for using the indicators | 41
indicators in action
PaRtIcIPatoRy MaPPIng ExERcISE
Aparticipatorymappingexercisecanprovideanopportunity for involvement of a greater numberof both men and women from the communityincludingthosetraditionallymarginalized,buildingtrust and strengthening relationships betweenfacilitatorsandcommunitymembers,andestab-lishinga structure inwhichdecision-makingandresponsibilities are shared. The mapping activityinitiates a community involvement forum whichcontinuestobedevelopedthroughregularvillagemeetings. Finally, the maps created serve asreference material for future planning, providingimportantinsightintothespecificsocio-ecologicalcharacteristicsofthearea.
Community members in Fiji engaged in participatory mapping
localcontext.Whenparticipantshavedifficultycompre-hendingaquestion,facilitatorscanassistparticipantsbyexplainingthescoresandtrends.
Individual ScoringThefacilitatorshouldasktheparticipantsthequestionfor each resilience indicator and explain with somelocal contexts and examples. Have each individualparticipantgivehisorherownscoreforeachindicator.
Participants score their landscape using indicators for resilience during a workshop, Bhutan
Group ScoringAfterindividualscoringhasbeencompleted,thegroupshould discuss, for each indicator question, whichscorerepresentstheoverallperceptionsof thewholegroup.Thismaybedonebyhavingindividualpartici-pantsdiscusstheirscoresandtrendsandthereasonsbehind them to arrive at a consensus opinion, oranothermethodsuchastakingasimplemathematicalaverage.Thisstepisimportant:
• Toprovideaspacefordiscussion.• To identify different views within and among
communitymembers.
ScoringTheprocessofhavingtheworkshopparticipantsscoretheir landscapeor seascapeaccording to the twentyindicatorsofresilienceisattheheartoftheassessmentworkshop. The twenty indicators are each accompa-niedbyquestionsforuseinscoring,aswellasnotes,examples and additional discussion questions whereappropriate.
Thephysicalmethodofcollectingscoresmaydependon the local context. When planning the workshop,facilitatorsshoulddecidewhethereachparticipantwillbe given a scorecard, write their scores on a chalk-board,placeanumberofsmallstones intoacup,orsomeothermethod.
Scores:Theindicatorsareintendedtobescoredonafive-pointscale.Ascoreof1meansthelandscapeorseascapeperformsverypoorlyinthatindicatorandascoreof5meansanextremelygoodperformance.(seepage18)
trends: A basic score for each indicator may beenoughinsomecases.Incaseswhereresourcesallow,itmaybedesirable tohaveparticipantsalsoprovidetheirperceptionsoftrends,notesonreasonsfortheirscores,andpotentialproblemsandsolutions.
Trendsaregenerallycapturedusingatimespan(5,10,30yearsetc.)determinedforeachindicator.Itisgener-ally sufficient to evaluate trends using a three-tieredscale (improving; no change; worsening), but a morecomplex five-tiered scale (rapidly improving; slowlyimproving;nochange;slowlyworsening;rapidlywors-ening)hasalsobeenused.
Itisimportanttoaskquestionsontheresilienceindica-torsinawaythatiseasytounderstandforallpartici-pants. It is recommended that facilitators prepare inadvancehowtoposeeachquestiontotheparticipantsusinglocalexamplesandinterpretingquestionsinthe
• To reachacommonunderstanding (ifpossible)ofthe landscape/seascape situation and any threatsandsolutions.
Toreachconsensus,theadditionalquestionsfoundinthefourthcolumnoftheindicatortable(Chapter2)canbeaskedduringthediscussion.
Tips:• Facilitatorsshouldworkatcreatingaparticipatory
and communicative atmosphere to keep partici-pantsinterestedandengagedintheprocess.
• Itisimportanttocapturehowthingshavechangedtemporally and what the drivers associated withthesechangesare.Thiswillhelpthecommunitiesdevelopstrategies to improve their resilienceasafollowupprocesstotheresilienceassessment.
• Materials such as cards, small stones, plastic orpapercapscanminimizethetimetakenforscoring.Providingacupand5smallstones foreach indi-vidual participant, facilitators can ask the partici-pants to put stones for each question in the cupwhileanote-takercapturesindividualscores.
It may be useful to prepare an indicator score sheetliketheoneonthenextpageonaposter-sizedsheetof paper and write each participant’s scores for thewholegrouptosee,inordertofacilitateaparticipatoryprocessinarrivingatgroupscores.
©B
iove
rsity
Inte
rnat
iona
l/Dun
jaM
ijato
vic
©C
OM
DE
KS
Bhu
tan/
Dor
jiS
inga
y

42 | Toolkit for the Indicators of Resilience in Socio-ecological Production Landscapes and Seascapes (SEPLS) Chapter 3: Practical guidance for using the indicators | 43
Indicator Question#
name name name name name group consensus
Score Trend Score Trend Score Trend Score Trend Score Trend Score Trend
1234567891011121314151617181920
Table 1. Score sheet for group scores andrecoverfromshocks.Basedontheseunderstand-ings, participants should further explore options forenhancing the resilience of the landscape/seascapeandidentifypossiblenextstepsforthegrouptotake.
Everyoneshouldbeencouragedtospeakfreelyinthediscussion,evenifthereisrepetition,andanote-takershouldrecordthecomments.
Tips:Groupdiscussionisagoodopportunityto:• Identify potential solutions to problems facing the
landscapeorseascape.• Askparticipantswhatstrikesthemmostaboutthe
findings.• Discusshowtoimprovetheresilienceoftheland-
scapeor seascapeand identifypotential commu-nity-basedactivitiestodoso.
Thefollowingaresomeexamplesofpossibleelementsforthediscussion.Facilitatorscanconsiderorganizinganothersessionafewdaysorweeksaftertheassess-ment workshop to further promote discussion andidentifynextsteps.
Discussion of scoring results Aftersummarizing theassessmentscores, facilitatorsmaydisplaydiagramsand the indicatorscoresheetsonawall,andstimulatediscussiononstrengthsandweaknesses in landscape or seascape resilience.Facilitatorsmaygoovereachresilienceindicatorques-tionagain,orcovereachsub-categoryof the indica-tors. Participants should share their thoughts on thescores,theirreasons,andpracticesusedtorespondtoshocksandchanges.
Discussing the results of the indicators scoring exercise in plenary, Khotont district, Mongolia
Tips:The following is one option to process the collectedscoringdata:• Calculateaveragescoresofeachsub-categoryof
theresilienceindicators.• Drawaradardiagramonabigsheetofpapertohelp
participantsvisualizetheresultsduringdiscussion.
Discussion on specific topicsFacilitators can stimulate discussion to identify keytopicsforthecommunity.
Keydiscussiontopicsmayinclude:• Keycommunityconcernsandthreatstolandscape
orseascaperesilience.• Needsforimprovementincurrentpractices.
Scoring data collected at a workshop in Kenya
discussion, summary and next steps
Discussionoftheresultsoftheindicatorscoringisasimportantasthescoringitself.Anactiveandproduc-tivediscussionoftheindicatorscoringcanhelppartici-pantsunderstandhowtoenhancetheresilienceofthelandscapeorseascapeandidentifypotentialcommu-nity-basedactivitiesthatcanimproveresiliencebasedonthesefindings.Theadditionalquestionsfoundintheindicator table (Chapter 2) can be also asked at thisstagetoguidethediscussion.
Facilitatorsshouldguidethediscussion inawaythatencourages participants to share ideas, views, prob-lems, threats, explanations and local solutions suchasknowledgeandpracticesusedtomitigate,manage
©B
iove
rsity
Inte
rnat
iona
l/Yas
ukiM
orim
oto
©B
iove
rsity
Inte
rnat
iona
l/Ron
nie
Vern
ooy
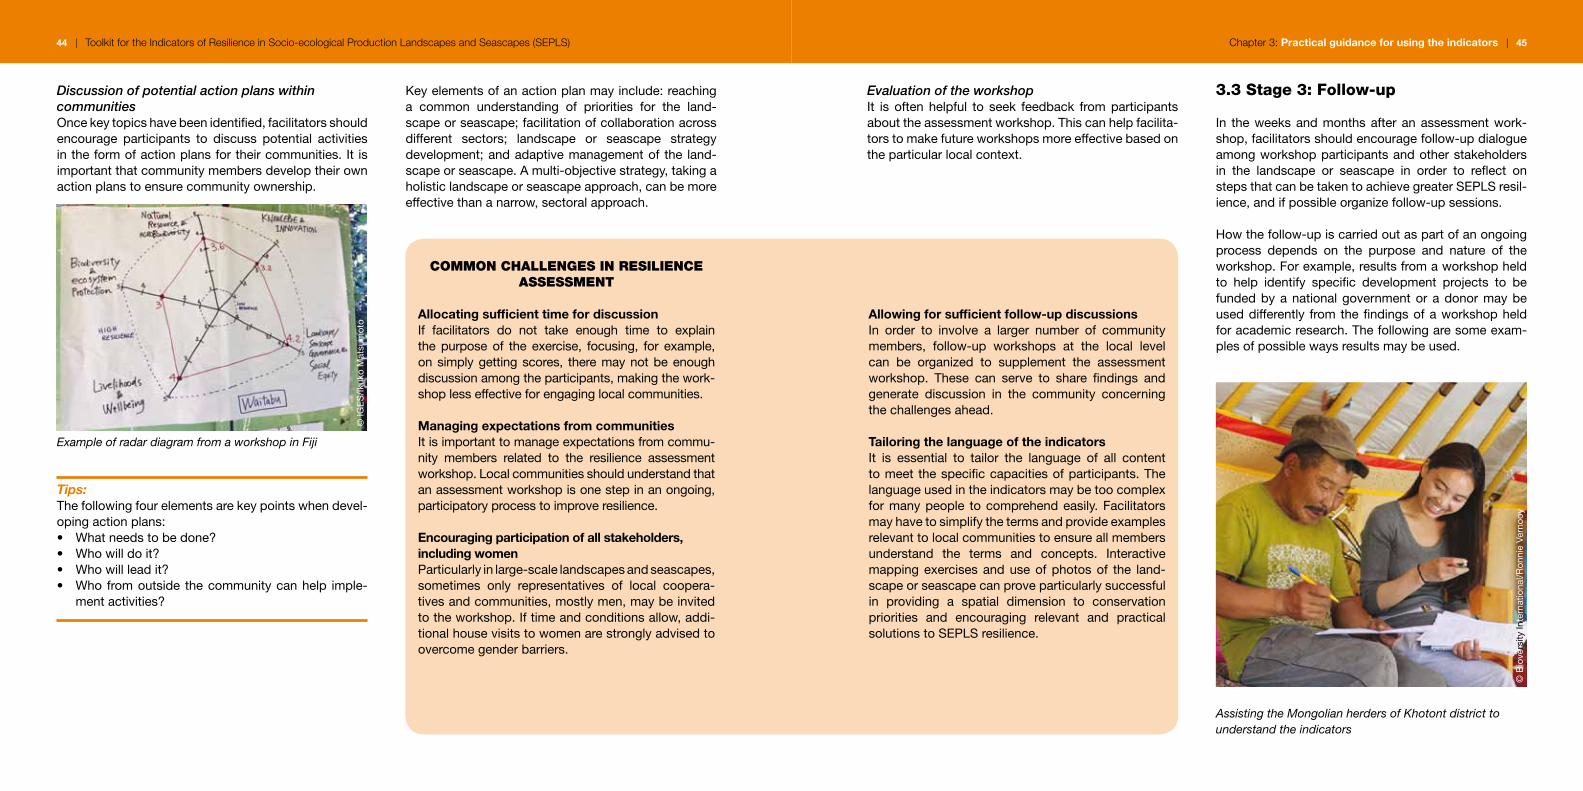
44 | Toolkit for the Indicators of Resilience in Socio-ecological Production Landscapes and Seascapes (SEPLS) Chapter 3: Practical guidance for using the indicators | 45
Discussion of potential action plans within communitiesOncekeytopicshavebeenidentified,facilitatorsshouldencourage participants to discuss potential activitiesintheformofactionplansfortheircommunities.It isimportantthatcommunitymembersdeveloptheirownactionplanstoensurecommunityownership.
Example of radar diagram from a workshop in Fiji
Tips:Thefollowingfourelementsarekeypointswhendevel-opingactionplans:• Whatneedstobedone?• Whowilldoit?• Whowillleadit?• Who fromoutside thecommunitycanhelp imple-
mentactivities?
coMMon chaLLEngES In RESILIEncE aSSESSMEnt
Allocating sufficient time for discussionIf facilitators do not take enough time to explainthe purpose of the exercise, focusing, for example,onsimplygettingscores, theremaynotbeenoughdiscussionamongtheparticipants,makingthework-shoplesseffectiveforengaginglocalcommunities.
Managing expectations from communitiesItisimportanttomanageexpectationsfromcommu-nity members related to the resilience assessmentworkshop.Localcommunitiesshouldunderstandthatanassessmentworkshopisonestepinanongoing,participatoryprocesstoimproveresilience.
Encouraging participation of all stakeholders, including womenParticularlyinlarge-scalelandscapesandseascapes,sometimes only representatives of local coopera-tivesandcommunities,mostlymen,maybeinvitedtotheworkshop.Iftimeandconditionsallow,addi-tionalhousevisitstowomenarestronglyadvisedtoovercomegenderbarriers.
Allowing for sufficient follow-up discussionsIn order to involve a larger number of communitymembers, follow-up workshops at the local levelcan be organized to supplement the assessmentworkshop. These can serve to share findings andgenerate discussion in the community concerningthechallengesahead.
Tailoring the language of the indicators It is essential to tailor the language of all contenttomeet thespecificcapacitiesofparticipants.Thelanguageusedintheindicatorsmaybetoocomplexformanypeople tocomprehendeasily.Facilitatorsmayhavetosimplifythetermsandprovideexamplesrelevanttolocalcommunitiestoensureallmembersunderstand the terms and concepts. Interactivemappingexercisesanduseofphotosof the land-scapeorseascapecanproveparticularlysuccessfulin providing a spatial dimension to conservationpriorities and encouraging relevant and practicalsolutionstoSEPLSresilience.
Keyelementsofanactionplanmayinclude:reachinga common understanding of priorities for the land-scapeorseascape;facilitationofcollaborationacrossdifferent sectors; landscape or seascape strategydevelopment;andadaptivemanagementof the land-scapeorseascape.Amulti-objectivestrategy,takingaholisticlandscapeorseascapeapproach,canbemoreeffectivethananarrow,sectoralapproach.
3.3 stage 3: follow-up
In theweeksandmonthsafteranassessmentwork-shop,facilitatorsshouldencouragefollow-updialogueamongworkshopparticipantsandotherstakeholdersin the landscape or seascape in order to reflect onstepsthatcanbetakentoachievegreaterSEPLSresil-ience,andifpossibleorganizefollow-upsessions.
Howthefollow-upiscarriedoutaspartofanongoingprocess depends on the purpose and nature of theworkshop.Forexample,resultsfromaworkshopheldto help identify specific development projects to befundedbyanationalgovernmentoradonormaybeuseddifferently fromthefindingsofaworkshopheldforacademicresearch.Thefollowingaresomeexam-plesofpossiblewaysresultsmaybeused.
Assisting the Mongolian herders of Khotont district to understand the indicators
Evaluation of the workshopIt is often helpful to seek feedback from participantsabouttheassessmentworkshop.Thiscanhelpfacilita-torstomakefutureworkshopsmoreeffectivebasedontheparticularlocalcontext.
©IG
ES
/Iku
koM
atsu
mot
o
©B
iove
rsity
Inte
rnat
iona
l/Ron
nie
Vern
ooy
46 | Toolkit for the Indicators of Resilience in Socio-ecological Production Landscapes and Seascapes (SEPLS) Chapter 3: Practical guidance for using the indicators | 47
QuantItatIvE, QuaLItatIvE and coMPaRatIvE anaLySIS to IdEntIfy
coMMunIty nEEdS
Various types of quantitative, qualitative andcomparative analysis can be applied to scoringresults,eachofwhichwillidentifydifferentissuesandneeds.Forexample,pastuseof the indica-torshasshownthatquantitativeanalysisofscorevalues was useful in identifying risk perceptionsshared among the communities in a landscapeorseascape (suchas lossof localcropvarietiesandpoorecosystemmanagement),whilequalita-tiveanalysisusingdiscussionhelpedtofocusontheperceived reasons for these (suchas lackofawareness and ineffective government actions).Comparative analysis between communitieswhere multiple assessments are carried out canprovide hints as to what kinds of interventionsmaybeeffectiveindifferentareas.SeeChapter4,Example4forexamplesofdataanalysis.
further analysis of assessment data and scoring
Scoringdatacollectedataworkshopcanbeusedforvarioustypesofqualitative,quantitativeandcompara-tiveanalysis.Furtheranalysiscanbeusefulforunder-standing trends, identifying more effective follow-upactivitiesandstrategies,andforscientificresearch.
Share the results of the assessment workshop with other stakeholders
Theworkshopresultscanbesharedwithotherstake-holders.Thefacilitatorcanpresentperceivedstrengthsandweaknesses in landscapeor seascape resilienceby displaying the diagrams and the indicator scoresheetsandsharingthediscussionresults.
develop concrete action plans within communities
Strategy or concrete action plans can be furtherconsolidated toplanand implementspecificprojectsoractivitiestoenhanceSEPLSresilience.
Itisalsogoodtoelucidateconcretestepsthatpartici-pantswill take in implementing theactionplans. It isimportanttorememberthatbothshort-termgoalsthatcanbeachievedwithcurrently-availableresourcesandlong-termgoalstodirectthecontinueddevelopmentoftheSEPLSshouldbeconsidered.
indicators in action foLLoW-uP
Inthenorth-westernpartofMakawanpurdistrictinNepal,theresultsofaresilienceassessmentwereeffectivelyusedtodevelopalandscapestrategyforthearea.Theindicatorscoringshowedarelativelypoorperceptionintheareaofecosystemprotec-tion,sothefollowingwereidentifiedasimportantstrategicissuesindevelopinggoalsandobjectives:
• Increasingconnectivity• Addressingmarginalityandinequality• Diversificationoflanduses• Respectingusefultraditionalknowledge
andcomplementingitwithnewinnovations• Synergybuilding• GenderandsocialInclusion• Marketlinkage
Importantly, the assessment also showed whichearlier interventionshadbeenbeneficial in areassuch as agricultural biodiversity, which helpedguidetheabovepriorities.
Repeated resilience assessment for adaptive management
For adaptive landscape/seascape management, theindicatorsmaynotbeonlyusedasaone-timeexer-cise,butinsteadutilizedthroughoutprojects’lifetimes.Landscape or seascape strategies can be adjusteddependingonperiodic resilienceassessmentsoveranumber of years. This requires allowing appropriatetime fordiscussionand interpretingchanges that thedata reveal and adapting strategies accordingly. It isgoodtopayattentiontoanyseasonaldifferencesthatmightaffectresponses,andtrytoperformthescoringexerciseatthesametimeeachyearifappropriate.
Possible post-assessment follow-up activities
For local communities and NGOs:Propagatingacommonunderstandingofpriorityissuesforthelandscapeorseascape:• Hold discussions on the status of the landscape
orseascapeasperceivedby localstakeholders inordertoreachaclearunderstandingasabasisforprioritiesincollaborativeactions.
• Facilitate communication on goals and expectedoutcomesatthelandscape/seascapelevel.
• Identify priority issues to be addressed bycommunities.
• Identify key threats and intervention strategies tostrengthen community resilience including liveli-hoodimprovement.
Facilitationofcollaborationacrossdifferentsectors:• Identify possible allies for resilience strengthening
activitiesinthelandscapeorseascape.• Strengthen partnership among various actors and
ensuresustainabilityandresilienceofthelandscapeorseascape.
Landscape/seascapestrategydevelopment:• Develop landscape/seascape resilience-strength-
eningstrategiesandactionplans.• Enhance community participation in the decision-
making process on landscape/seascape manage-ment at local and national levels, and promotecommunicationwithpolicy-makers.
• Presentoutcomesoftheworkshoptokeynationalstakeholders, and enhance communication withpolicy-makersinordertofacilitatetheincorporationof local landscape and seascape strategies intoNational Biodiversity Strategies and Action Plansandotherdevelopmentplans.
Adaptivemanagementofthelandscapeorseascape:• Use assessment results as a baseline for further
monitoringchangesinthelandscapeorseascape.• Conduct resilience assessments periodically to
enableadaptivemanagementof the landscapeorseascape.
For policymakers:• Utilize the resilience assessment as a decision
making tool to identify intervention priorities anddevelopstrategiesatthelocalandnationallevel.
• Promote participatory landscape/seascapemanagementamongdifferentstakeholders.
• Identify an integrated approach in the variousprojectplanningandprojectimplementationstagesinlandscapes/seascapes.
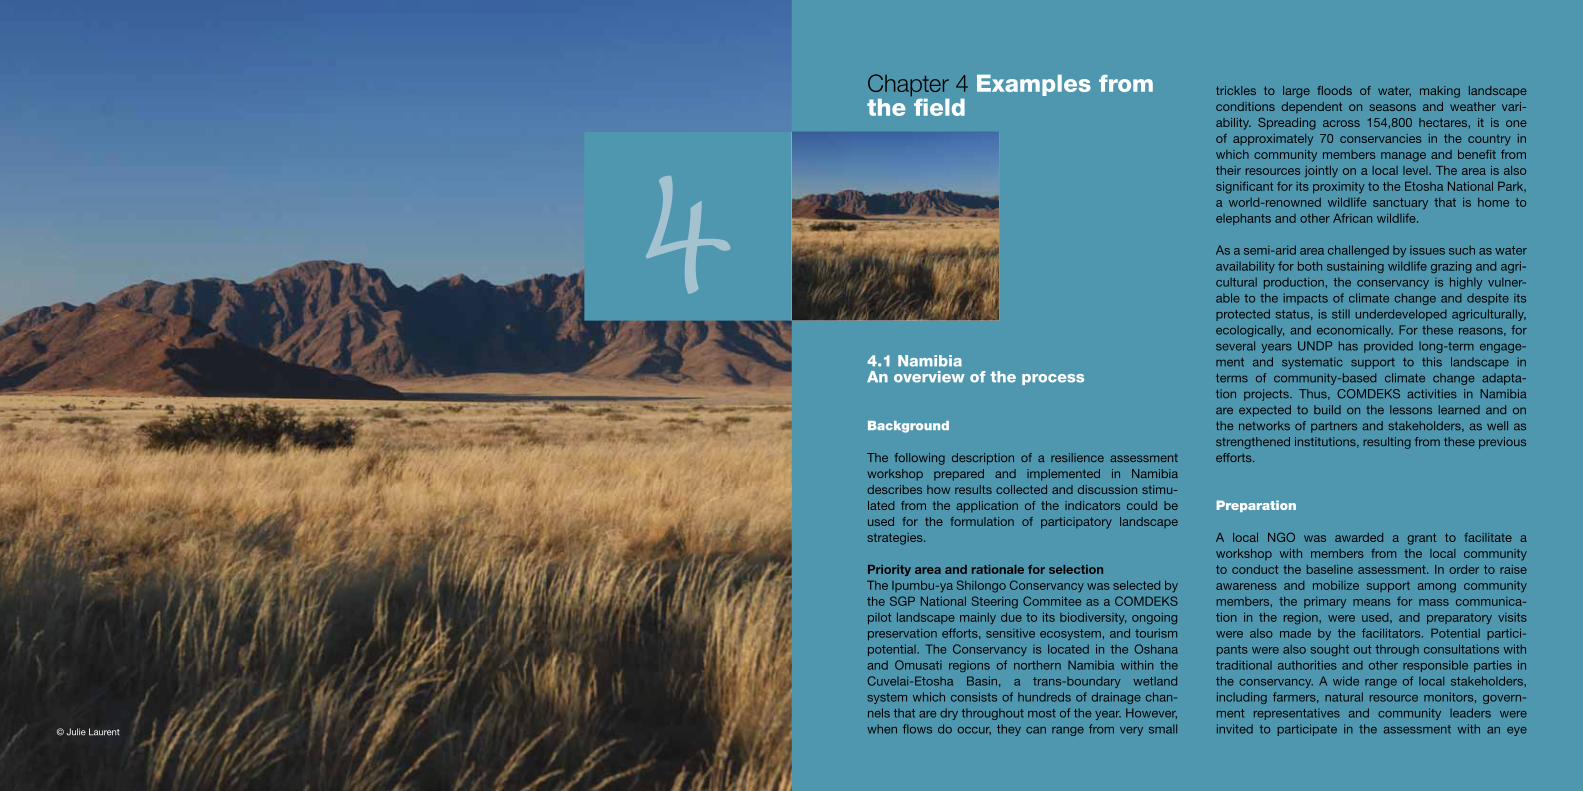
48 | Toolkit for the Indicators of Resilience in Socio-ecological Production Landscapes and Seascapes (SEPLS) Chapter 4: Examples from the field | 49
4Chapter 4 examples from the field
4.1 namibia an overview of the process
Background
The following description of a resilience assessmentworkshop prepared and implemented in Namibiadescribeshowresultscollectedanddiscussionstimu-lated from the application of the indicators could beused for the formulation of participatory landscapestrategies.
Priority area and rationale for selectionTheIpumbu-yaShilongoConservancywasselectedbytheSGPNationalSteeringCommiteeasaCOMDEKSpilotlandscapemainlyduetoitsbiodiversity,ongoingpreservationefforts,sensitiveecosystem,andtourismpotential. The Conservancy is located in the Oshanaand Omusati regions of northern Namibia within theCuvelai-Etosha Basin, a trans-boundary wetlandsystemwhichconsistsofhundredsofdrainagechan-nelsthataredrythroughoutmostoftheyear. However,whenflowsdooccur, theycanrangefromverysmall
trickles to large floods of water, making landscapeconditions dependent on seasons and weather vari-ability. Spreading across 154,800 hectares, it is oneof approximately 70 conservancies in the country inwhichcommunitymembersmanageandbenefitfromtheirresourcesjointlyonalocallevel.TheareaisalsosignificantforitsproximitytotheEtoshaNationalPark,a world-renowned wildlife sanctuary that is home toelephantsandotherAfricanwildlife.
Asasemi-aridareachallengedbyissuessuchaswateravailabilityforbothsustainingwildlifegrazingandagri-cultural production, the conservancy is highly vulner-abletotheimpactsofclimatechangeanddespiteitsprotectedstatus,isstillunderdevelopedagriculturally,ecologically,andeconomically.Forthesereasons,forseveral yearsUNDPhasprovided long-termengage-ment and systematic support to this landscape interms of community-based climate change adapta-tion projects. Thus, COMDEKS activities in Namibiaareexpected tobuildon the lessons learnedandonthenetworksofpartnersandstakeholders,aswellasstrengthenedinstitutions,resultingfromthesepreviousefforts.
Preparation
A local NGO was awarded a grant to facilitate aworkshop with members from the local communitytoconductthebaselineassessment.Inordertoraiseawareness and mobilize support among communitymembers, the primary means for mass communica-tion in the region, were used, and preparatory visitswere also made by the facilitators. Potential partici-pantswerealsosoughtoutthroughconsultationswithtraditionalauthoritiesandother responsibleparties intheconservancy.Awide rangeof local stakeholders,including farmers,natural resourcemonitors,govern-ment representatives and community leaders wereinvited to participate in the assessment with an eye©JulieLaurent
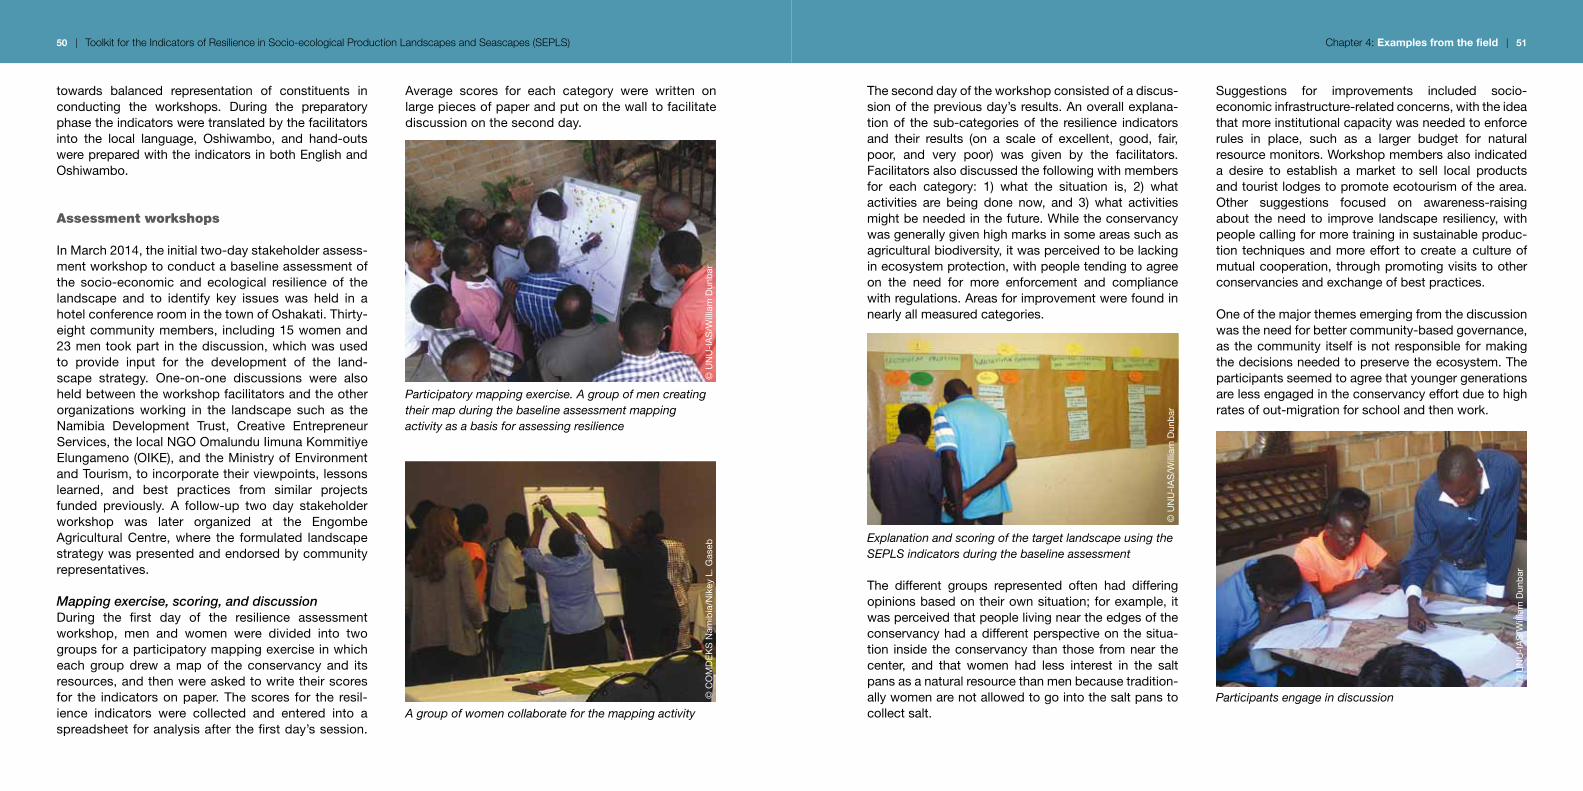
50 | Toolkit for the Indicators of Resilience in Socio-ecological Production Landscapes and Seascapes (SEPLS) Chapter 4: Examples from the field | 51
Average scores for each category were written onlargepiecesofpaperandputonthewalltofacilitatediscussiononthesecondday.
Participatory mapping exercise. A group of men creating their map during the baseline assessment mapping activity as a basis for assessing resilience
A group of women collaborate for the mapping activity
towards balanced representation of constituents inconducting the workshops. During the preparatoryphasetheindicatorsweretranslatedbythefacilitatorsinto the local language, Oshiwambo, and hand-outswerepreparedwiththeindicatorsinbothEnglishandOshiwambo.
assessment workshops
InMarch2014,theinitialtwo-daystakeholderassess-mentworkshoptoconductabaselineassessmentofthe socio-economic and ecological resilience of thelandscape and to identify key issues was held in ahotelconferenceroominthetownofOshakati.Thirty-eightcommunitymembers, including15womenand23mentookpart inthediscussion,whichwasusedto provide input for the development of the land-scape strategy. One-on-one discussions were alsoheldbetweentheworkshopfacilitatorsandtheotherorganizations working in the landscape such as theNamibia Development Trust, Creative EntrepreneurServices,thelocalNGOOmalunduIimunaKommitiyeElungameno(OIKE), andtheMinistryofEnvironmentandTourism,toincorporatetheirviewpoints,lessonslearned, and best practices from similar projectsfunded previously. A follow-up two day stakeholderworkshop was later organized at the EngombeAgriculturalCentre,where the formulated landscapestrategywaspresentedandendorsedbycommunityrepresentatives.
Mapping exercise, scoring, and discussionDuring the first day of the resilience assessmentworkshop, men and women were divided into twogroupsforaparticipatorymappingexerciseinwhicheach group drew a map of the conservancy and itsresources,andthenwereaskedtowritetheirscoresfor the indicatorsonpaper.Thescores for the resil-ience indicators were collected and entered into aspreadsheetforanalysisafterthefirstday’ssession.
Theseconddayoftheworkshopconsistedofadiscus-sionofthepreviousday’sresults.Anoverallexplana-tionof thesub-categoriesof the resilience indicatorsand their results (on a scale of excellent, good, fair,poor, and very poor) was given by the facilitators.Facilitatorsalsodiscussedthefollowingwithmembersfor each category: 1) what the situation is, 2) whatactivities are being done now, and 3) what activitiesmightbeneededinthefuture.Whiletheconservancywasgenerallygivenhighmarksinsomeareassuchasagriculturalbiodiversity,itwasperceivedtobelackinginecosystemprotection,withpeopletendingtoagreeon the need for more enforcement and compliancewithregulations.Areasforimprovementwerefoundinnearlyallmeasuredcategories.
Explanation and scoring of the target landscape using the SEPLS indicators during the baseline assessment
The different groups represented often had differingopinionsbasedontheirownsituation;forexample, itwasperceivedthatpeoplelivingneartheedgesoftheconservancyhadadifferentperspectiveonthesitua-tion inside theconservancy than those fromnear thecenter, and that women had less interest in the saltpansasanaturalresourcethanmenbecausetradition-allywomenarenotallowedtogointothesaltpanstocollectsalt.
Suggestions for improvements included socio-economicinfrastructure-relatedconcerns,withtheideathatmoreinstitutionalcapacitywasneededtoenforcerules in place, such as a larger budget for naturalresourcemonitors.Workshopmembersalsoindicateda desire to establish a market to sell local productsandtouristlodgestopromoteecotourismofthearea.Other suggestions focused on awareness-raisingabout theneed to improve landscape resiliency,withpeoplecallingformoretraininginsustainableproduc-tiontechniquesandmoreeffort tocreateacultureofmutualcooperation,throughpromotingvisitstootherconservanciesandexchangeofbestpractices.
Oneofthemajorthemesemergingfromthediscussionwastheneedforbettercommunity-basedgovernance,as thecommunity itself isnot responsible formakingthedecisionsneededtopreservetheecosystem.Theparticipantsseemedtoagreethatyoungergenerationsarelessengagedintheconservancyeffortduetohighratesofout-migrationforschoolandthenwork.
Participants engage in discussion
©U
NU
-IA
S/W
illia
mD
unb
ar©
CO
MD
EK
SN
amib
ia/N
ikey
L.G
aseb
©U
NU
-IA
S/W
illia
mD
unb
ar
©U
NU
-IA
S/W
illia
mD
unb
ar
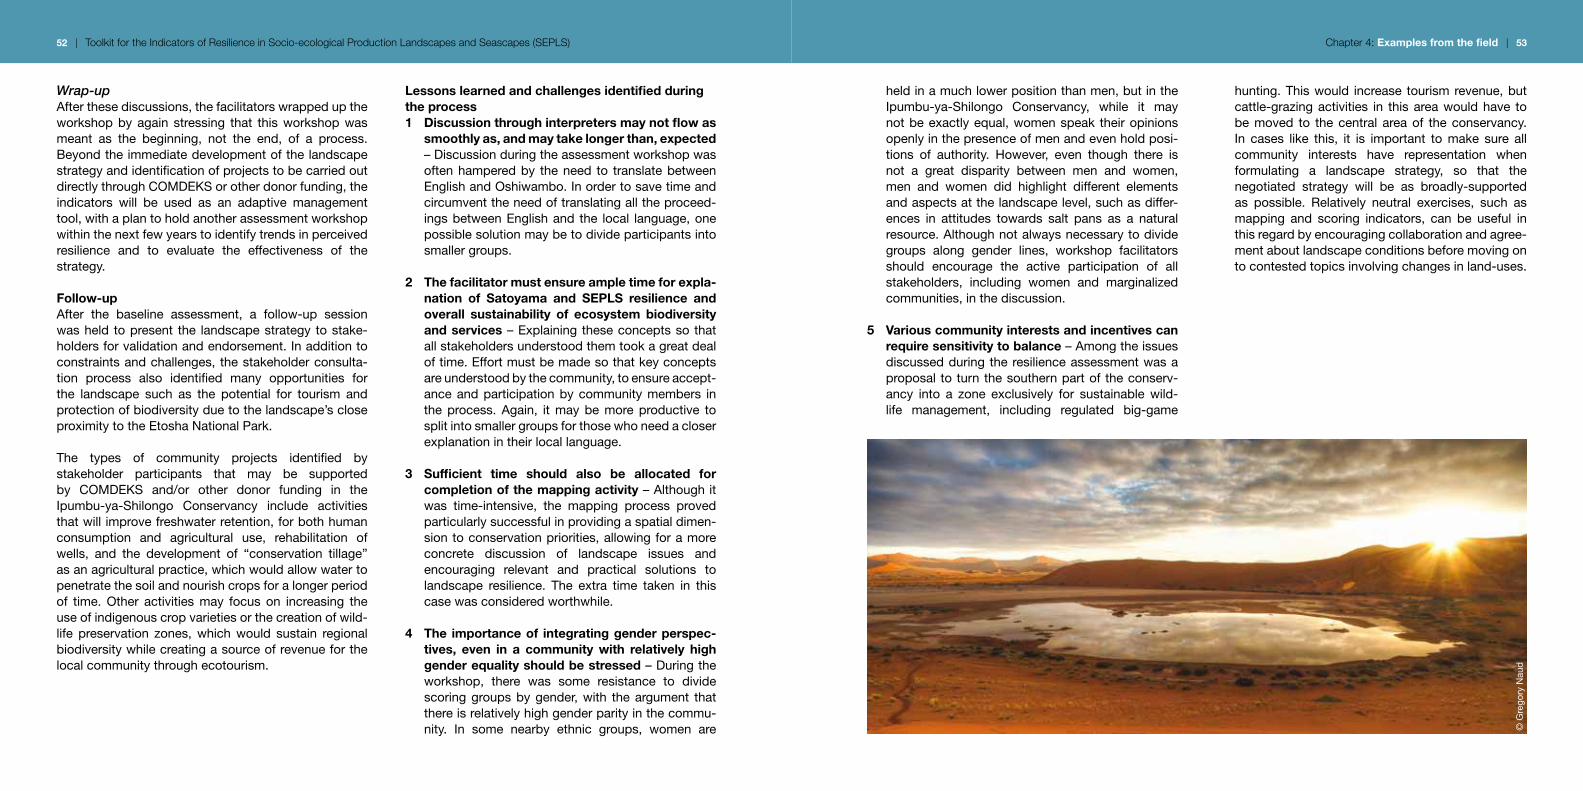
52 | Toolkit for the Indicators of Resilience in Socio-ecological Production Landscapes and Seascapes (SEPLS) Chapter 4: Examples from the field | 53
Wrap-upAfterthesediscussions,thefacilitatorswrappeduptheworkshopbyagain stressing that thisworkshopwasmeant as the beginning, not the end, of a process.BeyondtheimmediatedevelopmentofthelandscapestrategyandidentificationofprojectstobecarriedoutdirectlythroughCOMDEKSorotherdonorfunding,theindicators will be used as an adaptive managementtool,withaplantoholdanotherassessmentworkshopwithinthenextfewyearstoidentifytrendsinperceivedresilience and to evaluate the effectiveness of thestrategy.
Follow-upAfter the baseline assessment, a follow-up sessionwasheld topresent the landscapestrategy tostake-holdersforvalidationandendorsement.Inadditiontoconstraintsandchallenges,thestakeholderconsulta-tion process also identified many opportunities forthe landscape such as the potential for tourism andprotectionofbiodiversityduetothelandscape’scloseproximitytotheEtoshaNationalPark.
The types of community projects identified bystakeholder participants that may be supportedby COMDEKS and/or other donor funding in theIpumbu-ya-Shilongo Conservancy include activitiesthatwillimprovefreshwaterretention,forbothhumanconsumption and agricultural use, rehabilitation ofwells, and the development of “conservation tillage”asanagriculturalpractice,whichwouldallowwatertopenetratethesoilandnourishcropsforalongerperiodof time. Other activities may focus on increasing theuseofindigenouscropvarietiesorthecreationofwild-life preservation zones, which would sustain regionalbiodiversitywhilecreatingasourceofrevenueforthelocalcommunitythroughecotourism.
hunting.Thiswould increase tourismrevenue,butcattle-grazingactivities in thisareawouldhave tobemoved to thecentral areaof theconservancy.In cases like this, it is important to make sure allcommunity interests have representation whenformulating a landscape strategy, so that thenegotiated strategy will be as broadly-supportedas possible. Relatively neutral exercises, such asmapping and scoring indicators, can be useful inthisregardbyencouragingcollaborationandagree-mentaboutlandscapeconditionsbeforemovingontocontestedtopicsinvolvingchangesinland-uses.
Lessons learned and challenges identified during the process1 Discussion through interpreters may not flow as
smoothly as, and may take longer than, expected–Discussionduringtheassessmentworkshopwasoftenhamperedby theneed to translatebetweenEnglishandOshiwambo.Inordertosavetimeandcircumventtheneedoftranslatingalltheproceed-ingsbetweenEnglishand the local language,onepossiblesolutionmaybetodivideparticipantsintosmallergroups.
2 The facilitator must ensure ample time for expla-nation of Satoyama and SEPLS resilience and overall sustainability of ecosystem biodiversity and services–Explainingtheseconceptssothatallstakeholdersunderstoodthemtookagreatdealoftime.Effortmustbemadesothatkeyconceptsareunderstoodbythecommunity,toensureaccept-anceandparticipationbycommunitymembers inthe process. Again, it may be more productive tosplitintosmallergroupsforthosewhoneedacloserexplanationintheirlocallanguage.
3 Sufficient time should also be allocated for completion of the mapping activity –Althoughitwas time-intensive, the mapping process provedparticularlysuccessfulinprovidingaspatialdimen-siontoconservationpriorities,allowingforamoreconcrete discussion of landscape issues andencouraging relevant and practical solutions tolandscape resilience. The extra time taken in thiscasewasconsideredworthwhile.
4 The importance of integrating gender perspec-tives, even in a community with relatively high gender equality should be stressed –Duringtheworkshop, there was some resistance to dividescoringgroupsbygender,with theargument thatthereisrelativelyhighgenderparityinthecommu-nity. In some nearby ethnic groups, women are ©
Gre
gory
Nau
d
heldinamuchlowerpositionthanmen,butintheIpumbu-ya-Shilongo Conservancy, while it maynotbeexactlyequal,womenspeaktheiropinionsopenlyinthepresenceofmenandevenholdposi-tions of authority. However, even though there isnot a great disparity between men and women,men and women did highlight different elementsandaspectsatthelandscapelevel,suchasdiffer-ences in attitudes towards salt pans as a naturalresource.Althoughnotalwaysnecessarytodividegroups along gender lines, workshop facilitatorsshould encourage the active participation of allstakeholders, including women and marginalizedcommunities,inthediscussion.
5 Various community interests and incentives can require sensitivity to balance – Amongtheissuesdiscussedduringtheresilienceassessmentwasaproposaltoturnthesouthernpartoftheconserv-ancy into a zone exclusively for sustainable wild-life management, including regulated big-game

54 | Toolkit for the Indicators of Resilience in Socio-ecological Production Landscapes and Seascapes (SEPLS) Chapter 4: Examples from the field | 55
4.2 fiji Identification of concrete community actions
LocalcommunitymembersonTaveuniIsland,Fiji,wereabletoidentifypossibleactionstostrengthentheresil-ienceoftheircommunities’landscapesandseascapesthrough assessment workshops held by BioversityInternational(see“IndicatorsinAction:Sampleassess-ment workshop timetable” on page 37 for the work-shops’design).TwoassessmentworkshopswereheldinthevillagesofLavenaandKorovou,withparticipantsfromfourvillagesintheBoumaNationalHeritageParkon Taveuni Island: Korovou, Lanvena, Vidawa andWaitabu. The Bouma National Heritage Park coversabout 15,000 hectares of rainforest including strictconservation areas known as the Nature Reserve(communities cannot take anything from this area),andtheForestReserve(communitiescantakenaturalresourcesfromthisareaonlyfortheirsubsistence).Allfourvillagesarelocatedalongthecoast,andmostofthevillagersareinvolvedinbothagricultureandfishing.Thus, villagers’ awareness of connectivity between
Map of the Bouma National Heritage Park in Taveuni Island
Table 2. Group scoring from Waitabu village, Taveuni Island, Fiji
Questions for scoring common understanding of the group group Score/trend
Landscape/seascape biodiversity and ecosystem protection 3
1 Landscape/seascape diversity
Isthelandscape/seascapecomposedofdiversenaturalecosystems(terrestrialandaquatic)andlanduses?
TheestablishmentofaMarineProtectedAreacoveringpartofthevillagefishinggroundshasproducedsubstantialbenefitstothecommunity.
4á
2 Ecosystem protection
Arethereareasinthelandscapeorseascapewhereecosystemsareprotectedunderformalorinformalformsofprotection?
SeascapeprotectionisdonethroughtheMarineProtectedArea,butnoneofthelandscapeisprotectedbesidestheNatureReserve,whereaccesstonaturalforestisrestrictedinthenorthernpartofthevillage.
2á
3 Ecological interactions between different components of the landscape/seascape
Areecologicalinteractionsbetweendifferentcomponentsofthelandscapeorseascapeconsideredwhilemanagingnaturalresources?
Theimportanceofconnectivityisunderstood,butvillagersarestillpoachingandusingherbicidesandpesticidesinagriculture.
3á
4 Recovery and regeneration of the landscape/seascape
Doesthelandscapeorseascapehavetheabilitytorecoverandregenerateafterextremeenvironmentalshocks?
Afterahurricane,landscapes/seascapeswillrecover.However,itwilltakesometime.Forexample,recoveryofcoconuttrees,taroandcoralreeftake3,2and2yearsrespectively.
3á
Biodiversity (including agricultural biodiversity) 3.6
5 diversity of local food system
Doesthecommunityconsumeadiversityoflocally-producedfood?
Thereisahighdiversityoflocalfoods.However,villagers’dietsandpreferenceshavebeenchangingandvillagershavestartedbuyingfoodinstores,suchascannedfish,flour,noodlesetc.
5â
6 Maintenance and use of local crop varieties and animal breeds
Aredifferentlocalcrops,varietiesandanimalbreedsconservedandusedinthecommunity?
Localvarietiesstillexist,buttheseareslowlybeingreplacedbycommercialones(e.g.taro),andvillagersarenotinterestedinmaintaininglocalvarieties.
3à
7 Sustainable management of common resources
Arecommonresourcesmanagedsustainably? Fishingpracticesareimproving,butarestillnotsustainable.
3á
korovou village
Lanvena village
vidawa village
Waitabu village
differentcomponentsof the landscapeandseascapeis relatively high. The four villages have been alsoinvolved incommunity-basedecotourismsince1990,with funding assistance from the New Zealand AidProgramme.Thus,thecommunitieshavebeenactivelyinvolved innatural resourcemanagement,particularlyrelatedtoecotourism.
Throughdiscussionsofthegroupscoresforeachindi-cator,thevillagerswereabletosharetheirperceptionsofthestatusoftheir landscapesandseascapes,andtoreachcommonunderstandingamongelders,youth,menandwomen.Afterfinishingthegroupscoring,theydiscussedwaystostrengthenlandscapeandseascaperesiliencebasedonthisunderstanding,whichallowedthemtocomeupwithconcreteideasforactionsthatcouldbeimplementedatthevillagelevel.
Forexample,participantsfromWaitabuvillagereachedagreement on the following group scores for eachindicator.1
1 TheresilienceIndicatorsusedintheFijiworkshopwereapreviousversionslightlydifferentfromthesetofindicatorsfoundinthistoolkit.

56 | Toolkit for the Indicators of Resilience in Socio-ecological Production Landscapes and Seascapes (SEPLS) Chapter 4: Examples from the field | 57
Questions for scoring common understanding of the group group Score/trend
knowledge and innovation 3.2
8 Innovation in agriculture and conservation practices
Doesthecommunitydevelop,improveandadoptnewagricultural,fisheries,forestryandconservationpracticesand/orrevitalizetraditionalonestoadapttochangingconditions,includingclimatechange?
Agroforestrypractices,suchasavoidingclear-cutting,helpresilienceinthefaceofhurricanes.However,thesepracticesarenotenough.
3á
9 traditions and knowledge related to biodiversity
Arelocalknowledgeandculturaltraditionsrelatedtobiodiversitytransmittedfromeldersandparentstoyoungpeopleinthecommunity?
Someknowledgeispasseddownthroughcollectiveworkonfarms.Kavasessions(drinkingkava)amongvillagersareoccasionstoshareknowledge.
3á
10 documentation, access and exchange of agricultural biodiversity
Isagriculturalbiodiversityandassociatedknowledgedocumented,accessedandexchanged?
Agriculturalbiodiversityandknowledgeisaccessedandexchangedamongvillagers,butnodocumentationexists.Documentationisnotpartoftheculture.Documentationintheareahasbeendonebythegovernment,butvillagersdon’talwayshaveaccesstodocuments.
3á
11 Women’s knowledge
Arewomen’sknowledge,experiencesandskillsrecognizedandrespectedathousehold,communityandlandscape/seascapelevel?
Womengaveascoreof4,whilemengaveascoreof5.Understandingbetweenmenandwomenwasdifferent.
4á
governance and social equity 4.2
12 Right in relation to land/water and other natural resource management
Doesthecommunityhavecustomaryand/orformallyrecognizedrightsoverland(seasonal)pastures,waterandnaturalresources?
Villagersfeelthattheyhaveacertainfreedomoverlandandwaterresources,althoughthesysteminplacelimitstheallocationoffarmlandforeachfamily.Thefishinggroundiscommonpropertysharedbytwoothercommunities.
5á
13 community-based governance
Aregovernancemechanismsbylocalcommunitiesandinstitutionseffectiveforsustainablenaturalresourcesandbiodiversitymanagement?
Thereisacommitteethatlooksafternaturalresources.Thecommitteeissupportedbythenationalgovernmentandfisheriesdepartment,whicharepromotingsustainabledevelopment.
4á
Questions for scoring common understanding of the group group Score/trend
14 Social capital in the form of cooperation across the landscape/seascape
Isthereconnection,cooperationandcoordinationwithinandbetweencommunitiesforthemanagementofnaturalresources?
Cohesionwithinthecommunityisgood,butnotbetweencommunities.
4á
15 gender equity
Dowomenhavethesameopportunitiesasmenindecisionmaking,accesstoresources,education,informationandinnovation?
Inequalitiesareonlyseenindecision-makingprocessesinclanmeetings.Women’spositionindecision-makingisweak.
4á
16 Social equity
Isaccesstoresourcesandotheropportunitiesfairandequitableforallcommunitymembers?
Eachclanhasanequalshareofresources.However,amongthethreeclansinthevillage,somehavesmallerpopulationsthanothersandsohavemoreresourcesperperson.
4á
Livelihoods and well-being 4
17 Socio-economic infrastructure
Isthesocio-economicinfrastructureadequatefortheneedsofthecommunity?
Roadsinthevillageareinpoorcondition,whichisoneoftheprioritiesforimprovement.
4á
18 health of people and environmental conditions
Whatisthegeneralhealthsituationoflocalpeopletakingintoconsiderationtheprevailingenvironmentalconditions?
Thevillageiskeptcleanandtidy.Wasteisseparated,andplasticisburned.EveryMonday,thosethataresickaretakentothenurse.Biofiltershavebeeninstalledintwocommunitywatertanksfordrinkingwater.Flushtoiletsareineveryhousehold.
5á
19 Income diversity
Arehouseholdsinthecommunityinvolvedinavarietyofsustainable,income-generatingactivities?
Relianceonagriculture(taroandcassava)istoohigh(60-70%).TourismintheMarineParkandhandicraft(mats,fans,virgincoconutoil)arepotentialothersourcesofincome.
3á
20 opportunities for biodiversity-based livelihoods
Doesthecommunitydevelopinnovativeuseoflocalbiodiversityforitslivelihoods?
TheMarineParkisanattemptnotonlytoimprovetheconservationstatusofthecoralreefandbenefitfromspillovereffectsonsurroundingareas,butalsoasamaintouristattraction.
4á

58 | Toolkit for the Indicators of Resilience in Socio-ecological Production Landscapes and Seascapes (SEPLS) Chapter 4: Examples from the field | 59
Afterreviewingthiscommonunderstandingofthestatusofthelandscape/seascape,thegroupselectedprioritydiscussion topics to identify possible actions for thevillage.Thefourdiscussiontopicswereasfollows:1 Reductionofchemicaluseinagriculturalactivities2 Reforestation in areas with heavy clearing for
agroforestry
topic What needs to be done? Who will do it? Who will lead it? External support
1 • Revivetraditionalcollectivework(balebale)inthevillagetoreduceuseofchemicals
villagemen villageheadman,villagechief
TeteTaveuni(localNGOpromotinguseoforganicfertilizers),MinistryofAgriculture(nationalgov’t)
2 • Organizevillagemeetingswherethevillagechiefandelderscantellthecommunityabouttheimportanceofreforestation
villagechief plantationcommitteeofeachvillage
ForestryDepartment(nationalgov’t),becauseithasnativeseeds
3 • Discussrevivaloftraditionalknowledgeincludingfarmingpracticesduringcollectivework
• Moredialoguebetweeneldersandyouthtoshareknowledgewithyoungvillagers,forexampleduringthecollectivework
• Documentationoftraditionalknowledge
• Traditionalfarmingpracticesinclude:
– Farmingdiversity:plantingnotonlytaroandcava,butalsootherproducts
– Plantingtaroevery4months:tarotakes8monthstoharvest.Thus,4monthsafterplanting,villagersplantagainsothattheycanharvesttaroevery4months
– Practiceagroforestrytoprotectmarineresources
youthgroups,elders
villageheadman,villagechief
MinistryofAgriculture(nationalgov’t),MinistryofiTaukei(“indigenous”)Affairs(nationalgov’t)
4 Planttarointheoff-season,sincevillagerscangrowtaroatanytimeonTaveuniIsland,sothatvillagerscansellitintheoff-season(AprilandMay)inamarketwheretarocanbesoldatahigherprice
Findgoodmarketsforlocalhandicrafts(sewing,tapacloth,matsandothers),forexampleinavisitorcentreinthevillageorresorthotelsontheisland
PlantmorePandanustoproducemoremats
villagers,women villageheadman,villagechief
3 Revitalization of traditional knowledge includingfarmingpractices
4 Promotionofmoreincome-generatingactivities
Thevillagersdiscussedeachtopicandcameupwiththefollowingideasforconcreteactionsinthevillage.
4.3 Turkey Development of a landscape/seascape strategy
Background
ThefollowingcasestudyfromCOMDEKSactivitiesinTurkeyhighlightshow the indicatorscanbeused forempoweringlocalcommunitiesinthemanagementoftheir landscapesthroughtheformulationofparticipa-tory landscapeandseascapestrategies.ThroughtheCOMDEKSprogramme,UNDPisencouragingahighlyparticipatory and inclusive approach to formulationof landscapeandseascapestrategies,builtaroundacommunity-drivenvisionforrestoringandmaintainingSEPLSresilience.
After the identification of the target landscape forCOMDEKSactivitiesinTurkey-selectionmadeonthebasisofseveralcriteria, themost importantofwhichwasthedemonstratedinterestandengagementofthecommunitiesthemselves-aresilienceassessmentwasheld in the Datça-Bozburun Peninsula in the Muğlaprovince of Southwest Turkey to assess the currentsituationinthetargetSEPLSandtobetterunderstandlocalcommunities’perceptions.Thisbaselineassess-ment led to the preparation of a COMDEKS CountryProgramme Landscape Strategy, a comprehensivedocument which outlines the landscape profile,expectedgoalsandoutcomes,andkeymeasuresandstrategiesforcommunity-basedactions.
TheDatça-BozburunPeninsulaisrecognizedasaKeyBiodiversity Area (KBA)1 as it represents one of themostpristinelowlandforestandcoastallandscapesinthe Mediterranean. The targeted area spans 247,700hectaresandincludesthepeninsulaanditssurround-ings, with a northward extension covering the richmarinehabitatsofGökovaBay.Itisadiversehillyland-scape with harbours and bays along its coasts. The
steepcliffspreventtheexpansionoftheroadnetworkto some extent and provide patches of habitat forwildlife.
About 90 percent of the Datça-Bozburun Peninsulais protected under natural parks, wildlife reservesand natural and archaeological sites, as well as six“No-TakeZones”(NTZs)andtwoSpecialEnvironmentalProtectionAreas (GökovaSEPAandDatça-BozburunPeninsulaSEPA).However,Datça-Bozburun isat riskof losing its valuableprotectedstatus,which todatehasreducedthreatstothelandscape.
The Datça-Bozburun peninsula is recognized as a Key Biodiversity Area
1 “Keybiodiversityareasareplacesofinternationalimportancefortheconservationofbiodiversitythroughprotectedareasandothergovern-ancemechanisms.Theyareidentifiednationallyusingsimple,standardcriteria,basedontheirimportanceinmaintainingspeciespopulations.”(Source:www.iucn.org)
Table 3. Ideas for actions in Waitabu village, Taveuni Island, Fiji
©C
OM
DE
KS
Tur
key/
Gök
men
Arg
un

60 | Toolkit for the Indicators of Resilience in Socio-ecological Production Landscapes and Seascapes (SEPLS) Chapter 4: Examples from the field | 61
Fishing is one of the key livelihood activities in Gokova Bay
Preparation
Information collection and stakeholder identificationThe teamofexperts supporting thebaselineassess-ment prepared information regarding the status ofconservationandlivelihoodactivitiesinthearea,takingintoaccount forexample thecontinuousdecrease inpopulationsofvulnerableMediterraneanspecies.
A literature review, assessment of local capacities,site visits and consultations with local stakeholderswere conducted. Local stakeholders included repre-sentatives of local villages, municipalities and citycouncils;cooperativesandunionsforagriculture,fish-eries, tourism and infrastructure; individual farmers,fishermen, hotel owners, tourism operators, animalkeepersandlocalresidents;localandnationalprotec-tion-oriented NGOs working on nature conservationand agricultural biodiversity; and local academicsresearchingmarineprotection.
One challenge was adapting the terminology to thecommunity’s needs. As the language used in theindicators was difficult for most of the participantsto comprehend, the COMDEKS team translated andsimplifiedtheterminologyandprovidedexamplesrele-vantto localcommunitiestoensurethatallmemberswouldunderstandthetermsandconcepts.
assessment workshops
Theassessmentworkshopslasted3-4hours,includingan introductory presentation and exercises to createa more informal, participatory and communicativeatmosphere.Theassessmentof the landscapesitua-tionwasbasedon1)aninteractivemappingexercise,2)scoringoftheresilienceindicators,and3)aproblemtree analysis, which was produced from discussionsduringtheprocess.
Prior to the workshops, participants were asked tomark important assets, values, threats and conflictareasbystickingnotesandphotosontoamapofthelandscape.Thecomposedmapnotonlyprovidedvalu-ableinformationonkeycharacteristicsofthearea,butalso underlined sensitive areas of interest, problems,opportunitiesandthreats.
Afterthemappingexercise,thethreeresilienceassess-mentworkshopswereheld,andlaterkeystakeholderswhodidnotappearatthemeetingswerevisitedindi-vidually. Then, a follow-up session was organized todiscussproblemanalysis.
Based on the interactive mapping exercise and indi-catorassessment,localcommunitiesidentifiedthreatsandproblemsintheareas.Theyfoundthat,asaresultofincreasingdevelopmentpressuressuchasurbaniza-tion,pollutionandhabitatdestructioninterrestrialandmarineecosystems,thedegradationleveloftheland-scape is increasing. Important problems highlighted
ParticipantsThreeworkshopswereheld in thepeninsula inorderto maximize key local stakeholders’ participation. Intotal, more than 70 stakeholder representatives from17targetcommunitieswereinvolvedintheworkshops.
Duetothelargesizeoftheareaandthehighpopulationon the peninsula, only representatives of local coop-erativesandcommunities,mostlymen,wereinvitedtotheseworkshops,althoughiftimeandconditionsallow,additionalhousevisitstowomenarestronglyadvisedtoovercomegenderbarriersinsuchcases.
Local fisherwoman in Datça-Bozburun Peninsula
in the problem tree analysis included a loss of localagriculturalproductssuchasfigandmastic,abandon-mentoftraditionalfishinganddivingpracticesinfavourof conventional products with higher profit margins,destructionofvaluableforestsanddecreasingwildlifepopulation. Literature also shows that populations ofvulnerable Mediterranean species continue to shrinkdespiteprotectionstatus.
Landscape strategy and action plan
The series of consultations undertaken on Datça-Bozburun provided a snapshot of the current situ-ation of the landscape from the perspective of keystakeholders. In addition, a landscape-level perspec-tivewasveryhelpfulforlocalcommunitiestohaveanopportunity to visualize how their actions affect thelandscape, and how those actions link together. Theprocessgenerateda list of values, opportunities andthreats,fromwhichthestrategytoenhancelandscaperesiliencewasdeveloped.
Based on these consultations, stakeholder repre-sentativesdevelopedtheCOMDEKSCountryProgramLandscape Strategy with four desired outcomes: 1)to improve and/or maintain ecosystem services bystrengthening participatory land use planning andmanagementpractices;2)toincreaseresilienceofagri-culturethroughconservationofplantgeneticresourcesandimplementationofagro-ecologicalpracticesusingtraditional knowledge; 3) to improve the livelihoodsof the people through eco-friendly community-basedenterprisesthatreduceimpactsontheecosystemandscenic value of the landscape; and 4) to create and/or strengthen institutional governance mechanismsthrough more inclusive and participatory decision-makingprocessesatthelandscapelevel.
During the consultative process for the developmentoftheLandscapeStrategy,participantsalsoidentified
©C
OM
DE
KS
Tur
key/
Zaf
erK
ızılk
aya
©C
OM
DE
KS
Tur
key/
Zaf
erK
ızılk
aya

62 | Toolkit for the Indicators of Resilience in Socio-ecological Production Landscapes and Seascapes (SEPLS) Chapter 4: Examples from the field | 63
the kinds of local interventions needed to achievetheseoutcomesandguidethedesignandselectionofspecificcommunityprojectsfordirectgrantfunding–eitherfromCOMDEKSorotherdonors.Basedonthiscommunity-driven landscape planning process, theSGPNationalSteeringCommittee inTurkey selectednine projects in the Datca-Bozburun Peninsula, allof which are administered by community organiza-tions and are designed to improve the livelihoods oflocal populations while strengthening the resilienceof surrounding ecosystems in the target landscape.For example, the “Transition to Responsible Fishing Practices in Datça Peninsula”and“Ghost Net Hunters”projects aim to protect biodiversity and improveecosystemservicesbycombatingoverfishing,thelackofregulatoryenforcementandillegalharvestingwithinno-fishingzones,while the“Ecosystem Sustainability, Rehabilitation and a Start for Ecotourism at Hacetevi Hill” and “The Conservation, Promotion and Fair Trade of Datça Almonds”projectsareworkingtowardsdevel-opingresilientagriculturalsystems.Alloftheprojectstake a holistic approach to sustainable community-based development and create synergies throughoutthetargetlandscape.
Stakeholder-drivenplanningprocessesand theprac-ticalapplicationoftheindicators,basedoncommunityperspectives,areeffectivetoolsforreachingcommonunderstandingofthreatsandsolutionsandfordefiningstrategies to enhance SEPLS resilience throughcommunity-basedactivities.
TheCOMDEKSTurkeyLandscapeStrategyservesasa collaborative adaptive management tool to protectDatça-BozburunKeyBiodiversityAreawhileimprovingthe livelihoodsof local communities.After theuseoftheResilienceIndicatorsasatoolforcommunitiestoassess their landscape, identify desired ecological,socialandeconomicoutcomes,andplanactivitiestobuildresilience,theCOMDEKSprojectinTurkeysoonbegantheprocessofconductinganex-postbaseline
assessment inorder tomeasure resultsandachieve-mentsatthelandscapelevel,assesschangeinpercep-tions,andadaptplanningforsubsequentmanagementpracticesthatwillreflectlessonslearned.
Divers from the “Ghost Net Hunters” project
Landscape poster with information on landscape elements and COMDEKS funded activities developed during the baseline assessment in Turkey
This poster, titled “Challenges and solutions toenhance the resilience of the Datça-BozburunPeninsula’s socio-economic production landscapeand seascape” was produced through the assess-mentprocess. It isusedasaneducational tool forlocalcommunitiesandforbuildingawarenessamongvisitorstothearea.
The left side of the map simulates the interactivemapping exercise held during the assessment, in
which community members were asked to markimportant assets, including key biodiversity andlocal products, as well as threats and challengessuch as sea pollution, overfishing and ghost nets.The right side outlines the nine community-basedprojectsidentifiedthroughtheresilienceassessmentworkshops,andcurrentlysupportedbyCOMDEKS,which focus on both landscapes and seascapesof the peninsula. Below the annotated map, eightmessages welcome visitors in both Turkish andEnglishandpresentwaystorespectthelandscape’snatural featuresbyavoidingdisturbance to animalhabitats,supportingsustainablefishing,andempow-ering local cooperatives to ensure conservation oftheDatçaalmondandotherlocalproducts.
©C
OM
DE
KS
Tur
key/
Den
izA
carli
©B
ebec
iC.
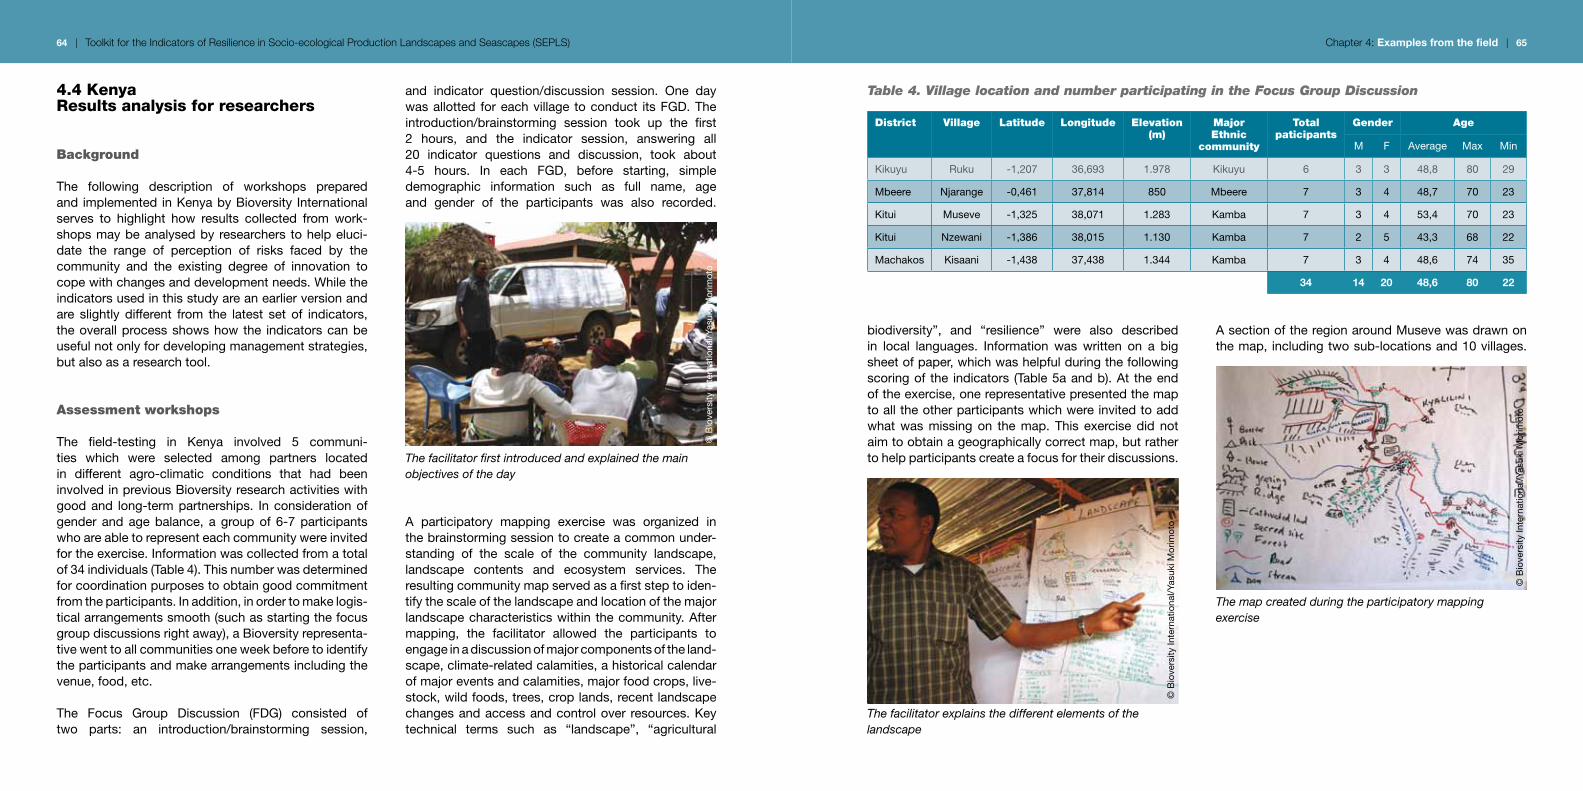
64 | Toolkit for the Indicators of Resilience in Socio-ecological Production Landscapes and Seascapes (SEPLS) Chapter 4: Examples from the field | 65
4.4 Kenya Results analysis for researchers
Background
The following description of workshops preparedand implemented inKenyabyBioversity Internationalserves to highlight how results collected from work-shopsmaybeanalysedbyresearchers tohelpeluci-date the range of perception of risks faced by thecommunity and the existing degree of innovation tocopewithchangesanddevelopmentneeds.Whiletheindicatorsusedinthisstudyareanearlierversionandare slightly different from the latest set of indicators,theoverallprocessshowshowthe indicatorscanbeusefulnotonlyfordevelopingmanagementstrategies,butalsoasaresearchtool.
assessment workshops
The field-testing in Kenya involved 5 communi-ties which were selected among partners locatedin different agro-climatic conditions that had beeninvolvedinpreviousBioversityresearchactivitieswithgoodand long-termpartnerships. Inconsiderationofgender andagebalance, agroupof 6-7participantswhoareabletorepresenteachcommunitywereinvitedfortheexercise.Informationwascollectedfromatotalof34individuals(Table4).Thisnumberwasdeterminedforcoordinationpurposestoobtaingoodcommitmentfromtheparticipants.Inaddition,inordertomakelogis-ticalarrangementssmooth(suchasstartingthefocusgroupdiscussionsrightaway),aBioversityrepresenta-tivewenttoallcommunitiesoneweekbeforetoidentifytheparticipantsandmakearrangementsincludingthevenue,food,etc.
The Focus Group Discussion (FDG) consisted oftwo parts: an introduction/brainstorming session,
and indicator question/discussion session. One daywasallotted foreachvillage toconduct itsFGD.Theintroduction/brainstorming session took up the first2 hours, and the indicator session, answering all20 indicator questions and discussion, took about4-5 hours. In each FGD, before starting, simpledemographic information such as full name, ageand gender of the participants was also recorded.
The facilitator first introduced and explained the main objectives of the day
A participatory mapping exercise was organized inthebrainstormingsessiontocreateacommonunder-standing of the scale of the community landscape,landscape contents and ecosystem services. Theresultingcommunitymapservedasafirststeptoiden-tifythescaleofthelandscapeandlocationofthemajorlandscapecharacteristicswithinthecommunity.Aftermapping, the facilitator allowed the participants toengageinadiscussionofmajorcomponentsoftheland-scape,climate-relatedcalamities,ahistoricalcalendarofmajoreventsandcalamities,majorfoodcrops,live-stock,wildfoods,trees,croplands,recentlandscapechangesandaccessandcontroloverresources.Keytechnical terms such as “landscape”, “agricultural
biodiversity”, and “resilience” were also describedin local languages. Information was written on a bigsheetofpaper,whichwashelpfulduringthefollowingscoringof the indicators (Table5aandb).At theendoftheexercise,onerepresentativepresentedthemaptoalltheotherparticipantswhichwereinvitedtoaddwhat was missing on the map. This exercise did notaimtoobtainageographicallycorrectmap,butrathertohelpparticipantscreateafocusfortheirdiscussions.
The facilitator explains the different elements of the landscape
AsectionoftheregionaroundMusevewasdrawnonthemap,includingtwosub-locationsand10villages.
The map created during the participatory mapping exercise
Table 4. Village location and number participating in the Focus Group Discussion
district village Latitude Longitude Elevation (m)
Major Ethnic
community
total paticipants
gender age
M F Average Max Min
Kikuyu Ruku -1,207 36,693 1.978 Kikuyu 6 3 3 48,8 80 29
Mbeere Njarange -0,461 37,814 850 Mbeere 7 3 4 48,7 70 23
Kitui Museve -1,325 38,071 1.283 Kamba 7 3 4 53,4 70 23
Kitui Nzewani -1,386 38,015 1.130 Kamba 7 2 5 43,3 68 22
Machakos Kisaani -1,438 37,438 1.344 Kamba 7 3 4 48,6 74 35
34 14 20 48,6 80 22
©B
iove
rsity
Inte
rnat
iona
l/Yas
ukiM
orim
oto
©B
iove
rsity
Inte
rnat
iona
l/Yas
ukiM
orim
oto
©B
iove
rsity
Inte
rnat
iona
l/Yas
ukiM
orim
oto

66 | Toolkit for the Indicators of Resilience in Socio-ecological Production Landscapes and Seascapes (SEPLS) Chapter 4: Examples from the field | 67
Table 5a. Major landscape components and calamities identified in Museve village, Kenya
category description
Majorlandscapesandlandmarks
Hills,ridges,forests,largetreesandrocks,swamps,damsandwaterpointsincludingwells,roads,schools,houses,dispensaries,churches,seasonalriversandstreams,radioandtelephoneboosters,cropfields,grazinglands
Protectedlandscapesandareas
Forests,waterdams,culturalsitesandsacredplaces,schools,markets,churches,dispensaries,roads
Crops Maize,beans,sorghum,cassava,sweetpotatoes,cocoyam(Xanthosomasp.),sugarcane,bananas,kale,blacknightshade(Solanumsp.),carrots,pumpkins,ediblegourds(Lagenaria siceraria),onions,coriander,pigeonpeas,cowpeas,climbingbeans,greengram,bambarabeans,watermelon,fingermillet,pearlmillet,custardapples(Annona reticulata),tomatoes,avocadoes,passionfruit,mangoes,oranges,pawpaw,tangerines,guava
Trees Cupressussp.,Eucalyptus sp,Grevillia robusta,Senna siamea,Vitexpayo,Croton macrostachys(kitundu),Antidesma venosum(kikala),miklanginga
Livestock Cows,goats,sheep,donkeys,chickens
Wildanimals Monkeys,nzonga,squirrels,rabbits/hares,rats,mice,mongoose,impala,snakes
Climate-relatedcalamities
Prolongeddryseason(drought),overgrazing,floods,landerosion,croppestssuchasarmyworms,bushfires,interferenceofpeople,diseases(animalandhuman)
Socialcalamities Poverty,unemployment,malnutritionandhunger,drugabuse,lackofmoralityamongyouth,Indigenoustreescutdownandnotplantedagain
Table 5b. Example translations of landscape terms prepared for the discussion in Kikamba (a local language)
English kikamba
Landscape nzi/nthi,wmbowanthi/nzi(“natureofcountry”)
Resilience kwiyumiisyo,kwingangiiya
Diversity mbulanio,kivathkanyo
The population of this landscape was estimated tobe 6-7,000 people in 750-800 households, with theperceived scale of the landscape varying among thefivecommunitiessurveyed.
Results analysis
After the workshop, researchers carried out furtheranalysisusingthecollectedscores,helpingtoidentifyrisksfacedbythefivecommunities.Localinnovationsand challenges were shown to have implications forpotentialcommunitydevelopment.
Three typesofanalyticalmethodwereutilized:quan-titative, qualitative and comparative. The followingare examples of results found through each of thedifferent methods. Table 6 shows the proportion ofrespondents scoring 1 (explained as “high risk” inthese workshops) to 5 (explained as “good state”)foreachof the20 indicators in thefivecommunities.
Table 6. Percentages of respondents with different scores and trends, mean scores and trends in the five communities, indicating degree and variation of perception scores and trends for the 20 indicators
Score (%) Mean score * trend (%) Mean trend *
Ind
icat
ors
1 2 3 4 5 Ruk
u
Nja
rang
e
Mus
eve
Nze
wan
i
Kis
aani
â æ à ä á Ruk
u
Nja
rang
e
Mus
eve
Nze
wan
i
Kis
aani
1 Heterogeneityandmultifunctionalityinthelandscape
6 21 41 21 12 3.0 a 3.7 a 3.9 a 2.6 a 2.4 a 0 59 12 26 3 2.5 a 2.4 a 2.3 a 4.0 b 2.4 a
2 Areasprotectedfortheirculturalandecologicalimportance
21 59 18 3 0 1.0 a 2.1 b 2.7 b 2.1 b 2.0 b 6 47 24 24 0 3.0 b 1.9 a 2.4 ab 4.0 c 2.0 a
3 Sustainableuseofresources
0 56 38 6 0 3.0 bc 2.0 a 3.1 c 2.4 ab 2.0 a 0 59 9 32 0 2.5 ab 2.0 a 3.1 ab 4.0 c 2.0 a
4 Environmentalsecurityandsafety
0 32 59 9 0 3.3 b 2.1 a 3.0 b 2.7 ab 2.7 ab 0 26 6 68 0 3.5 b 2.0 a 3.6 b 4.0 b 4.0 b
5a Localcrops,varietiesandanimalbreedsusedinacommunity
3 6 76 15 0 2.8 ab 2.6 a 3.3 ab 3.4 b 3.0 ab 0 32 3 65 0 3.0 ab 2.1 a 3.7 b 3.7 b 4.0 b
5b Agriculturalbiodiversitydocumentedandconservedincommunityclassificationsystemsandcommunityseedbanks
62 32 6 0 0 1.0 a 1.0 a 1.4 a 2.3 b 1.4 a 0 0 26 71 3 3.0 a 3.9 b 3.9 b 4.0 b 4.0 b
6 Diversityoflocalfoodsystem
0 50 41 9 0 3.5 b 2.1 a 2.3 a 2.4 a 2.7 ab 3 21 3 74 0 3.7 b 1.9 a 3.9 b 4.0 b 4.0 b
7 Innovationinagriculturalbiodiversitymanagementforimprovedresilienceandsustainability
0 38 47 12 3 4.0 c 2.1 a 2.1 a 3.0 b 2.9 b 0 9 6 76 9 4.0 ab 3.1 a 3.9 ab 4.3 b 4.0 ab
8 Accessandexchangeofagriculturalbiodiversity
0 53 26 18 3 4.2 c 2.1 a 2.0 a 3.0 b 2.4 ab 0 21 6 74 0 3.8 b 2.1 a 4.0 b 3.7 b 4.0 b
9 Transmissionoftraditionalknowledgefromelders,parentsandpeerstotheyoungpeopleinacommunity
3 32 56 9 0 3.3 c 3.1 bc 2.4 ab 2.7 ac 2.0 a 0 38 3 59 0 2.0 a 2.3 a 4.0 b 3.6 b 4.0 b
10 Culturaltraditionsrelatedtobiodiversity
0 26 62 12 0 2.7 a 2.9 a 3.1 a 2.4 a 3.1 a 6 65 6 24 0 2.0 ab 2.4 b 1.7 ab 4.0 b 2.1 ab
11 Numberofgenerationsinteractingwiththelandscape
0 0 38 53 9 4.2 b 3.6 ab 4.1 b 3.3 ab 3.4 ab 0 97 3 0 0 2.0 a 2.1 a 2.0 a 2.0 a 2.0 a
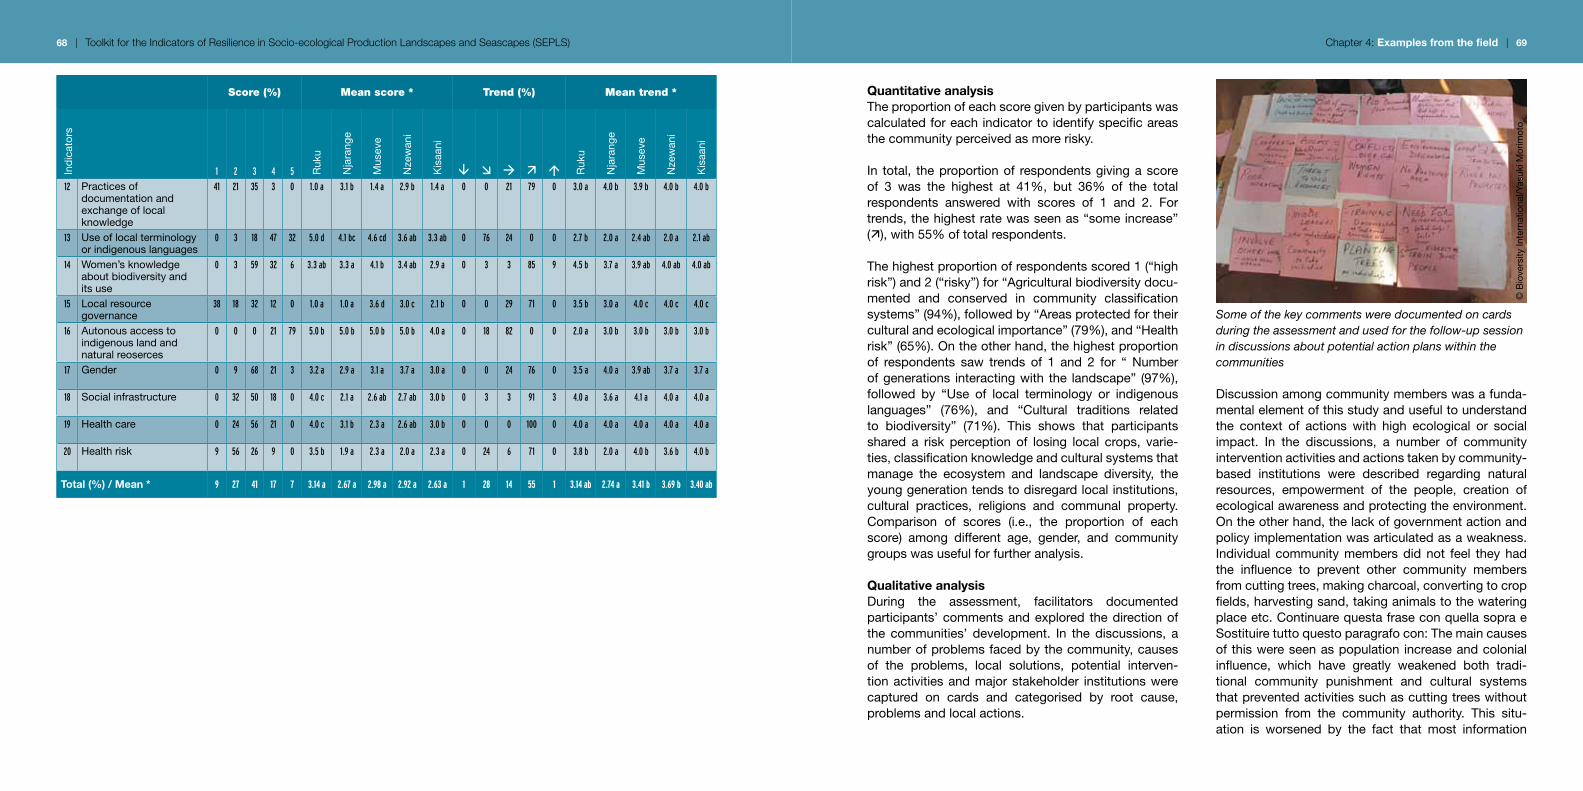
68 | Toolkit for the Indicators of Resilience in Socio-ecological Production Landscapes and Seascapes (SEPLS) Chapter 4: Examples from the field | 69
Score (%) Mean score * trend (%) Mean trend *
Ind
icat
ors
1 2 3 4 5 Ruk
u
Nja
rang
e
Mus
eve
Nze
wan
i
Kis
aani
â æ à ä á Ruk
u
Nja
rang
e
Mus
eve
Nze
wan
i
Kis
aani
12 Practicesofdocumentationandexchangeoflocalknowledge
41 21 35 3 0 1.0 a 3.1 b 1.4 a 2.9 b 1.4 a 0 0 21 79 0 3.0 a 4.0 b 3.9 b 4.0 b 4.0 b
13 Useoflocalterminologyorindigenouslanguages
0 3 18 47 32 5.0 d 4.1 bc 4.6 cd 3.6 ab 3.3 ab 0 76 24 0 0 2.7 b 2.0 a 2.4 ab 2.0 a 2.1 ab
14 Women’sknowledgeaboutbiodiversityanditsuse
0 3 59 32 6 3.3 ab 3.3 a 4.1 b 3.4 ab 2.9 a 0 3 3 85 9 4.5 b 3.7 a 3.9 ab 4.0 ab 4.0 ab
15 Localresourcegovernance
38 18 32 12 0 1.0 a 1.0 a 3.6 d 3.0 c 2.1 b 0 0 29 71 0 3.5 b 3.0 a 4.0 c 4.0 c 4.0 c
16 Autonousaccesstoindigenouslandandnaturalreoserces
0 0 0 21 79 5.0 b 5.0 b 5.0 b 5.0 b 4.0 a 0 18 82 0 0 2.0 a 3.0 b 3.0 b 3.0 b 3.0 b
17 Gender 0 9 68 21 3 3.2 a 2.9 a 3.1 a 3.7 a 3.0 a 0 0 24 76 0 3.5 a 4.0 a 3.9 ab 3.7 a 3.7 a
18 Socialinfrastructure 0 32 50 18 0 4.0 c 2.1 a 2.6 ab 2.7 ab 3.0 b 0 3 3 91 3 4.0 a 3.6 a 4.1 a 4.0 a 4.0 a
19 Healthcare 0 24 56 21 0 4.0 c 3.1 b 2.3 a 2.6 ab 3.0 b 0 0 0 100 0 4.0 a 4.0 a 4.0 a 4.0 a 4.0 a
20 Healthrisk 9 56 26 9 0 3.5 b 1.9 a 2.3 a 2.0 a 2.3 a 0 24 6 71 0 3.8 b 2.0 a 4.0 b 3.6 b 4.0 b
Total (%) / Mean * 9 27 41 17 7 3.14 a 2.67 a 2.98 a 2.92 a 2.63 a 1 28 14 55 1 3.14 ab 2.74 a 3.41 b 3.69 b 3.40 ab
Quantitative analysisTheproportionofeachscoregivenbyparticipantswascalculatedforeachindicatortoidentifyspecificareasthecommunityperceivedasmorerisky.
In total, theproportionof respondentsgivingascoreof 3 was the highest at 41%, but 36% of the totalrespondents answered with scores of 1 and 2. Fortrends,thehighestratewasseenas“someincrease”(ä),with55%oftotalrespondents.
Thehighestproportionofrespondentsscored1(“highrisk”)and2(“risky”)for“Agriculturalbiodiversitydocu-mented and conserved in community classificationsystems”(94%),followedby“Areasprotectedfortheirculturalandecologicalimportance”(79%),and“Healthrisk”(65%).Ontheotherhand,thehighestproportionof respondents saw trends of 1 and 2 for “ Numberofgenerations interactingwith the landscape” (97%),followed by “Use of local terminology or indigenouslanguages” (76%), and “Cultural traditions relatedto biodiversity” (71%). This shows that participantsshared a risk perception of losing local crops, varie-ties,classificationknowledgeandculturalsystemsthatmanage the ecosystem and landscape diversity, theyounggenerationtendstodisregardlocalinstitutions,cultural practices, religions and communal property.Comparison of scores (i.e., the proportion of eachscore) among different age, gender, and communitygroupswasusefulforfurtheranalysis.
Qualitative analysis During the assessment, facilitators documentedparticipants’commentsandexplored thedirectionofthe communities’ development. In the discussions, anumberofproblemsfacedbythecommunity,causesof the problems, local solutions, potential interven-tionactivitiesandmajorstakeholder institutionswerecaptured on cards and categorised by root cause,problemsandlocalactions.
Some of the key comments were documented on cards during the assessment and used for the follow-up session in discussions about potential action plans within the communities
Discussionamongcommunitymemberswasafunda-mentalelementofthisstudyandusefultounderstandthe context of actions with high ecological or socialimpact. In the discussions, a number of communityinterventionactivitiesandactionstakenbycommunity-based institutions were described regarding naturalresources, empowerment of the people, creation ofecologicalawarenessandprotectingtheenvironment.Ontheotherhand,thelackofgovernmentactionandpolicyimplementationwasarticulatedasaweakness.Individual communitymembersdidnot feel theyhadthe influence to prevent other community membersfromcuttingtrees,makingcharcoal,convertingtocropfields,harvestingsand,takinganimalstothewateringplaceetc.ContinuarequestafraseconquellasopraeSostituiretuttoquestoparagrafocon:Themaincausesofthiswereseenaspopulation increaseandcolonialinfluence, which have greatly weakened both tradi-tional community punishment and cultural systemsthatpreventedactivitiessuchascuttingtreeswithoutpermission from the community authority. This situ-ation is worsened by the fact that most information
©B
iove
rsity
Inte
rnat
iona
l/Yas
ukiM
orim
oto

70 | Toolkit for the Indicators of Resilience in Socio-ecological Production Landscapes and Seascapes (SEPLS)
relatedtoagriculturalandecosystembiodiversityhasbeenpassedononly throughoral traditionand therehas been a lack of educational materials describinglocalbiodiversityinlocallanguages.
Comparative analysisForacomparativestudy, targetcommunitiesneed tobeidentifiedstrategicallyinconsiderationoftheiragro-climatic,geographical(location,distancetomarketsortowns,altitudeetc.),andsocio-culturalcharacteristics.
In this case, an interesting observation was seen forindicators related todocumentationandexchangeoflocal knowledge, from comparative analysis betweenthe communities. The Kisaani community had betterperceived risk compared to the other communities,whichwasconsideredtobearesultofearliercommu-nity efforts. In Kisaani between 2001 and 2002, withhelp fromBioversity International, agroupofwomenknown as the Kyanika Women’s Group undertook aprojecttosafeguardthediversityofgourdandcowpeavarietiesand localknowledgeabout theirmanyuses.Duringthisproject,theyvisiteddifferentpartsofKenya,collectingmany typesofgourdandcowpeavarietiesand recording people’s knowledge about them. Thefruits, seeds and information were stored and exhib-itedinaspecialbuilding,akindofcommunityresourcecentre,whichactsasasourceofseedsandaneduca-tioncentre.
Comparative analysis in this case helped to showthe real effectiveness of past interventions, and thusprovideevidenceforwhattypesofinterventionsshouldbepursuedinthefuture.
findings of the results analysis
The indicator workshops and results analysis helpedto identify perceived risks and potential develop-ment options for securing ecosystem services and
sustainable production systems through enhancingsocialcohesion,humancapitalandfarmers’knowledgeregardingmanagementoflocally-availableagriculturaldiversity.Thisprocess,includingcontinuedinteraction,can raise self-motivated awareness and local owner-ship in decision-making and creation of action planstoimplementcommunity-basedinterventionsandthusstrengthenresilienceinthelandscape.
Some practical lessons learned from conducting thisstudy:• Agroupof6-7participantswasfoundtobeappro-
priateformanagingandfacilitatingdiscussionsbutinsufficientforstatisticaldataassessmentofscores.In order to understand community perceptionsfromstatisticalanalysis,alargernumberofpartici-pantsfromvarioussocialbackgroundsneedtobeselectedfromabroaderrangeofthepopulation.
• Workingoutpotentialoptionsrequiresalotoftime.The research team and facilitators therefore needtoidentifytheidealnumberofparticipantsforthisexercise.Around15-20activeparticipantsare themaximum number that one facilitator can handle.Iftwopairsoffacilitatorsandnotetakersareavail-able, two separatediscussions can be organized,possiblydividedbygender.
