tohoku relief project wind/solar energy power generator · tohoku relief project – wind/solar...
TRANSCRIPT

Tohoku Relief Project – Wind/Solar Energy Power Generator
Senior Design I Final Project Document
Group #15 4/27/2012
Members: Imran Ali
Travis Comer Keith Walls
Sponsored by: Workforce Central Florida
Participating in: Progress Energy Symposium

i
Table of Contents 1 Executive Summary ............................................................................................................................... 1
2 Definition .............................................................................................................................................. 2
2.1 Motivation .................................................................................................................................... 2
2.2 Goals and Objectives ..................................................................................................................... 3
2.2.1 Solar Power input .................................................................................................................. 3
2.2.2 Wind Power Input ................................................................................................................. 4
2.2.3 AC Power Output .................................................................................................................. 4
2.2.4 DC Power Output .................................................................................................................. 4
2.2.5 Simultaneous operation ........................................................................................................ 5
2.2.6 Efficiency ............................................................................................................................... 5
2.2.7 Modularity/Portability .......................................................................................................... 5
2.2.8 Electronics Enclosure ............................................................................................................ 5
2.2.9 Display ................................................................................................................................... 6
3 Requirements ........................................................................................................................................ 6
3.1 Input Power .................................................................................................................................. 6
3.2 Output Power................................................................................................................................ 6
3.3 Power Storage ............................................................................................................................... 7
3.4 Display ........................................................................................................................................... 7
3.5 Physical Requirements .................................................................................................................. 7
4 Research ................................................................................................................................................ 7
4.1 Hardware ...................................................................................................................................... 7
4.1.1 Batteries ................................................................................................................................ 8
4.1.2 Maximum Power Point Tracking ......................................................................................... 11
4.1.3 Charging Circuitry ................................................................................................................ 13
4.1.4 Power Inverters ................................................................................................................... 22
4.1.5 Wind Turbine ...................................................................................................................... 24
4.1.6 PV Cell Arrays ...................................................................................................................... 27
4.1.7 Power Calculation Sensors .................................................................................................. 32
4.1.8 Displays ............................................................................................................................... 34
4.1.9 Microcontrollers ................................................................................................................. 37
4.2 Software ...................................................................................................................................... 42
4.2.1 Power Usage Calculations ................................................................................................... 42
4.2.2 Battery Charge State Calculations ...................................................................................... 43

ii
4.2.3 Displays ............................................................................................................................... 43
4.2.4 Microcontrollers ................................................................................................................. 46
5 Design.................................................................................................................................................. 47
5.1 Battery ........................................................................................................................................ 47
5.2 Charging System.......................................................................................................................... 50
5.3 Wind Turbine .............................................................................................................................. 53
5.4 PV Panel Array............................................................................................................................. 57
5.5 Display ......................................................................................................................................... 60
5.6 Microcontroller ........................................................................................................................... 63
5.6.1 Power Usage Sensors .......................................................................................................... 68
5.6.2 Battery Charge State Sensors.............................................................................................. 69
5.7 Power Inverter ............................................................................................................................ 70
5.8 Power Outlets ............................................................................................................................. 72
5.9 Stand and Electronics Enclosure ................................................................................................. 74
6 Design Summary ................................................................................................................................. 75
7 Testing ................................................................................................................................................. 76
7.1 Introduction to Testing ............................................................................................................... 76
7.2 Power Generation testing ........................................................................................................... 77
7.2.1 Wind Turbine ...................................................................................................................... 77
7.2.2 PV Cell Array ........................................................................................................................ 79
7.2.3 Complete Power Generation System .................................................................................. 81
7.3 Power Storage System Testing ................................................................................................... 82
7.4 Power Output Testing ................................................................................................................. 83
7.5 Display Testing ............................................................................................................................ 84
8 System Operation ............................................................................................................................... 85
9 Administrative Details ......................................................................................................................... 86
9.1 Milestones................................................................................................................................... 86
9.2 Budget ......................................................................................................................................... 86
9.3 Final Plans for Device .................................................................................................................. 87
9.4 Project Summary ......................................................................................................................... 88
9.5 Conclusion ................................................................................................................................... 89
10 Appendices ...................................................................................................................................... 90
10.1 Bibliography ................................................................................................................................ 90
10.2 Image Permissions ...................................................................................................................... 96

iii
List of Figures
Figure 1 - Block Diagram of Overall System Layout ....................................................................................................... 2 Figure 2 - I-V and P-V Curve of a Typical 75W PV Panel .............................................................................................. 11 Figure 3 - I-V Curve of a PV Panel at Various Sunlight Levels ...................................................................................... 12 Figure 4 – Lead Acid Battery Charger Circuit ............................................................................................................... 13 Figure 5 – Lead Acid Battery Charging Stages ............................................................................................................. 14 Figure 6 – Nickel-Metal Hydride Battery Charger Circuit ............................................................................................. 15 Figure 7 - Charging Characteristics of a Nickel-Metal Hydride Battery ....................................................................... 16 Figure 8 - Lithium Ion Battery Charging Circuit ............................................................................................................ 17 Figure 9 – Charging States of Lithium Ion Battery ....................................................................................................... 18 Figure 10 - MPPT Characteristic Graph ........................................................................................................................ 22 Figure 11 - Modified Sine wave inverter signal vs. pure sine wave inverter signal ...................................................... 23 Figure 12 - Verical Axis Wind Turbine .......................................................................................................................... 25 Figure 13 - Horizontal Axis Wind Turbine .................................................................................................................... 25 Figure 14 – HAWT Wind Direction ............................................................................................................................... 26 Figure 15 – Wind Intensity Map................................................................................................................................... 27 Figure 16 - Global Sun Exposure Map .......................................................................................................................... 28 Figure 17 – Charging System form Solar Panel ............................................................................................................ 29 Figure 18 - Thin PV Cell Array Flexibility ...................................................................................................................... 30 Figure 19 - Current vs. Voltage at Different Temperatures ......................................................................................... 31 Figure 20 - Thin Film Array Panel Layers ...................................................................................................................... 32 Figure 21 - Battery Terminal Voltage vs. Percentage of Battery Charge Remaining ................................................... 33 Figure 22 - Comparison between Placing a Current Sensor on the High Voltage Side of a Load vs. the Low Side ...... 34 Figure 23 - SparkFun LCD Display ................................................................................................................................ 34 Figure 24 - Backlight Brightness for LCD Screen .......................................................................................................... 36 Figure 25 - Serial Connection on LCD ........................................................................................................................... 36 Figure 26 - LCD/Microcontroller Interconnection ........................................................................................................ 38 Figure 27 - Hardware multipliers for MSP430 ............................................................................................................. 40 Figure 28 - MSP430 Architecture ................................................................................................................................. 41 Figure 29 - Low Power Speaker for audible tones ........................................................................................................ 43 Figure 30 - Voltage vs. percent of charge left .............................................................................................................. 44 Figure 31 - LED to display fault codes .......................................................................................................................... 45 Figure 32 - Cycle Life vs. Depth of Discharge ............................................................................................................... 48 Figure 33 - Optima Battery Comparison ...................................................................................................................... 49 Figure 34 - Schematic Diagram for 12 VDC Supplied by Optima D51 Battery ............................................................. 50 Figure 35 – MPPT Comparison Chart ........................................................................................................................... 51 Figure 36 – Spec’d MPPT Charge Controllers ............................................................................................................... 51 Figure 37 –Charge Controller Connections .................................................................................................................. 52 Figure 38 – Wind Turbine Comparison Chart ............................................................................................................... 54 Figure 39 – One Line Diagram ..................................................................................................................................... 55 Figure 40 – Wind Speed vs. Watts Produce of the Sunforce 45444 Wind Turbine....................................................... 56 Figure 41 – Solar/Wind Charging Diagram .................................................................................................................. 56 Figure 42 - Thin Film Array Solar Panel Specifications ................................................................................................. 57 Figure 43 - PV Array ..................................................................................................................................................... 58 Figure 44 - Mirrors on a Solar Panel ............................................................................................................................ 59 Figure 45 - Current Sensor with DC lines going to battery as well as data lines going to MSP430 ............................. 60 Figure 46 - Airflow Pattern to dissipate heat on board and display ............................................................................ 61 Figure 47 - LCD serial pin layout .................................................................................................................................. 62 Figure 48 - Serial LCD Graphical Display ...................................................................................................................... 63 Figure 49 – MSP430 Mpower Consumption ................................................................................................................ 64 Figure 50 - MSP430G2231 Diagram ............................................................................................................................ 65

iv
Figure 51 – MSP430 Chart ........................................................................................................................................... 66 Figure 52 – Microcontroller Schematic ........................................................................................................................ 67 Figure 53 – 3D Model of Microcontroller PCB ............................................................................................................. 67 Figure 54 - Voltage Divider to Feed Battery Voltage to Microcontroller ..................................................................... 69 Figure 55 - Commercially available power inverter comparison chart ........................................................................ 71 Figure 56 - Schematic Diagram of Wiring from Power Inverter to Outlets .................................................................. 72 Figure 57 - Wiring Diagram for GFCI Outlet ................................................................................................................ 73 Figure 58 - Heat transfer over a box ............................................................................................................................ 74 Figure 59 - Fins used to dissipate heat and keep elements out ................................................................................... 74 Figure 60 - Waterproof button used to change modes................................................................................................ 75 Figure 61 - Overall Concept Design .............................................................................................................................. 75 Figure 62 – Orlando Executive Airport ......................................................................................................................... 77 Figure 63 – RPM Testing Method ................................................................................................................................ 78 Figure 64 – Universal Studios Parking Garage, Orlando FL ......................................................................................... 79 Figure 65 - Connection between PV array and Battery ................................................................................................ 80 Figure 66 – Temperature Effect on PV Panels .............................................................................................................. 81 Figure 67 - Schematic for Testing Power Storage System ............................................................................................ 83 Figure 68 - Wire Rating for Amperage vs. Temperature vs. Material .......................................................................... 84 Figure 69 - Tentative Schedule ..................................................................................................................................... 86 Figure 70 – Revised Itemized Budget ........................................................................................................................... 87

1
1 Executive Summary It was the goal of our senior design team to design and construct a power generator that harnessed and stored energy from renewable energy sources. The green energy sources chosen included both solar energy, generated using two 200 Watt solar panels, and wind energy, which is generated using a single 450 Watt micro wind turbine. All of the energy generated is stored in a battery for use at times when very little green energy is available, and has the capability of powering both a laptop computer and a projector for a minimum of thirty minutes. With the targeted application of the system being a classroom setting, the functionality of the power generator and its user interface were of top priority. The system was designed and implemented in such a way that it is very simple for the user to operate, and at the same time very reliable. Within this document, our group first fully outlines and defines all of our goals and requirements for our project. After that we delve into the research completed by our group throughout the two semesters in the effort of developing a deep understanding of our project. With all the research complete, our group then goes on to discuss all of the specific parts and techniques implemented in the final design of our power generator. Finally, we describe how the prototype was assembled, and provide an abundance of test cases that were implemented to completely examine and document every aspect of our power generator under the plethora of natural environments that it could encounter during everyday use. The goals of this document listed above were completed in two academic semesters. Our first step in the completion of this project was thoroughly researching and coming up with a preliminary design. After this was completed, we then began the stage of acquiring and building all the parts and components that were necessary to complete this original design. This basically took up the first semester of the project. We continued to acquire and build the necessary components in the second semester, but also began the assembly, testing, and prototyping process. As we acquired and built the systems components, we would then perform small tests to ensure that the part would in fact work for the design. If an issues were found, either an alternate part was obtained or built, or the original design was modified. Once we completed the design and put it through as many different test situations as we could, we presented the project as a whole to a panel engineers. The panel of engineers then assessed all of our work, including our research, design, and final implementation, and then provided us feedback, asked questions, and ultimately decided if we were successful in providing a solution to the problem. Our group’s project was funded and all parts necessary were paid for using funds provided by Workforce Central Florida. Below in Figure 1 is an overall block diagram of our project. This diagram shows, in a broad way, our solution to the problem. It also gives insight into the areas in which was our research was performed, the product that was designed, and the prototype that was implemented in the end.

2
Wind Turbine
Wind Charge Controller
Battery
Solar Panel Array
Solar Charge Controller
Microprocessor
Display
DC→AC Converter
12 VDC Outlet
120 VAC Outlets
5 VDC USB Outlet
Figure 1 - Block Diagram of Overall System Layout
2 Definition 2.1 Motivation The IEEE – UCF Student Branch was contacted by a member of the student branch of IEEE at Waseda University in Tokyo Japan. He was in central Florida to look at potential research opportunities when he told the UCF student branch officers about the situation that Japan is still in. At the time, Japan was still recovering from the tsunami that struck in March of 2011. One of the biggest problems still plaguing the country at the time was the widespread power outages. These outages were sometimes to the point where it was difficult for the universities to even hold classes. After this initial discussion, the two student branches continued to correspond on how they could find a solution to this problem. In the end, it was decided that a senior design group could be used to design and implement a solution to the problem. This is where we came into the picture. Japanese companies that were sympathetic to the problem were contacted to donate solar panels and micro wind turbines that engineering students from UCF will be able to install around the Waseda campus such that in the event of a power outage the power generated and stored by these devices will be enough to power a projector and a laptop computer, the bare essentials to hold a respectable lecture. Originally, a few companied had agreed, but they later backed out.

3
It is important to note that Waseda University as well as UCF will more than likely be able to benefit greatly from this collaboration. Waseda will be given the resources needed to continue to function as a university during these hard times and UCF will be given exposure to one of the most prestigious universities in Japan that could sway many potential graduate and PHD students to consider UCF for their degrees and contribute to the many research opportunities ongoing on campus as well as research park. Not to mention, engineering students here at UCF (our group in particular) will be given a chance to gain hands on experience to put what they have learned here at UCF to good use towards a very tangible application. What we have done for our senior design project is built on the initial solution concept by trying to improve the design. We have more thoroughly designed the system, improved its efficiency, and made the system portable, all at a minimum cost per unit. The upgrades that we have implemented will be of the sort that require little to no interaction or maintenance so that these generators will remain self sufficient and autonomous. One of the upgrades implemented was the addition of reflective panels to collect as much radiant sunlight as possible to direct it back towards the PV cells so they receive more sunlight than they would otherwise. Another simple upgrade will be to add a pivot and rotating system to the micro wind turbine so that it may orient itself in the direction of incoming wind gusts to gain maximum gain from wind energy. Max power point tracking was also implemented on both the solar panels and the wind turbine, so as to constantly get the most power possible from them. However much of the knowledge that was gained from this project was in the understanding of what it took to build this generator system even without the upgrades. Circuitry to monitor power usage and power generation by either recording it or displaying on a screen was also designed and implemented. An understanding of power systems was utilized to combine the DC output of the PV cells to the DC output of the wind turbine and then collectively charge a battery. A power inverter was also utilized so that both the wind turbine and the PV panels will be able to deliver the power they have generated to charge the battery at any given time. The results from this project were combined with the ongoing research being conducted for this project to make these generator systems sustainable and obtainable to the people of Japan in the near future.
2.2 Goals and Objectives The main objective of this project was to create an energy source to provide power for the major necessities in holding a respectable class. Most of the goals and objectives for the main sub-systems were defined specifically for such a device. These goals and objectives are discussed in detail and compared to the overall goals of this system in the sections following.
2.2.1 Solar Power input The final device utilizes solar panels to harness energy from the sun and convert it to useful electrical power. The solar panels used are of low cost and low maintenance,

4
while being as efficient (generating as much power) as possible. In general, the lower cost panels output a lower amount of power. For this reason, the cheapest panels were not automatically selected, and instead price must be balanced with the power requirements of the system as a whole. Since solar panels generally output a DC voltage, storage of the energy created by them in a battery will be a straight forward process. Also, because one of the overall goals of the system as a whole was to be portable, size and weight of the panels were limited. Thus, the panels chosen maximized power generated for its corresponding size and weight when compared to other available panels. The solar panels were mounted to a tripod stand. The tripod stand will be the base of the power generators for the entire system. The method for mounting the solar panels should be such that they can be quickly and easily removed when the entire device needs to be relocated. This also includes a quick and easy way to connect/disconnect any and all cabling that is related to the panels.
2.2.2 Wind Power Input The device also harnesses energy from the wind via a wind turbine. The wind turbine converts the wind energy to electrical power, which is either be immediately used or stored in a battery for later use. As with the solar panels, the wind turbine is low cost and low maintenance, while maintaining a high efficiency. Again, price was balanced with the power requirements of the whole system. Some wind turbines output a three phase AC power, while others have circuitry already included in their design to output a DC voltage. This is because in most applications, the energy generated by the turbine is not immediately consumed. It is instead, stored in a battery for use at a later time. When it comes to wind turbines, there aren’t a lot of options in the price range we are looking for, but it was still important to keep size and weight in mind when making the final selection for which one would be used in this system. The turbine was mounted to the top of a tripod stand, which is the same stand that holds the solar panels. The method used to mount the turbine to the tripod was such that the turbine can be easily installed or removed in the event the entire device needs to be relocated, and as with the solar panels, this should also include an easy way to connect/disconnect all related cabling coming from the turbine.
2.2.3 AC Power Output The generator by specifications was designed to supply an AC power output in order to power a laptop and a projector. The AC output is obtained from the DC battery power supply with the use of an inverter in conjunction with a standard AC power outlet to provide a connection point for the projector and laptop to tap into the power system.
2.2.4 DC Power Output After the power is collected in the battery from the various generation sources, it then is delivered to the loads in the form of a DC output in addition to the AC output. In order for that power to be used by the loads, a popular DC outlet was used.

5
2.2.5 Simultaneous operation Per the specification, the design of the generator facilitates simultaneous operation of the power sources. This means that no matter what conditions are present at any given time, the generator is able to generate power without any external input or maintenance from the user and both sources supply power to the battery simultaneously and independently depending on the external conditions. If it is night out but there is a breeze blowing the user does not have to go outside and set a mode for just wind generation. The same goes for if there is no breeze but it is a sunny day outside, the generator still operates the same way but only getting power from the solar panels. The owner is also be able to have both the laptop and the projector plugged into the generator at the same time as to allow both loads to be drawing power simultaneously. The owner does not have to rely on the battery of the laptop to run for a while and charge it only when the projector is not in use. The owner is able to have a laptop and a projector being powered by the generator simultaneously.
2.2.6 Efficiency Because the generator is being powered by elements outside the control of the user, steps were taken to conserve as much of the captured power as possible to allow it to be available to the load. It was also one of the main goals of this project to find what simple ways would be available to conserve power in a system such as this in order to facilitate ease of maintenance and reliability for the owner. From future research we hope to find ways of adding and orienting parts to the system so that as much power as possible can be retained for as little cost and future maintenance as possible. There are a multitude of various efficiency methods available to the generator however cost and simplicity were the main deciding criteria as to which ones were ultimately chosen for the project.
2.2.7 Modularity/Portability In order to facilitate the ease of transportation for the generator for testing and presentation, the generator needed to be portable and to make construction and deconstruction easier it was determined that a modular approach would be best in order to be able to assemble and disassemble the project quickly and easily. The modular approach also allows the different sections of the generator to be constructed and tested separately before final construction. This allows for detection of simple problems to be spotted earlier in order for the correction of said problem to be done so in an efficient manner. This also avoided a problematic scenario when final testing did come around; the generator was not being continually completely deconstructed and constructed again to fix individual problems multiple times over.
2.2.8 Electronics Enclosure To provide protection from the elements the electronics in the system were enclosed. This prevented moisture from interfering with the electronic circuitry. Since the design is only a prototype and its’ main purpose is to facilitate testing of methods and procedures the enclosure for the electronics is a very simple plastic box to just prevent direct water

6
contact during testing. Since cost and time were factors in this project design of an enclosure and no finished product is being shipped to consumers, a simple barrier preventing direct water exposure is satisfactory per our design specifications.
2.2.9 Display In today’s day and age it is not enough to say that the designed power generator is making energy just by being outside. People want to see something showing them that the generator is in fact working. That is why as part of the design, an LCD screen is included. Even if there is no breeze during a sunny day and the generator looks as though it is doing nothing, looking at the LCD screen shows that there is some kind of activity coming from the generator. It is also very useful to be able to look at a screen and be able to find out how much power is left in a system if a user knows that they are going to need to use it at a later time.
3 Requirements 3.1 Input Power In order to power the basic essentials for a typical classroom during a power outage, some method of power generation must be used.
Power should be simultaneously generated using a solar cell array and a wind turbine
The solar panel should produce a minimum of 100 W.
The wind turbine should produce a minimum of 200 W.
The solar cell array should weigh no more than 20 lbs.
The wind turbine should weigh no more than 30 lbs.
The solar panels should output a DC voltage.
The wind turbine should output a DC voltage.
3.2 Output Power To make the power generated by the system useful, some popular forms of power will need to be generated and made available via their typical connections or outlets.
The system should provide a standard 12 VDC output via a cigarette lighter outlet
The system should provide a standard 5 VDC output via a USB connection
The system should provide a standard 120 VAC 60 Hz output via a standard wall socket
The system should incorporate the correct fuses and/or circuit breakers for each particular power output type
The system should be capable of supplying power form all power sources simultaneously
The system should use a pure sine wave inverter for the 12 VDC to 120 VAC conversion process.

7
3.3 Power Storage Having this mobile power generator would be pointless when the sun isn’t out and the wind isn’t blowing. For this reason, we need to harvest and store the energy as electrical energy when it is available.
The system should be capable of running a laptop and projector for at least 2 hours on average.
The system should be capable of being fully recharged in less than 6 hours of sunlight
The system should be capable of simultaneously storing the power generated by the wind turbine and solar cells.
The system should indicate the charged state of the battery to the user in a percentage.
When the battery is being drained, an approximate runtime remaining should be indicated to the user.
The battery should weigh less than 60 lbs.
3.4 Display In order to report the status of the battery, rate of discharge, and runtime remaining, some sort of electronic display must be used.
The display should consume less than 5 W.
The display should indicate the charge state of the battery.
The display should indicate the runtime remaining.
The display should indicate the rate of discharge.
The display should indicate any problems that may arise with the system.
3.5 Physical Requirements The entire system needs to be a size and weight that’s reasonable enough to often be relocated. The system needs to be low maintenance, and should be easy to assemble and disassemble.
The entire system should weigh less than 100 lbs.
The entire system should be able to fit in the trunk of a standard car, or 10 cubic feet.
The system should incorporate wheels so that it can be easily moved.
The system should seal out moisture so that the electronics are not affected by it.
The system should be modular and clearly indicate a method for assembly.
4 Research 4.1 Hardware Now that the goals, objectives, specifications and requirements have been laid out, all options on how to achieve them must be explored. Starting with hardware, everything from the proper battery to use to best microcontroller to use for calculating the amount of power generated must be thoroughly investigated to be sure that all options are evenly weighed out. It is only after this process that decisions can be made on types of

8
components, their configurations, or the specific interconnections to be used in the final design. In the following sections, the different options and details about each option for all major hardware components of the system will be discussed. Specific components will not be selected here; this can be found in the design sections.
4.1.1 Batteries Choosing the correct battery is one of the most critical parts of this design. Since there is no guarantee that the sun will be out or that there will be wind at the time of the blackouts, it is necessary for the power generated by the wind turbine and solar cells to be stored in a battery as it is created, at the time these resources are available. In the most extreme case, when the wind turbine and the solar cells aren’t able to create any power, the battery has to have enough energy stored to run a laptop and a projector for at least two hours. Choosing a battery for this device may seem like an easy task at first, but after closer consideration, it’s a rather involved process. Since the goal is to keep the entire unit as portable and modular as possible, the physical size and weight of the battery must be limited. It’s also important to consider the reliability, durability, typical life span, ease of use, and the availability of the battery. There are many battery types and sub-types that could be used for the intended application, a few of the most viable of which will be discussed in detail below. Lead acid batteries come in many forms. The most widely recognized form is known as an SLI (starting, lighting, ignition) battery or a cranking battery. These are the typical 6V and 12V automotive battery found in cars, motorcycles, and lawnmowers all over the world. Cranking batteries can provide a high current for a short period of time and most have a large enough storage capacity for our application. The problem is they are not meant to be significantly discharged and re-charged, or deep cycled, very often. When SLI batteries are subject to such deep cycle use, their life-span is quickly deteriorated. The reason this occurs is cranking batteries are made with very thin and porous lead plates, which maximizes the surface are in contact with the acid to in turn maximize the instantaneous current they can provide. It is these thin lead plates that cause the battery to fail quickly under repeated deep cycle operation, as the deep discharging and recharging dissolves the lead. Once the lead plates are dissolved to a certain point, they cannot be used. The lead plates are not replaceable, so the entire battery must be replaced. Most of these batteries come in a form without caps to replace water that may be lost, which causes a problem if the battery is overcharged multiple times. During overcharging, the electrolyte inside the battery undergoes electrolysis, and the hydrogen and oxygen gasses created can be released from the battery if the pressure builds too high. If this occurs too many times, the water within the electrolyte can be depleted, causing the lead plates to slowly lose contact with the electrolyte. These batteries are usually designed with extra electrolyte already inside, which prolongs the life of the battery in if overcharging does occur a few times, but it is limited. If the electrolyte level on battery with removable caps gets low, the battery can be saved simply by adding distilled water as often as necessary. Another popular type of lead acid battery is known as a deep cycle battery, which are also typically 6V or 12V. These batteries typically provide a more moderate current for a

9
long period of time and a larger storage capacity than an SLI battery of similar size. Deep cycle batteries are popular in boats and RV’s, as these have more electronic accessories to run, often without the engine running, than a car typically does. These are also the typical battery of choice for storing the energy produced by solar panels and wind turbines, just like our device will need. Unlike the cranking battery, deep cycle batteries are designed to have a significant amount of their charge depleted before they are re-charged. The lead plates are less porous and thicker than those of SLI batteries, which is the reason that the current they provide is less. These thick lead plates are also the reason deep cycle batteries can withstand repeated deep cycling. The lead doesn’t dissolve and leave gaps that cannot conduct a charge as quickly as the thin lead plates in SLI batteries do. Deep cycle batteries typically weigh between 15 and 70 pounds, and their cost is usually between $50 and $300, though there are many exceptions to these generalities. These batteries, in configurations that will work for this application, are readily available at many local stores and on the internet, so replacements are easily attainable. There are two main types of deep cycle lead acid batteries, known as flooded and valve regulated lead acid (VRLA) batteries. Flooded batteries are typically longer lasting, and cheaper than VRLA batteries. Overcharging is not a big problem with them, as the water lost (due to electrolysis) can be replaced via removable caps on the top of the battery or in some cases the battery is designed with extra electrolyte already enclosed if it doesn’t have caps. Caps can be seen as an advantage as the battery can be refilled as many times as necessary, but it also means water can evaporate from the battery thus requiring periodic maintenance. One of the downsides of all flooded batteries is that they are less durable. They are sensitive to movement and vibrations because the lead supports itself in the electrolyte and they must also be used in an upright position so that the lead plates will be properly submerged in the liquid electrolyte. Another disadvantage of flooded batteries when compared to VRLA batteries is that the electrolyte can be spilled. For this reason, most national and international shipping companies will not ship them. The diagram below shows the typical construction of a flooded lead acid battery. These disadvantages are in effect advantages of VRLA batteries. VRLA batteries are more accepting of vibrations and being moved around a lot due to their pancake stack like design. They can be also mounted in any orientation and can’t be spilled because their electrolyte is immobile. In addition, VRLA batteries tend to have a higher storage capacity, a lower internal resistance, a higher charging efficiency, and are maintenance free. VLRA batteries, however, are much more sensitive to overcharging than flooded cell are. This is because they are sealed electrolyte is immobile, thus extra cannot be included in the design. So the only disadvantages of VRLA batteries when compared to flooded cell batteries are price, lifespan and sensitivity to overcharging. In general, VRLA batteries are about twice the cost of a comparable sized flooded battery, but their lifespan is only slightly less if charged correctly every time. Valve regulated lead acid batteries are batteries that are in most cases sealed. However, if the pressure inside the battery gets too high due to hydrogen and oxygen

10
created by electrolysis within the battery, a safety valve will open and relieve the pressure. When this happens, the water is permanently lost to the battery. However, in most cases, the pressure never builds high enough within the battery to open the valve. This keeps the hydrogen and oxygen inside the battery, so that it can later recombine to form water again. There are two types of VRLA batteries; the gel battery (gel cell) and the absorbed glass matt (AGM) battery. Gel batteries are exactly what they sound like. The electrolyte in gel cells is gelified, and practically immobile. Other than that, they use basically the same chemistry as a flooded cell. AGM batteries hold the electrolyte in a glass mat between the lead plates. During the manufacturing of the battery, the glass matt is soaked in the electrolyte, and then slightly wrung out, making the battery capable of holding more acid than is available and therefore practically spill proof. But again, the chemistry is still basically the same as that applied by a flooded cell. The different constructions of these two batteries results in some important end characteristic differences. AGM batteries have a lower internal resistance, which results in a higher charge efficiency due to less electrical energy being turned into heat. Their design also allows for virtually any charging current, which can drastically reduce charging time. The figure below shows an illustrated diagram of the difference between wet cell, AGM, and gel cell batteries. Nickel-metal hydride batteries can also be found with a wide range of storage capacities, sizes, and weights. Those with the capacity to power this system alone, however, are often hard to find, and very expensive if they are located. In order to avoid these high cost, large capacity batteries, it may be possible to use multiple smaller remote controlled car battery packs. The price of these smaller nickel-metal hydride batteries is reasonable, at between $30 and $70 each battery pack. Nickel metal hydride battery packs are typically fairly small, weigh about 1 pound, come in 7.2V, 8.4V, and 9.6V battery packs, and are available with a storage capacity up to 5000mAh. Nickel-metal hydride batteries are designed to be deep cycled frequently, and they don’t have a liquid electrolyte meaning they can’t be spilled and can be oriented in any way while in use. Unfortunately, most of these battery packs require special charging procedures, such as a limit on the current, and some require a break period between cycles. Because we they do not come in the voltage and storage capacity we need, we will have to buy many of these batteries to make them work for our application. Perhaps the newest and fastest growing technology in rechargeable batteries is the lithium ion based battery. Like the most of the previous batteries discussed, these also come in many different forms and sizes. They range from being small enough to fit in and power your cell phone, all the way up to full size automotive batteries. They also don’t have a liquid electrolyte, and therefore cannot be spilled. Lithium ion based batteries are much better than any other type of rechargeable battery when it comes to its storage capacity per unit of mass or volume. However, because of their cost ($1000 and higher), large sized automotive lithium batteries are not very popular. As with the nickel-metal hydride batteries, a possible way to try to avoid the cost of the large batteries is to use multiple smaller R/C car lithium polymer battery packs. These smaller battery packs generally cost between $60 and $150 each, weigh about 1 pound each, have a storage capacity up to 12800mAh, and come in 7.4V and 11.1V variants. They

11
are designed to be deep cycled many times and are readily available at hobby shops and on the internet. One major downfall of lithium based batteries is that extreme care must be taken when charging lithium based batteries, as there is a risk of explosion if charging procedures listed by the manufacturer are not strictly followed. Due to the fact that these battery packs do not come in the voltage or storage capacity we need, we would again have to use multiple battery packs.
4.1.2 Maximum Power Point Tracking There are many factors that can and will decrease the power generation efficiency of the systems wind turbine and solar panels. Each of these factors is constantly changing, making it impossible to make a one-time adjustment or correction for these power generation losses. This is where maximum power point tracking (MPPT) comes in handy. The goal of MPPT is to electronically maximize the power generation efficiency at any given conditions. There are many operational conditions that can contribute to the power generation losses. Perhaps the largest and most important is the voltage at the battery. When using a conventional charger to re-charge a depleted battery, the generator is in effect connected directly to the battery. This forces the generator to run at the current voltage of the battery, which is undesirable because this voltage is unlikely to coincide with the voltage at which the generator produces its maximum power. The figure below shows an I-V curve for a typical 75W PV panel.
Figure 2 - I-V and P-V Curve of a Typical 75W PV Panel
Permission Pending from SolarEnergyExplorer.com
As you can see, at 12V, the panel only produces about 53W. If the panel were allowed to operate at its optimal voltage of about 17V, it would generate 75W of power. This is exactly the purpose of an MPPT charge controller. It will allow the generator to operate at the voltage which maximized power generation, and then turns that extra power generated into more current at the same 12V. For example, say this 75W solar panel outputs 75W at 4.4A and 17V under full sunlight. If it is forced to run at 12V under full sunlight, it still only puts out 4.4A, which makes or 12V x 4.4A = 53W. This results in

12
22W of un-generated power. If the PV panel were allowed to operate at 17V and generate its maximum of 75W, 75W/12V = 6.25 would be delivered to the battery. This is much better than the 4.4A before, and obviously will result in a quicker recharge of the battery. Again, this is all assuming full sunlight. The I-V curve of PV panels changes for each amount of sunlight it receives. The figure below shows multiple I-V curves for a certain PV panel at different sunlight levels.
Figure 3 - I-V Curve of a PV Panel at Various Sunlight Levels
Reprinted with permission under the terms of the GNU Free Documentation License,
So how is it that an MPPT charge controller works, you ask? As you can imagine, there isn’t a simple answer. There are multiple methods for tracking and adjusting for the maximum power point. To simplify this complex answer, only the most popular methods will be discussed here. In order to “track” the maximum power point (MPP), an algorithm is used to sample dP/dV (the dotted line in figure showing the I-V and P-V cure of the 75W PV panel). If the slope is positive, the algorithm knows it must adjust the voltage further in the same direction. This process is repeated until the slope is found to be negative, at which point the algorithm adjusts the voltage in the opposite direction. This can result in oscillations around the MPP, but will keep the voltage much closer to that of the MPP than a traditional charge controller can. To adjust the voltage that the solar panel is operating at, a high frequency DC to DC converter is employed. Most of today’s MPPT charge controllers are 93 – 97% efficient and yield a 10 - 40% power gain in the winter and 10 - 15% power gain in the summer. Another issue to consider is that when using multiple generators, they are likely not all in the same state, and therefore don’t all have the same maximum power point. This
13
applies to arrays of solar panels, wind generators, and combinations of the two. When using multiple different types of solar panels, they will have different properties and therefore different MPP’s, even when they are under the same conditions. Even multiple PV panels that are exactly the same can have different MPP’s, due to manufacturing tolerances. This also applies to wind turbines, and applications where wind turbines and PV panels are applied simultaneously. The most efficient way to correct this it to employ an MPPT charge controller on each and every solar panel and wind turbine in the system. However, the most common method is to simply apply one MPP charge controller on the entire solar array and one on the wind generator array.
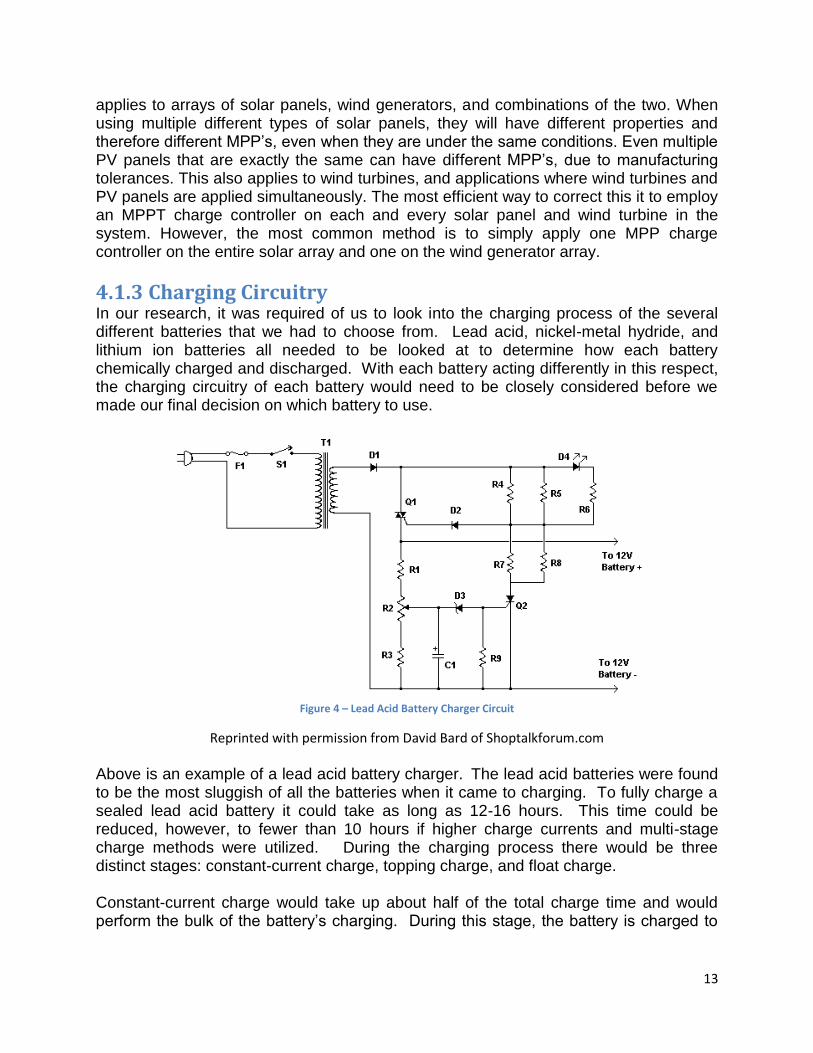
4.1.3 Charging Circuitry In our research, it was required of us to look into the charging process of the several different batteries that we had to choose from. Lead acid, nickel-metal hydride, and lithium ion batteries all needed to be looked at to determine how each battery chemically charged and discharged. With each battery acting differently in this respect, the charging circuitry of each battery would need to be closely considered before we made our final decision on which battery to use.
Figure 4 – Lead Acid Battery Charger Circuit
Reprinted with permission from David Bard of Shoptalkforum.com
Above is an example of a lead acid battery charger. The lead acid batteries were found to be the most sluggish of all the batteries when it came to charging. To fully charge a sealed lead acid battery it could take as long as 12-16 hours. This time could be reduced, however, to fewer than 10 hours if higher charge currents and multi-stage charge methods were utilized. During the charging process there would be three distinct stages: constant-current charge, topping charge, and float charge. Constant-current charge would take up about half of the total charge time and would perform the bulk of the battery’s charging. During this stage, the battery is charged to

14
about 70% of its maximum capacity. This process can last between five through eight hours depending on the charge voltage that is applied to the battery cells. The charging of the battery should transition seamlessly from the constant-current charge stage to the topping charge stage. This stage will complete the remaining 30% of the charging that is needed and can last between seven and ten hours. The current applied to the battery begins to drop as the battery begins to saturate, and the battery is considered fully charged when the current reaches a level that is 3% of the rated current. The final stage for charging a lead acid battery is known as the float charge stage. During this time, a very low current is applied to the battery to prevent self-discharge of the battery due to leakage. A battery that has very high leakage may never reach its saturation point. Because of this, a timer will need to be used while charging the battery to cut off the charge after a specified threshold so as to not accidently overcharge the battery. If overcharging were to occur beyond a voltage that the battery was able to handle then the excess energy inside the battery would be converted into heat, causing gassing within the battery. It is recommended that if the battery does not reach its float charge stage after 48 hours of being in the topping charge stage that the battery be taken off of the charge. These three stages are illustrated in the picture below.
Figure 5 – Lead Acid Battery Charging Stages
Permission pending from Battery University

15
If we were to use a lead acid battery in our final design, there would be a few specific requirements that we would need to follow. First, the area where the battery was located would need to be well ventilated, as the hydrogen gas produced while charging the battery is explosive. Next, we would need to look at the specific charge program for the battery that we choose, as it could be different between the flooded, gel, and AGM batteries that we have looked at. We would then need to make sure that the battery is constantly charged after each use as to prevent the voltage from dropping below its threshold. Finally, the temperature of the battery would need to be constantly monitored, and charge to the battery would need to be cut off if the battery was frozen or if the ambient temperature of the battery exceeded 120° F (49° C).
Figure 6 – Nickel-Metal Hydride Battery Charger Circuit
Permission pending from circuitsuggest.com
An example of a nickel-metal hydride battery charger is shown above. Nickel-metal hydride batteries have different charging methods than that of lead acid batteries. It should first be noted that most of the nickel-metal hydride batteries tend to charge much quicker, as the charge time at a 1C charge rate is generally around only one hour long. The difficulty of charging a nickel-metal hydride battery comes with that fact that it is more difficult to monitor when the battery has reached its full-charge state. Generally, most nickel-metal hydride chargers use a combination of methods to monitor the battery’s charge. Below is an illustration of the charging characteristics of a nickel-based battery.

16
Figure 7 - Charging Characteristics of a Nickel-Metal Hydride Battery
Permission pending from Battery University
The most preferred method for nickel-based chargers is known as Negative Delta V (NDV). Through NDV, the microcontroller in the system measures a voltage drop in the charger. This is a defined voltage signature that occurs when the battery has reached full capacity. It is the most accurate method when it comes to measuring most nickel-based chargers. A specific problem with nickel-metal hydride batteries is that the voltage drop experienced when the battery has reached full charge is very minute, and the microcontroller must respond to a drop of 5mV per cell. Because of this extremely low voltage drop, the charger must include electronic filtering, which would account for noise and voltage fluctuations within the battery and the charger. Because this method is not fully reliable, our charger would need to include other monitoring methods in order to detect when the battery is fully charged. Other methods that can be combined with the NDV method to detect a full battery charge include setting a voltage plateau, monitoring the temperature of the battery, monitoring the change in temperature of the battery, and incorporating a charge timer. The voltage plateau can be used to shut off the charge when it has reached a certain voltage level, but this is a rough estimate of the battery’s charge state. The outside temperature of the battery can also be used to indicate when a battery is at full charge. Over charge can occur from this method, however, as the internal temperature of the battery is warmer than the skin. A more secure method is to monitor the rate of temperature change over time and to use a set threshold to cut off the charge. If the threshold rate is never achieved, then at that point the temperature of the battery could

17
be used as an alternative. Finally, if none of these methods are ever utilized by the charger as a shut off point, then an absolute timer can be used to cut off the charge and prevent over charging. All of these methods combined, though complicated to implement, would be the most ideal way to monitor when the nickel-metal hydride battery has reached its maximum charge.
Figure 8 - Lithium Ion Battery Charging Circuit
Image obtained from http://electronics-diy.com/electronic_schematic.php?id=680
Above is an example of a lithium ion battery charger. Unlike other batteries, lithium ion batteries’ charging and discharging process is not a chemical reaction. Instead, it is attributed to the movement of energy between anode and cathode inside the battery. Despite this fact, however, lithium ion batteries, just like all other batteries do still experience performance loss over time. Lithium ion batteries are less complicated than nickel-metal hydride batteries when it comes to charging, and are more similar to lead acid batteries. The lithium ion batteries differ from lead acid batteries in the fact that they do not have a float charge stage and the cut-off voltages of lithium ion batteries are more strictly set. This is to prevent overcharging, which would be catastrophic for the lithium ion batteries. Similar to lead acid batteries, the initial bulk charging stage of lithium ion batteries will charge the battery to about 70% capacity. This is done at a charge rate of 0.5C to 1C, and the lithium ion batteries generally have a charge time of three hours. These batteries are considered full once the threshold voltage has been reached and the current drops to 3% of the rated current. Another method to determine if a lithium ion battery is fully charged is to monitor when the current levels off, as elevated self-discharge may prevent the battery from reaching its threshold voltage. Below is the current and voltage signature of a lithium ion battery in its charging stages.

18
Figure 9 – Charging States of Lithium Ion Battery
Permission pending from Battery University
Lithium ion batteries also experience a second stage of charging after the battery is charged to 70%. This topping charge stage, however, does not always charge the battery to max capacity. This is to prevent overcharging in the battery, as lithium ion batteries become very stressed when they go over the threshold voltage. This, combined with the fact the lithium ion batteries can operate at voltages below their maximum, makes it unnecessary and undesirable to fully charge a lithium ion battery to its threshold voltage. Though this will result in a lower runtime of the battery, it will increase the overall life of the battery. Though it is not desirable to overcharge any battery, lithium ion batteries are particularly dangerous when the voltage passes the threshold. From prolonged charging, the cathode material of the battery will begin oxidizing, become unstable, and start producing carbon dioxide. Cell pressure also begins to rise, and may result in the eruption of a safety membrane, possibly leading to the battery catching on fire. Under these conditions, there is a threat that the battery will explode. Though most batteries could experience these conditions, lithium ion batteries are more susceptible to them, and would thus require the utmost attention while charging if used in our final design. The charging process of each of the lead acid, nickel-metal hydride, and lithium ion batteries, though discussed in detail above, will need to be further looked at once a battery is picked for the final design. Our group will need to look at and fully understand the charging procedure specified for the battery by the manufacturer and will need to act

19
according to those guidelines. With proper and responsible practices in charging the battery our group will save time and money from buying a new battery and will avoid all potential injury. In order to properly capture as much gathered energy as efficiently as possible a charging circuit would be needed to take the energy generated by the wind turbine and the solar cells and be able to store it into the later specified battery. Because the goal of the project is to retain as much generated power as possible for use during a scheduled power outage efficiency in the charging circuit is a major concern that deserves a great deal of attention. Many variables must be accounted for when looking into what kind of charging circuit should be utilized for the project such as how fast the charging circuit can deliver a charge, how much heat will need to be dissipated for the process to work, and general safety concerns to ensure the battery does not become critical due to an instable charging circuit. The specifications for various chargers were looked at for a multitude of different generators and the pros and cons of each were weighed in the decision on which charging circuit to implement for the project. Firstly it was to be determined what kind of processes were needed for any charging circuit for any kind of battery. This would be crucial in understanding the requirements that would be needed when choosing a charging circuit for the project. These processes include four stages of a battery charging system that include the bulk stage, absorption stage, float stage and the equalization stage. The bulk charge stage was the first to be looked at and studied out of the four processes. From the bulk charge stage of the charging process the majority of the energy being supplied to the battery was being delivered, up to ninety percent of the battery’s capacity. This stage also took up the majority of the recharge time in the charging process. This stage is characterized by current being sent to the battery as quickly as it can be delivered. This brought about the most concern for choosing a charging system as it would be crucial that the bulk stage of the process would need to be paramount however great care would be needed to observe the surge of amperage being poured into the battery during the charging process. Although the battery is gaining the majority of it’s’ charge at this stage careful observation must be made to ensure that the battery is not being overcharged from the amperage being supplied to it. An overcharge to a battery can create a dangerous scenario that could cause great harm to the battery itself as well as anyone standing is close proximity if the battery were to go critical and explode. In most cases the bulk stage of the battery ceased when a voltage of approximately fourteen volts was measured. As previously stated the bulk stage of the charging process does not last forever and is typically determined by observing variables such as how depleted the battery is, the Amp/Hour rating of the battery, and the maximum recharge rate of the battery. For example if a battery had an Amp/Hour rating of two hundred and the battery was depleted by fifty percent. Then the battery depletion would be one hundred amps. The maximum recharge rate at this point could be calculated from the amp hour rating of two hundred divided by a battery limit ratio of twenty amps charging for every one hundred

20
amp/hour rating which would give us a maximum recharge rate of forty amps for this example. The time period of the bulk stage could then be determined from one hundred and twenty percent of the charge depletion depth divided by the average recharge rate. This would give a time period of three hours for the bulk stage of the charging process. The second stage that was observed and studied for charging circuits is known as the absorption stage. This is characterized by when the charger for the battery keeps a constant voltage set on the positive and negative terminals of the battery. Slowly as the internal resistance of the battery begins to grow as it nears full capacitance the current supplied to the battery is decreased. For the specified battery in this project the constant voltage at this stage in the recharging process would be between thirteen and fourteen volts and would be the highest constant voltage in the recharge process would be at its’ zenith in this stage. At the end of this stage the battery would have been brought from around ninety percent capacity to one hundred percent capacity. Now that the battery has been brought to full capacity the remaining two stages would be for maintaining and reconditioning the battery. The third stage that was observed and studied for charging circuits is known as the float stage of the charging process. It is characterized by a very low voltage being supplied to the battery in order to provide a small but constant maintenance charge in order for the battery to remain at maximum capacity. Over time the battery has a natural self-discharge that although small is indeed measurable. To prevent this, a current less than an amp is supplied to the battery to allow the battery to replenish itself as it slowly self-discharges. Many batteries do not require a float stage in their charging process because of an extremely slow self-discharge rate, however it was a variable in choosing a charging system that was felt deserved due consideration none the less since all batteries succumb to some type of self-discharge in their lifetime. The fourth and final stage that was observed and studied for the charging circuits is known as the equalization stage of the charging process. This stage is characterized by an attempt by the charger to equalize the voltage in the various cells of a battery. This is accomplished by applying a voltage slightly higher than the constant voltage measured in the absorption stage and the placed across each individual cell inside of the battery. Many chargers implement this as part of their charging cycle as an attempt to prevent a buildup of minerals such as sulfate on the plates within the battery that would decrease the life of the battery. Implementing an equalizing state ensures a longer battery life as well as all cells within a battery being brought up to the same voltage level. This stage is not as crucial as others, however if a battery is compatible with an equalization process it is highly recommended to include one in a charging system. The following graph illustrates as an example how these processes working together have an effect on the voltages amperages and capacitances within the specified battery in a given scenario. From this graph the different stages can be differentiated from each other and gives an idea of what to expect during testing.

21
With the general understanding of what to look for in a charging circuit we can now look to see how the specified battery will react to the previously discussed charging methods. The battery chosen with a capacity of thirty eight amp/hours would then have a bulk charge state of one hour and thirty minutes with an average charge of twenty five amps to bring the battery from zero percent capacity through the bulk stage of the charging process to around ninety percent capacity. Because of the fickle nature of the generators as they are dependent on ever changing variables the charge time of the generator deployed outside in the elements would also have to take into account the changing charging amperages as well as temperature of the surrounding environment and could greatly fluctuate with a multitude of given circumstances. After the charging current falls below one amp in this state the charging circuit will have to switch over to a constant current of two amps for one hour to complete the charge. The voltage on the battery at this point should be around fourteen volts and will be a satisfactory cut off point for the charging circuit. Because the battery will be stored in the generator for a long period of time a float stage will also be beneficial to the charging circuit to combat the self-depletion of the battery. This will allow the battery to be stored close to full capacity and will be beneficial squeezing as much life out of the battery as possible until it will need to be replaced. The charging circuit will also call for an equalization stage in the process where a current of two amps was applied to the battery for an hour in order to equalize all batter cells in the specified battery. However if the best form of charging circuitry is to be available for use in the project more than just the multi-stage charging system must be looked at. Another method available for use is to utilize what is known as maximum point power tracking or MPPT for short. Initial research showed that at first look the maximum point power tracking system is a great deal more complex than other multi-stage charging systems. Price is also much higher than other conventional forms of charging circuitry. At first look the use of maximum point power tracking did not offer very much appeal however that was soon offset when its’ efficiency rating was determined compared with other charging circuitry. Compared to other charging circuits a maximum point power tracking system has an average efficiency rating above ninety five percent, a good thirty percent more than other charging systems. In order to maximize efficiency a maximum point power tracker does exactly what its’ name implies the electronics inside the charging system track the maximum output coming from a voltage source and also track the voltage across terminals of the charging battery and determine what is the best voltage that should be supplied to that battery to efficiently charge it. Without the use of a maximum point power tracking system the power available to charge the battery can only be determined by the voltage currently across the battery terminals. An example of this would be if you had a depleted battery and the voltage across its’ terminals was ten and a half volts if a turbine was supplying over twenty volts and a current of ten amps only ten and a half of those twenty volts could be used to supply a charge to the battery supplying only one hundred and a half watts out of the potential

22
two hundred available to the battery. The use of a maximum point power tracking system would be able to raise the input voltage and current supplied to the battery to deliver around one hundred and four watts instead of the initial one hundred and ten watts without a maximum point power tracking system. That yields an efficiency rating of around ninety seven percent for the maximum point tracking system. The relationship between output of an example PV array battery charging system and the wasted power involved in the power transfer can be seen in the figure below.
Figure 10 - MPPT Characteristic Graph
Permission pending from Electropaedia
A maximum point power tracking system would be able to take the characteristics of the example PV array and determine its’ maximum point and use that for an optimized charging system. The maximum point power tracking system can take what inputs are available to it and combine them in a way to where the most efficient use of energy is able to pass through it. As it is seen above with the blue and orange lines of the graph where the blue line shows the voltage and current available to the maximum point power tracking system. After the maximum point power tracking system is able to take these inputs it is able to develop the green line which is a combination of the input voltages and currents and from that green line determine where the most efficient use of power is for the charging battery.
4.1.4 Power Inverters There are two widely used types of power inverters today; the modified sine wave inverter and the pure sine wave inverter. Both types operate by performing two basic steps. The first part of the power conversion process is to transform the direct current coming from the battery into an alternating current. Nowadays this is typically done with transistors or logic devices, but the first power inverters were made with

23
electromagnets. By choosing the correct parts here, the frequency and shape of the output can be chosen. The second part of the conversion is to step the voltage up or down using transformers. In this case, the power inverter will be converting 12 VDC to 120 VAC at 60 hertz, which is the standard form provided by the electricity grid here in the United States. When this device is implemented in Japan, the power inverter will have to be changed out for one that converts 12 VDC to 100VAC at 50 hertz, as this is the standard form provided by the electricity grid in Tokyo. The modified sine wave inverter is the less desirable of the two types, mainly because of its lower efficiency and the possibility that it could interfere with some sensitive electronics such as TV’s, motors, and medical equipment. There is also a small risk of damage to electronics powered by such an inverter as they have been known to have brief jumps in current. The signal from a modified sine wave inverter is sometimes referred to as hybrid, meaning in this case that it is a mix between a sinusoidal and a square wave. In order to create such a signal, these inverters simply supply various DC voltages for specified time intervals in a repeated staircase like climbing and descending fashion. On the other hand, the signal provided by a pure sine wave inverter is exactly what the name says, a perfect sine wave. This is exactly the same type of signal that is provided by the power grid, and it virtually eliminates the possibility of interference or damage to connected electronics. Because of its signal, a pure sine wave inverter is usually also slightly more efficient than a comparable modified sine wave inverter. Most modified sine wave inverters have conversion efficiencies between 85% and 90%, but pure sine wave inverters usually have slightly over a 90% efficiency rating. The figure below shows the difference in the signals provided by the two different inverter types. As always, there is a cost for the better characteristics of pure sine wave inverters. The construction and circuitry is much more complex, and they generally cost about three times as much as a comparable modified sine wave inverter.
Figure 11 - Modified Sine wave inverter signal vs. pure sine wave inverter signal
Permission pending from Solar Energy At Home
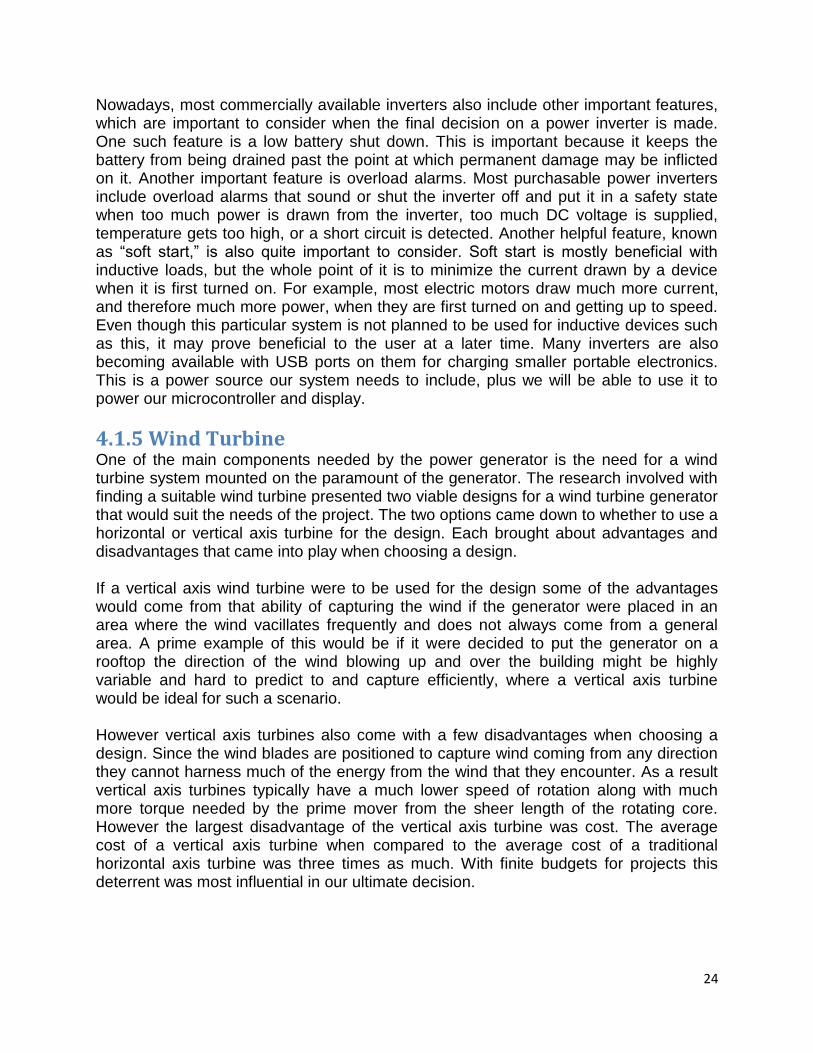
24
Nowadays, most commercially available inverters also include other important features, which are important to consider when the final decision on a power inverter is made. One such feature is a low battery shut down. This is important because it keeps the battery from being drained past the point at which permanent damage may be inflicted on it. Another important feature is overload alarms. Most purchasable power inverters include overload alarms that sound or shut the inverter off and put it in a safety state when too much power is drawn from the inverter, too much DC voltage is supplied, temperature gets too high, or a short circuit is detected. Another helpful feature, known as “soft start,” is also quite important to consider. Soft start is mostly beneficial with inductive loads, but the whole point of it is to minimize the current drawn by a device when it is first turned on. For example, most electric motors draw much more current, and therefore much more power, when they are first turned on and getting up to speed. Even though this particular system is not planned to be used for inductive devices such as this, it may prove beneficial to the user at a later time. Many inverters are also becoming available with USB ports on them for charging smaller portable electronics. This is a power source our system needs to include, plus we will be able to use it to power our microcontroller and display.
4.1.5 Wind Turbine One of the main components needed by the power generator is the need for a wind turbine system mounted on the paramount of the generator. The research involved with finding a suitable wind turbine presented two viable designs for a wind turbine generator that would suit the needs of the project. The two options came down to whether to use a horizontal or vertical axis turbine for the design. Each brought about advantages and disadvantages that came into play when choosing a design. If a vertical axis wind turbine were to be used for the design some of the advantages would come from that ability of capturing the wind if the generator were placed in an area where the wind vacillates frequently and does not always come from a general area. A prime example of this would be if it were decided to put the generator on a rooftop the direction of the wind blowing up and over the building might be highly variable and hard to predict to and capture efficiently, where a vertical axis turbine would be ideal for such a scenario. However vertical axis turbines also come with a few disadvantages when choosing a design. Since the wind blades are positioned to capture wind coming from any direction they cannot harness much of the energy from the wind that they encounter. As a result vertical axis turbines typically have a much lower speed of rotation along with much more torque needed by the prime mover from the sheer length of the rotating core. However the largest disadvantage of the vertical axis turbine was cost. The average cost of a vertical axis turbine when compared to the average cost of a traditional horizontal axis turbine was three times as much. With finite budgets for projects this deterrent was most influential in our ultimate decision.
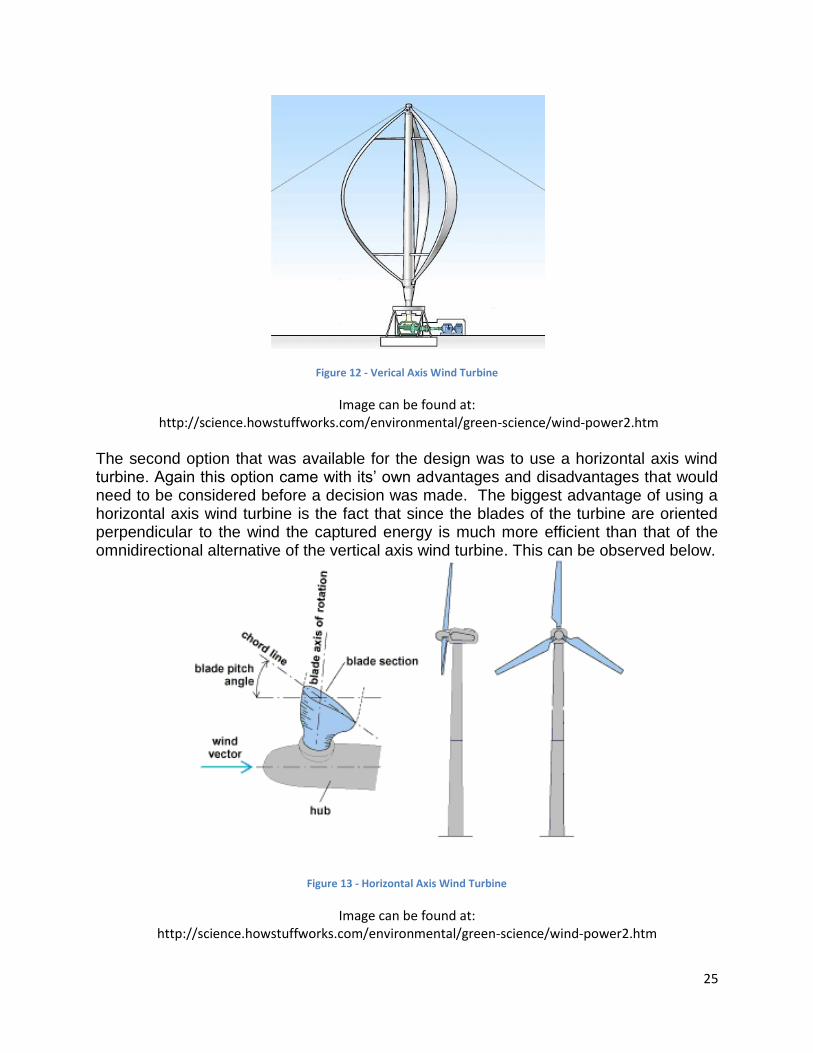
25
Figure 12 - Verical Axis Wind Turbine
Image can be found at: http://science.howstuffworks.com/environmental/green-science/wind-power2.htm
The second option that was available for the design was to use a horizontal axis wind turbine. Again this option came with its’ own advantages and disadvantages that would need to be considered before a decision was made. The biggest advantage of using a horizontal axis wind turbine is the fact that since the blades of the turbine are oriented perpendicular to the wind the captured energy is much more efficient than that of the omnidirectional alternative of the vertical axis wind turbine. This can be observed below.
Figure 13 - Horizontal Axis Wind Turbine
Image can be found at: http://science.howstuffworks.com/environmental/green-science/wind-power2.htm
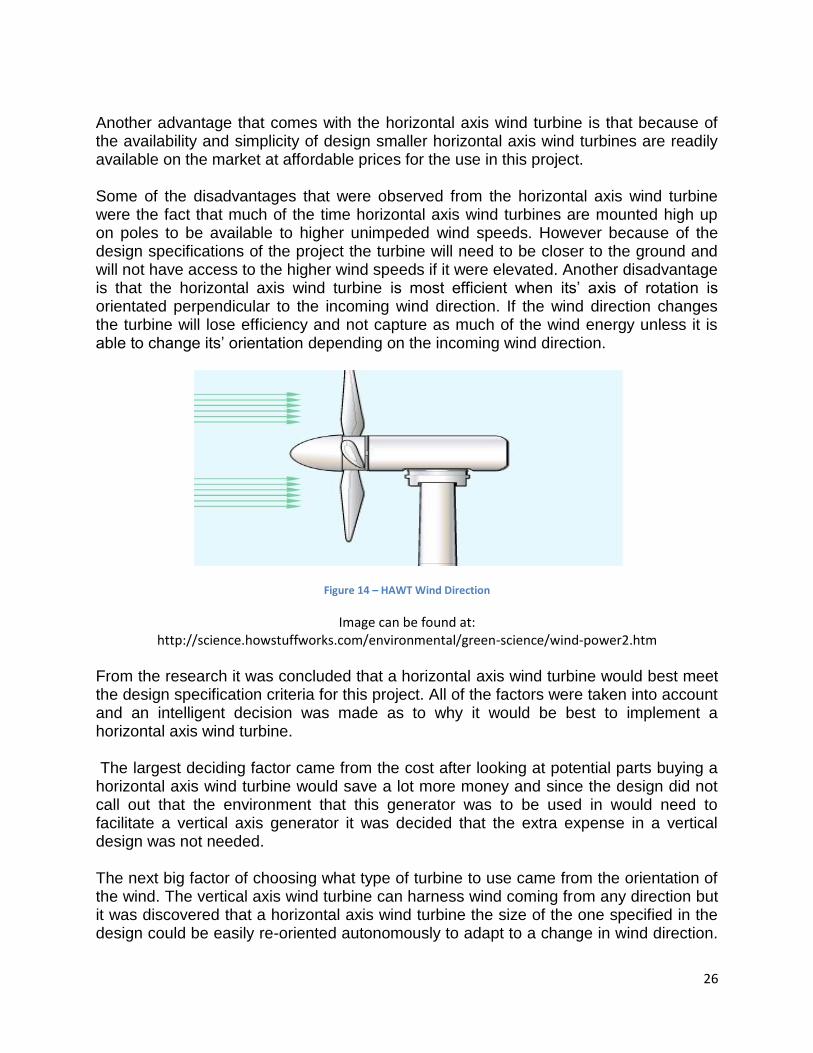
26
Another advantage that comes with the horizontal axis wind turbine is that because of the availability and simplicity of design smaller horizontal axis wind turbines are readily available on the market at affordable prices for the use in this project. Some of the disadvantages that were observed from the horizontal axis wind turbine were the fact that much of the time horizontal axis wind turbines are mounted high up on poles to be available to higher unimpeded wind speeds. However because of the design specifications of the project the turbine will need to be closer to the ground and will not have access to the higher wind speeds if it were elevated. Another disadvantage is that the horizontal axis wind turbine is most efficient when its’ axis of rotation is orientated perpendicular to the incoming wind direction. If the wind direction changes the turbine will lose efficiency and not capture as much of the wind energy unless it is able to change its’ orientation depending on the incoming wind direction.
Figure 14 – HAWT Wind Direction
Image can be found at: http://science.howstuffworks.com/environmental/green-science/wind-power2.htm
From the research it was concluded that a horizontal axis wind turbine would best meet the design specification criteria for this project. All of the factors were taken into account and an intelligent decision was made as to why it would be best to implement a horizontal axis wind turbine. The largest deciding factor came from the cost after looking at potential parts buying a horizontal axis wind turbine would save a lot more money and since the design did not call out that the environment that this generator was to be used in would need to facilitate a vertical axis generator it was decided that the extra expense in a vertical design was not needed. The next big factor of choosing what type of turbine to use came from the orientation of the wind. The vertical axis wind turbine can harness wind coming from any direction but it was discovered that a horizontal axis wind turbine the size of the one specified in the design could be easily re-oriented autonomously to adapt to a change in wind direction.

27
This could be facilitated with the use of pivots and slip rings around the base of the turbine to allow for rotation and a wind foil located on the aft of the turbine to catch the changing wind direction. All of these modifications combined would allow the turbine to move and rotate with the wind to always allow the horizontal axis wind turbine to be oriented perpendicular to the wind. Next it was decided where best to deploy such a generator since the design resources specified Waseda University in Shinjuku-ku, Japan it was determined what the average wind resources were in that location of the world and if at a later date other locations were chosen the following data could be used as a base point in making that decision. The map in figure shows those wind resources and the location of Shinjuku-ku, Japan has been denoted with a red dot to give a sense of perspective on where the generator is being deployed.
Figure 15 – Wind Intensity Map
Reprinted with permission from ABC Media, LTD
4.1.6 PV Cell Arrays Sunlight energy is a very easy source of power to harness. It can be accessed from anywhere in the world and most of our solar system. Some places in the world get more sunlight than others but all areas can receive energy from the sun. We decided to use solar panels as one of our primary source of energy. We chose this because since our box will be used outdoors it is the best way to harness energy since sunlight is available almost anywhere in the world. They are many sources of energy that we could have used but solar had the least drawback.

28
Figure 16 - Global Sun Exposure Map
Reprinted with permission from the Center for Global Development
Hydropower was an option but we needed a running stream to harness this energy. There is a high probability that the user will be in an area that a running source of water will not be available so there is no reason to use this as a primary source of energy. In our design we will be using Solar Panels to charge our battery. These panels output 12 volts, which we will use to charge the battery by using sunlight. They will be mounted on our box in such a way to optimize sunlight. They will have a buffer that connects between them and the battery. This is important because we don’t want power to be lost if the battery is low by returning back to the solar panel. There will be a buffer to keep the energy flowing in one direction and not back to the other direction. We found that they are many different types of solar panels. Some of the types of panels that we ran into are included mono-crystalline, polycrystalline, amorphous, and finally a non-silicon solar panel named Copper Indium Gallium de-Selenide (CIGS). In the later sections we will discuss the different types of solar panels and why we chose one over the other. The first type of solar panel we came across was mono-crystalline. These had high outputs but were very expensive to implement. The output of these types of panels were a bit higher than the others ranging up to 20% more efficient. The process these panels are made make them a very expensive option usually ranging in prices from $800.00 for a panel that produces 130 watt of power. One of the main advantages of this type of panel is it has very low to no maintenance. Because of this, the panels are usually more expensive than other types of solar panels. These panels are made from a very pure crystal ingot, which must be purified by using a process that is expensive as well as making the product very fragile and would not work well with our project since we need
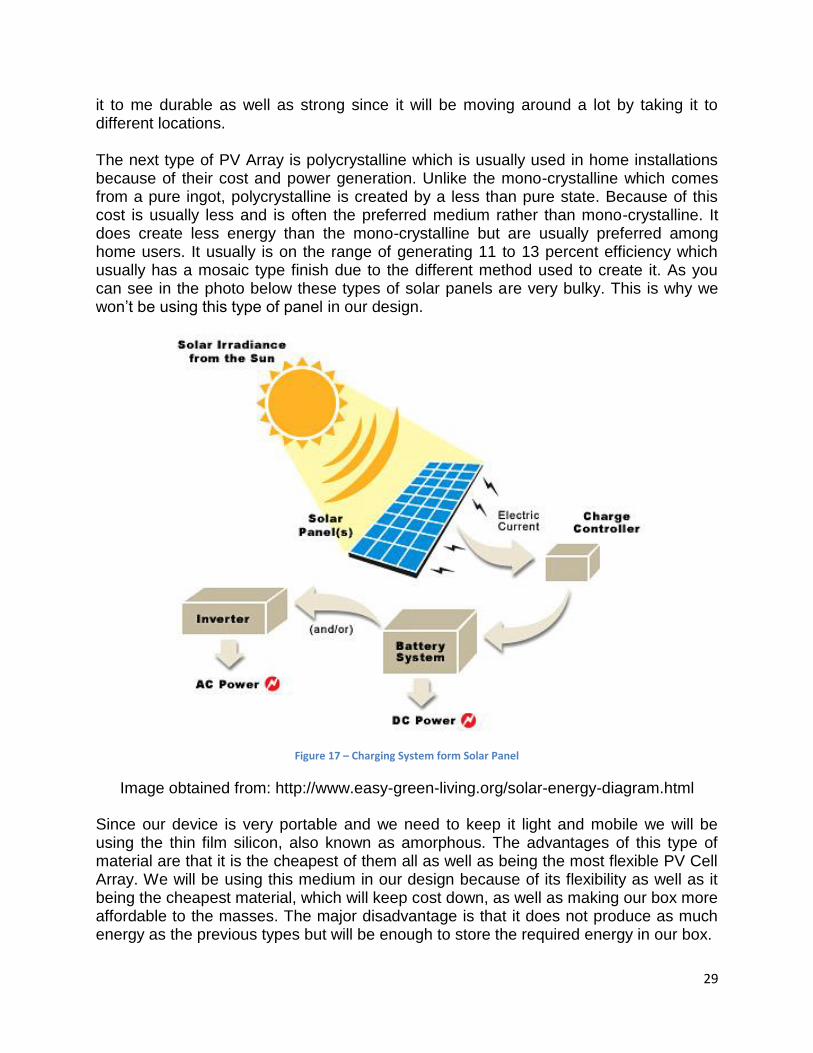
29
it to me durable as well as strong since it will be moving around a lot by taking it to different locations. The next type of PV Array is polycrystalline which is usually used in home installations because of their cost and power generation. Unlike the mono-crystalline which comes from a pure ingot, polycrystalline is created by a less than pure state. Because of this cost is usually less and is often the preferred medium rather than mono-crystalline. It does create less energy than the mono-crystalline but are usually preferred among home users. It usually is on the range of generating 11 to 13 percent efficiency which usually has a mosaic type finish due to the different method used to create it. As you can see in the photo below these types of solar panels are very bulky. This is why we won’t be using this type of panel in our design.
Figure 17 – Charging System form Solar Panel
Image obtained from: http://www.easy-green-living.org/solar-energy-diagram.html
Since our device is very portable and we need to keep it light and mobile we will be using the thin film silicon, also known as amorphous. The advantages of this type of material are that it is the cheapest of them all as well as being the most flexible PV Cell Array. We will be using this medium in our design because of its flexibility as well as it being the cheapest material, which will keep cost down, as well as making our box more affordable to the masses. The major disadvantage is that it does not produce as much energy as the previous types but will be enough to store the required energy in our box.

30
Figure 18 - Thin PV Cell Array Flexibility
Reprinted with permission from First Solar
As you can see from the picture it is a very thin material so we can bend it and in some cases cut it to the desired shape needed to put on the box. We will be adding this material to every possible area such that it can be optimizing the sunlight. Finally the last type of material used for solar energy that we can discuss is the CIGS. This material is still in its developmental stages but it is a very good prospect of a PV array. The material is sprayed on a surface and it is then used to conduct electricity. This form can take many shapes and fit in almost any area but as of right now we had to rule it out of our design. The reason is it is still in the experimental area and we think that it is far out of reach of our design project. It would be a good idea to use this material but since it is in developmental stages we went with something more concrete. Thin Film Array is very widely used in projects all over the world. It is used in many electronics including solar powered calculators. Since it is very flexible it would make a great design idea to implement in our design. It will be placed on the exterior of our case and will be used to optimize sunlight. There are many things that would affect the performance of the solar panels. One of the main things that will affect our project will be temperature because the hotter the panel gets the less energy is produced.

31
Figure 19 - Current vs. Voltage at Different Temperatures
Permission Pending form Matrix Energy
As you can see in the graph above you can see that at higher temperatures the voltage starts dropping rapidly and at lower temperatures it gets to a higher voltage. Because of this, we will have to try to keep the panels as cool as possible. This will be a task because for the panel to work it needs to be in direct sunlight. We will explore ways to keep the panel cool as well as absorbing the sunlight such that we can maintain a very high and cost effective system. We will be using mirrors to direct more sunlight at the solar panels since it depends on where the sun is in the sky it can cast a shadow on part of the solar panel. Since this might be an issue we will also be adding mirrors to direct the lost light back into the solar panel. They are many different types of panels, which output different voltages for different applications. Since we are using a 12-volt battery we are going to also have to pick a panel, which outputs a voltage of 12-volts. The panels will also have to wire in parallel such that we don’t double the voltage by each panel that is added respectively. The panels will also have to match the Voc because if we do not we will have voltage fluctuations and it will not charge the load correctly. The panel will be best used in areas where sun is highly available. Sun is a very important creator of energy and will contribute to creating 50 percent of the energy to charge our battery. We will also have wind power, which will be discussed, in a different section.

32
Figure 20 - Thin Film Array Panel Layers
Reprinted with permission from IEEE Spectrum
As you can see in the figure above the solar panel is made up of layers. There is a think transparent layer that coats the panel. This is the conducting coating it acts as a protective layer and also is a reflective material that lets the useable light into the array. The array cannot use all forms of light. As you know visible light is made up of many colors and it cannot use some of the spectrum of light. This light is usually not able to penetrate this layer and is sometimes reflected back. The transfer of energy happens in the substrate. This is where the electrons are transferred to the output storage device.
4.1.7 Power Calculation Sensors In order to calculate the power being used by a device, there are two quantities that must be known; Voltage at the devices terminals and the current draw of the device. When this knowledge is applied to this particular application, it is noticed that the power to all loads of the battery will be at least initially supplied with the instantaneous voltage of the battery. These loads include the power inverter and the cigarette lighter socket. Even though the power inverter will eventually power the 120VAC outlets, the USB charging port, and the microprocessor, all of this power will initially be supplied through the connection between the inverter and the battery. This means we simply need to know the current in the leads to the power inverter and the instantaneous voltage of the battery. In order to sense the voltage at the battery, a simple voltage divider circuit can be employed to drop the voltage swing from the 10.5 – 13.5VDC range to the 0 – 3VDC range. This will enable the voltage to be read at the analog inputs of the microprocessor, as most microprocessors read in analog voltages between 0 and 5VDC. The voltages can then be scaled back up mathematically in the programming of the power calculation. This method of measuring the voltage at the battery can also be used to calculate the charged state of the battery. Since voltage and percent charged

33
have a linear relationship, all we need to know to calculate the percentage of battery charge remaining is what the maximum, minimum, and instantaneous voltages of the battery are. This graph of the battery terminal voltage vs. percentage of battery charge remaining for the Optima yellow top D51 battery can be seen below. For example, if the battery voltage is measured to be 11.5V, there is approximately 40% of the batteries charge still remaining.
Figure 21 - Battery Terminal Voltage vs. Percentage of Battery Charge Remaining
To sense the current, there are a few different possible methods. The first possible method is to use a Hall Effect sensor. A Hall Effect sensor uses the magnetic field created by the current within the wire to calculate the current running through the wire. This value is then output by the sensor in the form of a DC voltage. The current can then be mathematically calculated from this voltage within the program of the microcontroller. Different Hall Effect sensors have different relationships between their output voltages and the current they sense in the wire. The second possible method is to put a shunt resistor in series with the load and use a current sense amplifier to increase the voltage drop across this resistor to a value that is readable by the microcontroller. This is typically done on the high side of the load, but it is possible to also use this method the low side of the load. The charts below detail the advantages and disadvantages of both low side and high side sensing.
10
10.5
11
11.5
12
12.5
13
13.5
0 5 10 15 20 25 30 35 40 45 50 55 60 65 70 75 80 85 90 95 100
Bat
tert
Te
rmin
a V
olt
age
Percentage of Battery Charge Remaining
Battery Terminal Voltage vs. Percentage of Battery Charge Remaining

34
High Side Low Side
Pros Cons Pros Cons
Current sensor is directly connected to the power source, and can therefore detect a downstream failure right away so corrective actions can be made
Current sensor must withstand higher voltages
Easy to implement, usually with just an op amp and a shunt resistor
Adds resistance to the ground path
Current sensor won't increase the resistance to the ground
Cheap and very precise
Figure 22 - Comparison between Placing a Current Sensor on the High Voltage Side of a Load vs. the Low Side
Hall Effect sensors are in general much easier to set up and use, as there is no soldering required. Just connect the power wire to the battery, run it through the sensor, and then connect the remaining end to the load. On the down side, these types of sensors are usually bulky, and must be bolted down to a solid location. On the other hand, shunt resistor current sensor circuits can be a bit more complex. First, the correct resistance must be chosen for the shunt resistor, and then the correct amplifier must be chosen as well. Then the two components must be soldered in series with the load. These shunt resistor current sensors do however take up much less space, and could possibly even be implemented directly on the microcontroller PCB.
4.1.8 Displays They will be using a serial LCD made by Monochrome in our design. Some of the many advantages of this LCD display is that it uses an onboard PIC tells the display to show alphanumerical characters rather than printing to a seven segment display. It also uses very low power which will be essential to this design since they are looking to optimize energy stored in a battery. Some of the features that they will be using with this LCD are the brightness display as well as the on/off feature. It also uses very low power and features can be turned on and off where they see fit. This LCD display can store up to
Figure 23 - SparkFun LCD Display
Image obtained from: http://ronczap.home.insightbb.com/

35
80 characters on one single display. The backlight can handle up to 1 A current to light the screen. It can be assumed that this will be at maximum brightness. It will also have a splash screen, which will show some kind of logo, or lettering that we plan on branding our design. In our design we will incorporate a 40% brightness. The less power we use on the backlit screen we can save to run other features or save power overall. The screen will be powered by a 5 volt serial connection connected to a MSP430 which will be used to monitor the system. On the screen we will show items that include but not limited to: Power consumption, Charge left in battery, time until shutdown, recharge rate compared to discharge rate in percent. The LCD screen will display to the user information about the system as well as information of perceived events if the current usage/charging keeps up. It will display the message "Power Consumption: XXXXX Watts" where XXXXX is the total power usage at that particular moment. We will also be using buttons some of them will be intended to save more power by turning off the display as well as turning it back on. Charge on the battery will show how much battery is left before complete discharge in a percentage, the message will read "Battery Percentage Remaining: XXX%", where XXX is the percentage from 0 to 100. Another message that will be displayed is the time until shutdown. There will be an algorithm used to calculate a future time by using the power consumption and charging to calculate when the device will run out of power and shut down. The message will read "Charge time remaining before discharge XX: XX" were XX: is the hours remaining on the battery and :XX is the minutes remaining on the battery. There will also be an incorporation of power in compared to power out. This feature will let the user know if they are drawing more power that is coming in or vice versa. If the user is drawing less power that what is coming in the message that will be displayed is, “You are using no stored energy". If the user is using more power than what is coming in the message will display, "You are using current and stored energy". To control all of these features we will be using buttons to flip through the various messages. The buttons that we will be using will be used to interact with the LCD screen. One of the buttons will be used to scroll through the options that have been previously described. There will also be a timeout after a certain amount of time which will cause the screen to go dark to save power. We estimate the power saved will be small but when increasing efficiently saving power in small amounts all over the system will end up being exponentially increased throughout the process. There will also be a button to turn off and on the screen manually incase the user does not want to wait until time timeout to save more energy. The screen will light back up and blink a sequence when the power is low to let the user know that the battery is almost discharged and inform the user that there will be a need to connect to a different power source unit before complete shutdown. I estimate 10 minutes before would be sufficient enough to let the user know about the situation. If the user ignores this we will then send out another alert when there is 5 minutes of battery left and a final alert when 2 minutes of battery is left.

36
Figure 24 - Backlight Brightness for LCD Screen
In figure 28 you can see that there are many operations of the LCD screen brightness. We will be using value 128 to turn off the LCD screen and will operate it at 140 values which are mapped to 40% brightness. As you can see you can map the whole range with this LCD screen by mapping the value between 128 and 157 inclusive. The LCD will be connected in serial as in the figure below you can see the serial connection that it will make with the MSP430. We are using a low power microcontroller to save power for the other operations of the power system. This LCD interfaces with the MSP430 which we have tested with by writing a test program and seeing if the LCD will be able to interface with the MSP430. In the figure below you can see the serial connection that the MSP430 will make with the display this we will also incorporate the buttons which will change the display and turn it on and off. This is an important factor in making our display multifunctional as well as making it user friendly so that a novice user can use it without any problems.
Figure 25 - Serial Connection on LCD
Reprinted with permission from ITead Sudios

37
All of the settings will be stored on the LCD display in the EEPROM chip. This will store the configuration of the display as well as its timeout feature. We will also store in that chip how we want the characters to be displayed. We will be using a 20 character wide format which will display the characters on the screen a little smaller than we wanted to but we will try to condense the material to show on a 16 character wide display to make it more readable for the users. To turn on and off the display we will be using pin 15 to turn off and on the display when it is not in use. This LCD chip needs 5 volts to work There are thousands of different LCD screens on the market we chose this one because it has a very low power consumption. It also has the ability to turn on and off the backlight. Price was also an option that we had to consider. We needed a display that was cheap as well meet all the demanding requirements that we need to make all of these requirements work. There is also a communication protocol that is easy to understand and is compatible with many other protocols that are on the market. The reason we didn’t choose a graphical LCD was because we are trying to optimize power and cost and using a graphical display will cost more money as well as consume more power as the one we are using. The operating temperature of this LCD display is very important because the solar panels will draw heat which will cause the box temperature to get somewhere in the range of 80oF to 90oF. Due to this issue we will need to choose a LCD that will have a high operating temperature so that it can deal with the heat. Also location will play a very important role in this because there will be places on the box where heat will be high and places that it will be lower. The electrical components and chips will be placed lower in the box due to the fact that heat rises and the bottom will be cooler than the top because of this physical property of heat.
4.1.9 Microcontrollers Microcontrollers, which are small computers on integrated chips, are commonly used in embedded applications. They include a processor core, memory, and input/output peripherals, and are usually used to accomplish dedicated and/or specific tasks. Examples of devices that use microcontrollers include automobile engine control systems, appliances, power tools, toys, and implantable medical devices. Since most microcontrollers are able to operate at clock rates as low as 4 kHz and draw only nanowatts worth of power while sleeping they are very useful for applications that require long term battery usage. One of the most common uses of microcontrollers is with LED or LCD displays. As it is our desire to use an LCD display in our design, a microcontroller would be used to program the display. As it is our desire to only incorporate a very basic user display system in our design, it would not be a hard task to program the microchip for this purpose. Furthermore, other specific tasks that we may wish to accomplish in our final design may also require a separate microcontroller. This would mean that our final design would include multiple microcontrollers. Below is an illustration of how an LCD display would be connected to a microcontroller.

38
Figure 26 - LCD/Microcontroller Interconnection
The function of a microcontroller is to take real world or user input and to express the results of its program as an output. This is done through both the input and output pins on the side of the microcontroller. The program that executes within the microchip will need to be written by our group for our specific purposes. Common lower level programming languages that this task can be accomplished in include Assembler, C, and BASIC.
Another function that the microcontroller could perform would be the power usage and battery charge state calculations. Taking input from sensors connected to the charge controllers of the incoming power supplies, the microcontrollers would be able to monitor all incoming power. Next, the microcontroller would be able to measure the amount of energy being used within the entire system. This information could then be fed to the LED display, informing the user of the power usage and how much time the battery has left while running any applications hooked up to the system. There are a couple attractive qualities of microcontrollers that make them a realistic component to include in our design. One such aspect is the fact that microcontrollers are relatively cheap; ranging from $1 to about $15 for low level microcontrollers. At this price, it is extremely easy for our group to budget for one or multiple microcontrollers if needed. Also, since microcontrollers are relatively small, our design will not be altered drastically by the addition of one or more microcontrollers.

39
In selecting our microcontroller, there are a few aspects that we have to take into consideration for our design. First off, the microcontroller should be easily programmable. This will help us avoid wasted time on a microcontroller that is more difficult than necessary to program. Also, as the needs of our LED display will undoubtedly change during the testing phase, it will be necessary for the microcontroller to be reprogrammable, and not a one-time programmable chip. Finally, we will need to be sure to pick out both a microcontroller and an LCD display that are compatible with one another. In our research, it is necessary to look at several of the available microcontrollers side by side so that we may choose one that is most ideal for our uses. With the plethora of information regarding the many different microcontrollers we have to choose from, it should be an easy task to find one that suits our needs. Below, we will discuss in detail the microcontrollers that we looked at in our research and which one we will ultimately be using in our final design. Texas Instruments provides a family of microcontrollers known as the MSP430 line. These 16-bit RISC mixed-signal processors are ideal for taking measurements in battery-powered devices. As it is our desire to monitor the power supply remaining in our battery, this feature of the MSP430 microcontroller would prove extremely useful. The power drawn by the MSP430 while active is around 120 µA/MHz @ 2.2 V, and dips down to 0.7 µA/MHz @ 2.2 V or lower while inactive. This low power consumption would work well with our design, as we would not need to worry about it drawing too much power away from the laptop and projector that we will be powering. The MSP430 is also user-friendly, easy to learn, and can be programmed in C. Since Texas Instruments offers over 230 parts for the MSP430 line, there will undoubtedly be a specific part that is ideal for our needs. The MSP430 has a built in clock system and is also capable of being used with external devices and could easily be used to control our LCD user display. With packages between $10-$20 and individual parts as low as $0.50, the MSP 430 is a very affordable option for our group. An Arduino microcontroller is another board that we could consider using in our design. This is an open-source single-board prototyping platform that is designed to be used in electronics for multidisciplinary projects. This microcontroller is also able to use its input peripherals as sensors, enabling it to affect its environment by controlling electronics surrounding it. Arduino microcontrollers are controlled using their own Arduino programming language. Since this language is very similar to C++, however, learning how to program the board using this software would not be a hard task. The board can be powered by an external battery while having a maximum current draw of 50mA. Since boards can be found at under $30, we would have no problem budgeting for an Arduino microcontroller.

40
Texas Instruments also offers another viable option with its Stellaris family of microcontrollers. This line of microcontrollers combines high performance with cost effective pricing. A 32-bit microcontroller from Stellaris runs at roughly the same price as other 8-bit or 16-bit microcontrollers. Included in the Stellaris family is over 140 different members that are based on the Cortex –M3 technology from ARM. The Stellaris microcontrollers are also capable of both monitoring and converting power and energy. For ease of use, Texas Instruments allows the user to program the microcontroller in C/C++. Power consumption for the Stellaris line of microcontrollers can run as low as 1.6µA while the microcontroller is in stand-by mode.
With these microcontrollers to choose from, we have decided, at this time, to go with the MSP430 Microcontroller because of its very low power consumption. This will be written using the C/C++ programming language. The reason why we have chosen this programming language is because it is an easy language which is required for computer and electrical engineers. Thus, we should have no problem with this as every member of our group has taken C programming, which should make it easy as we can all have input on this subject. As of right now the software will only be used to get the data from the microcontroller, which will monitor the status of the system as well as note any problems with the current status of the system. It will also be used to calculate the charge remaining on the system. This will require us to come up with an algorithm that relates voltage and current draw to determine when the system will be out of stored energy and when it will shut down. It will also have to calculate the amount of charge that will be entering the system. This farther complicates our measurement because we will have to take that into account when predicting the amount of time left on the system.
Figure 27 - Hardware multipliers for MSP430

41
Above is a picture of some of the hardware multipliers that we will implement in our design project. This is what will be used to carry out the prediction operations in our system. These operations are very fast which is what we will need to compute real time results. It also has a very low cost per operation because it requires little power and can be used even if the microcontroller is partially asleep. As you can see it also has some very high regions of accuracy which we will incorporate in our timer because we need that to be as accurate to the minute and, if possible, to the second. We will also use this to trip the display to show a message which will let the user know they will need to plug into an external source before the system shuts down and can possibly lose information or cause damage to the batteries. The batteries have a cutoff voltage, which states that if the batteries go below this threshold it can damage the battery so we will need to tell the user that some sort of action needs to be taken.
Figure 28 - MSP430 Architecture
The above image is an open educational resource (OER).
The above figure shows the MSP430 architecture. As stated before and as shown in the figure, the MSP430 has its own clock system, capable of functioning with external devices. The MSP430 is available with either Flash or Read Only Memory (ROM). As it is our desire to write our own program and to have the ability to reprogram the chip in the testing phase, we will be sure to use a microcontroller that utilizes Flash memory. This will be denoted by an “F” part number immediately following the “MSP430” in the chips name. Also included on the chip is Random Access Memory (RAM) that can be used for both programmed code and data. Utilized by the MSP430 microcontroller is a 16-bit Reduced Instruction Set Computer (RISC) Central Processing Unit (CPU). Included with this CPU is a 16-bit Arithmetic Logic Unit (ALU), which is capable of handling arithmetic (addition, subtraction, etc.),
42
comparison and logical operations (AND, OR, XOR, etc.). With 12 of the 16 registers being used for general purposes, the ALU allows frequently used values to be stored on the CPU instead of in the RAM, saving time in terms of computing. Perhaps one of the more important features of the MSP430 architecture that we will be able to utilize in our design is its “Watchdog” component. This device is able to monitor the power consumption of external devices that are utilizing the MSP430 microcontroller. The Watchdog is then able to communicate its results to an LCD output display. Utilizing the Watchdog in our final design software should drastically increase our efficiency in monitoring the power that is being supplied by out batteries to our laptop and projector. These features of the MSP430, as well as the input/output peripherals and ports, and are all connected by a 16-bit Memory Address Bus (MAB) and 16-bit Memory Data Bus (MDB). All of these features combined together allow the MSP430 to execute code at much faster speeds. This results in a wake up time for the microcontroller of less than 1µs, producing faster, more real time results.
4.2 Software Now that we have looked at the hardware, we will need to research the software aspects of our project that will be incorporated in the final design. This will include all calculations used and devices controlled through executable code. From power calculations and displays to user interfaces, all of our hardware will be implemented using original code that our group will write. Since most, if not all, of our devices will be controlled by one microcontroller or another, it would be beneficial to the group to choose a microcontroller that is programmable in a programming language that is already familiar with all of the group members.
4.2.1 Power Usage Calculations Calculating the power usage will be done by calculating the amount of power in wattage coming into the system vs. power going out of the system. If 5 watts of power is coming into the system and 10 watts are going out of the system to power devices the difference of the two will show the power consumption which will be displayed to the user in a message on the screen. It will also light a LED, which will tell the user without looking at the display if it is using power or storing power. For example if the system is consuming power it will display a negative value on the screen which will light up a red LED that will indicate power usage. This information will have to be fed to the time calculation as well to calculate the amount of time remaining. The next possible situation is if the system is storing more power than using. This will be indicated as a positive number and will also light a green LED such that the user can see that he is storing power. For example if the system is producing 10 watts and using 5 watts the difference will be shown as a positive 5 watts as well as a green LED. The time calculation can be infinite if the user is storing energy so we will not display a time until empty because it is storing energy. The user will instead have a message of no stored energy is being used.

43
4.2.2 Battery Charge State Calculations The battery level will be displayed on the screen as time until empty. Using the power calculation previously described in the earlier section will determine if the system is using or storing power. The easy case is that it is storing power and we will just display that the system is storing power and there is no estimated time for depletion of the battery. The other case is that if the system is using power we will need some way of calculating the time remaining. The easiest way we determined is by using the max voltage across the terminals the battery can have and then comparing that with the minimal value of the battery and the amount of change between drops in charge as a function if time. We will be able to calculate the amount of battery time remaining. All batteries have a cutoff voltage in which usage beyond this value will cause damage the battery. We will have to inform the user that the battery cannot function any longer and the system needs to be shut down. We will signal an audible tone when such an event is going to occur. This will be done by a small speaker that will be mounted on the inside of the case as in the figure below:
Figure 29 - Low Power Speaker for audible tones
Reprinted with permission from diyAudio
We may also use this speaker in other aspects of the project, which include fault codes and heat thresholds. Reaching to all the senses of a user is important when critical events are taking place. The more attention we can bring to the box the more better it is in the safety and well-being of the individual using it as well as the machine itself. Adding a speaker will be very inexpensive as well as very valuable in the event of failure as well as in the event of important events that might take place.
4.2.3 Displays Our display will be programmed using C/C++ programming language. There will be many functions to control different types of messages that will be displayed to the user. One of these functions will show what the status of the battery is. This function will be called by main and will be used when the mode button is pressed. It will also cycle through other functions, which will control different things. This function will contain an algorithm that will calculate how much time is remaining until empty. The chart below will explain the method we are using to show where the battery is. Since we are using a car battery it is a 12 Volt battery and will be following these specs to get the percent of the battery left.

44
Percentage of Battery Charge Remaining Battery Terminal Voltage
0 10.5
5 10.63
10 10.76
15 10.89
20 11.02
25 11.15
30 11.28
35 11.41
40 11.54
45 11.67
50 11.8
55 11.93
60 12.06
65 12.19
70 12.32
75 12.45
80 12.58
85 12.71
90 12.84
95 12.97
100 13.1
Figure 30 - Voltage vs. percent of charge left
When the battery is full it will be a little above 12 volts. As the battery loses charge the voltage will drop causing the percent of battery left to change. This will be sent into the microcontroller in real time such that the microcontroller can display that on the LCD screen. There are other ways to get the battery data. This method seems to be the easiest, but it is not the most accurate. The most accurate method is to use the specific gravity of the battery, which the processor can take up to 2 hours to calculate. We felt as if this is too much time to get the percent of the battery left because that amount of time to get a steady state to read the level is too much time. If the battery was a smaller battery and needed to be accurate we would of went with this but according to the specs we don’t think that this is necessary. Another function that needs to be written is about the fault codes that we will need to worry about. One of the main fault codes will be heat in the box, if the heat in the box gets to a critical level we will need to let the user know that if they don’t turn off the machine or do something to cool it down it can fail. This is important because we need to take safety into account. We will use the temperature sensor that is built into the MSP430 to complete this task. Since the board will be inside of the box as well as all of the electronics it is great to have an onboard temperature sensor. If the temperature
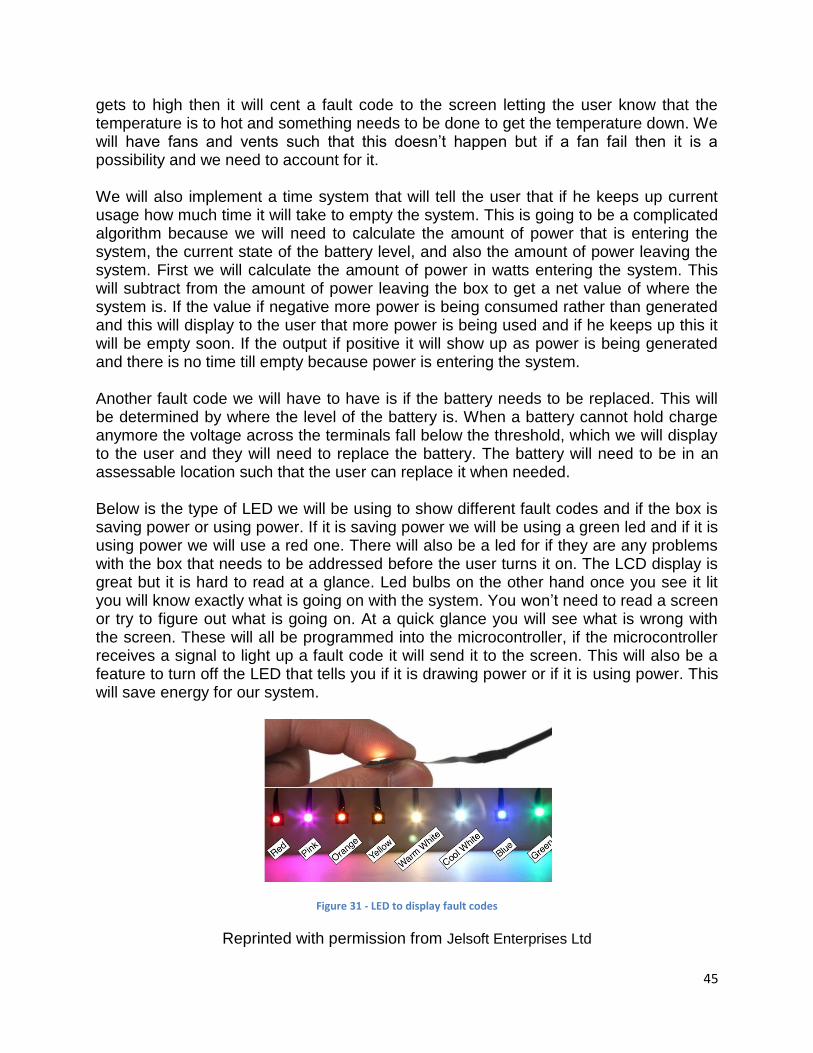
45
gets to high then it will cent a fault code to the screen letting the user know that the temperature is to hot and something needs to be done to get the temperature down. We will have fans and vents such that this doesn’t happen but if a fan fail then it is a possibility and we need to account for it. We will also implement a time system that will tell the user that if he keeps up current usage how much time it will take to empty the system. This is going to be a complicated algorithm because we will need to calculate the amount of power that is entering the system, the current state of the battery level, and also the amount of power leaving the system. First we will calculate the amount of power in watts entering the system. This will subtract from the amount of power leaving the box to get a net value of where the system is. If the value if negative more power is being consumed rather than generated and this will display to the user that more power is being used and if he keeps up this it will be empty soon. If the output if positive it will show up as power is being generated and there is no time till empty because power is entering the system. Another fault code we will have to have is if the battery needs to be replaced. This will be determined by where the level of the battery is. When a battery cannot hold charge anymore the voltage across the terminals fall below the threshold, which we will display to the user and they will need to replace the battery. The battery will need to be in an assessable location such that the user can replace it when needed. Below is the type of LED we will be using to show different fault codes and if the box is saving power or using power. If it is saving power we will be using a green led and if it is using power we will use a red one. There will also be a led for if they are any problems with the box that needs to be addressed before the user turns it on. The LCD display is great but it is hard to read at a glance. Led bulbs on the other hand once you see it lit you will know exactly what is going on with the system. You won’t need to read a screen or try to figure out what is going on. At a quick glance you will see what is wrong with the screen. These will all be programmed into the microcontroller, if the microcontroller receives a signal to light up a fault code it will send it to the screen. This will also be a feature to turn off the LED that tells you if it is drawing power or if it is using power. This will save energy for our system.
Figure 31 - LED to display fault codes
Reprinted with permission from Jelsoft Enterprises Ltd

46
Programming the LED’s will come from the microcontroller. We will have functions that will be running in real time to light the bulb. The bulbs will have a label under them letting the user know what the meaning of each bulb is.
4.2.4 Microcontrollers The MSP430 microcontroller is what we will be programming to perform all of the operations that our power generator requires. It will be programmed in the C language, as it is the most convenient and most familiar language for our group. Once programmed correctly, the MSP430 will be able to act as a heat sensor, it will be able to perform all of our power consumption calculations, and it will be able to control the LCD display. Since we will be using an MSP430 that is reprogrammable, we will be able to overwrite the software and perform as many experiments with our code during the testing phase as we desire. Since MSP430’s come at such a low cost and take up virtually no design space, our group has an option when it comes to designing our power generator. Overall, we could decide to use one microcontroller that would be programmed to perform all of our operations needed by itself. On the other hand, we could add multiple microcontrollers, each having a specific task that would need to be programmed to it. The pros and cons of each solution must be looked at. With one microcontroller, the design would obviously be made simpler in the fact that we would only need to worry about wiring one microcontroller to the system. All of our operations can be programmed to perform on the one microcontroller. The con of using only one microcontroller, however, is that it would make diagnosing a problem during the testing phase harder to do. The code we would need to program would be much more complicated, and we would have to search through hundreds of lines to pin point specific issues. With multiple microcontrollers, the code programmed to each microcontroller would be much simpler. As it would only need to worry about dealing with one task, the code written for it would be very specific for that goal. During testing, if one aspect of our power generator was not functioning properly, we would be able to go back to the microcontrollers and specifically pin point the issue. Overall, the fact that more microcontrollers would require more wiring, take up slightly more space, and come at slightly increased price can be overlooked from the benefits of having multiple microcontrollers. Though none of our group members have ever programmed a microcontroller before, there are enough databases on the internet that we will easily be able to find code examples. Once we have figured out how to control all of the major pins of the MSP430 microcontrollers we will be able to write simple programs in C to perform all of our operations.

47
Texas Instruments provides its own set of code examples for the MSP430 line. For each microcontroller generation, it provides a plethora of different code examples. There is also a read-me file included with each set of examples to be used in pin-pointing code examples that perform specific tasks. Code examples are provided in both C and Assembly.
5 Design 5.1 Battery After carefully considering all the different types and sub-types of batteries researched, the decision was made to use a lead acid deep cycle AGM battery. The closest contenders were the nickel-metal hydride and lithium polymer batteries. Using multiple remote controlled car battery packs of these types instead of just a single automotive sized battery of the same respective types will definitely afford some significant weight savings, but ultimately the price is still too high. Automotive batteries of these types cost in the range of $1000 or more, and it turns out using four one pound battery packs to obtain a voltage and capacity closer to what we actually need actually brought the price close to $400. A single automotive sized lead acid AGM battery with close to double the storage capacity and weighing twenty six pounds is available for $150. While the twenty two pound weight savings offered by the nickel-metal hydride and lithium polymer battery packs would be nice, it’s just not a necessity in this application. This was especially the case since the entire system will already be fairly heavy and will contain wheels to ease in its movement. We ultimately decided that weight alone wasn’t a good enough reason to use a battery that was more than double the cost of its closest competitor. Other benefits of the AGM battery over these battery packs that factored in on our decision were the AGM’s higher charging efficiency and speed, low maintenance, better durability, and simple charging techniques. Now that we have decided to use an AGM battery, we must choose a specific manufacturer and model to use. The first thing we must consider when choosing our battery is its power storage capacity, or energy density. As previously stated, the battery needs to have a high enough energy density to power a laptop and a projector for at least two hours. In order to estimate the correct size battery and ensure its lifetime is not compromised, a few calculations must be done. Most laptop power supplies consume less than 120W and most projectors consume less than 450W. To be safe we can round this up to a total of 600W power usage between the two, which would draw 5A from a 120V source. This means we need a battery with an approximate capacity of 10Ah. Since draining a battery completely is bad for its longevity, it’s best to abide by a rule of thumb for the percentage of a battery’s energy to be depleted in power storage applications. This percentage fluctuates, depending on the number of cycles desired out of the battery, but at the lower end of the spectrum is 50%. The effect of the depth of discharge on the cycle life of the battery can be viewed in the figure below. Accounting for an 85% efficiency of the DC to AC inverter, a battery with approximately 23.5Ah of storage capacity is necessary. In most cases, batteries with this kind of storage capacity are going to be of the smaller automotive sizes.

48
Figure 32 - Cycle Life vs. Depth of Discharge
Permission pending form electropaedia
It’s worthy to note that there are two different popular design types of AGM batteries. The first AGM batteries were made with rectangular cells, but more recently battery companies have been using spiral cells. Spiral cell AGM batteries are typically capable of containing a higher internal pressure. This ability to withstand a higher internal pressure reduces the sensitivity to overcharging, as they can be designed with a pressure relief valve that opens at a higher pressure. The higher the pressure, the more severe the overcharge will have to be to cause the pressure relief valves to open and allow water to be lost. Spiral cell designs also tend to have lower internal resistances, which increases charging speed and efficiency and decreases the effect of self discharging. The figure below shows the construction differences between a spiral cell AGM (left) and a typical rectangular cell AGM (right).
Because of the benefits of a spiral cell AGM battery over a rectangular cell AGM battery, the decision was made to use a spiral cell. The most popular and widely available manufacture is Optima. To help in making a final decision on a specific battery to use in our design, we created a comparison chart for all the different deeps cycle batteries Optima makes. We calculated and included the Ampere-Hour/cubic inch, Ampere-Hour/Pound, and Ampere Hour/dollar for each battery as well. This chart can be viewed in the figure below.

49
Optima Battery Comparison
Battery Capacity
(Ah) Weight
(Lbs) Voltage
(V) Volume
(cm3) Price ($) AH/cm3 AH/Lb AH/$
D27M 66 53.8 13.1 715.15 208.89 0.09229 1.2268 0.316
D31M 75 59.8 13.1 782.63 221.40 0.09583 1.2542 0.3388
D34M 55 43.5 13.1 540.68 181.34 0.10172 1.2644 0.3033
D31A 75 59.8 13.1 778.48 215.29 0.09634 1.2542 0.3484
D31T 75 59.8 13.1 778.48 218.08 0.09634 1.2542 0.3439
D34 55 42.9 13.1 535.22 181.42 0.10276 1.2821 0.3032
D34/78 55 43.5 13.1 539.93 178.19 0.10187 1.2644 0.3087
D35 48 36.4 13.1 480.599 164.74 0.09988 1.3187 0.2914
D51/D51R 38 26 13.1 413.23 158.07 0.09196 1.4615 0.2404
D75/25 48 37.8 13.1 486.25 169.69 0.09871 1.2698 0.2829
D27F 66 53.2 13.1 707.75 235.00 0.09325 1.2406 0.2809
Figure 33 - Optima Battery Comparison
In the end, the decision was made to use the Optima D51 battery. Optima is a well known AGM battery manufacturer, and their batteries generally receive very good reviews on many different websites. This D51 is the cheapest and smallest battery Optima makes, costing less than $140.00 on amazon.com and weighing in at a mere 26 lbs, both of which are significantly less than most lead acid deep cycle AGM batteries. It has a 38Ah storage capacity, which is more than our design requires, but will increase the batteries cycle life because the typical 2 hour battery cycle will be reduced to a roughly 30% DOD on this battery. The only downside to this particular battery is it has an internal resistance of .0046Ω, which the highest internal resistance of any battery made by Optima. Fortunately, this is still below the internal resistance provided by most gel cell batteries, so the benefit of using an AGM over a gel cell is still present in this particular battery. The figure below shows the schematic diagram for the 12 VDC to be supplied by the battery.
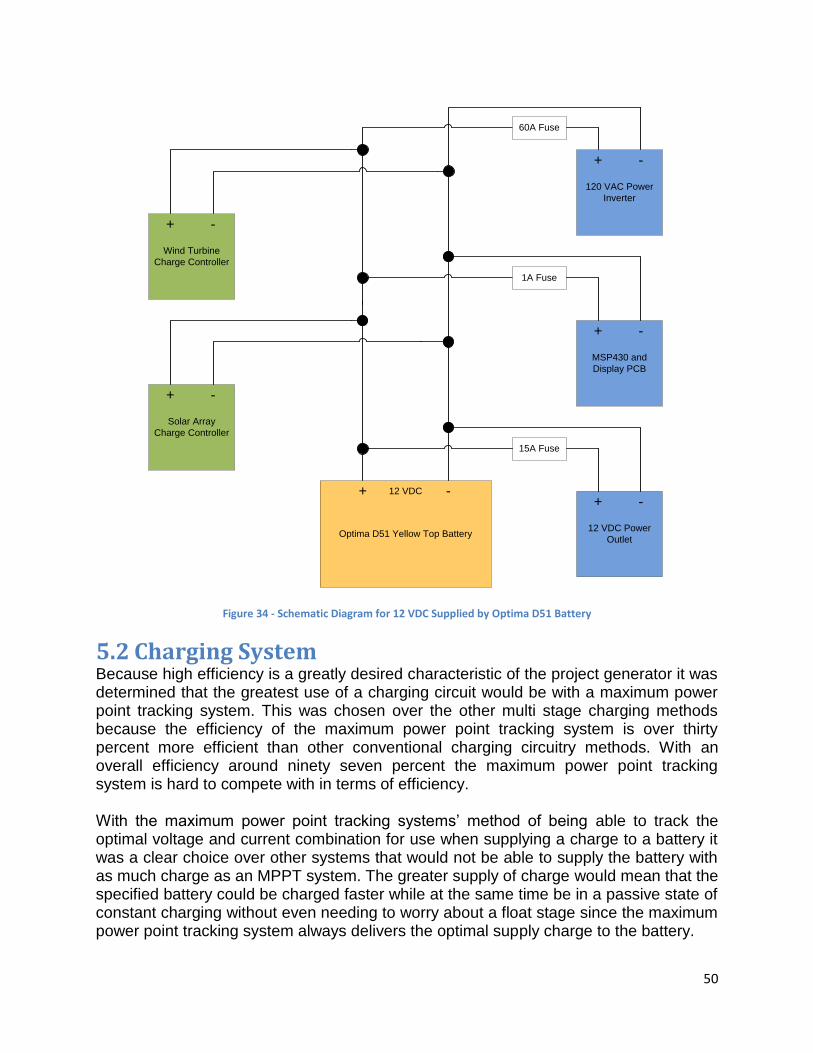
50
Optima D51 Yellow Top Battery
+ -
Solar Array
Charge Controller
Wind Turbine
Charge Controller
12 VDC Power
Outlet
120 VAC Power
Inverter
MSP430 and
Display PCB
+ -
+ -
15A Fuse
60A Fuse
12 VDC
+ -
+ -
+ -
1A Fuse
Figure 34 - Schematic Diagram for 12 VDC Supplied by Optima D51 Battery
5.2 Charging System Because high efficiency is a greatly desired characteristic of the project generator it was determined that the greatest use of a charging circuit would be with a maximum power point tracking system. This was chosen over the other multi stage charging methods because the efficiency of the maximum power point tracking system is over thirty percent more efficient than other conventional charging circuitry methods. With an overall efficiency around ninety seven percent the maximum power point tracking system is hard to compete with in terms of efficiency. With the maximum power point tracking systems’ method of being able to track the optimal voltage and current combination for use when supplying a charge to a battery it was a clear choice over other systems that would not be able to supply the battery with as much charge as an MPPT system. The greater supply of charge would mean that the specified battery could be charged faster while at the same time be in a passive state of constant charging without even needing to worry about a float stage since the maximum power point tracking system always delivers the optimal supply charge to the battery.

51
Although a maximum power point tracking system is more expensive to other multi stage charging systems the greater efficiency leads it to be the clear choice in charging circuitry over other methods. Part of the reason that a maximum power point tracking system is more expensive to the other methods is because of the sheer complexity of the circuitry involved in the design. That is why it was decided that is why a commercially available maximum power point tracking system was to be used in the project simply because of the man hours and expense it would cost to try and create a maximum power point tracking system from scratch. Many vendors were looked at when considering what kind of maximum power point tracking system to buy. Below is a table of possible charging systems that were considered for the project and their pros and cons.
MPPT Charge Controller Comparisons
Manufacturer MidNite Outback Blue Sky Xantrex Morningstar Apollo
Model Classic 150 FM60 FM80 3048DL XWMPPT60
TSMPPT60 TS80
Rated Amps 80-96 60 80 30 60 60 80
Max Operating Voltage 150 145 145 112 140 150 112
Max Battery Voltage 72 60 60 48 60 72 48
Solar Use X X X X X X X
Wind Use X
Average Price 850 749 849 649 685 793 849
Display Included X X X X X X X
GFI X X
Oscilloscope Use X X
Battery Status Meter X
External Shunt X
Figure 35 – MPPT Comparison Chart
The maximum point power tracker that was eventually chosen for the project was the Solar Regulator, 30A MPPT rated up to 1.2KW that would be used in conjunction with the solar array, and an additional MPPT system that was included with the wind turbine. Between the two combined systems the power from both the micro wind turbine and the solar array should be at peak efficiencies when it is sent to supply a charge for the battery. Both can be seen below with the Solar Regulator to the left and the counterpart Sunforce MPPT to the right.
Figure 36 – Spec’d MPPT Charge Controllers
Reprinted with permission from Sunforce

52
At first the exorbitant cost of the compared maximum power point tracking systems were a major turn off from the use of MPPT technology. However the discovery of the Solar Regulator with a more than required thirty amps rating with the maximum power point tracking technology for only one hundred and seventy eight dollars MPPT became a much more feasible option for use in the project, and with Sunforce supplying their own maximum power point tracking system with their wind turbine that was going to be bought from them all of the angles in power generation were covered and the charge from the outputs was going to able to be regulated in the most efficient way possible.
Figure 37 –Charge Controller Connections
The use of two charge regulators although expensive was deemed to be a necessity. At first it was believed that the charge controller provided from Sunforce would be sufficient in regulating the supply of charge going into the battery. However after further research only using one charge regulator would have proven to be a mistake. Because the maximum power point tracking system tracks the output coming out of a power

53
source and supplies additional voltage and current depending on the output of the sources compared with the energy across the battery terminals. If there were a scenario where the wind turbine was producing a higher amount of energy than the solar panels at a given moment in time the higher potential in the wind turbine would cause a surge of reverse polarity current into the solar panels that would eventually wear down and damage the panels. Alternatively another option around this would be to add additional switching circuitry to only allow the energy source with the highest potential to be the only active source at a time that way the solar array could be isolated from the wind turbine or vice versa the wind turbine could then be isolated from the solar array. However this approach was deemed to complex and time consuming for the specifications of this project and the use of multiple charge controllers was deemed a suitable and satisfactory solution to controlling the output of the energy sources.
5.3 Wind Turbine From the research it was concluded that a horizontal axis wind turbine would best meet the design specification criteria for this project. All of the factors were taken into account and an intelligent decision was made as to why it would be best to implement a horizontal axis wind turbine. The largest deciding factor came from the cost after looking at potential parts buying a horizontal axis wind turbine would save a lot more money and since the design did not call out that the environment that this generator was to be used in would need to facilitate a vertical axis generator it was decided that the extra expense in a vertical design was not needed. The next big factor of choosing what type of turbine to use came from the orientation of the wind. The vertical axis wind turbine can harness wind coming from any direction but it was discovered that a horizontal axis wind turbine the size of the one specified in the design could be easily re-oriented autonomously to adapt to a change in wind direction. This could be facilitated with the use of pivots and slip rings around the base of the turbine to allow for rotation and a wind foil located on the aft of the turbine to catch the changing wind direction. All of these modifications combined would allow the turbine to move and rotate with the wind to always allow the horizontal axis wind turbine to be oriented perpendicular to the wind. Next it was decided where best to deploy such a generator, since the design resources specified Waseda University in Shinjuku-ku, Japan it was determined what the average wind resources were in that location of the world and if at a later date other locations were chosen the following data could be used as a base point in making that decision. With an average wind speed of 10 miles per hour a sufficient generator would be needed that could run on a 10 mile per hour wind speed.

54
Many potential turbines were looked at and compared and the following data can be seen in the table below with various specifications from said potential turbines.
Product Manufacturer Peak Output
(Watts)
Blades
Diameter
Peak
Speed
(m/s)
Cut In
Speed
(m/s)
Cut Out
Speed
(m/s)
10kW
Westwind
10 6.2 16 3 26
20kW
Westwind
20 10 15 3 18
20kW
Westwind
20 10 15 3 18
3kW
Westwind
3 3.7 17 3.5 26
5kW
Westwind
5.5 5.1 16 3 26
Bee 800 0.8 1.75 12 3.5 26
Bornay 600 0.6 2 11 3.5 26
Bornay 1500 1.5 2.86 14 3.5 26
Bornay 3000 3 4 14 3.5 26
Bornay 6000 6 3.9 14 3.5 26
Proven 7 3.2 3.5 12 2.5 26
Proven 11 6 5.5 12 2.5 26
Proven 35 15 9 12 2.5 26
Evoco 10 10 9.65 9.5 2.5 26
Evoco
Airsurfer 1.5
1.5 3.2 12 2.5 26
Gaia 133 Gaia Wind 11 13 9.5 3 26
Iskra R9000 Evance 5 5.4 12 2.5 26
Scirocco Eoltec 6 5.6 12 2.7 26
Alize Fortis 10 7 13 2.5 15
Montana 5.8 5 17 2 25
Passaat 1.4 3.12 16 3 26
S-250 5 5.5 14 4 24
S-343 5.2 5.2 12 4.1 24
G-3120 35 19.2 11 3.5 25
E-3120 55 19.2 11 3.5 25
45444 Sunforce 0.6 2.1 12.5 2 70
Skystream
3.7Skystream
2.4 3.72 13 3.5 25
Westwind
Bornay
Proven
Evoco
Endurance
Figure 38 – Wind Turbine Comparison Chart
With all of these factors taken into account the Sunforce model 45444 micro wind turbine was chosen to satisfy all of these criteria. The Sunforce 45444 surpassed all other observed micro wind turbines in cost, constructability, and performance in the specified environment. The first reason that the Sunforce 45444 was noticed was the cost of the device with some vendors prepared to sell the device for around five hundred dollars. Other

55
comparable micro wind turbines were in the range of seven hundred to one thousand dollars. One of the reasons for the lower costs is that the Sunforce 45444 was designed for off-grid performance and utility. Meaning that its’ sole purpose is to charge twelve to twenty four volt batteries, very similar to the use that we have for it. Because that it was designed for off-grid use it does not require many of the accessories and sensors that various codes require personal power generators to abide by if they input power back into a power grid. Its’ simple design also allows for simple assimilation into the project design. The second stated reason for choosing the Sunforce 45444 being constructability was another reason in the decision for choosing this micro wind turbine. Because the wind turbine is designed for battery charging, assimilation into the project design is quick and easy. Attaching the Sunforce to a standard slip ring will give the turbine the ability to rotate freely with the wind allowing it to constantly orient itself in the direction of oncoming wind. This orientation as stated previously in the research will allow the Sunforce to capture the most energy from the wind as efficiently as possible. The other reason that the Sunforce is highly sought after in constructability terms is that it is designed in conjunction with its’ counterpart MPPT charge controller to help to regulate the output coming from the generator to keep the energy charging the battery within safe levels to keep it from going critical and being potentially dangerous. Although many other MPPT charge controllers can be found on the open market it is very comforting to know that this MPPT is designed to work in conjunction with one of the parts that we will be including into our design.
Figure 39 – One Line Diagram
The following table illustrates approximated Watts produced at a variety of wind speeds when using the Sunforce 45444. The figures were generated from the product manual provided by the manufacturer.
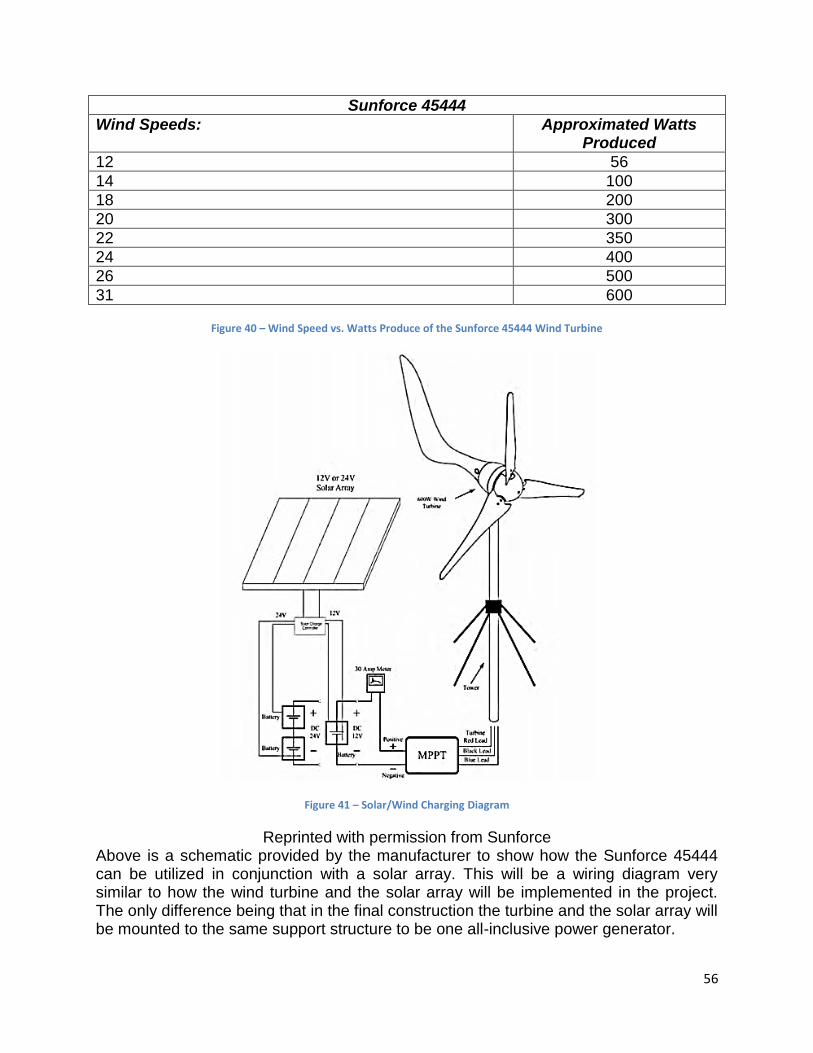
56
Sunforce 45444
Wind Speeds: Approximated Watts Produced
12 56
14 100
18 200
20 300
22 350
24 400
26 500
31 600
Figure 40 – Wind Speed vs. Watts Produce of the Sunforce 45444 Wind Turbine
Figure 41 – Solar/Wind Charging Diagram
Reprinted with permission from Sunforce Above is a schematic provided by the manufacturer to show how the Sunforce 45444 can be utilized in conjunction with a solar array. This will be a wiring diagram very similar to how the wind turbine and the solar array will be implemented in the project. The only difference being that in the final construction the turbine and the solar array will be mounted to the same support structure to be one all-inclusive power generator.

57
5.4 PV Panel Array In our design we used PV array as an energy source to charge the battery. There will be other sources that we will be using to create energy. The type of PV array we will be using is the Thin Film Array Panel. The reason we are going with this design aspect is because it is flexible and inexpensive. We will be covering the top of our panel, which we will be going with a dome design, which will be able to pick up light at any angle at any time of the day depending on the location of the sun. The dome design was unique design aspect that we are using because it will consume the light energy as much as possible. We will also have mirrors around it, which will cause a reflection that will reflect lost light on to the solar panels. These mirrors will increase energy production by 10 percent we estimated we would also have to try to keep heat down from affecting the solar panels performance. The dome design will help because it will dissipate heat due to the high surface area associated with a dome design. The panels are pretty flexible so we do not see it being difficult tasks in making it conform to a dome shape. These panels will be wired to a diode, which will make energy loss low due to the panels on the terminal of the battery. The diodes main purpose is so the energy that is stored in the battery will not reverse polarity and go back into the panels. Since the panels will be across the battery it can be looked as a source in one direction or a load in the other. We do not want it be a load because this will cause power to be drained across the battery which will make it act more like a light bulb rather than an outside energy source. The battery will then go to an inverter, which will change the 12-volt DC to AC, which is usable on many different devices. The inverter will be in the box so it will dissipate heat when loads are connected to it. We will have an exhaust system that will be used to remove the heat from the box. This will make it nearly impossible to overheat the inverter and cause it to start a fire. We will make our box out of aluminum, which is a very moldable metal. This will make the dome in which the solar panels will be attached. Because of this the panels will have to be wrapped around this causing it to deform around the dome.
Figure 42 - Thin Film Array Solar Panel Specifications

58
The photo above shows the type of panel we will be using in our project. As you can see it is very flexible and we will be using this panel to cover the dome. This panel is made by Honeywell and is readily available for purchase. This particular solar panel can be cut to conform to different shapes. This is one of the main advantages of using this material. This type of panel is also cheap because it is created using a very cost effective manufacturing process. They are disadvantages of using this solar panel. One of the main disadvantages is that it doesn’t produce energy as effective as other panels, which are available on the market. We will only be using this power source to charge a battery which is not that difficult of a task and since we are also including wind power it is not the only source of power in our system. They are some types of Thin Film Array, which must be covered by glass due to elements that can damage the surface of the material. We found that there are Thin Film Arrays that do not need to be covered by glass because they are covered with a transparent element, which causes the material to flex and also protects it from the elements. Using non-conductive rivets, which will secure this to the metal, will mount the panels to the metal. There will be a rivet approximately one foot apart with a spread of 6 to 8 inches. This will secure the panels to the metal and cause it not to move in the wind. Since we are using wind as a power source we will have to make sure that the panels are secured tightly to the metal backing. We do not want air to go under the panels, this will cause the panels to lift and can create problems in the reliability of the system. These panels are flexible but they are not made to move due to damper and wind resistance.
Figure 43 - PV Array
The wires that connect these panels to the battery are 12 to 14 gauge wires. We chose these wires because of the fact that we need to supply a 12-volt source to the battery.

59
Since the panels will not send a burst of current and is limited to the maximum amperage of the wire we do not foresee a problem by using a thinner wire to transfer the energy to the battery. When the energy is leaving the body we will have to make sure that we use a thicker wire because we do not know the maximum current draw the user will plug into the unit. We will have to place a maximum current draw on the system such that the user knows what the recommended usage is of the system.
Figure 44 - Mirrors on a Solar Panel
We used mirrors to focus light back into the panel that is lost. This is done by placing reflective mirrors at the base of the panels and having them tilt back to the panel. As you can see in the photo above visible light enters the system randomly. The light that is lost will then be reflected back into the solar panel and used back by the system to optimize the light that is entering the system. This generates more power but will also generate heat. We ended up not needing to find a way to remove heat from the system because it does not heat the solar panels too much. As discussed earlier, the more heat that is added to the system the less effective the solar panels are and we do not want to lose energy through the addition of heat. We will need to find a way to balance the heat as well as energy creation because we don’t want to create too much loss. This will defeat the purpose of adding the mirrors to the system. In our design we are implementing many sensors to measure the current produced as well as the amount of voltage that is sent to the battery. In the solar panels we are using a current sensor to measure the amount of current that is sent to the battery. This information is converted into a voltage which is sent to the MSP430 so that it can read the data that is coming out of the sensor. This then feeds to the display so that the user can be informed of the amount of energy that is being produced by the system.

60
Figure 45 - Current Sensor with DC lines going to battery as well as data lines going to MSP430
Reprinted with permission from Alt Yapi of 320volt.com
In the figure above you can see that we connected the solar panels through the current sensor. This then goes to the blocking diode which blocks energy from feeding back into the panels. It is then be stored in the battery and used by the user. The data lines coming out of the sensor measure 1.6-4.6 volts. This is what the MSP430 will use to calculate the information that will be sent to the user. The current is mapped to a voltage in this range. As you can see in the figure above there is a fuse, which protects the system. We determined the max range of the sensor and then used that to calculate the fuse value such that we don't damage the components of our system.
5.5 Display There are many displays out there that all do basically all the same thing. These displays range from 9-segment display to fully realized pictures with images as well as movies. One of the main reasons in choosing our display is that it draws very little power and is cheap. We also noticed that the more sophisticated the display the more power it draws. For low power we must have a system that consumes the least amount of power available. This power saved can be used for many other things but the most importantly is to maintain power on the objects outside the system. Our users don’t care whether the system has all the bells and whistles but most importantly looking for a system that will encompass the needs of that specific individual and be able to power there system. The display is going to incorporate messages, which are being shown to the user. This is done in the C language as well as making functions that shows the user what power is left in the machine as well as how much other information that will be discussed in this section. Some of these functions will calculate how much power is left and change

61
that into time. Another function shows any errors that are in the system. An example of an error that shows up is if the battery is not good. In that case the user will need to replace the battery so that it can hold a charge. Another fault code that that displays shows is which unit is producing power whether it is the solar panels or the wind turbine. This is important because in the future if the user wants to make changes to the system he can decide that if it is worth adding more panels or taking panels off to make room for another turbine or some other form of energy.
Figure 46 - Airflow Pattern to dissipate heat on board and display
Reprinted with permission from adhoc Hard- und Software
We decided that placement is a very important consideration when taking on this type of design. Because of the solar panels heat is going to be an issue that we took this into consideration as well as outside conditions since the device will be out in the external environment. For this to happen this display needs to be in low section of the box which will cause the heat to rise. According to the way we want the board setup it has to have a fan to circulate the air into the system and then out of the system. We looked into different airflow patterns to keep our system cool. We accomplished this by using fans that will draw air from the bottom of the box and pull it in and let it out through raised slits in the side of the box. This is the best type of design because we need to keep rain and other elements out of the box. The rain will completely compromise our system and need to take precautions to keep it out of the system. Since the fan will be drawing air from the bottom of the box there will be very little change of water getting in because if the fact water can’t fall up. The slits in the side of the box will have a very 45-degree angle in the metal, which will deflect the water from going into the skits and let the heat go out of the box. The display is weather proof because if water damages the LCD screen then the user will not know what is going on with the system which can cause it to have some sort of failure. The best way is to seal the display in some sort of clear material that will keep

62
the elements out of the box and cause it to fail. The buttons change the information on the display and show other parts of the system. We went with buttons instead of touch screen. The reason why is because the water can damage the capacitive touch sensors rendering the display useless. The buttons we are using will be made for the rough conditions that we are going to face. The buttons will need to deal with heat as well as rain and maybe even snow and ice. This is why our buttons need to withstand the environment and be able to function in the harshest environments. Finally the display is always assessable all the time when the system has power and when they system has shut down it should still stay active explaining to the user that there is no power left in the system and should find another means of power. When tested on the display being active at least 1 hour after the system has completely lost power such that the user can be aware that they need to use something else. This is highly feasible because of the fact that the display will use such little power it will not be necessary for us to keep reserve charge to run this feature it should require less than half of a percent of battery to accomplish according to our calculations. The display that we used in our design has a 16 x 2 display. This is more than enough to display our messages to the user. The model of the display we are using is LCD-09395 16 x 2 Black on White Serial Display. This LCD has special commands, which cause it to sleep when not in use and also to dim the brightness. These are the main features that we are using in our box so we can save current and make the box perform more efficiently and increase productivity.
Figure 47 - LCD serial pin layout
The figure above has the pin layout for the LCD display. As you can see in the picture the data bus lines are pin 7 through 14. These are the pins we are going to use the

63
send the data to the LCD screen. Pins 1 and 2 are used for powering up the LCD screen; they are ground and Vcc respectably. The other pins that are associated with this device are settings and features we will try to incorporate in our design. Some of the pins need special values on their lines because they are used as option pins or have more than one setting that it can be set to.
Figure 48 - Serial LCD Graphical Display
There were some other LCD screens we as a group were looking into. One if the main design issues we ran across when making our decision for the LCD was: Did we want to use an alpha numeric display or did we want to use just a simple 7 segment display? We decided on using the alphanumeric display because unlike the 7-segment display we can display characters, which would be a great feature for our users because they would not have to try to figure out what this number means on the screen. Instead it shows up as a short phrase and then tells the user the number or value associated with that phrase. We completely ruled out a display using moving characters and motion picture because it would be very nice to have but it would outweigh the benefits of using this type of device. First of all it draws more power, which we wanted to keep at a minimum. Also, dimensions of the screen would not be ideal for displaying a message. We were looking for something rectangular, which we can fit complete thoughts on. Most of the motion displays were square, which showed the messages more awkward and was not user friendly. In the end we decided because of these design issues to go with the alphanumeric displays. It is a very simple display and I think that it would be a great design to use in with our display.
5.6 Microcontroller From our research, our group has decided that the line of microcontrollers most suitable for our project would be the MSP430 line of microcontrollers from Texas Instruments. The C programming language, which all of our group members are familiar with, will be used to write all of the code to program the microcontroller. The power supply for the microcontroller will come from the 5 VDC USB connections from our power inverter output.
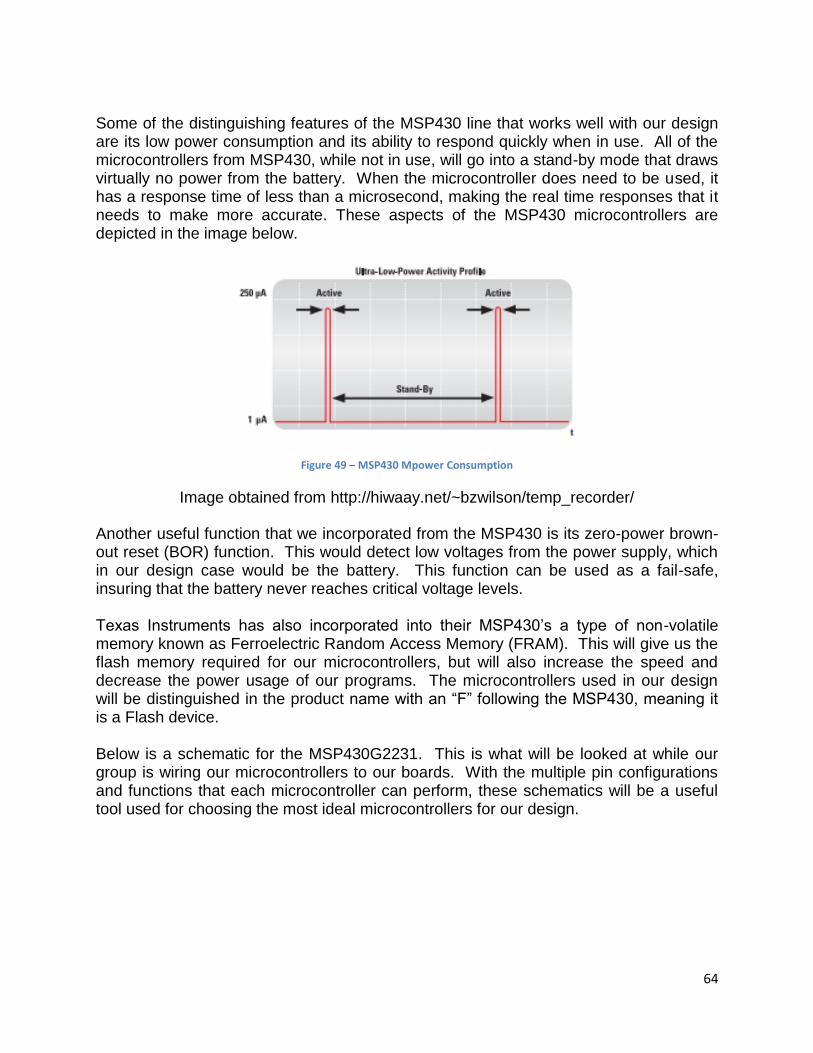
64
Some of the distinguishing features of the MSP430 line that works well with our design are its low power consumption and its ability to respond quickly when in use. All of the microcontrollers from MSP430, while not in use, will go into a stand-by mode that draws virtually no power from the battery. When the microcontroller does need to be used, it has a response time of less than a microsecond, making the real time responses that it needs to make more accurate. These aspects of the MSP430 microcontrollers are depicted in the image below.
Figure 49 – MSP430 Mpower Consumption
Image obtained from http://hiwaay.net/~bzwilson/temp_recorder/
Another useful function that we incorporated from the MSP430 is its zero-power brown-out reset (BOR) function. This would detect low voltages from the power supply, which in our design case would be the battery. This function can be used as a fail-safe, insuring that the battery never reaches critical voltage levels. Texas Instruments has also incorporated into their MSP430’s a type of non-volatile memory known as Ferroelectric Random Access Memory (FRAM). This will give us the flash memory required for our microcontrollers, but will also increase the speed and decrease the power usage of our programs. The microcontrollers used in our design will be distinguished in the product name with an “F” following the MSP430, meaning it is a Flash device. Below is a schematic for the MSP430G2231. This is what will be looked at while our group is wiring our microcontrollers to our boards. With the multiple pin configurations and functions that each microcontroller can perform, these schematics will be a useful tool used for choosing the most ideal microcontrollers for our design.

65
Figure 50 - MSP430G2231 Diagram
The above image is an open educational resource (OER).
To make things more convenient in our design, we have decided to use multiple microcontrollers to control the separate functions of the power generator. This way, we will know the function of each microcontroller and we will be able to program the code to it for its specific application. This will make it easier to both program and test the system, as we will be able to pin point where any programming errors may have occurred. With the MSP430 line being so extensive, we will need to look at which microcontrollers are available to use for the functions that they might serve. Though each microcontroller is for the most part identical to one another, they mostly differ in the number of pins that they feature. For our application, it would be wise of us to choose the microcontrollers that are the most simple, while still being able to perform the desired tasks. Looking at the chart from Texas Instruments found below will be useful for comparing available microcontrollers. A few particular lines of the MSP430 family have built in LCD controllers, making it convenient to control our user display system. This is also combined with a fast wake up system and flash memory, both features desirable in our design.

66
Figure 51 – MSP430 Chart
The following image provided "Courtesy of Texas Instruments".
For any of the microcontrollers utilized, we will not be able to use any of the LaunchPads offered by Texas Instruments. This will mean that we will be required to solder the microcontroller onto our own PCB. Care will need to be given while doing so as to place the wires where they need to go. As it is a common mistake for groups to solder in the wrong location, or even completely upside down, our group will pay special attention to this part of the design process. After careful consideration, it was decided that the MSP430G2231 would work perfectly for this application. It has a frequency for 16MHz, 2KB of flash, and 128B of SRAM. This should yield plenty of memory and speed to implement the basic code for executing the power calculations and the functions to display the calculated conditions to the screen. The plan is to use two of these microcontrollers. The first one will read in the voltage of the battery and the current sensors, calculate all relevant values, and then synchronously send the results to the second microcontroller. The second microcontroller will be in control of the display. Depending on the button pressed by the user, different data will be displayed.

67
Figure 52 – Microcontroller Schematic
As you can see in the figure above, we used one of the USB outputs of the power inverter to power the microprocessors. This will integrate them into the power calculations for the power inverter, so one less current sensor will be needed. As you can see, the 5VDC input by the USB cable is reduced via a voltage divider circuit. This is because the suggested max voltage at Vcc for the microcontrollers is 3.6V. Using the circuit shown in the above schematic, the voltage is dropped to approximately 3.49V, which will work perfectly as it is well within the acceptable range.
Figure 53 – 3D Model of Microcontroller PCB

68
5.6.1 Power Usage Sensors Power usage of the system was determined by looking at all of the energy being generated by our solar and wind sources and how much power is being consumed by each of our applications. These numbers will let us know if the battery is taking in enough energy to store or if the system is using more than it is taking in, depleting the battery. This information, being relevant to the user, will be displayed on the LCD screen. The energy produced by the wind turbine is quite simple to monitor. As the Sunforce 45444 comes with its own built in MPPT charge controller, the power that is being output to the battery will be easy to monitor. This information is also fed into a microcontroller whose task it will be to compute the power usage of the system. The energy from the solar panels, though slightly more difficult, is still be relatively easy to compute. They did not come with their own charge controller, requiring us to connect our own to them. The MPPT charge controllers will help regulate the power output and will ensure that it stays within safe levels for the battery. This information will also be fed into the same microcontroller as the second power input source. Next, we will need to know the amount of power being drawn between all of our devices. This would include such things as the laptop, the projector, the LCD displays, and any microcontrollers used. Since MSP430 microcontrollers are known for their low power usage, their power usage is negligible. The rest of the components, however, will need to be hooked up to sensors and their power usage fed into the microcontroller. With all of this information, we were able to calculate the total power usage of the system. If the energy coming in from our power sources is greater than the power being used by our components, then we will be storing energy in the battery and the LCD reflected this. If, however, we are not drawing in as much energy as we are using, our system will be draining the battery. This will also need to be displayed on our LCD screen, as well as an estimation of how much longer the battery can power the components until it runs out of energy. The power calculations can all be programmed on one microcontroller. The data can be taken in, and the microcontroller can do all of the arithmetic operations required in real time. This information can then be used to determine what action the LCD will take to output the proper display to the user. In order to calculate the power being used, the voltage at the load and the current going to the load must be measured. In order to do this, the battery voltage must be scaled down to a voltage readable by the microcontroller, which is -0.3V to Vcc+0.3V. This can be done with a simple voltage divider placed on the PCB. In this case we will be using a Vcc of 3.5V, so the range will be from -0.3V to 3.8V. This means we need to drop our maximum voltage of 13.1V to 3.8V, so R1 should be equal to 2KΩ and R2 should be equal to 723Ω. This circuit can be viewed in the figure below. The circuit below can be

69
included on the PCB created for the microcontrollers, or may be on a separate PCB, depending on final board sizing requirements.
Battery Positive
Battery Negative
2KΩ
723Ω
Battery Voltage to Microcontroller
Figure 54 - Voltage Divider to Feed Battery Voltage to Microcontroller
The current going to the load will be calculated using a Hall Effect Sensor. Since there will need to be multiple of these sensors, they will be placed on their own circuit board. Since most current sensors don’t have an output that 5V or higher, their voltage is modified to that accepted by the microcontrollers in the same way as above. These voltage divider circuits are included on the same circuit board that the sensor is mounted to in order to allow for any current sensor to be used in the case that one fails.
5.6.2 Battery Charge State Sensors It will be our next task of computing in real time the amount of time remaining that the battery can be used. This can be done be using the data collected by the microcontroller in the power usage calculations. The amount of energy remaining in the battery will also be another consideration for our battery charge state calculations, as well as the minimum power level that the battery can reach before risking damage to the battery. This task will be accomplished using a sensor to monitor the energy level of the battery. The minimum energy level allowed for the battery will be a set value that is programmed into our microcontroller. This number will be subtracted from the energy remaining, giving us the total amount of energy that can be consumed by our components. Once this task is accomplished, the overall battery charge state will be determined by dividing the energy available to the components by the power wattage that they are consuming. This operation will leave us with the time value of energy remaining for the components. If we are left with a negative value, this means that we are storing more energy than we are consuming, and time remaining on the battery cannot be calculated. If left in this condition, the battery will be able to power its components indefinitely. With the time value of power remaining determined, the microcontroller will be able to export this information to the LCD screen to be displayed. If we are in fact storing more energy than we are consuming, then this will instead be referenced on the screen in place of a time value. This function will be done by the same microcontroller that performs the power usage calculations.
70
AS it would be highly undesirable to drain the battery of more power than it could handle, our group has decided to add an alert system that will warn the user when the battery is dangerously low on energy. A small speaker will be controlled by the microcontroller to go off whenever there is less than 5 minutes remaining on the battery. This will give the user enough time to ensure all data on the laptop is properly saved before power is cutoff to all external components so the battery is able to recharge itself.
In order to calculate the charge state of the battery, its voltage must be known. This is the same voltage that was necessary for the power calculations in section 5.6.1, so the same voltage divider circuit that was already built for those calculations can again be used for these calculations. There is a linear relationship between the batteries voltage and its percentage remaining. At 100% full, the batteries voltage should be 13.1V, and at 0% its voltage should be 10.5V. In reality, at 10.5V, the battery is not completely empty, but it is at this point that the power it outputs becomes pretty much useless. Draining the battery to a voltage below 10.5V may also cause permanent damage to the battery.
5.7 Power Inverter When it came to the power inversion part of the design, we had two options. We could either build an inverter from scratch, or we could purchase a commercially available alternative. In building one from scratch, the inverter would be custom and specific for this application, and it would also cost significantly less than a comparable commercially available option. On the other hand, building one from scratch would require a lot of time and effort, and in the end we would not have really accomplished anything new since there are so many different inverters already available for purchase. The length of time required to design and build an inverter from scratch may actually be long enough to take up an entire senior design project, especially if building a modified sine wave or pure sine wave variant. Thus, after careful consideration, it was decided that an inverter would just be purchased. Next the decision had to be made as to a specific power inverter to use in the system. While the improved efficiency of a pure sine wave inverter would be useful in this application, the ability to operate sensitive equipment is of little importance. As noted in section 4.1.4, price sharply increases on pure sine wave inverters over comparable modified sine wave inverters. Since one of the main goals of this project is to maximize efficiency at the lowest cost, this made our choice especially difficult. But in the end, the decision was eventually made to use a modified sine wave inverter. In order to come to this decision, it was realized that the small gain in efficiency of the power inverter wouldn’t really translate to a lower cost in the battery, wind turbine, or solar cells since the power output from these were already quite small when compared to all of those available. There are a few situations where a pure sine wave inverter may produce actual monetary savings. One such situation is when a when an older less efficient inverter is already in place on a large system that the required runtime has been increased. Rather than spend lots of money increasing the size of the battery bank, it may be possible to simply swap out the older inverter for a new pure sine wave version.

71
Also, in some instances, extra generated power can be sold back to the power company. Pure sine wave inverters are required for these situations, as the power that is put into the electrical grid must match that which already occupies the grid. As previously calculated in section 5.1, the wattage necessary to power a laptop and projector should not exceed 600W continuous power. Thus, any inverter with a power rating larger than this should work fine for this application. It was also decided that an inverter with a USB output should be used, as this would further simplify the design of the power usage monitoring to just between the inverter and the cigarette lighter plug. The 5VDC from the USB would be able to provide the power for the microcontroller and the USB output power port, so a separate power line would not have to be run from the battery to these which would need a current sensor on each to calculate power usage. It is also desirable to have an input and output overload alarms/shut down, low battery alarm/shut down, temperature alarms/shut downs, and short circuit shut down. A comparison chart with a few possible power inverters can be viewed in the figure below.
Co
ntin
uo
us P
ow
er Ratin
g
Peak Efficien
cy (%)
Pu
re Sine W
ave
USB
Po
rt
Low
Batte
ry Pro
tectio
n
Overlo
ad P
rote
ction
Soft Start
Sho
rt Circu
it Pro
tection
Tem
peratu
re Pro
tection
Price ($
)
Wagan 2016-6 700 90 X X X X X 60.15
Xantrex PROWatt 600 600 90 X X X X X X X 143.11
Vector VEC043B 750 90 X X X X X 64.99
Sunforce 11240 1000 n/a X X X X X X 189.00
Cobra CPI 880 800 88 X X X X X 43.21
Black & Decker VEC049DCB 1000 87 X X X X X 129.99
Black & Decker PI750AB 750 n/a X X X X X 59.06
Whistler Pro-800W 800 90 X X X X X X 52.71
Pyle PINV2 600 90 X X X 35.00
Pyle PINV3 800 90 X X X 44.99
Power Bright PW900 900 90 X X X X 64.44
PowerDrive RPPD1000 1000 87 X X X X X 79.50
Figure 55 - Commercially available power inverter comparison chart
In the end it was decided that Wagan 2016-6 would be used. As it turns out, the peak efficiency of this modified sine wave inverter (90%) was just as high as the pure sine wave inverters in our power and price range. It also boasts a dual USB output, low battery protection, overload protection, short circuit protection, and temperature protection. We plan to use one USB outlet to power the external outlet of the enclosure,

72
and the other USB outlet to power the microcontroller if possible. A brief schematic of this inverter applied to this system can be viewed below. As you can see, it has two AC power outputs to go to the AC receptacle and two USB power outputs to be connected as stated above. The figure below shows a schematic diagram of how the power inverter will be wired to the battery, the 120VAC outlets, and the USB outlet.
Figure 56 - Schematic Diagram of Wiring from Power Inverter to Outlets
5.8 Power Outlets In order to keep the power inverter sealed from the elements, it must be mounted inside the enclosure with all the other electronics. To make the system user friendly, the power coming from the inverter must be delivered to the exterior of the enclosure in forms that are most widely used so that most existing electronics can simply be plugged in and work with no extra efforts. To maintain the resistance to the elements and safety of the enclosure, weather resistant outdoor outlets should be used. The main concern with respect to the power to be supplied at the outside of the electronics enclosure is with the 120 VAC, as this is potentially the most dangerous power form delivered by the system. After looking at the options available at the local home improvement stores, it was decided to use a GE 20 Amp Backyard Outlet with a ground-fault circuit interrupter (GFCI) receptacle. When the system is implemented in Japan, similar equivalent outlets can easily be swapped in to go with a power inverter that is correct for the region. We decided to go with a GFCI receptacle to boost safety. Since the system will be used outdoors where it and the user could be subject to moisture, the risk of shock is greatly increased, and GFCI outlets can help to protect

73
against this. A GFCI receptacle compared the current flowing from the hot wire to the neutral wire. If there is a difference as small as 4 or 5 mA all power to the outlet is immediately cut off. It is important that we create and use a true ground in this case. This means that the system will have to be externally grounded in same way. There are two ways of doing this, the first being to create a new ground at the site the system is being deployed and the second being to use the already existing ground of the nearest building. Rather than having to run a cord to the nearest building and plug it into an outlet there, it was decided a new ground should be created at the location of the system. In order to do this, a 6 foot metal rod must be pounded into the ground, and then connected to the ground lug on the outlet. A wiring diagram showing the planned connection of the GFCI outlet can be viewed below. Each outlet should be connected to a separate outlet on the power inverter.
120 VAC “Hot”120 VAC “Neutral”
120 VAC “Neutral”
120 VAC “Hot”
Ground
Figure 57 - Wiring Diagram for GFCI Outlet
Since the 12 VDC and 5 VDC power sources aren’t large enough to cause a significant electrical shock, they will not need a safety feature like GFCI. However, it is still important to ensure that the outlets for each are protected from moisture and sun. This will ensure the outlets themselves will stand up to the elements, and help keep moisture out of the electronic enclosure. This can be accomplished simply by sealing all gaps with a widely available indoor/outdoor silicon caulking and using sealed outlets. The Parts Express Marine Grade Cigarette Lighter Socket was chosen as the 12 VDC receptacle, as this is the most widely used connection type for this power type. It also has a cover that can be closed to seal out moisture. For the USB receptacle, the Clarion CCAUSB USB 2.0 Extension Cable was chosen because of its sealed watertight design.

74
5.9 Stand and Electronics Enclosure We will be enclosing our electronics for our system in the bottom of our box. This design idea was chosen because heat rises we would be using fans to cool our system. An example of the enclosure for our system is shown below:
Figure 58 - Heat transfer over a box
Reprinted with permission from AJ+2 Limited
As you can see from the picture heat will rise which will cause the top of the box to get hot. We will mount a heat sink and will use thermal ohms law to calculate the amount of surface area we need to be able to cool the box effectively. As in the image above you can see that we will be using fans to direct the air into the box by doing this we can route the air to transfer the heat from the box to atmosphere. This box will also be sealed to keep out acts of nature. For example water cannot get into the section of the box that houses the electronics. We will be using fins to accomplish this task. The picture below shows the type of fin that we will be using to accomplish this:
Figure 59 - Fins used to dissipate heat and keep elements out
As you can see from the picture above we will be using fins to dissipate the heat from the electronics in the sealed box. Water cannot get into this box and if it does it can damage the entire system. On top of this box we will be mounting fans, which will further dissipate the heat. With this enclosure and fans we will completely eliminate the heat dissipation problem as well as the element of exposing moisture to the system, which are two main problems that can compromise our system. The display will have a similar design that will be clear such that the user can see the display and interact with it. The buttons that will control the electronics will be waterproof buttons. These buttons are shown below:

75
Figure 60 - Waterproof button used to change modes
Reprinted with permission from TooWei
The image above shows the button that we will be using in our design. As you can see it is a very durable button as well as being waterproof. We are building this system to withstand camping, power outage, mobile power station. This button is designed into this project be the user who will be using it for camping. It will keep bugs from getting into the box by the button as well as if the user has mud or water on his hand it will not go in to the system and destroy the button. This is important in making a design that is durable as well as flexible to all types of users. Using a button of this magnitude will prevent oil, water and other contaminants from getting into the system and also prevent issues that could have been prevented by bad design.
6 Design Summary
To summarize the final design of the project as a whole a separate synopsis of the wind turbine power system, a separate synopsis of the solar array power system, and a third synopsis of what happens after the two are combined at the battery will be the simplest way of describing the project as a whole.
Figure 61 - Overall Concept Design

76
To begin with the wind turbine power system is described. The system starts with the Sunforce model 45444 micro wind turbine mounted on the zenith of a converted speaker stand tripod that utilizes slip rings underneath the turbine so that the Sunforce 45444 is free of obstruction and able to move and rotate freely. From there insulated wiring travels down the speaker stand inside the sealed enclosure where the output from the wind turbine is dumped into a charge controller. This charge controller takes the output from the wind turbine and allows it to be safely supplied to the battery. Next is the solar array power system. Utilizing flexible thin film solar arrays reflective mirrors are to be placed at the base of the arrays so as to collect stray sunlight to convert into energy. These solar arrays will be placed in parallel so to add the currents together to charge the battery faster. From here the wiring travels into the enclosure where it is connected with the Solar Regulator 30Amp charge controller. Similar to the wind turbine system this charge controller allows the output from the solar arrays to be safely dumped into the battery. Thirdly is how all of these systems interact with each other at the battery to supply power to the load. At the battery there are a few systems working simultaneously. The previously aforementioned power systems are dumping their outputs to charge the battery via their respective charge controller but MSP 430 electronics are also collecting data and sending it to an LCD display where the user can view it. Such things collected are power usage power generated and power still available in the battery. After the energy is stored in the battery it needs to be taken out and used in a form that the load can utilize. In order to do this the 12 volt DC input from the battery is sent to a pure sine-wave inverter where the 12 volt DC input can be converted to a usable 120 volt AC output. From here the power from the inverter is sent to power the MSP 430 electronics as well as GFI outlets exposed to the outside of the enclosure where a user can plug into and utilize the power generated from the two wind and solar sources and stored into the battery.
7 Testing 7.1 Introduction to Testing Testing is a very important concept when designing a device. You might have everything worked out correctly for it to work but will have an issue with implementing it in real life. Testing is one the most important processes when designing a project especially when someone’s life depends on it. It must meet many requirements dealing with safety as well as functionality. There are many international specifications that we will need to take into consideration for power and fire safety. This is one of the main reasons we will be buying a power inverter because it needs to adhere to specifications if we had to make would take a very long time and the cost benefit ratio would be too high. In the next couple of section we will be describing testing techniques for testing our system. We will be testing many components of the system individually and then testing them together with the parts of the system that interacts with them.

77
7.2 Power Generation testing In order to ensure that the system can recharge the battery quickly and correctly, a few different tests must be performed. To begin, the solar panel array and wind turbine will be tested separately. Each generator will have a multitude of tests performed on it to evaluate its performance and ensure that it is in fact generating the power that is advertised to and is necessary for the system as a whole to operate correctly. Once each power generation type is verified to be working correctly, the two will be combined to ensure that no problems arise. The processes of testing the power generators in all the different configurations will be detailed in the paragraphs below.
7.2.1 Wind Turbine In order to properly test the capabilities of the wind turbine a series of procedures need to be researched and studied as to most appropriate way to measure the output of the micro wind turbine. There are many possible methods available to test the turbine in a controlled environment. Some of those ways that will be discussed will include the open field approach to allow a real world element into the testing to get solid results, the rpm gauge where the energy produced will be measured while inputting a controlled amount of rpm's into the turbine, and the last method will be the automobile approach where wind speed can be artificially simulated by mounting the turbine atop an automobile and measured at various speeds in a controlled environment. All of which will be discussed and considered for testing. The first of the methods that will be looked into is the open field approach. As stated before this will entail taking the generator out to an open air environment with air speed measuring equipment and seeing how the turbine performs in a real world environment. Such a scenario could be taking the generator out to one of the airports here in Orlando where there are few obstructions to impede wind speed and where an average wind speed can be observed and studied such as Orlando Executive Airport shown below.
Figure 62 – Orlando Executive Airport
The above image can be obtained from: http://www.orlandoairports.net/orl/history.htm

78
Some feel that open field testing is the only true way to test the performance of a micro wind turbine, stating that other testing leaves room for the data to be unrealistic if it is only tested under optimal conditions. However to accurately test the results more testing methods will be needed in order to compare results from different tests. The next testing method that will be looked at will be the rpm gauge to see what kind of energy is generated by subjecting the turbine to various degrees of rpm speeds and measuring what kind of results are delivered. In order to accurately measure how many rpm's are being subjected to the turbine a drill or rated motor will need to be utilized so that the turbine can be accelerated up to a pre-determined rpm rotational speed and kept at that rotational speed long enough to obtain an accurate measurement of the energy produced. This will need to be reproduced multiple times at different rotational speeds and the results compared to one another as well as the rated values. The following image shows how such a test can be implemented using a drill and an automobile transmission as an example.
Figure 63 – RPM Testing Method
Since this test will be the most accurate way of determining what kind of energy will be produced at a certain rpm speed the collected data could be used to compare the actual performance of the turbine with the rated values of the turbine supplied by the manufacturer. The last and final testing method that will be researched will be the automobile approach. As previously stated this will entail mounting the turbine atop of a moving automobile and using the speed of the car at various speeds to simulate wind speed moving across the blades of the wind turbine. In order for this kind of testing to work a place of relatively dead air space will be needed so that the wind speeds from outside breezes will not interfere with the testing data. Most likely the most ideal situation will be

79
to utilize parking garages when they are not in use so as the testing does not interfere with normal traffic activity. If an inside location is eventually chosen for the testing area then mounting of the turbine will be even more crucial and require more thought involved. Since most parking garages have a low ceiling from the floor mounting the turbine to the top of the automobile could prove disastrous while at the same time expensive if a new turbine is to needed to replace one smashed into a concrete ceiling. However using a small lower to the ground car and mounting the turbine to the hood of the car while still allowing the driver to see around the turbine to drive would be ideal conditions for a test similar to this. A prime location to do this would be the parking garages at Universal Studios City Walk in Orlando where the large interior expanse would provide a perfect dead space with which to test the turbine while also allowing long straight runs so as turns or inclines will not interfere with testing results. Below are images of the exterior of the Universal Parking garages to show the sheer expanse of the building and a picture showing ideal conditions to find the garage most likely after hours to where testing will not interfere with patrons or employees.
Figure 64 – Universal Studios Parking Garage, Orlando FL
The image above obtained “Courtesy of Universal Orlando Resort”
All of the tests previously stated will need a method in order to accurately measure any data coming from the turbine in real-time during one of the tests. This will need to be accomplished by applying a voltmeter up to two hundred volts so as the turbine spins the voltmeter can accurately measure the voltage being produced from the turbine at a given speed of rotation from the turbine.
7.2.2 PV Cell Array During the testing of the solar panels we will see how long it takes to charge a dead battery as a standalone power supply. We will use this information to see if more panels needed to be added. We will also see how much heat is created by the sun or controlled light source so we can determine if the system is getting to hot or if it is fine how it is. We will also have to make sure that the correct voltages are coming out of the panels. There will also be a buffer that we will have to add a blocking diode, which will prevent loss of energy from the battery when the panels are not in use.

80
Figure 65 - Connection between PV array and Battery
Heat generated by the panels may compromise our system. If that happens we need to find ways to dissipate the heat generated. We propose putting the panels outside of the box since they are weatherproof and make it lifted from the box such that air can flow between the panels cooling it as well as adding insulation so that it cannot go into the box and damage components. We will also have to make sure it is storing enough power at a rate, which is acceptable to the user. It is important to manage the amount of panels vs. the amount of energy created. We do not want to create a bulky system that will create energy at a rapid rate but on the other side we do not want to create a system that takes a really long time to charge the system. Another method that will be utilized to test the photovoltaic array is to utilize UV lighting and light sensors to determine how well the array can generate energy on its’ own disconnected from the rest of the system. The test will start with multiple PV cells connected together with a number of UV lights directed at them and a multi-meter reading the output generated from them. As data is collected, one by one UV lights will be removed from the test and the new data analyzed for any patterns. The test data should show a linear decline in the energy generated by the system with each light removed. After all of the lights have been removed the test should be repeated again but this time removing a section of PV cells and the new data re-analyzed. After performing this test not only should a linear pattern of energy loss be present for each individual light removed but there should also be a similar linear decline with each PV section removed. If the quantity of light generated by the UV lighting is constant for each bulb then after all of the data is collected it should be calculable to determine the amount of energy each individual PV section should be able to generate with a given amount of light and how adding additional sections would add to that value

81
That way if in the future it is determined that the power system is lacking by a factor of ‘X’ amount of energy a close estimate of how many additional PV sections needed can be calculated to make up the difference. Testing of the PV panels will be done by using a controlled light source in which we can measure the amount of lumens being transferred from the bulb we will then use this to measure the amount of energy being dissipated by the solar panels. This will be used with a load of light bulbs with the same number of lumens. We will use this to calculate the amount of energy that is lost from the transfer of energy from the source bulb to the output bulb. We will use a millimeter to measure the amount of energy that is created by the solar panels and compare it to the amount of energy emitted by the source. We will also have to make sure the sensor we are using for the amount of Amps entering the system is working so we can calculate the amount of power entering the system. According to the chart below we need to keep out temperature of the solar panel around 45 degrees Celsius. The temperature coefficients are stated that if you go over these temperatures this is the loss you should expect. We will have to test if this holds true as well as how we are going to keep the panels at this temperature.
Figure 66 – Temperature Effect on PV Panels
This sensor will be tested by using a power generator and by sending 30 amps into the sensor. This should relay a voltage reading, which should show that the sensor is reading 30 amps through the wire. We will then test the voltage sensor by using a multimeter and then see if the reading off the voltage sensor matches the rest of the system. We will then vary this to determine that the sensor is acting properly. There will also be a fuse in the system in case there is a short we will not damage our sensors it will just blow the fuse.
7.2.3 Complete Power Generation System At this point, the wind turbine and solar array sub-systems should have already been thoroughly tested and confirmed to be working properly. Now it’s important to combine the two systems and use them to charge the battery, making sure that nothing changes in the power generation of each system individually. In order to perform such tests, methods that are repeatable yet able to be performed simultaneously must be used. The only option for such tests is the use an electric motor which we can specify different

82
RPM’s to spin the turbine at, and lights so that we can raise and lower the amount of light incident on the panels in specified intervals. These factors should be varied in the same manner as they were when the generators were tested individually. While these tests are being performed, the system must be closely monitored to make sure that the charge controllers and/or the battery are not overheating.
We must also perform multiple real world tests. Such tests will show that not only does the charging system as a whole provide ample power mathematically; it also does so in real life. This will also allow for additional problems such as overheating and moisture related issues to arise due to the environment. Thus, the temperature of the charging systems components must again be closely monitored in addition to any leaks in the enclosure or possibly moisture buildup. The battery should be completely discharged, and then connected to the generators and left to charge. The Voltage of the battery should be measure at a set interval, say every 30 minutes, in order to obtain a rough plot of the charge level vs. time. It should also be ensure that the battery is back to fully charged in less than 6 hours, as was originally specified.
7.3 Power Storage System Testing There are a few different aspects of the power storage system that must be tested to ensure correct functionality. The first, and perhaps the most important, is the runtime of a laptop and projector when no power is being generated. While this is very important, it is also very easy to test. The basic idea is to connect a laptop and projector to the system with a fully charged battery and with the power generation sources disconnected. It is preferred that the laptop and projector are at the higher end of the spectrum when their power consumption is compared to other similar electronics. The devices will be left on until the battery voltage drops below 10.5V, causing the inverter to shut down and as a result the electronics finally turning off. This will be considered a full discharge cycle real world test. If at the end of the full discharge cycle the electronics ran for more than 2 hours, we have successfully met the goal. Perhaps a more accurate and repeatable way to test the same thing but at maximum designed power consumption is to create a resistive load that will dissipate approximately 600W. This can be done by hooking 3 100W light bulbs in parallel and then connecting them all to one of the 120VAC power outlets, and the hooking another 3 to the other 120VAC power outlets. This is done to make sure that the current drawn on a single outlet is not too much. To verify that a total of 600W is in fact being consumed, an AC power meter can be placed on both outlets that a light bulb array is plugged into and then adding the two measurements together. During the process of this test, it should also be ensured that the temperature of the battery does not get above 125°F (51.7°C) and the power inverter stays below its temperature protection threshold. Another aspect of the power storage system to test is its recharge rate. In order to do this the battery should be drained to 10.5V and then connected to the charging system, which should include the solar cell array and the wind turbine. Once connected, the battery should be fully recharged to 13.1V in 6 hours or less. This will show that the designed solar cell array combined with the wind turbine generates enough power to adequately charge the chosen 38Ah battery from a completely empty state in a

83
reasonable amount of time. As with the battery drain test, temperatures should again be closely monitored. Like before, the battery temperature should stay below 125°F (51.7°C). In reality, this is the same test that was to be performed in 7.2.3, and can be done simultaneously. The only difference is here we are looking at the size of the battery chosen, rather than the level of the output power of the generators. If the battery is not fully recharged in 6 hours, then a decision must be made on whether the generators need to be larger, or the battery needs to be smaller.
Optima D51 Yellow Top Battery
+ -
120 VAC Power
Inverter
+
-
60A Fuse
12 VDC
120 VAC
Outlets
120 VAC “Hot”120 VAC “Neutral”
120 VAC “Hot”120 VAC “Neutral” 3 Parallel 100W
Light Bulbs
3 Parallel 100W
Light Bulbs
120 VAC “Hot”120 VAC “Neutral”
120 VAC “Hot”120 VAC “Neutral”
Ground
Figure 67 - Schematic for Testing Power Storage System
7.4 Power Output Testing To test the power input we will need a multimeter which we will use to measure the outputs coming out of the DC terminals. Measuring the 12-volt output to see if we are getting 12 volts will do this. The USB ports will measure the output voltage around 5 volts. We will have to use an oscilloscope to measure the output of the standard wall plug output. We will need the frequency to be 60 Hertz as well as it needs to be running at 120 Vrms. This will be used to power normal household plugs when they are out in the field. For example we will have the USB ports to charge cell phones and other devices because most phones are charged with USB today. Next we will have a 12 volt output for devices that need a 12 volt source. Finally we will have the normal plugs that are on the wall such that any other item can be plugged into it. We will also need to test the amount of amps that can be drawn at a time such that there is not overload that can happen. There should be some sort of safety that if someone plugs in a lot of items into a port it might melt or short out the wire. In this case we need to add some sort of breaker in the line such that we do not exceed the wire specification that we are using such that this cannot be allowed to happen. We will be using the chart below to get the maximum current values that we can transfer through the wire.

84
Figure 68 - Wire Rating for Amperage vs. Temperature vs. Material
Image obtained from: http://waterheatertimer.org/How-to-install-a-subpanel.html
According to the chart above it depends on the material that we are using. We are most likely going to go with copper because it is durable and inexpensive. We do not plan on drawing more than 50 amps at one time because of these specifications we plan on going with 4 gauge wire for the battery to outlets. When we receive our power inverter we will see what the maximum is on that and our gauge of wire that we are using might change. As for the USB ports and 12 volt ports we will not require that big of a wire and will go with 16 gauge wire since these ports do not draw a lot of amperage. As you can see temperature also affects the wire in the system that’s why we will be monitoring the temperature of the system as much and as accurate as we can. Aluminum is a great metal but copper is more readily available and will be the medium we will be using for our project
7.5 Display Testing Testing the display was done towards the end of the project. To test the time until empty we hooked it up directly to the battery and see if we add a light bulb of a known usage. For example a 60 W light bulb, we use this to see if it is calculating power consumption correctly. It is important that the display shows that the system is using 60 watts of power. Then we will use that to calculate a time until empty and see if our predicted time matches our actual time. We have done this over and over and tweak the system such that we get the most accurate value possible. Then we used 2 light bulbs and see if it is using 120 watts and so on until we get to a point that anything we do to the system is easily predicted. We then tested to see if we are charging the battery if the light will go on that means the system is storing energy. This simulated the power coming into the system and show that power is being saved in the system. We also tested the buttons to see if they scroll through the different items we have incorporated it into the menu.

85
Most of the testing for the display is done in software before it is even implemented into the system. Once all the bugs are worked out in software we then put it into a working system where we have tested the parts that we used to send messages to the display. These messages tell the user the fault codes associated with the system as well as information that pertains to the system. By using a multimeter we measure the voltage in the battery and compare it to what is displayed on the screen. The temperature sensor that we are using will be built into the MSP430, which has been tested by Texas Instruments and will not require extensive testing. We will also have to simulate failures, which must set off the codes that tell the user if something is wrong with the system.
8 System Operation
1. Setup the tripod on a flat and sturdy surface. It is very important the legs of the tripod are extended and seated firmly on the ground.
2. Attach the wind turbine to the top of the tripod and screw the clamp down such that it is attached to the turbine and the tripod.
3. Place the PV panels on the side of the tripod facing east and west connecting it
to the A frame with the supplied bolts.
4. Connect the panels and turbine to the enclosure using the color coded wires and connects them to their respective colors on the enclosure.
5. Insert inline fuse into positive cable connecting the battery to the inverter and
connect the battery cable to the battery.
6. Power on the inverter using the switch on the inside of the enclosure
7. The device is now on and the battery voltage should be displayed on the screen
8. Check to see if the light on the outlet is on. If it is not check your cables and make sure the inverter is on. If the cables are correct check the display to see if the battery level is below 10.8 volts if so the battery needs to be charged, which can be done by waiting 30 minutes so that the turbine and PV panels can charge it
9. If the battery is charged you should now have power at the outlet in which you
can plug in your devices and start using the product
10. Now that your device is working you can toggle through the options on the display which will display the voltage of the battery, the amount of energy that you are producing in watts (if any), and the amount of power that your devices are using. The button will toggle through these options for as long the unit has power.
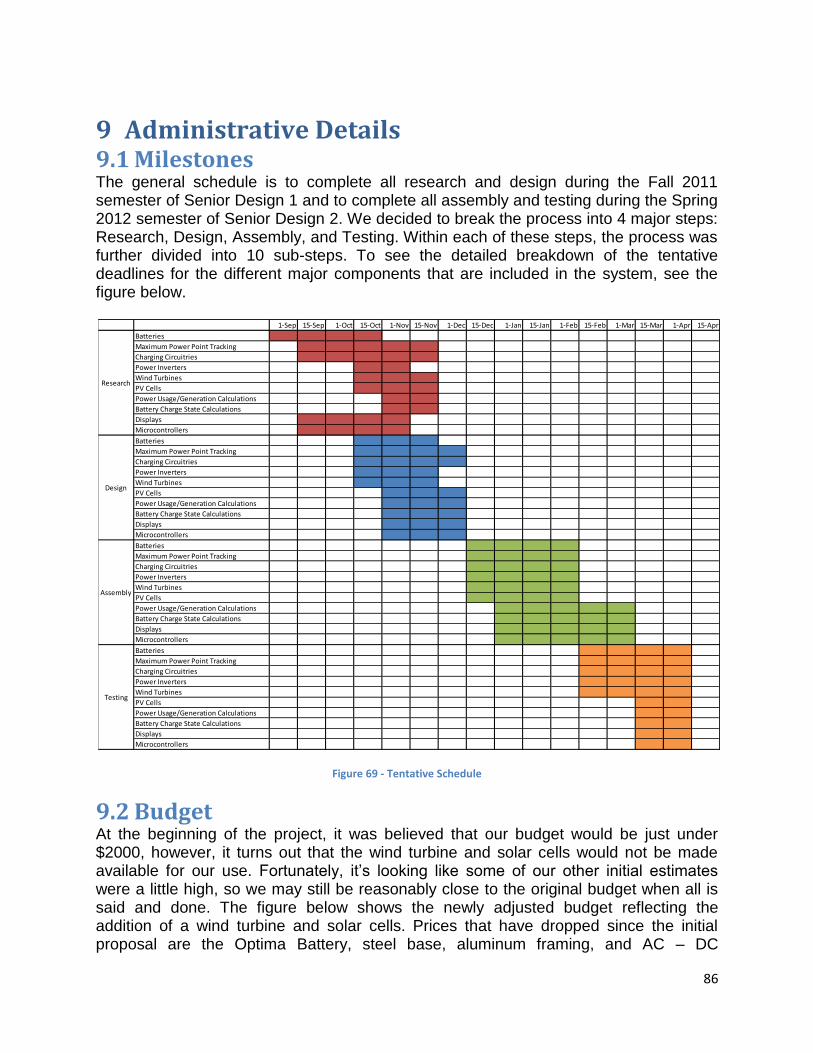
86
9 Administrative Details 9.1 Milestones The general schedule is to complete all research and design during the Fall 2011 semester of Senior Design 1 and to complete all assembly and testing during the Spring 2012 semester of Senior Design 2. We decided to break the process into 4 major steps: Research, Design, Assembly, and Testing. Within each of these steps, the process was further divided into 10 sub-steps. To see the detailed breakdown of the tentative deadlines for the different major components that are included in the system, see the figure below.
Figure 69 - Tentative Schedule
9.2 Budget At the beginning of the project, it was believed that our budget would be just under $2000, however, it turns out that the wind turbine and solar cells would not be made available for our use. Fortunately, it’s looking like some of our other initial estimates were a little high, so we may still be reasonably close to the original budget when all is said and done. The figure below shows the newly adjusted budget reflecting the addition of a wind turbine and solar cells. Prices that have dropped since the initial proposal are the Optima Battery, steel base, aluminum framing, and AC – DC
1-Sep 15-Sep 1-Oct 15-Oct 1-Nov 15-Nov 1-Dec 15-Dec 1-Jan 15-Jan 1-Feb 15-Feb 1-Mar 15-Mar 1-Apr 15-Apr
Batteries
Maximum Power Point Tracking
Charging Circuitries
Power Inverters
Wind Turbines
PV Cells
Power Usage/Generation Calculations
Battery Charge State Calculations
Displays
Microcontrollers
Batteries
Maximum Power Point Tracking
Charging Circuitries
Power Inverters
Wind Turbines
PV Cells
Power Usage/Generation Calculations
Battery Charge State Calculations
Displays
Microcontrollers
Batteries
Maximum Power Point Tracking
Charging Circuitries
Power Inverters
Wind Turbines
PV Cells
Power Usage/Generation Calculations
Battery Charge State Calculations
Displays
Microcontrollers
Batteries
Maximum Power Point Tracking
Charging Circuitries
Power Inverters
Wind Turbines
PV Cells
Power Usage/Generation Calculations
Battery Charge State Calculations
Displays
Microcontrollers
Research
Design
Assembly
Testing
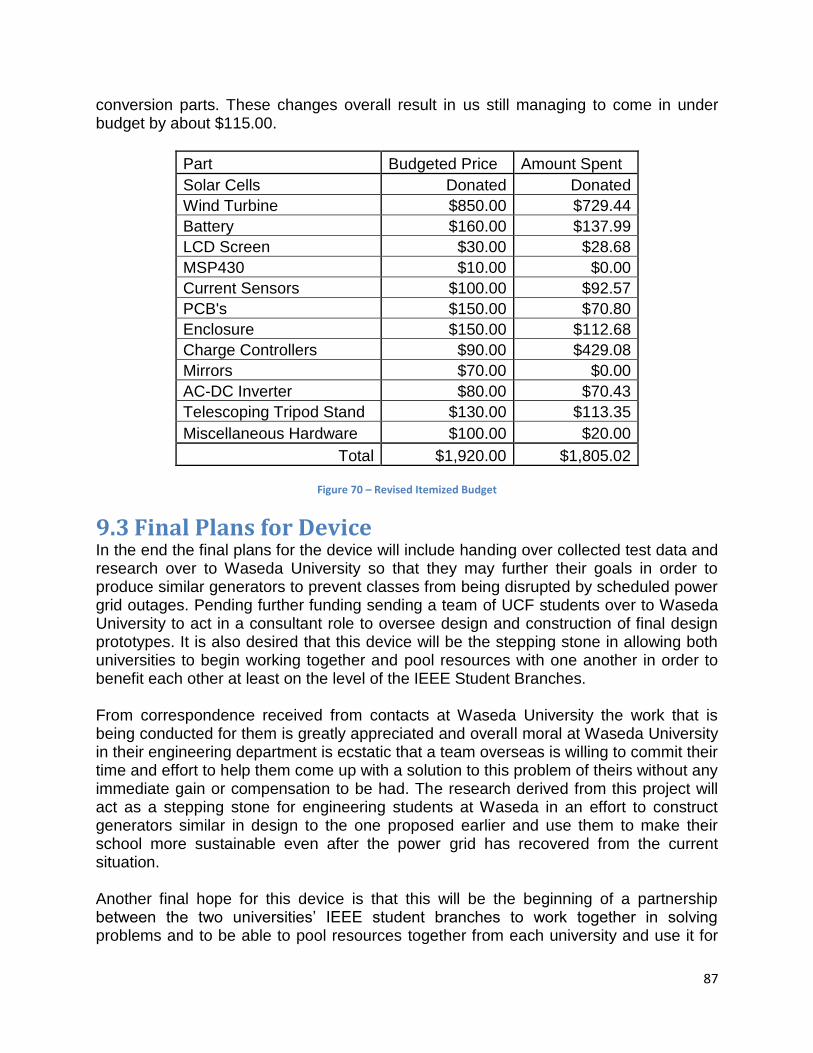
87
conversion parts. These changes overall result in us still managing to come in under budget by about $115.00.
Part Budgeted Price Amount Spent
Solar Cells Donated Donated
Wind Turbine $850.00 $729.44
Battery $160.00 $137.99
LCD Screen $30.00 $28.68
MSP430 $10.00 $0.00
Current Sensors $100.00 $92.57
PCB's $150.00 $70.80
Enclosure $150.00 $112.68
Charge Controllers $90.00 $429.08
Mirrors $70.00 $0.00
AC-DC Inverter $80.00 $70.43
Telescoping Tripod Stand $130.00 $113.35
Miscellaneous Hardware $100.00 $20.00
Total $1,920.00 $1,805.02
Figure 70 – Revised Itemized Budget
9.3 Final Plans for Device In the end the final plans for the device will include handing over collected test data and research over to Waseda University so that they may further their goals in order to produce similar generators to prevent classes from being disrupted by scheduled power grid outages. Pending further funding sending a team of UCF students over to Waseda University to act in a consultant role to oversee design and construction of final design prototypes. It is also desired that this device will be the stepping stone in allowing both universities to begin working together and pool resources with one another in order to benefit each other at least on the level of the IEEE Student Branches. From correspondence received from contacts at Waseda University the work that is being conducted for them is greatly appreciated and overall moral at Waseda University in their engineering department is ecstatic that a team overseas is willing to commit their time and effort to help them come up with a solution to this problem of theirs without any immediate gain or compensation to be had. The research derived from this project will act as a stepping stone for engineering students at Waseda in an effort to construct generators similar in design to the one proposed earlier and use them to make their school more sustainable even after the power grid has recovered from the current situation. Another final hope for this device is that this will be the beginning of a partnership between the two universities’ IEEE student branches to work together in solving problems and to be able to pool resources together from each university and use it for

88
the betterment of each other. This being one of the founding principles of IEEE it is greatly desired that an outcome similar to this will hopefully one day be the fruit of our labor.
The last goal that this project hopes to accomplish is to allow UCF engineers the opportunity to work hand in hand with our partners across the pacific. It is desired that this project and the knowledge it can provide will allow UCF engineers to travel to Waseda University in order to aid in the construction and design of the generators that Waseda University is hoping to construct. This phase of the project however is still far in the planning process and is currently on hold until funds become available in order to send a team of engineers over to Waseda University. There are still many avenues being pursued however until a stable source of sponsorship can be found this phase of the project will remain on hold.
9.4 Project Summary To summarize the final design of the project as a whole a separate synopsis of the wind turbine power system a separate synopsis of the solar array power system and a third synopsis of what happens after the two are combined at the battery will be the simplest way of describing the project as a whole. To begin with the wind turbine power system will be described. The system starts with the Sunforce model 45444 micro wind turbine mounted on the zenith of a converted speaker stand that utilizes slip rings underneath the turbine so that the Sunforce 45444 will be free of obstruction and able to move and rotate freely. From there insulated wiring travels down the speaker stand inside the sealed enclosure where the output from the wind turbine is dumped into a charge controller. This charge controller takes the output from the wind turbine and allows it to be safely supplied to the battery. Next is the solar array power system. Utilizing flexible thin film solar arrays reflective mirrors are to be placed at the base of the arrays so as to collect stray sunlight to convert into energy. These solar arrays will be placed in parallel so to add the currents together to charge the battery faster. From here the wiring travels into the enclosure

89
where it is connected with the Solar Regulator 30Amp charge controller. Similar to the wind turbine system this charge controller allows the output from the solar arrays to be safely dumped into the battery. Thirdly is how all of these systems interact with each other at the battery to supply power to the load. At the battery there are a few systems working simultaneously. The previously aforementioned power systems are dumping their outputs to charge the battery via their respective charge controller but MSP 430 electronics are also collecting data and sending it to an LCD display where the user can view it. Such things collected are power usage power generated and power still available in the battery. After the energy is stored in the battery it needs to be taken out and used in a form that the load can utilize. In order to do this the 12 volt DC input from the battery is sent to a pure sine-wave inverter where the 12 volt DC input can be converted to a usable 120 volt AC output. From here the power from the inverter is sent to power the MSP 430 electronics as well as GFI outlets exposed to the outside of the enclosure where a user can plug into and utilize the power generated from the two wind and solar sources and stored into the battery.
9.5 Conclusion The project as a whole has given the researching engineers hands on experience in design and construction specifications required to construct renewable power systems. It was one of the underlying goals of the project in order to learn about the ins and outs of alternative energy and power generation. Many different fields of electrical and computer engineering were involved in this project and allowed the senior design team to have ample exposure to all of them. Some of those fields were things such as circuit design, DC power inversion, PV arrays, turbine generators, and energy conversions. During the research portion of the project the senior design group had to learn and study about many new types of technology and equipment that they may not have had very much experience with before. However with the accumulated knowledge that they had gained from their tenure as an engineering students they were able to analyze and understand the data and concepts that were placed before them. With their new understanding of the concepts that were required for a project as this they were able to take that research and apply it to a feasible application in order to design the project within the starting specifications. In the design stage of the project actual application and construction is what the senior design group had to learn and embrace when they undertook this portion of the project. In the classroom students typically focus on abstract concepts and simple right or wrong questions. However when it comes to design there is no right or wrong answers. Any engineer can sit down and tell you this is what you need and rattle of specifications and numbers to solve a problem, but when it actually comes down to finding parts and equipment to take those numbers and turn them into application it takes an entirely different way of thinking.

90
One of the last but not least sections that the senior design team needed to learn about was how to test the designs that they just came up with. The testing section proved to be an interesting and unexpected challenge. After designs were drafted and parts specified it came down to how to test the machine after it is constructed. It is one thing to say that a motor is spinning at two hundred rotations per minute but when you have to find a way to prove it challenges can be encountered. The senior design team was able to sit down and draft multiple and creative methods that could potentially be available to them in order to test their designs and collect data on the final designs. The project had also been a very good hands on approach to many organization skills that were not necessarily self-evident to the senior design team at the time of the project but when encountered proved to be good experience for skills that will be requiem later on in life. Skills such as time management, coordination between group members, budgeting of both time and money, as well as technical writing will all be useful to the senior design group in the future to come in whatever kind of careers that the students pursue with their engineering degrees.
10 Appendices 10.1 Bibliography
"All About Microcontrollers | Code, Circuits, & Construction." Code Circuits, and Construction.
Web. 29 Nov. 2011. <http://www.tigoe.net/pcomp/code/controllers/all-about-
microcontrollers>.
"Basic Tutorials: Charge Controllers for Solar Energy Systems." DIY Solar Panel Help -
Tutorials, Calculators and Design Tools for Solar Power. FreeSunPower.com. Web. 21
Nov. 2011. <http://www.freesunpower.com/chargecontrollers.php>.
"Charge Controllers for Solar Electric Systems." Solar Electric Power Components and Solar
Panels. Northern Arizona Wind & Sun. Web. 20 Oct. 2011.
<http://www.windsun.com/ChargeControls/ChargeCont.htm>.
"Charge Controllers on Sale, Charge Controllers by Xantrex, Trace, Outback Power, Solar
Boost, MorningStar, Prostar, Sunsaver, Sun Guard and More!" Solar Panels from

91
Wholesale Solar. Wholesale Solar. Web. 20 Nov. 2011.
<http://www.wholesalesolar.com/controllers.html>.
"Charging Information For Lead Acid Batteries – Battery University." Basic to Advanced
Battery Information from Battery University. Isidor Buchmann. Web. 29 Nov. 2011.
<http://batteryuniversity.com/learn/article/charging_the_lead_acid_battery>.
"Charging Lithium-Ion Batteries – Battery University." Basic to Advanced Battery Information
from Battery University. Isidor Buchmann. Web. 29 Nov. 2011.
<http://batteryuniversity.com/learn/article/charging_lithium_ion_batteries>.
"Charging Nickel-Metal-Hydride Batteries – Battery University." Basic to Advanced Battery
Information from Battery University. Isidor Buchmann. Web. 29 Nov. 2011.
<http://batteryuniversity.com/learn/article/charging_nickel_metal_hydride>.
"Energy Basics: Photovoltaics." U.S. DOE Energy Efficiency and Renewable Energy (EERE)
Home Page. U.S. Department of Energy. Web. 05 Nov. 2011.
<http://www.eere.energy.gov/basics/renewable_energy/photovoltaics.html>.
"HowStuffWorks "Modern Wind-power Technology"" HowStuffWorks "Science"
HowStuffWorks.com. Web. 13 Nov. 2011.
<http://science.howstuffworks.com/environmental/green-science/wind-power2.htm>.
"MSP430 Microcontroller | 16 Bit Microcontroller | 16 Bit MCU – TI.com." Analog, Embedded
Processing, Semiconductor Company, Texas Instruments. Texas Instruments. Web. 29
Nov. 2011. <http://www.ti.com/lsds/ti/microcontroller/16-
bit_msp430/overview.page?DCMP=MCU_other>.

92
"Solar Electricity Basics." Solar Elecricity Basics. Home Power Magizine. Web. 15 Nov. 2011.
<http://homepower.com/basics/solar/>.
"Stellaris ARM Cortex-M | ARM Microcontroller | ARM MCU." Analog, Embedded Processing,
Semiconductor Company, Texas Instruments. Texas Instruments. Web. 29 Nov. 2011.
<http://www.ti.com/lsds/ti/microcontroller/arm_stellaris/overview.page>.
"Wind Electricity Basics." Affordable Solar. Home Power Magazine. Web. 10 Oct. 2011.
<http://www.homepower.com/basics/wind/>.
"Wind Turbines." Energy Bible Home Page. EnergyBible.com. Web. 20 Oct. 2011.
<http://www.energybible.com/wind_energy/wind_turbines.html>.
Biello, David. "Solar Power Lightens Up with Thin-Film Technology: Scientific American." Science
News, Articles and Information | Scientific American. Web. 04 Dec. 2011.
<http://www.scientificamerican.com/article.cfm?id=solar-power-lightens-up-with-thin-
film-cells>.
Djmatic. "Serial LCD Tutorial." Serial LCD Tutorial. Web.
<http://www.arduino.cc/playground/Learning/SerialLCD>.
"How Embedded Microcontroller LCD Displays Work." Embedded LCD Touchscreens Made Easy
from Reach Technology. Web. 04 Dec. 2011.
<http://www.reachtech.com/evaluate/how_does_it_work/>.

93
Knight, Chris. "The Breakthrough Institute: The Promise of Solar Photovoltaic Thin-Films: Not
Your Uncle's Solar Panel." The Breakthrough Institute: Home. Web. 04 Dec. 2011.
<http://thebreakthrough.org/blog/2008/07/the_promise_of_solar_photovolt.shtml>.
"Photovoltaic Panel Efficiency and Performance." Posharp - The Source For Renewables. Web.
04 Dec. 2011. <http://www.posharp.com/photovoltaic/panelefficiency/database.aspx>.
"A PIC Serial LCD Project." The Best Microcontroller Projects and Resources. Web. 04 Dec. 2011.
<http://www.best-microcontroller-projects.com/serial-lcd.html>.
"Testing the Solar Panel." Instructables - Make, How To, and DIY. Web. 04 Dec. 2011.
<http://www.instructables.com/id/Build-a-60-Watt-Solar-Panel/step15/Testing-the-
solar-panel/>.
Toothman, Jessika. "HowStuffWorks "How Solar Cells Work"" HowStuffWorks "Science" Web.
04 Dec. 2011. <http://science.howstuffworks.com/environmental/energy/solar-
cell.htm>.
"Battery Capacity Conversion." Camera Hacker. Web. 10 Oct. 2011.
<http://www.camerahacker.com/Definitions/Battery_Capacity_Conversion.shtml>.

94
"Battery Life and How To Improve It." Electropaedia, Energy Sources and Energy Storage,
Battery and Energy Encyclopaedia and History of Technology. Web. 15 Nov. 2011.
<http://www.mpoweruk.com/life.htm>.
"Battery Metering." Welcome to OTHERPOWER.COM. Web. 27 Oct. 2011.
<http://www.otherpower.com/otherpower_battery_metering.html>.
Braille Battery USA Lighter • Stronger • Faster. Web. 15 Nov. 2011.
<http://www.braillebattery.com/>.
"Deep Cycle Battery FAQ." Solar Electric Power Components and Solar Panels. Web. 27 Oct.
2011. <http://www.windsun.com/Batteries/Battery_FAQ.htm>.
"Flat Plate AGM." Exide | Lead Acid Battery | Exide Batteries. Web. 15 Nov. 2011.
<http://www.exide.com/us/en/product-solutions/transportation/technology-
transportation/flat-plate-agm.aspx>.
"How to Calculate Battery Run-time When Design Equipment Using Batteries; Battery Technical
Resources for Design Engineers from PowerStream." PowerStream Power Supplies and
Chargers for OEMs in a Hurry. Web. 27 Oct. 2011.
<http://www.powerstream.com/battery-capacity-calculations.htm>.

95
"How to Measure Current and Power - Using a Hall Effect Transducer - Clamp." Free Math
Physics Engineering Lessons Simulations Freeware Shareware. Web. 3 Dec. 2011.
<http://scienceshareware.com/how-to-measure-AC-DC-current-with-a-hall-effect-
clamp-.htm>.
"Lead Acid Battery - Sealed, Flooded, AGM, VRLA Lead Acid Batteries Provided from
AtBatt.com." AtBatt.com - Batteries, Battery Chargers, Power Supplies. Rechargeable Li-
Ion, AGM, NiMH, Alkaline. Web. 27 Oct. 2011. <http://www.atbatt.com/c/lead-
acid.asp?sort_field=0>.
"Power Inverter Frequently Asked Qestions (FAQ)." Power Inverters - 12V Inverters - DC to AC
Power Inverters. Web. 3 Dec. 2011. <http://www.invertershop.com.au/frequently-
asked-power-inverter-questions.html>.
"The Universal Current Sensor | Sensors." Sensors | Sensors Magazine | Sensor Technology
News and Real-world Sensor Application. Web. 3 Dec. 2011.
<http://www.sensorsmag.com/sensors/electric-magnetic/the-universal-current-sensor-
1029>.
"Using Batteries for Home Power Storage | Alternative & Renewable Energy - ABS Alaskan, Inc."
Alternative & Renewable Energy - ABS Alaskan. Web. 27 Oct. 2011.
<http://www.absak.com/library/deep-cycle-home-power-batteries>.

96
"What Is a Current Sensor and How Is It Usedr." TI.com. Texas Instruments. Web. 3 Dec. 2011.
<http://www.ti.com/analog/docs/microsite.tsp?sectionId=560&tabId=2180µsiteId
=7>.
Zhao, Neil, Wenshuai Liao, and Henri Sino. Analog.com. Analog Devices. Web. 3 Dec. 2011.
<http://www.analog.com/library/analogDialogue/archives/44-12/high_side.pdf>.
10.2 Image Permissions

97

98

99

100